occupational cancer: knowledge and needs · pipe fitters/welders 0.9 0.9 painters 1.6 1.4 ... •...
TRANSCRIPT

AA R O N B L AI R , P h D , M P H
O c c u p a t i o n a l C a n c e r R e s e a r c h C e n t r e , To r o n t o , O N
a n d t h eO c c u p a t i o n a l a n d E n v i r o n m e n t a l E p i d e m i o l o g y B r a n c h
N a t i o n a l C a n c e r I n s t i t u t e ,B e t h e s d a , M D
I N S T I T U T E F O R W O R K E R S H E A LT H
T O R O N T O , O N
N O V E M B E R 4 , 2 0 0 9
Occupational Cancer: Knowledge
and Needs
November 4th, 2009 Slide 2
Occupational Cancer
What do we know about occupational cancer?
What are we doing now?
What are the important methodologic issues?
Has prevention been successful?

November 4th, 2009 Slide 3
References on Occupational Causes of
Cancer
Tomatis L, Huff J, Hertz-Picciotto I, Sandler DP,
Bucher J, Boffetta P, Axelson O, Blair A, Taylor J,
Stayner L, Barrett JC. Avoided and avoidable risks
of cancer. Carcinogenesis 18:97-105, 1997.
Siemiatycki J, Richardson L, Straif K, Latreille B,
Lakhani R, Campbell S, Rousseau M, Boffetta P.
Listing of occupational carcinogens. Environ Health
Perspect 112:1447-1459, 2004.

Some Well-Established
Occupational Causes of CancerCancer Site Exposure Cancer Site Exposure
Bladder
Bendizine Mesothelioma Asbestos
Coal tars Bone Radium
2-Naphthylamine Larynx Sulfuric acid mist
4-AminobiphenylLiver
Arsenic
Lung
Arsenic Vinyl chloride
Asbestos
Nasal
cavity/sinuses
Nickel
Beryllium Radium
Chloromethyl ether Chromium
ChromiumSkin
Arsenic
Coal tar pitch volatiles Coal tars
Radon Lukemia Benzene
SilicaNasopharynx
Formaldehyde
LeukemiaMustard gas
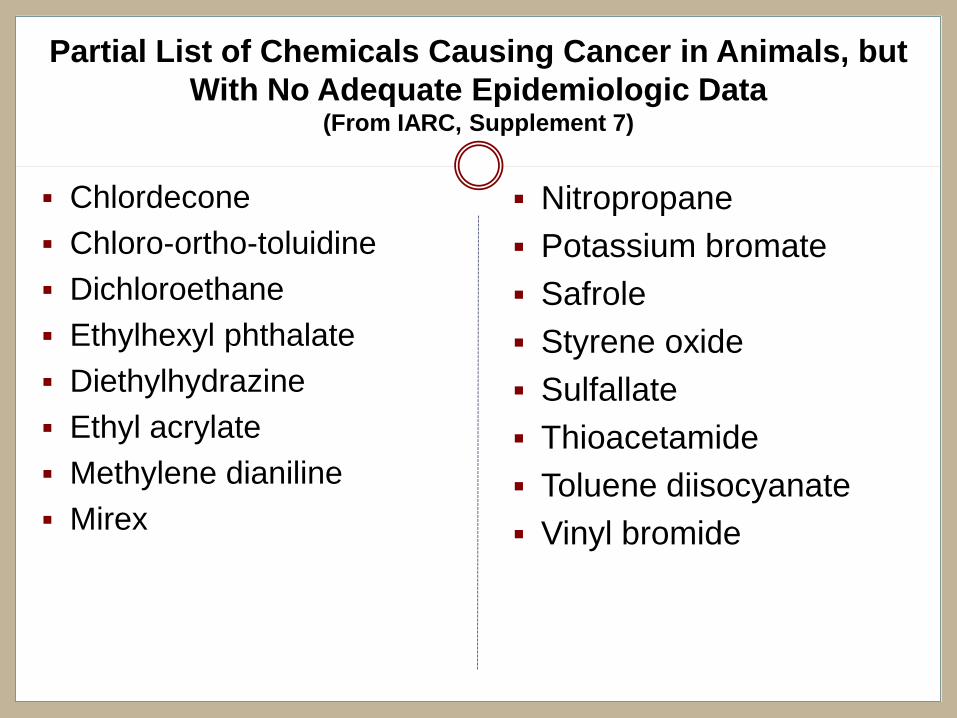
Partial List of Chemicals Causing Cancer in Animals, but
With No Adequate Epidemiologic Data(From IARC, Supplement 7)
Chlordecone
Chloro-ortho-toluidine
Dichloroethane
Ethylhexyl phthalate
Diethylhydrazine
Ethyl acrylate
Methylene dianiline
Mirex
Nitropropane
Potassium bromate
Safrole
Styrene oxide
Sulfallate
Thioacetamide
Toluene diisocyanate
Vinyl bromide
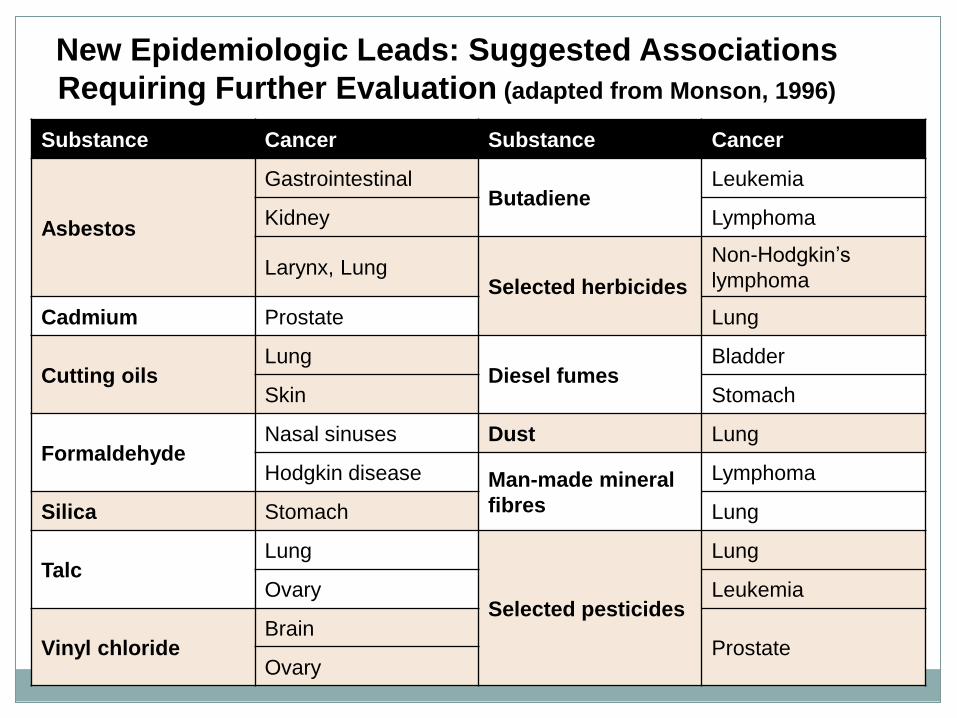
New Epidemiologic Leads: Suggested Associations
Requiring Further Evaluation (adapted from Monson, 1996)
Substance Cancer Substance Cancer
Asbestos
GastrointestinalButadiene
Leukemia
Kidney Lymphoma
Larynx, LungSelected herbicides
Non-Hodgkin’s
lymphoma
Cadmium Prostate Lung
Cutting oilsLung
Diesel fumesBladder
Skin Stomach
FormaldehydeNasal sinuses Dust Lung
Hodgkin disease Man-made mineral
fibres
Lymphoma
Silica Stomach Lung
TalcLung
Selected pesticides
Lung
Ovary Leukemia
Vinyl chlorideBrain
ProstateOvary

New Epidemiologic Leads: Occupations Associated with
Cancer Where Agent Has Not Been Clearly Identified(adapted from Monson, 1996)
Occup Group Cancer Site Occup Group Cancer Site
Farmers
Leukemia
Dry cleaners
Bladder
NHL Esophagus
Lung Kidney
Prostate Liver
Lip Cervix
Stomach Embalmers Leukemia
Brain
Petrochemical
workers
Leukemia
Myeloma Brain
Chemists Various sites Kidney
Pattern makers Colon NHL
Welders Lung Rubber workersLeukemia
Lung

New Epidemiologic Leads: Occupations Associated with
Cancer Where Agent Has Not Been Clearly Identified(adapted from Monson, 1996)
Occup Group Cancer Site Occup Group Cancer Site
Veterinarians LeukemiaLead workers
Lung
Waiters Lung Brain
Artists BladderMeat workers
Lung
Bakers Lung Leukemia
Cement workersLung
Painters and paint
manufacturers
Lung
Stomach Bladder
Coal minersStomach Myeloma
LeukemiaPlumbers
Lung
Coke plant workersPancreas Leukemia
ColonTruck drivers
Bladder
Beauticians Leukemia Lung

November 4th, 2009 Slide 9
Proportion of Cancer Due to Various Factors(from Doll and Peto, 1981 and Lichtenstein et al., 2000)
Factor
Genes
Diet
Tobacco
Infections
Reproductive/sexual behavior
Occupation
Geophysical factors
Alcohol
Pollution
Medicines
%
20-40
35
30
10
7
4
3
3
2
1
November 4th, 2009 Slide 10
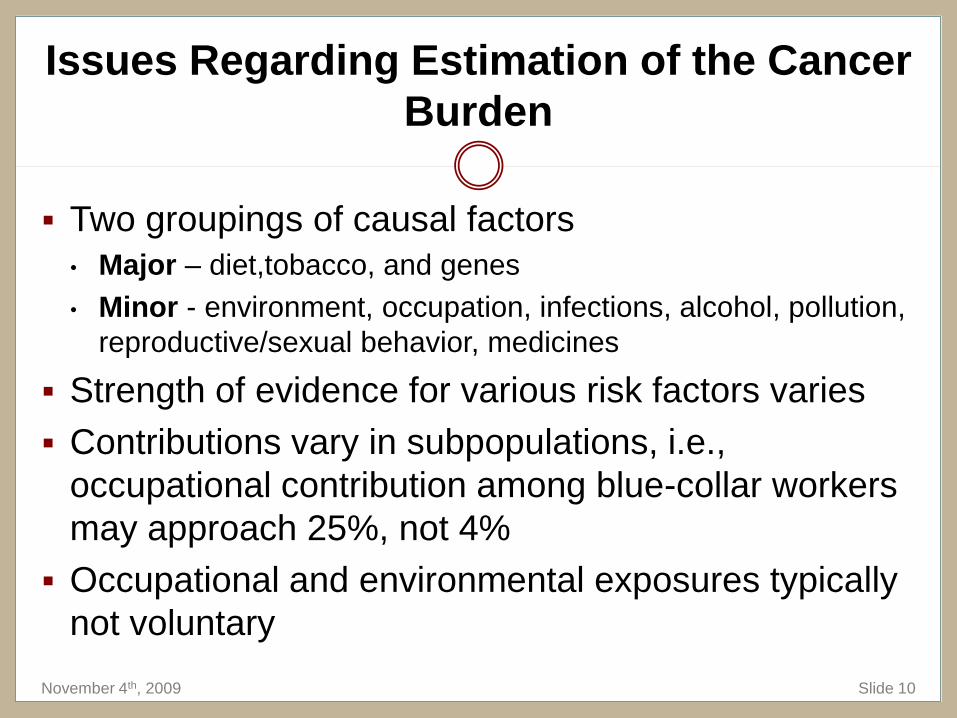
Issues Regarding Estimation of the Cancer
Burden
Two groupings of causal factors
• Major – diet,tobacco, and genes
• Minor - environment, occupation, infections, alcohol, pollution,
reproductive/sexual behavior, medicines
Strength of evidence for various risk factors varies
Contributions vary in subpopulations, i.e.,
occupational contribution among blue-collar workers
may approach 25%, not 4%
Occupational and environmental exposures typically
not voluntary

November 4th, 2009 Slide 11
Occupational Carcinogens from IARC
Monographs
IARC evaluations through 2003
• 89 Sufficient; 28 occupational carcinogens
• 64 Probable; 27 occupational carcinogens
• 264 Possible; 110 occupational carcinogens
18 Industries/occupations as 1, 2A, or 2B
Percent Occupational
• Sufficient - 31%
• Probable - 42%
• Possible - 42%
From: Siemiatycki et al. Environ Health Perspect 2004;112:1447-1459.
November 4th, 2009 Slide 12
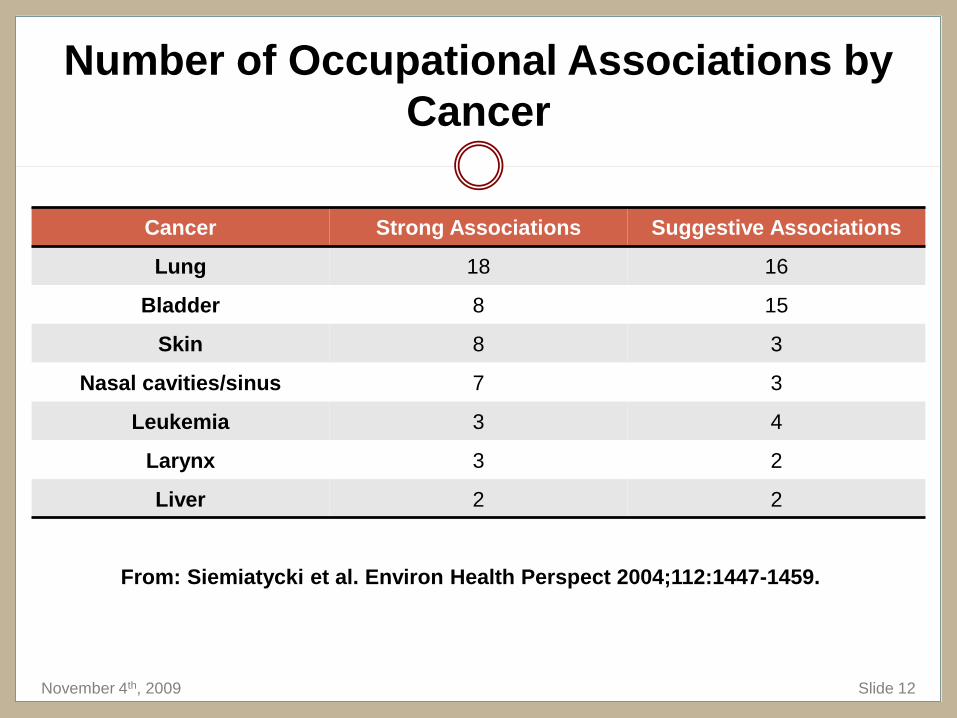
Number of Occupational Associations by
Cancer
Cancer Strong Associations Suggestive Associations
Lung 18 16
Bladder 8 15
Skin 8 3
Nasal cavities/sinus 7 3
Leukemia 3 4
Larynx 3 2
Liver 2 2
From: Siemiatycki et al. Environ Health Perspect 2004;112:1447-1459.

November 4th, 2009 Slide 13
Cancer and Occupational Exposures
Airway sites prominent
Bladder and skin frequent
Leukemia and liver occurs
Digestive and reproductive systems largely absent
Leads for blood/lymph, digestive, and reproduction
systems

November 4th, 2009 Slide 14
Growth in Understanding about
Occupational Carcinogens
2003 1987 1964IARC Rating IARC Rating WHO Rating
1 28 19 14
2A 27 22
9 (2A & 2B)
2B 110 70
From: Siemiatycki et al. Environ Health Perspect 2004;112:1447-1459.
November 4th, 2009 Slide 15
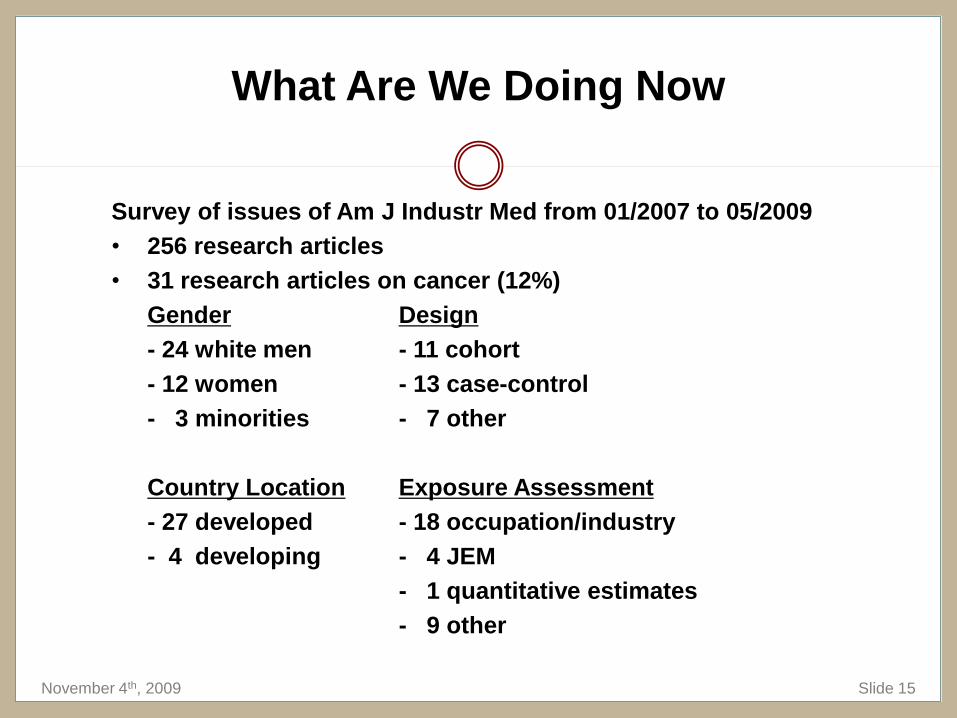
Survey of issues of Am J Industr Med from 01/2007 to 05/2009
• 256 research articles
• 31 research articles on cancer (12%)
Gender Design
- 24 white men - 11 cohort
- 12 women - 13 case-control
- 3 minorities - 7 other
Country Location Exposure Assessment
- 27 developed - 18 occupation/industry
- 4 developing - 4 JEM
- 1 quantitative estimates
- 9 other
What Are We Doing Now

November 4th, 2009 Slide 16
How is Research
on Occupational Cancer Faring?
Funding? Decrease
Number of occupational research projects?
Decrease
Number of occupational cancer sessions at scientific
meetings? Decrease
Number of published papers? Probably a decrease

November 4th, 2009 Slide 17
Why the Reduction in Occupational
Research
Perceptions:
Not an important contributor to the cancer burden• Contributes as much as any factor, except diet and tobacco use
No new leads• Many leads from epidemiological and experimental studies
Occupational exposures well controlled• Some are, most are not
Not scientifically important• Provided much of what we know about carcinogenesis. Can be even
more important in the “omics” era
Political decisions• The major impediment

November 4th, 2009 Slide 18
What Don’t We Know About Occupational
Carcinogens
Women and minorities seldom studied
• Survey of 1233 occupational cancer reports (Zahm, 1994)
• Only 14% with any analyses of women
• Only 7% with more than 5 risk estimates
Workers in small businesses rarely studied
Most studies in developed countries
Some sites studies more than others

November 4th, 2009 Slide 19
IARC and NORA Evaluation of 2A and 2B
Carcinogens: Needs and Gaps
Criteria to be placed on the list:
Widespread occupational exposure
Other reasons for public health importance
Preference for single agents
Other considerations:
Associations with cancers with increasing rates
Caution against an overemphasis on molecular
research

November 4th, 2009 Slide 20
2A and 2B Carcinogens Selected for IARC
Needs and Gaps Meeting
Selected Considered But Not Selected Shiftwork Toluenes and benzoyl chloride
Diesel exhaust Acrylamide
Styrene-7,8 oxide Epichlorohydrin
Tetrachloroethylene Naphthalene
Trichloroethylene Acrylonitrile
Cobalt with tungsten carbide Chloroprene
Indium phosphide Ethyl acrylate
Refractory ceramic fibers Toluene diisocyanates
Carbon black Carbon tetrachloride
Styrene Methylenedianiline
Propylene oxide Nitrobenzene
Chloroform 1,4-Dioxane
Dichloromethane Hydrazine
Welding fumes Ethylene dibromide
Atrazine Vinyl fluoride and vinyl bromide
Ethylhexyl phthalate
Formaldehyde
PCBs
Lead and lead compounds

November 4th, 2009 Slide 21
Methodologic Needs for Future Studies
More studies of women, minorities, and in
developing countries
Enhanced use of quantitative exposure assessment
Collection of information on non-occupational risk
factors
Assess mechanisms of action and evaluate gene-
exposure interactions
More frequent use of cross-sectional, case-control,
and prospective designs than in the past

November 4th, 2009 Slide 22
Type of Exposure Assessment in
Occupational Studies of Cancer
From articles on occupational cancer published in the Scand. J. Work Environ.
Health and the Amer. J. Industr. Med. over a two year period.
Type of Exposure
AssessmentNumber of Studies %
Occupation or Industry
only23 32
Occupation/Industry
and duration19 26
Ever/never for specific
exposures7 10
Qualitative estimates 15 21
Quantitative estimates 8 11
Total 72 100

November 4th, 2009 Slide 23
Issues in Occupational Epidemiology of
Cancer
Confounding
Exposure Misclassification
Prevention
November 4th, 2009 Slide 24
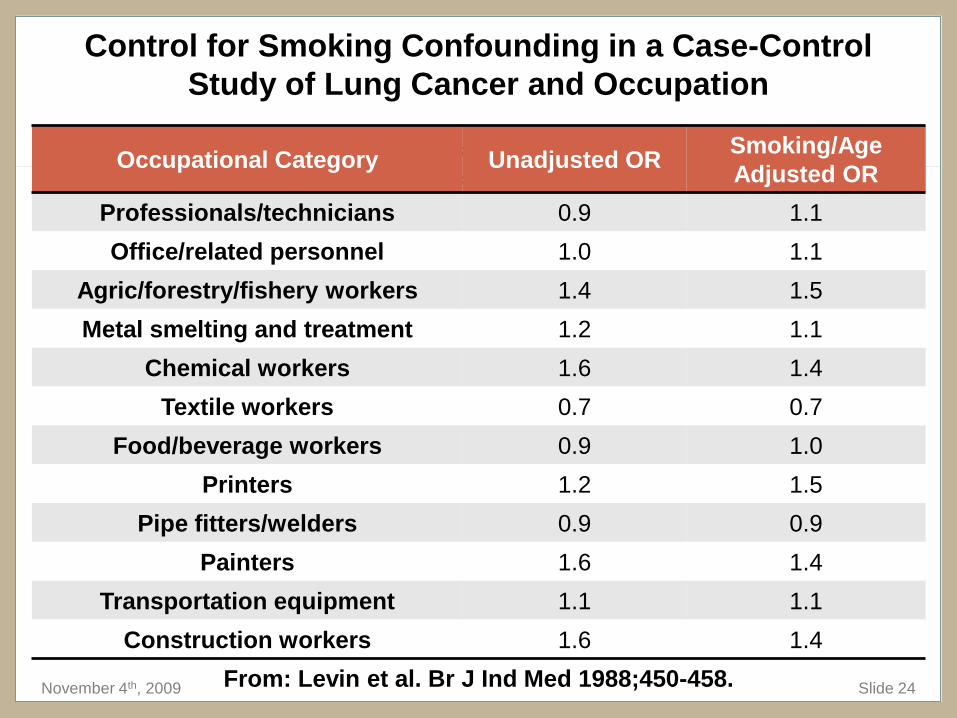
Control for Smoking Confounding in a Case-Control
Study of Lung Cancer and Occupation
Occupational Category Unadjusted ORSmoking/Age
Adjusted OR
Professionals/technicians 0.9 1.1
Office/related personnel 1.0 1.1
Agric/forestry/fishery workers 1.4 1.5
Metal smelting and treatment 1.2 1.1
Chemical workers 1.6 1.4
Textile workers 0.7 0.7
Food/beverage workers 0.9 1.0
Printers 1.2 1.5
Pipe fitters/welders 0.9 0.9
Painters 1.6 1.4
Transportation equipment 1.1 1.1
Construction workers 1.6 1.4
From: Levin et al. Br J Ind Med 1988;450-458.

November 4th, 2009 Slide 25
Control for Smoking and Asbestos Confounding in a
Case-Control Study of Lung Cancer and Occupation
Industry Age Adj OR Age/Smk Adj ORAge/Smk/Asbestos
Adj OR
Agric/forestry/fishing 1.3 1.3 1.3
Energy/mining 1.7 1.5 1.4
Chemical/oil 1. 2 1.2 1.2
Stone/glass/pottery 1.8 1.6 1.5
Metal production 1.4 1.4 1.3
Electrical/sheet metal 0.9 0.9 0.9
Leather/textile 1.0 1.0 1.0
Construction 1.6 1.4 1.3
Financing/insurance 0.8 0.8 0.8
Restaurants/hotels 1.4 1.0 1.1
From: Bruske-Hohlfeld et al. Am J Epid 2000;151:384-395.

November 4th, 2009 Slide 26
From: Blair et al. Scand J Work Environ Health 1998;24:suppl 2:25-41.
Relative Risks (# Exposed Deaths) for Lung Cancer
by Cumulative Exposure to Acrylonitrile
Quintile of Estimated Exposure
Analysis Group Lowest 2nd 3rd 4th HighestP for
Trend
% Ever Smoked
Cigarettes62% 64% 68% 72% 75%
Entire Cohort 1.1 (27) 1.3 (26) 1.2 (28) 1.0 (27) 1.5 (26) 0.65
Entire Smoking
Subcohort (Not Adj. for
Smoking)
0.8 (27) 1.1 (26) 1.0 (28) 0.9 (27) 1.5 (26) 0.70
Smoking Subcohort with
Smoking Data (Not Adj.)0.3 (5) 0.9 (6) 1.0 (7) 1.0 (13) 1.7 (9) 0.80
Smoking Subcohort Adj.
for Ever Used Cigarettes0.3 (5) 0.8 (6) 1.0 (7) 0.9 (13) 1.6 (9) 0.99

November 4th, 2009 Slide 27
Summary of Comparisons of Unadjusted and Adjusted
RRs from Six Recent Am. J. Epidemiology Issues
Four of 92 comparisons differed by >0.3
Four of 92 might result in a different conclusion using
adjusted RR
• Two with a change in magnitude
• Two with a change to no effect

November 4th, 2009 Slide 28
Conclusions About Confounding
My Conclusion:
• Confounding is rare – only 5% occurrence in this sample
• Should not discount findings based on a suggestion of
confounding without some evidence that it actually occurs
Confounding – What if you cannot adjust directly?
• Are requirements for confounding evident?
• Are other effects of confounding apparent?
• Has this confounding occurred in other studies?
• Estimate possible effect (Axelson method for smoking)
November 4th, 2009 Slide 29
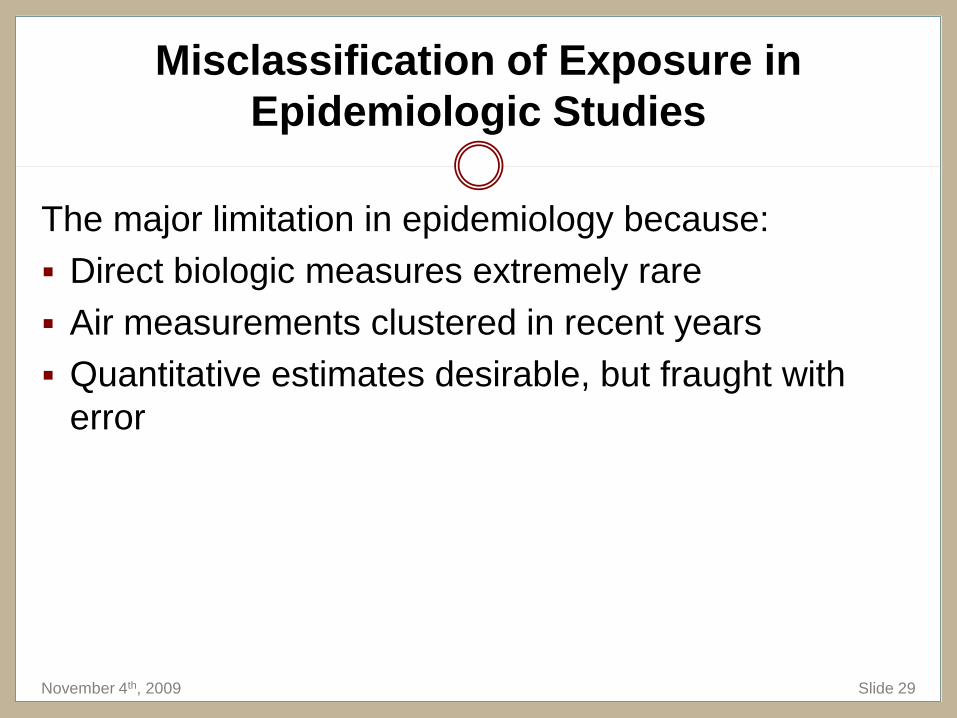
Misclassification of Exposure in
Epidemiologic Studies
The major limitation in epidemiology because:
Direct biologic measures extremely rare
Air measurements clustered in recent years
Quantitative estimates desirable, but fraught with
error
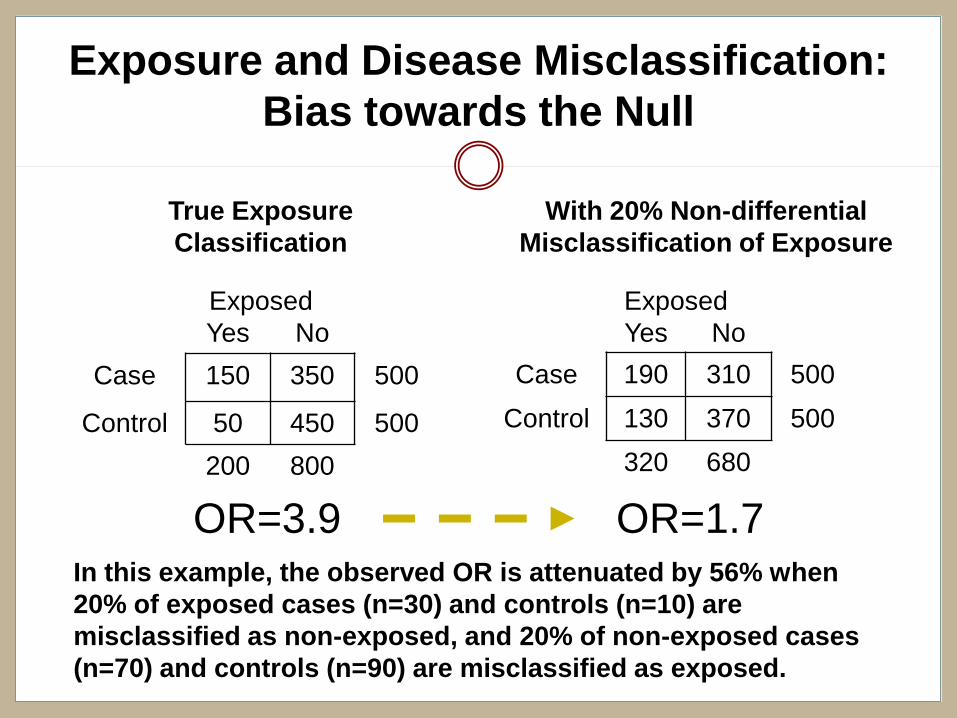
Exposure and Disease Misclassification:
Bias towards the Null
Yes No
Case 150 350 500
Control 50 450 500
200 800
OR=3.9
Exposed
With 20% Non-differential
Misclassification of Exposure
Yes No
Case 190 310 500
Control 130 370 500
320 680
Exposed
OR=1.7
True Exposure
Classification
In this example, the observed OR is attenuated by 56% when
20% of exposed cases (n=30) and controls (n=10) are
misclassified as non-exposed, and 20% of non-exposed cases
(n=70) and controls (n=90) are misclassified as exposed.


True RR
Misclassified RR

True RR
Misclassified RR

November 4th, 2009 Slide 34
Levels of Misclassification in Occupational
Studies
Acrylonitrile – Measurements/estimates, r = 0.6
Dioxin – Serum levels/estimates, r = 0.70
Coal tar volatiles – Measurements/estimates, r =
0.42
Formaldehyde – Different estimates, r = -0.1 to 0.7
Jobs – Reported/recorded jobs, 83% agreement
Welding fumes- Measurements/experts, r = 0.42
Asbestos – Supplementary Qx/JEM, Kappa = 0.39
2,4-D – PK Model/urinary measurements, r = 0.65
November 4th, 2009 Slide 35
Misclassification of Exposure
Conclusion
• Misclassification is the major weakness
• Not well considered in data interpretation
• Ignoring it creates false negative impressions
Must consider impact of misclassification
• Evaluation degree of misclassification
• Scour literature for relevant data and examples
• Perform sensitivity analyses to estimate effects
• Assess magnitude of misclassification in relation to other
study biases and problems

November 4th, 2009 Slide 36
Prevention of Occupational Cancer
Cancer incidence and mortality has not declined as rapidly as other major causes of death
50% of cancers might be prevented
Disagreement on the proportion attributable to various risk factors
Estimates of attributable risks largely based on unverified assumptions
Effect primary prevention could be achieved by number of exposures and reduction in level of exposure
Not much direct evidence on effectiveness of occupational exposure intervention
Epidemiology criteria for establishing causality are stringent and demanding
• Protect against false positives
• May have allowed false negatives and impeded adoption of public health measures
Important remaining issues:
• Shape of the dose-response and the question of a threshold
• Complex mixtures and multiple exposures
Tomatis L, Huff J, Hertz-Picciotto I, Sandler DP, Bucher J, Boffetta P, Axelson O, Blair A, Taylor J, Stayner L, Barrett JC. Avoided and avoidable risks of cancer. Carcinogenesis 18:97-105, 1997.

November 4th, 2009 Slide 37
Preventive Approaches
Type of Action Example
Direct ActionChanging processes or raw
ingredients
RegulationRestricting or banning use in
industry
Commerce Requiring radon assessment
EducationPublicity about the risks from
exposure from asbestos
November 4th, 2009 Slide 38
Evidence Indicating That Prevention Works
for Occupational Exposures
Decreased risk when individuals leave an exposure
area
Changes in risks in a cohort as exposure levels
decrease
Lower risks among those entering a workforce when
exposures were lower
From: Tomatis et al. Carcinogenesis 1997;18(1):97-105
November 4th, 2009 Slide 39
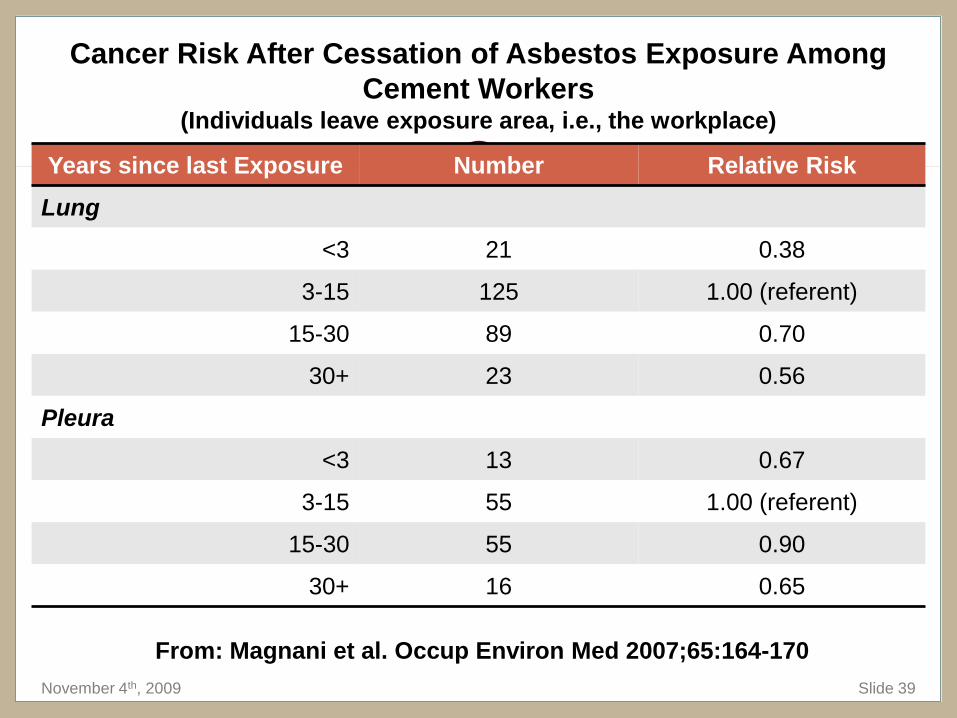
Cancer Risk After Cessation of Asbestos Exposure Among
Cement Workers(Individuals leave exposure area, i.e., the workplace)
Years since last Exposure Number Relative Risk
Lung
<3 21 0.38
3-15 125 1.00 (referent)
15-30 89 0.70
30+ 23 0.56
Pleura
<3 13 0.67
3-15 55 1.00 (referent)
15-30 55 0.90
30+ 16 0.65
From: Magnani et al. Occup Environ Med 2007;65:164-170

November 4th, 2009 Slide 40
Stove Improvement and Lung Cancer in Cohort in China(Reduction in exposure for the cohort)
None0-10 Years
Later
10-19
Years
Later
20+ Years
Later
Men 1.0 1.79 0.25 0.07
Women 1.0 1.41 0.24 0.17
Stove Improvement
All RR are statistically significant
From: Lan et al. J Natl Cancer Inst 2002;94:826-835
November 4th, 2009 Slide 41
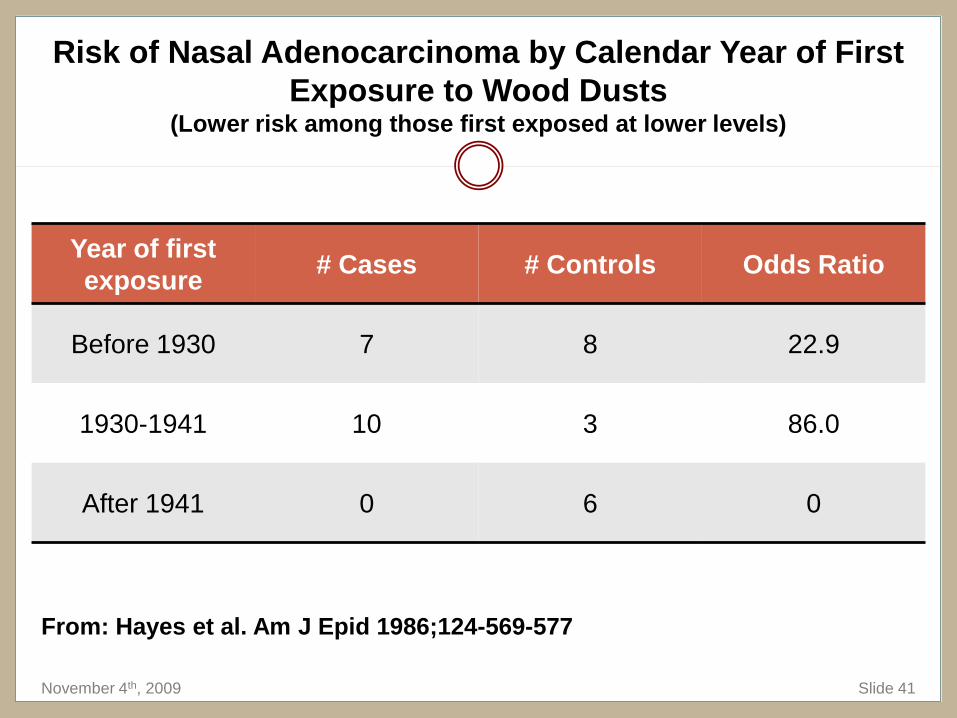
Risk of Nasal Adenocarcinoma by Calendar Year of First
Exposure to Wood Dusts(Lower risk among those first exposed at lower levels)
From: Hayes et al. Am J Epid 1986;124-569-577
Year of first
exposure# Cases # Controls Odds Ratio
Before 1930 7 8 22.9
1930-1941 10 3 86.0
After 1941 0 6 0

November 4th, 2009 Slide 42
Why So Few Clear Examples of Preventive
Successes for Environmental Exposures
Public tends to view intervention as the final step in
the prevention process
Funding more difficult for studies to characterize
preventive effectiveness than to identify etiology
For chronic diseases a consider time lapse is
required before disease rates change
From: Tomatis et al. Carcinogenesis 1997;18(1):97-105

QUESTIONS?
Thanks
November 4th, 2009 Slide 44
Why Preventive Approaches Should Work
for Occupational Exposures
Natural experiments
• Rates for some cancers go down among migrants
Toxicologic principle
• Rates rise with increasing exposure, so they should decline
with decreasing exposure
Empirical evidence
• Worked for tobacco

November 4th, 2009 Slide 45
Odds Ratios for N-Acetylation, Benzidine,
and Bladder Cancer
Fast Acetylators Slow Acetylators
Phenotype 1.0 0.3 (0.1-1.3)
Genotype 1.0 0.5 (0.1-1.8)
From: Hayes R, et al. Carcinogenesis 14:675-8, 1993
November 4th, 2009 Slide 46
Explanation of N-acetylation, Benzidine,
and Bladder Cancer Results
Slow acetylation not associated with increased
bladder cancer risk among benzidine exposed
workers
Biologic effects of N-acetylation are chemical
specific
Exposure assessment is critical
Exposure assessment can often be performed more
accurately in the workplace than elsewhere