occupational exposure assessment of magnetic fields ...lbk.fe.uni-lj.si/pdfs/pmb2012b.pdf ·...
TRANSCRIPT

Occupational exposure assessment of magnetic fields generated by induction heating
equipment—the role of spatial averaging
This article has been downloaded from IOPscience. Please scroll down to see the full text article.
2012 Phys. Med. Biol. 57 5943
(http://iopscience.iop.org/0031-9155/57/19/5943)
Download details:
IP Address: 193.2.84.130
The article was downloaded on 11/09/2012 at 10:46
Please note that terms and conditions apply.
View the table of contents for this issue, or go to the journal homepage for more
Home Search Collections Journals About Contact us My IOPscience
IOP PUBLISHING PHYSICS IN MEDICINE AND BIOLOGY
Phys. Med. Biol. 57 (2012) 5943–5953 doi:10.1088/0031-9155/57/19/5943
Occupational exposure assessment of magnetic fieldsgenerated by induction heating equipment—the roleof spatial averaging
Bor Kos1,2, Blaz Valic2, Tadej Kotnik1 and Peter Gajsek2,3
1 Laboratory of Biocybernetics, Faculty of Electrical Engineering, University of Ljubljana,Trzaska 25, SI-1000 Ljubljana, Slovenia2 Institute of Non-Ionizing Radiation, Pohorskega Bataljona 215, SI-1000 Ljubljana, Slovenia
E-mail: [email protected], [email protected], [email protected] and [email protected]
Received 16 April 2012, in final form 13 July 2012Published 11 September 2012Online at stacks.iop.org/PMB/57/5943
AbstractInduction heating equipment is a source of strong and nonhomogeneousmagnetic fields, which can exceed occupational reference levels. Weinvestigated a case of an induction tempering tunnel furnace. Measurementsof the emitted magnetic flux density (B) were performed during its operationand used to validate a numerical model of the furnace. This model was used tocompute the values of B and the induced in situ electric field (E) for 15 differentbody positions relative to the source. For each body position, the computedB values were used to determine their maximum and average values, usingsix spatial averaging schemes (9–285 averaging points) and two averagingalgorithms (arithmetic mean and quadratic mean). Maximum and average Bvalues were compared to the ICNIRP reference level, and E values to theICNIRP basic restriction. Our results show that in nonhomogeneous fields,the maximum B is an overly conservative predictor of overexposure, as ityields many false positives. The average B yielded fewer false positives, but asthe number of averaging points increased, false negatives emerged. The mostreliable averaging schemes were obtained for averaging over the torso withquadratic averaging, with no false negatives even for the maximum number ofaveraging points investigated.
(Some figures may appear in colour only in the online journal)
Introduction
Induction heating applications are very common in industrial processes, such as metal meltingand refinement (Faerman et al 1997), as well as welding and hardening (Bayindir et al 2003).3 Author to whom any correspondence should be addressed.
0031-9155/12/195943+11$33.00 © 2012 Institute of Physics and Engineering in Medicine Printed in the UK & the USA 5943

5944 B Kos et al
They are also becoming more common in cooking, for both professional and domestic use(Acero et al 2010).
The fields used by induction heating equipment are alternating and can range in frequencyfrom tens of Hz to hundreds of kHz (Bayindir et al 2003, Millan et al 2010). With the exceptionof the 50 and 60 Hz subrange of power line frequencies, this range is also among the leastinvestigated in the scientific literature in terms of human exposure (Floderus et al 2002).Since the field strength required by induction heating applications is typically very high dueto large power demands, from tens of kW to several MW (Floderus et al 2002), there is asignificant possibility for fields exceeding the occupational reference levels as set out in theICNIRP guidelines (ICNIRP 2010). With operations that require close proximity of a workerto a induction heating source, the worker is typically exposed to a highly nonhomogeneousfield. When reference levels are exceeded, the ICNIRP guidelines, as well as the currentlyvalid IEEE standards (IEEE 2006), require the determination of dosimetric quantities in thehuman body, and their comparison to the basic restriction. In the investigated frequency range,the most widely used reference level is the magnetic flux density (B) and the basic restrictionof the in situ electric field (E), where the latter can only be determined non-invasively bymeans of numerical dosimetry (Bakker et al 2012, Hirata et al 2011), or by measurements onphantoms.
Numerical determination of dosimetric quantities in the human body is a complex task, andthe most frequently used numerical methods all rely on staircasing (representation of curvedsurfaces by cubic voxels), resulting in the possibility of large errors. To reduce the staircasingerrors, the ICNIRP guidelines recommend averaging over a volume of 2 × 2 × 2 mm3, orusing the 99th percentile value when investigating the tissue-specific E. We have previouslyused the whole body 999th permille (Kos et al 2011), while others have successfully employedspatial averaging of tissue conductivities to reduce drastic conductivity changes at theintra-tissue and tissue–air boundaries (Laakso and Hirata 2012).
In this study, we investigated the role of spatial averaging in the measurements of magneticfields in empty space for classification of human exposure (overexposure versus compliance).Such averaging has been suggested in the literature (Jokela 2007, ICNIRP 2010), but tothe authors’ best knowledge, no attempt has yet been made to compare different averagingschemes in their predictive power regarding the classification of exposures. Here, we performa comparison of six such schemes with the results of numerical dosimetry computed in thebody serving as a reference.
We present a case of an induction tempering tunnel furnace where workers perform qualitycontrol checks near the entrance of the tunnel. We report the measurements and numericalsimulations of the generated stray B and numerical simulations of induced E in the human body.Finally, we discuss the application of spatial averaging of B for determination of compliancewith exposure guidelines.
Materials and methods
Magnetic flux density measurements
We performed measurements of the magnetic flux density (B) generated by an inductiontempering tunnel furnace using a calibrated ELT-400 instrument with the 100 cm2 probe (bothfrom Narda STS, Pfullingen, Germany). Spot measurements of B were performed using theinstrument’s RMS detection mode that has a flat frequency response. The total uncertainty ofthe measurement setup determined in the frequency range from 6 Hz to 320 kHz is 2.3 dB.The tempering tunnel operates at 10 kHz and consists of three turns of wire, each running
Averaging in EMF exposure assessments 5945
Distance to source
Direction of lateral displacement
Induction coil
100 µT80 µT60 µT40 µT20 µT0 µT
(A)
(B)
(C)
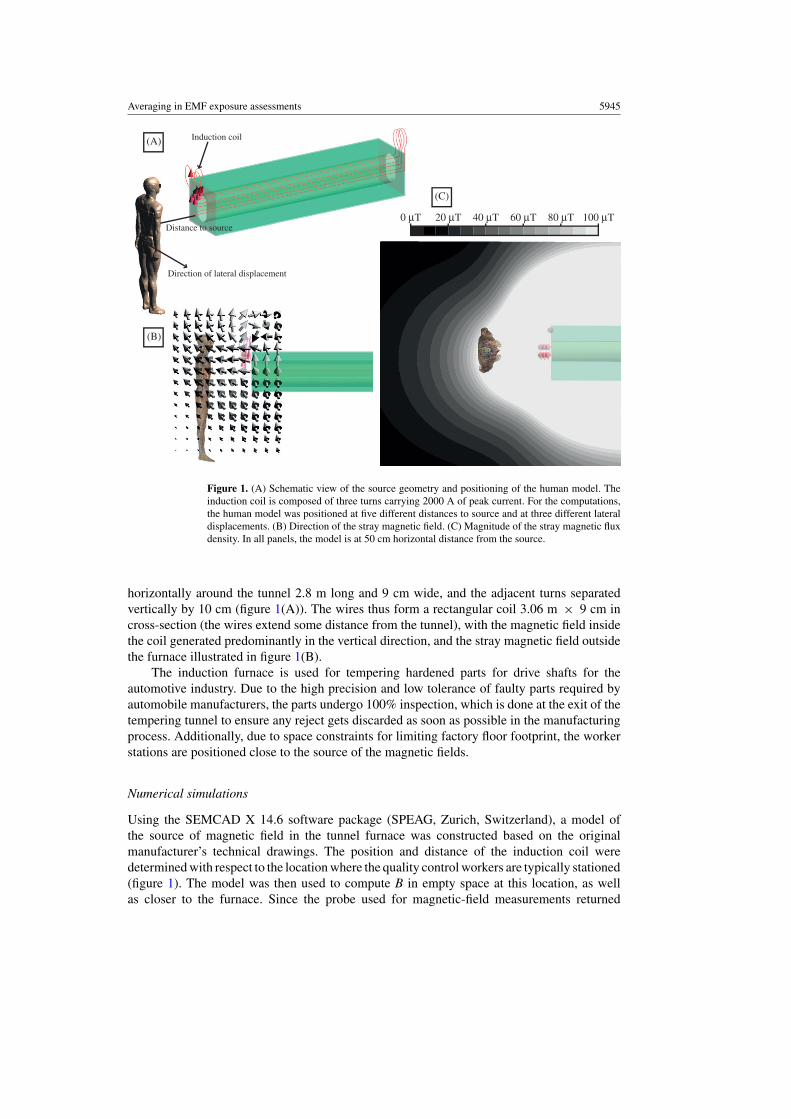
Figure 1. (A) Schematic view of the source geometry and positioning of the human model. Theinduction coil is composed of three turns carrying 2000 A of peak current. For the computations,the human model was positioned at five different distances to source and at three different lateraldisplacements. (B) Direction of the stray magnetic field. (C) Magnitude of the stray magnetic fluxdensity. In all panels, the model is at 50 cm horizontal distance from the source.
horizontally around the tunnel 2.8 m long and 9 cm wide, and the adjacent turns separatedvertically by 10 cm (figure 1(A)). The wires thus form a rectangular coil 3.06 m × 9 cm incross-section (the wires extend some distance from the tunnel), with the magnetic field insidethe coil generated predominantly in the vertical direction, and the stray magnetic field outsidethe furnace illustrated in figure 1(B).
The induction furnace is used for tempering hardened parts for drive shafts for theautomotive industry. Due to the high precision and low tolerance of faulty parts required byautomobile manufacturers, the parts undergo 100% inspection, which is done at the exit of thetempering tunnel to ensure any reject gets discarded as soon as possible in the manufacturingprocess. Additionally, due to space constraints for limiting factory floor footprint, the workerstations are positioned close to the source of the magnetic fields.
Numerical simulations
Using the SEMCAD X 14.6 software package (SPEAG, Zurich, Switzerland), a model ofthe source of magnetic field in the tunnel furnace was constructed based on the originalmanufacturer’s technical drawings. The position and distance of the induction coil weredetermined with respect to the location where the quality control workers are typically stationed(figure 1). The model was then used to compute B in empty space at this location, as wellas closer to the furnace. Since the probe used for magnetic-field measurements returned
5946 B Kos et al
Table 1. Body-averaging schemes in quantitative terms.
Back–front Right–left Vertical axisAveraging scheme axis points axis points points Total points
Whole body dense 3 5 19 285Whole body reduced 1 1 3 10 30Whole body reduced 2 1 3 5 15Torso dense 3 5 11 165Torso reduced 1 1 3 6 18Torso reduced 2 1 3 3 9
B averaged over three orthogonal circular 100 cm2 surfaces, we developed an algorithmthat performs the same type of averaging on the numerical results to provide comparabilitybetween the measured and the numerically computed B. More precisely, B was computed ina sphere with a radius of 5.64 cm (in approx. 42 000 voxels), the normal B was averagedover three orthogonal cross sections, and the total average B was computed as the norm of itsthree-dimensional vector.
The numerical computations of in situ electric fields (E) were performed with the virtualfamily (Christ et al 2010) model ‘Duke’, i.e. the 34 year old male model. The model waspositioned at a horizontal distance of 20, 30, 40, 50 or 100 cm from source (20 cm being theclosest distance accessible to the workers in the case considered), and at a lateral displacementof 0, 20 or 50 cm to the right. The total number of different body positions was therefore 15.Vertically, the coil was positioned 120 cm above the feet of the model. Therefore, the areaexposed to the highest B is the chest and head regions. The computation was performed at10 kHz frequency using the low-frequency quasi-static solver implemented in SEMCAD X.Extended (k = 2) total uncertainty of the dosimetric simulations was estimated to be 4 dB withdetails on the estimation given in a previously published work (Kos et al 2011). The humanmodel was discretized to 2 × 2 × 2 mm3 resolution, giving a total of 43 M-cells for thesimulation. The resulting values of E were extracted for each tissue in the model (total of 77)and statistically analyzed to find their maximum, 99th percentile and mean values. We usedthe IT’IS database for dielectric properties of body tissues (Hasgall et al 2011).
Averaging algorithms
The ICNIRP guidelines (ICNIRP 2010) suggest that determining only the maximum value ofB at a certain position can be an overly conservative measure for determining compliance withthe exposure limits. Spatial averaging of fields over the whole body, or parts of the body, issuggested by Jokela (2007) to give a less conservative and more realistic estimate of actualexposure. We have investigated six different spatial averaging schemes by varying the numberof averaging points. Averaging introduces the possibility of false negatives, i.e. situationswhere the worker is overexposed, yet the averaged fields are below the reference level. Sincethe main goal of reference levels is to prevent any possibility of overexposure, false negativeshave to be avoided. On the other hand, false positives, where the averaged fields exceed thereference levels, while the actual exposure is below the basic restrictions, would imply that theaveraging algorithm is overly conservative, albeit less conservative than the use of the spatialmaximum value.
In total, six averaging schemes with varying number of averaging points (from 9 to285 points) were investigated, as shown in table 1 and illustrated in figure 2. Thus, in thewhole body dense scheme, the averaging was performed at 285 points forming a rectangular

Averaging in EMF exposure assessments 5947
Figure 2. Body-averaging schemes illustrated. The whole body schemes covered the total bodyheight of 180 cm, while the torso schemes covered only the 100 cm from the pelvis up. In thereduced schemes, the grid consisted of a single point along the front–back axis, located in the frontplane of the body, since that plane is contributing the most to the total exposure.
grid with 3 points along the back–front (x) axis, 5 points along the right–left (y) axis, and 19points along the vertical (z) axis, with all points spaced equidistantly in 10 cm intervals. Theprocedure was similar for the torso dense scheme, with the legs region excluded and thus only11 points along the vertical axis. With the whole body reduced 1 and torso reduced 1 averagingschemes, the points were spaced at 20 cm intervals, while with both reduced 2 schemes, theywere spaced at 20 cm intervals horizontally and at 40 cm intervals vertically.
Although the practical use of averaging with a number of points as high as 285 or 165is questionable without some sort of automated measurement system, it was included forcomprehensiveness.
For each scheme, 15 different body positions were investigated. In addition, we alsoinvestigated the differences between a simple arithmetic mean and a quadratic mean in spatialaveraging, with the quadratic mean defined as
Baverage =√√√√1
n
n∑i=1
B2i
and thus giving more importance to higher values. This yielded a total of 180 investigatedcombinations of averaging scheme, type of mean and body position.

5948 B Kos et al
Table 2. Measured magnetic flux density at five points in front of the assessed induction furnace.The reference value of ICNIRP (2010) at 10 kHz is 100 μT.
Measurement spot Measured B (μT) Computed B (μT) % error
1 350 224 −36%2 117 70.5 −40%3 116 176 52%4 45 40.6 −10%5 17 20 18%
Results and discussion
Measurements of magnetic flux density
The magnetic flux density (B) was measured at five points in front of the tempering tunnelduring its operation. As shown in table 2, at three of these points, the measured values of Bexceeded the ICNIRP guidelines (ICNIRP 2010). Since workers need to perform some tasksat the points where an excessive field has been measured, according to these guidelines a moredetailed assessment—dosimetric evaluation of in situ induced electric field (E)—needs to beperformed.
In table 2, we also compare the measured and the computed values of B at the locationscorresponding to the measurement points. Although some of the errors are relatively large,they are still within the uncertainty boundaries as specified by Kuster et al (2006). Therefore,it is appropriate to use the computed values of B for the investigation of the influence of spatialaveraging.
Numerical computation of magnetic flux density and in situ electric fields
The computed maximum and averaged fields at all investigated combinations of averagingscheme, type of mean and body position are shown in table 3, while a summary of the numericaldosimetry data is given in table 4. In our results, where the maximum B in the body does notexceed the ICNRIP reference levels, there are no cases of exposure exceeding the ICNIRPbasic restrictions as indicated by the 99th percentile of E. Although Bakker et al (2012) havefound some cases where such overexposure could occur, those were with child models exposedto homogeneous fields at the occupational reference levels. On the other hand, the maximumB yields many false positives and is thus an overly conservative predictor of overexposure,which is in agreement with the suggestions of the ICNIRP guidelines.
From the cross-referencing of tables 3 and 4, it is possible to identify the false negatives,i.e. the locations where the average B is below the reference level, while the induced E isabove the basic restriction. There were three such false negatives in the 180 combinationsinvestigated: at 40 cm distance in the aligned and 20 cm to-the-right positions, and at 20 cmdistance in the 50 cm to-the-right position; all these false negatives were obtained using thewhole-body-dense averaging scheme with the arithmetic mean. This indicates that whole-bodyaveraging is inappropriate, particularly in highly nonhomogeneous fields.
Additionally, there were 17 false positives, with several locations where false positiveswere yielded only by the quadratic mean averaging, but not by the arithmetic mean. This isan expected result since the quadratic mean is more conservative, with the higher values givenmore importance.

Averaging
inE
MF
exposureassessm
ents5949
Table 3. Computed values of averaged (A—arithmetic; Q—quadratic mean) and maximum (M) magnetic flux density (in μT). Since the occupational reference level at 10 kHz is exactly100 μT, the numerical value of magnetic flux density is equal to the percentage of the reference level. The top row indicates the distances from the source to the frontal plane of thehuman body. Note that the maximum B values are the same in the aligned and 0.2 m right (R) position because the two positions share some measurement points which are located inthe area with the strongest fields.
Horizontal distance from source
20 cm 30 cm 40 cm 50 cm 100 cm
Scheme Lateral position A Q M A Q M A Q M A Q M A Q M
Aligned 190 291 1114 122 169 530 85 110 297 64 78 187 24 25 43Whole body dense 0.2 m R 165 257 1114 111 155 530 81 104 297 61 75 187 23 25 43
0.5 m R 80 113 476 65 86 315 53 66 213 44 53 149 20 22 41
Aligned 270 399 1114 164 225 530 111 142 297 80 98 187 27 29 43Whole body reduced 1 0.2 m R 236 368 1114 150 209 530 104 135 297 76 94 187 27 29 43
0.5 m R 103 154 476 81 113 315 65 84 213 52 65 149 23 25 41
Aligned 284 390 830 177 229 445 120 148 266 86 102 174 28 30 42Whole body reduced 2 0.2 m R 249 359 830 161 214 445 112 141 266 83 99 174 28 30 42
0.5 m R 111 157 400 83 115 279 66 87 196 53 67 141 23 25 40
Aligned 302 381 1114 187 220 530 127 142 297 92 100 187 30 31 43Torso dense 0.2 m R 261 337 1114 171 202 530 120 135 297 89 96 187 30 31 43
0.5 m R 120 146 476 95 111 315 75 85 213 61 67 149 26 26 41
Aligned 426 514 1114 253 289 530 165 182 297 116 124 187 35 35 43Torso reduced 1 0.2 m R 371 474 1114 229 269 530 155 173 297 111 120 187 35 35 43
0.5 m R 154 197 476 119 144 315 93 107 213 74 82 149 29 30 41
Aligned 446 502 830 270 294 445 177 189 266 124 130 174 36 37 42Torso reduced 2 0.2 m R 389 462 830 245 275 445 166 179 266 119 125 174 36 36 42
0.5 m R 165 201 400 128 150 279 100 112 196 79 86 141 30 31 40
5950 B Kos et al
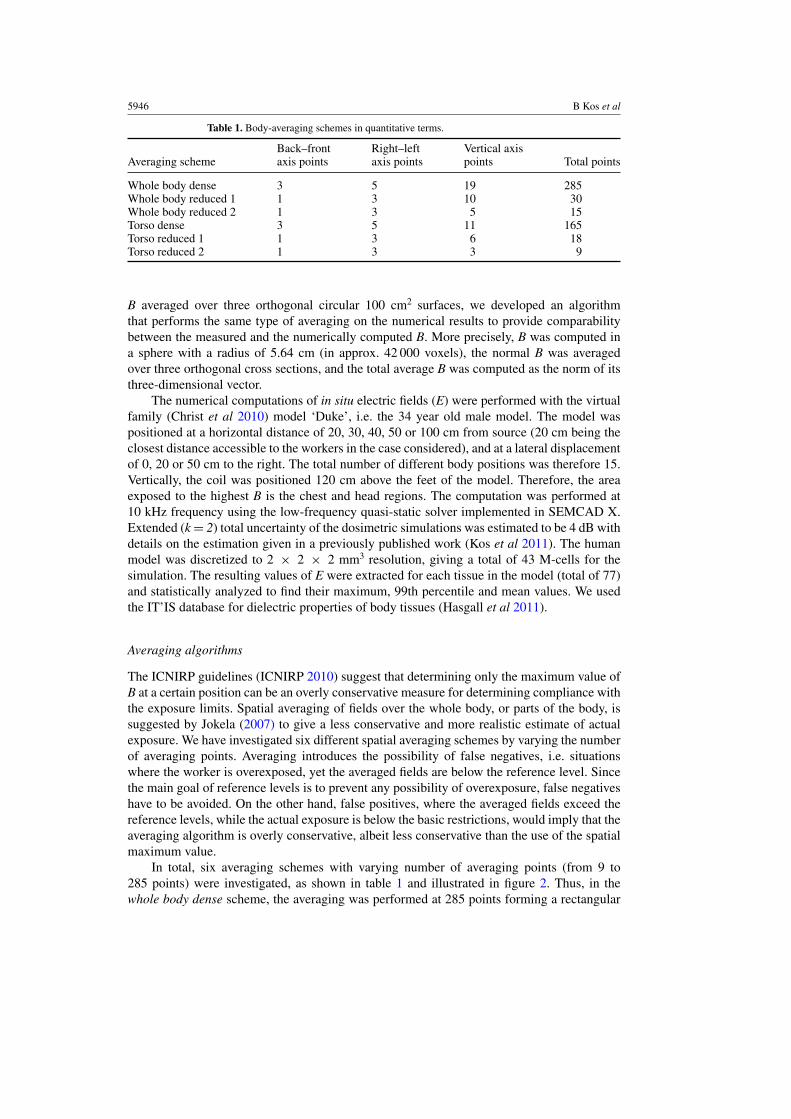
Table 4. Number of tissues with the 99th percentile of in situ electric field (E99%) exceeding thebasic restriction (BR), the highest of the E99% among all tissues, and its ratio to BR. The basicrestriction at 10 kHz is 2.7 V m−1 for all tissues of the head and body (ICNIRP 2010).
Distance (m) 0.2 0.3 0.4 0.5 1
Aligned No of tissues over BR 33 12 2 0 0max E99% 11.9 V m−1 6.07 V m−1 3.53 V m−1 2.23 V m−1 0.585 V m−1
max E99%/BR 439% 225% 131% 83% 22%Tissue with max E99% Ear skin Ear skin Ear skin Ear skin Adrenal gland
0.2 m right No of tissues over BR 28 10 1 0 0max E99% 8.45 V m−1 4.63 V m−1 3.00 V m−1 2.10 V m−1 0.616 V m−1
max E99%/BR 313% 172% 111% 78% 23%Tissue with max E99% Mucosa Mucosa Mucosa Mucosa Bone
0.5 m right No of tissues over BR 3 0 0 0 0max E99% 3.18 V m−1 2.49 V m−1 1.91 V m−1 1.48 V m−1 0.536 V m−1
max E99%/BR 118% 92% 71% 55% 20%Tissue with max E99% Teeth Mucosa Mucosa Mucosa Bone
Table 4 also shows that the most overexposed tissues include mucosa, ear skin, bonesand teeth. In this context, it should be noted that the restrictive ICNIRP limits aim to avoidstimulatory phenomena in the heart and the central nervous system, so overexposure of lesssusceptible tissues should not necessarily be viewed as a source of concern. Still, at the closestdistance, the overexposed tissues also include white and gray matter, heart muscle and spinalcord.
All the results presented in tables 3 and 4 were obtained with the current of 2000 A flowingin the induction coil. However, this current can be adjusted to the needs of the particularmanufacturing process, resulting in proportionally changed values of B and consequently ofE. This can affect the assessment of exposure, including the occurrence of false negatives andpositives. To emulate the changes of induction coil current, we have scaled the values of B asgiven in table 3, and the resulting values of E as given in table 4, by factors ranging from 0.1to 3 in increments of 0.1, and again compared the 99th percentile of E to the basic restrictions.Thus, we have investigated a total of 30 different power levels and corresponding changesof B and E. The total number of misclassifications was determined for each normalizationfactor, and the results are summarized with respect to the averaging scheme in figure 3, whichsuggests that irrespective of magnetic flux density, the quadratic averaging scheme generallyproduces the fewest false negatives.
Table 3 and figure 3 also show that in both arithmetic and quadratic averaging, as thenumber of averaging points increased, false negatives emerged and increased in number.The most reliable averaging schemes were obtained for averaging over the torso withquadratic averaging, with no false negatives even for the maximum number of averagingpoints investigated.
Figure 4 shows the data on misclassifications with respect to the scaling factor. This figurehighlights that field averaging is the most important for the range of magnetic flux densitiesthat induce in situ electric fields close (either below or above) to the basic restriction. Forscaling factors below 0.3, the basic restriction is not exceeded in any tissue for any of theanalyzed body positions, while above 1.9, the basic restriction is exceeded in at least onetissue for each body position except at the largest (100 cm) distance from the induction tunnel.As a consequence, for these scaling factors the number of misclassifications is very small,implying that for either sufficiently low or sufficiently high B, averaging can be avoided. Inaddition, averaging also becomes unnecessary at distances over 1 m from the tunnel, where B

Averaging in EMF exposure assessments 5951
Figure 3. Misclassifications of exposure in different averaging schemes for the whole range ofinvestigated scaling factors. The maximum B yielded 88 false positives and no false negatives.
Figure 4. Misclassifications of exposure as functions of the scaling factor.
5952 B Kos et al
becomes almost homogeneous, and its maximum value can be taken as a reliable indicator ofexposure.
The case studied here is in some aspects quite specific, as it considers a single-source-type functioning at a single frequency. However, as can be seen in figures 1(B) and (C), themagnetic field in the location of the human body is rather similar, both in the aspect of itsspatial distribution and its nonhomogeneity, to those in front of typical circular coils. In ourcase, we did not investigate the very nonhomogeneous fields at extremely close distances tothe furnace, as such distances are in practice inaccessible to the workers; this may not bethe case in many other magnetic field sources, for which the situation, including reasonableaveraging methods, should be addressed by a separate study. The same conclusion applies forsources operating at considerably higher or lower frequencies.
Conclusions
Magnetic fields generated by industrial induction furnaces can induce in situ electric fieldsexceeding the basic restriction according to the ICNIRP guidelines. For determination ofoccupational exposure, spatial averaging provides an adequate estimate, in the sense that itis protective, yet less conservative than the maximum value, which can lead to an excessivenumber of false positives. Quadratic averaging has a much lower likelihood of producing falsenegatives than simple arithmetic averaging, and averaging over the torso yields fewer falsenegatives than averaging over the whole body. Averaging is most important for magnetic fieldsthat induce in situ electric fields close to the basic restriction, while for both significantlyweaker or stronger fields the maximum value is a reliable indicator of exposure.
Acknowledgment
This work was supported by the Slovenian Research Agency under grant number L7-2231.
References
Acero J, Burdio J M, Barragan L A, Navarro D, Alonso R, Ramon J, Monterde F, Hernandez P, Llorente S and Garde I2010 Domestic induction appliances IEEE Ind. Appl. Mag. 16 39–47
Bakker J F, Paulides M M, Neufeld E, Christ A, Chen X L, Kuster N and van Rhoon G C 2012 Children and adultsexposed to low-frequency magnetic fields at the ICNIRP reference levels: theoretical assessment of the inducedelectric fields Phys. Med. Biol. 57 1815–29
Bayindir N, Kukrer O and Yakup M 2003 DSP-based PLL-controlled 50–100 kHz 20 kW high-frequency inductionheating system for surface hardening and welding applications RID B-4867–2008 IEE Proc. B 150 365–71
Christ A et al 2010 The Virtual Family—development of surface-based anatomical models of two adults and twochildren for dosimetric simulations Phys. Med. Biol. 55 N23–38
Faerman L, Luzgin V, Petrov A and Rachkov S 1997 Highly efficient induction heating units for metallurgy andmachine construction Metallurgist 41 191–3
Floderus B, Stenlund C and Carlgren F 2002 Occupational exposures to high frequency electromagnetic fields in theintermediate range (>300 Hz–10 MHz) Bioelectromagnetics 23 568–77
Hasgall P, Neufeld E, Gosselin M, Klingenbock A and Kuster N 2011 IT’IS Database for thermal and electromagneticparameters of biological tissues www.itis.ethz.ch/database
Hirata A, Takano Y, Fujiwara O, Dovan T and Kavet R 2011 An electric field induced in the retina and brain atthreshold magnetic flux density causing magnetophosphenes Phys. Med. Biol. 56 4091–101
ICNIRP 2010 Guidelines for limiting exposure to time-varying electric and magnetic fields (1 Hz to 100 kHz) HealthPhys. 99 818–36
IEEE 2006 IEEE standard for safety levels with respect to human exposure to radio frequency electromagneticfields, 3 kHz to 300 GHz IEEE Standard C95.1–2005 (Revision of IEEE Standard C95.1–1991)doi:10.1109/IEEESTD.2006.99501
Averaging in EMF exposure assessments 5953
Jokela K 2007 Assessment of complex EMF exposure situations including inhomogeneous field distribution HealthPhys. 92 531–40
Kos B, Valic B, Miklavcic D, Kotnik T and Gajsek P 2011 Pre- and post-natal exposure of children to EMF generatedby domestic induction cookers Phys. Med. Biol. 56 6149–60
Kuster N, Torres V B, Nikoloski N, Frauscher M and Kainz W 2006 Methodology of detailed dosimetry and treatmentof uncertainty and variations for in vivo studies Bioelectromagnetics 27 378–91
Laakso I and Hirata A 2012 Reducing the staircasing error in computational dosimetry of low-frequencyelectromagnetic fields Phys. Med. Biol. 57 N25–34
Millan I, Burdio J M, Acero J, Lucia O and Palacios D 2010 Resonant inverter topologies for three concentric planarwindings applied to domestic induction heating Electron. Lett. 46 1225–6