occupational outlook report 2011 -...
TRANSCRIPT

2011Occupational Outlook Report


2011 Occupational Outlook ReportSan Diego County
2011 Edition

i
AcknowledgmentsThe San Diego Workforce Partnership thanks
the following for making the 2011 Occupational Outlook Report a reality.
San Diego Workforce Partnership Board of Directors
Mark Cafferty, San Diego Workforce Partnership, President and CEO
Project ManagersD. Todd Phillips, Director, Governmental Relations and Legislative Affairs
Gary Moss, Labor Market Intelligence SpecialistChuck Flacks, Research Director
Evelyn Ramirez, Administrative AssistantShannon Michelsen, Communications Coordinator
Product DevelopmentBW Research Partnership, Inc.
Belladia Marketing and DesignMichael Schuerman Photography
The San Diego Workforce Partnership would also like to thank the following for their contribution to initiating the project:
The San Diego Workforce Partnership thanks the nearly 800 area employers who graciously gave their valuable time to provide the data used to develop the individual occupational profiles available in this report.
Their willing support and cooperation made this report possible.
David Almeida, California Center for Sustainable EnergyWendy Evers, San Diego State UniversityChuck Flacks, San Diego Workforce PartnershipPhil Jordan, lmigreen.comAlan Kneale, Cardinal HealthJudy Lawton, The Lawton Group
Gary Moss, San Diego Workforce PartnershipEvelyn Ramirez, San Diego Workforce PartnershipSharon Rhodes, San Diego Community College DistrictLauree Sahba, San Diego Regional Economic Development Corp.Agnes Zsigovics, San Diego Workforce Partnership

ii
The San Diego Workforce Partnership is a nonprofit corporation whose mis-sion is to foster economic growth and prosperity through education, training and lifelong learning. In fulfilling this mission, the Workforce Partnership pro-vides leadership on workforce issues affecting the region, directs San Diego’s Workforce Investment Act employment and training efforts, and funds work-force education and training efforts that meet the needs of the region’s econ-omy. Providing leadership in these areas requires the Workforce Partnership to share current and reliable information about the region’s labor market with employers, education and training providers, community and government leaders, and residents.
The Occupational Outlook Report was last published in 2007 and funding for future project was no longer available. As a result of lengthy discussions, a fo-cus group issued a recommendation and upon concurrence by the San Diego
Workforce Partnership Board of Directors funds from the U.S. Department of Labor and the State of California - Employment Development Department were allocated to produce the 2011 Occupational Outlook Report. Future edi-tions of this product will depend upon available funding.
The 2011 Occupational Outlook Report supports the above objective by provid-ing detailed occupational information for 46 key occupations from throughout the county. Fully understanding these profiles, though, requires placing them in the context of the region’s overall economy.
The region’s economy was battered by the Great Recession which began lo-cally in late 2006 and though the local recession was officially declared over in the fall of 2009 the economy has been slow in its recovery. Local unemploy-ment remains near 10 percent, more than double the norm for the region. The number of unemployed averages about 150,000 persons each month. New job growth for the regions is projected between 15,000 and 20,000 new jobs for the next several years. At that forecasted rate, estimates are that it will take 4 - 5 years to recoup the 122,000 jobs lost during the recession. The economic and job outlook is for slow growth over the next several years.
The benefit of region is its diverse industry base. While the construction, real estate, finance, retail trade, and manufacturing sectors continue to struggle to recover, the life sciences, telecommunications, defense contracting, visitor ser-vices and entertainment, software development, clean tech, and healthcare sectors provide a more positive outlook for the region.
The vitality of the region depends on the diversity of the economy and the ability of the workforce to adapt to the ever-changing requirements of local employers.
Preface
San Diego County’s Economy

iii
The San Diego Workforce Partnership provides businesses, educators, policy makers, and job seekers local labor market information to help them make in-formed decisions about company staffing, education programs and curricula, workforce policy, and career choices. The 2011 Occupational Outlook Report (OOR) serves as the cornerstone of this activity. The OOR contains profiles of 46 occupations with information on wages and benefits, education, skill and experience requirements, employment outlook, retirement outlook, and occupational growth information. The information in this report can be used by a variety of orga-nizations and individuals for many different purposes, including:
Career Decisions:
Career counselors/advisors and job seekers can make informed occupational choices based on skills, abilities, interests, education, and personal needs. The localized information is easy to read and includes employer requirements, wages, labor demand, sources of employment, and education and training employers typically required for applicants in the occupation.
Curriculum Design:
Training providers can assess and update their curricula based on the skill re-quirements for the occupations profiled in the report. This will attract students looking for the best programs, and employers looking for students with ap-propriate skills.
Economic Development:
Economic development organizations and local government agencies can find information that is frequently requested by companies considering locat-ing in the region, such as occupational size, expected growth rates, wages, and benefits typically offered.
Human Resource Management:
Small business owners and large corporate human resource directors alike can use this report to help determine competitive wages and benefits and im-prove their recruitment methods.
Program Marketing:
Training providers can effectively market their programs by informing students about the current demand and projected growth for an occupation. They can also demonstrate to students and employers that their programs meet em-ployer’s needs because they were developed using reliable local occupational data.
Program Planning:
Education and training administrators can use the data on occupational size and expected growth rates to evaluate, improve and eliminate programs, or to plan new programs.
Purpose and Uses of the 2011 Occupational Outlook Report

iv
Table of Contents
Acknowledgments .......................................................................................................................................................................................... i
Preface and Economic Outlook, San Diego County 2007 ............................................................................................................................. ii
Purpose and Uses of Report .........................................................................................................................................................................iii
Table of Contents ......................................................................................................................................................................................... iv
Understanding the Occupational Profiles ................................................................................................................................................... vi
Methodology ................................................................................................................................................................................................ iv
Occupational ProfilesAccountants and Auditors ............................................................................................................................................................................................1
Architects, Except Landscape and Naval ......................................................................................................................................................................3
Automotive Service Technicians and Mechanics ..........................................................................................................................................................5
Biological Technicians ..................................................................................................................................................................................................7
Bookkeeping, Accounting, and Auditing Clerks ...........................................................................................................................................................9
Budget Analysts .........................................................................................................................................................................................................11
Carpenters .................................................................................................................................................................................................................13
Civil Engineers ...........................................................................................................................................................................................................15
Claims Adjusters, Examiners, and Investigators .........................................................................................................................................................17
Computer Programmers ............................................................................................................................................................................................19
Computer Software Engineers, Applications ..............................................................................................................................................................21
Computer Software Engineers, Systems Software .......................................................................................................................................................23
Computer Support Specialists ....................................................................................................................................................................................25
Computer Systems Analysts........................................................................................................................................................................................27
Construction Manager ...............................................................................................................................................................................................29
Cost Estimators ..........................................................................................................................................................................................................31
Customer Service Representatives ..............................................................................................................................................................................33
Database Administrators ...........................................................................................................................................................................................35
Dental Assistants .......................................................................................................................................................................................................37

v
Dental Hygienists .......................................................................................................................................................................................................39
Educational, Vocation, and School Counselors ..........................................................................................................................................................41
Electricians ................................................................................................................................................................................................................43
Executive Secretaries and Administrative Assistants ...................................................................................................................................................45
Graphic Designers .....................................................................................................................................................................................................47
Legal Secretaries ........................................................................................................................................................................................................49
Licensed Practical and Licensed Vocational Nurses ....................................................................................................................................................51
Maintenance and Repair Workers, General ...............................................................................................................................................................53
Mechanical Engineers ................................................................................................................................................................................................55
Medical Assistants ......................................................................................................................................................................................................57
Medical Records and Health Information Technicians ...............................................................................................................................................59
Medical Secretaries ....................................................................................................................................................................................................61
Mental Health and Substance Abuse Social Workers ..................................................................................................................................................63
Mental Health Counselors .........................................................................................................................................................................................65
Network and Computer Systems Administrators ........................................................................................................................................................67
Network Systems and Data Communications Analysts ..............................................................................................................................................69
Nursing Aides, Orderlies, and Attendants ..................................................................................................................................................................71
Painters, Construction and Maintenance ...................................................................................................................................................................73
Paralegals and Legal Assistants .................................................................................................................................................................................75
Pharmacy Technicians ...............................................................................................................................................................................................77
Plumbers, Pipefitters, and Steamfitters .......................................................................................................................................................................79
Police and Sheriff’s Patrol Officers ..............................................................................................................................................................................81
Registered Nurses .......................................................................................................................................................................................................83
Surgical Technologists ................................................................................................................................................................................................85
Teachers - Middle School, Except Special and Vocational Education Surgical Technologists .......................................................................................87
Teachers - Secondary School ......................................................................................................................................................................................89
Truck Drivers, Heavy Tractor Trailer ..........................................................................................................................................................................91
Table of Contents

vi
Understanding the Occupational Profiles
Definitions and SOC CodeThe definitions and SOC Codes are those used in O*NET developed by the U.S. Department of Labor. Occupational definitions, SOC Codes and skill require-ments can be accessed at www.onetonline.org.
Typical Educational Requirements for this OccupationEmployers were provided a selection of educational levels for each occupation. The list is the percent of responding employers’ choice most often required for the educational requirement for the occupation.
Typical Level of Work Requirements for this OccupationEmployers were provided a selection of work experience levels for each occu-pation. The list is the percent of responding employers’ choice they most often require for work experience in each occupation.
Pay Range – Hourly/AnnuallyThe pay range displays the lowest and the highest hourly wage and the lowest and highest annual wage as reported by employers for each occupation. Em-ployers provided wage information for entry-level and experienced employ-ees. Some occupations may have only an hourly or an annual wage based on the reporting by responding employers.
Where the Jobs AreWhere the jobs are was developed from the responses of the employers allow-ing them to identify the industry sector in which their firm belonged.
12-Month Growth ExpectationsThe percent of responding employers who indicated they would have more,
less or the same number of employees in the occupation in the next 12 months is displayed here.
Employers Anticipate Increasing or Decreasing Employment in the OccupationsThe numbers on the chart indicate the percent increase or decrease, and rep-resents the current number of employees in the occupation and the number of employees expected in the occupation in the next 12 months. The increase or decrease in employees represents only the data obtained from responding employers and does not include opportunities available from all employers in the county who employ the occupation.
Benefits Offered by EmployersThis represents the percent of responding employers who offer (Yes) or do not offer (No) the identified benefits.
Percent of Benefits Covered by EmployerThe chart displays the percent of employers that pay certain levels of each benefit listed.
Most Important Skills for Applicants The most important skills are listed in order of importance by the percent of employers who indicated the skill as important for applicants. Responding employers were able to select more than one skill.
Most Deficient Skills of Applicants The most deficient skills are listed in order of deficiency by the percent of em-ployers who indicated the skill as being deficient in applicants. Responding employers were able to select more than one skill.
The following are explanations of the topics and terms used in the 2011 Occupational Outlook Report:

vii
Most Effective Recruitment Methods for Finding Qualified Appli-cantsEmployers could select their most effective recruitment methods for finding qualified entry-level job applicants and for finding qualified mid-to-senior lev-el job applicants. Employers could select up to two methods.
How Often the Position is Permanent Full-Time PositionThe percentage of responding employers who indicated the occupation was either always full-time, usually full-time, or seldom-to-never full-time.
Average Hours per Week Position RequiresA range of the average number of hours worked by employees in this occupa-tion provided by responding employers is displayed.
Employer Expectations for Retirements Over the Next 2 – 3 YearsThe percent shown represents the percentage of responding employers that expect to see many retirements in the next 2 to 3 years from their mature workers (50+ years of age) in the profiled occupation. Employers indicated if they expected to see a substantial number of retirements (over 10%), some retirements (between 10% and 3%), or little-to-no retirements (less than 3%) for each occupation in the next 2 to 3 years.
Employers That Would Consider Hiring an Ex-Offender for this PositionThe percent shown represents the percentage of responding employers that indicated they would be willing to consider hiring an ex-offender (someone who has been incarcerated for at least 6 months) for this occupations: either yes, no, or possibly (depending on the crime committed).
Annual Job Growth Projections for San Diego County 2010 – 2015EMSI (Economic Modeling Specialists Inc.) developed the five-year projections used in this section. The projections include the annual number of new jobs forecasted to be generated by employers throughout the county, plus the av-erage number of replacement jobs (openings resulting from retirements, pro-motions, transfers etc.) which equals the average total of annual openings for the occupation in the county.
New Job Growth Rate 2010 – 2015The new job growth rate for each occupation, developed by EMSI as part of their occupation projections for San Diego County, is compared to the new job growth rate for all occupations in the county.
Understanding the Occupational Profiles
viii
Methodology
The San Diego Workforce Partnership (SDWP) commissioned BW Research Partnership, Inc. (BW Research) to conduct a study with participating business-es in San Diego County that would allow the development of occupational profiles for 51 occupations. Viewed broadly, the main research objectives of the study were to:
• Identify the 51 occupations that would be the focus of the Occupational Outlook Report;
• Assess employer demand and difficulty finding qualified applicants for these occupations;
• Identify the benefits, wages and work requirements associated with these occupations;
• Understand the work experience and level of education employers are requiring for each of the occupations; and
• Determine the skills that are most important to employers for each oc-cupation and those skills in which new applicants are most likely to be deficient.
Methodology OverviewThe methodology for this study focused on employers in San Diego County that were likely to employ at least one of the 51 occupations that were identi-fied. Response time to the questionnaire averaged 19 minutes. In total, a sam-ple of 787 San Diego County employers completed a telephone (367) or web (420) version of the questionnaire and gave in-depth information through 1,956 responses. On average, there were 2.49 occupational responses per par-ticipating firm.
The telephone questionnaire was used to contact selected from a database of 26,019 San Diego County employers, which was acquired from InfoUSA. The initial sample of San Diego County employers was delineated into industries likely to employ the occupations included in the study. Employers were cate-gorized into one industry and then firms were split by size - small firms (5 to 24 employees) and medium to large firms (25 or more employees). Employers in industries likely to hire multiple occupations and medium to large firms were the first to be contacted to participate in the study. Employers could complete up to four occupational profiles when they were contacted.
The web version of the questionnaire was distributed by Research Now (an e-Rewards company) as part of their San Diego County employer web panel. The initial section of the online questionnaire verified that employers 1) had at least one location in San Diego County, 2) were in one of the industries likely to have the occupations, and 3) had employees in at least one of the occupations. During data review, the results were checked to ensure that no individual firm participated in the study more than once.
Of the 51 occupations, all but five received at least 10 employer responses. The results for those five occupations were not included in the occupational outlook report since they received less than 10 completed questionnaires. The employers’ responses provided sufficient data to produce the 46 profiles in this report.
Questionnaire DesignThrough an iterative process, BW Research worked closely with San Diego Workforce Partnership, Labor Market Information (LMI) Team to develop a data gathering instrument that met all the research objectives of the study. In de-veloping the instrument, BW Research utilized techniques to overcome known biases in survey research and minimize potential sources of measurement er-ror within the study. BW Research also worked closely with the LMI Team to identify five specific skills for evaluation for each of the occupations.

ix
Sampling MethodA mixed-method approach (telephone and web) was utilized to interview a sample of employers in San Diego County with the objective of maximizing the occupational response from each employer. The universe of firms was stratified based on industry and employer size. Firms were then grouped into clusters with others sharing the same profile and then randomly selected to complete the questionnaire on occupations in their in-dustry. Larger employers (those with 25 employees or more) and those in in-dustries with multiple occupations were the first employers that were contact-ed to complete the questionnaire since they were the most likely to be able to provide information on multiple occupations. Employers were asked about up to 10 occupations that were most likely to be employed in their industry. If employers did not have at least one of the occupations of interest, they were thanked and the interview was terminated without a completed response.
The primary method of data collection was evenly split between the tele-phone and the web version of the survey. The sampling plan for the study was continually updated in order to focus on those industries that were more likely to have the occupations in which less than 20 questionnaire responses had been completed. During data review, the data were checked to ensure that no individual firm completed the survey more than once (for example by phone and web).
Data CollectionPrior to beginning data collection, BW Research conducted interviewer train-ing for the telephone portion of the study. BW Research also pre-tested and re-tested both questionnaire instruments to ensure that all the words and questions were easily understood by respondents. Telephone interviews were generally conducted from 9:00 am to 4:30 pm Monday through Friday. Follow-up callbacks were scheduled at respondents’ convenience.
The data collection period was April 14 through May 24, 2011
Methodology

Occupations
1
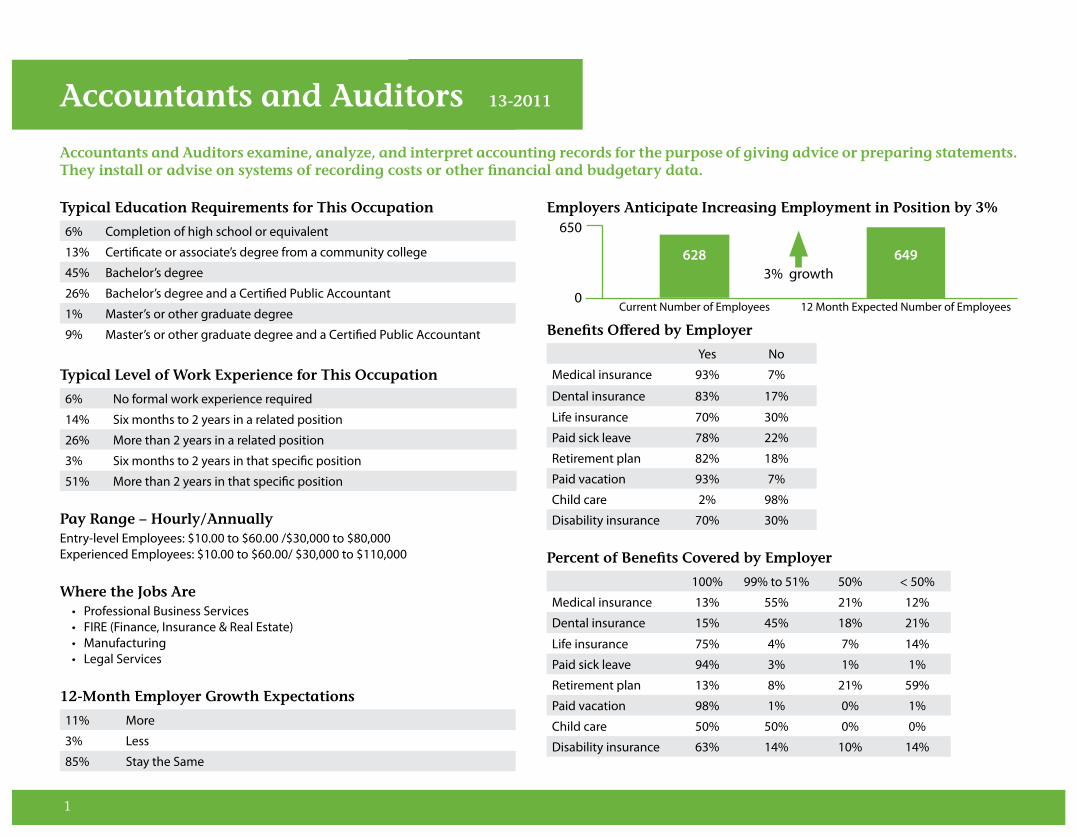
Typical Education Requirements for This Occupation
6% Completion of high school or equivalent
13% Certificate or associate’s degree from a community college
45% Bachelor’s degree
26% Bachelor’s degree and a Certified Public Accountant
1% Master’s or other graduate degree
9% Master’s or other graduate degree and a Certified Public Accountant
Typical Level of Work Experience for This Occupation
6% No formal work experience required
14% Six months to 2 years in a related position
26% More than 2 years in a related position
3% Six months to 2 years in that specific position
51% More than 2 years in that specific position Pay Range – Hourly/Annually Entry-level Employees: $10.00 to $60.00 /$30,000 to $80,000Experienced Employees: $10.00 to $60.00/ $30,000 to $110,000
Where the Jobs Are• Professional Business Services • FIRE (Finance, Insurance & Real Estate) • Manufacturing • Legal Services
12-Month Employer Growth Expectations
11% More
3% Less
85% Stay the Same
Employers Anticipate Increasing Employment in Position by 3%
Benefits Offered by Employer
Yes No
Medical insurance 93% 7%
Dental insurance 83% 17%
Life insurance 70% 30%
Paid sick leave 78% 22%
Retirement plan 82% 18%
Paid vacation 93% 7%
Child care 2% 98%
Disability insurance 70% 30%
Percent of Benefits Covered by Employer
100% 99% to 51% 50% < 50%
Medical insurance 13% 55% 21% 12%
Dental insurance 15% 45% 18% 21%
Life insurance 75% 4% 7% 14%
Paid sick leave 94% 3% 1% 1%
Retirement plan 13% 8% 21% 59%
Paid vacation 98% 1% 0% 1%
Child care 50% 50% 0% 0%
Disability insurance 63% 14% 10% 14%
Accountants and Auditors examine, analyze, and interpret accounting records for the purpose of giving advice or preparing statements. They install or advise on systems of recording costs or other financial and budgetary data.
Accountants and Auditors 13-2011
650
0
628 6493% growth
Current Number of Employees 12 Month Expected Number of Employees

2
Most Important Skills for Applicants
61% Ability to analyze and interpret budgets and data
57% Ability to prepare financial statements and reports
32% Ability to plan, set up and administer accounting systems
27% Ability to effectively use spreadsheet software
22% Has a Certified Public Accountant (CPA) certification
Most Deficient Skills of Applicants
29% Ability to plan, set up and administer accounting systems
29% Has a Certified Public Accountant (CPA) certification
17% Ability to analyze and interpret budgets and data
16% Ability to prepare financial statements and reports
9% Ability to effectively use spreadsheet software
Most Effective Recruitment Methods for Finding Qualified Applicants
Entry Level Mid to Senior Level
Place ads online, like Monster.com or Craigslist 55% 44%
Contract with employment agency/recruiter 23% 33%
The firm's website or internal job board 23% 28%
Partner with a college or university 14% n/a
Word of mouth/referrals/networking 14% 23%
Job fairs 5% n/a
Advertise in newspaper 3% 4%
LinkedIn or other social media sites 2% 2%
Firm does own recruiting/walk-ins 1% n/a
Promote from within n/a 1%
How Often Position is Permanent Full-Time Position
76% Always
20% Usually
3% Seldom to never
Average Hours per Week Position Requires - 4 to 75 hours
Employer Expectations for Retirements Over the Next 2 to 3 Years
2% Substantial (Over 10%)
17% Somewhat (Between 10% and 3%)
81% Little to none (Less than 3%)
Employers That Would Consider Hiring an Ex-Offender for this Position (someone that has been incarcerated for at least six months)
1% Yes
36% It depends on the crime
63% No
Annual Job Growth Projections for San Diego County 2010 – 2015
285 Average annual new jobs
165 Average annual replacement jobs
450 Average total annual openings(Source: EMSI)
New Job Growth Rate 2010 – 201515% percent growth rate for accountants and auditors in San Diego County over the next five years. This is compared to 8 percent growth for all occupa-tions in the county over the next five years. (Source: EMSI)
Accountants and Auditors

3
Typical Education Requirements for This Occupation
77% Bachelor’s degree
23% Master’s or other graduate degree
Typical Level of Work Experience for This Occupation
0% No formal work experience required
0% Six months to 2 years in a related position
15% More than 2 years in a related position
0% Six months to 2 years in that specific position
85% More than 2 years in that specific position Pay Range – AnnualEntry-level Employees: $40,000 to $80,000Experienced Employees: $50,000 to $125,000
Where the Jobs Are• Education & Social Services • Mental Health Positions
12-Month Employer Growth Expectations
21% More
0% Less
79% Stay the Same
Employers Anticipate Increasing Employment in Position by 5%
Benefits Offered by Employer
Yes No
Medical insurance 87% 13%
Dental insurance 86% 14%
Life insurance 67% 33%
Paid sick leave 79% 21%
Retirement plan 67% 33%
Paid vacation 87% 13%
Child care 7% 93%
Disability insurance 62% 38%
Percent of Benefits Covered by Employer
100% 99% to 51% 50% < 50%
Medical insurance 27% 55% 0% 18%
Dental insurance 30% 40% 10% 20%
Life insurance 67% 11% 11% 11%
Paid sick leave 82% 0% 18% 0%
Retirement plan 22% 0% 22% 56%
Paid vacation 92% 0% 8% 0%
Child care 0% 0% 0% 100%
Disability insurance 57% 0% 43% 0%
Architects, Except Landscape and Naval plan and design structures, such as private residences, office buildings, theaters, factories, and other structural property.
Architects, Except Landscape and Naval 17-1011
130
0
120 1265% growth
Current Number of Employees 12 Month Expected Number of Employees
4
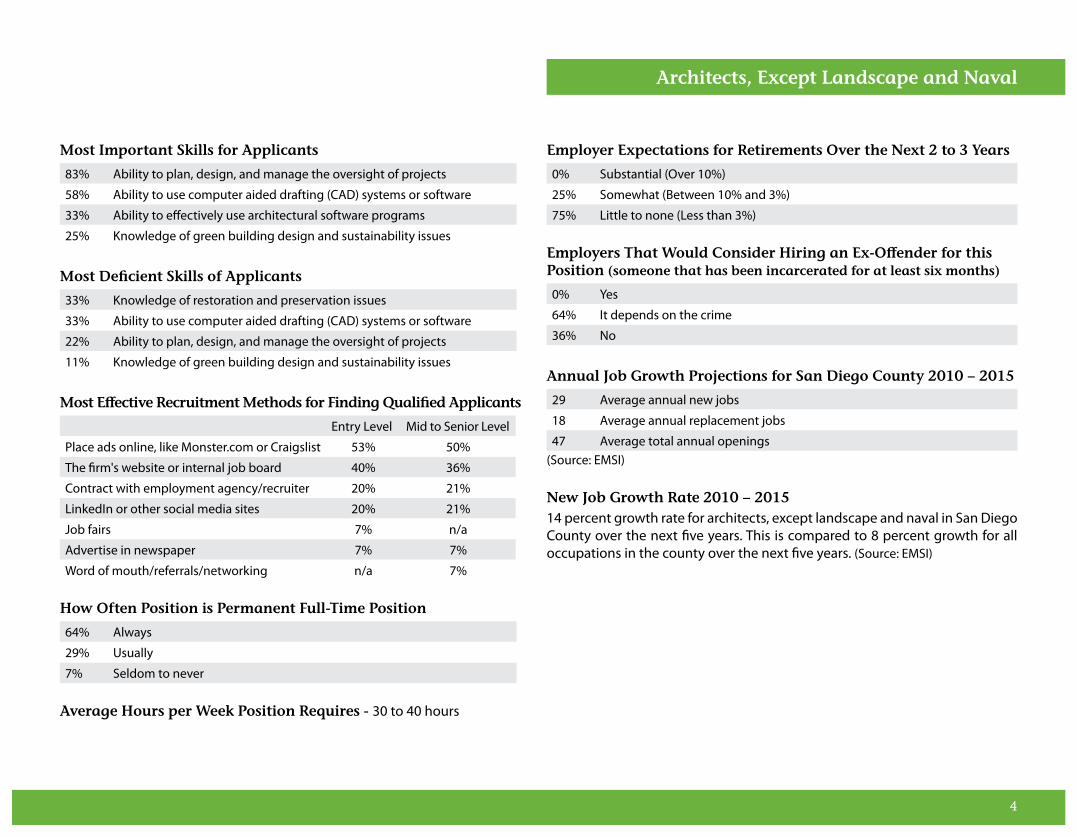
Most Important Skills for Applicants
83% Ability to plan, design, and manage the oversight of projects
58% Ability to use computer aided drafting (CAD) systems or software
33% Ability to effectively use architectural software programs
25% Knowledge of green building design and sustainability issues
Most Deficient Skills of Applicants
33% Knowledge of restoration and preservation issues
33% Ability to use computer aided drafting (CAD) systems or software
22% Ability to plan, design, and manage the oversight of projects
11% Knowledge of green building design and sustainability issues
Most Effective Recruitment Methods for Finding Qualified Applicants
Entry Level Mid to Senior Level
Place ads online, like Monster.com or Craigslist 53% 50%
The firm's website or internal job board 40% 36%
Contract with employment agency/recruiter 20% 21%
LinkedIn or other social media sites 20% 21%
Job fairs 7% n/a
Advertise in newspaper 7% 7%
Word of mouth/referrals/networking n/a 7%
How Often Position is Permanent Full-Time Position
64% Always
29% Usually
7% Seldom to never
Average Hours per Week Position Requires - 30 to 40 hours
Employer Expectations for Retirements Over the Next 2 to 3 Years
0% Substantial (Over 10%)
25% Somewhat (Between 10% and 3%)
75% Little to none (Less than 3%)
Employers That Would Consider Hiring an Ex-Offender for this Position (someone that has been incarcerated for at least six months)
0% Yes
64% It depends on the crime
36% No
Annual Job Growth Projections for San Diego County 2010 – 2015
29 Average annual new jobs
18 Average annual replacement jobs
47 Average total annual openings(Source: EMSI)
New Job Growth Rate 2010 – 201514 percent growth rate for architects, except landscape and naval in San Diego County over the next five years. This is compared to 8 percent growth for all occupations in the county over the next five years. (Source: EMSI)
Architects, Except Landscape and Naval

5
Typical Education Requirements for This Occupation
62% Completion of high school or equivalent
38% Certificate or associate’s degree from a community college
Typical Level of Work Experience for This Occupation
0% No formal work experience required
20% Six months to 2 years in a related position
7% More than 2 years in a related position
7% Six months to 2 years in that specific position
67% More than 2 years in that specific position Pay Range – HourlyEntry-level Employees: $8.00 to $40.00Experienced Employees: $10.00 to $40.00
Where the Jobs Are• Auto Repair
12-Month Employer Growth Expectations
40% More
7% Less
53% Stay the Same
Employers Anticipate Increasing Employment in Position by 9%
Benefits Offered by Employer
Yes No
Medical insurance 73% 27%
Dental insurance 33% 67%
Life insurance 20% 80%
Paid sick leave 53% 47%
Retirement plan 40% 60%
Paid vacation 87% 13%
Child care 7% 93%
Disability insurance 73% 27%
Percent of Benefits Covered by Employer
100% 99% to 51% 50% < 50%
Medical insurance 18% 9% 45% 27%
Dental insurance 20% 0% 20% 60%
Life insurance 67% 0% 0% 33%
Paid sick leave 88% 0% 0% 13%
Retirement plan 0% 0% 17% 83%
Paid vacation 100% 0% 0% 0%
Child care 0% 0% 0% 100%
Disability insurance 33% 0% 17% 50%
Automotive Service Technicians and Mechanics diagnose, adjust, repair, or overhaul automotive vehicles.
Automotive Service Technicians and Mechanics 49-3023
100
0
91 999% growth
Current Number of Employees 12 Month Expected Number of Employees

6
Most Important Skills for Applicants
50% Ability to diagnose faults or malfunctions in automobiles
50% Ability to use and understand high-tech diagnostic devices including computers
42% Skill to use specialized tools
33% Ability to adjust, repair or replace automotive parts
25% Received ASE (Automotive Service Excellence) certification
Most Deficient Skills of Applicants
55% Ability to diagnose faults or malfunctions in automobiles
27% Ability to adjust, repair or replace automotive parts
9% Ability to use and understand high-tech diagnostic devices including computers
9% Received ASE (Automotive Service Excellence) certification
Most Effective Recruitment Methods for Finding Qualified Applicants
Entry Level Mid to Senior Level
Place ads online, like Monster.com or Craigslist 46% 45%
Word of mouth/referrals/networking 38% 36%
Contract with employment agency/recruiter 8% 9%
Partner with a college or university 8% n/a
Advertise in newspaper 8% 18%
Firm does own recruiting/walk-ins 8% n/a
How Often Position is Permanent Full-Time Position
100% Always
0% Usually
0% Seldom to never
Average Hours per Week Position Requires - 40 to 50 hours
Employer Expectations for Retirements Over the Next 2 to 3 Years
0% Substantial (Over 10%)
13% Somewhat (Between 10% and 3%)
87% Little to none (Less than 3%)
Employers That Would Consider Hiring an Ex-Offender for this Position (someone that has been incarcerated for at least six months)
21% Yes
64% It depends on the crime
14% No
Annual Job Growth Projections for San Diego County 2010 – 2015
002 Average annual new jobs
102 Average annual replacement jobs
104 Average total annual openings(Source: EMSI)
New Job Growth Rate 2010 – 20150.25 percent growth rate for automotive service technicians and mechanics in San Diego County over the next five years. This is compared to 8 percent growth for all occupations in the county over the next five years. (Source: EMSI)
Automotive Service Technicians and Mechanics

7
Typical Education Requirements for This Occupation
3% Certificate or associate’s degree from a community college
78% Bachelor’s degree
19% Master’s or other graduate degree
Typical Level of Work Experience for This Occupation
13% No formal work experience required
33% Six months to 2 years in a related position
23% More than 2 years in a related position
7% Six months to 2 years in that specific position
23% More than 2 years in that specific position Pay Range – HourlyEntry-level Employees: $10.00 to $20.00Experienced Employees: $10.00 to $26.00
Where the Jobs Are• Life Sciences & Bio
12-Month Employer Growth Expectations
30% More
0% Less
70% Stay the Same
Employers Anticipate Increasing Employment in Position by 4%
Benefits Offered by Employer
Yes No
Medical insurance 97% 3%
Dental insurance 97% 3%
Life insurance 90% 10%
Paid sick leave 94% 6%
Retirement plan 88% 13%
Paid vacation 97% 3%
Child care 21% 79%
Disability insurance 91% 9%
Percent of Benefits Covered by Employer
100% 99% to 51% 50% < 50%
Medical insurance 14% 82% 4% 0%
Dental insurance 18% 75% 4% 4%
Life insurance 60% 24% 8% 8%
Paid sick leave 93% 7% 0% 0%
Retirement plan 24% 24% 0% 52%
Paid vacation 97% 3% 0% 0%
Child care 0% 50% 0% 50%
Disability insurance 50% 42% 4% 4%
Biological Technicians assist biological and medical scientists in laboratories. They set up, operate, and maintain laboratory instruments and equipment, monitor experiments, make observations, and calculate and record results.
Biological Technicians 19-4021
2,050
0
1,966 2,0384% growth
Current Number of Employees 12 Month Expected Number of Employees

8
Most Important Skills for Applicants
65% Skill of conducting biological, biochemical or laboratory analyses
52% Ability to analyze data (quantitative and qualitative) and prepare reports
52% Ability to conduct laboratory research
29% Ability to apply multiple scientific theories and concepts
3% Knowledge of genetic theory
Most Deficient Skills of Applicants
36% Ability to analyze data (quantitative and qualitative) and prepare reports
27% Skill of conducting biological, biochemical or laboratory analyses
18% Ability to apply multiple scientific theories and concepts
14% Knowledge of genetic theory
5% Ability to conduct laboratory research
Most Effective Recruitment Methods for Finding Qualified Applicants
Entry Level Mid to Senior Level
The firm’s website or internal job board 52% 36%
Place ads online, like Monster.com/Craigslist 34% 14%
Contract with employment agency/recruiter 34% 68%
Partner with a college or university 17% n/a
Word of mouth/referrals/networking 14% 7%
LinkedIn or other social media sites n/a 4%
How Often Position is Permanent Full-Time Position
43% Always
50% Usually
7% Seldom to never
Average Hours per Week Position Requires - 25 to 50 hours
Employer Expectations for Retirements Over the Next 2 to 3 Years
0% Substantial (Over 10%)
7% Somewhat (Between 10% and 3%)
93% Little to none (Less than 3%)
Employers That Would Consider Hiring an Ex-Offender for this Position (someone that has been incarcerated for at least six months)
4% Yes
50% It depends on the crime
46% No
Annual Job Growth Projections for San Diego County 2010 – 2015
082 Average annual new jobs
084 Average annual replacement jobs
166 Average total annual openings(Source: EMSI)
New Job Growth Rate 2010 – 201517 percent growth rate for biological technicians in San Diego County over the next five years. This is compared to 8 percent growth for all occupations in the county over the next five years. (Source: EMSI)
Biological Technicians
9
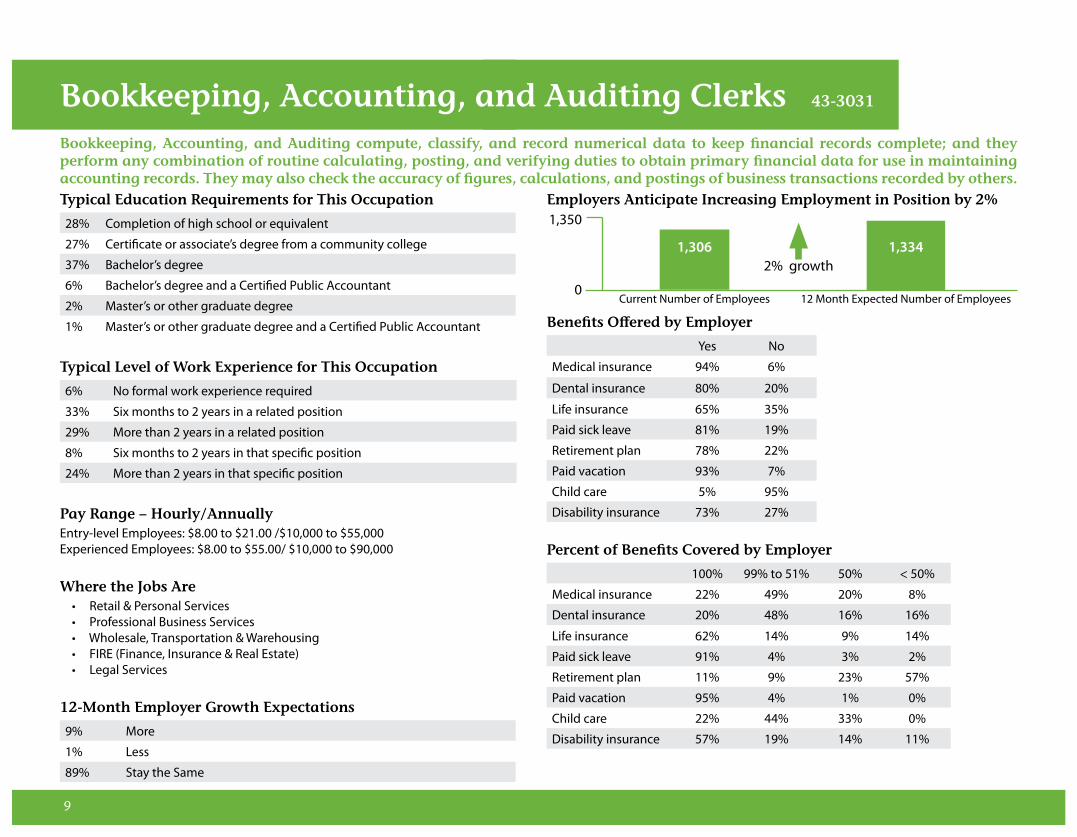
Typical Education Requirements for This Occupation
28% Completion of high school or equivalent
27% Certificate or associate’s degree from a community college
37% Bachelor’s degree
6% Bachelor’s degree and a Certified Public Accountant
2% Master’s or other graduate degree
1% Master’s or other graduate degree and a Certified Public Accountant
Typical Level of Work Experience for This Occupation
6% No formal work experience required
33% Six months to 2 years in a related position
29% More than 2 years in a related position
8% Six months to 2 years in that specific position
24% More than 2 years in that specific position
Pay Range – Hourly/Annually Entry-level Employees: $8.00 to $21.00 /$10,000 to $55,000Experienced Employees: $8.00 to $55.00/ $10,000 to $90,000
Where the Jobs Are• Retail & Personal Services • Professional Business Services • Wholesale, Transportation & Warehousing • FIRE (Finance, Insurance & Real Estate) • Legal Services
12-Month Employer Growth Expectations
9% More
1% Less
89% Stay the Same
Employers Anticipate Increasing Employment in Position by 2%
Benefits Offered by Employer
Yes No
Medical insurance 94% 6%
Dental insurance 80% 20%
Life insurance 65% 35%
Paid sick leave 81% 19%
Retirement plan 78% 22%
Paid vacation 93% 7%
Child care 5% 95%
Disability insurance 73% 27%
Percent of Benefits Covered by Employer
100% 99% to 51% 50% < 50%
Medical insurance 22% 49% 20% 8%
Dental insurance 20% 48% 16% 16%
Life insurance 62% 14% 9% 14%
Paid sick leave 91% 4% 3% 2%
Retirement plan 11% 9% 23% 57%
Paid vacation 95% 4% 1% 0%
Child care 22% 44% 33% 0%
Disability insurance 57% 19% 14% 11%
Bookkeeping, Accounting, and Auditing compute, classify, and record numerical data to keep financial records complete; and they perform any combination of routine calculating, posting, and verifying duties to obtain primary financial data for use in maintaining accounting records. They may also check the accuracy of figures, calculations, and postings of business transactions recorded by others.
Bookkeeping, Accounting, and Auditing Clerks 43-3031
1,350
0
1,306 1,3342% growth
Current Number of Employees 12 Month Expected Number of Employees

10
Most Important Skills for Applicants
73% Skills to use various computer software programs (payroll systems, spreadsheet and word processing)
68% Ability to apply accounting principles
27% Ability to use spreadsheet software extensively
23% Skills to compute and record fiscal data
9% Ability to process and prepare business and government forms
Most Deficient Skills of Applicants
28% Ability to process and prepare business and government forms
20% Ability to use spreadsheet software extensively
19% Skills to use various computer software programs (payroll systems, spreadsheet and word processing)
18% Ability to apply accounting principles
15% Skills to compute and record fiscal data
Most Effective Recruitment Methods for Finding Qualified Applicants
Entry Level Mid to Senior Level
Place ads online, like Monster.com or Craigslist 47% 42%
The firm's website or internal job board 27% 27%
Contract with employment agency/recruiter 22% 25%
Word of mouth/referrals/networking 10% 16%
Partner with a college or university 10% 9%
Advertise in newspaper 6% 3%
Firm does own recruiting/walk-ins 5% 1%
Job fairs 3% 3%
LinkedIn or other social media sites 2% 3%
Promote from within n/a 2%
How Often Position is Permanent Full-Time Position
65% Always
27% Usually
8% Seldom to never
Average Hours per Week Position Requires - 4 to 75 hours
Employer Expectations for Retirements Over the Next 2 to 3 Years
4% Substantial (Over 10%)
15% Somewhat (Between 10% and 3%)
81% Little to none (Less than 3%)
Employers That Would Consider Hiring an Ex-Offender for this Position (someone that has been incarcerated for at least six months)
5% Yes
46% It depends on the crime
49% No
Annual Job Growth Projections for San Diego County 2010 – 2015
279 Average annual new jobs
179 Average annual replacement jobs
458 Average total annual openings(Source: EMSI)
New Job Growth Rate 2010 – 20159 percent growth rate for bookkeeping, accounting, and auditing clerks in San Diego County over the next five years. This is compared to 8 percent growth for all occupations in the county over the next five years. (Source: EMSI)
Bookkeeping, Accounting, and Auditing Clerks
11
Typical Education Requirements for This Occupation
4% Completion of high school or equivalent
4% Certificate or associate’s degree from a community college
62% Bachelor’s degree
22% Bachelor’s degree and a Certified Public Accountant
4% Master’s or other graduate degree
2% Master’s or other graduate degree and a Certified Public Accountant
Typical Level of Work Experience for This Occupation
4% No formal work experience required
19% Six months to 2 years in a related position
26% More than 2 years in a related position
4% Six months to 2 years in that specific position
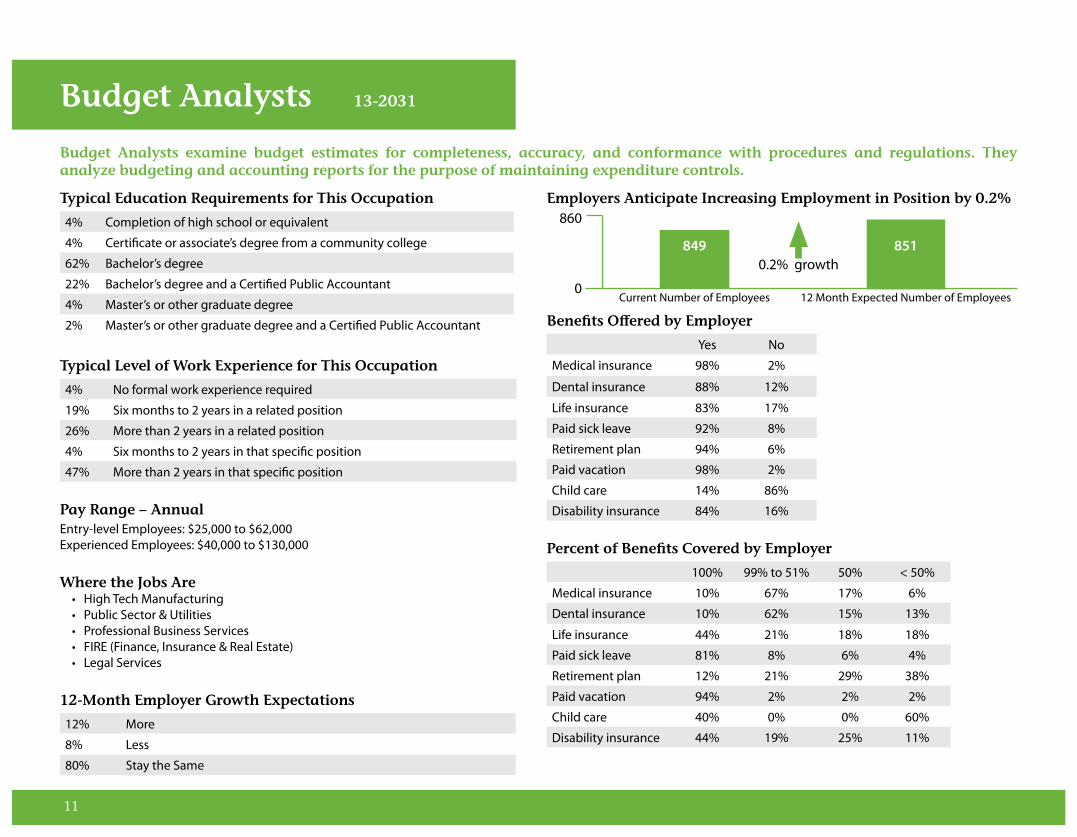
47% More than 2 years in that specific position Pay Range – AnnualEntry-level Employees: $25,000 to $62,000Experienced Employees: $40,000 to $130,000
Where the Jobs Are• High Tech Manufacturing • Public Sector & Utilities• Professional Business Services• FIRE (Finance, Insurance & Real Estate) • Legal Services
12-Month Employer Growth Expectations
12% More
8% Less
80% Stay the Same
Employers Anticipate Increasing Employment in Position by 0.2%
Benefits Offered by Employer
Yes No
Medical insurance 98% 2%
Dental insurance 88% 12%
Life insurance 83% 17%
Paid sick leave 92% 8%
Retirement plan 94% 6%
Paid vacation 98% 2%
Child care 14% 86%
Disability insurance 84% 16%
Percent of Benefits Covered by Employer
100% 99% to 51% 50% < 50%
Medical insurance 10% 67% 17% 6%
Dental insurance 10% 62% 15% 13%
Life insurance 44% 21% 18% 18%
Paid sick leave 81% 8% 6% 4%
Retirement plan 12% 21% 29% 38%
Paid vacation 94% 2% 2% 2%
Child care 40% 0% 0% 60%
Disability insurance 44% 19% 25% 11%
Budget Analysts examine budget estimates for completeness, accuracy, and conformance with procedures and regulations. They analyze budgeting and accounting reports for the purpose of maintaining expenditure controls.
Budget Analysts 13-2031
860
0
849 8510.2% growth
Current Number of Employees 12 Month Expected Number of Employees
12
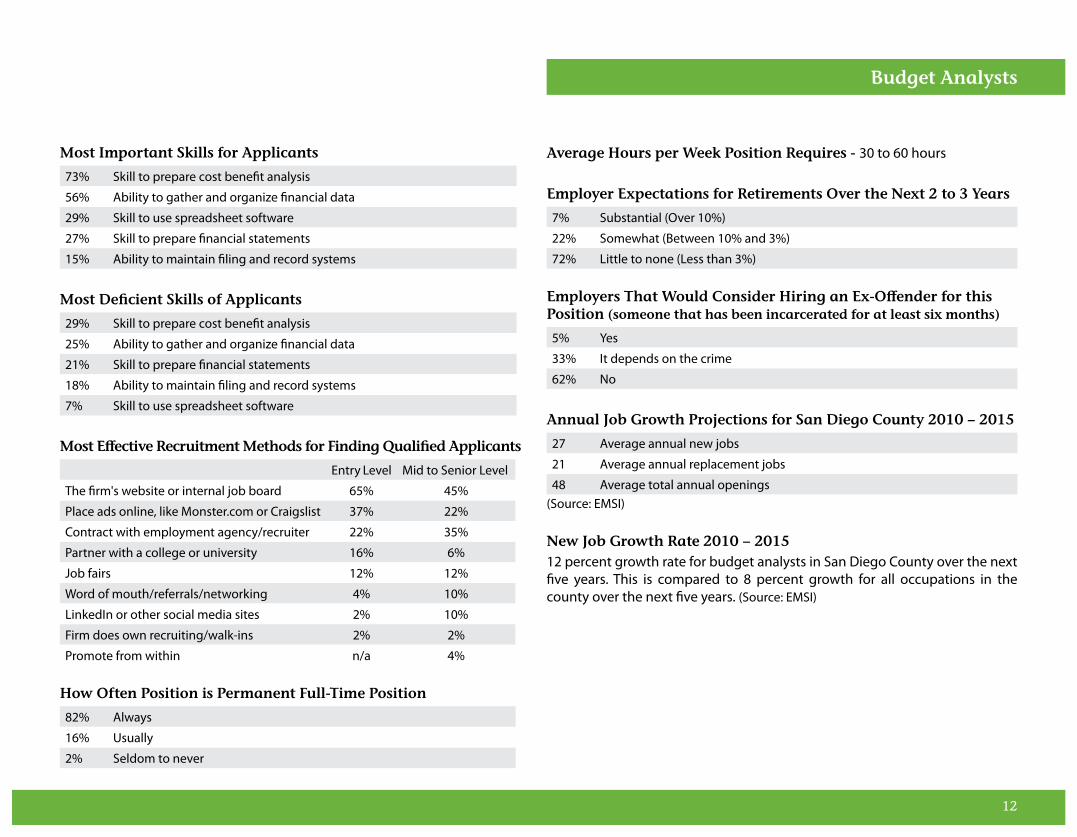
Most Important Skills for Applicants
73% Skill to prepare cost benefit analysis
56% Ability to gather and organize financial data
29% Skill to use spreadsheet software
27% Skill to prepare financial statements
15% Ability to maintain filing and record systems
Most Deficient Skills of Applicants
29% Skill to prepare cost benefit analysis
25% Ability to gather and organize financial data
21% Skill to prepare financial statements
18% Ability to maintain filing and record systems
7% Skill to use spreadsheet software
Most Effective Recruitment Methods for Finding Qualified Applicants
Entry Level Mid to Senior Level
The firm's website or internal job board 65% 45%
Place ads online, like Monster.com or Craigslist 37% 22%
Contract with employment agency/recruiter 22% 35%
Partner with a college or university 16% 6%
Job fairs 12% 12%
Word of mouth/referrals/networking 4% 10%
LinkedIn or other social media sites 2% 10%
Firm does own recruiting/walk-ins 2% 2%
Promote from within n/a 4%
How Often Position is Permanent Full-Time Position
82% Always
16% Usually
2% Seldom to never
Average Hours per Week Position Requires - 30 to 60 hours
Employer Expectations for Retirements Over the Next 2 to 3 Years
7% Substantial (Over 10%)
22% Somewhat (Between 10% and 3%)
72% Little to none (Less than 3%)
Employers That Would Consider Hiring an Ex-Offender for this Position (someone that has been incarcerated for at least six months)
5% Yes
33% It depends on the crime
62% No
Annual Job Growth Projections for San Diego County 2010 – 2015
27 Average annual new jobs
21 Average annual replacement jobs
48 Average total annual openings(Source: EMSI)
New Job Growth Rate 2010 – 201512 percent growth rate for budget analysts in San Diego County over the next five years. This is compared to 8 percent growth for all occupations in the county over the next five years. (Source: EMSI)
Budget Analysts

13
Typical Education Requirements for This Occupation
82% Completion of high school or equivalent
18% Certificate or associate’s degree from a community college
Typical Level of Work Experience for This Occupation
0% No formal work experience required
17% Six months to 2 years in a related position
42% More than 2 years in a related position
8% Six months to 2 years in that specific position
33% More than 2 years in that specific position Pay Range – HourlyEntry-level Employees: $10.00 to $20.00 Experienced Employees: $10.00 to $50.00
Where the Jobs Are• Construction
12-Month Employer Growth Expectations
15% More
23% Less
62% Stay the Same
Employers Anticipate Decreasing Employment in Position by 8%
Benefits Offered by Employer
Yes No
Medical insurance 67% 33%
Dental insurance 30% 70%
Life insurance 27% 73%
Paid sick leave 77% 23%
Retirement plan 50% 50%
Paid vacation 83% 17%
Child care 0% 100%
Disability insurance 54% 46%
Percent of Benefits Covered by Employer
100% 99% to 51% 50% < 50%
Medical insurance 11% 67% 11% 11%
Dental insurance 17% 67% 17% 0%
Life insurance 60% 40% 0% 0%
Paid sick leave 86% 14% 0% 0%
Retirement plan 38% 13% 0% 50%
Paid vacation 88% 13% 0% 0%
Child care 0% 0% 0% 0%
Disability insurance 33% 33% 17% 17%
Carpenters construct, erect, install, or repair structures and fixtures made of wood, such as concrete forms, building frameworks, including partitions, joists, studding, and rafters; wood stairways, window and door frames, and hardwood floors. They may also install cabinets, siding, drywall and batt or roll insulation.
Carpenters 47-2031
150
0
129 119-8% growth
Current Number of Employees 12 Month Expected Number of Employees

14
Most Important Skills for Applicants
69% Skills to operate hand and power tools
62% Skills to build and/ or repair wooden structures
38% Ability to read blueprints and technical drawings
15% Ability to perform math related to construction projects.
15% Ability to perform tasks that require heavy lifting and/ or squatting or standing in awkward positions
Most Deficient Skills of Applicants
45% Ability to perform math related to construction projects.
36% Ability to read blueprints and technical drawings
9% Skills to operate hand and power tools
9% Ability to perform tasks that require heavy lifting and/ or squatting or standing in awkward positions
Most Effective Recruitment Methods for Finding Qualified Applicants
Entry Level Mid to Senior Level
Place ads online, like Monster.com or Craigslist 46% 33%
Advertise in newspaper 31% 17%
Word of mouth/referrals/networking 23% 8%
Contract with employment agency/recruiter 15% 25%
Partner with a college or university 15% 8%
The firm's website or internal job board 15% 17%
LinkedIn or other social media sites n/a 8%
Firm does own recruiting/walk-ins n/a 8%
How Often Position is Permanent Full-Time Position
36% Always
50% Usually
14% Seldom to never
Average Hours per Week Position Requires - 40 hours
Employer Expectations for Retirements Over the Next 2 to 3 Years
0% Substantial (Over 10%)
23% Somewhat (Between 10% and 3%)
77% Little to none (Less than 3%)
Employers That Would Consider Hiring an Ex-Offender for this Position (someone that has been incarcerated for at least six months)
8% Yes
83% It depends on the crime
8% No
Annual Job Growth Projections for San Diego County 2010 – 2015
220 Average annual new jobs
082 Average annual replacement jobs
302 Average total annual openings(Source: EMSI)
New Job Growth Rate 2010 – 201517 percent growth rate for carpenters in San Diego County over the next five years. This is compared to 8 percent growth for all occupations in the county over the next five years. (Source: EMSI)
Carpenters

15
Typical Education Requirements for This Occupation
8% Certificate or associate’s degree from a community college
80% Bachelor’s degree
12% Master’s or other graduate degree
Typical Level of Work Experience for This Occupation
15% No formal work experience required
15% Six months to 2 years in a related position
23% More than 2 years in a related position
4% Six months to 2 years in that specific position
42% More than 2 years in that specific position Pay Range – AnnualEntry-level Employees: $32,000 to $78,000Experienced Employees: $32,000 to $105,000
Where the Jobs Are• Public Sector & Utilities • Professional Business Services
12-Month Employer Growth Expectations
19% More
0% Less
81% Stay the Same
Employers Anticipate Increasing Employment in Position by 1%
Benefits Offered by Employer
Yes No
Medical insurance 97% 3%
Dental insurance 87% 13%
Life insurance 83% 17%
Paid sick leave 87% 13%
Retirement plan 87% 13%
Paid vacation 97% 3%
Child care 7% 93%
Disability insurance 89% 11%
Percent of Benefits Covered by Employer
100% 99% to 51% 50% < 50%
Medical insurance 8% 84% 8% 0%
Dental insurance 18% 64% 14% 5%
Life insurance 52% 24% 19% 5%
Paid sick leave 88% 8% 4% 0%
Retirement plan 9% 45% 27% 18%
Paid vacation 96% 0% 4% 0%
Child care 0% 0% 0% 100%
Disability insurance 59% 18% 18% 5%
Civil Engineers perform engineering duties in planning, designing, and overseeing construction and maintenance of building structures, and facilities, such as roads, railroads, airports, bridges, harbors, channels, dams, irrigation projects, pipelines, power plants, water and sewage systems, and waste disposal units.
Civil Engineers 17-2051
1,250
0
1,219 1,2311% growth
Current Number of Employees 12 Month Expected Number of Employees
16
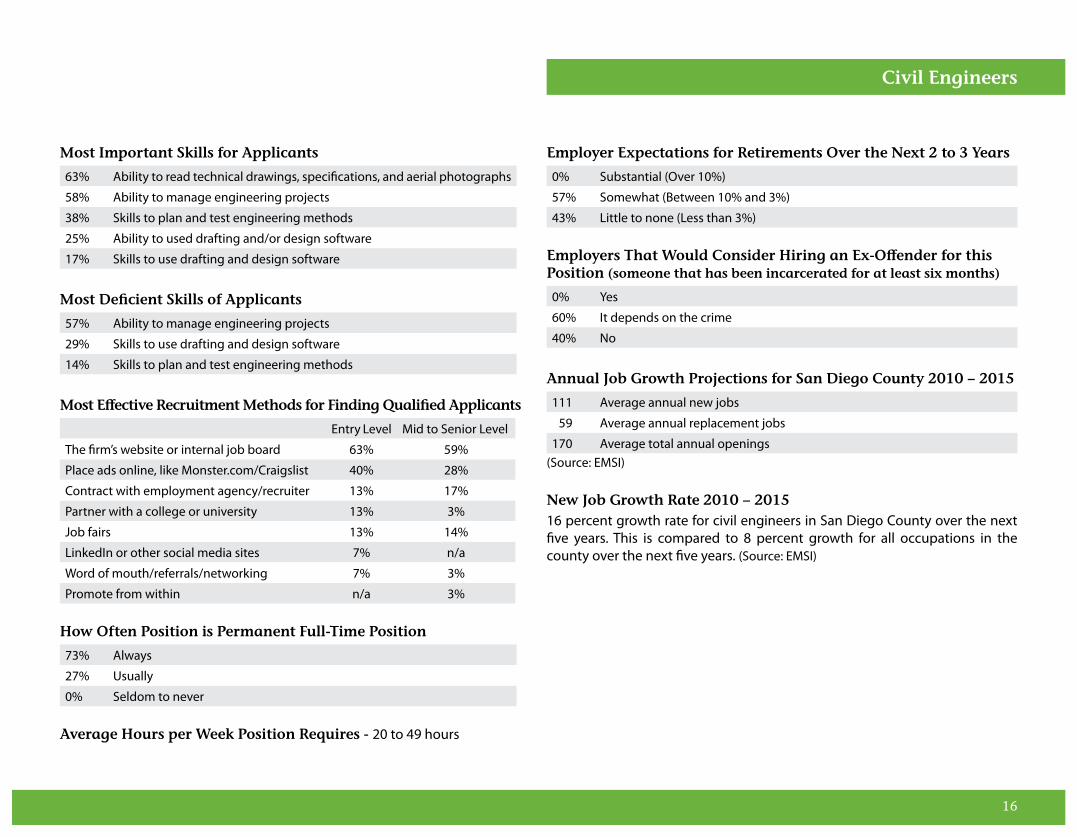
Most Important Skills for Applicants
63% Ability to read technical drawings, specifications, and aerial photographs
58% Ability to manage engineering projects
38% Skills to plan and test engineering methods
25% Ability to used drafting and/or design software
17% Skills to use drafting and design software
Most Deficient Skills of Applicants
57% Ability to manage engineering projects
29% Skills to use drafting and design software
14% Skills to plan and test engineering methods
Most Effective Recruitment Methods for Finding Qualified Applicants
Entry Level Mid to Senior Level
The firm’s website or internal job board 63% 59%
Place ads online, like Monster.com/Craigslist 40% 28%
Contract with employment agency/recruiter 13% 17%
Partner with a college or university 13% 3%
Job fairs 13% 14%
LinkedIn or other social media sites 7% n/a
Word of mouth/referrals/networking 7% 3%
Promote from within n/a 3%
How Often Position is Permanent Full-Time Position
73% Always
27% Usually
0% Seldom to never
Average Hours per Week Position Requires - 20 to 49 hours
Employer Expectations for Retirements Over the Next 2 to 3 Years
0% Substantial (Over 10%)
57% Somewhat (Between 10% and 3%)
43% Little to none (Less than 3%)
Employers That Would Consider Hiring an Ex-Offender for this Position (someone that has been incarcerated for at least six months)
0% Yes
60% It depends on the crime
40% No
Annual Job Growth Projections for San Diego County 2010 – 2015
111 Average annual new jobs
059 Average annual replacement jobs
170 Average total annual openings(Source: EMSI)
New Job Growth Rate 2010 – 201516 percent growth rate for civil engineers in San Diego County over the next five years. This is compared to 8 percent growth for all occupations in the county over the next five years. (Source: EMSI)
Civil Engineers

17
Typical Education Requirements for This Occupation
14% Completion of high school or equivalent
71% Bachelor’s degree
14% Bachelor’s degree and a Certified Public Accountant
Typical Level of Work Experience for This Occupation
29% No formal work experience required
29% Six months to 2 years in a related position
14% More than 2 years in a related position
0% Six months to 2 years in that specific position
29% More than 2 years in that specific position Pay Range – AnnualEntry-level Employees: $45,000 to $90,000Experienced Employees: $45,000 to $120,000
Where the Jobs Are• FIRE (Finance, Insurance & Real Estate)
12-Month Employer Growth Expectations
13% More
13% Less
75% Stay the Same
Employers Anticipate Decreasing Employment in Position by 2%
Benefits Offered by Employer
Yes No
Medical insurance 100% 0%
Dental insurance 100% 0%
Life insurance 89% 11%
Paid sick leave 100% 0%
Retirement plan 89% 11%
Paid vacation 100% 0%
Child care 13% 88%
Disability insurance 89% 11%
Percent of Benefits Covered by Employer
100% 99% to 51% 50% < 50%
Medical insurance 0% 88% 13% 0%
Dental insurance 0% 71% 29% 0%
Life insurance 25% 25% 25% 25%
Paid sick leave 100% 0% 0% 0%
Retirement plan 14% 0% 29% 57%
Paid vacation 100% 0% 0% 0%
Child care 0% 100% 0% 0%
Disability insurance 40% 20% 20% 20%
Claims Adjusters, Examiners, and Investigators review settled claims to determine that payments and settlements have been made in accordance with company practices and procedures, ensuring that proper methods have been followed. They report overpayments, underpayments, and other irregularities. Confer with legal counsel on claims requiring litigation.
175
0
170 167-2% growth
Current Number of Employees 12 Month Expected Number of Employees
Claims Adjusters, Examiners, and Investigators 13-1031

18
Most Important Skills for Applicants
57% Ability to compile, code, categorize, calculate, tabulate, audit, and verify information or data
57% Ability to consider the relative costs and benefits of potential actions to choose the most appropriate one
42% Ability to communicate effectively in writing
28% Ability to communicate effectively in person
14% Developed computer literacy
Most Deficient Skills of Applicants
50% Ability to consider the relative costs and benefits of potential actions to choose the most appropriate one
25% Developed computer literacy
25% Ability to communicate effectively in person
Most Effective Recruitment Methods for Finding Qualified Applicants
Entry Level Mid to Senior Level
Place ads online, like Monster.com/Craigslist 63% 43%
Contract with employment agency/recruiter 38% 43%
The firm's website or internal job board 38% 29%
Word of mouth/referrals/networking 25% 29%
Job fairs 13% n/a
Promote from within n/a 14%
How Often Position is Permanent Full-Time Position
100% Always
0% Usually
0% Seldom to never
Average Hours per Week Position Requires - 40 to 50 hours
Employer Expectations for Retirements Over the Next 2 to 3 Years
0% Substantial (Over 10%)
43% Somewhat (Between 10% and 3%)
57% Little to none (Less than 3%)
Employers That Would Consider Hiring an Ex-Offender for this Position (someone that has been incarcerated for at least six months)
0% Yes
33% It depends on the crime
67% No
Annual Job Growth Projections for San Diego County 2010 – 2015
053 Average annual new jobs
070 Average annual replacement jobs
123 Average total annual openings(Source: EMSI)
New Job Growth Rate 2010 – 201510 percent growth rate for claims adjusters, examiners, and investigators in San Diego County over the next five years. This is compared to 8 percent growth for all occupations in the county over the next five years. (Source: EMSI)
Claims Adjusters, Examiners, and Investigators

19
Typical Education Requirements for This Occupation
10% Certificate or associate’s degree from a community college
80% Bachelor’s degree
10% Master’s or other graduate degree
Typical Level of Work Experience for This Occupation
10% No formal work experience required
0% Six months to 2 years in a related position
20% More than 2 years in a related position
20% Six months to 2 years in that specific position
50% More than 2 years in that specific position Pay Range – AnnualEntry-level Employees: $45,000 to $60,000Experienced Employees: $45,000 to $80,000
Where the Jobs Are• Life Sciences & Bio • FIRE (Finance, Insurance & Real Estate)
12-Month Employer Growth Expectations
10% More
0% Less
90% Stay the Same
Employers Anticipate Increasing Employment in Position by 1%
Benefits Offered by Employer
Yes No
Medical insurance 100% 0%
Dental insurance 92% 8%
Life insurance 83% 17%
Paid sick leave 92% 8%
Retirement plan 75% 25%
Paid vacation 92% 8%
Child care 18% 82%
Disability insurance 92% 8%
Percent of Benefits Covered by Employer
100% 99% to 51% 50% < 50%
Medical insurance 8% 83% 8% 0%
Dental insurance 20% 70% 0% 10%
Life insurance 56% 22% 0% 22%
Paid sick leave 73% 9% 9% 9%
Retirement plan 0% 25% 25% 50%
Paid vacation 90% 0% 0% 10%
Child care 0% 100% 0% 0%
Disability insurance 56% 22% 0% 22%
Computer Programmers convert project specifications and statements of problems and procedures to detailed logical flow charts for coding into computer language. They develop and write computer programs to store, locate, and retrieve specific documents, data, and information.
Computer Programmers 15-1021
75
0
73 741% growth
Current Number of Employees 12 Month Expected Number of Employees

20
Most Important Skills for Applicants
50% Skills to design computer programs and programming tools
50% Ability to learn and apply new computer languages
38% Skills to apply data storage technology
38% Ability to test and troubleshoot computer programs and systems
25% Skills to apply differential equations to computer programming
Most Deficient Skills of Applicants
38% Ability to test and troubleshoot computer programs and systems
25% Skills to apply data storage technology
25% Ability to learn and apply new computer languages
13% Skills to design computer programs and programming tools
Most Effective Recruitment Methods for Finding Qualified Applicants
Entry Level Mid to Senior Level
Contract with employment agency/recruiter 45% 64%
Place ads online, like Monster.com or Craigslist 36% 18%
The firm's website or internal job board 27% 27%
Partner with a college or university 18% n/a
Word of mouth/referrals/networking 18% 9%
LinkedIn or other social media sites 9% n/a
Promote from within n/a 9%
How Often Position is Permanent Full-Time Position
58% Always
42% Usually
0% Seldom to never
Average Hours per Week Position Requires - 30 to 50 hours
Employer Expectations for Retirements Over the Next 2 to 3 Years
0% Substantial (Over 10%)
100% Somewhat (Between 10% and 3%)
0% Little to none (Less than 3%)
Employers That Would Consider Hiring an Ex-Offender for this Position (someone that has been incarcerated for at least six months)
11% Yes
33% It depends on the crime
56% No
Annual Job Growth Projections for San Diego County 2010 – 2015
044 Average annual new jobs
056 Average annual replacement jobs
100 Average total annual openings(Source: EMSI)
New Job Growth Rate 2010 – 20157 percent growth rate for computer programmers in San Diego County over the next five years. This is compared to 8 percent growth for all occupations in the county over the next five years. (Source: EMSI)
Computer Programmers

21
Typical Education Requirements for This Occupation
72% Bachelor’s degree
6% Bachelor’s degree and a Certified Public Accountant
22% Master’s or other graduate degree
Typical Level of Work Experience for This Occupation
0% No formal work experience required
22% Six months to 2 years in a related position
28% More than 2 years in a related position
11% Six months to 2 years in that specific position
39% More than 2 years in that specific position Pay Range – Annually Entry-level Employees: $50,000 to $80,000Experienced Employees: $60,000 to $130,000
Where the Jobs Are• Professional Business Services • High Tech Manufacturing• Life Sciences & Bio
12-Month Employer Growth Expectations
32% More
0% Less
68% Stay the Same
Employers Anticipate Increasing Employment in Position by 3%
Benefits Offered by Employer
Yes No
Medical insurance 95% 5%
Dental insurance 90% 10%
Life insurance 80% 20%
Paid sick leave 95% 5%
Retirement plan 85% 15%
Paid vacation 100% 0%
Child care 18% 82%
Disability insurance 65% 35%
Percent of Benefits Covered by Employer
100% 99% to 51% 50% < 50%
Medical insurance 20% 67% 13% 0%
Dental insurance 14% 57% 21% 7%
Life insurance 54% 15% 8% 23%
Paid sick leave 89% 6% 0% 6%
Retirement plan 14% 7% 29% 50%
Paid vacation 100% 0% 0% 0%
Child care 0% 50% 0% 50%
Disability insurance 50% 30% 0% 20%
Computer Software Engineers, Applications develop, create, and modify general computer applications software or specialized utility programs. They analyze user needs and develop software solutions. They design software or customize software for client use with the aim of optimizing operational efficiency. They may analyze and design databases within an application area, working individually or coordinating database development as part of a team.
Computer Software Engineers, Applications 15-1031
450
0
419 4303% growth
Current Number of Employees 12 Month Expected Number of Employees

22
Most Important Skills for Applicants
63% Ability to develop, design, or create new applications
56% Ability to write computer programs for various purposes
31% Skills to design, develop and modify software systems
25% Ability to analyze user needs with software requirements
25% Ability to coordinate software installation while monitoring equipment functionality
Most Deficient Skills of Applicants
44% Ability to coordinate software installation while monitoring equipment functionality
25% Ability to analyze user needs with software requirements
19% Ability to develop, design, or create new applications
6% Ability to write computer programs for various purposes
6% Skills to design, develop and modify software systems
Most Effective Recruitment Methods for Finding Qualified Applicants
Entry Level Mid to Senior Level
Place ads online, like Monster.com or Craigslist 42% 32%
The firm's website or internal job board 32% 37%
Contract with employment agency/recruiter 21% 37%
Word of mouth/referrals/networking 16% 16%
Partner with a college or university 11% 5%
Job fairs 11% 5%
Advertise in newspaper 5% 1%
LinkedIn or other social media sites n/a 5%
Promote from within n/a 5%
How Often Position is Permanent Full-Time Position
65% Always
30% Usually
5% Seldom to never
Average Hours per Week Position Requires - 10 to 60 hours
Employer Expectations for Retirements Over the Next 2 to 3 Years
0% Substantial (Over 10%)
6% Somewhat (Between 10% and 3%)
94% Little to none (Less than 3%)
Employers That Would Consider Hiring an Ex-Offender for this Position (someone that has been incarcerated for at least six months)
0% Yes
83% It depends on the crime
17% No
Annual Job Growth Projections for San Diego County 2010 – 2015
312 Average annual new jobs
058 Average annual replacement jobs
370 Average total annual openings(Source: EMSI)
New Job Growth Rate 2010 – 201523 percent growth rate for computer software engineers, applications in San Diego County over the next five years. This is compared to 8 percent growth for all occupations in the county over the next five years. (Source: EMSI)
Computer Software Engineers, Applications
23
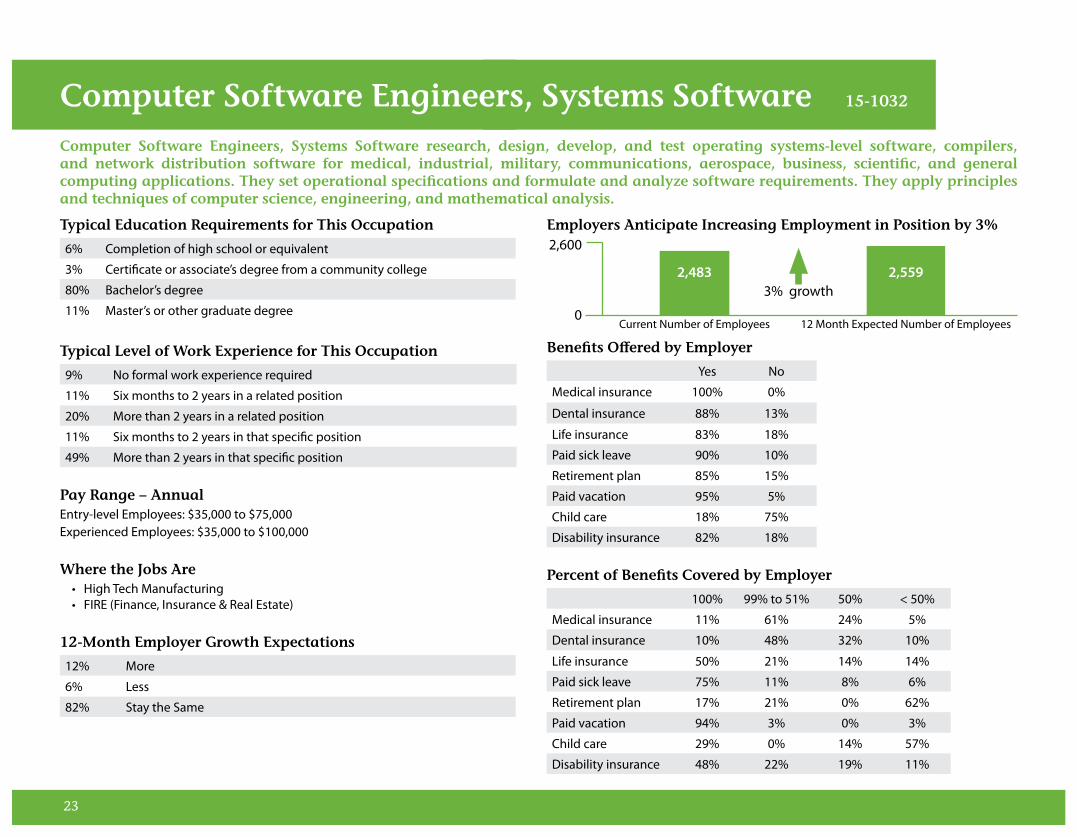
Typical Education Requirements for This Occupation
6% Completion of high school or equivalent
3% Certificate or associate’s degree from a community college
80% Bachelor’s degree
11% Master’s or other graduate degree
Typical Level of Work Experience for This Occupation
9% No formal work experience required
11% Six months to 2 years in a related position
20% More than 2 years in a related position
11% Six months to 2 years in that specific position
49% More than 2 years in that specific position Pay Range – AnnualEntry-level Employees: $35,000 to $75,000Experienced Employees: $35,000 to $100,000
Where the Jobs Are• High Tech Manufacturing • FIRE (Finance, Insurance & Real Estate)
12-Month Employer Growth Expectations
12% More
6% Less
82% Stay the Same
Employers Anticipate Increasing Employment in Position by 3%
Benefits Offered by Employer
Yes No
Medical insurance 100% 0%
Dental insurance 88% 13%
Life insurance 83% 18%
Paid sick leave 90% 10%
Retirement plan 85% 15%
Paid vacation 95% 5%
Child care 18% 75%
Disability insurance 82% 18%
Percent of Benefits Covered by Employer
100% 99% to 51% 50% < 50%
Medical insurance 11% 61% 24% 5%
Dental insurance 10% 48% 32% 10%
Life insurance 50% 21% 14% 14%
Paid sick leave 75% 11% 8% 6%
Retirement plan 17% 21% 0% 62%
Paid vacation 94% 3% 0% 3%
Child care 29% 0% 14% 57%
Disability insurance 48% 22% 19% 11%
Computer Software Engineers, Systems Software research, design, develop, and test operating systems-level software, compilers, and network distribution software for medical, industrial, military, communications, aerospace, business, scientific, and general computing applications. They set operational specifications and formulate and analyze software requirements. They apply principles and techniques of computer science, engineering, and mathematical analysis.
Computer Software Engineers, Systems Software 15-1032
2,600
0
2,483 2,5593% growth
Current Number of Employees 12 Month Expected Number of Employees

24
Most Important Skills for Applicants
63% Ability to program new software according to specific guidelines
43% Skills to store, retrieve, and manipulate data for analysis of system capa-bilities and requirements
43% Ability to learn and apply new computer languages
27% Ability to coordinate installation of software system.
23% Knowledge of circuit boards, processors, chips, electronic equipment, computer hardware and software
Most Deficient Skills of Applicants
29% Ability to program new software according to specific guidelines
29% Ability to coordinate installation of software system.
17% Skills to store, retrieve, and manipulate data for analysis of system capa-bilities and requirements
17% Ability to learn and apply new computer languages
8% Knowledge of circuit boards, processors, chips, electronic equipment, computer hardware and software
Most Effective Recruitment Methods for Finding Qualified Applicants
Entry Level Mid to Senior Level
Place ads online, like Monster.com/Craigslist 56% 29%
The firm's website or internal job board 53% 38%
Contract with employment agency/recruiter 38% 53%
Partner with a college or university 13% 9%
Job fairs 6% 9%
LinkedIn or other social media sites 3% 12%
Word of mouth/referrals/networking 3% 6%
How Often Position is Permanent Full-Time Position
59% Always
35% Usually
6% Seldom to never
Average Hours per Week Position Requires - 40 to 66 hours
Employer Expectations for Retirements Over the Next 2 to 3 Years
10% Substantial (Over 10%)
29% Somewhat (Between 10% and 3%)
61% Little to none (Less than 3%)
Employers That Would Consider Hiring an Ex-Offender for this Position (someone that has been incarcerated for at least six months)
8% Yes
56% It depends on the crime
36% No
Annual Job Growth Projections for San Diego County 2010 – 2015
165 Average annual new jobs
038 Average annual replacement jobs
203 Average total annual openings(Source: EMSI)
New Job Growth Rate 2010 – 201519 percent growth rate for computer software engineers, systems software in San Diego County over the next five years. This is compared to 8 percent growth for all occupations in the county over the next five years. (Source: EMSI)
Computer Software Engineers, Systems Software

25
Typical Education Requirements for This Occupation
12% Completion of high school or equivalent
28% Certificate or associate’s degree from a community college
50% Bachelor’s degree
8% Bachelor’s degree and a Certified Public Accountant
1% Master’s or other graduate degree and a Certified Public Accountant
Typical Level of Work Experience for This Occupation
6% No formal work experience required
32% Six months to 2 years in a related position
30% More than 2 years in a related position
10% Six months to 2 years in that specific position
23% More than 2 years in that specific position Pay Range – Hourly/Annually Entry-level Employees: $8.00 to $30.00 /$25,000 to $70,000Experienced Employees: $8.00 to $65.00/$25,000 to $75,000
Where the Jobs Are• Professional Business Services • Retail & Personal Services • High Tech Manufacturing • Legal Services • Life Sciences & Bio
12-Month Employer Growth Expectations
13% More
2% Less
84% Stay the Same
Employers Anticipate Increasing Employment in Position by 1%
Benefits Offered by Employer
Yes No
Medical insurance 98% 2%
Dental insurance 87% 13%
Life insurance 77% 23%
Paid sick leave 86% 14%
Retirement plan 82% 18%
Paid vacation 94% 6%
Child care 10% 90%
Disability insurance 81% 19%
Percent of Benefits Covered by Employer
100% 99% to 51% 50% < 50%
Medical insurance 16% 52% 24% 8%
Dental insurance 18% 53% 16% 13%
Life insurance 54% 15% 15% 15%
Paid sick leave 88% 6% 4% 2%
Retirement plan 9% 11% 26% 54%
Paid vacation 96% 3% 1% 0%
Child care 27% 9% 27% 36%
Disability insurance 54% 16% 19% 10%
Computer Support Specialists provide technical assistance to computer system users. They answer questions or resolve computer problems for clients in person, via telephone or from remote location. They may provide assistance concerning the use of computer hardware and software, including printing, installation, word processing, electronic mail, and operating systems.
Computer Support Specialists 15-1041
2,450
0
2,377 2,4011% growth
Current Number of Employees 12 Month Expected Number of Employees

26
Most Important Skills for Applicants
72% Skill to perform technical assistance and helpdesk functions
68% Skill to test and troubleshoot computer programs and systems
42% Ability to communicate effectively over the phone
12% Ability to apply data security procedures
6% Ability to understand application flow charts
Most Deficient Skills of Applicants
26% Skill to test and troubleshoot computer programs and systems
22% Ability to communicate effectively over the phone
22% Ability to understand application flow charts
22% Ability to apply data security procedures
7% Skill to perform technical assistance and helpdesk functions
Most Effective Recruitment Methods for Finding Qualified Applicants
Entry Level Mid to Senior Level
Place ads online, like Monster.com or Craigslist 47% 35%
The firm's website or internal job board 40% 35%
Contract with employment agency/recruiter 30% 38%
Partner with a college or university 12% 9%
Word of mouth/referrals/networking 10% 11%
Job fairs 8% 8%
LinkedIn or other social media sites 3% 8%
Firm does own recruiting/walk-ins 3% 1%
Advertise in newspaper 1% n/a
Promote from within n/a 1%
How Often Position is Permanent Full-Time Position
60% Always
33% Usually
7% Seldom to never
Average Hours per Week Position Requires - 10 to 60 hours
Employer Expectations for Retirements Over the Next 2 to 3 Years
4% Substantial (Over 10%)
10% Somewhat (Between 10% and 3%)
86% Little to none (Less than 3%)
Employers That Would Consider Hiring an Ex-Offender for this Position (someone that has been incarcerated for at least six months)
6% Yes
59% It depends on the crime
35% No
Annual Job Growth Projections for San Diego County 2010 – 2015
166 Average annual new jobs
183 Average annual replacement jobs
349 Average total annual openings(Source: EMSI)
New Job Growth Rate 2010 – 201513 percent growth rate for computer support specialists in San Diego County over the next five years. This is compared to 8 percent growth for all occupa-tions in the county over the next five years. (Source: EMSI)
Computer Support Specialists
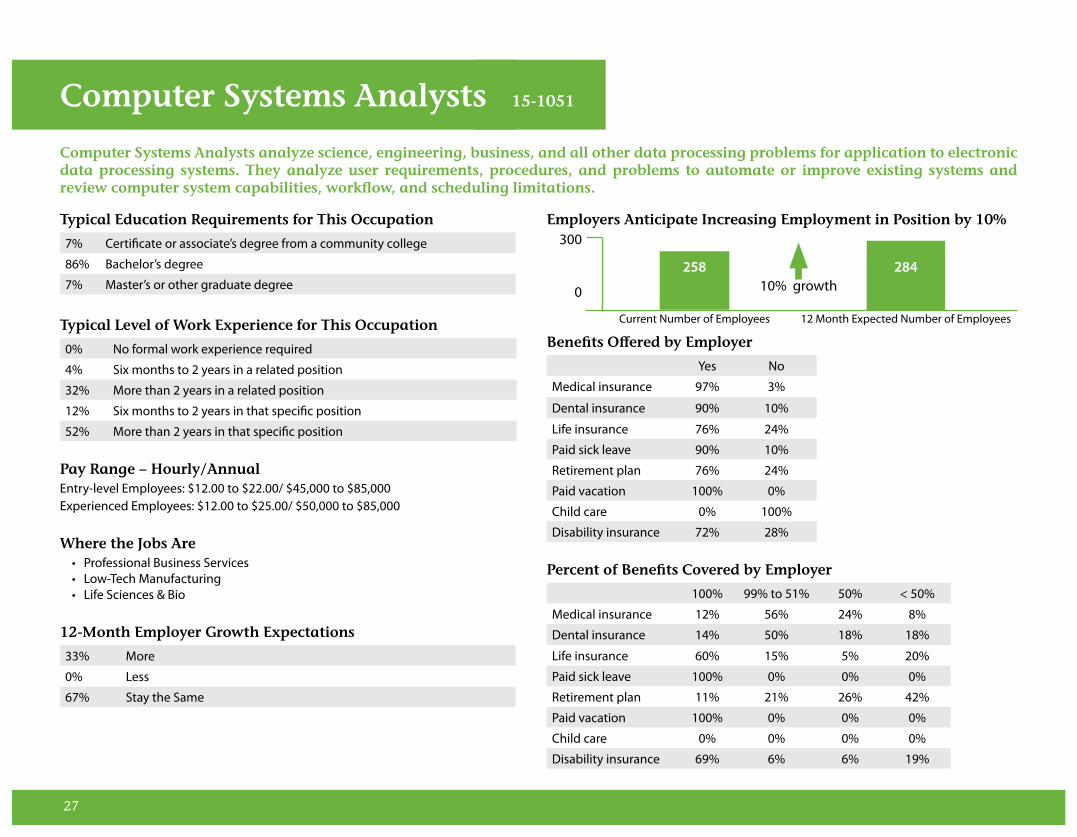
27
Typical Education Requirements for This Occupation
7% Certificate or associate’s degree from a community college
86% Bachelor’s degree
7% Master’s or other graduate degree
Typical Level of Work Experience for This Occupation
0% No formal work experience required
4% Six months to 2 years in a related position
32% More than 2 years in a related position
12% Six months to 2 years in that specific position
52% More than 2 years in that specific position Pay Range – Hourly/AnnualEntry-level Employees: $12.00 to $22.00/ $45,000 to $85,000Experienced Employees: $12.00 to $25.00/ $50,000 to $85,000
Where the Jobs Are• Professional Business Services • Low-Tech Manufacturing • Life Sciences & Bio
12-Month Employer Growth Expectations
33% More
0% Less
67% Stay the Same
Employers Anticipate Increasing Employment in Position by 10%
Benefits Offered by Employer
Yes No
Medical insurance 97% 3%
Dental insurance 90% 10%
Life insurance 76% 24%
Paid sick leave 90% 10%
Retirement plan 76% 24%
Paid vacation 100% 0%
Child care 0% 100%
Disability insurance 72% 28%
Percent of Benefits Covered by Employer
100% 99% to 51% 50% < 50%
Medical insurance 12% 56% 24% 8%
Dental insurance 14% 50% 18% 18%
Life insurance 60% 15% 5% 20%
Paid sick leave 100% 0% 0% 0%
Retirement plan 11% 21% 26% 42%
Paid vacation 100% 0% 0% 0%
Child care 0% 0% 0% 0%
Disability insurance 69% 6% 6% 19%
Computer Systems Analysts analyze science, engineering, business, and all other data processing problems for application to electronic data processing systems. They analyze user requirements, procedures, and problems to automate or improve existing systems and review computer system capabilities, workflow, and scheduling limitations.
Computer Systems Analysts 15-1051
300
0
258 28410% growth
Current Number of Employees 12 Month Expected Number of Employees

28
Most Important Skills for Applicants
61% Ability to set up or alter computer software or hardware systems
46% Ability to develop and design procedures for computer and software us-age
43% Ability to provide users with assistance solving computer related problems
39% Ability to consult with management to ensure agreement on system prin-ciples.
11% Knowledge of circuit boards, processors, chips, electronic equipment, and computer hardware and software
Most Deficient Skills of Applicants
41% Ability to develop and design procedures for computer and software us-age
24% Knowledge of circuit boards, processors, chips, electronic equipment, and computer hardware and software
24% Ability to consult with management to ensure agreement on system prin-ciples.
6% Ability to set up or alter computer software or hardware systems
6% Ability to provide users with assistance solving computer related problems
Most Effective Recruitment Methods for Finding Qualified Applicants
Entry Level Mid to Senior Level
Place ads online, like Monster.com or Craigslist 43% 38%
The firm's website or internal job board 29% 12%
Contract with employment agency/recruiter 25% 38%
Job fairs 14% 15%
Partner with a college or university 7% 8%
Word of mouth/referrals/networking 7% 15%
Advertise in newspaper 7% n/a
Firm does own recruiting/walk-ins 4% n/a
LinkedIn or other social media sites n/a 8%
How Often Position is Permanent Full-Time Position
86% Always
10% Usually
3% Seldom to never
Average Hours per Week Position Requires - 32 to 70 hours
Employer Expectations for Retirements Over the Next 2 to 3 Years
4% Substantial (Over 10%)
15% Somewhat (Between 10% and 3%)
81% Little to none (Less than 3%)
Employers That Would Consider Hiring an Ex-Offender for this Position (someone that has been incarcerated for at least six months)
0% Yes
63% It depends on the crime
38% No
Annual Job Growth Projections for San Diego County 2010 – 2015
136 Average annual new jobs
088 Average annual replacement jobs
224 Average total annual openings(Source: EMSI)
New Job Growth Rate 2010 – 201517 percent growth rate for computer systems analysts in San Diego County over the next five years. This is compared to 8 percent growth for all occupa-tions in the county over the next five years. (Source: EMSI)
Computer Systems Analysts
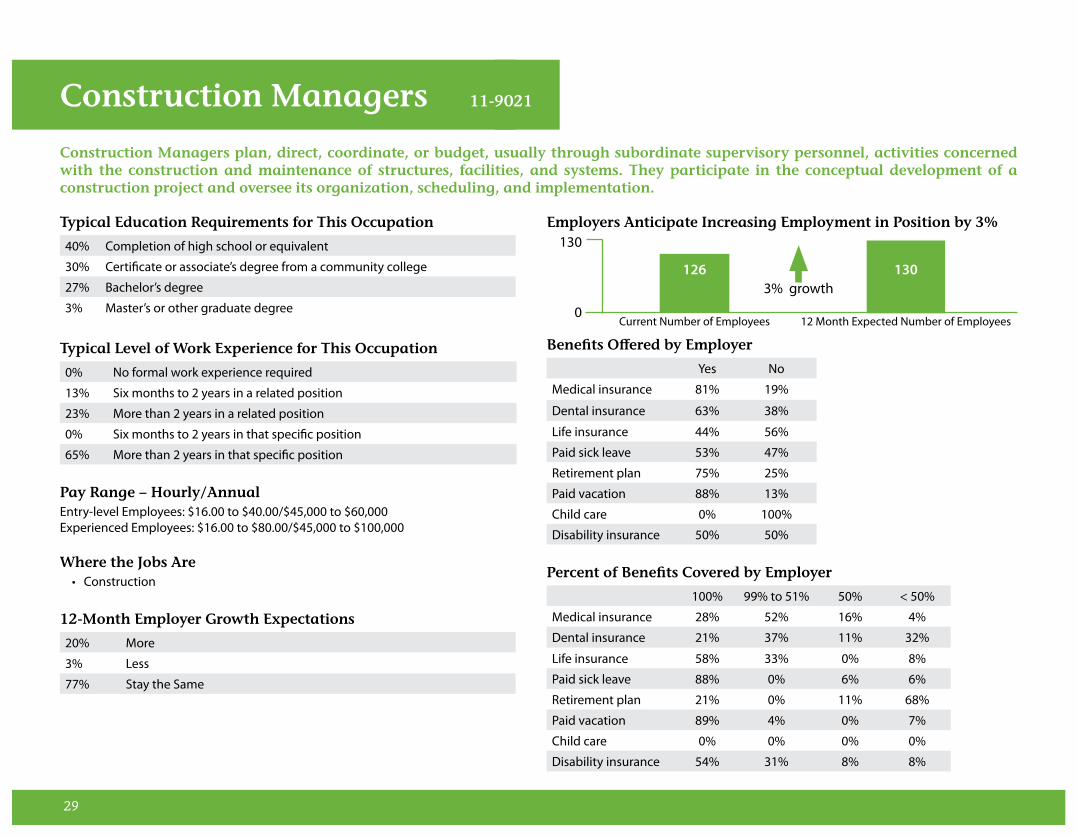
29
Typical Education Requirements for This Occupation
40% Completion of high school or equivalent
30% Certificate or associate’s degree from a community college
27% Bachelor’s degree
3% Master’s or other graduate degree
Typical Level of Work Experience for This Occupation
0% No formal work experience required
13% Six months to 2 years in a related position
23% More than 2 years in a related position
0% Six months to 2 years in that specific position
65% More than 2 years in that specific position Pay Range – Hourly/AnnualEntry-level Employees: $16.00 to $40.00/$45,000 to $60,000Experienced Employees: $16.00 to $80.00/$45,000 to $100,000
Where the Jobs Are• Construction
12-Month Employer Growth Expectations
20% More
3% Less
77% Stay the Same
Employers Anticipate Increasing Employment in Position by 3%
Benefits Offered by Employer
Yes No
Medical insurance 81% 19%
Dental insurance 63% 38%
Life insurance 44% 56%
Paid sick leave 53% 47%
Retirement plan 75% 25%
Paid vacation 88% 13%
Child care 0% 100%
Disability insurance 50% 50%
Percent of Benefits Covered by Employer
100% 99% to 51% 50% < 50%
Medical insurance 28% 52% 16% 4%
Dental insurance 21% 37% 11% 32%
Life insurance 58% 33% 0% 8%
Paid sick leave 88% 0% 6% 6%
Retirement plan 21% 0% 11% 68%
Paid vacation 89% 4% 0% 7%
Child care 0% 0% 0% 0%
Disability insurance 54% 31% 8% 8%
Construction Managers plan, direct, coordinate, or budget, usually through subordinate supervisory personnel, activities concerned with the construction and maintenance of structures, facilities, and systems. They participate in the conceptual development of a construction project and oversee its organization, scheduling, and implementation.
Construction Managers 11-9021
130
0
126 1303% growth
Current Number of Employees 12 Month Expected Number of Employees
30
Most Important Skills for Applicants
75% Ability to schedule and coordinate construction work
64% Ability to manage project budgets and maintain project costs
25% Ability to apply structural and safety principles to buildings & other con-struction
21% Ability to apply for and obtain state and local building codes and regula-tions
14% Ability to interpret maps for architecture, construction, civil engineering, etc.
Most Deficient Skills of Applicants
32% Ability to schedule and coordinate construction work
32% Ability to manage project budgets and maintain project costs
14% Ability to apply structural and safety principles to buildings & other con-struction
14% Ability to apply for and obtain state and local building codes and regula-tions
9% Ability to interpret maps for architecture, construction, civil engineering, etc.
Most Effective Recruitment Methods for Finding Qualified Applicants
Entry Level Mid to Senior Level
Place ads online, like Monster.com/Craigslist 41% 43%
Word of mouth/referrals/networking 31% 11%
Advertise in newspaper 24% 14%
Contract with employment agency/recruiter 14% 32%
The firm's website or internal job board 14% 14%
Partner with a college or university 10% n/a
Job fairs 3% n/a
Firm does own recruiting/walk-ins 3% n/a
LinkedIn or other social media sites n/a 4%
How Often Position is Permanent Full-Time Position
84% Always
13% Usually
3% Seldom to never
Average Hours per Week Position Requires - 35 to 50 hours
Employer Expectations for Retirements Over the Next 2 to 3 Years
0% Substantial (Over 10%)
14% Somewhat (Between 10% and 3%)
86% Little to none (Less than 3%)
Employers That Would Consider Hiring an Ex-Offender for this Position (someone that has been incarcerated for at least six months)
4% Yes
54% It depends on the crime
43% No
Annual Job Growth Projections for San Diego County 2010 – 2015
81 Average annual new jobs
14 Average annual replacement jobs
95 Average total annual openings(Source: EMSI)
New Job Growth Rate 2010 – 201523 percent growth rate for construction managers in San Diego County over the next five years. This is compared to 8 percent growth for all occupations in the county over the next five years. (Source: EMSI)
Construction Managers
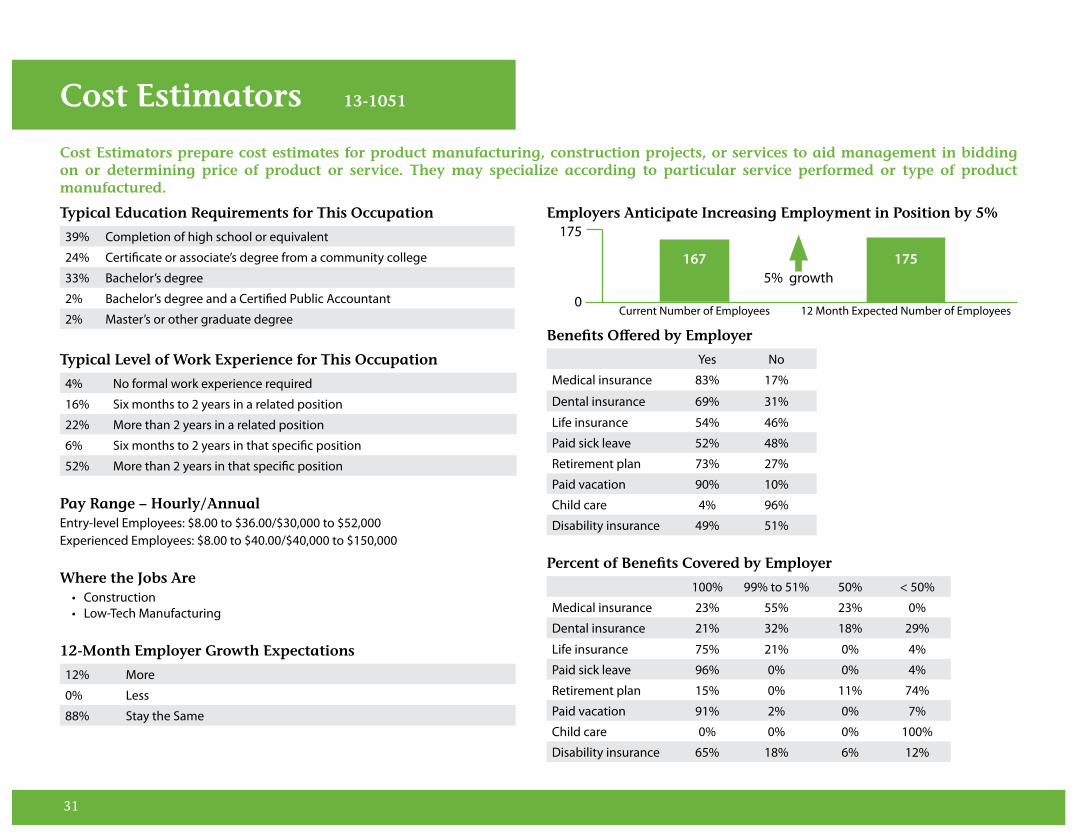
31
Typical Education Requirements for This Occupation
39% Completion of high school or equivalent
24% Certificate or associate’s degree from a community college
33% Bachelor’s degree
2% Bachelor’s degree and a Certified Public Accountant
2% Master’s or other graduate degree
Typical Level of Work Experience for This Occupation
4% No formal work experience required
16% Six months to 2 years in a related position
22% More than 2 years in a related position
6% Six months to 2 years in that specific position
52% More than 2 years in that specific position Pay Range – Hourly/AnnualEntry-level Employees: $8.00 to $36.00/$30,000 to $52,000Experienced Employees: $8.00 to $40.00/$40,000 to $150,000
Where the Jobs Are• Construction • Low-Tech Manufacturing
12-Month Employer Growth Expectations
12% More
0% Less
88% Stay the Same
Employers Anticipate Increasing Employment in Position by 5%
Benefits Offered by Employer
Yes No
Medical insurance 83% 17%
Dental insurance 69% 31%
Life insurance 54% 46%
Paid sick leave 52% 48%
Retirement plan 73% 27%
Paid vacation 90% 10%
Child care 4% 96%
Disability insurance 49% 51%
Percent of Benefits Covered by Employer
100% 99% to 51% 50% < 50%
Medical insurance 23% 55% 23% 0%
Dental insurance 21% 32% 18% 29%
Life insurance 75% 21% 0% 4%
Paid sick leave 96% 0% 0% 4%
Retirement plan 15% 0% 11% 74%
Paid vacation 91% 2% 0% 7%
Child care 0% 0% 0% 100%
Disability insurance 65% 18% 6% 12%
Cost Estimators prepare cost estimates for product manufacturing, construction projects, or services to aid management in bidding on or determining price of product or service. They may specialize according to particular service performed or type of product manufactured.
Cost Estimators 13-1051
175
0
167 1755% growth
Current Number of Employees 12 Month Expected Number of Employees

32
Most Important Skills for Applicants
67% Ability to interpret blueprints, drawings and specifications
56% Ability to estimate materials for production and manufacturing
36% Ability to develop and maintain cost estimation databases
24% Skills to prepare estimates for general expenses and overhead
18% Advanced ability with spreadsheet software
Most Deficient Skills of Applicants
32% Advanced ability with spreadsheet software
27% Ability to estimate materials for production and manufacturing
19% Ability to develop and maintain cost estimation databases
14% Ability to interpret blueprints, drawings and specifications
8% Skills to prepare estimates for general expenses and overhead
Most Effective Recruitment Methods for Finding Qualified Applicants
Entry Level Mid to Senior Level
Place ads online, like Monster.com/Craigslist 42% 47%
Word of mouth/referrals/networking 30% 24%
Advertise in newspaper 14% 13%
The firm's website or internal job board 12% 9%
Contract with employment agency/recruiter 10% 22%
Partner with a college or university 8% 2%
Firm does own recruiting/walk-ins 6% n/a
Job fairs 4% 2%
Promote from within n/a 2%
How Often Position is Permanent Full-Time Position
88% Always
10% Usually
2% Seldom to never
Average Hours per Week Position Requires - 20 to 50 hours
Employer Expectations for Retirements Over the Next 2 to 3 Years
4% Substantial (Over 10%)
11% Somewhat (Between 10% and 3%)
85% Little to none (Less than 3%)
Employers That Would Consider Hiring an Ex-Offender for this Position (someone that has been incarcerated for at least six months)
9% Yes
63% It depends on the crime
28% No
Annual Job Growth Projections for San Diego County 2010 – 2015
074 Average annual new jobs
043 Average annual replacement jobs
117 Average total annual openings(Source: EMSI)
New Job Growth Rate 2010 – 201519 percent growth rate for cost estimators in San Diego County over the next five years. This is compared to 8 percent growth for all occupations in the county over the next five years. (Source: EMSI)
Cost Estimators

33
Typical Education Requirements for This Occupation
55% Completion of high school or equivalent
28% Certificate or associate’s degree from a community college
15% Bachelor’s degree
1% Master’s or other graduate degree
Typical Level of Work Experience for This Occupation
12% No formal work experience required
44% Six months to 2 years in a related position
21% More than 2 years in a related position
7% Six months to 2 years in that specific position
16% More than 2 years in that specific position Pay Range – Hourly/Annually Entry-level Employees: $8.00 to $30.00 /$25,000 to $45,000Experienced Employees: $8.00 to $40.00/ $25,000 to $60,000
Where the Jobs Are• Low-Tech Manufacturing • Auto Repair • High Tech Manufacturing• Life Sciences & Bio
12-Month Employer Growth Expectations
27% More
0% Less
73% Stay the Same
Employers Anticipate Increasing Employment in Position by 3%
Benefits Offered by Employer
Yes No
Medical insurance 85% 15%
Dental insurance 57% 43%
Life insurance 49% 51%
Paid sick leave 75% 25%
Retirement plan 57% 43%
Paid vacation 93% 7%
Child care 3% 97%
Disability insurance 62% 38%
Percent of Benefits Covered by Employer
100% 99% to 51% 50% < 50%
Medical insurance 17% 50% 22% 12%
Dental insurance 13% 44% 21% 23%
Life insurance 67% 15% 6% 12%
Paid sick leave 94% 4% 0% 2%
Retirement plan 8% 11% 29% 53%
Paid vacation 99% 0% 0% 1%
Child care 0% 0% 0% 100%
Disability insurance 58% 18% 3% 21%
Customer Service Representatives interact with customers to provide information in response to inquiries about products and services and to handle and resolve complaints.
Customer Service Representatives 43-4051
1,200
0
1,159 1,1993% growth
Current Number of Employees 12 Month Expected Number of Employees

34
Most Important Skills for Applicants
67% Ability to interview customers, investigate complaints, and explain tech-nical material over the phone
52% Computer literacy skills
45% Ability to explain the type and costs of services offered
30% Ability to explain technical material over the phone
6% Ability to determine special program eligibility
Most Deficient Skills of Applicants
40% Ability to interview customers, investigate complaints, and explain tech-nical material over the phone
30% Ability to explain technical material over the phone
13% Ability to explain the type and costs of services offered
12% Ability to determine special program eligibility
5% Computer literacy skills
Most Effective Recruitment Methods for Finding Qualified Applicants
Entry Level Mid to Senior Level
Place ads online, like Monster.com/Craigslist 51% 44%
Word of mouth/referrals/networking 24% 22%
Contract with employment agency/recruiter 21% 27%
Partner with a college or university 7% 2%
The firm's website or internal job board 7% 8%
Advertise in newspaper 7% 13%
Firm does own recruiting/walk-ins 3% n/a
Job fairs 1% 5%
Promote from within n/a 5%
LinkedIn or other social media sites n/a 3%
How Often Position is Permanent Full-Time Position
69% Always
27% Usually
4% Seldom to never
Average Hours per Week Position Requires - 10 to 60 hours
Employer Expectations for Retirements Over the Next 2 to 3 Years
0% Substantial (Over 10%)
11% Somewhat (Between 10% and 3%)
89% Little to none (Less than 3%)
Employers That Would Consider Hiring an Ex-Offender for this Position (someone that has been incarcerated for at least six months)
12% Yes
61% It depends on the crime
27% No
Annual Job Growth Projections for San Diego County 2010 – 2015
395 Average annual new jobs
558 Average annual replacement jobs
953 Average total annual openings(Source: EMSI)
New Job Growth Rate 2010 – 201511 percent growth rate for customer service representatives in San Diego County over the next five years compared to 8 percent growth for all occupa-tions in the county. (Source: EMSI)
Customer Service Representatives

35
Typical Education Requirements for This Occupation
8% Completion of high school or equivalent
10% Certificate or associate’s degree from a community college
77% Bachelor’s degree
5% Master’s or other graduate degree
Typical Level of Work Experience for This Occupation
6% No formal work experience required
14% Six months to 2 years in a related position
39% More than 2 years in a related position
14% Six months to 2 years in that specific position
28% More than 2 years in that specific position Pay Range – AnnualEntry-level Employees: $25,000 to $70,000Experienced Employees: $25,000 to $75,000
Where the Jobs Are• Life Sciences & Bio • Professional Business Services• FIRE (Finance, Insurance & Real Estate) • High Tech Manufacturing• Legal Services
12-Month Employer Growth Expectations
5% More
0% Less
95% Stay the Same
Employers Anticipate Increasing Employment in Position by 1%
Benefits Offered by Employer
Yes No
Medical insurance 93% 7%
Dental insurance 82% 18%
Life insurance 66% 34%
Paid sick leave 91% 9%
Retirement plan 80% 20%
Paid vacation 96% 4%
Child care 12% 88%
Disability insurance 78% 22%
Percent of Benefits Covered by Employer
100% 99% to 51% 50% < 50%
Medical insurance 15% 78% 8% 0%
Dental insurance 18% 65% 12% 6%
Life insurance 63% 15% 7% 15%
Paid sick leave 95% 5% 0% 0%
Retirement plan 0% 24% 38% 38%
Paid vacation 95% 5% 0% 0%
Child care 0% 50% 0% 50%
Disability insurance 63% 23% 7% 7%
Database Administrators coordinate changes to computer databases, test and implement the database applying knowledge of database management systems. They may plan, coordinate, and implement security measures to safeguard computer databases.
Database Administrators 15-1061
240
0
233 2351% growth
Current Number of Employees 12 Month Expected Number of Employees

36
Most Important Skills for Applicants
61% Ability to maintain databases on multi-user computer systems
45% Knowledge of data storage technology
42% Knowledge of data security procedures
37% Advanced ability with relational databases
16% Skills to apply system optimization techniques
Most Deficient Skills of Applicants
50% Advanced ability with relational databases
29% Skills to apply system optimization techniques
13% Knowledge of data storage technology
8% Ability to maintain databases on multi-user computer systems
Most Effective Recruitment Methods for Finding Qualified Applicants
Entry Level Mid to Senior Level
The firm's website or internal job board 48% 25%
Place ads online, like Monster.com or Craigslist 36% 20%
Contract with employment agency/recruiter 36% 53%
Partner with a college or university 12% 3%
Word of mouth/referrals/networking 10% 10%
LinkedIn or other social media sites 5% 10%
Advertise in newspaper 2% n/a
Promote from within n/a 5%
How Often Position is Permanent Full-Time Position
78% Always
18% Usually
5% Seldom to never
Average Hours per Week Position Requires - 30 to 50 hours
Employer Expectations for Retirements Over the Next 2 to 3 Years
0% Substantial (Over 10%)
3% Somewhat (Between 10% and 3%)
97% Little to none (Less than 3%)
Employers That Would Consider Hiring an Ex-Offender for this Position (someone that has been incarcerated for at least six months)
6% Yes
53% It depends on the crime
42% No
Annual Job Growth Projections for San Diego County 2010 – 2015
47 Average annual new jobs
24 Average annual replacement jobs
71 Average total annual openings(Source: EMSI)
New Job Growth Rate 2010 – 201516 percent growth rate for database administrators in San Diego County over the next five years. This is compared to 8 percent growth for all occupations in the county over the next five years. (Source: EMSI)
Database Administrators
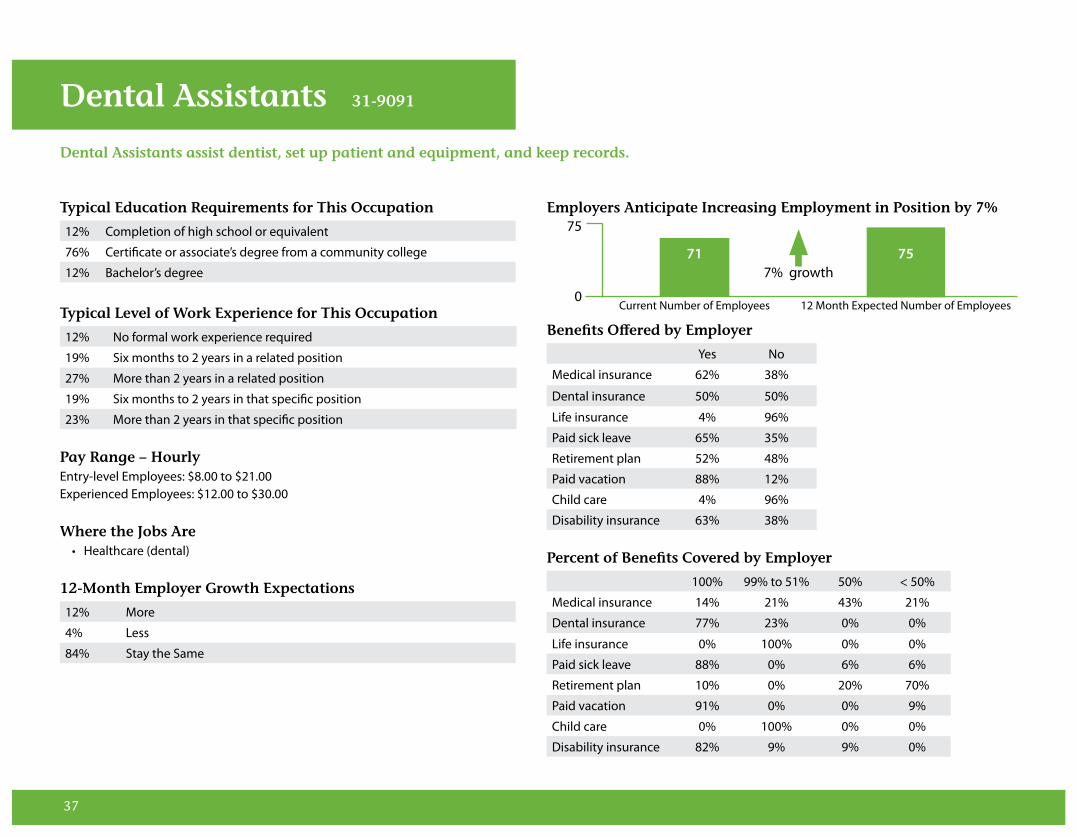
37
Typical Education Requirements for This Occupation
12% Completion of high school or equivalent
76% Certificate or associate’s degree from a community college
12% Bachelor’s degree
Typical Level of Work Experience for This Occupation
12% No formal work experience required
19% Six months to 2 years in a related position
27% More than 2 years in a related position
19% Six months to 2 years in that specific position
23% More than 2 years in that specific position Pay Range – HourlyEntry-level Employees: $8.00 to $21.00Experienced Employees: $12.00 to $30.00
Where the Jobs Are• Healthcare (dental)
12-Month Employer Growth Expectations
12% More
4% Less
84% Stay the Same
Employers Anticipate Increasing Employment in Position by 7%
Benefits Offered by Employer
Yes No
Medical insurance 62% 38%
Dental insurance 50% 50%
Life insurance 4% 96%
Paid sick leave 65% 35%
Retirement plan 52% 48%
Paid vacation 88% 12%
Child care 4% 96%
Disability insurance 63% 38%
Percent of Benefits Covered by Employer
100% 99% to 51% 50% < 50%
Medical insurance 14% 21% 43% 21%
Dental insurance 77% 23% 0% 0%
Life insurance 0% 100% 0% 0%
Paid sick leave 88% 0% 6% 6%
Retirement plan 10% 0% 20% 70%
Paid vacation 91% 0% 0% 9%
Child care 0% 100% 0% 0%
Disability insurance 82% 9% 9% 0%
Dental Assistants assist dentist, set up patient and equipment, and keep records.
Dental Assistants 31-9091
75
0
71 757% growth
Current Number of Employees 12 Month Expected Number of Employees

38
Most Important Skills for Applicants
79% Skills to prepare patients for dental examinations and treatments
63% Certificate from a dental-assisting program
54% Skills to clean and polish teeth
4% Ability to advise patients on oral hygiene
Most Deficient Skills of Applicants
35% Skills to clean and polish teeth
29% Ability to compile and maintain medical records
18% Skills to prepare patients for dental examinations and treatments
12% Certificate from a dental-assisting program
6% Ability to advise patients on oral hygiene
Most Effective Recruitment Methods for Finding Qualified Applicants
Entry Level Mid to Senior Level
Place ads online, like Monster.com or Craigslist 59% 36%
Contract with employment agency/recruiter 27% 32%
Partner with a college or university 23% 14%
Word of mouth/referrals/networking 14% 18%
Advertise in newspaper 9% 9%
How Often Position is Permanent Full-Time Position
42% Always
42% Usually
15% Seldom to never
Average Hours per Week Position Requires - 25 to 50 hours
Employer Expectations for Retirements Over the Next 2 to 3 Years
0% Substantial (Over 10%)
8% Somewhat (Between 10% and 3%)
92% Little to none (Less than 3%)
Employers That Would Consider Hiring an Ex-Offender for this Position (someone that has been incarcerated for at least six months)
5% Yes
58% It depends on the crime
37% No
Annual Job Growth Projections for San Diego County 2010 – 2015
153 Average annual new jobs
072 Average annual replacement jobs
225 Average total annual openings(Source: EMSI)
New Job Growth Rate 2010 – 201520 percent growth rate for dental assistants in San Diego County over the next five years. This is compared to 8 percent growth for all occupations in the county over the next five years. (Source: EMSI)
Dental Assistants
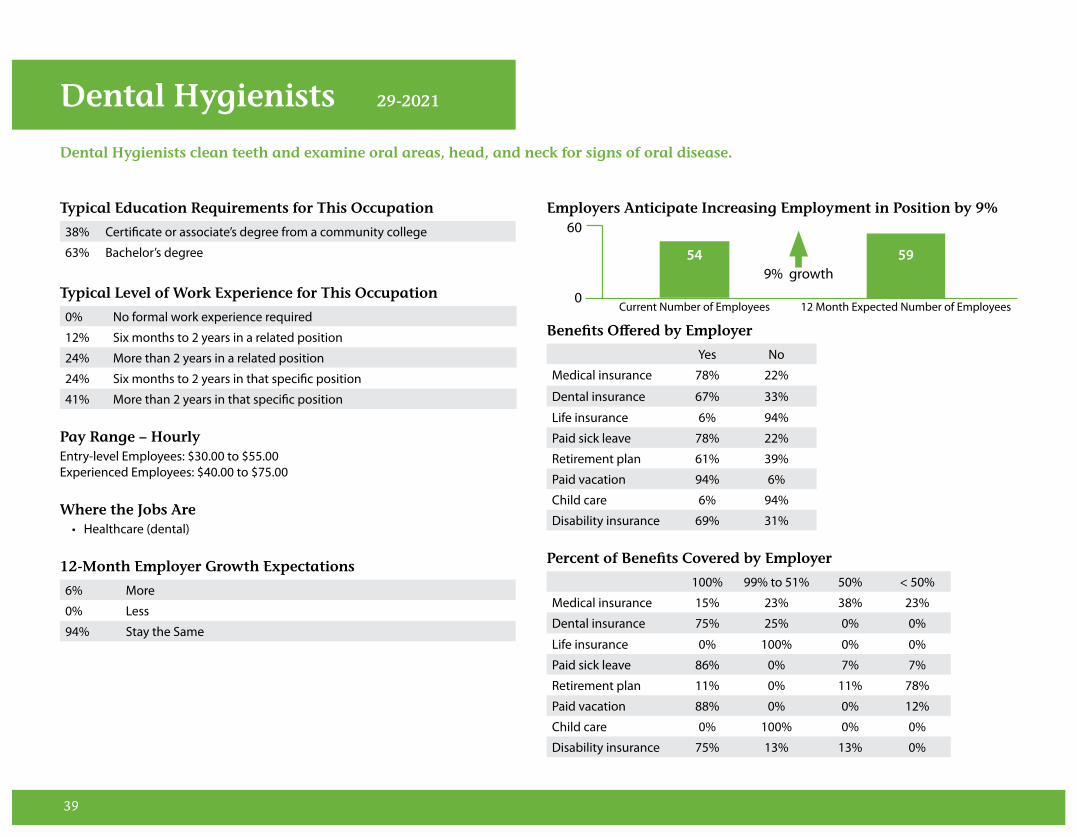
39
Typical Education Requirements for This Occupation
38% Certificate or associate’s degree from a community college
63% Bachelor’s degree
Typical Level of Work Experience for This Occupation
0% No formal work experience required
12% Six months to 2 years in a related position
24% More than 2 years in a related position
24% Six months to 2 years in that specific position
41% More than 2 years in that specific position Pay Range – HourlyEntry-level Employees: $30.00 to $55.00Experienced Employees: $40.00 to $75.00
Where the Jobs Are• Healthcare (dental)
12-Month Employer Growth Expectations
6% More
0% Less
94% Stay the Same
Employers Anticipate Increasing Employment in Position by 9%
Benefits Offered by Employer
Yes No
Medical insurance 78% 22%
Dental insurance 67% 33%
Life insurance 6% 94%
Paid sick leave 78% 22%
Retirement plan 61% 39%
Paid vacation 94% 6%
Child care 6% 94%
Disability insurance 69% 31%
Percent of Benefits Covered by Employer
100% 99% to 51% 50% < 50%
Medical insurance 15% 23% 38% 23%
Dental insurance 75% 25% 0% 0%
Life insurance 0% 100% 0% 0%
Paid sick leave 86% 0% 7% 7%
Retirement plan 11% 0% 11% 78%
Paid vacation 88% 0% 0% 12%
Child care 0% 100% 0% 0%
Disability insurance 75% 13% 13% 0%
Dental Hygienists clean teeth and examine oral areas, head, and neck for signs of oral disease.
Dental Hygienists 29-2021
60
0
54 599% growth
Current Number of Employees 12 Month Expected Number of Employees
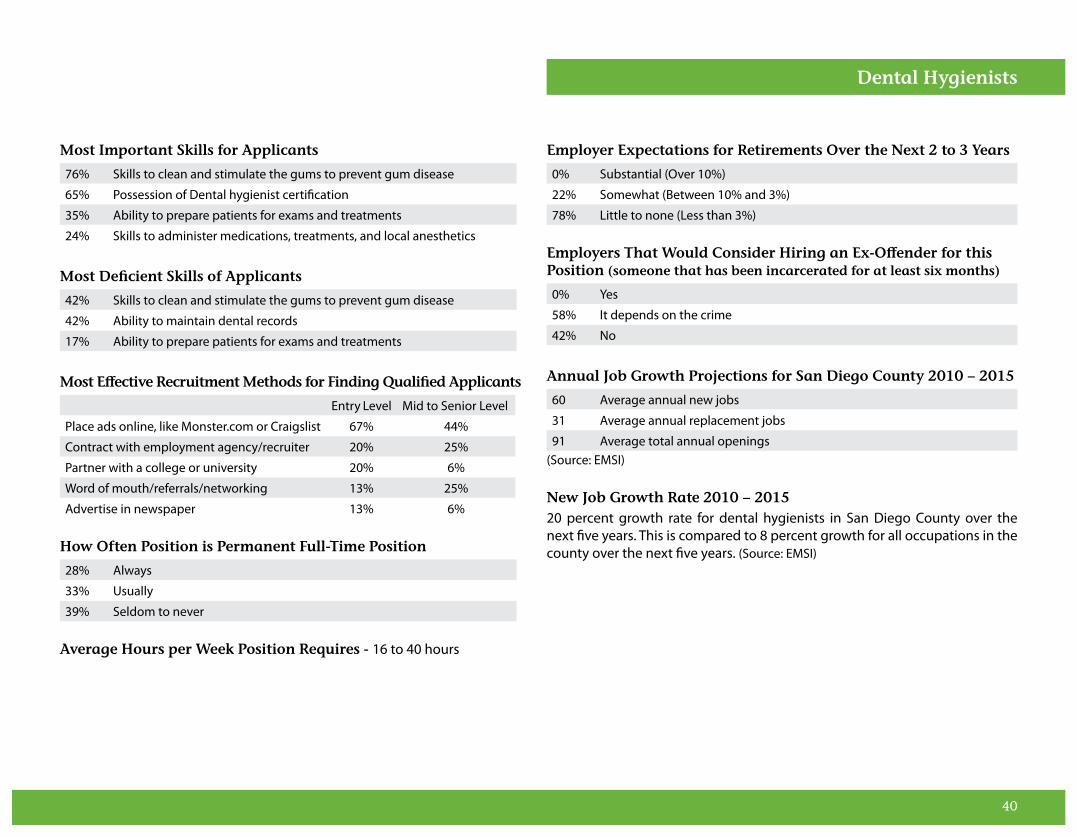
40
Most Important Skills for Applicants
76% Skills to clean and stimulate the gums to prevent gum disease
65% Possession of Dental hygienist certification
35% Ability to prepare patients for exams and treatments
24% Skills to administer medications, treatments, and local anesthetics
Most Deficient Skills of Applicants
42% Skills to clean and stimulate the gums to prevent gum disease
42% Ability to maintain dental records
17% Ability to prepare patients for exams and treatments
Most Effective Recruitment Methods for Finding Qualified Applicants
Entry Level Mid to Senior Level
Place ads online, like Monster.com or Craigslist 67% 44%
Contract with employment agency/recruiter 20% 25%
Partner with a college or university 20% 6%
Word of mouth/referrals/networking 13% 25%
Advertise in newspaper 13% 6%
How Often Position is Permanent Full-Time Position
28% Always
33% Usually
39% Seldom to never
Average Hours per Week Position Requires - 16 to 40 hours
Employer Expectations for Retirements Over the Next 2 to 3 Years
0% Substantial (Over 10%)
22% Somewhat (Between 10% and 3%)
78% Little to none (Less than 3%)
Employers That Would Consider Hiring an Ex-Offender for this Position (someone that has been incarcerated for at least six months)
0% Yes
58% It depends on the crime
42% No
Annual Job Growth Projections for San Diego County 2010 – 2015
60 Average annual new jobs
31 Average annual replacement jobs
91 Average total annual openings(Source: EMSI)
New Job Growth Rate 2010 – 201520 percent growth rate for dental hygienists in San Diego County over the next five years. This is compared to 8 percent growth for all occupations in the county over the next five years. (Source: EMSI)
Dental Hygienists

41
Typical Education Requirements for This Occupation
7% Certificate or associate’s degree from a community college
38% Bachelor’s degree
8% Bachelor’s degree and a certificate
44% Master’s or other graduate degree
3% Master’s or other graduate degree and a Certified Public Accountant
Typical Level of Work Experience for This Occupation
17% No formal work experience required
29% Six months to 2 years in a related position
16% More than 2 years in a related position
14% Six months to 2 years in that specific position
24% More than 2 years in that specific position Pay Range – AnnualEntry-level Employees: $30,000 to $60,000Experienced Employees: $32,000 to $90,000
Where the Jobs Are• Education & Social Services
12-Month Employer Growth Expectations
3% More
23% Less
74% Stay the Same
Employers Anticipate Decreasing Employment in Position by 5%
Benefits Offered by Employer
Yes No
Medical insurance 98% 2%
Dental insurance 95% 5%
Life insurance 84% 16%
Paid sick leave 98% 2%
Retirement plan 92% 8%
Paid vacation 90% 10%
Child care 8% 92%
Disability insurance 74% 26%
Percent of Benefits Covered by Employer
100% 99% to 51% 50% < 50%
Medical insurance 41% 51% 3% 5%
Dental insurance 46% 42% 2% 11%
Life insurance 40% 24% 20% 16%
Paid sick leave 90% 5% 2% 3%
Retirement plan 18% 29% 18% 36%
Paid vacation 94% 2% 2% 2%
Child care 50% 0% 25% 25%
Disability insurance 26% 38% 18% 18%
Educational, Vocational, and School Counselors counsel individuals and provide group educational and vocational guidance services.
Educational, Vocational, and School Counselors 43-6012
1,525
0
1,519 1,447-5% growth
Current Number of Employees 12 Month Expected Number of Employees

42
Most Important Skills for Applicants
62% Ability to apply counseling techniques
58% Ability to assess educational potential and need
38% Ability to resolve conflicts
33% Ability to assist clients to develop job readiness skills and job search strat-egies
8% Skills to interpret psychological test results
Most Deficient Skills of Applicants
41% Ability to assist clients to develop job readiness skills and job search strat-egies
30% Skills to interpret psychological test results
16% Ability to resolve conflicts
11% Ability to assess educational potential and need
3% Ability to apply counseling techniques
Most Effective Recruitment Methods for Finding Qualified Applicants
Entry Level Mid to Senior Level
The firm's website or internal job board 65% 66%
Place ads online, like Monster.com/Craigslist 32% 29%
Partner with a college or university 19% 6%
Job fairs 8% 5%
Word of mouth/referrals/networking 6% 3%
Contract with employment agency/recruiter 2% 11%
LinkedIn or other social media sites 2% 2%
Advertise in newspaper n/a 2%
How Often Position is Permanent Full-Time Position
28% Always
64% Usually
8% Seldom to never
Average Hours per Week Position Requires - 20 to 60 hours
Employer Expectations for Retirements Over the Next 2 to 3 Years
8% Substantial (Over 10%)
37% Somewhat (Between 10% and 3%)
56% Little to none (Less than 3%)
Employers That Would Consider Hiring an Ex-Offender for this Position (someone that has been incarcerated for at least six months)
4% Yes
43% It depends on the crime
54% No
Annual Job Growth Projections for San Diego County 2010 – 2015
079 Average annual new jobs
074 Average annual replacement jobs
153 Average total annual openings(Source: EMSI)
New Job Growth Rate 2010 – 201511 percent growth rate for educational, vocational, and school counselors in San Diego County over the next five years. This is compared to 8 percent growth for all occupations in the county over the next five years. (Source: EMSI)
Educational, Vocational, and School Counselors

43
Typical Education Requirements for This Occupation
65% Completion of high school or equivalent
35% Certificate or associate’s degree from a community college
Typical Level of Work Experience for This Occupation
0% No formal work experience required
12% Six months to 2 years in a related position
24% More than 2 years in a related position
12% Six months to 2 years in that specific position
53% More than 2 years in that specific position Pay Range – HourlyEntry-level Employees: $10.00 to $22.00 Experienced Employees: $11.00 to $38.00
Where the Jobs Are• Construction
12-Month Employer Growth Expectations
35% More
0% Less
65% Stay the Same
Employers Anticipate Increasing Employment in Position by 11%
Benefits Offered by Employer
Yes No
Medical insurance 100% 0%
Dental insurance 88% 13%
Life insurance 69% 31%
Paid sick leave 56% 44%
Retirement plan 81% 19%
Paid vacation 75% 25%
Child care 7% 93%
Disability insurance 77% 23%
Percent of Benefits Covered by Employer
100% 99% to 51% 50% < 50%
Medical insurance 8% 58% 25% 8%
Dental insurance 27% 45% 27% 0%
Life insurance 57% 43% 0% 0%
Paid sick leave 100% 0% 0% 0%
Retirement plan 0% 17% 17% 67%
Paid vacation 90% 0% 0% 10%
Child care 0% 0% 0% 0%
Disability insurance 40% 60% 0% 0%
Electricians install, maintain, and repair electrical wiring, equipment, and fixtures. They ensure that work is in accordance with relevant codes. They may install or service street lights, intercom systems, or electrical control systems.
Electricians 47-2111
365
0
324 35911% growth
Current Number of Employees 12 Month Expected Number of Employees

44
Most Important Skills for Applicants
91% Skills to install electrical and electronic cable and wiring
36% Ability to interpret blueprints and technical drawings
27% Skills to install electromechanical control instruments
27% Skills to test and measure voltage, loads, ground faults and integrity of circuits
18% Knowledge of Alternating Current (AC) and Analog Electronics Theory
Most Deficient Skills of Applicants
33% Skills to install electrical and electronic cable and wiring
33% Ability to interpret blueprints and technical drawings
17% Skills to install electromechanical control instruments
8% Knowledge of Alternating Current (AC) and Analog Electronics Theory
8% Skills to test and measure voltage, loads, ground faults and integrity of circuits
Most Effective Recruitment Methods for Finding Qualified Applicants
Entry Level Mid to Senior Level
Place ads online, like Monster.com/Craigslist 38% 27%
Contract with employment agency/recruiter 6% 7%
Partner with a college or university 6% n/a
The firm's website or internal job board 13% 20%
Word of mouth/referrals/networking 25% 13%
Advertise in newspaper 6% 13%
Promote from within n/a 13%
Job fairs n/a 7%
How Often Position is Permanent Full-Time Position
65% Always
35% Usually
0% Seldom to never
Average Hours per Week Position Requires - 40 to 45 hours
Employer Expectations for Retirements Over the Next 2 to 3 Years
0% Substantial (Over 10%)
7% Somewhat (Between 10% and 3%)
93% Little to none (Less than 3%)
Employers That Would Consider Hiring an Ex-Offender for this Position (someone that has been incarcerated for at least six months)
14% Yes
57% It depends on the crime
29% No
Annual Job Growth Projections for San Diego County 2010 – 2015
146 Average annual new jobs
134 Average annual replacement jobs
280 Average total annual openings(Source: EMSI)
New Job Growth Rate 2010 – 201513 percent growth rate for electricians in San Diego County over the next five years. This is compared to 8 percent growth for all occupations in the county over the next five years. (Source: EMSI)
Electricians

45
Typical Education Requirements for This Occupation
36% Completion of high school or equivalent
34% Certificate or associate’s degree from a community college
27% Bachelor’s degree
2% Bachelor’s degree and a Certified Public Accountant
Typical Level of Work Experience for This Occupation
4% No formal work experience required
31% Six months to 2 years in a related position
29% More than 2 years in a related position
5% Six months to 2 years in that specific position
31% More than 2 years in that specific position Pay Range – Hourly/Annually Entry-level Employees: $9.00 to $25.00 /$20,000 to $65,000Experienced Employees: $8.00 to $26.00/ $20,000 to $75,000
Where the Jobs Are• Professional Business Services • FIRE (Finance, Insurance & Real Estate) • Public Sector & Utilities • Low-Tech Manufacturing • Legal Services
12-Month Employer Growth Expectations
6% More
4% Less
90% Stay the Same
Employers Anticipate Decreasing Employment in Position by 3%
Benefits Offered by Employer
Yes No
Medical insurance 96% 4%
Dental insurance 83% 17%
Life insurance 75% 25%
Paid sick leave 87% 13%
Retirement plan 86% 14%
Paid vacation 97% 3%
Child care 8% 92%
Disability insurance 77% 23%
Percent of Benefits Covered by Employer
100% 99% to 51% 50% < 50%
Medical insurance 13% 58% 22% 7%
Dental insurance 12% 54% 16% 18%
Life insurance 49% 21% 12% 18%
Paid sick leave 88% 4% 5% 2%
Retirement plan 10% 16% 27% 48%
Paid vacation 94% 3% 2% 1%
Child care 17% 17% 33% 33%
Disability insurance 49% 19% 22% 11%
Executive Secretaries and Administrative Assistants provide high-level administrative support by conducting research, preparing statistical reports, handling information requests, and performing clerical functions such as preparing correspondence, receiving visitors, arranging conference calls, and scheduling meetings. They may also train and supervise lower-level clerical staff.
Executive Secretaries and Administrative Assistants 43-6010
675
0
670 652-3% growth
Current Number of Employees 12 Month Expected Number of Employees

46
Most Important Skills for Applicants
68% Ability to prioritize and handle multiple tasks
63% Computer literacy skills
37% Ability to determine and establish office procedures and routines
28% Ability to undertake and complete special management assignments
4% Ability to prepare budgets
Most Deficient Skills of Applicants
39% Ability to prepare budgets21% Ability to prioritize and handle multiple tasks14% Ability to undertake & complete special management assignments13% Computer literacy skills12% Ability to determine and establish office procedures and routines
Most Effective Recruitment Methods for Finding Qualified Applicants
Entry Level Mid to Senior Level
Place ads online, like Monster.com or Craigslist 48% 34%
The firm's website or internal job board 39% 39%
Contract with employment agency/recruiter 27% 34%
Word of mouth/referrals/networking 13% 23%
Partner with a college or university 11% 3%
Job fairs 10% 5%
LinkedIn or other social media sites 3% n/a
Advertise in newspaper 3% 3%
Firm does own recruiting/walk-ins 1% n/a
How Often Position is Permanent Full-Time Position
85% Always
15% Usually
1% Seldom to never
Average Hours per Week Position Requires - 30 to 60 hours
Employer Expectations for Retirements Over the Next 2 to 3 Years
2% Substantial (Over 10%)
20% Somewhat (Between 10% and 3%)
78% Little to none (Less than 3%)
Employers That Would Consider Hiring an Ex-Offender for this Position (someone that has been incarcerated for at least six months)
3% Yes
43% It depends on the crime
54% No
Annual Job Growth Projections for San Diego County 2010 – 2015
433 Average annual new jobs
243 Average annual replacement jobs
676 Average total annual openings(Source: EMSI)
New Job Growth Rate 2010 – 201512 percent growth rate for executive secretaries in San Diego County over the next five years. This is compared to 8 percent growth for all occupations in the county over the next five years. (Source: EMSI)
Executive Secretaries and Administrative Assistants

47
Typical Education Requirements for This Occupation
11% Completion of high school or equivalent
21% Certificate or associate’s degree from a community college
68% Bachelor’s degree
Typical Level of Work Experience for This Occupation
11% No formal work experience required
37% Six months to 2 years in a related position
26% More than 2 years in a related position
11% Six months to 2 years in that specific position
16% More than 2 years in that specific position Pay Range – AnnualEntry-level Employees: $25,000 to $47,000Experienced Employees: $25,000 to $64,000
Where the Jobs Are• Life Sciences & Bio • FIRE (Finance, Insurance & Real Estate) • High Tech Manufacturing
12-Month Employer Growth Expectations
8% More
0% Less
92% Stay the Same
Employers Anticipate Increasing Employment in Position by 1%
Benefits Offered by Employer
Yes No
Medical insurance 100% 0%
Dental insurance 88% 12%
Life insurance 80% 20%
Paid sick leave 100% 0%
Retirement plan 88% 12%
Paid vacation 100% 0%
Child care 20% 80%
Disability insurance 92% 8%
Percent of Benefits Covered by Employer
100% 99% to 51% 50% < 50%
Medical insurance 4% 70% 22% 4%
Dental insurance 12% 82% 6% 0%
Life insurance 65% 18% 12% 6%
Paid sick leave 92% 8% 0% 0%
Retirement plan 0% 29% 29% 41%
Paid vacation 92% 8% 0% 0%
Child care 0% 33% 0% 67%
Disability insurance 50% 39% 6% 6%
Graphic Designers design or create graphics to meet specific commercial or promotional needs, such as packaging, displays, or logos. They may use a variety of mediums to achieve artistic or decorative effects.
Graphic Designers 27-1024
675
0
650 6561% growth
Current Number of Employees 12 Month Expected Number of Employees

48
Most Important Skills for Applicants
50% Ability to create and design art from general feedback and ideas
44% Knowledge of marketing and graphic arts techniques
44% Ability to consult with clients to establish designs and illustrations
44% Knowledge of computer design and graphics technology and software
19% Ability to design advertising layouts
Most Deficient Skills of Applicants
42% Ability to consult with clients to establish designs and illustrations
25% Ability to design advertising layouts
17% Knowledge of marketing and graphic arts techniques
8% Ability to create and design art from general feedback and ideas
8% Knowledge of computer design and graphics technology and software
Most Effective Recruitment Methods for Finding Qualified Applicants
Entry Level Mid to Senior Level
The firm's website or internal job board 58% 45%
Place ads online, like Monster.com/Craigslist 38% 18%
Contract with employment agency/recruiter 33% 50%
Partner with a college or university 13% n/a
Word of mouth/referrals/networking 8% 14%
LinkedIn or other social media sites 4% n/a
Promote from within n/a 5%
How Often Position is Permanent Full-Time Position
68% Always
32% Usually
0% Seldom to never
Average Hours per Week Position Requires - 35 to 50 hours
Employer Expectations for Retirements Over the Next 2 to 3 Years
0% Substantial (Over 10%)
6% Somewhat (Between 10% and 3%)
94% Little to none (Less than 3%)
Employers That Would Consider Hiring an Ex-Offender for this Position (someone that has been incarcerated for at least six months)
0% Yes
67% It depends on the crime
33% No
Annual Job Growth Projections for San Diego County 2010 – 2015
047 Average annual new jobs
069 Average annual replacement jobs
116 Average total annual openings(Source: EMSI)
New Job Growth Rate 2010 – 201511 percent growth rate for graphic designers in San Diego County over the next five years. This is compared to 8 percent growth for all occupations in the county over the next five years. (Source: EMSI)
Graphic Designers

49
Typical Education Requirements for This Occupation
39% Completion of high school or equivalent
42% Certificate or associate’s degree from a community college
19% Bachelor’s degree
Typical Level of Work Experience for This Occupation
3% No formal work experience required
26% Six months to 2 years in a related position
34% More than 2 years in a related position
3% Six months to 2 years in that specific position
34% More than 2 years in that specific position Pay Range – AnnualEntry-level Employees: $25,000 to $55,000Experienced Employees: $30,000 to $100,000
Where the Jobs Are• Legal Services
12-Month Employer Growth Expectations
30% More
3% Less
68% Stay the Same
Employers Anticipate Increasing Employment in Position by 3%
Benefits Offered by Employer
Yes No
Medical insurance 97% 3%
Dental insurance 81% 19%
Life insurance 68% 32%
Paid sick leave 89% 11%
Retirement plan 86% 14%
Paid vacation 95% 5%
Child care 8% 92%
Disability insurance 68% 32%
Percent of Benefits Covered by Employer
100% 99% to 51% 50% < 50%
Medical insurance 53% 29% 12% 6%
Dental insurance 48% 33% 4% 15%
Life insurance 74% 9% 4% 13%
Paid sick leave 94% 3% 3% 0%
Retirement plan 15% 23% 19% 42%
Paid vacation 97% 3% 0% 0%
Child care 10% 0% 0% 0%
Disability insurance 58% 16% 16% 11%
Legal Secretaries perform secretarial duties utilizing legal terminology, procedures, and documents. They prepare legal papers and correspondence, such as summonses, complaints, motions, and subpoenas. They may also assist with legal research.
Legal Secretaries 43-6012
400
0
347 3573% growth
Current Number of Employees 12 Month Expected Number of Employees

50
Most Important Skills for Applicants
86% Advanced ability in use of word processing software
77% Prepare legal documents
14% Assist with legal research including reviewing journals and publications
14% Apply industry terms and concepts
9% Ability to compile information for court cases
Most Deficient Skills of Applicants
36% Assist with legal research including reviewing journals and publications
21% Ability to compile information for court cases
18% Apply industry terms and concepts
14% Advanced ability in use of word processing software
11% Prepare legal documents
Most Effective Recruitment Methods for Finding Qualified Applicants
Entry Level Mid to Senior Level
Place ads online, like Monster.com/Craigslist 56% 39%
Contract with employment agency/recruiter 38% 52%
Partner with a college or university 21% 18%
The firm's website or internal job board 21% 27%
Word of mouth/referrals/networking 6% 6%
Advertise in newspaper 3% n/a
How Often Position is Permanent Full-Time Position
79% Always
16% Usually
5% Seldom to never
Average Hours per Week Position Requires - 30 to 47 hours
Employer Expectations for Retirements Over the Next 2 to 3 Years
3% Substantial (Over 10%)
17% Somewhat (Between 10% and 3%)
80% Little to none (Less than 3%)
Employers That Would Consider Hiring an Ex-Offender for this Position (someone that has been incarcerated for at least six months)
3% Yes
41% It depends on the crime
56% No
Annual Job Growth Projections for San Diego County 2010 – 2015
114 Average annual new jobs
041 Average annual replacement jobs
161 Average total annual openings(Source: EMSI)
New Job Growth Rate 2010 – 201519 percent growth rate for network legal secretaries in San Diego County over the next five years. This is compared to 8 percent growth for all occupations in the county over the next five years. (Source: EMSI)
Legal Secretaries

51
Typical Education Requirements for This Occupation
5% Completion of high school or equivalent
59% Certificate or associate’s degree from a community college
30% Bachelor’s degree
5% Master’s or other graduate degree
Typical Level of Work Experience for This Occupation
0% No formal work experience required
48% Six months to 2 years in a related position
18% More than 2 years in a related position
25% Six months to 2 years in that specific position
10% More than 2 years in that specific position Pay Range – HourlyEntry-level Employees: $10.00 to $42.00 Experienced Employees: $11.00 to $51.00
Where the Jobs Are• Healthcare (non-dental)
12-Month Employer Growth Expectations
17% More
7% Less
76% Stay the Same
Employers Anticipate Increasing Employment in Position by 2%
Benefits Offered by Employer
Yes No
Medical insurance 96% 4%
Dental insurance 93% 7%
Life insurance 84% 16%
Paid sick leave 89% 11%
Retirement plan 91% 9%
Paid vacation 96% 4%
Child care 18% 82%
Disability insurance 86% 14%
Percent of Benefits Covered by Employer
100% 99% to 51% 50% < 50%
Medical insurance 10% 73% 12% 5%
Dental insurance 15% 51% 15% 18%
Life insurance 43% 10% 27% 20%
Paid sick leave 86% 11% 3% 0%
Retirement plan 10% 31% 21% 38%
Paid vacation 93% 8% 0% 0%
Child care 33% 0% 33% 33%
Disability insurance 40% 24% 16% 20%
Licensed Practical and Licensed Vocational Nurses care for ill, injured, convalescent, or disabled persons in hospitals, nursing homes, clinics, private homes, group homes, and similar institutions.
Licensed Practical and Licensed Vocational Nurses 29-2061
4,260
0
4,172 4,2522% growth
Current Number of Employees 12 Month Expected Number of Employees

52
Most Important Skills for Applicants
68% Ability to provide patient care and observe procedures
53% Ability to apply nursing practices and procedures
43% Skills to administer medications and treatments
25% Ability to Perform routine medical tests and treatments
13% Skills to perform routine medical tests
Most Deficient Skills of Applicants
24% Ability to apply nursing practices and procedures
24% Skills to perform routine medical tests
18% Ability to provide patient care and observe procedures
18% Ability to Perform routine medical tests and treatments
18% Skills to administer medications and treatments
Most Effective Recruitment Methods for Finding Qualified Applicants
Entry Level Mid to Senior Level
The firm's website or internal job board 53% 52%
Place ads online, like Monster.com or Craigslist 38% 48%
Job fairs 20% 10%
Partner with a college or university 13% 5%
Contract with employment agency/recruiter 11% 21%
Word of mouth/referrals/networking 7% 10%
Advertise in newspaper 4% n/a
Firm does own recruiting/walk-ins 2% n/a
LinkedIn or other social media sites n/a 2%
How Often Position is Permanent Full-Time Position
42% Always
49% Usually
9% Seldom to never
Average Hours per Week Position Requires - 20 to 80 hours
Employer Expectations for Retirements Over the Next 2 to 3 Years
15% Substantial (Over 10%)
21% Somewhat (Between 10% and 3%)
64% Little to none (Less than 3%)
Employers That Would Consider Hiring an Ex-Offender for this Position (someone that has been incarcerated for at least six months)
3% Yes
41% It depends on the crime
56% No
Annual Job Growth Projections for San Diego County 2010 – 2015
128 Average annual new jobs
164 Average annual replacement jobs
292 Average total annual openings(Source: EMSI)
New Job Growth Rate 2010 – 201512 percent growth rate for licensed practical and licensed vocational nurses in San Diego County over the next five years. This is compared to 8 percent growth for all occupations in the county over the next five years. (Source: EMSI)
Licensed Practical and Licensed Vocational Nurses

53
Typical Education Requirements for This Occupation
82% Completion of high school or equivalent
16% Certificate or associate’s degree from a community college
2% Bachelor’s degree
Typical Level of Work Experience for This Occupation
23% No formal work experience required
37% Six months to 2 years in a related position
23% More than 2 years in a related position
2% Six months to 2 years in that specific position
16% More than 2 years in that specific position Pay Range – Hourly/Annually Entry-level Employees: $8.00 to $20.00 /$22,000 to $45,000Experienced Employees: $9.00 to $30.00/$37,000 to $45,000
Where the Jobs Are• Public Sector & Utilities (not Education) • Wholesale, Transportation & Warehousing • Low-Tech Manufacturing
12-Month Employer Growth Expectations
17% More
9% Less
73% Stay the Same
Employers Anticipate Increasing Employment in Position by 1%
Benefits Offered by Employer
Yes No
Medical insurance 97% 3%
Dental insurance 90% 10%
Life insurance 84% 16%
Paid sick leave 91% 9%
Retirement plan 85% 15%
Paid vacation 99% 1%
Child care 6% 94%
Disability insurance 79% 21%
Percent of Benefits Covered by Employer
100% 99% to 51% 50% < 50%
Medical insurance 14% 62% 21% 3%
Dental insurance 16% 50% 22% 12%
Life insurance 57% 26% 7% 11%
Paid sick leave 91% 7% 0% 2%
Retirement plan 10% 37% 18% 35%
Paid vacation 98% 2% 0% 0%
Child care 0% 0% 0% 100%
Disability insurance 51% 24% 15% 10%
Maintenance and Repair Workers perform work involving the skills of two or more maintenance or craft occupations to keep ma-chines, mechanical equipment, or the structure of an establishment in repair. Their duties may involve pipe fitting; boiler making; insulating; welding; machining; carpentry; repairing electrical or mechanical equipment; installing, aligning, and balancing new equipment; and repairing buildings, floors, or stairs.
Maintenance and Repair Workers, General 49-9042
3,500
0
3,471 3,4991% growth
Current Number of Employees 12 Month Expected Number of Employees

54
Most Important Skills for Applicants
56% Skills to correct malfunctions in electrical and electronic equipment
48% Ability to use building materials for routine building maintenance
44% Skills to operate hand and power woodworking tools
35% Ability to interpret service manuals for electronic equipment
17% Ability to test and measure voltage, loads, ground faults integrity of cir-cuits
Most Deficient Skills of Applicants
35% Skills to correct malfunctions in electrical and electronic equipment
28% Ability to test and measure voltage, loads, ground faults integrity of cir-cuits
18% Ability to use building materials for routine building maintenance
15% Ability to interpret service manuals for electronic equipment
5% Skills to operate hand and power woodworking tools
Most Effective Recruitment Methods for Finding Qualified Applicants
Entry Level Mid to Senior Level
The firm's website or internal job board 47% 38%
Place ads online, like Monster.com or Craigslist 27% 33%
Contract with employment agency/recruiter 20% 23%
Job fairs 9% 13%
Word of mouth/referrals/networking 9% 6%
Partner with a college or university 8% 5%
Advertise in newspaper 6% 3%
Firm does own recruiting/walk-ins 3% n/a
LinkedIn or other social media sites 2% n/a
Promote from within n/a 3%
How Often Position is Permanent Full-Time Position
57% Always
38% Usually
5% Seldom to never
Average Hours per Week Position Requires - 8 to 48 hours
Employer Expectations for Retirements Over the Next 2 to 3 Years
5% Substantial (Over 10%)
34% Somewhat (Between 10% and 3%)
60% Little to none (Less than 3%)
Employers That Would Consider Hiring an Ex-Offender for this Position (someone that has been incarcerated for at least six months)
7% Yes
61% It depends on the crime
32% No
Annual Job Growth Projections for San Diego County 2010 – 2015
199 Average annual new jobs
171 Average annual replacement jobs
370 Average total annual openings(Source: EMSI)
New Job Growth Rate 2010 – 20159 percent growth rate for maintenance and repair workers in San Diego County over the next five years. This is compared to 8 percent growth for all occupations in the county over the next five years. (Source: EMSI)
Maintenance and Repair Workers, General
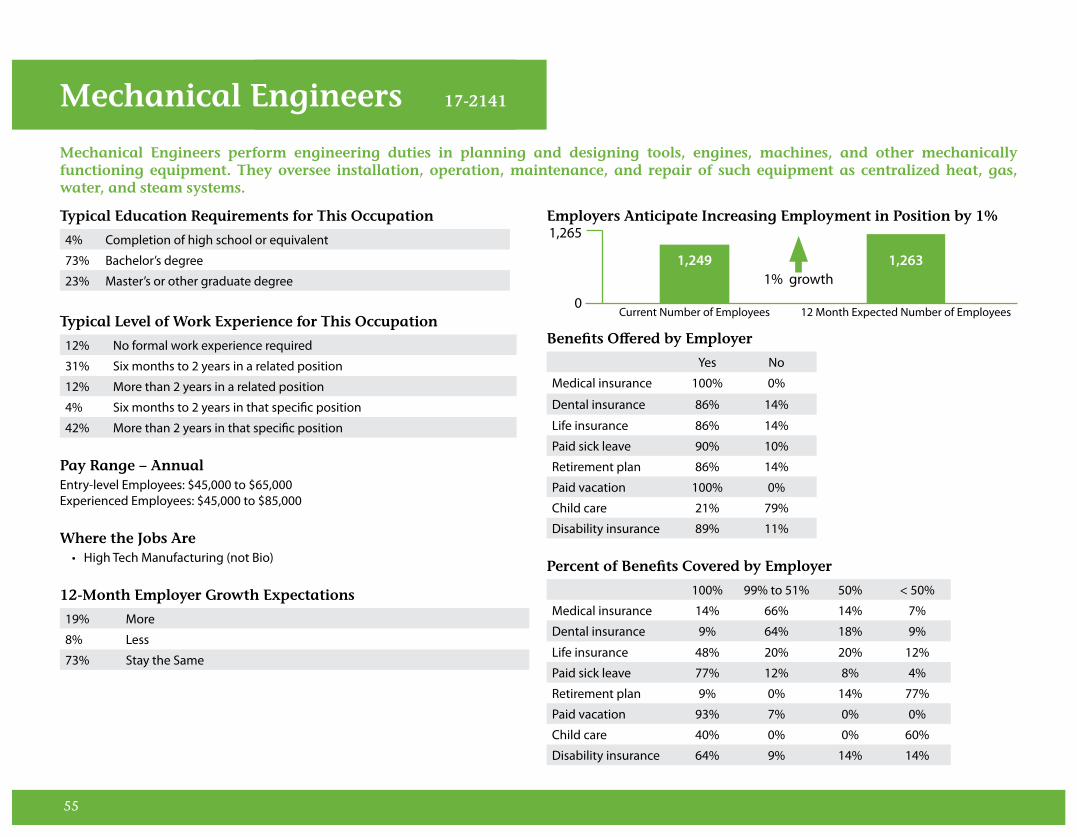
55
Typical Education Requirements for This Occupation
4% Completion of high school or equivalent
73% Bachelor’s degree
23% Master’s or other graduate degree
Typical Level of Work Experience for This Occupation
12% No formal work experience required
31% Six months to 2 years in a related position
12% More than 2 years in a related position
4% Six months to 2 years in that specific position
42% More than 2 years in that specific position Pay Range – AnnualEntry-level Employees: $45,000 to $65,000Experienced Employees: $45,000 to $85,000
Where the Jobs Are• High Tech Manufacturing (not Bio)
12-Month Employer Growth Expectations
19% More
8% Less
73% Stay the Same
Employers Anticipate Increasing Employment in Position by 1%
Benefits Offered by Employer
Yes No
Medical insurance 100% 0%
Dental insurance 86% 14%
Life insurance 86% 14%
Paid sick leave 90% 10%
Retirement plan 86% 14%
Paid vacation 100% 0%
Child care 21% 79%
Disability insurance 89% 11%
Percent of Benefits Covered by Employer
100% 99% to 51% 50% < 50%
Medical insurance 14% 66% 14% 7%
Dental insurance 9% 64% 18% 9%
Life insurance 48% 20% 20% 12%
Paid sick leave 77% 12% 8% 4%
Retirement plan 9% 0% 14% 77%
Paid vacation 93% 7% 0% 0%
Child care 40% 0% 0% 60%
Disability insurance 64% 9% 14% 14%
Mechanical Engineers perform engineering duties in planning and designing tools, engines, machines, and other mechanically functioning equipment. They oversee installation, operation, maintenance, and repair of such equipment as centralized heat, gas, water, and steam systems.
Mechanical Engineers 17-2141
1,265
0
1,249 1,2631% growth
Current Number of Employees 12 Month Expected Number of Employees
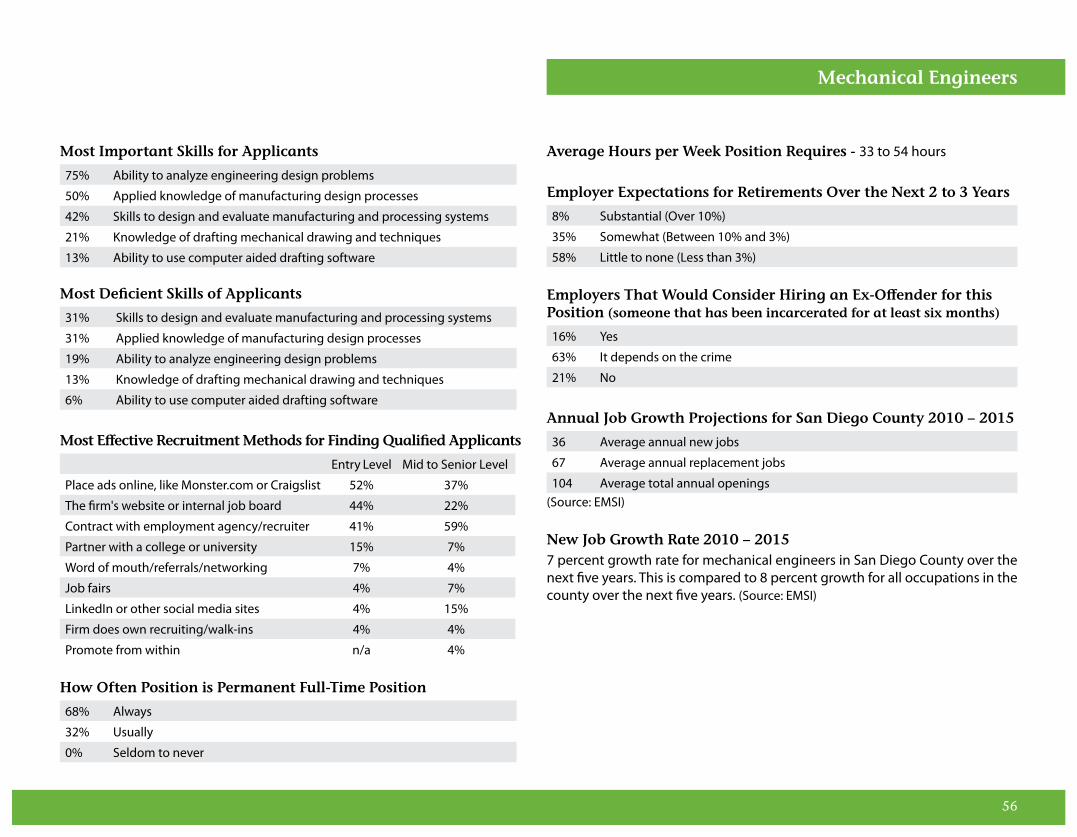
56
Most Important Skills for Applicants
75% Ability to analyze engineering design problems
50% Applied knowledge of manufacturing design processes
42% Skills to design and evaluate manufacturing and processing systems
21% Knowledge of drafting mechanical drawing and techniques
13% Ability to use computer aided drafting software
Most Deficient Skills of Applicants
31% Skills to design and evaluate manufacturing and processing systems
31% Applied knowledge of manufacturing design processes
19% Ability to analyze engineering design problems
13% Knowledge of drafting mechanical drawing and techniques
6% Ability to use computer aided drafting software
Most Effective Recruitment Methods for Finding Qualified Applicants
Entry Level Mid to Senior Level
Place ads online, like Monster.com or Craigslist 52% 37%
The firm's website or internal job board 44% 22%
Contract with employment agency/recruiter 41% 59%
Partner with a college or university 15% 7%
Word of mouth/referrals/networking 7% 4%
Job fairs 4% 7%
LinkedIn or other social media sites 4% 15%
Firm does own recruiting/walk-ins 4% 4%
Promote from within n/a 4%
How Often Position is Permanent Full-Time Position
68% Always
32% Usually
0% Seldom to never
Average Hours per Week Position Requires - 33 to 54 hours
Employer Expectations for Retirements Over the Next 2 to 3 Years
8% Substantial (Over 10%)
35% Somewhat (Between 10% and 3%)
58% Little to none (Less than 3%)
Employers That Would Consider Hiring an Ex-Offender for this Position (someone that has been incarcerated for at least six months)
16% Yes
63% It depends on the crime
21% No
Annual Job Growth Projections for San Diego County 2010 – 2015
36 Average annual new jobs
67 Average annual replacement jobs
104 Average total annual openings(Source: EMSI)
New Job Growth Rate 2010 – 20157 percent growth rate for mechanical engineers in San Diego County over the next five years. This is compared to 8 percent growth for all occupations in the county over the next five years. (Source: EMSI)
Mechanical Engineers

57
Typical Education Requirements for This Occupation
24% Completion of high school or equivalent
72% Certificate or associate’s degree from a community college
3% Bachelor’s degree
Typical Level of Work Experience for This Occupation
14% No formal work experience required
45% Six months to 2 years in a related position
7% More than 2 years in a related position
21% Six months to 2 years in that specific position
14% More than 2 years in that specific position Pay Range – HourlyEntry-level Employees: $8.75 to $16.00 Experienced Employees: $10.00 to $22.00
Where the Jobs Are• Healthcare (non-dental)
12-Month Employer Growth Expectations
17% More
10% Less
72% Stay the Same
Employers Anticipate Increasing Employment in Position by 4%
Benefits Offered by Employer
Yes No
Medical insurance 67% 33%
Dental insurance 30% 70%
Life insurance 27% 73%
Paid sick leave 77% 23%
Retirement plan 50% 50%
Paid vacation 83% 17%
Child care 0% 100%
Disability insurance 54% 46%
Percent of Benefits Covered by Employer
100% 99% to 51% 50% < 50%
Medical insurance 53% 26% 5% 16%
Dental insurance 44% 11% 0% 44%
Life insurance 75% 0% 0% 25%
Paid sick leave 90% 5% 0% 5%
Retirement plan 50% 8% 17% 25%
Paid vacation 96% 0% 4% 0%
Child care 0% 0% 0% 0%
Disability insurance 75% 8% 8% 8%
Medical Assistants perform administrative and certain clinical duties under the direction of a physician. Their administrative duties may include scheduling appointments, maintaining medical records, billing, and coding for insurance purposes. Their clinical duties may include taking and recording vital signs and medical histories, preparing patients for examination, drawing blood, and administering medications as directed by a physician.
Medical Assistants 31-9092
150
0
138 1434% growth
Current Number of Employees 12 Month Expected Number of Employees
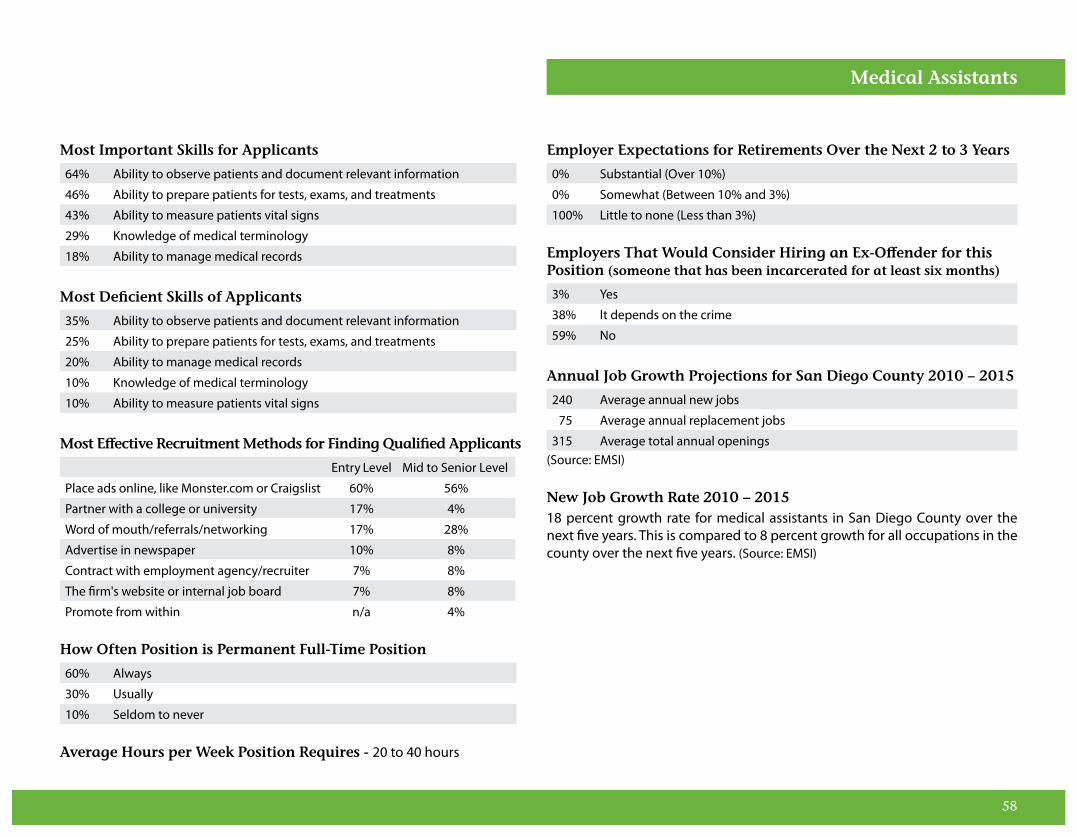
58
Most Important Skills for Applicants
64% Ability to observe patients and document relevant information
46% Ability to prepare patients for tests, exams, and treatments
43% Ability to measure patients vital signs
29% Knowledge of medical terminology
18% Ability to manage medical records
Most Deficient Skills of Applicants
35% Ability to observe patients and document relevant information
25% Ability to prepare patients for tests, exams, and treatments
20% Ability to manage medical records
10% Knowledge of medical terminology
10% Ability to measure patients vital signs
Most Effective Recruitment Methods for Finding Qualified Applicants
Entry Level Mid to Senior Level
Place ads online, like Monster.com or Craigslist 60% 56%
Partner with a college or university 17% 4%
Word of mouth/referrals/networking 17% 28%
Advertise in newspaper 10% 8%
Contract with employment agency/recruiter 7% 8%
The firm's website or internal job board 7% 8%
Promote from within n/a 4%
How Often Position is Permanent Full-Time Position
60% Always
30% Usually
10% Seldom to never
Average Hours per Week Position Requires - 20 to 40 hours
Employer Expectations for Retirements Over the Next 2 to 3 Years
0% Substantial (Over 10%)
0% Somewhat (Between 10% and 3%)
100% Little to none (Less than 3%)
Employers That Would Consider Hiring an Ex-Offender for this Position (someone that has been incarcerated for at least six months)
3% Yes
38% It depends on the crime
59% No
Annual Job Growth Projections for San Diego County 2010 – 2015
240 Average annual new jobs
075 Average annual replacement jobs
315 Average total annual openings(Source: EMSI)
New Job Growth Rate 2010 – 201518 percent growth rate for medical assistants in San Diego County over the next five years. This is compared to 8 percent growth for all occupations in the county over the next five years. (Source: EMSI)
Medical Assistants

59
Typical Education Requirements for This Occupation
60% Completion of high school or equivalent
31% Certificate or associate’s degree from a community college
7% Bachelor’s degree
2% Master’s or other graduate degree and a Certified Public Accountant
Typical Level of Work Experience for This Occupation
11% No formal work experience required
54% Six months to 2 years in a related position
9% More than 2 years in a related position
15% Six months to 2 years in that specific position
11% More than 2 years in that specific position Pay Range – HourlyEntry-level Employees: $8.00 to $20.00Experienced Employees: $9.00 to $21.00
Where the Jobs Are• Healthcare (non-dental)
12-Month Employer Growth Expectations
6% More
10% Less
84% Stay the Same
Employers Anticipate Decreasing Employment in Position by 4%
Benefits Offered by Employer
Yes No
Medical insurance 94% 6%
Dental insurance 87% 13%
Life insurance 77% 23%
Paid sick leave 92% 8%
Retirement plan 89% 11%
Paid vacation 100% 0%
Child care 20% 80%
Disability insurance 84% 16%
Percent of Benefits Covered by Employer
100% 99% to 51% 50% < 50%
Medical insurance 20% 69% 9% 2%
Dental insurance 17% 56% 12% 15%
Life insurance 47% 13% 23% 17%
Paid sick leave 93% 5% 2% 0%
Retirement plan 17% 26% 20% 37%
Paid vacation 94% 6% 0% 0%
Child care 25% 0% 50% 25%
Disability insurance 41% 21% 21% 17%
Medical Records and Health Information Technicians compile, process, and maintain medical records of hospital and clinic patients in a manner consistent with medical, administrative, ethical, legal, and regulatory requirements of the health care system. They process, maintain, compile, and report patient information for health requirements and standards.
Medical Records and Health Information Technicians 29-2071
1,250
0
1,249 1,199- 4% growth
Current Number of Employees 12 Month Expected Number of Employees

60
Most Important Skills for Applicants
60% Ability to use technology including computers to compile and maintain medical records
58% Ability to compile and maintain medical records
49% Ability to classify and code health records and related information
19% Ability to cross-reference and store records
14% Knowledge of government medical billing regulations
Most Deficient Skills of Applicants
58% Knowledge of government medical billing regulations
15% Ability to compile and maintain medical records
12% Ability to use technology including computers to compile and maintain medical records
9% Ability to classify and code health records and related information
6% Ability to cross-reference and store records
Most Effective Recruitment Methods for Finding Qualified Applicants
Entry Level Mid to Senior Level
The firm's website or internal job board 51% 49%
Place ads online, like Monster.com or Craigslist 34% 43%
Partner with a college or university 21% 6%
Job fairs 15% 10%
Word of mouth/referrals/networking 13% 14%
Contract with employment agency/recruiter 11% 22%
Advertise in newspaper 4% 4%
Firm does own recruiting/walk-ins 2% n/a
LinkedIn or other social media sites n/a 2%
How Often Position is Permanent Full-Time Position
52% Always
40% Usually
8% Seldom to never
Average Hours per Week Position Requires - 25 to 60 hours
Employer Expectations for Retirements Over the Next 2 to 3 Years
9% Substantial (Over 10%)
14% Somewhat (Between 10% and 3%)
77% Little to none (Less than 3%)
Employers That Would Consider Hiring an Ex-Offender for this Position (someone that has been incarcerated for at least six months)
4% Yes
46% It depends on the crime
50% No
Annual Job Growth Projections for San Diego County 2010 – 2015
38 Average annual new jobs
30 Average annual replacement jobs
68 Average total annual openings(Source: EMSI)
New Job Growth Rate 2010 – 201513 percent growth rate for medical records and health information technicians in San Diego County over the next five years. This is compared to 8 percent growth for all occupations in the county over the next five years. (Source: EMSI)
Medical Records and Health Information Technicians

61
Typical Education Requirements for This Occupation
45% Completion of high school or equivalent
43% Certificate or associate’s degree from a community college
10% Bachelor’s degree
2% Master’s or other graduate degree
Typical Level of Work Experience for This Occupation
2% No formal work experience required
63% Six months to 2 years in a related position
16% More than 2 years in a related position
12% Six months to 2 years in that specific position
7% More than 2 years in that specific position Pay Range – Hourly Entry-level Employees: $10.00 to $15.00Experienced Employees: $10.00 to $21.00
Where the Jobs Are• Healthcare (non-dental)
12-Month Employer Growth Expectations
9% More
9% Less
82% Stay the Same
Employers Anticipate Decreasing Employment in Position by 1%
Benefits Offered by Employer
Yes No
Medical insurance 87% 13%
Dental insurance 74% 26%
Life insurance 65% 35%
Paid sick leave 94% 6%
Retirement plan 83% 17%
Paid vacation 96% 4%
Child care 20% 80%
Disability insurance 70% 30%
Percent of Benefits Covered by Employer
100% 99% to 51% 50% < 50%
Medical insurance 24% 62% 8% 5%
Dental insurance 26% 48% 13% 13%
Life insurance 50% 14% 23% 14%
Paid sick leave 90% 8% 3% 0%
Retirement plan 28% 24% 17% 31%
Paid vacation 93% 7% 0% 0%
Child care 25% 0% 50% 25%
Disability insurance 48% 13% 22% 17%
Medical Secretaries perform secretarial duties utilizing specific knowledge of medical terminology and hospital, clinic, or laboratory procedures. Their duties include scheduling appointments, billing patients, and compiling and recording medical charts, reports, and correspondence.
Medical Secretaries 43-6013
1,550
0
1,532 1,511-1% growth
Current Number of Employees 12 Month Expected Number of Employees

62
Most Important Skills for Applicants
61% Ability to schedule and confirm appointments
44% Ability to provide basic information to clients and the public
41% Ability to obtain and process information
32% Ability to understand and use medical terminology
22% Interpret explain government organization rules policies
Most Deficient Skills of Applicants
42% Interpret explain government organization rules policies
27% Ability to obtain and process information
15% Ability to understand and use medical terminology
8% Ability to schedule and confirm appointments
8% Ability to provide basic information to clients and the public
Most Effective Recruitment Methods for Finding Qualified Applicants
Entry Level Mid to Senior Level
Place ads online, like Monster.com or Craigslist 44% 38%
The firm's website or internal job board 44% 48%
Partner with a college or university 20% 5%
Job fairs 18% 12%
Contract with employment agency/recruiter 11% 26%
Word of mouth/referrals/networking 7% 14%
Advertise in newspaper 4% 2%
LinkedIn or other social media sites n/a 2%
How Often Position is Permanent Full-Time Position
52% Always
43% Usually
5% Seldom to never
Average Hours per Week Position Requires - 25 to 80 hours
Employer Expectations for Retirements Over the Next 2 to 3 Years
5% Substantial (Over 10%)
23% Somewhat (Between 10% and 3%)
73% Little to none (Less than 3%)
Employers That Would Consider Hiring an Ex-Offender for this Position (someone that has been incarcerated for at least six months)
7% Yes
52% It depends on the crime
40% No
Annual Job Growth Projections for San Diego County 2010 – 2015
281 Average annual new jobs
120 Average annual replacement jobs
401 Average total annual openings(Source: EMSI)
New Job Growth Rate 2010 – 201516 percent growth rate for medical secretaries in San Diego County over the next five years. This is compared to 8 percent growth for all occupations in the county over the next five years. (Source: EMSI)
Medical Secretaries

63
Typical Education Requirements for This Occupation
11% Certificate or associate’s degree from a community college
28% Bachelor’s degree
61% Master’s or other graduate degree
Typical Level of Work Experience for This Occupation
6% No formal work experience required
20% Six months to 2 years in a related position
29% More than 2 years in a related position
20% Six months to 2 years in that specific position
26% More than 2 years in that specific position Pay Range – AnnualEntry-level Employees: $32,000 to $47,000Experienced Employees: $36,000 to $88,000
Where the Jobs Are• Education & Social Services • Mental Health Positions
12-Month Employer Growth Expectations
5% More
19% Less
76% Stay the Same
Employers Anticipate Decreasing Employment in Position by 1%
Benefits Offered by Employer
Yes No
Medical insurance 95% 5%
Dental insurance 90% 10%
Life insurance 79% 21%
Paid sick leave 89% 11%
Retirement plan 90% 10%
Paid vacation 92% 8%
Child care 11% 89%
Disability insurance 63% 37%
Percent of Benefits Covered by Employer
100% 99% to 51% 50% < 50%
Medical insurance 40% 43% 9% 9%
Dental insurance 41% 34% 9% 16%
Life insurance 56% 12% 16% 16%
Paid sick leave 91% 3% 0% 6%
Retirement plan 14% 31% 21% 34%
Paid vacation 94% 3% 3% 0%
Child care 50% 0% 0% 50%
Disability insurance 28% 33% 28% 11%
Mental Health and Substance Abuse Social Workers assess and treat individuals with mental, emotional, or substance abuse problems, including abuse of alcohol, tobacco, and/or other drugs. Their activities may include individual and group therapy, crisis intervention, case management, client advocacy, prevention, and education.
Mental Health and Substance Abuse Social Workers 21-1023
1,050
0
1,043 1,028- 1% growth
Current Number of Employees 12 Month Expected Number of Employees
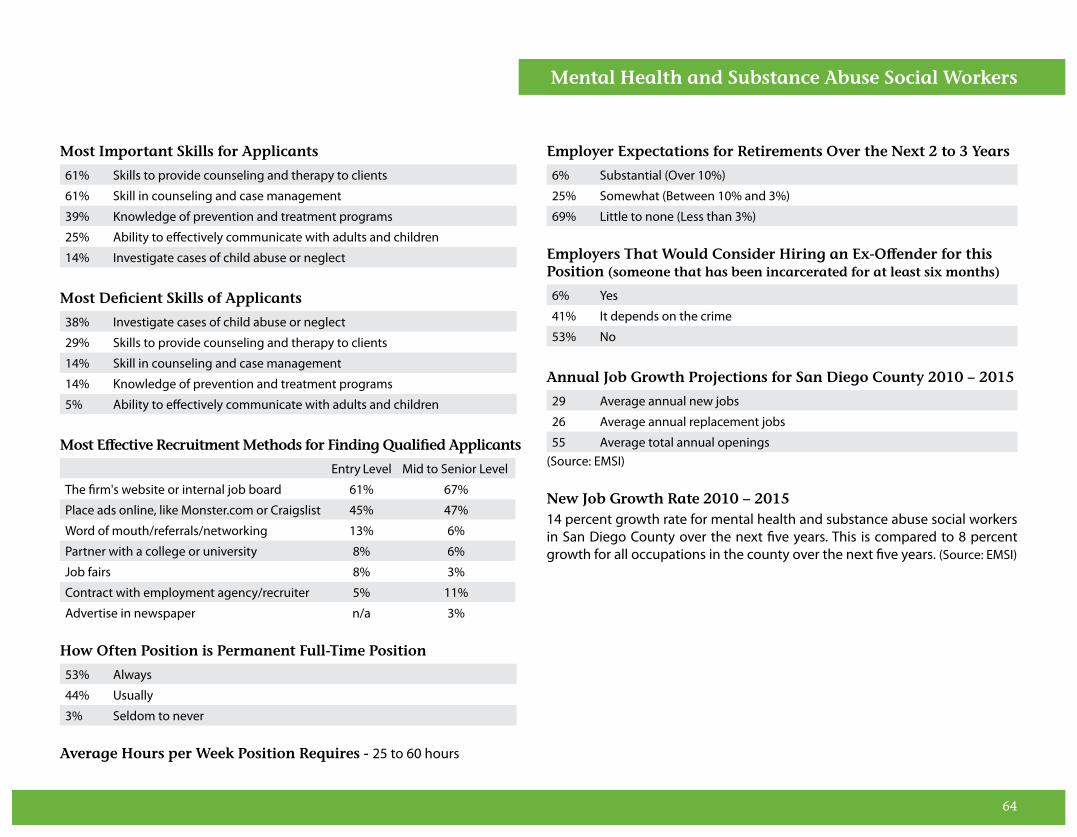
64
Most Important Skills for Applicants
61% Skills to provide counseling and therapy to clients
61% Skill in counseling and case management
39% Knowledge of prevention and treatment programs
25% Ability to effectively communicate with adults and children
14% Investigate cases of child abuse or neglect
Most Deficient Skills of Applicants
38% Investigate cases of child abuse or neglect
29% Skills to provide counseling and therapy to clients
14% Skill in counseling and case management
14% Knowledge of prevention and treatment programs
5% Ability to effectively communicate with adults and children
Most Effective Recruitment Methods for Finding Qualified Applicants
Entry Level Mid to Senior Level
The firm's website or internal job board 61% 67%
Place ads online, like Monster.com or Craigslist 45% 47%
Word of mouth/referrals/networking 13% 6%
Partner with a college or university 8% 6%
Job fairs 8% 3%
Contract with employment agency/recruiter 5% 11%
Advertise in newspaper n/a 3%
How Often Position is Permanent Full-Time Position
53% Always
44% Usually
3% Seldom to never
Average Hours per Week Position Requires - 25 to 60 hours
Employer Expectations for Retirements Over the Next 2 to 3 Years
6% Substantial (Over 10%)
25% Somewhat (Between 10% and 3%)
69% Little to none (Less than 3%)
Employers That Would Consider Hiring an Ex-Offender for this Position (someone that has been incarcerated for at least six months)
6% Yes
41% It depends on the crime
53% No
Annual Job Growth Projections for San Diego County 2010 – 2015
29 Average annual new jobs
26 Average annual replacement jobs
55 Average total annual openings(Source: EMSI)
New Job Growth Rate 2010 – 201514 percent growth rate for mental health and substance abuse social workers in San Diego County over the next five years. This is compared to 8 percent growth for all occupations in the county over the next five years. (Source: EMSI)
Mental Health and Substance Abuse Social Workers

65
Typical Education Requirements for This Occupation
35% Bachelor’s degree
65% Master’s or other graduate degree
Typical Level of Work Experience for This Occupation
12% No formal work experience required
24% Six months to 2 years in a related position
18% More than 2 years in a related position
18% Six months to 2 years in that specific position
29% More than 2 years in that specific position Pay Range – AnnualEntry-level Employees: $36,000 to $70,000Experienced Employees: $40,000 to $88,000
Where the Jobs Are• Education & Social Services • Mental Health Positions
12-Month Employer Growth Expectations
27% More
13% Less
60% Stay the Same
Employers Anticipate Increasing Employment in Position by 3%
Benefits Offered by Employer
Yes No
Medical insurance 100% 0%
Dental insurance 94% 6%
Life insurance 94% 6%
Paid sick leave 88% 12%
Retirement plan 94% 6%
Paid vacation 94% 6%
Child care 0% 100%
Disability insurance 61% 39%
Percent of Benefits Covered by Employer
100% 99% to 51% 50% < 50%
Medical insurance 31% 44% 13% 13%
Dental insurance 36% 36% 7% 21%
Life insurance 69% 0% 23% 8%
Paid sick leave 92% 0% 0% 8%
Retirement plan 9% 9% 9% 73%
Paid vacation 93% 0% 7% 0%
Child care 0% 0% 0% 0%
Disability insurance 57% 0% 29% 14%
Mental Health Counselors counsel individuals and groups to promote optimum mental health. They may help individuals deal with addictions and substance abuse; family, parenting, and marital problems; suicide; stress management; problems with self-esteem; and issues associated with aging and mental and emotional health. They counsel with emphasis on prevention.
Mental Health Counselors 21-1014
175
0
155 1603% growth
Current Number of Employees 12 Month Expected Number of Employees
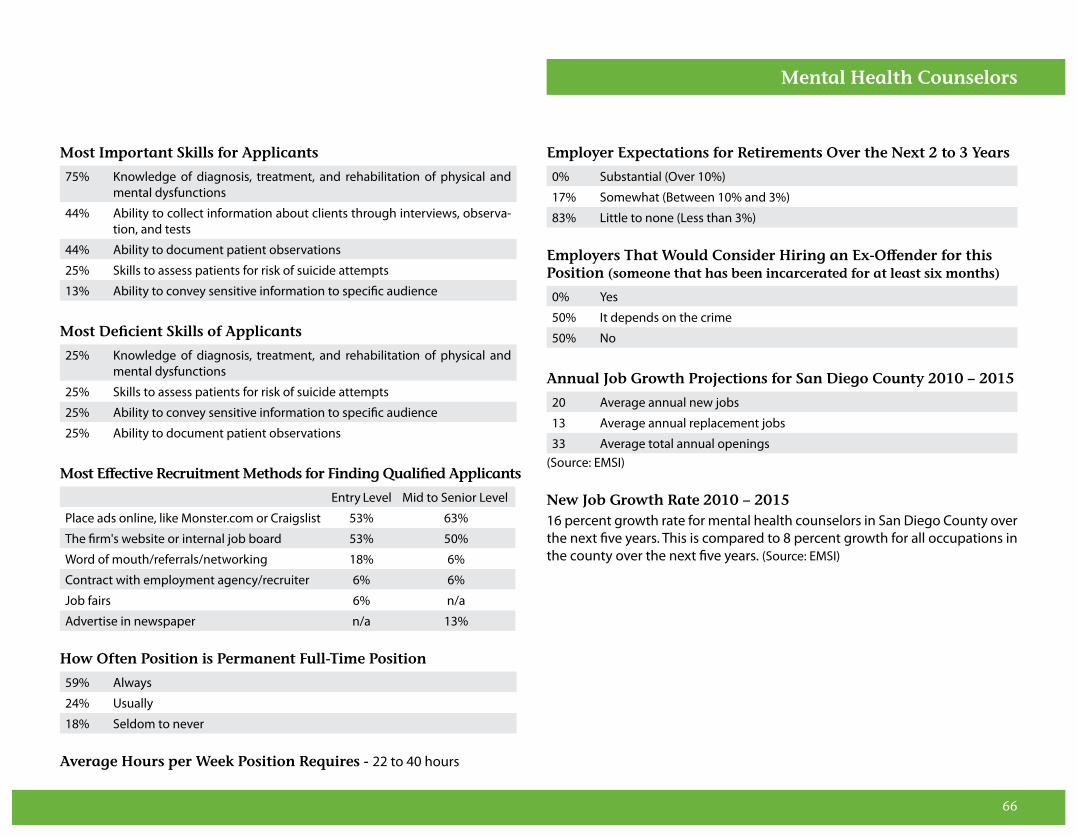
66
Most Important Skills for Applicants
75% Knowledge of diagnosis, treatment, and rehabilitation of physical and mental dysfunctions
44% Ability to collect information about clients through interviews, observa-tion, and tests
44% Ability to document patient observations
25% Skills to assess patients for risk of suicide attempts
13% Ability to convey sensitive information to specific audience
Most Deficient Skills of Applicants
25% Knowledge of diagnosis, treatment, and rehabilitation of physical and mental dysfunctions
25% Skills to assess patients for risk of suicide attempts
25% Ability to convey sensitive information to specific audience
25% Ability to document patient observations
Most Effective Recruitment Methods for Finding Qualified Applicants
Entry Level Mid to Senior Level
Place ads online, like Monster.com or Craigslist 53% 63%
The firm's website or internal job board 53% 50%
Word of mouth/referrals/networking 18% 6%
Contract with employment agency/recruiter 6% 6%
Job fairs 6% n/a
Advertise in newspaper n/a 13%
How Often Position is Permanent Full-Time Position
59% Always
24% Usually
18% Seldom to never
Average Hours per Week Position Requires - 22 to 40 hours
Employer Expectations for Retirements Over the Next 2 to 3 Years
0% Substantial (Over 10%)
17% Somewhat (Between 10% and 3%)
83% Little to none (Less than 3%)
Employers That Would Consider Hiring an Ex-Offender for this Position (someone that has been incarcerated for at least six months)
0% Yes
50% It depends on the crime
50% No
Annual Job Growth Projections for San Diego County 2010 – 2015
20 Average annual new jobs
13 Average annual replacement jobs
33 Average total annual openings(Source: EMSI)
New Job Growth Rate 2010 – 201516 percent growth rate for mental health counselors in San Diego County over the next five years. This is compared to 8 percent growth for all occupations in the county over the next five years. (Source: EMSI)
Mental Health Counselors
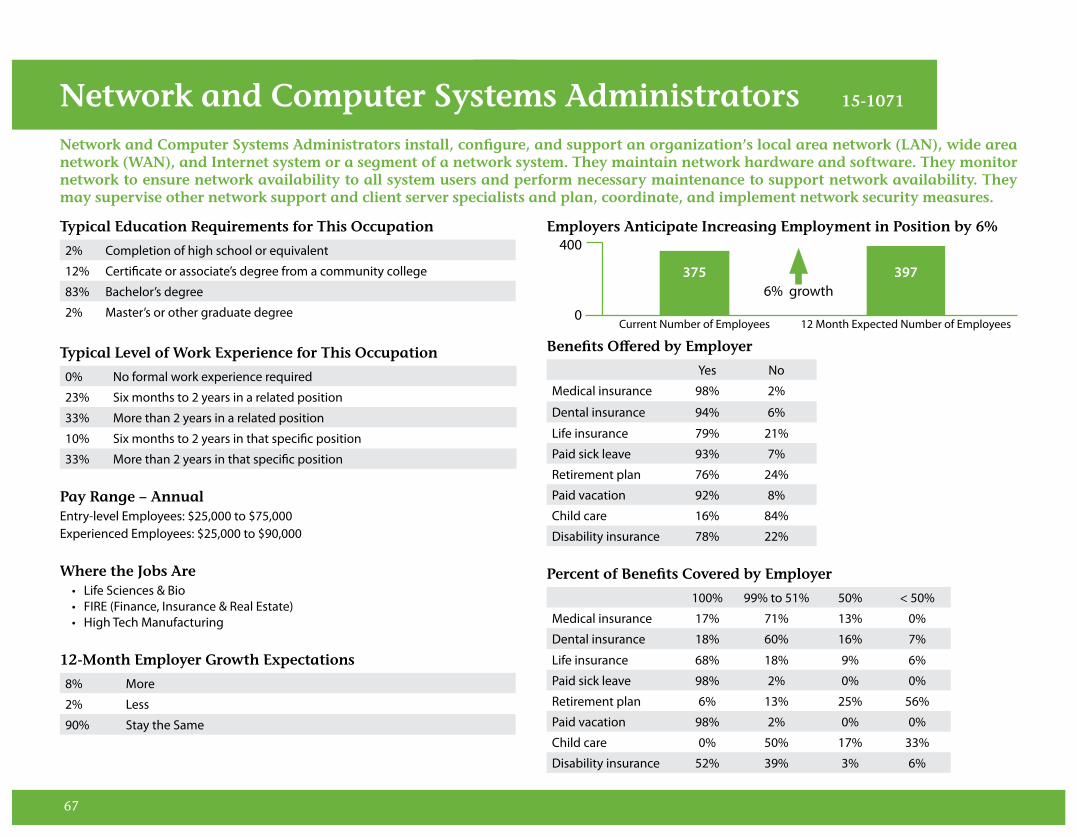
67
Typical Education Requirements for This Occupation
2% Completion of high school or equivalent
12% Certificate or associate’s degree from a community college
83% Bachelor’s degree
2% Master’s or other graduate degree
Typical Level of Work Experience for This Occupation
0% No formal work experience required
23% Six months to 2 years in a related position
33% More than 2 years in a related position
10% Six months to 2 years in that specific position
33% More than 2 years in that specific position Pay Range – AnnualEntry-level Employees: $25,000 to $75,000Experienced Employees: $25,000 to $90,000
Where the Jobs Are• Life Sciences & Bio • FIRE (Finance, Insurance & Real Estate) • High Tech Manufacturing
12-Month Employer Growth Expectations
8% More
2% Less
90% Stay the Same
Employers Anticipate Increasing Employment in Position by 6%
Benefits Offered by Employer
Yes No
Medical insurance 98% 2%
Dental insurance 94% 6%
Life insurance 79% 21%
Paid sick leave 93% 7%
Retirement plan 76% 24%
Paid vacation 92% 8%
Child care 16% 84%
Disability insurance 78% 22%
Percent of Benefits Covered by Employer
100% 99% to 51% 50% < 50%
Medical insurance 17% 71% 13% 0%
Dental insurance 18% 60% 16% 7%
Life insurance 68% 18% 9% 6%
Paid sick leave 98% 2% 0% 0%
Retirement plan 6% 13% 25% 56%
Paid vacation 98% 2% 0% 0%
Child care 0% 50% 17% 33%
Disability insurance 52% 39% 3% 6%
Network and Computer Systems Administrators install, configure, and support an organization’s local area network (LAN), wide area network (WAN), and Internet system or a segment of a network system. They maintain network hardware and software. They monitor network to ensure network availability to all system users and perform necessary maintenance to support network availability. They may supervise other network support and client server specialists and plan, coordinate, and implement network security measures.
Network and Computer Systems Administrators 15-1071
400
0
375 3976% growth
Current Number of Employees 12 Month Expected Number of Employees

68
Most Important Skills for Applicants
61% Ability to troubleshoot computer programs and systems
56% Knowledge of routing, firewalls and internet security standards.
53% Knowledge of LAN, WAN, and remote access
22% Skills to program computers using existing software
8% Ability to communicate technical issues in writing
Most Deficient Skills of Applicants
60% Ability to communicate technical issues in writing
20% Ability to troubleshoot computer programs and systems
16% Skills to program computers using existing software
4% Knowledge of routing, firewalls and internet security standards.
Most Effective Recruitment Methods for Finding Qualified Applicants
Entry Level Mid to Senior Level
The firm’s website or internal job board 47% 33%
Contract with employment agency/recruiter 40% 54%
Place ads online, like Monster.com/Craigslist 36% 26%
Partner with a college or university 15% 4%
Word of mouth/referrals/networking 13% 17%
LinkedIn or other social media sites 4% 7%
Job fairs 2% 2%
How Often Position is Permanent Full-Time Position
61% Always
33% Usually
7% Seldom to never
Average Hours per Week Position Requires - 20 to 50 hours
Employer Expectations for Retirements Over the Next 2 to 3 Years
0% Substantial (Over 10%)
14% Somewhat (Between 10% and 3%)
86% Little to none (Less than 3%)
Employers That Would Consider Hiring an Ex-Offender for this Position (someone that has been incarcerated for at least six months)
3% Yes
46% It depends on the crime
51% No
Annual Job Growth Projections for San Diego County 2010 – 2015
110 Average annual new jobs
051 Average annual replacement jobs
161 Average total annual openings(Source: EMSI)
New Job Growth Rate 2010 – 201518 percent growth rate for network and computer systems administrators in San Diego County over the next five years. This is compared to 8 percent growth for all occupations in the county over the next five years. (Source: EMSI)
Network and Computer Systems Administrators
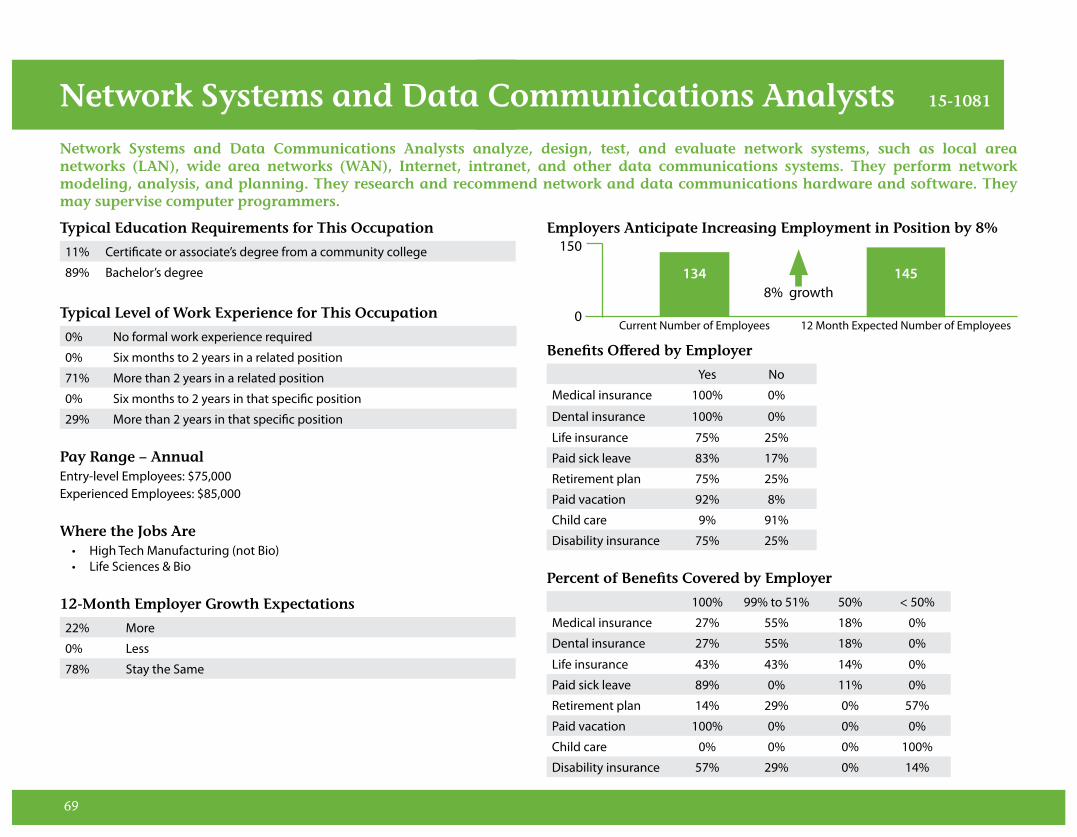
69
Typical Education Requirements for This Occupation
11% Certificate or associate’s degree from a community college
89% Bachelor’s degree
Typical Level of Work Experience for This Occupation
0% No formal work experience required
0% Six months to 2 years in a related position
71% More than 2 years in a related position
0% Six months to 2 years in that specific position
29% More than 2 years in that specific position Pay Range – AnnualEntry-level Employees: $75,000Experienced Employees: $85,000
Where the Jobs Are• High Tech Manufacturing (not Bio) • Life Sciences & Bio
12-Month Employer Growth Expectations
22% More
0% Less
78% Stay the Same
Employers Anticipate Increasing Employment in Position by 8%
Benefits Offered by Employer
Yes No
Medical insurance 100% 0%
Dental insurance 100% 0%
Life insurance 75% 25%
Paid sick leave 83% 17%
Retirement plan 75% 25%
Paid vacation 92% 8%
Child care 9% 91%
Disability insurance 75% 25%
Percent of Benefits Covered by Employer
100% 99% to 51% 50% < 50%
Medical insurance 27% 55% 18% 0%
Dental insurance 27% 55% 18% 0%
Life insurance 43% 43% 14% 0%
Paid sick leave 89% 0% 11% 0%
Retirement plan 14% 29% 0% 57%
Paid vacation 100% 0% 0% 0%
Child care 0% 0% 0% 100%
Disability insurance 57% 29% 0% 14%
Network Systems and Data Communications Analysts analyze, design, test, and evaluate network systems, such as local area networks (LAN), wide area networks (WAN), Internet, intranet, and other data communications systems. They perform network modeling, analysis, and planning. They research and recommend network and data communications hardware and software. They may supervise computer programmers.
Network Systems and Data Communications Analysts 15-1081
150
0
134 1458% growth
Current Number of Employees 12 Month Expected Number of Employees

70
Most Important Skills for Applicants
83% Ability to assist users to diagnose and solve data communication prob-lems
50% Ability to determine how a system should work and how changes in con-ditions, operations, and the environment will affect
33% Skills to maintain the peripherals that are connected to the network
33% Ability to monitor system performance and provide security measures, troubleshooting and maintenance as needed
Most Deficient Skills of Applicants
75% Ability to assist users to diagnose and solve data communication prob-lems
25% Ability to monitor system performance and provide security measures, troubleshooting and maintenance as needed
Most Effective Recruitment Methods for Finding Qualified Applicants
Entry Level Mid to Senior Level
Place ads online, like Monster.com/Craigslist 57% 50%
The firm's website or internal job board 43% 75%
Contract with employment agency/recruiter 29% 38%
Partner with a college or university 14% n/a
How Often Position is Permanent Full-Time Position
33% Always
67% Usually
0% Seldom to never
Average Hours per Week Position Requires - 40 to 50 hours
Employer Expectations for Retirements Over the Next 2 to 3 Years
0% Substantial (Over 10%)
40% Somewhat (Between 10% and 3%)
60% Little to none (Less than 3%)
Employers That Would Consider Hiring an Ex-Offender for this Position (someone that has been incarcerated for at least six months)
0% Yes
0% It depends on the crime
100% No
Annual Job Growth Projections for San Diego County 2010 – 2015
144 Average annual new jobs
041 Average annual replacement jobs
185 Average total annual openings(Source: EMSI)
New Job Growth Rate 2010 – 201532 percent growth rate for network systems and data communications ana-lysts in San Diego County over the next five years. This is compared to 8 per-cent growth for all occupations in the county over the next five years. (Source: EMSI)
Network Systems and Data Communications Analysts

71
Typical Education Requirements for This Occupation
30% Completion of high school or equivalent
70% Certificate or associate’s degree from a community college
Typical Level of Work Experience for This Occupation
25% No formal work experience required
33% Six months to 2 years in a related position
17% More than 2 years in a related position
25% Six months to 2 years in that specific position
0% More than 2 years in that specific position Pay Range – HourlyEntry-level Employees: $10.00 to $17.00 Experienced Employees: $10.00 to $22.00
Where the Jobs Are• Healthcare (non-dental)
12-Month Employer Growth Expectations
9% More
9% Less
82% Stay the Same
Employers Anticipate Decreasing Employment in Position by 0.4%
Benefits Offered by Employer
Yes No
Medical insurance 100% 0%
Dental insurance 73% 27%
Life insurance 50% 50%
Paid sick leave 73% 27%
Retirement plan 67% 33%
Paid vacation 92% 8%
Child care 17% 83%
Disability insurance 73% 27%
Percent of Benefits Covered by Employer
100% 99% to 51% 50% < 50%
Medical insurance 25% 50% 8% 17%
Dental insurance 14% 57% 29% 0%
Life insurance 33% 17% 17% 33%
Paid sick leave 100% 0% 0% 0%
Retirement plan 29% 0% 0% 71%
Paid vacation 89% 0% 0% 11%
Child care 0% 0% 50% 50%
Disability insurance 80% 0% 0% 20%
Nursing Aides, Orderlies, and Attendants provide basic patient care under direction of nursing staff; and they perform duties, such as feed, bathe, dress, groom, or move patients, or change linens.
Nursing Aides, Orderlies, and Attendants 31-1012
275
0
262 261-0.4% growth
Current Number of Employees 12 Month Expected Number of Employees

72
Most Important Skills for Applicants
45% Knowledge of basic nursing practices and procedures
45% Ability to perform patient observation
36% Ability to bathe, dress and groom patients
36% Ability to prepare patients for exams and treatments
36% Ability to maintain basic medical records
Most Deficient Skills of Applicants
33% Ability to prepare patients for exams and treatments
33% Ability to maintain basic medical records
22% Ability to perform patient observation
11% Ability to bathe, dress and groom patients
Most Effective Recruitment Methods for Finding Qualified Applicants
Entry Level Mid to Senior Level
Place ads online, like Monster.com or Craigslist 50% 64%
Contract with employment agency/recruiter 17% 9%
Partner with a college or university 17% 9%
The firm's website or internal job board 17% 9%
Word of mouth/referrals/networking 17% 9%
Job fairs 8% 9%
Advertise in newspaper 8% n/a
Firm does own recruiting/walk-ins 8% n/a
Promote from within n/a 9%
How Often Position is Permanent Full-Time Position
50% Always
25% Usually
25% Seldom to never
Average Hours per Week Position Requires - 11 to 40 hours
Employer Expectations for Retirements Over the Next 2 to 3 Years
9% Substantial (Over 10%)
18% Somewhat (Between 10% and 3%)
73% Little to none (Less than 3%)
Employers That Would Consider Hiring an Ex-Offender for this Position (someone that has been incarcerated for at least six months)
8% Yes
25% It depends on the crime
67% No
Annual Job Growth Projections for San Diego County 2010 – 2015
212 Average annual new jobs
086 Average annual replacement jobs
298 Average total annual openings(Source: EMSI)
New Job Growth Rate 2010 – 201512 percent growth rate for nursing aides, orderlies, and attendants in San Di-ego County over the next five years. This is compared to 8 percent growth for all occupations in the county over the next five years. (Source: EMSI)
Nursing Aides, Orderlies, and Attendants

73
Typical Education Requirements for This Occupation
89% Completion of high school or equivalent
11% Certificate or associate’s degree from a community college
Typical Level of Work Experience for This Occupation
18% No formal work experience required
31% Six months to 2 years in a related position
23% More than 2 years in a related position
5% Six months to 2 years in that specific position
23% More than 2 years in that specific position Pay Range – HourlyEntry-level Employees: $9.00 to $20.00Experienced Employees: $9.00 to $26.00
Where the Jobs Are• Construction • Wholesale, Transportation & Warehousing • Low-Tech Manufacturing
12-Month Employer Growth Expectations
15% More
0% Less
85% Stay the Same
Employers Anticipate Increasing Employment in Position by 9%
Benefits Offered by Employer
Yes No
Medical insurance 90% 10%
Dental insurance 79% 21%
Life insurance 65% 35%
Paid sick leave 82% 18%
Retirement plan 88% 13%
Paid vacation 90% 10%
Child care 0% 100%
Disability insurance 78% 18%
Percent of Benefits Covered by Employer
100% 99% to 51% 50% < 50%
Medical insurance 3% 64% 30% 3%
Dental insurance 7% 56% 26% 11%
Life insurance 55% 36% 0% 9%
Paid sick leave 90% 0% 3% 7%
Retirement plan 15% 11% 19% 56%
Paid vacation 97% 3% 0% 0%
Child care 0% 0% 0% 0%
Disability insurance 63% 25% 8% 4%
Painters, Construction and Maintenance workers paint walls, equipment, buildings, bridges, and other structural surfaces, using brushes, rollers, and spray guns.
Painters, Construction and Maintenance Workers 47-2141
815
0
736 8019% growth
Current Number of Employees 12 Month Expected Number of Employees
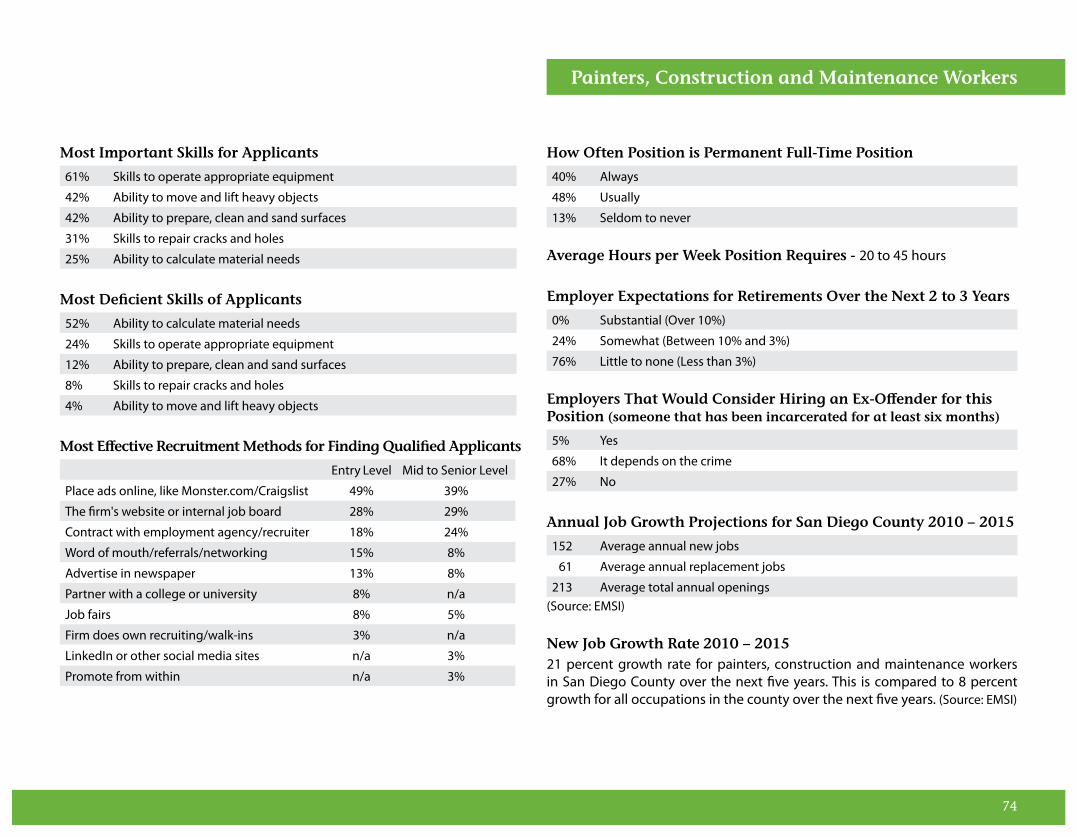
74
Most Important Skills for Applicants
61% Skills to operate appropriate equipment
42% Ability to move and lift heavy objects
42% Ability to prepare, clean and sand surfaces
31% Skills to repair cracks and holes
25% Ability to calculate material needs
Most Deficient Skills of Applicants
52% Ability to calculate material needs
24% Skills to operate appropriate equipment
12% Ability to prepare, clean and sand surfaces
8% Skills to repair cracks and holes
4% Ability to move and lift heavy objects
Most Effective Recruitment Methods for Finding Qualified Applicants
Entry Level Mid to Senior Level
Place ads online, like Monster.com/Craigslist 49% 39%
The firm's website or internal job board 28% 29%
Contract with employment agency/recruiter 18% 24%
Word of mouth/referrals/networking 15% 8%
Advertise in newspaper 13% 8%
Partner with a college or university 8% n/a
Job fairs 8% 5%
Firm does own recruiting/walk-ins 3% n/a
LinkedIn or other social media sites n/a 3%
Promote from within n/a 3%
How Often Position is Permanent Full-Time Position
40% Always
48% Usually
13% Seldom to never
Average Hours per Week Position Requires - 20 to 45 hours
Employer Expectations for Retirements Over the Next 2 to 3 Years
0% Substantial (Over 10%)
24% Somewhat (Between 10% and 3%)
76% Little to none (Less than 3%)
Employers That Would Consider Hiring an Ex-Offender for this Position (someone that has been incarcerated for at least six months)
5% Yes
68% It depends on the crime
27% No
Annual Job Growth Projections for San Diego County 2010 – 2015
152 Average annual new jobs
061 Average annual replacement jobs
213 Average total annual openings(Source: EMSI)
New Job Growth Rate 2010 – 201521 percent growth rate for painters, construction and maintenance workers in San Diego County over the next five years. This is compared to 8 percent growth for all occupations in the county over the next five years. (Source: EMSI)
Painters, Construction and Maintenance Workers

75
Typical Education Requirements for This Occupation
2% Completion of high school or equivalent
52% Certificate or associate’s degree from a community college
43% Bachelor’s degree
2% Master’s or other graduate degree
Typical Level of Work Experience for This Occupation
2% No formal work experience required
22% Six months to 2 years in a related position
27% More than 2 years in a related position
7% Six months to 2 years in that specific position
41% More than 2 years in that specific position Pay Range – AnnualEntry-level Employees: $25,000 to $60,000Experienced Employees: $25,000 to $80,000
Where the Jobs Are• Legal Services
12-Month Employer Growth Expectations
12% More
5% Less
84% Stay the Same
Employers Anticipate Increasing Employment in Position by 1%
Benefits Offered by Employer
Yes No
Medical insurance 93% 7%
Dental insurance 74% 26%
Life insurance 61% 39%
Paid sick leave 86% 14%
Retirement plan 81% 19%
Paid vacation 93% 7%
Child care 7% 93%
Disability insurance 62% 38%
Percent of Benefits Covered by Employer
100% 99% to 51% 50% < 50%
Medical insurance 57% 30% 8% 5%
Dental insurance 46% 36% 4% 14%
Life insurance 75% 8% 4% 13%
Paid sick leave 94% 3% 3% 0%
Retirement plan 18% 25% 18% 39%
Paid vacation 97% 3% 0% 0%
Child care 100% 0% 0% 0%
Disability insurance 55% 18% 14% 14%
Paralegals and Legal Assistants assist lawyers by researching legal precedent, investigating facts, or preparing legal documents. They conduct research to support a legal proceeding, to formulate a defense, or to initiate legal action.
Paralegals and Legal Assistants 23-2011
560
0
554 5581% growth
Current Number of Employees 12 Month Expected Number of Employees

76
Most Important Skills for Applicants
70% Skills to prepare legal briefs, correspondence, and documents
44% Ability to conduct legal research
42% Possession of a certificate in paralegal studies
28% Skills to prepare court reports and affidavits
16% Ability to interview clients and witnesses
Most Deficient Skills of Applicants
41% Ability to interview clients and witnesses
24% Skills to prepare court reports and affidavits
17% Ability to conduct legal research
14% Skills to prepare legal briefs, correspondence, and documents
3% Possession of a certificate in paralegal studies
Most Effective Recruitment Methods for Finding Qualified Applicants
Entry Level Mid to Senior Level
Place ads online, like Monster.com/Craigslist 51% 41%
Contract with employment agency/recruiter 33% 49%
Partner with a college or university 18% 14%
The firm's website or internal job board 18% 24%
Word of mouth/referrals/networking 10% 11%
Advertise in newspaper 3% n/a
How Often Position is Permanent Full-Time Position
76% Always
20% Usually
4% Seldom to never
Average Hours per Week Position Requires - 15 to 55 hours
Employer Expectations for Retirements Over the Next 2 to 3 Years
2% Substantial (Over 10%)
7% Somewhat (Between 10% and 3%)
91% Little to none (Less than 3%)
Employers That Would Consider Hiring an Ex-Offender for this Position (someone that has been incarcerated for at least six months)
3% Yes
35% It depends on the crime
63% No
Annual Job Growth Projections for San Diego County 2010 – 2015
097 Average annual new jobs
025 Average annual replacement jobs
122 Average total annual openings(Source: EMSI)
New Job Growth Rate 2010 – 201522 percent growth rate for paralegals and legal assistants in San Diego County over the next five years. This is compared to 8 percent growth for all occupa-tions in the county over the next five years. (Source: EMSI)
Paralegals and Legal Assistants

77
Typical Education Requirements for This Occupation
21% Completion of high school or equivalent
50% Certificate or associate’s degree from a community college
14% Bachelor’s degree
14% Master’s or other graduate degree
Typical Level of Work Experience for This Occupation
18% No formal work experience required
47% Six months to 2 years in a related position
18% More than 2 years in a related position
12% Six months to 2 years in that specific position
6% More than 2 years in that specific position Pay Range – HourlyEntry-level Employees: $8.00 to $20.00Experienced Employees: $8.00 to $22.00
Where the Jobs Are• Healthcare (non-dental) • Retail & Personal Services (lower skill)
12-Month Employer Growth Expectations
10% More
0% Less
90% Stay the Same
Employers Anticipate Increasing Employment in Position by 4%
Benefits Offered by Employer
Yes No
Medical insurance 100% 0%
Dental insurance 100% 0%
Life insurance 88% 13%
Paid sick leave 100% 0%
Retirement plan 92% 8%
Paid vacation 100% 0%
Child care 14% 86%
Disability insurance 92% 8%
Percent of Benefits Covered by Employer
100% 99% to 51% 50% < 50%
Medical insurance 0% 84% 11% 5%
Dental insurance 5% 70% 15% 10%
Life insurance 31% 25% 31% 13%
Paid sick leave 89% 0% 5% 5%
Retirement plan 11% 26% 32% 32%
Paid vacation 95% 5% 0% 0%
Child care 0% 0% 100% 0%
Disability insurance 33% 47% 20% 0%
Pharmacy Technicians prepare medications under the direction of a pharmacist. They may measure, mix, count out, label, and record amounts and dosages of medications.
Pharmacy Technicians 29-2052
350
0
316 3284% growth
Current Number of Employees 12 Month Expected Number of Employees
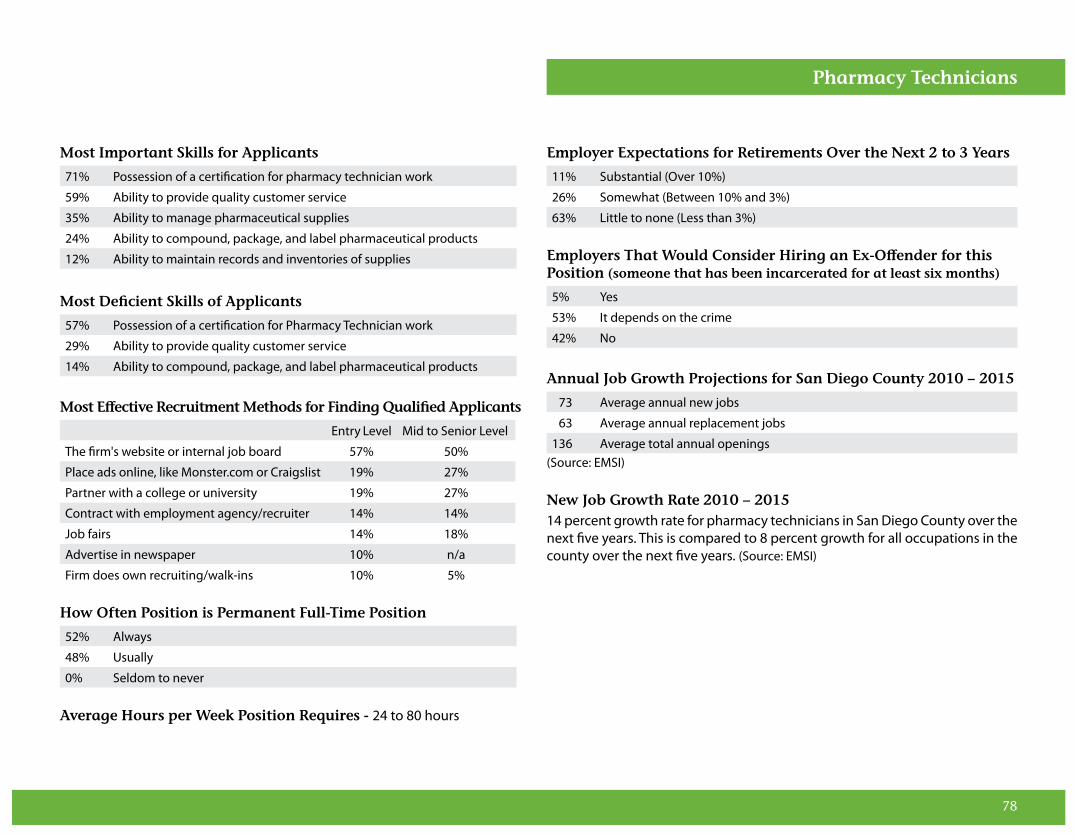
78
Most Important Skills for Applicants
71% Possession of a certification for pharmacy technician work
59% Ability to provide quality customer service
35% Ability to manage pharmaceutical supplies
24% Ability to compound, package, and label pharmaceutical products
12% Ability to maintain records and inventories of supplies
Most Deficient Skills of Applicants
57% Possession of a certification for Pharmacy Technician work
29% Ability to provide quality customer service
14% Ability to compound, package, and label pharmaceutical products
Most Effective Recruitment Methods for Finding Qualified Applicants
Entry Level Mid to Senior Level
The firm's website or internal job board 57% 50%
Place ads online, like Monster.com or Craigslist 19% 27%
Partner with a college or university 19% 27%
Contract with employment agency/recruiter 14% 14%
Job fairs 14% 18%
Advertise in newspaper 10% n/a
Firm does own recruiting/walk-ins 10% 5%
How Often Position is Permanent Full-Time Position
52% Always
48% Usually
0% Seldom to never
Average Hours per Week Position Requires - 24 to 80 hours
Employer Expectations for Retirements Over the Next 2 to 3 Years
11% Substantial (Over 10%)
26% Somewhat (Between 10% and 3%)
63% Little to none (Less than 3%)
Employers That Would Consider Hiring an Ex-Offender for this Position (someone that has been incarcerated for at least six months)
5% Yes
53% It depends on the crime
42% No
Annual Job Growth Projections for San Diego County 2010 – 2015
073 Average annual new jobs
063 Average annual replacement jobs
136 Average total annual openings(Source: EMSI)
New Job Growth Rate 2010 – 201514 percent growth rate for pharmacy technicians in San Diego County over the next five years. This is compared to 8 percent growth for all occupations in the county over the next five years. (Source: EMSI)
Pharmacy Technicians
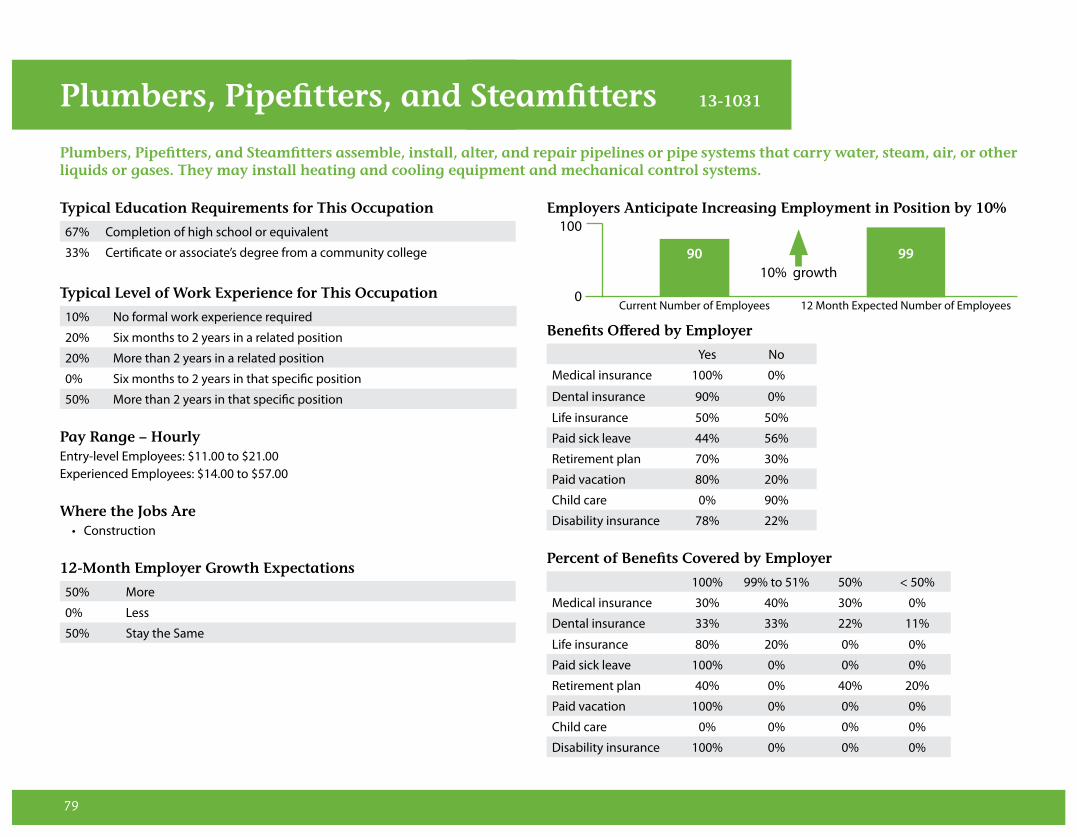
79
Typical Education Requirements for This Occupation
67% Completion of high school or equivalent
33% Certificate or associate’s degree from a community college
Typical Level of Work Experience for This Occupation
10% No formal work experience required
20% Six months to 2 years in a related position
20% More than 2 years in a related position
0% Six months to 2 years in that specific position
50% More than 2 years in that specific position Pay Range – HourlyEntry-level Employees: $11.00 to $21.00Experienced Employees: $14.00 to $57.00
Where the Jobs Are• Construction
12-Month Employer Growth Expectations
50% More
0% Less
50% Stay the Same
Employers Anticipate Increasing Employment in Position by 10%
Benefits Offered by Employer
Yes No
Medical insurance 100% 0%
Dental insurance 90% 0%
Life insurance 50% 50%
Paid sick leave 44% 56%
Retirement plan 70% 30%
Paid vacation 80% 20%
Child care 0% 90%
Disability insurance 78% 22%
Percent of Benefits Covered by Employer
100% 99% to 51% 50% < 50%
Medical insurance 30% 40% 30% 0%
Dental insurance 33% 33% 22% 11%
Life insurance 80% 20% 0% 0%
Paid sick leave 100% 0% 0% 0%
Retirement plan 40% 0% 40% 20%
Paid vacation 100% 0% 0% 0%
Child care 0% 0% 0% 0%
Disability insurance 100% 0% 0% 0%
Plumbers, Pipefitters, and Steamfitters assemble, install, alter, and repair pipelines or pipe systems that carry water, steam, air, or other liquids or gases. They may install heating and cooling equipment and mechanical control systems.
100
0
90 9910% growth
Current Number of Employees 12 Month Expected Number of Employees
Plumbers, Pipefitters, and Steamfitters 13-1031
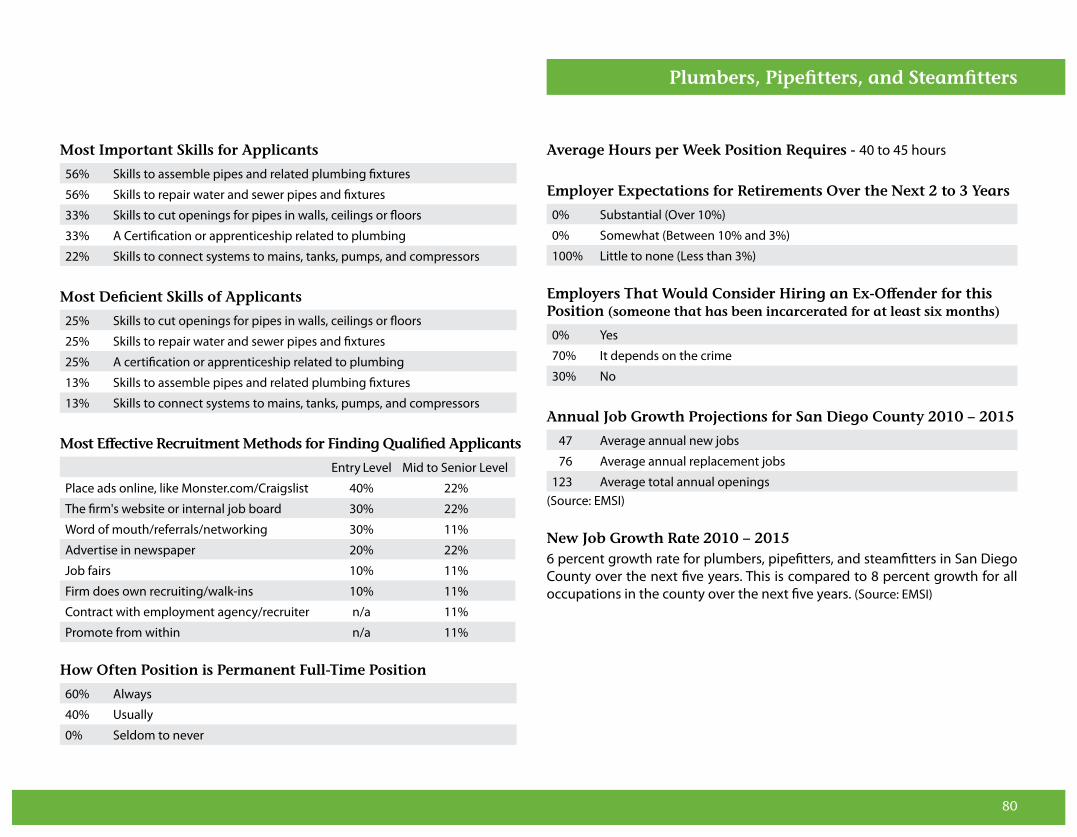
80
Most Important Skills for Applicants
56% Skills to assemble pipes and related plumbing fixtures
56% Skills to repair water and sewer pipes and fixtures
33% Skills to cut openings for pipes in walls, ceilings or floors
33% A Certification or apprenticeship related to plumbing
22% Skills to connect systems to mains, tanks, pumps, and compressors
Most Deficient Skills of Applicants
25% Skills to cut openings for pipes in walls, ceilings or floors
25% Skills to repair water and sewer pipes and fixtures
25% A certification or apprenticeship related to plumbing
13% Skills to assemble pipes and related plumbing fixtures
13% Skills to connect systems to mains, tanks, pumps, and compressors
Most Effective Recruitment Methods for Finding Qualified Applicants
Entry Level Mid to Senior Level
Place ads online, like Monster.com/Craigslist 40% 22%
The firm's website or internal job board 30% 22%
Word of mouth/referrals/networking 30% 11%
Advertise in newspaper 20% 22%
Job fairs 10% 11%
Firm does own recruiting/walk-ins 10% 11%
Contract with employment agency/recruiter n/a 11%
Promote from within n/a 11%
How Often Position is Permanent Full-Time Position
60% Always
40% Usually
0% Seldom to never
Average Hours per Week Position Requires - 40 to 45 hours
Employer Expectations for Retirements Over the Next 2 to 3 Years
0% Substantial (Over 10%)
0% Somewhat (Between 10% and 3%)
100% Little to none (Less than 3%)
Employers That Would Consider Hiring an Ex-Offender for this Position (someone that has been incarcerated for at least six months)
0% Yes
70% It depends on the crime
30% No
Annual Job Growth Projections for San Diego County 2010 – 2015
047 Average annual new jobs
076 Average annual replacement jobs
123 Average total annual openings(Source: EMSI)
New Job Growth Rate 2010 – 20156 percent growth rate for plumbers, pipefitters, and steamfitters in San Diego County over the next five years. This is compared to 8 percent growth for all occupations in the county over the next five years. (Source: EMSI)
Plumbers, Pipefitters, and Steamfitters

81
Typical Education Requirements for This Occupation
60% Completion of high school or equivalent
20% Certificate or associate’s degree from a community college
20% Bachelor’s degree
Typical Level of Work Experience for This Occupation
60% No formal work experience required
30% Six months to 2 years in a related position
10% More than 2 years in a related position
0% Six months to 2 years in that specific position
0% More than 2 years in that specific position Pay Range – AnnualEntry-level Employees: $46,000 to $60,000Experienced Employees: $46,000 to $72,000
Where the Jobs Are• Public Sector
12-Month Employer Growth Expectations
11% More
11% Less
78% Stay the Same
Employers Anticipate Increasing Employment in Position by 0.4%
Benefits Offered by Employer
Yes No
Medical insurance 100% 0%
Dental insurance 100% 0%
Life insurance 100% 0%
Paid sick leave 100% 0%
Retirement plan 100% 0%
Paid vacation 100% 0%
Child care 0% 100%
Disability insurance 100% 0%
Percent of Benefits Covered by Employer
100% 99% to 51% 50% < 50%
Medical insurance 10% 90% 0% 0%
Dental insurance 10% 70% 10% 10%
Life insurance 30% 40% 20% 10%
Paid sick leave 91% 9% 0% 0%
Retirement plan 10% 60% 20% 10%
Paid vacation 100% 0% 0% 0%
Child care 0% 0% 0% 0%
Disability insurance 50% 30% 20% 0%
Police and Sheriff’s Patrol Officers maintain order, enforce laws and ordinances, and protect life and property in an assigned patrol district. They perform combination of following duties: patrol a specific area on foot or in a vehicle; direct traffic; issue traffic summonses; investigate accidents; apprehend and arrest suspects, or serve legal processes of courts.
Police and Sheriff’s Patrol Officers 33-3051
2,675
0
2,655 2,6650.4% growth
Current Number of Employees 12 Month Expected Number of Employees

82
Most Important Skills for Applicants
67% Ability to enforce laws, ordinances, and regulations
33% Knowledge of arrest search seizure law
33% Ability to apply appropriate physical restraint
33% Ability to maintain firearms proficiency
33% Ability to conduct lawful interviews
Most Deficient Skills of Applicants
33% Knowledge of arrest search seizure law
33% Ability to maintain firearms proficiency
33% Ability to conduct lawful interviews
Most Effective Recruitment Methods for Finding Qualified Applicants
Entry Level Mid to Senior Level
The firm's website or internal job board 91% 45%
Place ads online, like Monster.com/Craigslist 27% 9%
Job fairs 18% 18%
Partner with a college or university 9% 9%
LinkedIn or other social media sites 9% n/a
Contract with employment agency/recruiter n/a 18%
How Often Position is Permanent Full-Time Position
78% Always
22% Usually
0% Seldom to never
Average Hours per Week Position Requires - 40 to 50 hours
Employer Expectations for Retirements Over the Next 2 to 3 Years
25% Substantial (Over 10%)
50% Somewhat (Between 10% and 3%)
25% Little to none (Less than 3%)
Employers That Would Consider Hiring an Ex-Offender for this Position (someone that has been incarcerated for at least six months)
0% Yes
0% It depends on the crime
100% No
Annual Job Growth Projections for San Diego County 2010 – 2015
097 Average annual new jobs
118 Average annual replacement jobs
215 Average total annual openings(Source: EMSI)
New Job Growth Rate 2010 – 201511 percent growth rate for police and sheriff’s patrol officers in San Diego County over the next five years. This is compared to 8 percent growth for all occupations in the county over the next five years. (Source: EMSI)
Police and Sheriff’s Patrol Officers

83
Registered Nurses 29-1111
Typical Education Requirements for This Occupation
28% Certificate or associate’s degree from a community college
64% Bachelor’s degree
8% Master’s or other graduate degree
Typical Level of Work Experience for This Occupation
0% No formal work experience required
42% Six months to 2 years in a related position
15% More than 2 years in a related position
19% Six months to 2 years in that specific position
23% More than 2 years in that specific position Pay Range – HourlyEntry-level Employees: $15.00 to $35.00 Experienced Employees: $18.00 to $45.00
Where the Jobs Are• General & Surgical Hospitals• Medical Offices• Outpatient Care Centers• Nursing Care Facilities
12-Month Employer Growth Expectations
25% More
4% Less
71% Stay the Same
Employers Anticipate Increasing Employment in Position by 4%
Benefits Offered by Employer
Yes No
Medical insurance 87% 13%
Dental insurance 77% 23%
Life insurance 69% 31%
Paid sick leave 76% 24%
Retirement plan 79% 21%
Paid vacation 93% 7%
Child care 11% 89%
Disability insurance 83% 17%
Percent of Benefits Covered by Employer
100% 99% to 51% 50% < 50%
Medical insurance 18% 50% 18% 14%
Dental insurance 24% 38% 14% 24%
Life insurance 56% 0% 25% 19%
Paid sick leave 90% 5% 5% 0%
Retirement plan 19% 19% 25% 38%
Paid vacation 100% 0% 0% 0%
Child care 0% 0% 0% 0%
Disability insurance 71% 7% 14% 7%
Registered Nurses assess patient health problems and needs, develop and implement nursing care plans, and maintain medical records. They administer nursing care to ill, injured, convalescent, or disabled patients. They may advise patients on health maintenance and disease prevention or provide case management.
625
0
597 6234% growth
Current Number of Employees 12 Month Expected Number of Employees

84
Most Important Skills for Applicants
62% Skills to administer medications & treatments as prescribed by physician
52% Skills to assist in examining and treating patients
43% Ability to monitor, record, and report symptoms
33% Skills to apply uniform medical tests and procedures
10% Ability to make initial medical diagnoses
Most Deficient Skills of Applicants
64% Ability to make initial medical diagnoses
21% Skills to assist in examining and treating patients
7% Skills to administer medications & treatments as prescribed by physician
7% Ability to monitor, record, and report symptoms
Most Effective Recruitment Methods for Finding Qualified Applicants
Entry Level Mid to Senior Level
Place ads online, like Monster.com or Craigslist 54% 62%
The firm's website or internal job board 29% 46%
Word of mouth/referrals/networking 21% 13%
Partner with a college or university 14% n/a
Advertise in newspaper 7% n/a
Job fairs 4% 4%
Firm does own recruiting/walk-ins 4% n/a
Contract with employment agency/recruiter n/a 15%
Job fairs n/a 4%
How Often Position is Permanent Full-Time Position
57% Always
25% Usually
18% Seldom to never
Average Hours per Week Position Requires - 5 to 40 hours
Employer Expectations for Retirements Over the Next 2 to 3 Years
7% Substantial (Over 10%)
11% Somewhat (Between 10% and 3%)
82% Little to none (Less than 3%)
Employers That Would Consider Hiring an Ex-Offender for this Position (someone that has been incarcerated for at least six months)
0% Yes
52% It depends on the crime
48% No
Annual Job Growth Projections for San Diego County 2010 – 2015
535 Average annual new jobs
371 Average annual replacement jobs
906 Average total annual openings(Source: EMSI)
New Job Growth Rate 2010 – 201513 percent growth rate for registered nurses in San Diego County over the next five years. This is compared to 8 percent growth for all occupations in the county over the next five years. (Source: EMSI)
Registered Nurses
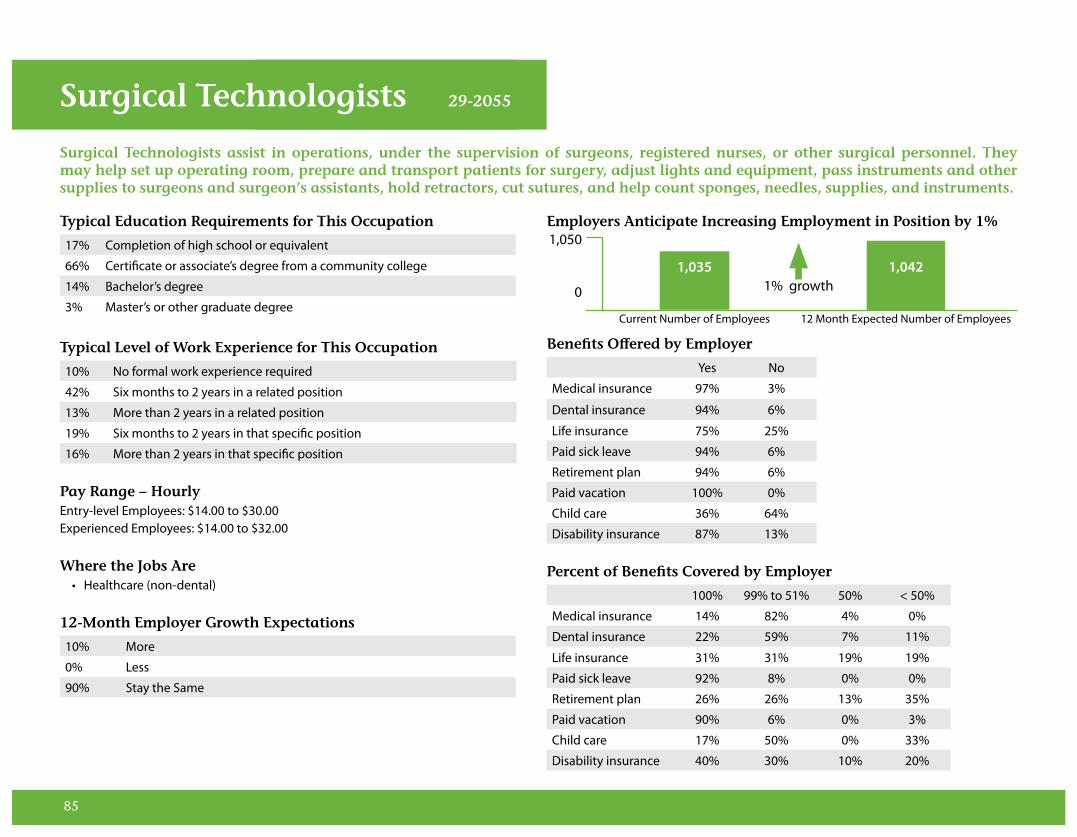
85
Typical Education Requirements for This Occupation
17% Completion of high school or equivalent
66% Certificate or associate’s degree from a community college
14% Bachelor’s degree
3% Master’s or other graduate degree
Typical Level of Work Experience for This Occupation
10% No formal work experience required
42% Six months to 2 years in a related position
13% More than 2 years in a related position
19% Six months to 2 years in that specific position
16% More than 2 years in that specific position Pay Range – HourlyEntry-level Employees: $14.00 to $30.00Experienced Employees: $14.00 to $32.00
Where the Jobs Are• Healthcare (non-dental)
12-Month Employer Growth Expectations
10% More
0% Less
90% Stay the Same
Employers Anticipate Increasing Employment in Position by 1%
Benefits Offered by Employer
Yes No
Medical insurance 97% 3%
Dental insurance 94% 6%
Life insurance 75% 25%
Paid sick leave 94% 6%
Retirement plan 94% 6%
Paid vacation 100% 0%
Child care 36% 64%
Disability insurance 87% 13%
Percent of Benefits Covered by Employer
100% 99% to 51% 50% < 50%
Medical insurance 14% 82% 4% 0%
Dental insurance 22% 59% 7% 11%
Life insurance 31% 31% 19% 19%
Paid sick leave 92% 8% 0% 0%
Retirement plan 26% 26% 13% 35%
Paid vacation 90% 6% 0% 3%
Child care 17% 50% 0% 33%
Disability insurance 40% 30% 10% 20%
Surgical Technologists assist in operations, under the supervision of surgeons, registered nurses, or other surgical personnel. They may help set up operating room, prepare and transport patients for surgery, adjust lights and equipment, pass instruments and other supplies to surgeons and surgeon’s assistants, hold retractors, cut sutures, and help count sponges, needles, supplies, and instruments.
Surgical Technologists 29-2055
1,050
0
1,035 1,0421% growth
Current Number of Employees 12 Month Expected Number of Employees

86
Most Important Skills for Applicants
59% Knowledge of surgical setup and support techniques
56% Ability to prepare supplies and equipment for surgery
56% Ability to anticipate needs of surgical team
28% Knowledge of clinical sterilizing techniques
Most Deficient Skills of Applicants
28% Ability to anticipate needs of surgical team
28% Ability to maintain medical supply records and inventories
22% Knowledge of surgical setup and support techniques
11% Ability to prepare supplies and equipment for surgery
11% Knowledge of clinical sterilizing techniques
Most Effective Recruitment Methods for Finding Qualified Applicants
Entry Level Mid to Senior Level
The firm's website or internal job board 59% 55%
Place ads online, like Monster.com or Craigslist 21% 29%
Job fairs 21% 13%
Contract with employment agency/recruiter 18% 32%
Word of mouth/referrals/networking 15% 13%
Partner with a college or university 12% 3%
Advertise in newspaper 6% 3%
LinkedIn or other social media sites n/a 3%
How Often Position is Permanent Full-Time Position
42% Always
45% Usually
13% Seldom to never
Average Hours per Week Position Requires - 25 to 65 hours
Employer Expectations for Retirements Over the Next 2 to 3 Years
4% Substantial (Over 10%)
18% Somewhat (Between 10% and 3%)
79% Little to none (Less than 3%)
Employers That Would Consider Hiring an Ex-Offender for this Position (someone that has been incarcerated for at least six months)
3% Yes
45% It depends on the crime
52% No
Annual Job Growth Projections for San Diego County 2010 – 2015
20 Average annual new jobs
20 Average annual replacement jobs
40 Average total annual openings(Source: EMSI)
New Job Growth Rate 2010 – 201513 percent growth rate for surgical technologists in San Diego County over the next five years. This is compared to 8 percent growth for all occupations in the county over the next five years. (Source: EMSI)
Surgical Technologists

87
Typical Education Requirements for This Occupation
3% Certificate or associate’s degree from a community college
73% Bachelor’s degree
24% Master’s or other graduate degree
Typical Level of Work Experience for This Occupation
23% No formal work experience required
17% Six months to 2 years in a related position
27% More than 2 years in a related position
13% Six months to 2 years in that specific position
20% More than 2 years in that specific position Pay Range – AnnualEntry-level Employees: $32,000 to $52,000Experienced Employees: $32,000 to $89,000
Where the Jobs Are• Education
12-Month Employer Growth Expectations
6% More
32% Less
61% Stay the Same
Employers Anticipate Decreasing Employment in Position by 5%
Benefits Offered by Employer
Yes No
Medical insurance 91% 9%
Dental insurance 86% 14%
Life insurance 76% 24%
Paid sick leave 91% 9%
Retirement plan 89% 11%
Paid vacation 85% 15%
Child care 12% 88%
Disability insurance 66% 34%
Percent of Benefits Covered by Employer
100% 99% to 51% 50% < 50%
Medical insurance 34% 55% 3% 7%
Dental insurance 57% 32% 4% 7%
Life insurance 43% 19% 19% 19%
Paid sick leave 93% 3% 0% 3%
Retirement plan 13% 29% 25% 33%
Paid vacation 96% 4% 0% 0%
Child care 67% 0% 0% 33%
Disability insurance 24% 41% 12% 24%
Middle School Teachers, Except Special and Vocational Education teach students in public or private schools in one or more subjects at the middle, intermediate, or junior high level, which falls between elementary and senior high school as defined by applicable State laws and regulations.
Teachers - Middle School, Except Special and Vocational Education 25-2022
1,050
0
1,047 996-5% growth
Current Number of Employees 12 Month Expected Number of Employees
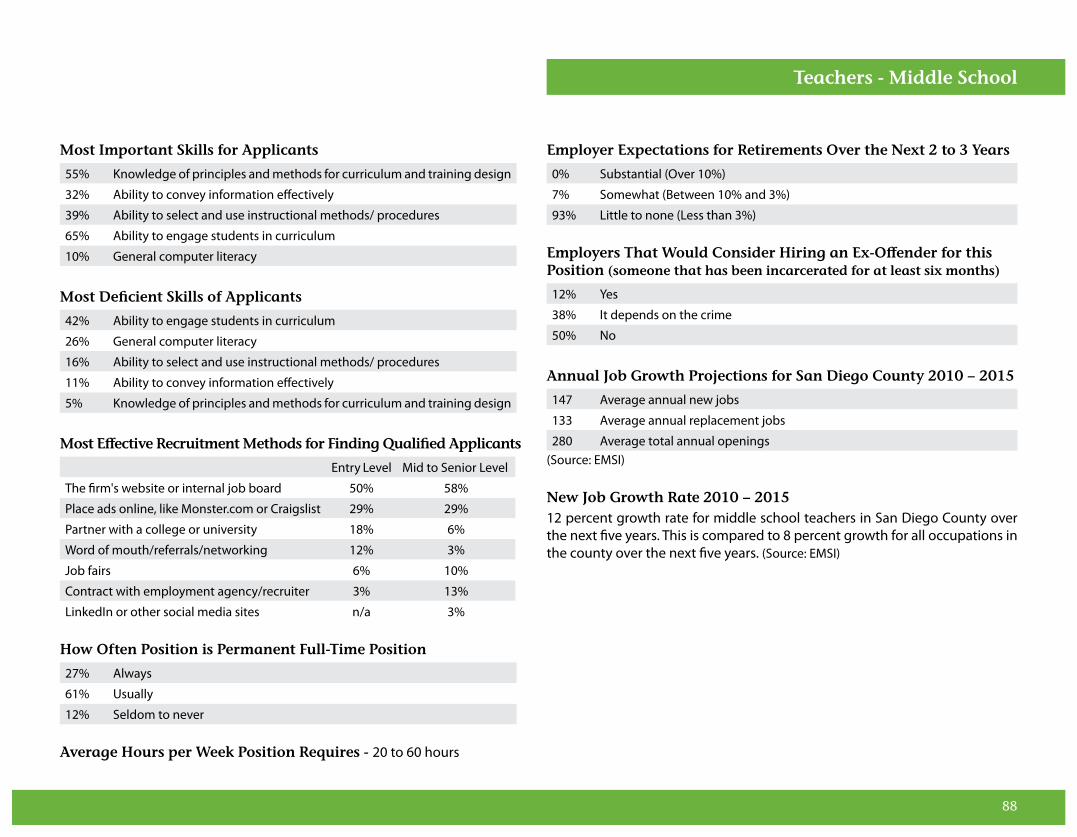
88
Most Important Skills for Applicants
55% Knowledge of principles and methods for curriculum and training design
32% Ability to convey information effectively
39% Ability to select and use instructional methods/ procedures
65% Ability to engage students in curriculum
10% General computer literacy
Most Deficient Skills of Applicants
42% Ability to engage students in curriculum
26% General computer literacy
16% Ability to select and use instructional methods/ procedures
11% Ability to convey information effectively
5% Knowledge of principles and methods for curriculum and training design
Most Effective Recruitment Methods for Finding Qualified Applicants
Entry Level Mid to Senior Level
The firm's website or internal job board 50% 58%
Place ads online, like Monster.com or Craigslist 29% 29%
Partner with a college or university 18% 6%
Word of mouth/referrals/networking 12% 3%
Job fairs 6% 10%
Contract with employment agency/recruiter 3% 13%
LinkedIn or other social media sites n/a 3%
How Often Position is Permanent Full-Time Position
27% Always
61% Usually
12% Seldom to never
Average Hours per Week Position Requires - 20 to 60 hours
Employer Expectations for Retirements Over the Next 2 to 3 Years
0% Substantial (Over 10%)
7% Somewhat (Between 10% and 3%)
93% Little to none (Less than 3%)
Employers That Would Consider Hiring an Ex-Offender for this Position (someone that has been incarcerated for at least six months)
12% Yes
38% It depends on the crime
50% No
Annual Job Growth Projections for San Diego County 2010 – 2015
147 Average annual new jobs
133 Average annual replacement jobs
280 Average total annual openings(Source: EMSI)
New Job Growth Rate 2010 – 201512 percent growth rate for middle school teachers in San Diego County over the next five years. This is compared to 8 percent growth for all occupations in the county over the next five years. (Source: EMSI)
Teachers - Middle School
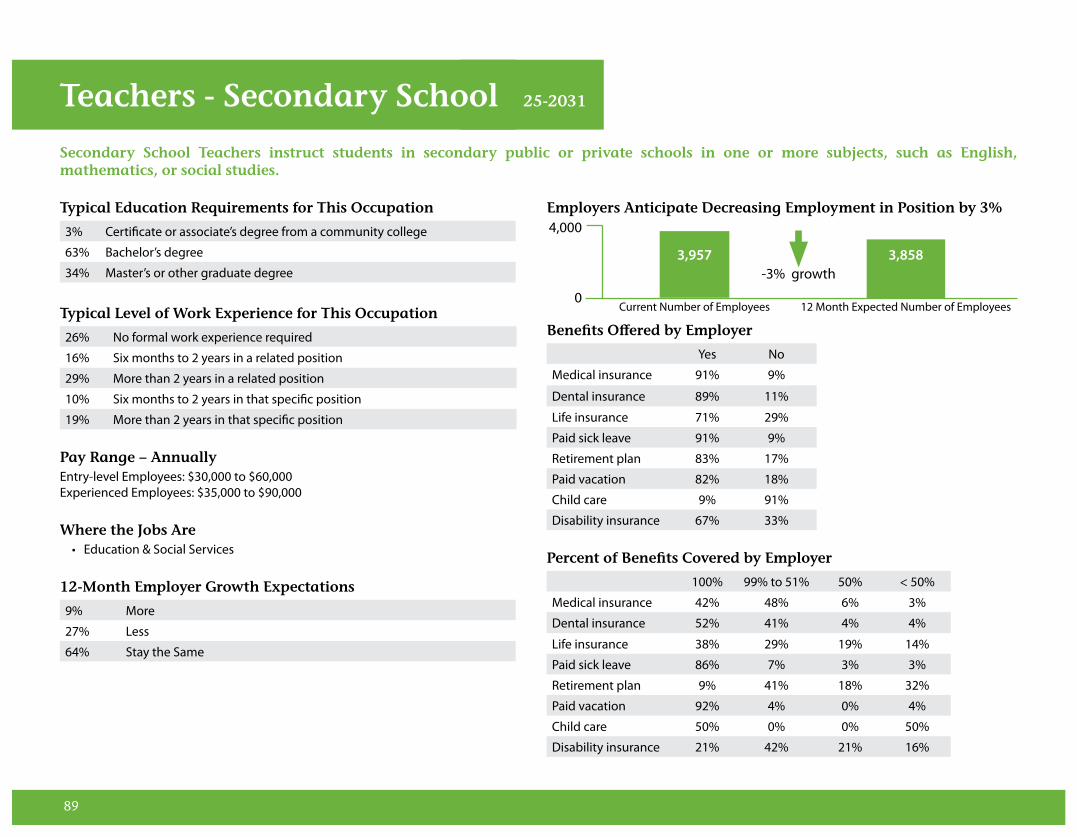
89
Secondary School Teachers instruct students in secondary public or private schools in one or more subjects, such as English, mathematics, or social studies.
Teachers - Secondary School 25-2031
Typical Education Requirements for This Occupation
3% Certificate or associate’s degree from a community college
63% Bachelor’s degree
34% Master’s or other graduate degree
Typical Level of Work Experience for This Occupation
26% No formal work experience required
16% Six months to 2 years in a related position
29% More than 2 years in a related position
10% Six months to 2 years in that specific position
19% More than 2 years in that specific position Pay Range – Annually Entry-level Employees: $30,000 to $60,000Experienced Employees: $35,000 to $90,000
Where the Jobs Are• Education & Social Services
12-Month Employer Growth Expectations
9% More
27% Less
64% Stay the Same
Employers Anticipate Decreasing Employment in Position by 3%
Benefits Offered by Employer
Yes No
Medical insurance 91% 9%
Dental insurance 89% 11%
Life insurance 71% 29%
Paid sick leave 91% 9%
Retirement plan 83% 17%
Paid vacation 82% 18%
Child care 9% 91%
Disability insurance 67% 33%
Percent of Benefits Covered by Employer
100% 99% to 51% 50% < 50%
Medical insurance 42% 48% 6% 3%
Dental insurance 52% 41% 4% 4%
Life insurance 38% 29% 19% 14%
Paid sick leave 86% 7% 3% 3%
Retirement plan 9% 41% 18% 32%
Paid vacation 92% 4% 0% 4%
Child care 50% 0% 0% 50%
Disability insurance 21% 42% 21% 16%
4,000
0
3,957 3,858-3% growth
Current Number of Employees 12 Month Expected Number of Employees

90
Most Important Skills for Applicants
57% Knowledge of classroom management techniques
47% Skills to develop course materials and curriculum content
47% Skills to evaluate the progress of students
40% Ability to prepare lesson plans and outlines
10% Ability to participate in staff meetings, educational conferences, and workshops
Most Deficient Skills of Applicants
29% Skills to evaluate the progress of students
24% Knowledge of classroom management techniques
24% Ability to participate in staff meetings, educational conferences, and workshops
19% Skills to develop course materials and curriculum content
5% Ability to prepare lesson plans and outlines
Most Effective Recruitment Methods for Finding Qualified Applicants
Entry Level Mid to Senior Level
The firm's website or internal job board 59% 67%
Place ads online, like Monster.com or Craigslist 26% 24%
Partner with a college or university 15% 6%
Word of mouth/referrals/networking 9% n/a
Job fairs 6% 6%
Contract with employment agency/recruiter 3% 12%
LinkedIn or other social media sites n/a 3%
How Often Position is Permanent Full-Time Position
25% Always
56% Usually
19% Seldom to never
Average Hours per Week Position Requires - 16 to 50 hours
Employer Expectations for Retirements Over the Next 2 to 3 Years
15% Substantial (Over 10%)
44% Somewhat (Between 10% and 3%)
41% Little to none (Less than 3%)
Employers That Would Consider Hiring an Ex-Offender for this Position (someone that has been incarcerated for at least six months)
6% Yes
35% It depends on the crime
58% No
Annual Job Growth Projections for San Diego County 2010 – 2015
193 Average annual new jobs
304 Average annual replacement jobs
497 Average total annual openings(Source: EMSI)
New Job Growth Rate 2010 – 20159 percent growth rate for secondary school teachers in San Diego County over the next five years. This is compared to 8 percent growth for all occupations in the county over the next five years. (Source: EMSI)
Teachers - Secondary School

91
Typical Education Requirements for This Occupation
87% Completion of high school or equivalent
13% Certificate or associate’s degree from a community college
Typical Level of Work Experience for This Occupation
6% No formal work experience required
21% Six months to 2 years in a related position
35% More than 2 years in a related position
6% Six months to 2 years in that specific position
32% More than 2 years in that specific position Pay Range – HourlyEntry-level Employees: $9.00 to $20.00Experienced Employees: $9.00 to $23.00
Where the Jobs Are• Low-Tech Manufacturing • Wholesale, Transportation & Warehousing
12-Month Employer Growth Expectations
32% More
6% Less
62% Stay the Same
Employers Anticipate Increasing Employment in Position by 7%
Benefits Offered by Employer
Yes No
Medical insurance 94% 6%
Dental insurance 88% 12%
Life insurance 65% 35%
Paid sick leave 88% 12%
Retirement plan 79% 21%
Paid vacation 97% 3%
Child care 3% 97%
Disability insurance 71% 29%
Percent of Benefits Covered by Employer
100% 99% to 51% 50% < 50%
Medical insurance 14% 61% 21% 4%
Dental insurance 7% 44% 26% 22%
Life insurance 68% 16% 0% 16%
Paid sick leave 97% 3% 0% 0%
Retirement plan 8% 13% 17% 63%
Paid vacation 97% 3% 0% 0%
Child care 0% 0% 0% 100%
Disability insurance 65% 15% 0% 20%
Truck Drivers, Heavy Tractor Trailer drive a tractor-trailer combination or a truck with a capacity of at least 26,000 GVW, to transport and deliver goods, livestock, or materials in liquid, loose, or packaged form.
Truck Drivers, Heavy Tractor Trailer 53-3032
760
0
707 7597% growth
Current Number of Employees 12 Month Expected Number of Employees
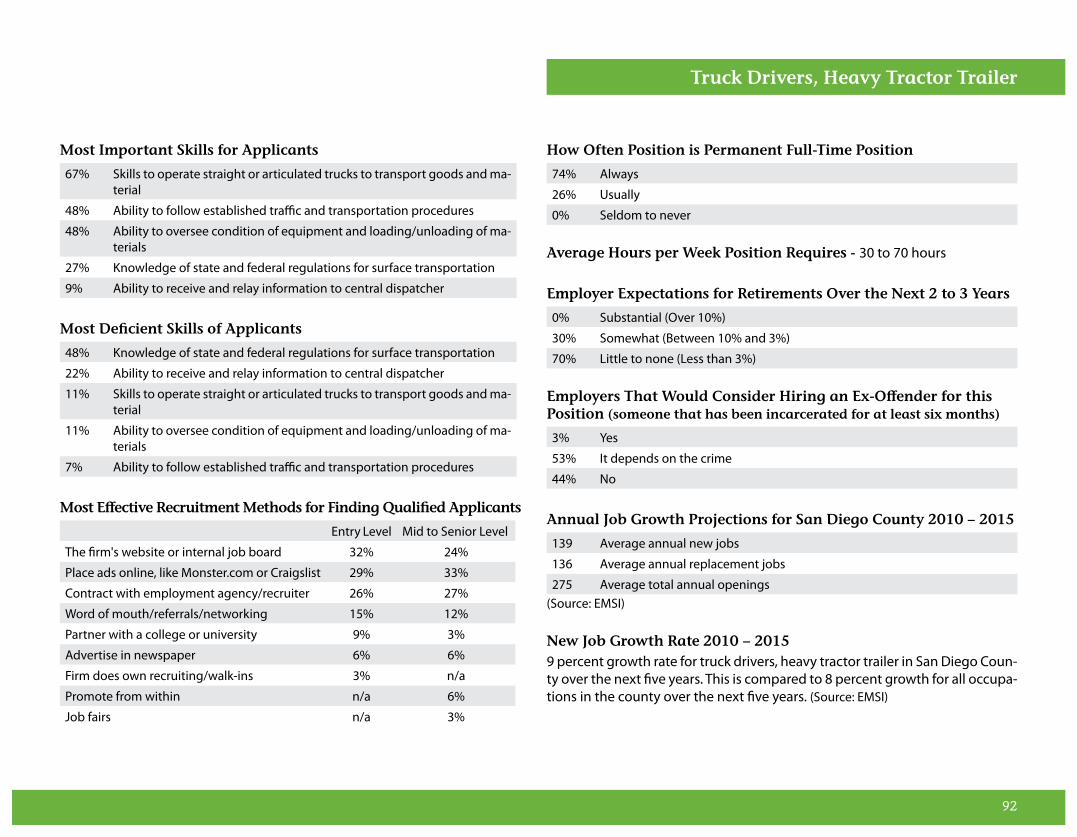
92
Most Important Skills for Applicants
67% Skills to operate straight or articulated trucks to transport goods and ma-terial
48% Ability to follow established traffic and transportation procedures
48% Ability to oversee condition of equipment and loading/unloading of ma-terials
27% Knowledge of state and federal regulations for surface transportation
9% Ability to receive and relay information to central dispatcher
Most Deficient Skills of Applicants
48% Knowledge of state and federal regulations for surface transportation
22% Ability to receive and relay information to central dispatcher
11% Skills to operate straight or articulated trucks to transport goods and ma-terial
11% Ability to oversee condition of equipment and loading/unloading of ma-terials
7% Ability to follow established traffic and transportation procedures
Most Effective Recruitment Methods for Finding Qualified Applicants
Entry Level Mid to Senior Level
The firm's website or internal job board 32% 24%
Place ads online, like Monster.com or Craigslist 29% 33%
Contract with employment agency/recruiter 26% 27%
Word of mouth/referrals/networking 15% 12%
Partner with a college or university 9% 3%
Advertise in newspaper 6% 6%
Firm does own recruiting/walk-ins 3% n/a
Promote from within n/a 6%
Job fairs n/a 3%
How Often Position is Permanent Full-Time Position
74% Always
26% Usually
0% Seldom to never
Average Hours per Week Position Requires - 30 to 70 hours
Employer Expectations for Retirements Over the Next 2 to 3 Years
0% Substantial (Over 10%)
30% Somewhat (Between 10% and 3%)
70% Little to none (Less than 3%)
Employers That Would Consider Hiring an Ex-Offender for this Position (someone that has been incarcerated for at least six months)
3% Yes
53% It depends on the crime
44% No
Annual Job Growth Projections for San Diego County 2010 – 2015
139 Average annual new jobs
136 Average annual replacement jobs
275 Average total annual openings(Source: EMSI)
New Job Growth Rate 2010 – 20159 percent growth rate for truck drivers, heavy tractor trailer in San Diego Coun-ty over the next five years. This is compared to 8 percent growth for all occupa-tions in the county over the next five years. (Source: EMSI)
Truck Drivers, Heavy Tractor Trailer

3910 University AvenueSuite 400
San Diego, CA 92105
(619) 228-2900(619) 228-2983 TDD
www.workforce.org