occupational outlook for various programs of study
TRANSCRIPT
OCCUPATIONAL OUTLOOK FOR VARIOUS
PROGRAMS OF STUDY COMPLETION TRENDS IN SOUTH CAROLINA
HIGHER EDUCATION, 2009/10-2013/14
APRIL 2016
REPORT BY: ERICA VON NESSEN, PH.D.
1 1 2 2 L A D Y S T . S U I T E 3 0 0 C O L U M B I A , S C 2 9 2 0 1
1 4-7-2016
E X E C U T I V E S U M M A RY Students, higher education leaders, and policymakers across South Carolina and across the nation are becoming increasingly concerned about potential mismatches in the labor market between the jobs available and the individuals with the skills to fill them. This report examines the issue from three perspectives for the state of South Carolina:
1. What are the most popular programs of studies for students graduating from the state’s public and independent colleges and universities, and what is the occupational outlook for those types of credentials?
2. What are the fastest growing occupations according to projections from the South Carolina Department of Employment and Workforce (DEW), and what have been the trends in the number of individuals graduating with degrees that could fill those types of jobs?
3. What are the current trends in the number of graduates in instructional programs classified as “STEM” fields and what are the likely number of job openings for those individuals in South Carolina through 2022? All of these approaches can help to identify areas of mismatch resulting in possible shortages or
potential surpluses of skilled labor. For institutions required to track the labor market outcomes of their graduates, this information may help them to evaluate whether the current availability and size of their programs is consistent with future market demand.
Based on South Carolina public and independent institution program completion data from
2009/10-2013/14 and the projected growth rates of occupations through 2022 prepared by DEW, the following potential imbalances were identified:
• Five very popular areas of study (as measured by total number of completions) are
associated with occupations that are expected to experience employment growth of less than 10 percent by 2022. They include:
o Biology, o Social Work, o Psychology,
o English, and o History
o Although this may imply a potential oversupply of these graduates, it is also necessary to take into account potential caveats such as their ability to work in other related fields that may have faster growth rates.
• Programs of study that fall below the top 15 most popular in the state but that have aggressive projected job growth of over 20 percent include:
o Marketing/Marketing Management, General and o Heating, Air, Ventilation, and Refrigerator Maintenance Technicians
Looking from the opposing perspective, amongst the occupations (requiring some form of higher
education) that are projected to have the fast or large degree of growth through 2022, there are seven that
2 4-7-2016
appear to have possible mismatches with the supply of graduates from SC’s public and independent institutions:
• Physical Therapists, • Medical and Clinical Laboratory Technicians, • Dental Hygienists, • Dental Assistants, • Medical Assistants, • Middle School Teachers, and • Nursing Assistants
Finally, examining trends in completions in STEM fields and the projected job openings for STEM occupations shows potential shortfalls of SC graduates in the following areas:
• Medical and Clinical Laboratory Technologists,
• Medical and Clinical Laboratory Technicians,
• Aerospace Engineers, • Nuclear Engineers, • Industrial Engineers, • Avionic Technicians,
• Nuclear Technicians, • Environmental Engineers, • Material Scientists, • Computer Programmers
(Computer Science), and • Chemical Technicians
While these are the trends seen in current data, it is important to note that there are limitations of the crosswalk between instructional program codes and occupational codes as well as rapid changes in the job market that may not be fully reflected in available employment projections. Thus, these findings should be viewed as a starting point for further investigation into particular programs of study where imbalances may exist.
3 4-7-2016
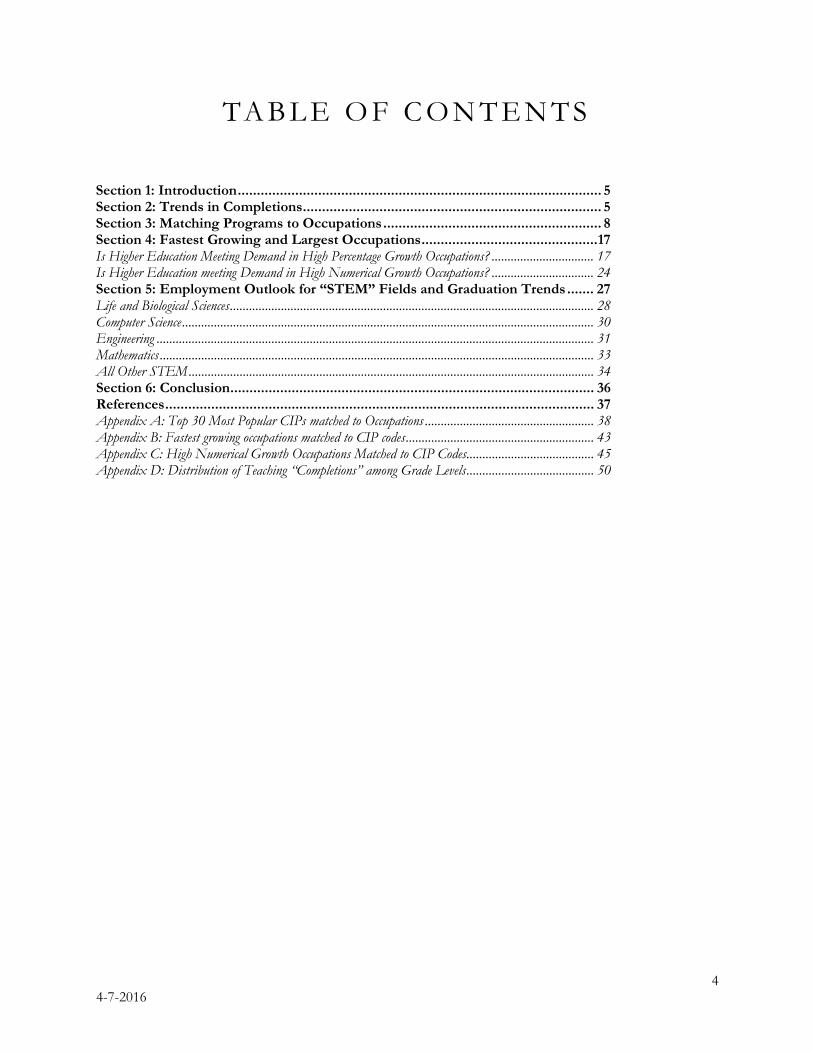
TA B L E O F C O N T E N T S
Section 1: Introduction ............................................................................................... 5 Section 2: Trends in Completions .............................................................................. 5 Section 3: Matching Programs to Occupations ......................................................... 8 Section 4: Fastest Growing and Largest Occupations .............................................. 17 Is Higher Education Meeting Demand in High Percentage Growth Occupations? ................................ 17 Is Higher Education meeting Demand in High Numerical Growth Occupations? ................................ 24 Section 5: Employment Outlook for “STEM” Fields and Graduation Trends ....... 27 Life and Biological Sciences .................................................................................................................. 28 Computer Science ................................................................................................................................. 30 Engineering ......................................................................................................................................... 31 Mathematics ........................................................................................................................................ 33 All Other STEM ............................................................................................................................... 34 Section 6: Conclusion ............................................................................................... 36 References ................................................................................................................ 37 Appendix A: Top 30 Most Popular CIPs matched to Occupations ..................................................... 38 Appendix B: Fastest growing occupations matched to CIP codes ........................................................... 43 Appendix C: High Numerical Growth Occupations Matched to CIP Codes ........................................ 45 Appendix D: Distribution of Teaching “Completions” among Grade Levels ........................................ 50
4 4-7-2016

O C C U PAT I O N A L O U T L O O K F O R
VA R I O U S P RO G R A M S O F S T U DY COMPLETION TRENDS IN SOUTH CAROLINA HIGHER EDUCATION, 2009/10-
2013/14
SECTION 1 : INTRODUCTION
To obtain a stable, high-paying job in the 21st century, it is increasingly necessary to have some level of higher education. Educational requirements vary widely from some high school to associate’s degrees through doctoral and professional degrees. The companion study to this piece, “Higher Education Enrollment,” provides a sense of the growth in public undergraduate and graduate student enrollment through the year 2023, but it does not address trends in the programs of study that college students are choosing. Higher education is increasingly important to achieve positive job prospects, but it is also important to consider the subject and degree level of education being received.
This report uses completion data from South Carolina’s public and independent colleges and universities to facilitate the discussion on whether the state’s higher education system is producing individuals trained in fields of study that are likely to remain in high demand throughout the next decade.
Section 2 will provide background information on the top 30 areas of study based on the number of completions between fiscal years 2009-10 and 2013-14. Section 3 will use Bureau of Labor Statistics (BLS) and the National Center for Education Statistics (NCES) information to match these areas of study to their most likely occupations and explore the employment outlook for each of the occupations. Section 4 explores the projected fastest growing occupations through 2022 and what type of education may be necessary to meet that needs. Section 5 explores current workforce and graduation trends in areas designated as part of STEM fields. Section 6 concludes.
SECTION 2: T RENDS IN COMPLETIONS
In the companion report to this piece, South Carolina Higher Education Enrollment Projections 2015-2023, forecasts of the number of students expected to be enrolled in the state’s public colleges and universities were presented for four sectors at the undergraduate level and two sectors at the graduate level. While overall enrollment projections may be useful for aggregate level planning for infrastructure and other system-wide budgeting, more detailed information about the types of programs being completed and their employment prospects will help policy makers determine if there are areas for improvement.
Standard Occupational Classification (SOC) codes are a system used by Federal agencies to classify workers into occupational categories. There are 840 detailed occupations available according to their occupational definition which can be combined into 461 broad occupations, 97 minor groups, and 23 major groups. The Classification of Instructional Programs (CIP) was developed by the US Department of
5 4-7-2016
Education’s NCES to provide a system for accurate tracking and reporting of fields of study and program completions. The NCES and the BLS have generated a crosswalk between SOC codes and CIP codes.
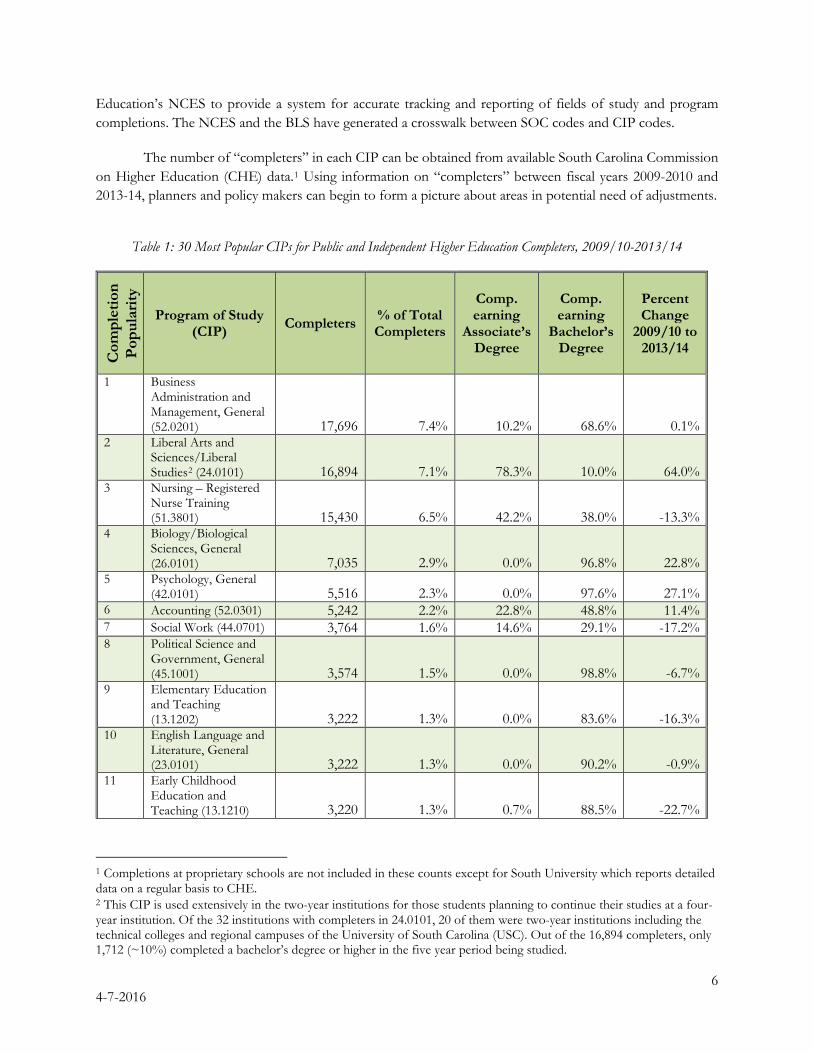
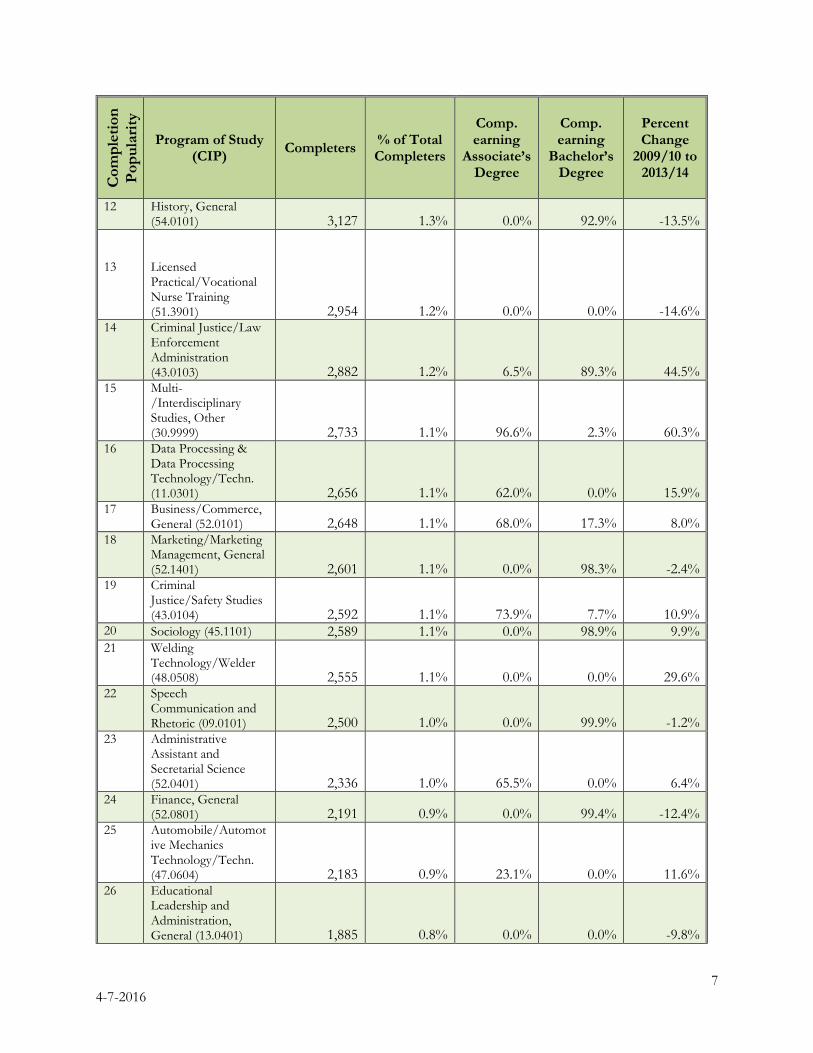
The number of “completers” in each CIP can be obtained from available South Carolina Commission on Higher Education (CHE) data.1 Using information on “completers” between fiscal years 2009-2010 and 2013-14, planners and policy makers can begin to form a picture about areas in potential need of adjustments.
Table 1: 30 Most Popular CIPs for Public and Independent Higher Education Completers, 2009/10-2013/14
Com
plet
ion
Popu
larit
y
Program of Study (CIP) Completers % of Total
Completers
Comp. earning
Associate’s Degree
Comp. earning
Bachelor’s Degree
Percent Change
2009/10 to 2013/14
1 Business Administration and Management, General (52.0201) 17,696 7.4% 10.2% 68.6% 0.1%
2 Liberal Arts and Sciences/Liberal Studies2 (24.0101) 16,894 7.1% 78.3% 10.0% 64.0%
3 Nursing – Registered Nurse Training (51.3801) 15,430 6.5% 42.2% 38.0% -13.3%
4 Biology/Biological Sciences, General (26.0101) 7,035 2.9% 0.0% 96.8% 22.8%
5 Psychology, General (42.0101) 5,516 2.3% 0.0% 97.6% 27.1%
6 Accounting (52.0301) 5,242 2.2% 22.8% 48.8% 11.4% 7 Social Work (44.0701) 3,764 1.6% 14.6% 29.1% -17.2% 8 Political Science and
Government, General (45.1001) 3,574 1.5% 0.0% 98.8% -6.7%
9 Elementary Education and Teaching (13.1202) 3,222 1.3% 0.0% 83.6% -16.3%
10 English Language and Literature, General (23.0101) 3,222 1.3% 0.0% 90.2% -0.9%
11 Early Childhood Education and Teaching (13.1210) 3,220 1.3% 0.7% 88.5% -22.7%
1 Completions at proprietary schools are not included in these counts except for South University which reports detailed data on a regular basis to CHE. 2 This CIP is used extensively in the two-year institutions for those students planning to continue their studies at a four-year institution. Of the 32 institutions with completers in 24.0101, 20 of them were two-year institutions including the technical colleges and regional campuses of the University of South Carolina (USC). Out of the 16,894 completers, only 1,712 (~10%) completed a bachelor’s degree or higher in the five year period being studied.
6 4-7-2016
Com
plet
ion
Popu
larit
y Program of Study
(CIP) Completers % of Total Completers
Comp. earning
Associate’s Degree
Comp. earning
Bachelor’s Degree
Percent Change
2009/10 to 2013/14
12 History, General (54.0101) 3,127 1.3% 0.0% 92.9% -13.5%
13
Licensed Practical/Vocational Nurse Training (51.3901)
2,954
1.2%
0.0%
0.0%
-14.6% 14 Criminal Justice/Law
Enforcement Administration (43.0103) 2,882 1.2% 6.5% 89.3% 44.5%
15 Multi-/Interdisciplinary Studies, Other (30.9999) 2,733 1.1% 96.6% 2.3% 60.3%
16 Data Processing & Data Processing Technology/Techn. (11.0301) 2,656 1.1% 62.0% 0.0% 15.9%
17 Business/Commerce, General (52.0101) 2,648 1.1% 68.0% 17.3% 8.0%
18 Marketing/Marketing Management, General (52.1401) 2,601 1.1% 0.0% 98.3% -2.4%
19 Criminal Justice/Safety Studies (43.0104) 2,592 1.1% 73.9% 7.7% 10.9%
20 Sociology (45.1101) 2,589 1.1% 0.0% 98.9% 9.9% 21 Welding
Technology/Welder (48.0508) 2,555 1.1% 0.0% 0.0% 29.6%
22 Speech Communication and Rhetoric (09.0101) 2,500 1.0% 0.0% 99.9% -1.2%
23 Administrative Assistant and Secretarial Science (52.0401) 2,336 1.0% 65.5% 0.0% 6.4%
24 Finance, General (52.0801) 2,191 0.9% 0.0% 99.4% -12.4%
25 Automobile/Automotive Mechanics Technology/Techn. (47.0604) 2,183 0.9% 23.1% 0.0% 11.6%
26 Educational Leadership and Administration, General (13.0401) 1,885 0.8% 0.0% 0.0% -9.8%
7 4-7-2016
Com
plet
ion
Popu
larit
y Program of Study
(CIP) Completers % of Total Completers
Comp. earning
Associate’s Degree
Comp. earning
Bachelor’s Degree
Percent Change
2009/10 to 2013/14
27 Heat, Air Cond., Ventilations & Refrig Maint Technol 1,743 0.7% 13.8% 0.0% -14.0%
28 Sport and Fitness Administration/Management (31.0504) 1,708 0.7% 0.0% 91.3% 28.4%
29 Business Administration, Management, and Operations (52.0299) 1,661 0.7% 0.0% 100.0% -44.5%
30 Civil Engineering, General (14.0801) 1,595 0.7% 0.0% 77.7% 15.4%
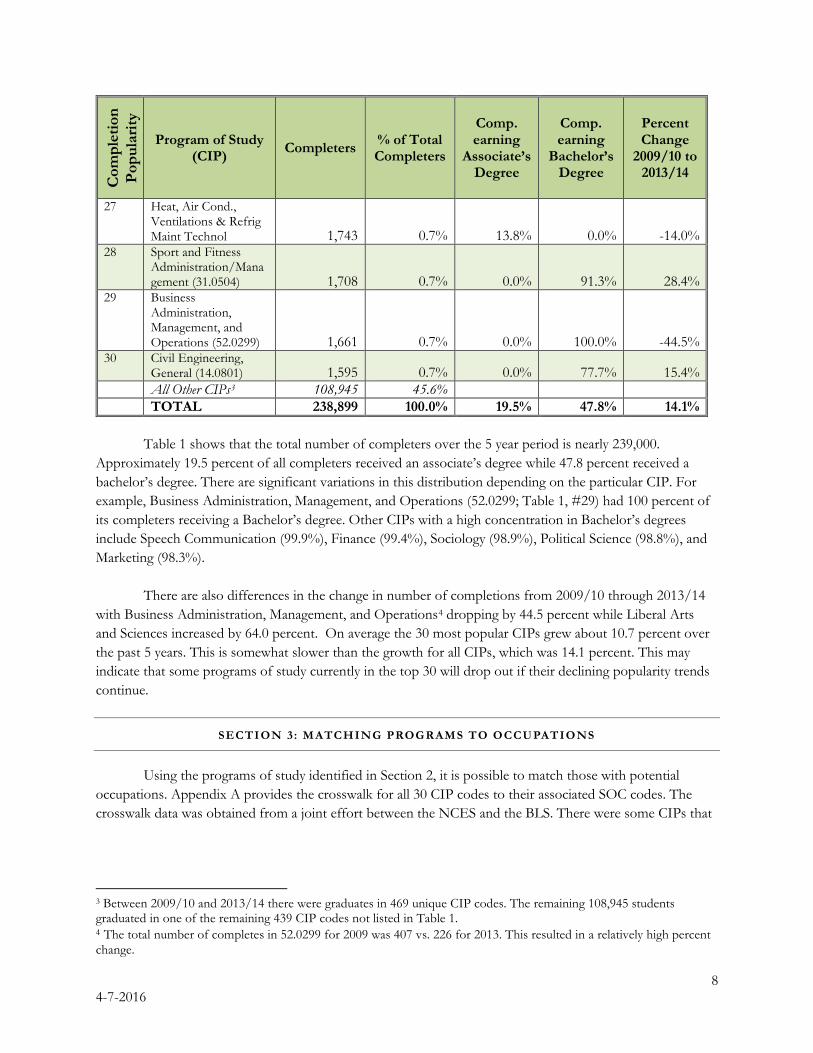
All Other CIPs3 108,945 45.6% TOTAL 238,899 100.0% 19.5% 47.8% 14.1%
Table 1 shows that the total number of completers over the 5 year period is nearly 239,000.
Approximately 19.5 percent of all completers received an associate’s degree while 47.8 percent received a bachelor’s degree. There are significant variations in this distribution depending on the particular CIP. For example, Business Administration, Management, and Operations (52.0299; Table 1, #29) had 100 percent of its completers receiving a Bachelor’s degree. Other CIPs with a high concentration in Bachelor’s degrees include Speech Communication (99.9%), Finance (99.4%), Sociology (98.9%), Political Science (98.8%), and Marketing (98.3%).
There are also differences in the change in number of completions from 2009/10 through 2013/14 with Business Administration, Management, and Operations4 dropping by 44.5 percent while Liberal Arts and Sciences increased by 64.0 percent. On average the 30 most popular CIPs grew about 10.7 percent over the past 5 years. This is somewhat slower than the growth for all CIPs, which was 14.1 percent. This may indicate that some programs of study currently in the top 30 will drop out if their declining popularity trends continue.
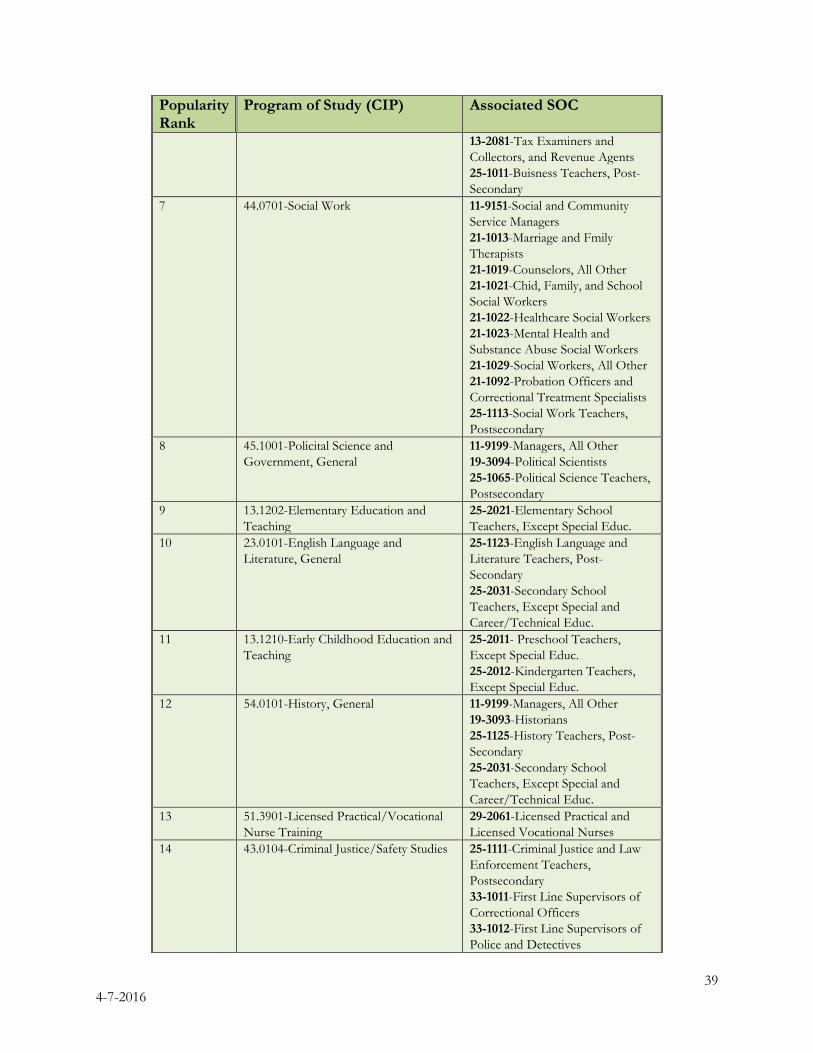
SECTION 3: MATCHING PROGRAMS TO OCCUPATIONS
Using the programs of study identified in Section 2, it is possible to match those with potential occupations. Appendix A provides the crosswalk for all 30 CIP codes to their associated SOC codes. The crosswalk data was obtained from a joint effort between the NCES and the BLS. There were some CIPs that
3 Between 2009/10 and 2013/14 there were graduates in 469 unique CIP codes. The remaining 108,945 students graduated in one of the remaining 439 CIP codes not listed in Table 1. 4 The total number of completes in 52.0299 for 2009 was 407 vs. 226 for 2013. This resulted in a relatively high percent change.
8 4-7-2016
did not have matching occupations or matches that did not seem appropriate. These are included in the charts in this section but have N/A beside them.5
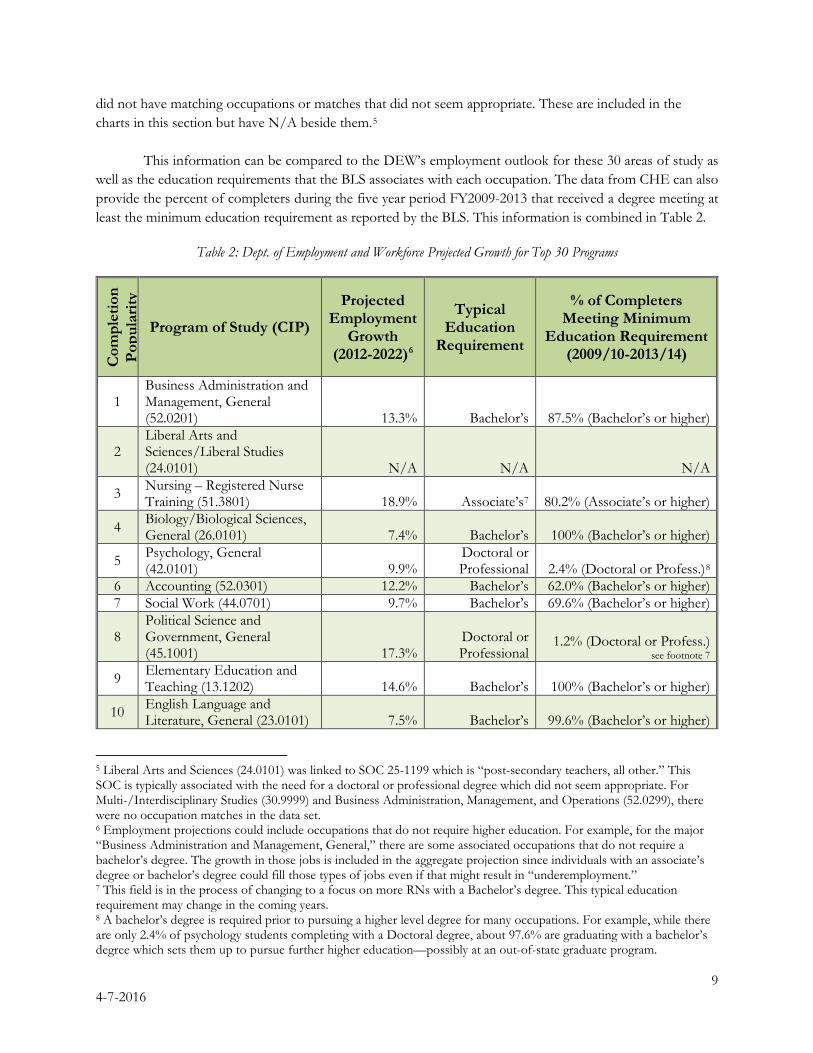
This information can be compared to the DEW’s employment outlook for these 30 areas of study as
well as the education requirements that the BLS associates with each occupation. The data from CHE can also provide the percent of completers during the five year period FY2009-2013 that received a degree meeting at least the minimum education requirement as reported by the BLS. This information is combined in Table 2.
Table 2: Dept. of Employment and Workforce Projected Growth for Top 30 Programs
Com
plet
ion
Popu
larit
y
Program of Study (CIP)
Projected Employment
Growth (2012-2022)6
Typical Education
Requirement
% of Completers Meeting Minimum
Education Requirement (2009/10-2013/14)
1 Business Administration and Management, General (52.0201) 13.3% Bachelor’s 87.5% (Bachelor’s or higher)
2 Liberal Arts and Sciences/Liberal Studies (24.0101) N/A N/A N/A
3 Nursing – Registered Nurse Training (51.3801) 18.9% Associate’s7 80.2% (Associate’s or higher)
4 Biology/Biological Sciences, General (26.0101) 7.4% Bachelor’s 100% (Bachelor’s or higher)
5 Psychology, General (42.0101) 9.9%
Doctoral or Professional 2.4% (Doctoral or Profess.)8
6 Accounting (52.0301) 12.2% Bachelor’s 62.0% (Bachelor’s or higher) 7 Social Work (44.0701) 9.7% Bachelor’s 69.6% (Bachelor’s or higher)
8 Political Science and Government, General (45.1001) 17.3%
Doctoral or Professional
1.2% (Doctoral or Profess.) see footnote 7
9 Elementary Education and Teaching (13.1202) 14.6% Bachelor’s 100% (Bachelor’s or higher)
10 English Language and Literature, General (23.0101) 7.5% Bachelor’s 99.6% (Bachelor’s or higher)
5 Liberal Arts and Sciences (24.0101) was linked to SOC 25-1199 which is “post-secondary teachers, all other.” This SOC is typically associated with the need for a doctoral or professional degree which did not seem appropriate. For Multi-/Interdisciplinary Studies (30.9999) and Business Administration, Management, and Operations (52.0299), there were no occupation matches in the data set. 6 Employment projections could include occupations that do not require higher education. For example, for the major “Business Administration and Management, General,” there are some associated occupations that do not require a bachelor’s degree. The growth in those jobs is included in the aggregate projection since individuals with an associate’s degree or bachelor’s degree could fill those types of jobs even if that might result in “underemployment.” 7 This field is in the process of changing to a focus on more RNs with a Bachelor’s degree. This typical education requirement may change in the coming years. 8 A bachelor’s degree is required prior to pursuing a higher level degree for many occupations. For example, while there are only 2.4% of psychology students completing with a Doctoral degree, about 97.6% are graduating with a bachelor’s degree which sets them up to pursue further higher education—possibly at an out-of-state graduate program.
9 4-7-2016
Com
plet
ion
Popu
larit
y Program of Study (CIP)
Projected Employment
Growth (2012-2022)6
Typical Education
Requirement
% of Completers Meeting Minimum
Education Requirement (2009/10-2013/14)
11 Early Childhood Education and Teaching (13.1210) 15.9% Associate’s 100% (Associate’s or higher)
12 History, General (54.0101) 8.6% Bachelor’s 100% (Bachelor’s or higher)
13 Licensed Practical/Vocational Nurse Training (51.3901) 23.6%
Post-secondary, non-degree9
100% (Post-secondary or higher)
14 Criminal Justice/Law Enforcement Administration (43.0103) 10.8%
High school diploma or equivalent
100% (High school or higher)
15 Multi-/Interdisciplinary Studies, Other (30.9999) N/A N/A N/A
16
Data Processing & Data Processing Technology/Techn. (11.0301)
0.1%
High school diploma or equivalent
100% (High school or
higher)
17 Business/Commerce, General (52.0101) 14.0% Bachelor’s 18.4% (Bachelor’s or higher)
18 Marketing/Marketing Management, General (52.1401) 20.1% Bachelor’s 98.3% (Bachelor’s or higher)
19 Criminal Justice/Safety Studies (43.0104) 5.6%
High school diploma or equivalent
100% (High school or higher)
20 Sociology (45.1101) 15.0% Doctoral or Professional
1.1% (Doctoral or Profess.) see footnote 7
21 Welding Technology/Welder (48.0508) 11.0%
High school diploma or equivalent
100% (High school or higher)
22 Speech Communication and Rhetoric (09.0101) 11.5% Bachelor’s 100% (Bachelor’s or higher)
23 Administrative Assistant and Secretarial Science (52.0401) 10.2%
High school diploma or equivalent
100% (High school or higher)
24 Finance, General (52.0801) 13.0% Bachelor’s 99.7% (Bachelor’s or higher)
25
Automobile/Automotive Mechanics Technology/Techn. (47.0604) 9.9%
Post-secondary, non-degree
100% (Post-secondary or higher)
26 Educational Leadership and Administration, General (13.0401) 11.3% Master’s 100% (Master’s or higher)
9 For this study, the BLS term “post-secondary, non-degree” corresponds to degree levels 1, 2, and 3 in CHE data.
10 4-7-2016
Com
plet
ion
Popu
larit
y Program of Study (CIP)
Projected Employment
Growth (2012-2022)6
Typical Education
Requirement
% of Completers Meeting Minimum
Education Requirement (2009/10-2013/14)
27 Heat, Air Cond., Ventilations & Refrig Maint Technol 22.0%
Post-secondary, non-degree
100% (Post-secondary or higher)
28 Sport and Fitness Administration/Management (31.0504) 11.3%
High school diploma or
higher 100% (High school or
higher)
29 Business Administration, Management, and Operations (52.0299) N/A N/A N/A
30 Civil Engineering, General (14.0801) 18.6% Bachelor’s 100% (Bachelor’s or higher)
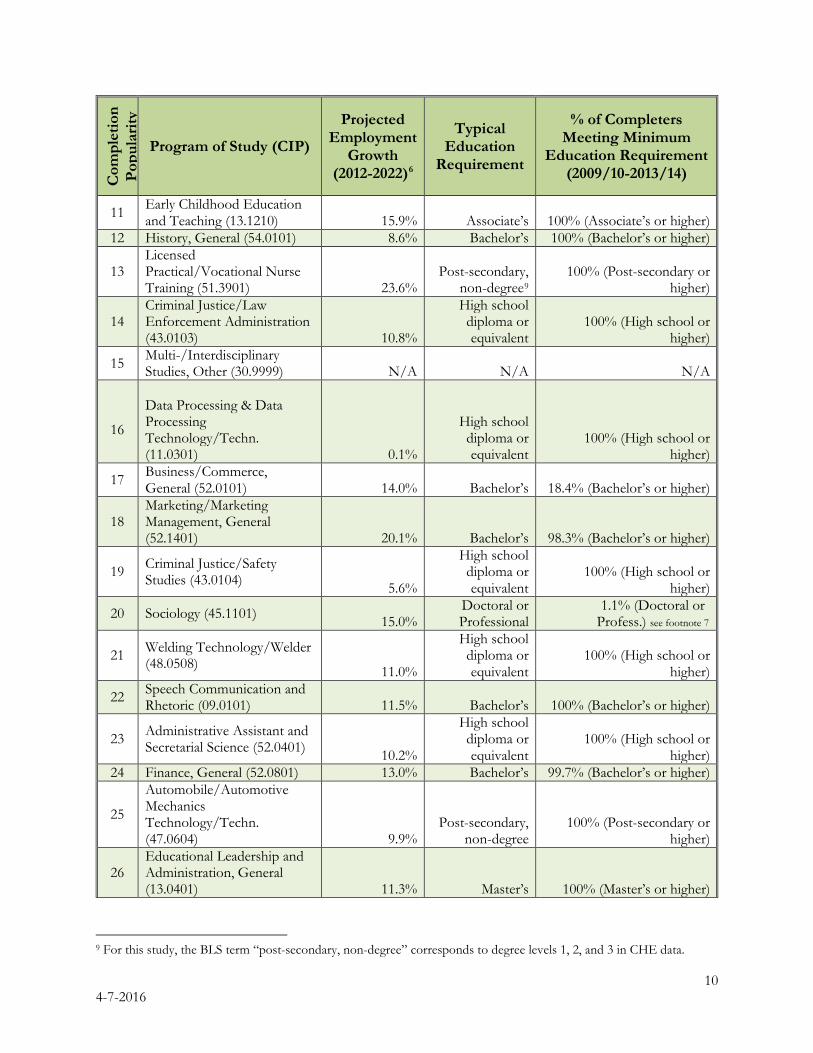
Among the most popular CIP codes, the four fastest growing occupational sectors are Licensed Practical/Vocational Nurse Training (23.6%); Heat, Air Cond. Maint. Tech. (22.0%); Marketing/Marketing Management (20.1%) and Nursing—Registered Nurse Training (18.9%). While these programs are projected to have significant employment opportunities over the next seven years, they only rank 13th, 27th, 18th, and 3rd, respectively, in terms of popularity of program of study at the state’s colleges and universities.
This can be represented visually using something like the diagram found in Figure 1. Areas of study can be broken into three categories based on DEW projections of employment growth by 2022: occupation growth expected be 20%+ by 2022, growth expected to be between 10% and 20%, and expected growth <10%. Areas of study can also be classified based on their popularity—whether they fall in the top 15 in terms of completers or whether they fall below the top 15. Although these category splits are somewhat subjective, they can provide some level of understanding on whether there are certain occupations expected to have significant employment opportunities in the future and how “popular” that area of study has been in recent years.
Figure 1: Conceptual Diagram of Employment Demand vs. Number of Graduates
DEW Projected Employment Growth
“Slow” <10% growth “Moderate” 10%-20% growth
“Fast” 20%+ growth
2009
-10
thro
ugh
2013
-14
Gra
duat
es
Top 15 most
popular degrees (6-digit CIP)
“Potential Oversupply”
“Potential Meeting Demand”
“Potential Shortage”
Top 16-30 most
11 4-7-2016

popular degrees (6-digit CIP)
“Likely Balanced”
“Possible Shortage”
“Probable Shortage”
12 4-7-2016
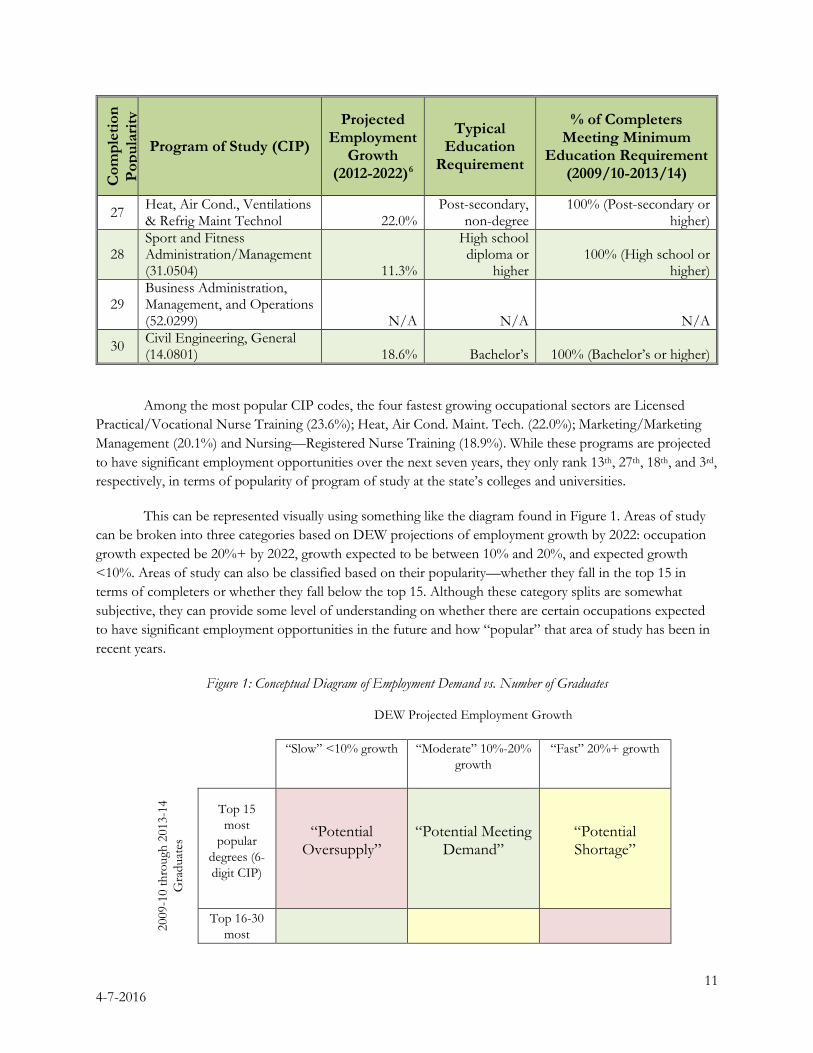
FAST : Those areas that are expected to have the fastest employment growth (20%+) and in the top 15 most popular CIPs could be considered to be in “potential shortage” meaning that although these are popular areas of study, their anticipated growth rate in the job market makes them an even more attractive option for students today and into the future. Those areas that are growing at the fastest rate but not in the top 15 are likely to be areas of “probable shortage.” These occupations are growing extremely quickly and need graduates with the skills necessary to take them. If there are an insufficient number of students graduating in those areas, there may be a shortage in future years.
Figure 2: CIPs with Fastest Projected Employment Growth
10.0%
12.0%
14.0%
16.0%
18.0%
20.0%
22.0%
24.0%
Mkting/MktingManagement
Heat, Air Cond.,Ventilations &
Refrig. Maint. Tech.
LPN/LVN Training
20.1%22.0%
23.6%
Proj
ecte
d Em
ploy
men
t Gro
wth
(2
012-
2022
)
Program of Study (CIP)
13 4-7-2016

MODERATE: Those occupations expected to grow at a moderate rate (10%-20%) and in the top 15 in popularity can be considered to be “potentially meeting demand.” These are common areas of study but they also have strong employment outlooks. Those areas with moderate employment growth projections that are outside of the top 15 could be considered to be in a “possible shortage.” These occupations are growing between 10% and 20% by 2022, so if there is insufficient interest by students for concentrating their studies in those areas, a possible shortage may arise over time.
Figure 3: CIPs with Moderate Projected Employment Growth
10.0%11.0%12.0%13.0%14.0%15.0%16.0%17.0%18.0%19.0%
10.2%10.8%11.0%11.3%11.3%11.5%
12.2%13.0%13.3%
14.0%14.6%15.0%
15.9%
17.3%
18.6%18.9%
Proj
ecte
d Em
ploy
men
t Gro
wth
(2
012-
2022
)
Program of Study (CIP)
14 4-7-2016
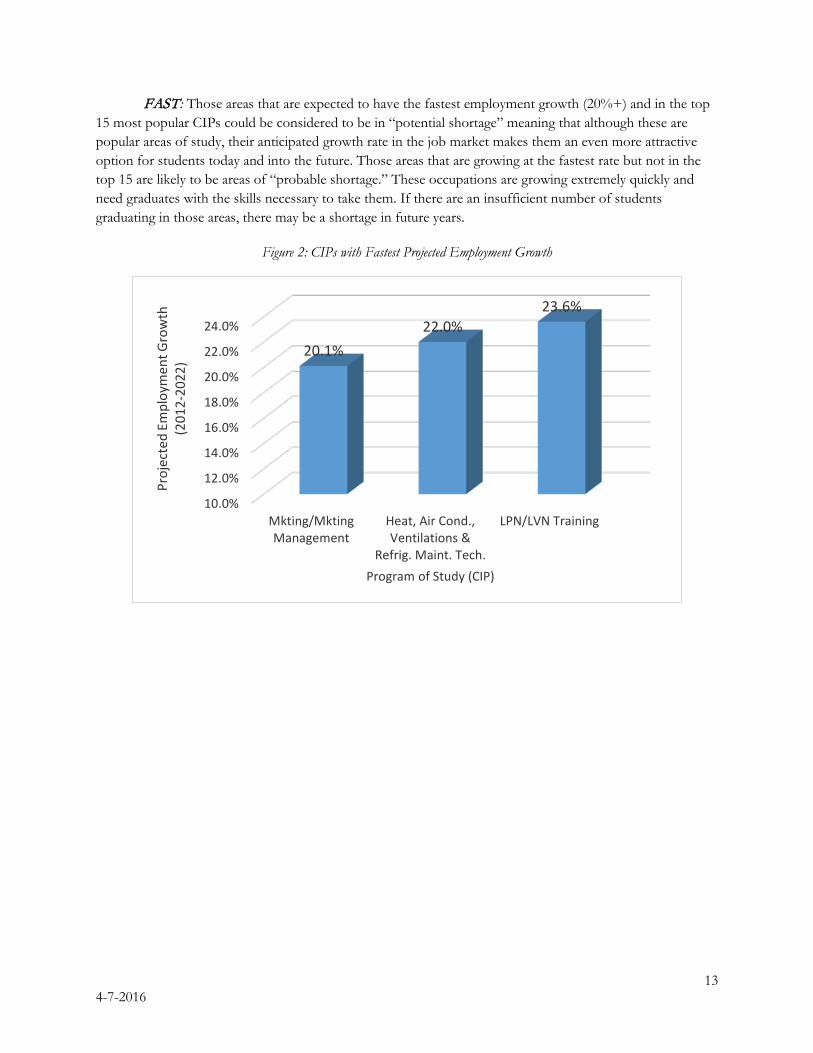
SLOW: Areas that are slow growing (<10%) and in the top 15 most popular CIPs may be creating a “potential oversupply.” This term should be taken with some caveats: first, the designation of fast/medium/slow growth are subjective, second, the designation of popular/not popular is also subjective, finally there are many students who graduate with one degree and are able to find suitable work in occupations that the BLS has not considered. For example, a psychology graduate may work in an occupation that is considered part of the management field. This is not taken into account by the BLS mapping of CIP to SOC codes. Finally, areas that are slow growing and outside of the top 15 might be more “balanced.” Similar to the popular, medium employment growth category, it is likely that the number of graduates is adequately meeting the demand for those types of positions.
Figure 4: CIPs with Slow Projected Employment Growth
0.0%2.0%4.0%6.0%8.0%
10.0%12.0%14.0%
0.1%
5.6%7.4% 7.5%
8.6%9.7% 9.9% 9.9%
Proj
ecte
d Em
ploy
men
t Gro
wth
(2
012-
2022
)
Program of Study (CIP)
15 4-7-2016
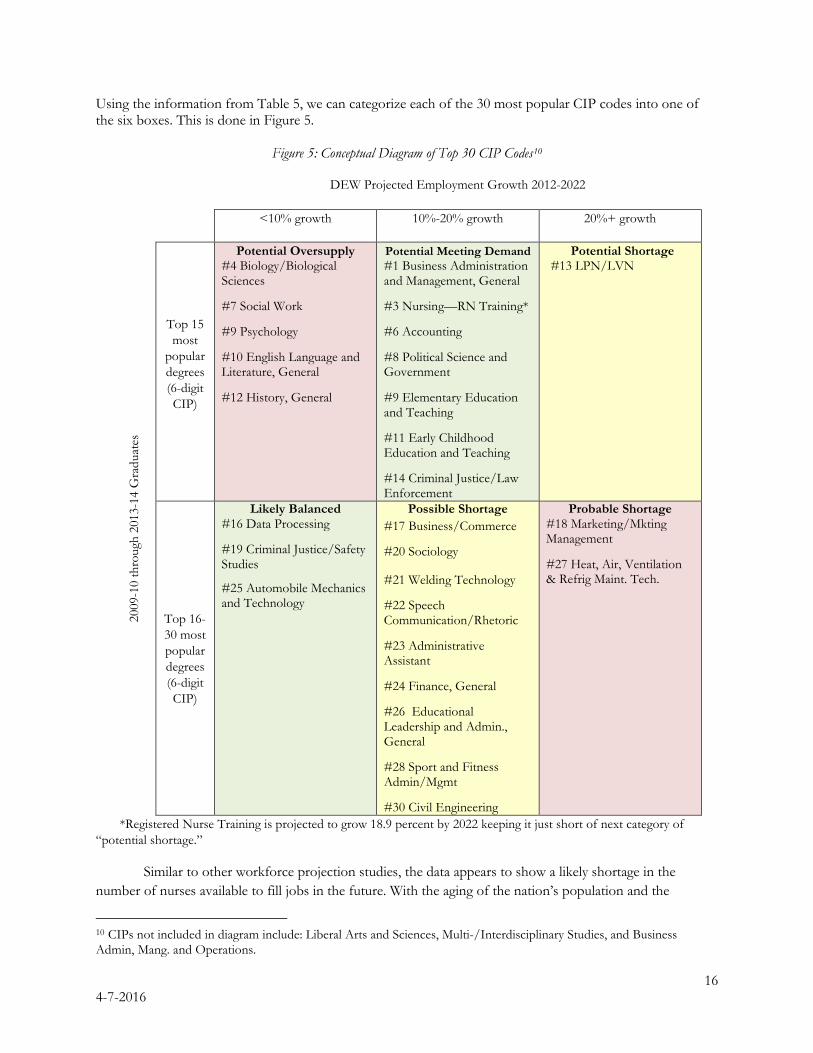
Using the information from Table 5, we can categorize each of the 30 most popular CIP codes into one of the six boxes. This is done in Figure 5.
Figure 5: Conceptual Diagram of Top 30 CIP Codes10
DEW Projected Employment Growth 2012-2022
<10% growth 10%-20% growth 20%+ growth
2009
-10
thro
ugh
2013
-14
Gra
duat
es
Top 15 most
popular degrees (6-digit CIP)
Potential Oversupply #4 Biology/Biological Sciences #7 Social Work #9 Psychology #10 English Language and Literature, General #12 History, General
Potential Meeting Demand #1 Business Administration and Management, General #3 Nursing—RN Training* #6 Accounting #8 Political Science and Government #9 Elementary Education and Teaching #11 Early Childhood Education and Teaching #14 Criminal Justice/Law Enforcement
Potential Shortage #13 LPN/LVN
Top 16-30 most popular degrees (6-digit CIP)
Likely Balanced #16 Data Processing
#19 Criminal Justice/Safety Studies
#25 Automobile Mechanics and Technology
Possible Shortage #17 Business/Commerce #20 Sociology
#21 Welding Technology #22 Speech Communication/Rhetoric #23 Administrative Assistant #24 Finance, General #26 Educational Leadership and Admin., General #28 Sport and Fitness Admin/Mgmt #30 Civil Engineering
Probable Shortage #18 Marketing/Mkting Management #27 Heat, Air, Ventilation & Refrig Maint. Tech.
*Registered Nurse Training is projected to grow 18.9 percent by 2022 keeping it just short of next category of “potential shortage.”
Similar to other workforce projection studies, the data appears to show a likely shortage in the number of nurses available to fill jobs in the future. With the aging of the nation’s population and the
10 CIPs not included in diagram include: Liberal Arts and Sciences, Multi-/Interdisciplinary Studies, and Business Admin, Mang. and Operations.
16 4-7-2016

increased access to healthcare, it is likely that many medical professions will continue to experience high levels of growth and thus an increased need for graduates in those areas. However, according to the “Hospital Nursing Workforce in South Carolina: 2015” report from the Office for Healthcare Workforce Analysis and Planning (OHWAP), only about 42 percent of hospitals currently employ any LPN/LVNs. Workers trained with this background more typically find employment in non-hospital settings, particularly retirement communities. The study additionally found that 36 percent of hospitals expect a reduction in the number of LPNs in their employ in 2015. These changes may not be accurately captured in the DEW occupational projections and thus may overstate future demand for this occupation. Similarly, the OHWAP study finds that while there seems to be a sufficient number of new graduates able to fill RN positions, many hospitals are more specifically interested in RNs with years of experience. Simply comparing the number of graduates to the projected RN demand may be insufficient to draw conclusions without also considering the stated needs of the medical community.
The box labeled “potential oversupply” should be considered with some caveats. Biology, for example is often chosen as a major for pre-med, pre-dental, or pre-vet students. These are not career paths taken into account in the NCES/BLS crosswalk between CIPs and SOCs. According to a 2013 article by Jordan Weissman in The Atlantic, English and History majors reported rates of unemployment of 9.8 percent and 9.5 percent, respectively, following graduation. This was better than the rates for economics and political science graduates who reported 10.4 percent and 11.1 percent unemployment post-graduation, respectively. However, there is still concern nationwide that many individuals majoring in these fields are likely to become underemployed post-graduation—taking jobs for which they are overqualified (Johnson, 2013). Although the economy has been improving since the Great Recession, the Federal Reserve Board still estimates that underemployment for recent college graduates is about 45 percent (Abel et. al, 2014).They find that this can differ substantially by major with the more technical fields typically having lower underemployment rates than those majoring in social sciences or leisure and hospitality.
An area that has the potential for rapid growth is the Heating, Air, Ventilation, and Refrigerator Maintenance. DEW anticipates that occupations associated with this degree will grow by 22.0 percent between 2012 and 2022. Florence-Darlington Technical College announced in early August 2015 that they were breaking ground on a new Automotive and HVAC (Heating and Air Conditioning) Center on their main campus which should be complete in the fall of 2016.
Marketing positions are increasingly focused on digital and content marketing. This may create more opportunity for overlap with some of the information technology graduates as online marketing continues to grow. This will be an additional source of potential workers that could balance out any mismatches in supply and demand.
SECTION 4: FASTEST GROWING AND LARGEST OCCUPATIONS
IS HIGHER EDUCATION MEETING DEMAND IN HIGH PERCENTAGE GROWTH OCCUPATIONS?
Exploring the labor supply and demand from the opposite perspective, it is possible to determine which occupations are likely to be in high demand over the coming years and compare that with the average number of completions at SC’s colleges and universities.
17 4-7-2016
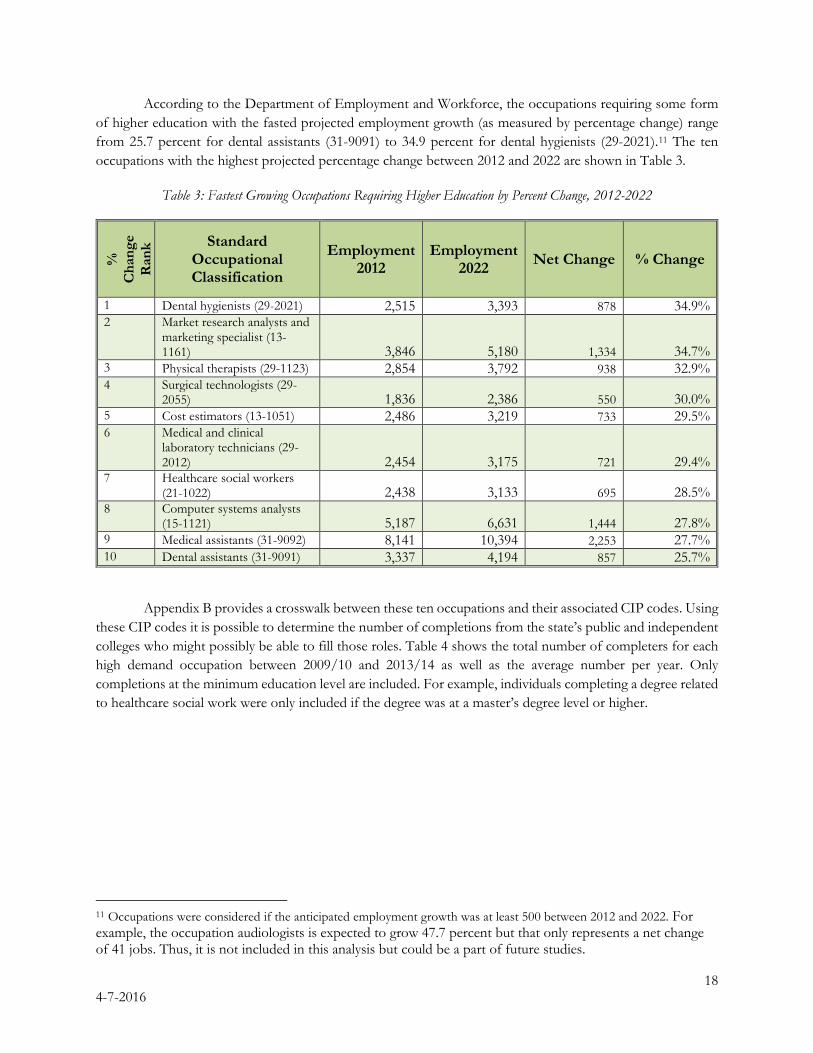
According to the Department of Employment and Workforce, the occupations requiring some form of higher education with the fasted projected employment growth (as measured by percentage change) range from 25.7 percent for dental assistants (31-9091) to 34.9 percent for dental hygienists (29-2021).11 The ten occupations with the highest projected percentage change between 2012 and 2022 are shown in Table 3.
Table 3: Fastest Growing Occupations Requiring Higher Education by Percent Change, 2012-2022
%
Cha
nge
Ran
k Standard Occupational Classification
Employment 2012
Employment 2022 Net Change % Change
1 Dental hygienists (29-2021) 2,515 3,393 878 34.9% 2 Market research analysts and
marketing specialist (13-1161) 3,846 5,180 1,334 34.7%
3 Physical therapists (29-1123) 2,854 3,792 938 32.9% 4 Surgical technologists (29-
2055) 1,836 2,386 550 30.0% 5 Cost estimators (13-1051) 2,486 3,219 733 29.5% 6 Medical and clinical
laboratory technicians (29-2012) 2,454 3,175 721 29.4%
7 Healthcare social workers (21-1022) 2,438 3,133 695 28.5%
8 Computer systems analysts (15-1121) 5,187 6,631 1,444 27.8%
9 Medical assistants (31-9092) 8,141 10,394 2,253 27.7% 10 Dental assistants (31-9091) 3,337 4,194 857 25.7%
Appendix B provides a crosswalk between these ten occupations and their associated CIP codes. Using these CIP codes it is possible to determine the number of completions from the state’s public and independent colleges who might possibly be able to fill those roles. Table 4 shows the total number of completers for each high demand occupation between 2009/10 and 2013/14 as well as the average number per year. Only completions at the minimum education level are included. For example, individuals completing a degree related to healthcare social work were only included if the degree was at a master’s degree level or higher.
11 Occupations were considered if the anticipated employment growth was at least 500 between 2012 and 2022. For example, the occupation audiologists is expected to grow 47.7 percent but that only represents a net change of 41 jobs. Thus, it is not included in this analysis but could be a part of future studies.
18 4-7-2016
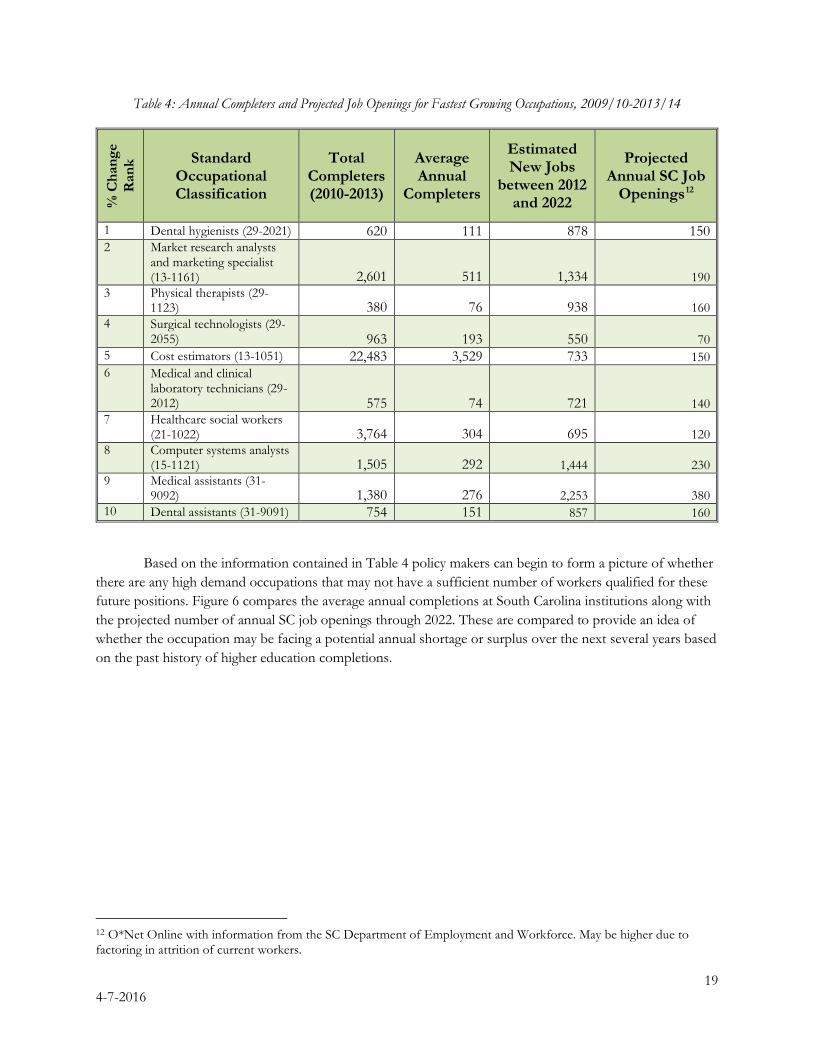
Table 4: Annual Completers and Projected Job Openings for Fastest Growing Occupations, 2009/10-2013/14 %
Cha
nge
Ran
k Standard Occupational Classification
Total Completers (2010-2013)
Average Annual
Completers
Estimated New Jobs
between 2012 and 2022
Projected Annual SC Job
Openings12
1 Dental hygienists (29-2021) 620 111 878 150 2 Market research analysts
and marketing specialist (13-1161) 2,601 511 1,334 190
3 Physical therapists (29-1123) 380 76 938 160
4 Surgical technologists (29-2055) 963 193 550 70
5 Cost estimators (13-1051) 22,483 3,529 733 150 6 Medical and clinical
laboratory technicians (29-2012) 575 74 721 140
7 Healthcare social workers (21-1022) 3,764 304 695 120
8 Computer systems analysts (15-1121) 1,505 292 1,444 230
9 Medical assistants (31-9092) 1,380 276 2,253 380
10 Dental assistants (31-9091) 754 151 857 160
Based on the information contained in Table 4 policy makers can begin to form a picture of whether there are any high demand occupations that may not have a sufficient number of workers qualified for these future positions. Figure 6 compares the average annual completions at South Carolina institutions along with the projected number of annual SC job openings through 2022. These are compared to provide an idea of whether the occupation may be facing a potential annual shortage or surplus over the next several years based on the past history of higher education completions.
12 O*Net Online with information from the SC Department of Employment and Workforce. May be higher due to factoring in attrition of current workers.
19 4-7-2016

Figure 6: Potential Annual Shortage/Surplus for High Demand Occupations
Cost Estimators were excluded from the figure due to being associated with the Business/Commerce, General (52.0101) and Business Administration and Management, General (52.0201) CIP codes which would inflate the number of completions as many of these graduates find work in a multitude of other occupations.
The finding that there may be more Marketing Research Analysts and Specialists than job openings
seems contrary to the findings from Figure 2. However, this demonstrates how the subjective nature of the “cut points” in Figure 2 can lead to differing conclusions. The information presented in Figure 2 should be used as a starting point with more detailed analysis on individual CIP codes to determine more accurately the balance between labor supply and demand. Marketing/Marketing Management (52.1401) is the 18th most popular CIP code in the state and it is expected to be a growing industry. However, Figure 6 demonstrates that currently there are likely enough graduates in that field to satisfy current and future demand.
In general, it appears that the higher education system in South Carolina is meeting the needs of Surgical Technologist, Computer Systems Analysts, and Dental Assistants. There are four areas that appear to have imbalances that might require additional consideration for filling future jobs: Physical Therapists, Medical and Clinical Laboratory Technicians, Dental Hygienists, and Medical Assistants. It may not be surprising that all are in the healthcare sector. According to the American Hospital Association, “The U.S. healthcare system faces growing challenges. The U.S. population is aging at a rapid rate; healthcare reform is expected to bring millions more patients into the system; and there are anticipated shortages in numbers of trained healthcare professionals to care for these patients” (Drake et. al, 2013). The CIPs associated with the four potential shortage occupations include:
150
160
140
380
160
111
511
76
193
74
304
292
276
151
190
70
120
230
0 100 200 300 400 500 600
Dental Hygienists
Martketing Spec.
Physical Therapists
Surgical Tech.
Med and Clinical Lab Tech
Healthcare Social Worker
Computer Systems Analysts
Med Assist.
Dental Assist.
Annual Completions Annual Openings
20 4-7-2016
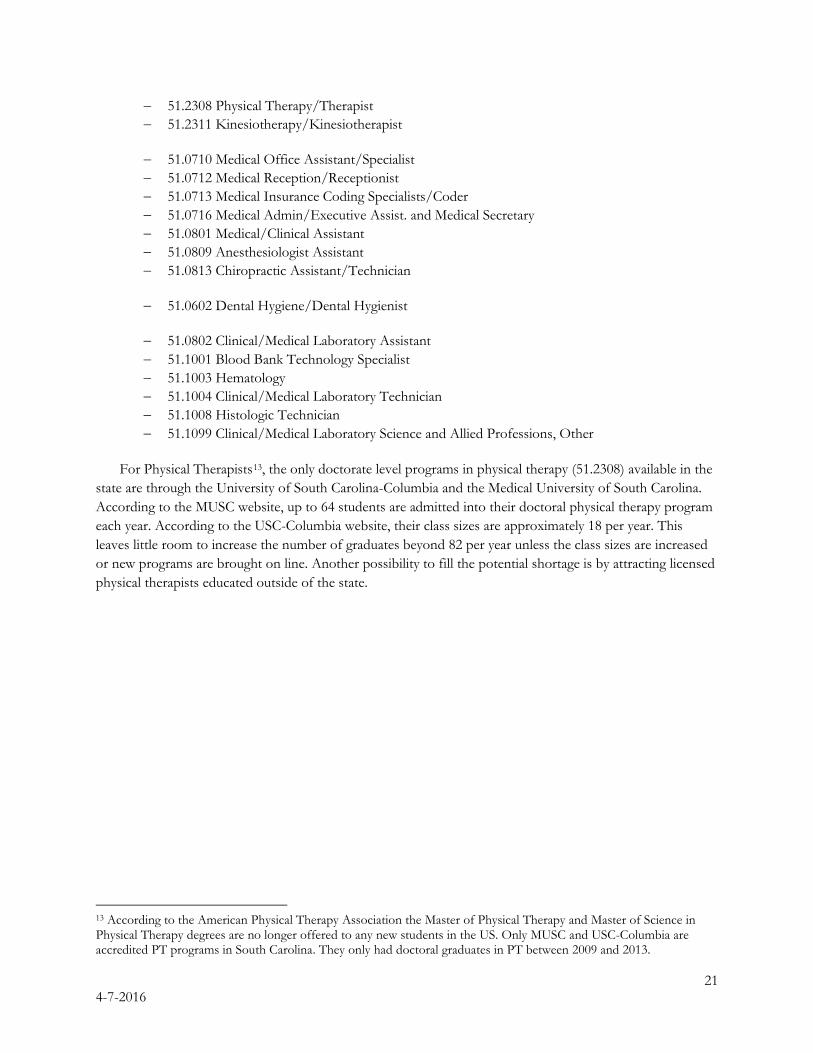
− 51.2308 Physical Therapy/Therapist − 51.2311 Kinesiotherapy/Kinesiotherapist − 51.0710 Medical Office Assistant/Specialist − 51.0712 Medical Reception/Receptionist − 51.0713 Medical Insurance Coding Specialists/Coder − 51.0716 Medical Admin/Executive Assist. and Medical Secretary − 51.0801 Medical/Clinical Assistant − 51.0809 Anesthesiologist Assistant − 51.0813 Chiropractic Assistant/Technician
− 51.0602 Dental Hygiene/Dental Hygienist
− 51.0802 Clinical/Medical Laboratory Assistant − 51.1001 Blood Bank Technology Specialist − 51.1003 Hematology − 51.1004 Clinical/Medical Laboratory Technician − 51.1008 Histologic Technician − 51.1099 Clinical/Medical Laboratory Science and Allied Professions, Other
For Physical Therapists13, the only doctorate level programs in physical therapy (51.2308) available in the state are through the University of South Carolina-Columbia and the Medical University of South Carolina. According to the MUSC website, up to 64 students are admitted into their doctoral physical therapy program each year. According to the USC-Columbia website, their class sizes are approximately 18 per year. This leaves little room to increase the number of graduates beyond 82 per year unless the class sizes are increased or new programs are brought on line. Another possibility to fill the potential shortage is by attracting licensed physical therapists educated outside of the state.
13 According to the American Physical Therapy Association the Master of Physical Therapy and Master of Science in Physical Therapy degrees are no longer offered to any new students in the US. Only MUSC and USC-Columbia are accredited PT programs in South Carolina. They only had doctoral graduates in PT between 2009 and 2013.
21 4-7-2016
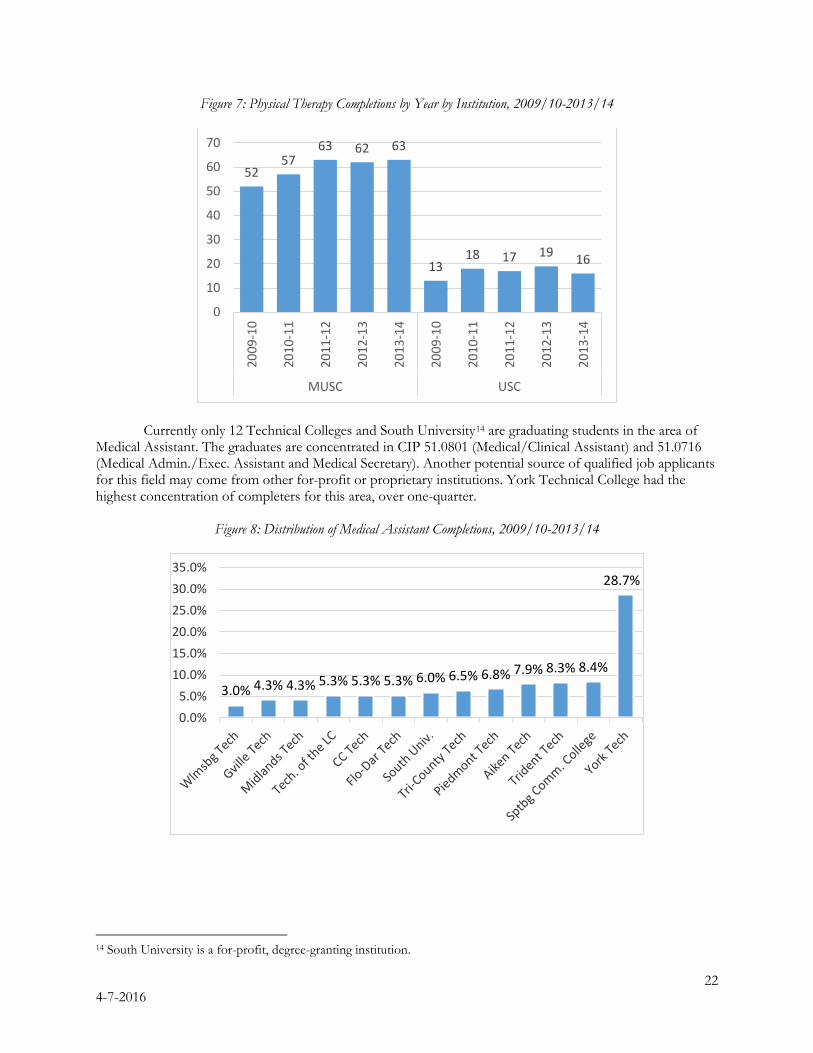
Figure 7: Physical Therapy Completions by Year by Institution, 2009/10-2013/14
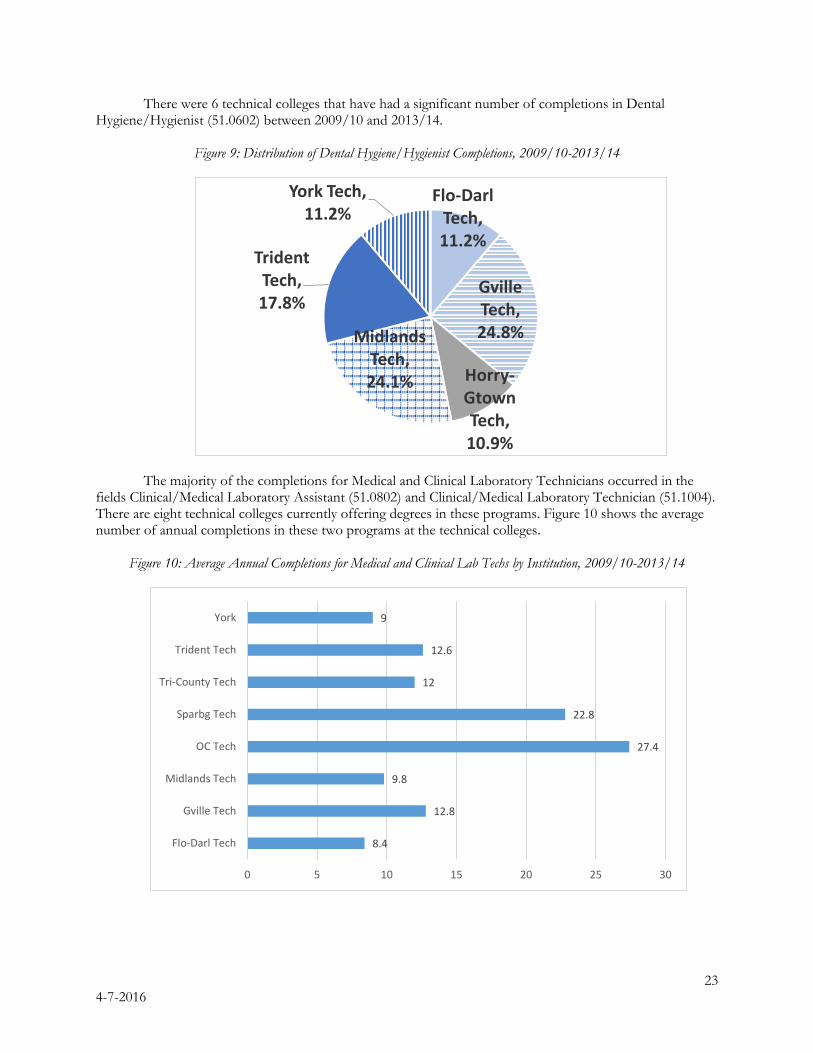
Currently only 12 Technical Colleges and South University14 are graduating students in the area of
Medical Assistant. The graduates are concentrated in CIP 51.0801 (Medical/Clinical Assistant) and 51.0716 (Medical Admin./Exec. Assistant and Medical Secretary). Another potential source of qualified job applicants for this field may come from other for-profit or proprietary institutions. York Technical College had the highest concentration of completers for this area, over one-quarter.
Figure 8: Distribution of Medical Assistant Completions, 2009/10-2013/14
14 South University is a for-profit, degree-granting institution.
5257
63 62 63
1318 17 19 16
0
10
20
30
40
50
60
70
2009
-10
2010
-11
2011
-12
2012
-13
2013
-14
2009
-10
2010
-11
2011
-12
2012
-13
2013
-14
MUSC USC
3.0% 4.3% 4.3% 5.3% 5.3% 5.3% 6.0% 6.5% 6.8% 7.9% 8.3% 8.4%
28.7%
0.0%5.0%
10.0%15.0%20.0%25.0%30.0%35.0%
22 4-7-2016
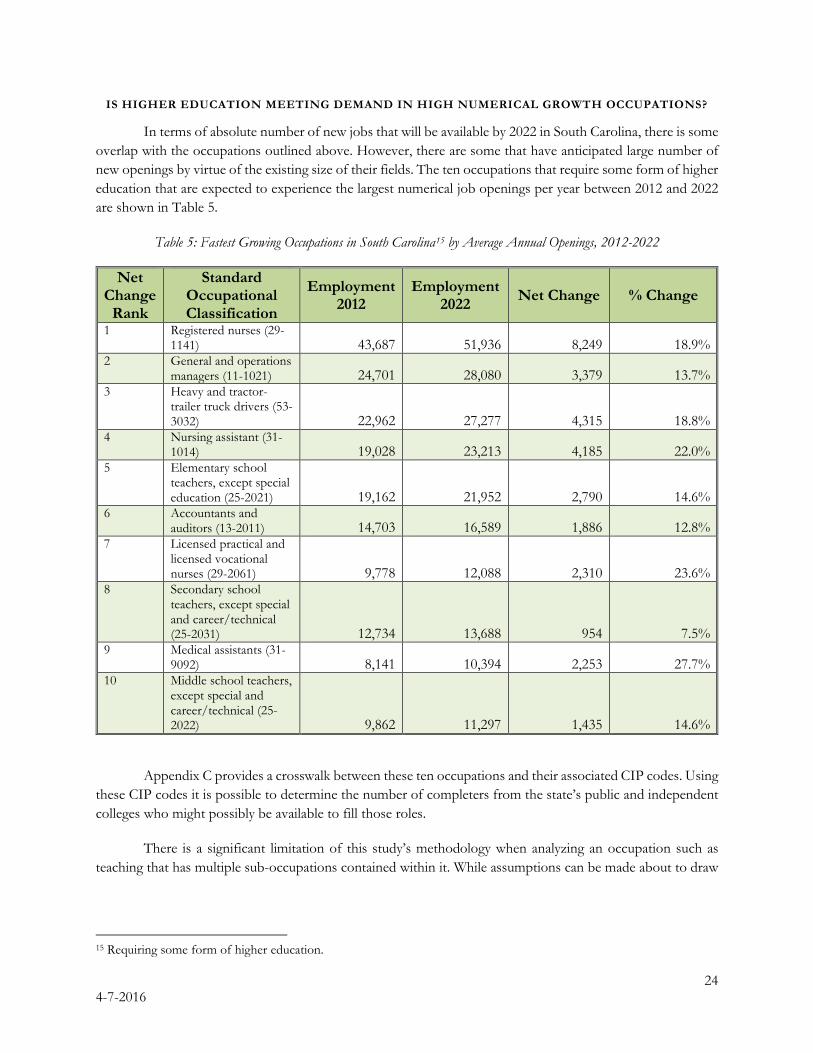
There were 6 technical colleges that have had a significant number of completions in Dental Hygiene/Hygienist (51.0602) between 2009/10 and 2013/14.
Figure 9: Distribution of Dental Hygiene/Hygienist Completions, 2009/10-2013/14
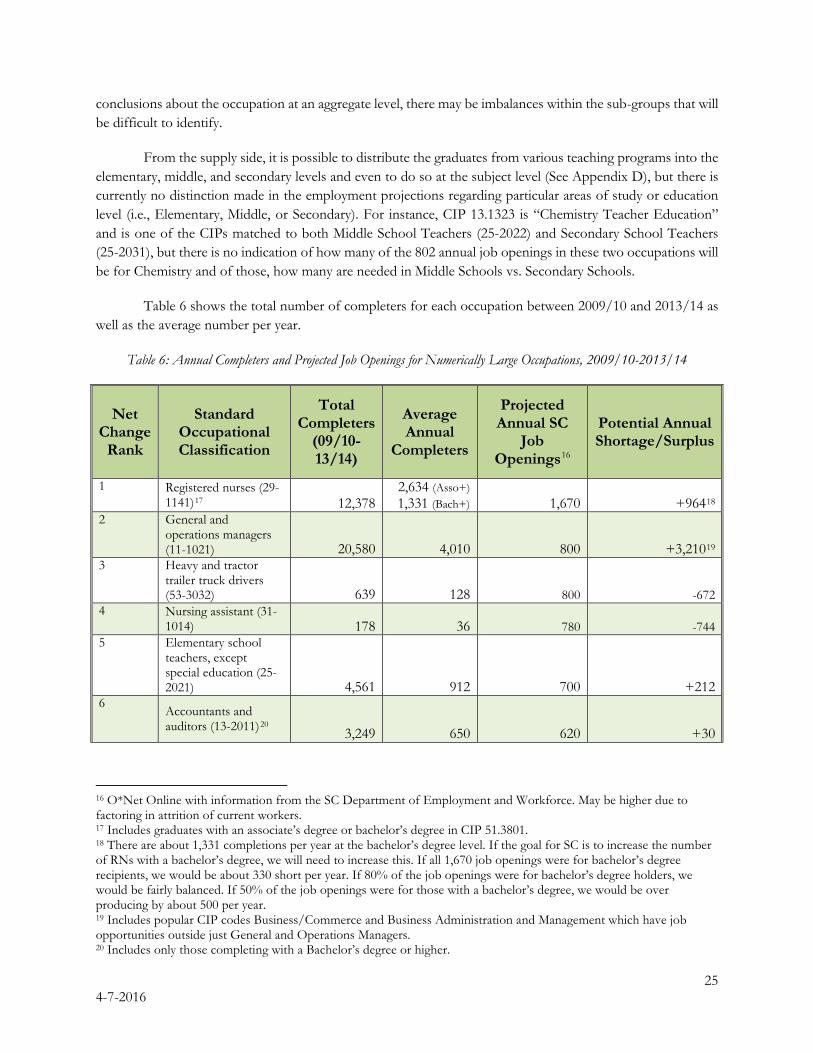
The majority of the completions for Medical and Clinical Laboratory Technicians occurred in the
fields Clinical/Medical Laboratory Assistant (51.0802) and Clinical/Medical Laboratory Technician (51.1004). There are eight technical colleges currently offering degrees in these programs. Figure 10 shows the average number of annual completions in these two programs at the technical colleges.
Figure 10: Average Annual Completions for Medical and Clinical Lab Techs by Institution, 2009/10-2013/14
Flo-Darl Tech, 11.2%
Gville Tech, 24.8%
Horry-Gtown Tech, 10.9%
Midlands Tech, 24.1%
Trident Tech, 17.8%
York Tech, 11.2%
8.4
12.8
9.8
27.4
22.8
12
12.6
9
0 5 10 15 20 25 30
Flo-Darl Tech
Gville Tech
Midlands Tech
OC Tech
Sparbg Tech
Tri-County Tech
Trident Tech
York
23 4-7-2016
IS HIGHER EDUCATION MEETING DEMAND IN HIGH NUMERICAL GROWTH OCCUPATIONS?
In terms of absolute number of new jobs that will be available by 2022 in South Carolina, there is some overlap with the occupations outlined above. However, there are some that have anticipated large number of new openings by virtue of the existing size of their fields. The ten occupations that require some form of higher education that are expected to experience the largest numerical job openings per year between 2012 and 2022 are shown in Table 5.
Table 5: Fastest Growing Occupations in South Carolina15 by Average Annual Openings, 2012-2022
Net Change
Rank
Standard Occupational Classification
Employment 2012
Employment 2022 Net Change % Change
1 Registered nurses (29-1141) 43,687 51,936 8,249 18.9%
2 General and operations managers (11-1021) 24,701 28,080 3,379 13.7%
3 Heavy and tractor-trailer truck drivers (53-3032) 22,962 27,277 4,315 18.8%
4 Nursing assistant (31-1014) 19,028 23,213 4,185 22.0%
5 Elementary school teachers, except special education (25-2021) 19,162 21,952 2,790 14.6%
6 Accountants and auditors (13-2011) 14,703 16,589 1,886 12.8%
7 Licensed practical and licensed vocational nurses (29-2061) 9,778 12,088 2,310 23.6%
8 Secondary school teachers, except special and career/technical (25-2031) 12,734 13,688 954 7.5%
9 Medical assistants (31-9092) 8,141 10,394 2,253 27.7%
10 Middle school teachers, except special and career/technical (25-2022) 9,862 11,297 1,435 14.6%
Appendix C provides a crosswalk between these ten occupations and their associated CIP codes. Using these CIP codes it is possible to determine the number of completers from the state’s public and independent colleges who might possibly be available to fill those roles.
There is a significant limitation of this study’s methodology when analyzing an occupation such as teaching that has multiple sub-occupations contained within it. While assumptions can be made about to draw
15 Requiring some form of higher education.
24 4-7-2016
conclusions about the occupation at an aggregate level, there may be imbalances within the sub-groups that will be difficult to identify.
From the supply side, it is possible to distribute the graduates from various teaching programs into the elementary, middle, and secondary levels and even to do so at the subject level (See Appendix D), but there is currently no distinction made in the employment projections regarding particular areas of study or education level (i.e., Elementary, Middle, or Secondary). For instance, CIP 13.1323 is “Chemistry Teacher Education” and is one of the CIPs matched to both Middle School Teachers (25-2022) and Secondary School Teachers (25-2031), but there is no indication of how many of the 802 annual job openings in these two occupations will be for Chemistry and of those, how many are needed in Middle Schools vs. Secondary Schools.
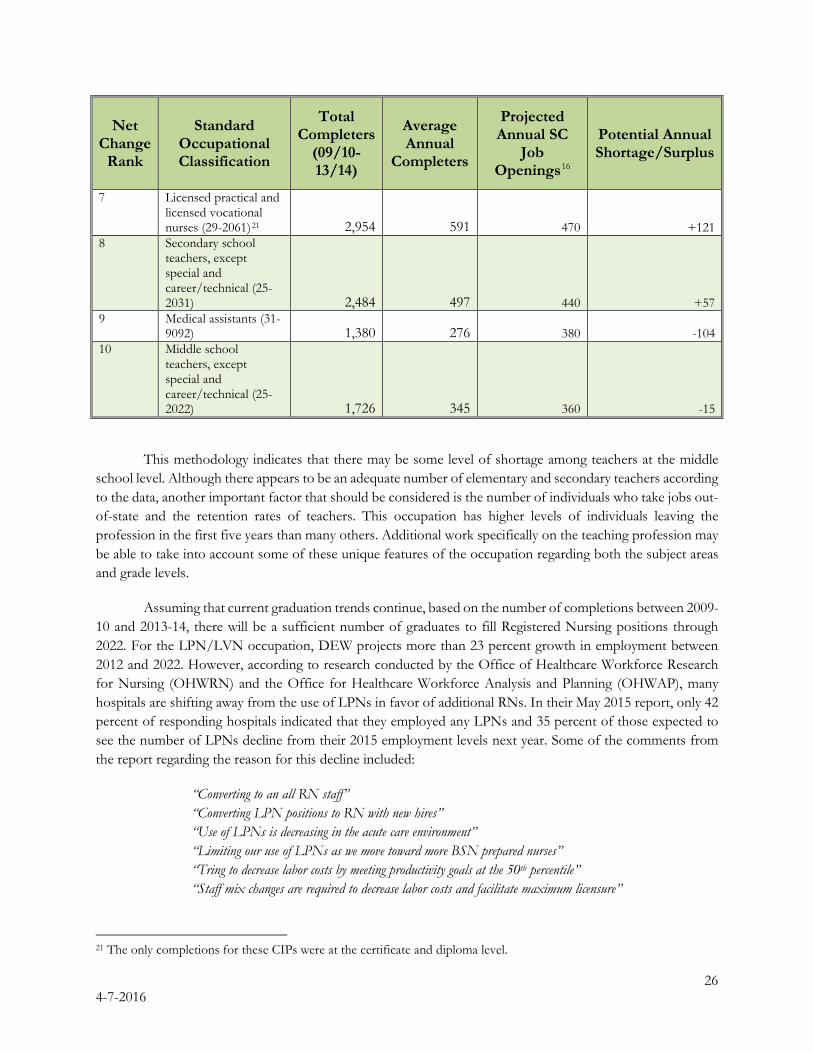
Table 6 shows the total number of completers for each occupation between 2009/10 and 2013/14 as well as the average number per year.
Table 6: Annual Completers and Projected Job Openings for Numerically Large Occupations, 2009/10-2013/14
Net Change
Rank
Standard Occupational Classification
Total Completers
(09/10-13/14)
Average Annual
Completers
Projected Annual SC
Job Openings16
Potential Annual Shortage/Surplus
1 Registered nurses (29-1141)17 12,378
2,634 (Asso+) 1,331 (Bach+) 1,670 +96418
2 General and operations managers (11-1021) 20,580 4,010 800 +3,21019
3 Heavy and tractor trailer truck drivers (53-3032) 639 128 800 -672
4 Nursing assistant (31-1014) 178 36 780 -744
5 Elementary school teachers, except special education (25-2021) 4,561 912 700 +212
6 Accountants and auditors (13-2011)20 3,249 650 620 +30
16 O*Net Online with information from the SC Department of Employment and Workforce. May be higher due to factoring in attrition of current workers. 17 Includes graduates with an associate’s degree or bachelor’s degree in CIP 51.3801. 18 There are about 1,331 completions per year at the bachelor’s degree level. If the goal for SC is to increase the number of RNs with a bachelor’s degree, we will need to increase this. If all 1,670 job openings were for bachelor’s degree recipients, we would be about 330 short per year. If 80% of the job openings were for bachelor’s degree holders, we would be fairly balanced. If 50% of the job openings were for those with a bachelor’s degree, we would be over producing by about 500 per year. 19 Includes popular CIP codes Business/Commerce and Business Administration and Management which have job opportunities outside just General and Operations Managers. 20 Includes only those completing with a Bachelor’s degree or higher.
25 4-7-2016
Net Change
Rank
Standard Occupational Classification
Total Completers
(09/10-13/14)
Average Annual
Completers
Projected Annual SC
Job Openings16
Potential Annual Shortage/Surplus
7 Licensed practical and licensed vocational nurses (29-2061)21 2,954 591 470 +121
8 Secondary school teachers, except special and career/technical (25-2031) 2,484 497 440 +57
9 Medical assistants (31-9092) 1,380 276 380 -104
10 Middle school teachers, except special and career/technical (25-2022) 1,726 345 360 -15
This methodology indicates that there may be some level of shortage among teachers at the middle school level. Although there appears to be an adequate number of elementary and secondary teachers according to the data, another important factor that should be considered is the number of individuals who take jobs out-of-state and the retention rates of teachers. This occupation has higher levels of individuals leaving the profession in the first five years than many others. Additional work specifically on the teaching profession may be able to take into account some of these unique features of the occupation regarding both the subject areas and grade levels.
Assuming that current graduation trends continue, based on the number of completions between 2009-10 and 2013-14, there will be a sufficient number of graduates to fill Registered Nursing positions through 2022. For the LPN/LVN occupation, DEW projects more than 23 percent growth in employment between 2012 and 2022. However, according to research conducted by the Office of Healthcare Workforce Research for Nursing (OHWRN) and the Office for Healthcare Workforce Analysis and Planning (OHWAP), many hospitals are shifting away from the use of LPNs in favor of additional RNs. In their May 2015 report, only 42 percent of responding hospitals indicated that they employed any LPNs and 35 percent of those expected to see the number of LPNs decline from their 2015 employment levels next year. Some of the comments from the report regarding the reason for this decline included:
“Converting to an all RN staff” “Converting LPN positions to RN with new hires” “Use of LPNs is decreasing in the acute care environment” “Limiting our use of LPNs as we move toward more BSN prepared nurses” “Tring to decrease labor costs by meeting productivity goals at the 50th percentile” “Staff mix changes are required to decrease labor costs and facilitate maximum licensure”
21 The only completions for these CIPs were at the certificate and diploma level.
26 4-7-2016
This shift in nursing staff distribution may not be properly accounted for in the employment projections. There are several options for those within the LPN/LVN occupation to find other employment opportunities including: working in a non-hospital setting, returning for additional schooling to become an RN, or accepting some of the projected openings for Nursing Assistants.
Nursing assistants is an occupation that appears to be potentially facing a shortage of qualified workers. For nursing assistants, there will be an estimated 780 new annual openings through 2022 with only 36 completers per year, on average, from SC public and independent institutions. This mismatch may be somewhat alleviated by the high number of individuals completing degrees associated with Registered Nursing and LPN/LVN. Additionally, the number of completers for CIP code 51.3902 (Nursing Aides and Assistants) has been increasing steadily between 2009-10 and 2013-14. Among the hospitals responding to the OHWRN/OHWAP survey, they also expect to experience increases in the number of their staff who are aides/assistants compared to 2015. Reasons cited include:
“More CNAs are needed to ensure good patient experience” “More nurse aides are needed for companion/sitter positions” “Opening more beds/patient volumes are increasing” “We are expecting high occupancy rates” “Converting to a different care model that includes CNAs”
There are a large number of entities outside of the state’s public and independent institutions that offer the truck driver training required to obtain a Commercial Driver’s License (CDL). Thus, the projected shortage of truck drivers shown in Table 6 may overstate the disparity. Similar to the findings in the previous section, it appears that medical assisting is also an area of potential shortage.
SECTION 5: EMPLOYMENT OUTLOOK FOR “STEM” FIELDS AND GRADUATION TREND S
There has been extensive discussion statewide and across the nation about the value and need for additional graduates in the STEM fields (i.e., Science, Technology, Engineering, and Math). According to the South Carolina Science and Technology Task Force22, “(a) skilled workforce educated in the sciences, technology, engineering, and mathematics disciplines is critical for building innovative products, services, and firms, which in turn drives economic growth.” That task force also set the goal of expanding the number of students with Ph.D., MS, and BA/BS degrees in STEM fields by 25 percent by 2025.
The occupations and programs of study that qualify as a STEM field has been the subject of some debate and differing definitions do exist. However, most organizations use the definition adopted by the National Science Foundation (NSF). It should be noted that the NSF definition does not include one of the largest and fastest growing sectors of the US economy, health care. Other organizations, such as the Bureau of Labor Statistics (BLS), do consider some health care occupations to be STEM.
In this section, using the NSF definitions of STEM, we compare the number of graduates in a selection of STEM fields with the projected employment growth for those related STEM occupations and identify areas
22 A committee composed of representatives from academia, industry, and government led by Dr. Prakash Nagarkatti, Vice President for Research at USC.
27 4-7-2016
of potential mismatch. Some factors to consider when analyzing these numbers include the availability of STEM field jobs for non-college graduates and the percentage of STEM majors that ultimately go on to hold jobs in non-STEM occupations. For instance, in computer science related occupations there is a sizeable percentage of the current workforce that does not have a college (particularly 4-year) degree associated with computer science (Costa, 2012). Wesley Robinson in The Washington Post cites a US Census Bureau report that shows that “people with bachelor’s degrees in science, technology, engineering, and math are more likely than other college graduates to have a job, but most of them don’t work in STEM occupations…”
LIFE AND BIOLOGICAL SCIENCES
Life and Biological sciences are popular fields of study for many students in South Carolina’s colleges and universities. In fact, Biology has been the 4th most popular field of study over the past 5 years while Psychology has been the 9th most common. While each of these sectors is considered to be a part of STEM, there are reasons to believe that there are more of these types of majors than will be able to find jobs in the state in the same field.
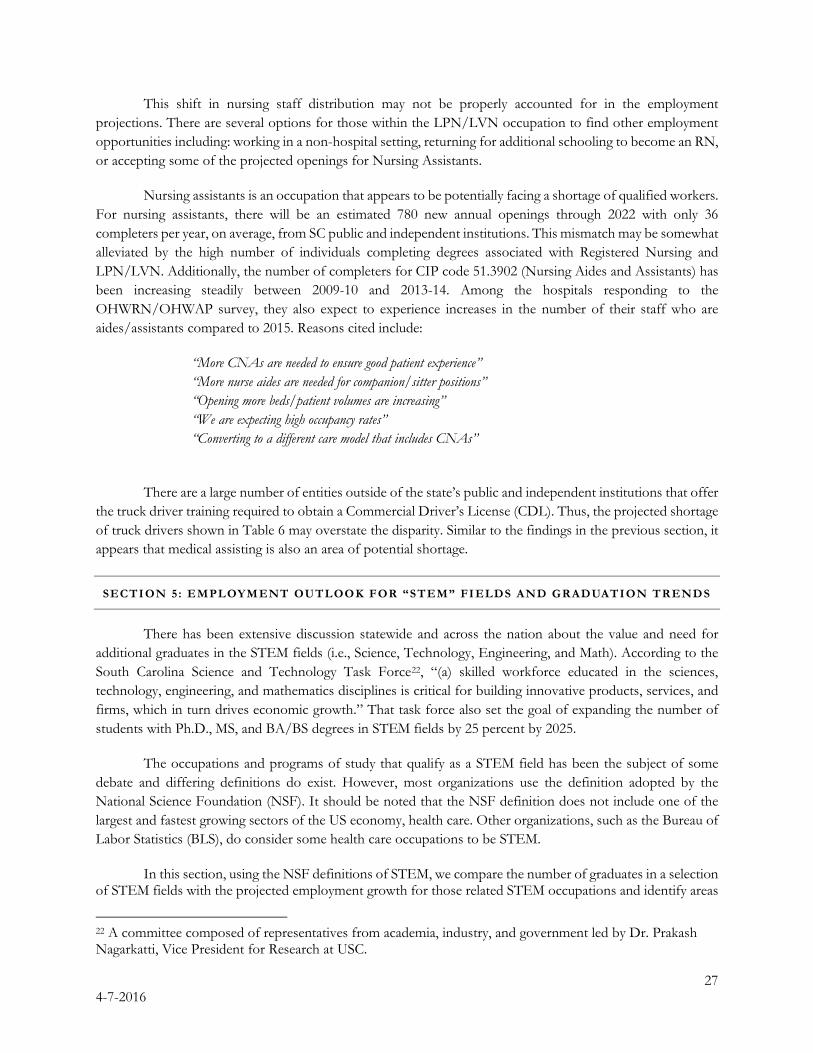
DEW projects that there will be about 50 new annual job openings for occupations associated with biology including: Biochemists and Biophysicists (19-1021), Microbiologists (19-1022), Zoologists and Wildlife Biologists (19-1023), Biological Scientists, All Other (19-1099), and Biological Science Teachers, Post-Secondary (25-1042). The cross walk between SOC codes and CIP codes does not consider the portion of biology majors that may end up going on to receive further education through a medical, dental, or veterinary school. This may be one outlet for potential surplus graduates while teaching in the Middle and Secondary Schools might also provide additional job openings. Still, the large number of completions annually in this major has the potential to create underemployment for graduates who are not able to find a job in their field of study.
Among the completers in these CIP codes, about 95 percent received a bachelor’s degree while 5 percent, or about 80 per year received a master’s or doctoral degree. According to DEW there will only be about 20 job openings in this area per year for those with only a bachelor’s degree. The remaining 30 job openings annually will require either a master’s or doctoral degree. Thus, the potential mismatch in this field is minimized for the post-baccalaureate graduates but remains quite high for those with a bachelor’s degree.
Researchers also project about 50 annual job openings for psychologists in the occupations of: Clinical, Counseling, and School Psychologists (19-3031), Industrial-Organizational Psychologists (19-3032), and Psychologists, All Other (19-3039). There were approximately 1,505 graduates per year in CIPs related to these occupations over the past five years. Unless graduates are finding work in closely related fields such as social work, there will be a significantly larger number of job seekers than jobs available in this field.
Looking more closely at the educational attainment of those 1,505 graduates shows that about 91 percent graduated with a bachelor’s degree while the remaining 9 percent completed either a master’s degree (6 percent), post-master’s degree (2 percent), or doctoral degree (1 percent). All of the occupations associated with this area require either a master’s degree or doctoral degree typically. This equates to about 138 graduates per year at this educational attainment level compared to the 50 job openings. This leaves a large number of graduates with bachelor’s degrees with few job prospects within their chosen field unless they continue their education further or take positions in closely related fields.
28 4-7-2016
Figure 11 shows these disparities.
Figure 11: Life and Biological Sciences Occupations Annual Job Openings vs. Annual Graduates
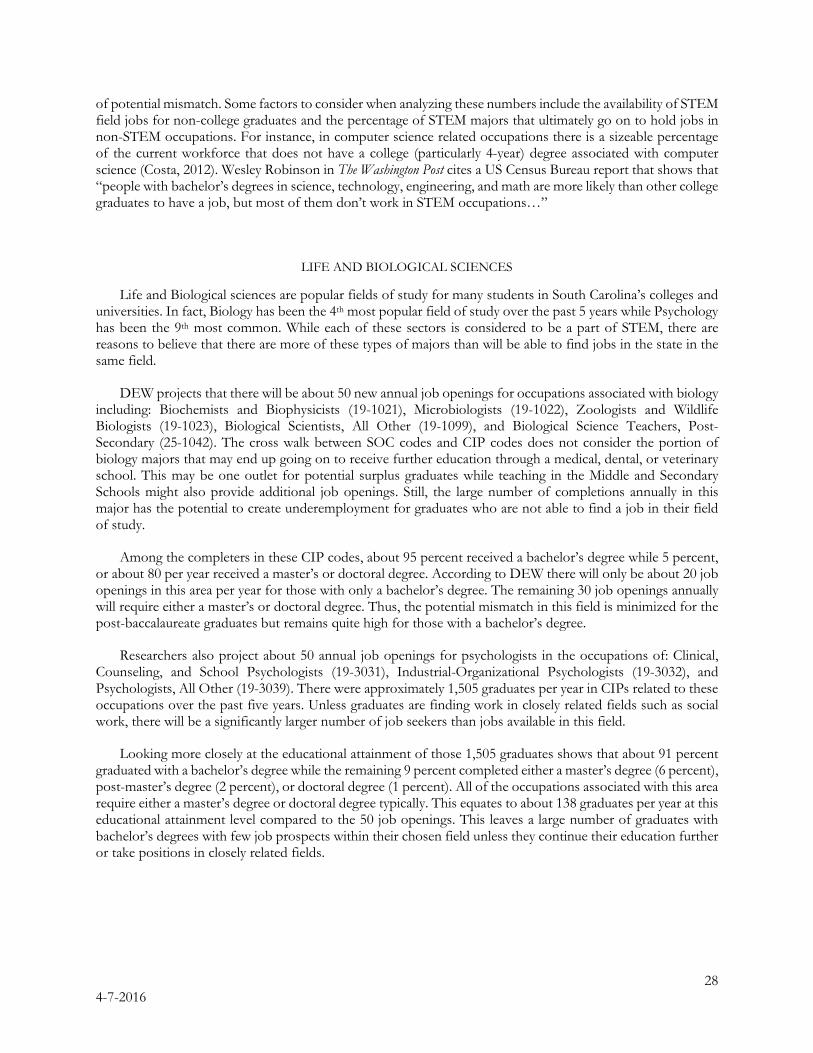
There are currently only pre-veterinarian programs of study (51.0905) available to students in South Carolina. However, the state does have agreements with institutions in other states to allow SC residents to obtain in-state tuition for a certain number of veterinary seats. There will be a projected 50 new jobs available each year for Veterinarians (29-1131) but these will have to be filled by students who have graduated with a degree in another state who return to SC to work. There are a significantly larger number of pre-veterinarian graduates than there will be veterinarian job openings. Many of these individuals may be able to work in associated fields such as Veterinarian Technicians (29-2056) which will likely provide another 50 job openings annually.
While there are about 16 completions at the certificate level in Nuclear Medicine Technology-related fields of study (29-2033) each year, this job typically requires an associate’s degree. It appears that there may be a significant shortage in the number of Medical and Clinical Laboratory Technologists (29-2011) and Medical and Clinical Laboratory Technicians (29-2012) graduates compared to the number of jobs needing to be filled. Typically the technician jobs require an associate’s degree while the technologist jobs require a bachelor’s degree. This information is displayed in Figure 12.
1,536
1,505
50
50
0 200 400 600 800 1,000 1,200 1,400 1,600 1,800
Biology
Psychologists
Annual Completions Annual Openings
29 4-7-2016
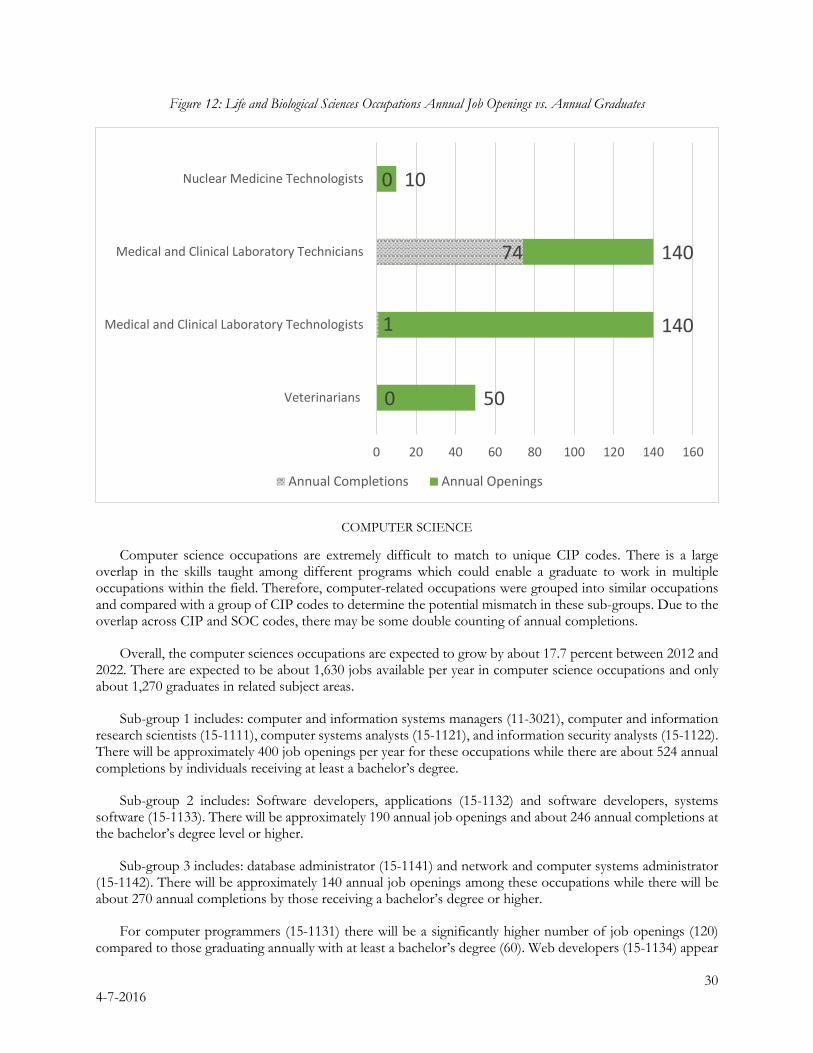
Figure 12: Life and Biological Sciences Occupations Annual Job Openings vs. Annual Graduates
COMPUTER SCIENCE
Computer science occupations are extremely difficult to match to unique CIP codes. There is a large overlap in the skills taught among different programs which could enable a graduate to work in multiple occupations within the field. Therefore, computer-related occupations were grouped into similar occupations and compared with a group of CIP codes to determine the potential mismatch in these sub-groups. Due to the overlap across CIP and SOC codes, there may be some double counting of annual completions.
Overall, the computer sciences occupations are expected to grow by about 17.7 percent between 2012 and 2022. There are expected to be about 1,630 jobs available per year in computer science occupations and only about 1,270 graduates in related subject areas.
Sub-group 1 includes: computer and information systems managers (11-3021), computer and information research scientists (15-1111), computer systems analysts (15-1121), and information security analysts (15-1122). There will be approximately 400 job openings per year for these occupations while there are about 524 annual completions by individuals receiving at least a bachelor’s degree.
Sub-group 2 includes: Software developers, applications (15-1132) and software developers, systems software (15-1133). There will be approximately 190 annual job openings and about 246 annual completions at the bachelor’s degree level or higher.
Sub-group 3 includes: database administrator (15-1141) and network and computer systems administrator (15-1142). There will be approximately 140 annual job openings among these occupations while there will be about 270 annual completions by those receiving a bachelor’s degree or higher.
For computer programmers (15-1131) there will be a significantly higher number of job openings (120) compared to those graduating annually with at least a bachelor’s degree (60). Web developers (15-1134) appear
50
140
140
10
0
1
74
0
0 20 40 60 80 100 120 140 160
Veterinarians
Medical and Clinical Laboratory Technologists
Medical and Clinical Laboratory Technicians
Nuclear Medicine Technologists
Annual Completions Annual Openings
30 4-7-2016
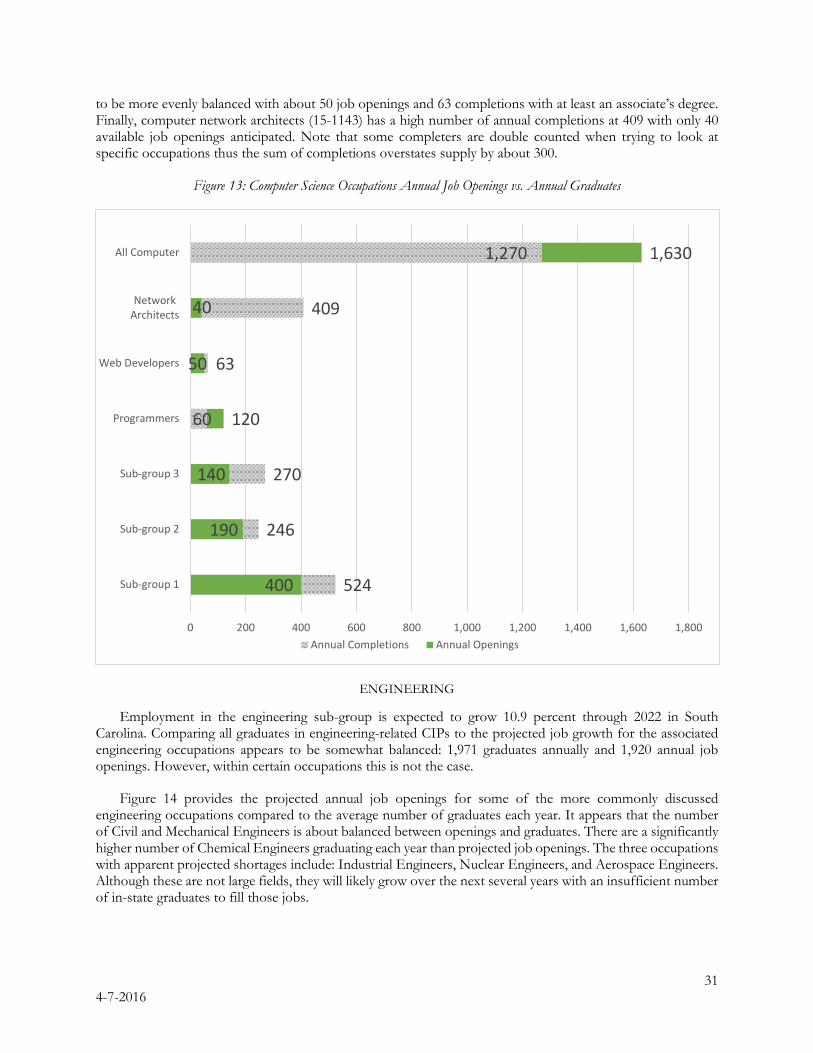
to be more evenly balanced with about 50 job openings and 63 completions with at least an associate’s degree. Finally, computer network architects (15-1143) has a high number of annual completions at 409 with only 40 available job openings anticipated. Note that some completers are double counted when trying to look at specific occupations thus the sum of completions overstates supply by about 300.
Figure 13: Computer Science Occupations Annual Job Openings vs. Annual Graduates
ENGINEERING
Employment in the engineering sub-group is expected to grow 10.9 percent through 2022 in South Carolina. Comparing all graduates in engineering-related CIPs to the projected job growth for the associated engineering occupations appears to be somewhat balanced: 1,971 graduates annually and 1,920 annual job openings. However, within certain occupations this is not the case.
Figure 14 provides the projected annual job openings for some of the more commonly discussed engineering occupations compared to the average number of graduates each year. It appears that the number of Civil and Mechanical Engineers is about balanced between openings and graduates. There are a significantly higher number of Chemical Engineers graduating each year than projected job openings. The three occupations with apparent projected shortages include: Industrial Engineers, Nuclear Engineers, and Aerospace Engineers. Although these are not large fields, they will likely grow over the next several years with an insufficient number of in-state graduates to fill those jobs.
400
190
140
120
50
40
1,630
524
246
270
60
63
409
1,270
0 200 400 600 800 1,000 1,200 1,400 1,600 1,800
Sub-group 1
Sub-group 2
Sub-group 3
Programmers
Web Developers
NetworkArchitects
All Computer
Annual Completions Annual Openings
31 4-7-2016
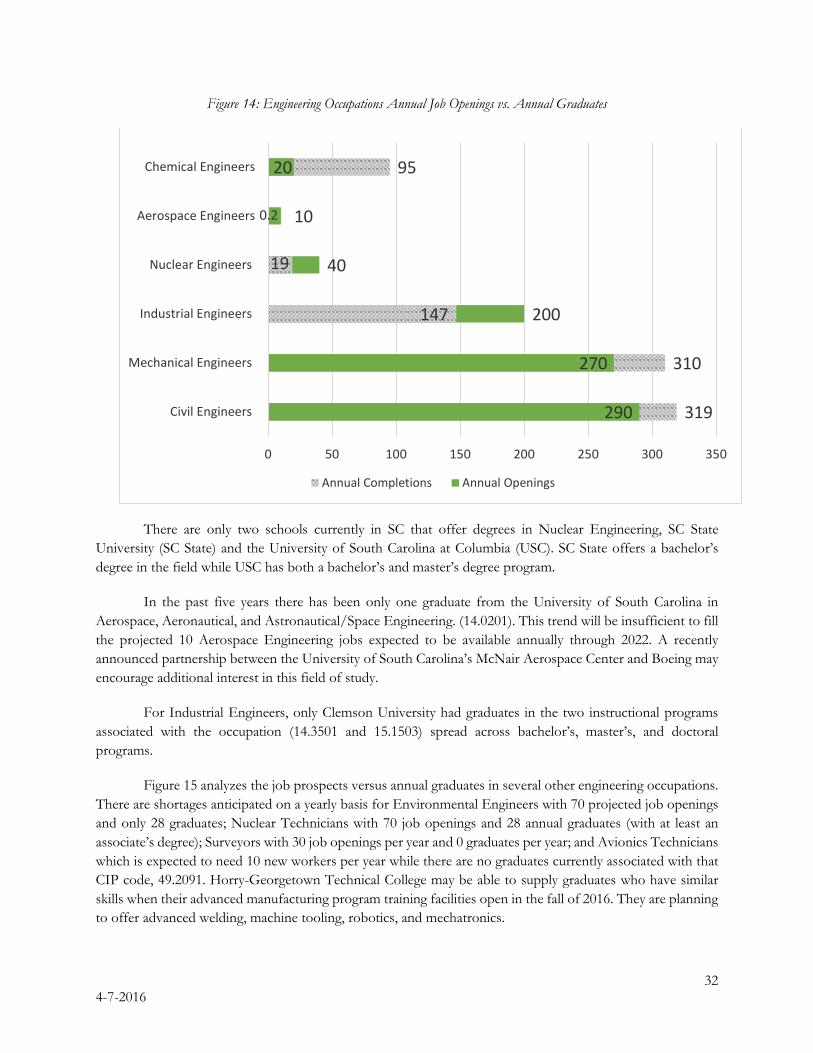
Figure 14: Engineering Occupations Annual Job Openings vs. Annual Graduates
There are only two schools currently in SC that offer degrees in Nuclear Engineering, SC State University (SC State) and the University of South Carolina at Columbia (USC). SC State offers a bachelor’s degree in the field while USC has both a bachelor’s and master’s degree program.
In the past five years there has been only one graduate from the University of South Carolina in Aerospace, Aeronautical, and Astronautical/Space Engineering. (14.0201). This trend will be insufficient to fill the projected 10 Aerospace Engineering jobs expected to be available annually through 2022. A recently announced partnership between the University of South Carolina’s McNair Aerospace Center and Boeing may encourage additional interest in this field of study.
For Industrial Engineers, only Clemson University had graduates in the two instructional programs associated with the occupation (14.3501 and 15.1503) spread across bachelor’s, master’s, and doctoral programs.
Figure 15 analyzes the job prospects versus annual graduates in several other engineering occupations. There are shortages anticipated on a yearly basis for Environmental Engineers with 70 projected job openings and only 28 graduates; Nuclear Technicians with 70 job openings and 28 annual graduates (with at least an associate’s degree); Surveyors with 30 job openings per year and 0 graduates per year; and Avionics Technicians which is expected to need 10 new workers per year while there are no graduates currently associated with that CIP code, 49.2091. Horry-Georgetown Technical College may be able to supply graduates who have similar skills when their advanced manufacturing program training facilities open in the fall of 2016. They are planning to offer advanced welding, machine tooling, robotics, and mechatronics.
200
40
10
319
310
147
19
0.2
95
290
270
20
0 50 100 150 200 250 300 350
Civil Engineers
Mechanical Engineers
Industrial Engineers
Nuclear Engineers
Aerospace Engineers
Chemical Engineers
Annual Completions Annual Openings
32 4-7-2016
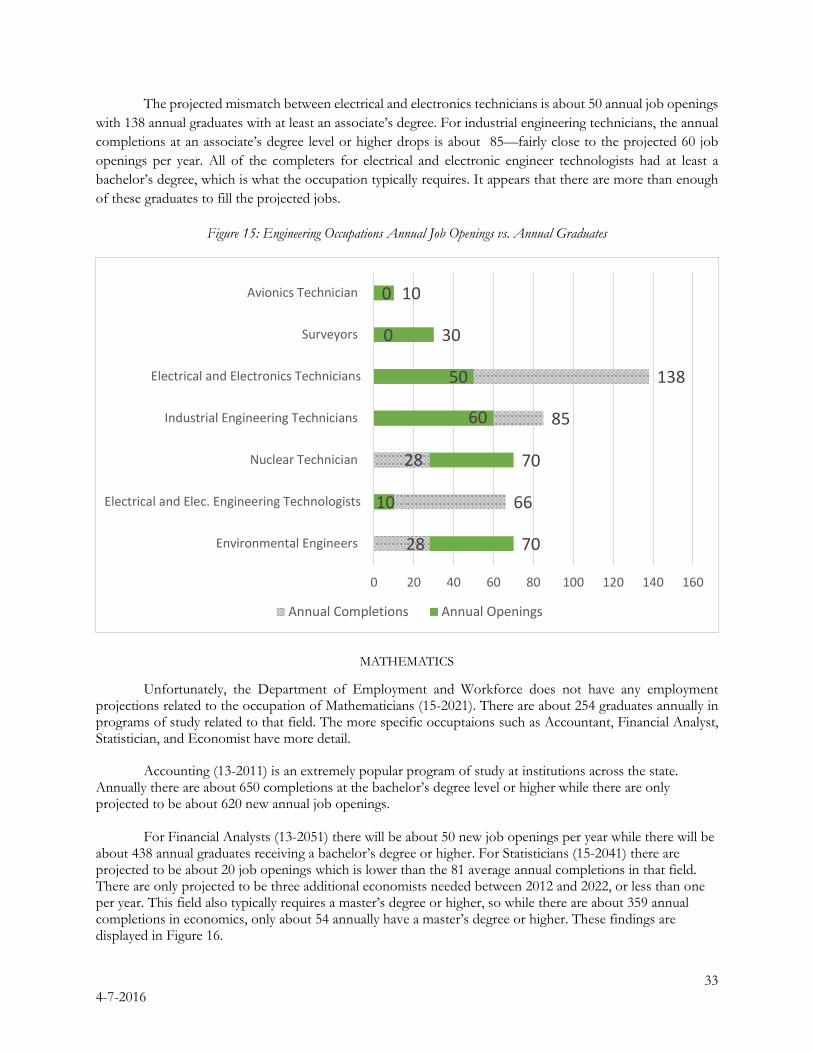
The projected mismatch between electrical and electronics technicians is about 50 annual job openings with 138 annual graduates with at least an associate’s degree. For industrial engineering technicians, the annual completions at an associate’s degree level or higher drops is about 85—fairly close to the projected 60 job openings per year. All of the completers for electrical and electronic engineer technologists had at least a bachelor’s degree, which is what the occupation typically requires. It appears that there are more than enough of these graduates to fill the projected jobs.
Figure 15: Engineering Occupations Annual Job Openings vs. Annual Graduates
MATHEMATICS
Unfortunately, the Department of Employment and Workforce does not have any employment projections related to the occupation of Mathematicians (15-2021). There are about 254 graduates annually in programs of study related to that field. The more specific occuptaions such as Accountant, Financial Analyst, Statistician, and Economist have more detail.
Accounting (13-2011) is an extremely popular program of study at institutions across the state. Annually there are about 650 completions at the bachelor’s degree level or higher while there are only projected to be about 620 new annual job openings.
For Financial Analysts (13-2051) there will be about 50 new job openings per year while there will be about 438 annual graduates receiving a bachelor’s degree or higher. For Statisticians (15-2041) there are projected to be about 20 job openings which is lower than the 81 average annual completions in that field. There are only projected to be three additional economists needed between 2012 and 2022, or less than one per year. This field also typically requires a master’s degree or higher, so while there are about 359 annual completions in economics, only about 54 annually have a master’s degree or higher. These findings are displayed in Figure 16.
70
10
70
60
50
30
10
28
66
28
85
138
0
0
0 20 40 60 80 100 120 140 160
Environmental Engineers
Electrical and Elec. Engineering Technologists
Nuclear Technician
Industrial Engineering Technicians
Electrical and Electronics Technicians
Surveyors
Avionics Technician
Annual Completions Annual Openings
33 4-7-2016
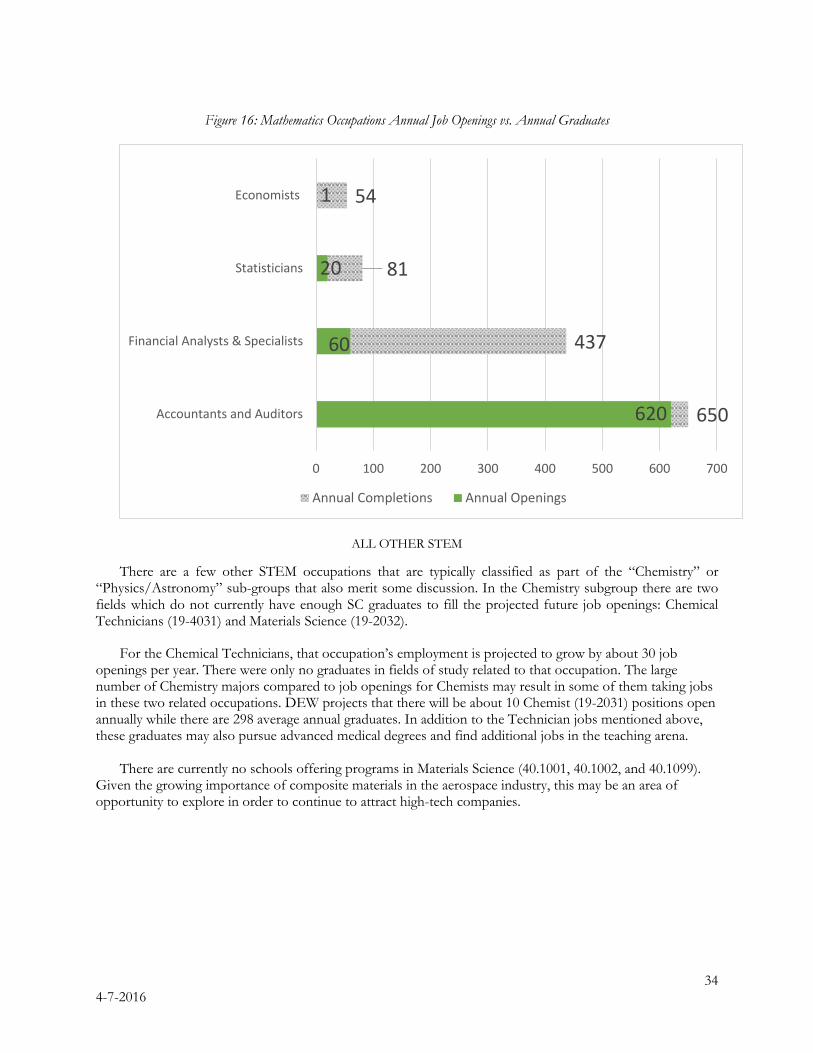
Figure 16: Mathematics Occupations Annual Job Openings vs. Annual Graduates
ALL OTHER STEM
There are a few other STEM occupations that are typically classified as part of the “Chemistry” or “Physics/Astronomy” sub-groups that also merit some discussion. In the Chemistry subgroup there are two fields which do not currently have enough SC graduates to fill the projected future job openings: Chemical Technicians (19-4031) and Materials Science (19-2032).
For the Chemical Technicians, that occupation’s employment is projected to grow by about 30 job openings per year. There were only no graduates in fields of study related to that occupation. The large number of Chemistry majors compared to job openings for Chemists may result in some of them taking jobs in these two related occupations. DEW projects that there will be about 10 Chemist (19-2031) positions open annually while there are 298 average annual graduates. In addition to the Technician jobs mentioned above, these graduates may also pursue advanced medical degrees and find additional jobs in the teaching arena.
There are currently no schools offering programs in Materials Science (40.1001, 40.1002, and 40.1099). Given the growing importance of composite materials in the aerospace industry, this may be an area of opportunity to explore in order to continue to attract high-tech companies.
650
437
81
54
620
60
20
1
0 100 200 300 400 500 600 700
Accountants and Auditors
Financial Analysts & Specialists
Statisticians
Economists
Annual Completions Annual Openings
34 4-7-2016
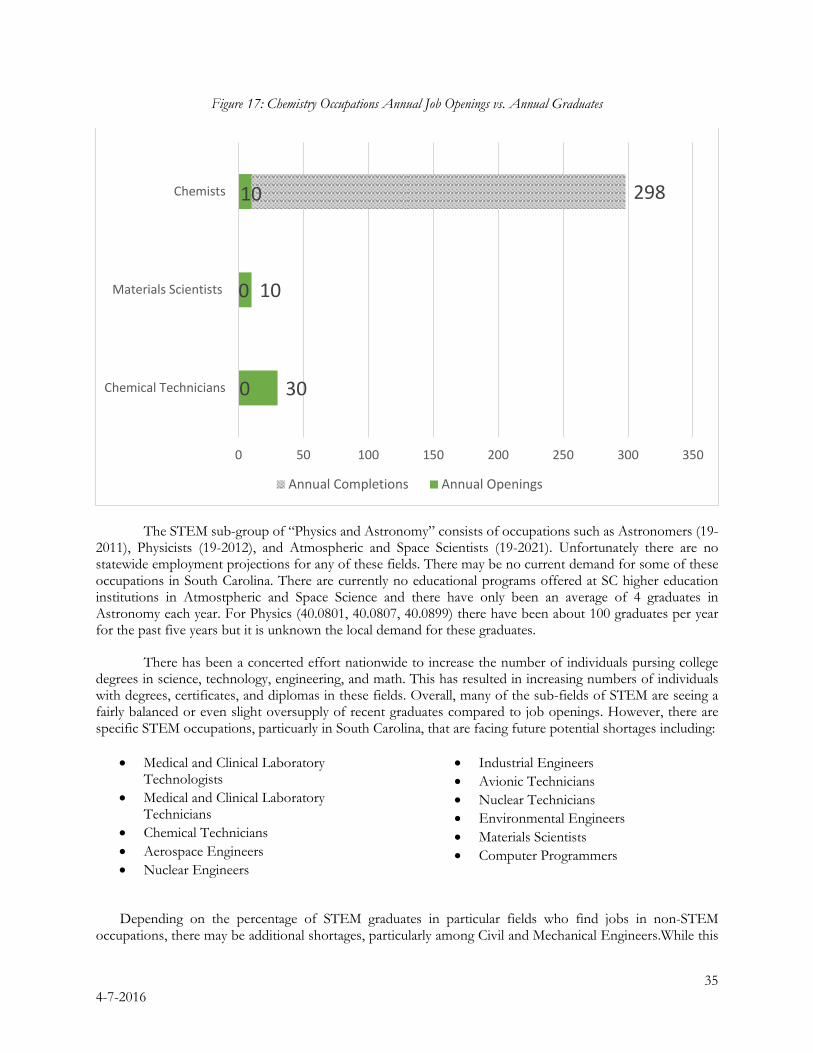
Figure 17: Chemistry Occupations Annual Job Openings vs. Annual Graduates
The STEM sub-group of “Physics and Astronomy” consists of occupations such as Astronomers (19-2011), Physicists (19-2012), and Atmospheric and Space Scientists (19-2021). Unfortunately there are no statewide employment projections for any of these fields. There may be no current demand for some of these occupations in South Carolina. There are currently no educational programs offered at SC higher education institutions in Atmostpheric and Space Science and there have only been an average of 4 graduates in Astronomy each year. For Physics (40.0801, 40.0807, 40.0899) there have been about 100 graduates per year for the past five years but it is unknown the local demand for these graduates.
There has been a concerted effort nationwide to increase the number of individuals pursing college degrees in science, technology, engineering, and math. This has resulted in increasing numbers of individuals with degrees, certificates, and diplomas in these fields. Overall, many of the sub-fields of STEM are seeing a fairly balanced or even slight oversupply of recent graduates compared to job openings. However, there are specific STEM occupations, particuarly in South Carolina, that are facing future potential shortages including:
• Medical and Clinical Laboratory Technologists
• Medical and Clinical Laboratory Technicians
• Chemical Technicians • Aerospace Engineers • Nuclear Engineers
• Industrial Engineers • Avionic Technicians • Nuclear Technicians • Environmental Engineers • Materials Scientists • Computer Programmers
Depending on the percentage of STEM graduates in particular fields who find jobs in non-STEM occupations, there may be additional shortages, particularly among Civil and Mechanical Engineers.While this
30
10
0
298
0
10
0 50 100 150 200 250 300 350
Chemical Technicians
Materials Scientists
Chemists
Annual Completions Annual Openings
35 4-7-2016
section does not represent all of the individual occupations in STEM, it does provide an overview of some of the larger and faster growing ones that should be studied in more depth to determine the severity of the projected shortage and potential ways to mitigate those shortages.
SECTION 6: CONCLUSION
South Carolina colleges and universities have produced more total graduates each year than the previous year for the past five years. While increasing the number of citizens with some form of higher education is one goal, producing the right number of graduates in the right fields is another topic to be considered and discussed. Among the most popular programs of study over the past five years, there are many that do not have high projected employment through 2022. This may result in difficulties finding jobs in their field of training and possibly taking jobs in other fields that do not fully utilize their education background.
There appear to be enough graduates in popular majors such as Biology, Social Work, Psychology, English, and History to meet projected employment demand through 2022. In contrast, there are other areas that are projected to have rapid employment growth over the next several years where there could be an insufficient number of SC college graduates to fill them. These programs of study include LPN/LVN, Marketing Management, and Heat, Air, Ventilation, and Refrigerator Maintenance Technicians. While these are the trends seen in current data, it is important to note that there are limitations of the crosswalk between instructional program codes and occupational codes as well as rapid changes in the job market that may not be fully reflected in the 10-year employment projections. Thus, these findings should be seen as a starting point for further investigation into particular programs of study where imbalances may exist.
Among the occupations that the Department of Employment and Workforce project to grow the fastest between 2012 and 2022, there are several that appear to have too few in-state graduates to fulfill the demand. These include: Physical Therapists, Medical Assistants, Dental Hygienists, Medical and Clinical Laboratory Technicians, Dental Assistants, Nursing Assistants, and Middle School Teachers . Six of seven of these occupations are associated with the healthcare sector, which is the primary focus of South Carolina’s Office for Healthcare Workforce Analysis and Planning.
Finally, when exploring the balance between graduates in STEM fields with the employment projections for STEM occupations, aggregate comparisons for sub-groups may obscure potential shortages in specific occupations. There continues to be a need to explore more in-depth several engineering, biological science, and computer science occupations to determine the potential severity of projected shortages and strategies to address them.
36 4-7-2016
REFERENCES
CNN Money “Business majors most likely to be underemployed, report finds” Angela Johnson 6/19/13
Costa, Daniel. “STEM Labor Shortages: Microsoft Report Distorts Reality about Computing Occupations.” Economic Policy Institute. November 19, 2012.
Drake, Stephanie H., Pawlowski, Ursula, Rile, Veronika. “Developing an Effective Health Care Workforce Planning Model” American Hospital Association September 2013.
Lacey, Linda M. 2015. The Hospital Nursing Workforce in South Carolina: 2015. Office for Healthcare Workforce Analysis and Planning, South Carolina Area Health Education Consortium.
Novant Health in Charlotte and Winston-Salem, NC
Robinson, Wesley. “Most with college STEM degrees go to work in other fields, survey finds.” The Washington Post. July 10, 2014.
University of South Carolina-Columbia and the Medical University of South Carolina
Jordan Weissman in The Atlantic
Weldon, David. “Healthcare organizations are planning ahead for fierce competition for qualified employees.” Healthcare Finance. October 10, 2013.
37 4-7-2016
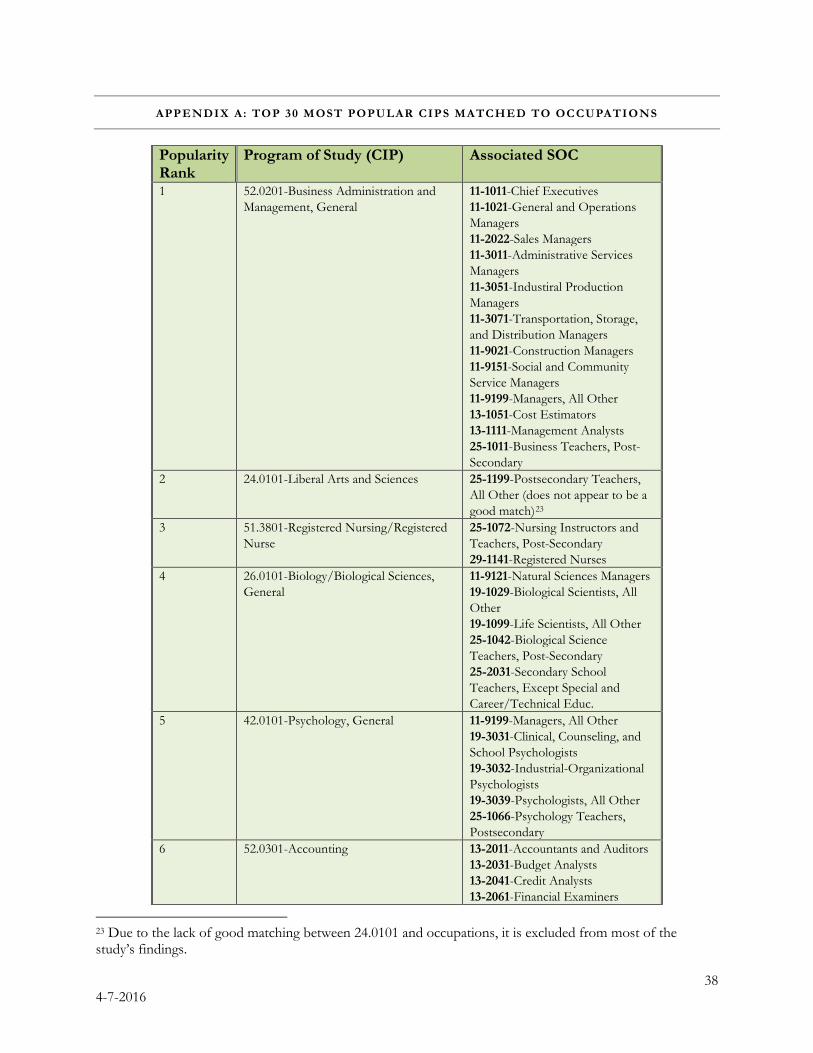
APPENDIX A: TOP 30 MOST POPULAR CIPS MATCHED TO OCCUPATIONS
Popularity Rank
Program of Study (CIP) Associated SOC
1 52.0201-Business Administration and Management, General
11-1011-Chief Executives 11-1021-General and Operations Managers 11-2022-Sales Managers 11-3011-Administrative Services Managers 11-3051-Industiral Production Managers 11-3071-Transportation, Storage, and Distribution Managers 11-9021-Construction Managers 11-9151-Social and Community Service Managers 11-9199-Managers, All Other 13-1051-Cost Estimators 13-1111-Management Analysts 25-1011-Business Teachers, Post-Secondary
2 24.0101-Liberal Arts and Sciences 25-1199-Postsecondary Teachers, All Other (does not appear to be a good match)23
3 51.3801-Registered Nursing/Registered Nurse
25-1072-Nursing Instructors and Teachers, Post-Secondary 29-1141-Registered Nurses
4 26.0101-Biology/Biological Sciences, General
11-9121-Natural Sciences Managers 19-1029-Biological Scientists, All Other 19-1099-Life Scientists, All Other 25-1042-Biological Science Teachers, Post-Secondary 25-2031-Secondary School Teachers, Except Special and Career/Technical Educ.
5 42.0101-Psychology, General 11-9199-Managers, All Other 19-3031-Clinical, Counseling, and School Psychologists 19-3032-Industrial-Organizational Psychologists 19-3039-Psychologists, All Other 25-1066-Psychology Teachers, Postsecondary
6 52.0301-Accounting 13-2011-Accountants and Auditors 13-2031-Budget Analysts 13-2041-Credit Analysts 13-2061-Financial Examiners
23 Due to the lack of good matching between 24.0101 and occupations, it is excluded from most of the study’s findings.
38 4-7-2016
Popularity Rank
Program of Study (CIP) Associated SOC
13-2081-Tax Examiners and Collectors, and Revenue Agents 25-1011-Buisness Teachers, Post-Secondary
7 44.0701-Social Work 11-9151-Social and Community Service Managers 21-1013-Marriage and Fmily Therapists 21-1019-Counselors, All Other 21-1021-Chid, Family, and School Social Workers 21-1022-Healthcare Social Workers 21-1023-Mental Health and Substance Abuse Social Workers 21-1029-Social Workers, All Other 21-1092-Probation Officers and Correctional Treatment Specialists 25-1113-Social Work Teachers, Postsecondary
8 45.1001-Policital Science and Government, General
11-9199-Managers, All Other 19-3094-Political Scientists 25-1065-Political Science Teachers, Postsecondary
9 13.1202-Elementary Education and Teaching
25-2021-Elementary School Teachers, Except Special Educ.
10 23.0101-English Language and Literature, General
25-1123-English Language and Literature Teachers, Post-Secondary 25-2031-Secondary School Teachers, Except Special and Career/Technical Educ.
11 13.1210-Early Childhood Education and Teaching
25-2011- Preschool Teachers, Except Special Educ. 25-2012-Kindergarten Teachers, Except Special Educ.
12 54.0101-History, General 11-9199-Managers, All Other 19-3093-Historians 25-1125-History Teachers, Post-Secondary 25-2031-Secondary School Teachers, Except Special and Career/Technical Educ.
13 51.3901-Licensed Practical/Vocational Nurse Training
29-2061-Licensed Practical and Licensed Vocational Nurses
14 43.0104-Criminal Justice/Safety Studies 25-1111-Criminal Justice and Law Enforcement Teachers, Postsecondary 33-1011-First Line Supervisors of Correctional Officers 33-1012-First Line Supervisors of Police and Detectives
39 4-7-2016
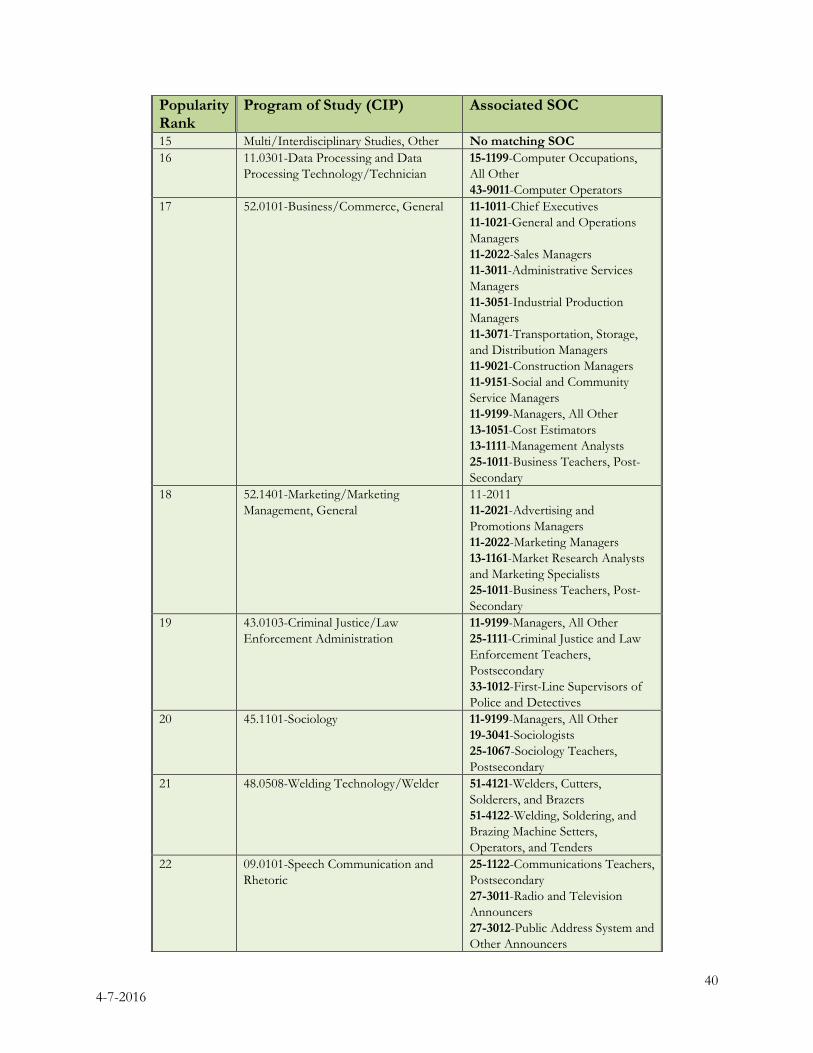
Popularity Rank
Program of Study (CIP) Associated SOC
15 Multi/Interdisciplinary Studies, Other No matching SOC 16 11.0301-Data Processing and Data
Processing Technology/Technician 15-1199-Computer Occupations, All Other 43-9011-Computer Operators
17 52.0101-Business/Commerce, General 11-1011-Chief Executives 11-1021-General and Operations Managers 11-2022-Sales Managers 11-3011-Administrative Services Managers 11-3051-Industrial Production Managers 11-3071-Transportation, Storage, and Distribution Managers 11-9021-Construction Managers 11-9151-Social and Community Service Managers 11-9199-Managers, All Other 13-1051-Cost Estimators 13-1111-Management Analysts 25-1011-Business Teachers, Post-Secondary
18 52.1401-Marketing/Marketing Management, General
11-2011 11-2021-Advertising and Promotions Managers 11-2022-Marketing Managers 13-1161-Market Research Analysts and Marketing Specialists 25-1011-Business Teachers, Post-Secondary
19 43.0103-Criminal Justice/Law Enforcement Administration
11-9199-Managers, All Other 25-1111-Criminal Justice and Law Enforcement Teachers, Postsecondary 33-1012-First-Line Supervisors of Police and Detectives
20 45.1101-Sociology 11-9199-Managers, All Other 19-3041-Sociologists 25-1067-Sociology Teachers, Postsecondary
21 48.0508-Welding Technology/Welder 51-4121-Welders, Cutters, Solderers, and Brazers 51-4122-Welding, Soldering, and Brazing Machine Setters, Operators, and Tenders
22 09.0101-Speech Communication and Rhetoric
25-1122-Communications Teachers, Postsecondary 27-3011-Radio and Television Announcers 27-3012-Public Address System and Other Announcers
40 4-7-2016
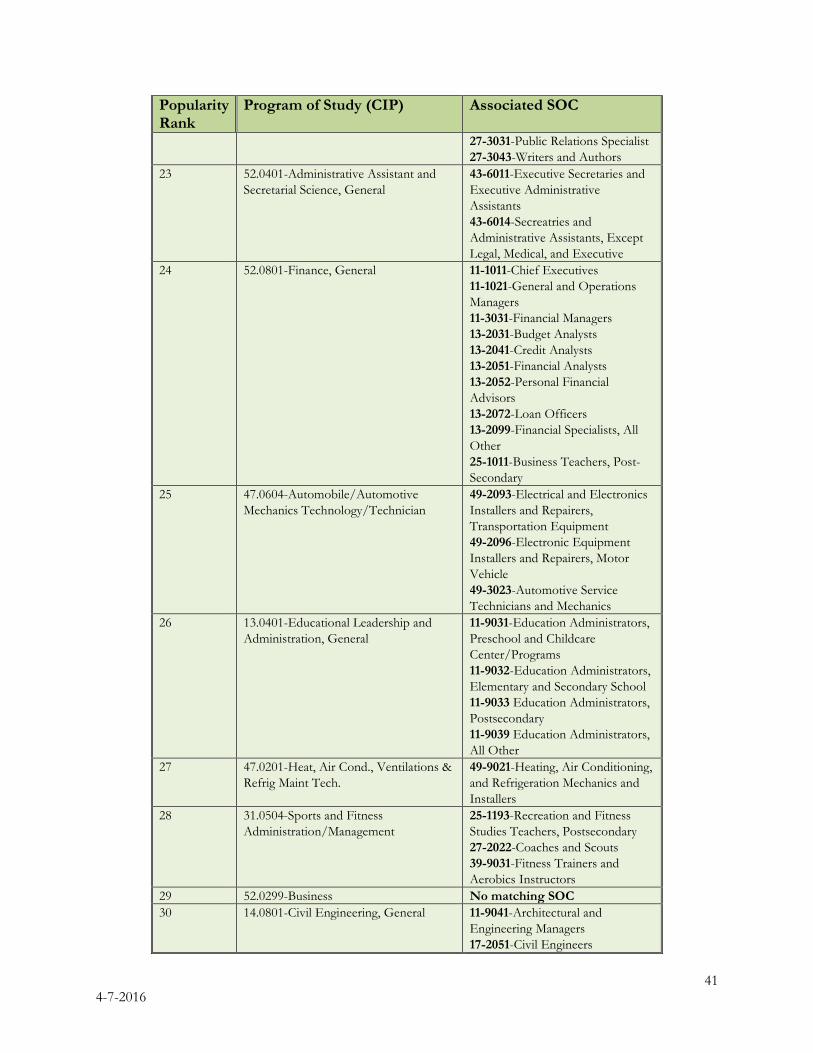
Popularity Rank
Program of Study (CIP) Associated SOC
27-3031-Public Relations Specialist 27-3043-Writers and Authors
23 52.0401-Administrative Assistant and Secretarial Science, General
43-6011-Executive Secretaries and Executive Administrative Assistants 43-6014-Secreatries and Administrative Assistants, Except Legal, Medical, and Executive
24 52.0801-Finance, General 11-1011-Chief Executives 11-1021-General and Operations Managers 11-3031-Financial Managers 13-2031-Budget Analysts 13-2041-Credit Analysts 13-2051-Financial Analysts 13-2052-Personal Financial Advisors 13-2072-Loan Officers 13-2099-Financial Specialists, All Other 25-1011-Business Teachers, Post-Secondary
25 47.0604-Automobile/Automotive Mechanics Technology/Technician
49-2093-Electrical and Electronics Installers and Repairers, Transportation Equipment 49-2096-Electronic Equipment Installers and Repairers, Motor Vehicle 49-3023-Automotive Service Technicians and Mechanics
26 13.0401-Educational Leadership and Administration, General
11-9031-Education Administrators, Preschool and Childcare Center/Programs 11-9032-Education Administrators, Elementary and Secondary School 11-9033 Education Administrators, Postsecondary 11-9039 Education Administrators, All Other
27 47.0201-Heat, Air Cond., Ventilations & Refrig Maint Tech.
49-9021-Heating, Air Conditioning, and Refrigeration Mechanics and Installers
28 31.0504-Sports and Fitness Administration/Management
25-1193-Recreation and Fitness Studies Teachers, Postsecondary 27-2022-Coaches and Scouts 39-9031-Fitness Trainers and Aerobics Instructors
29 52.0299-Business No matching SOC 30 14.0801-Civil Engineering, General 11-9041-Architectural and
Engineering Managers 17-2051-Civil Engineers
41 4-7-2016

Popularity Rank
Program of Study (CIP) Associated SOC
25-1032-Engineering Teachers, Post-Secondary
42 4-7-2016
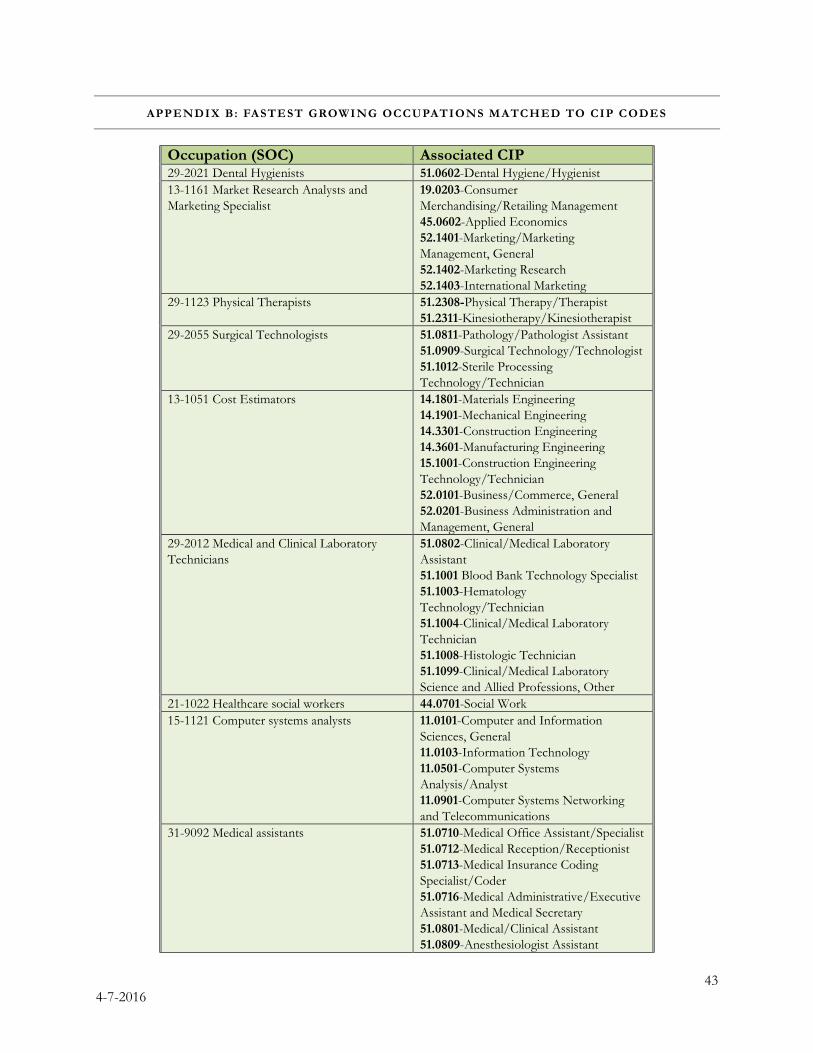
APPENDIX B: FASTEST GROWING OCCUPATIONS MATCHED TO CIP CODES
Occupation (SOC) Associated CIP 29-2021 Dental Hygienists 51.0602-Dental Hygiene/Hygienist 13-1161 Market Research Analysts and Marketing Specialist
19.0203-Consumer Merchandising/Retailing Management 45.0602-Applied Economics 52.1401-Marketing/Marketing Management, General 52.1402-Marketing Research 52.1403-International Marketing
29-1123 Physical Therapists 51.2308-Physical Therapy/Therapist 51.2311-Kinesiotherapy/Kinesiotherapist
29-2055 Surgical Technologists 51.0811-Pathology/Pathologist Assistant 51.0909-Surgical Technology/Technologist 51.1012-Sterile Processing Technology/Technician
13-1051 Cost Estimators 14.1801-Materials Engineering 14.1901-Mechanical Engineering 14.3301-Construction Engineering 14.3601-Manufacturing Engineering 15.1001-Construction Engineering Technology/Technician 52.0101-Business/Commerce, General 52.0201-Business Administration and Management, General
29-2012 Medical and Clinical Laboratory Technicians
51.0802-Clinical/Medical Laboratory Assistant 51.1001 Blood Bank Technology Specialist 51.1003-Hematology Technology/Technician 51.1004-Clinical/Medical Laboratory Technician 51.1008-Histologic Technician 51.1099-Clinical/Medical Laboratory Science and Allied Professions, Other
21-1022 Healthcare social workers 44.0701-Social Work 15-1121 Computer systems analysts 11.0101-Computer and Information
Sciences, General 11.0103-Information Technology 11.0501-Computer Systems Analysis/Analyst 11.0901-Computer Systems Networking and Telecommunications
31-9092 Medical assistants 51.0710-Medical Office Assistant/Specialist 51.0712-Medical Reception/Receptionist 51.0713-Medical Insurance Coding Specialist/Coder 51.0716-Medical Administrative/Executive Assistant and Medical Secretary 51.0801-Medical/Clinical Assistant 51.0809-Anesthesiologist Assistant
43 4-7-2016

Occupation (SOC) Associated CIP 51.0813-Chiropractic Assistant/Technician
31-9091 Dental assistants 51.0601-Dental Assisting/Assistant
44 4-7-2016
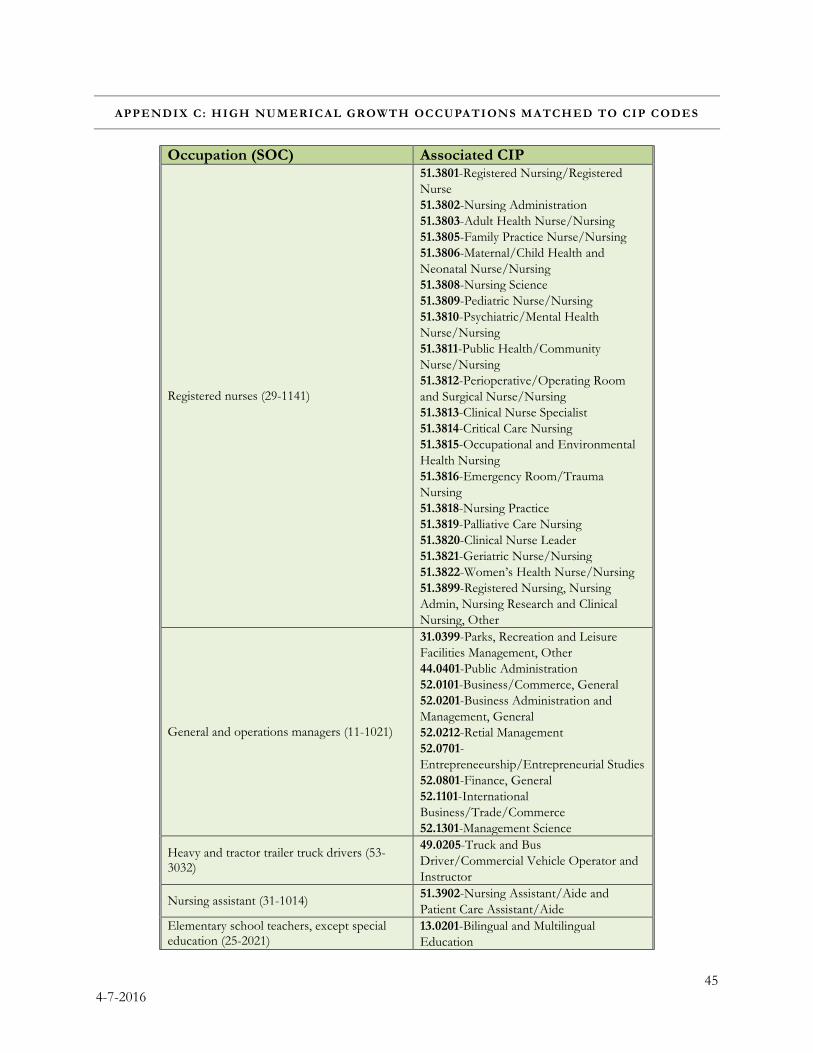
APPENDIX C: HIGH NUMERICAL GROWTH OCCUPATIONS MATCHED TO CIP CODES
Occupation (SOC) Associated CIP
Registered nurses (29-1141)
51.3801-Registered Nursing/Registered Nurse 51.3802-Nursing Administration 51.3803-Adult Health Nurse/Nursing 51.3805-Family Practice Nurse/Nursing 51.3806-Maternal/Child Health and Neonatal Nurse/Nursing 51.3808-Nursing Science 51.3809-Pediatric Nurse/Nursing 51.3810-Psychiatric/Mental Health Nurse/Nursing 51.3811-Public Health/Community Nurse/Nursing 51.3812-Perioperative/Operating Room and Surgical Nurse/Nursing 51.3813-Clinical Nurse Specialist 51.3814-Critical Care Nursing 51.3815-Occupational and Environmental Health Nursing 51.3816-Emergency Room/Trauma Nursing 51.3818-Nursing Practice 51.3819-Palliative Care Nursing 51.3820-Clinical Nurse Leader 51.3821-Geriatric Nurse/Nursing 51.3822-Women’s Health Nurse/Nursing 51.3899-Registered Nursing, Nursing Admin, Nursing Research and Clinical Nursing, Other
General and operations managers (11-1021)
31.0399-Parks, Recreation and Leisure Facilities Management, Other 44.0401-Public Administration 52.0101-Business/Commerce, General 52.0201-Business Administration and Management, General 52.0212-Retial Management 52.0701-Entrepreneeurship/Entrepreneurial Studies 52.0801-Finance, General 52.1101-International Business/Trade/Commerce 52.1301-Management Science
Heavy and tractor trailer truck drivers (53-3032)
49.0205-Truck and Bus Driver/Commercial Vehicle Operator and Instructor
Nursing assistant (31-1014) 51.3902-Nursing Assistant/Aide and Patient Care Assistant/Aide
Elementary school teachers, except special education (25-2021)
13.0201-Bilingual and Multilingual Education
45 4-7-2016
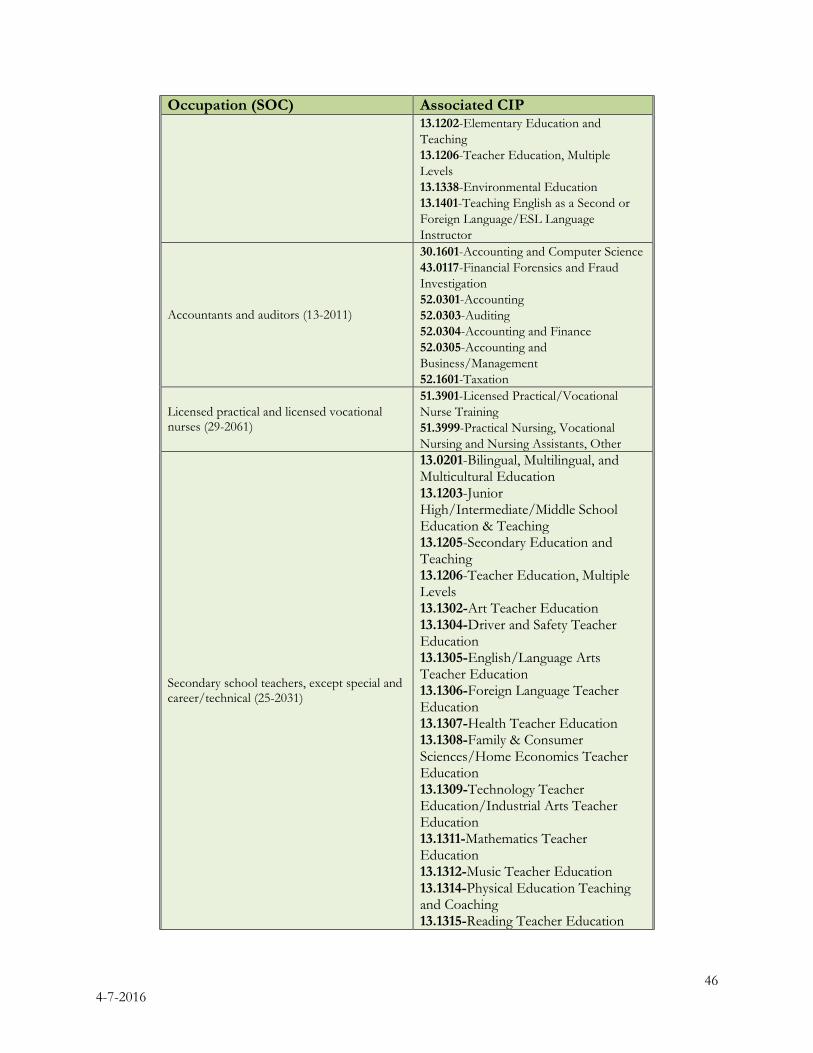
Occupation (SOC) Associated CIP 13.1202-Elementary Education and Teaching 13.1206-Teacher Education, Multiple Levels 13.1338-Environmental Education 13.1401-Teaching English as a Second or Foreign Language/ESL Language Instructor
Accountants and auditors (13-2011)
30.1601-Accounting and Computer Science 43.0117-Financial Forensics and Fraud Investigation 52.0301-Accounting 52.0303-Auditing 52.0304-Accounting and Finance 52.0305-Accounting and Business/Management 52.1601-Taxation
Licensed practical and licensed vocational nurses (29-2061)
51.3901-Licensed Practical/Vocational Nurse Training 51.3999-Practical Nursing, Vocational Nursing and Nursing Assistants, Other
Secondary school teachers, except special and career/technical (25-2031)
13.0201-Bilingual, Multilingual, and Multicultural Education 13.1203-Junior High/Intermediate/Middle School Education & Teaching 13.1205-Secondary Education and Teaching 13.1206-Teacher Education, Multiple Levels 13.1302-Art Teacher Education 13.1304-Driver and Safety Teacher Education 13.1305-English/Language Arts Teacher Education 13.1306-Foreign Language Teacher Education 13.1307-Health Teacher Education 13.1308-Family & Consumer Sciences/Home Economics Teacher Education 13.1309-Technology Teacher Education/Industrial Arts Teacher Education 13.1311-Mathematics Teacher Education 13.1312-Music Teacher Education 13.1314-Physical Education Teaching and Coaching 13.1315-Reading Teacher Education
46 4-7-2016
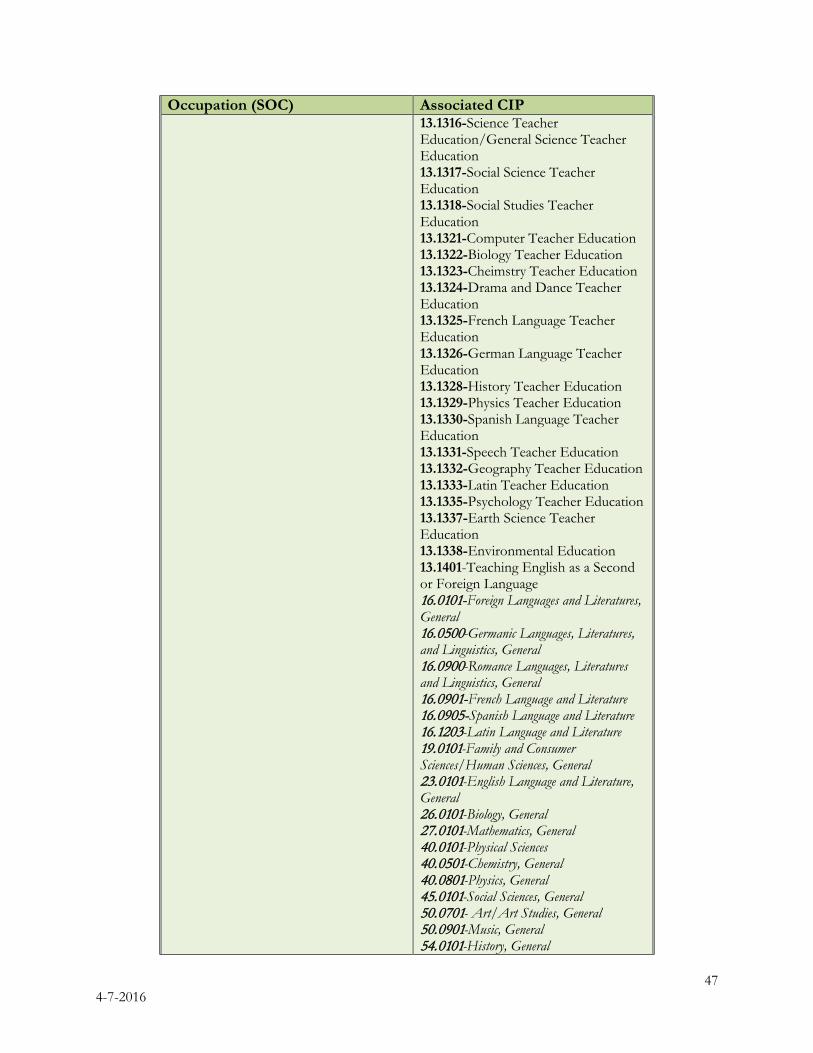
Occupation (SOC) Associated CIP 13.1316-Science Teacher Education/General Science Teacher Education 13.1317-Social Science Teacher Education 13.1318-Social Studies Teacher Education 13.1321-Computer Teacher Education 13.1322-Biology Teacher Education 13.1323-Cheimstry Teacher Education 13.1324-Drama and Dance Teacher Education 13.1325-French Language Teacher Education 13.1326-German Language Teacher Education 13.1328-History Teacher Education 13.1329-Physics Teacher Education 13.1330-Spanish Language Teacher Education 13.1331-Speech Teacher Education 13.1332-Geography Teacher Education 13.1333-Latin Teacher Education 13.1335-Psychology Teacher Education 13.1337-Earth Science Teacher Education 13.1338-Environmental Education 13.1401-Teaching English as a Second or Foreign Language 16.0101-Foreign Languages and Literatures, General 16.0500-Germanic Languages, Literatures, and Linguistics, General 16.0900-Romance Languages, Literatures and Linguistics, General 16.0901-French Language and Literature 16.0905-Spanish Language and Literature 16.1203-Latin Language and Literature 19.0101-Family and Consumer Sciences/Human Sciences, General 23.0101-English Language and Literature, General 26.0101-Biology, General 27.0101-Mathematics, General 40.0101-Physical Sciences 40.0501-Chemistry, General 40.0801-Physics, General 45.0101-Social Sciences, General 50.0701- Art/Art Studies, General 50.0901-Music, General 54.0101-History, General
47 4-7-2016
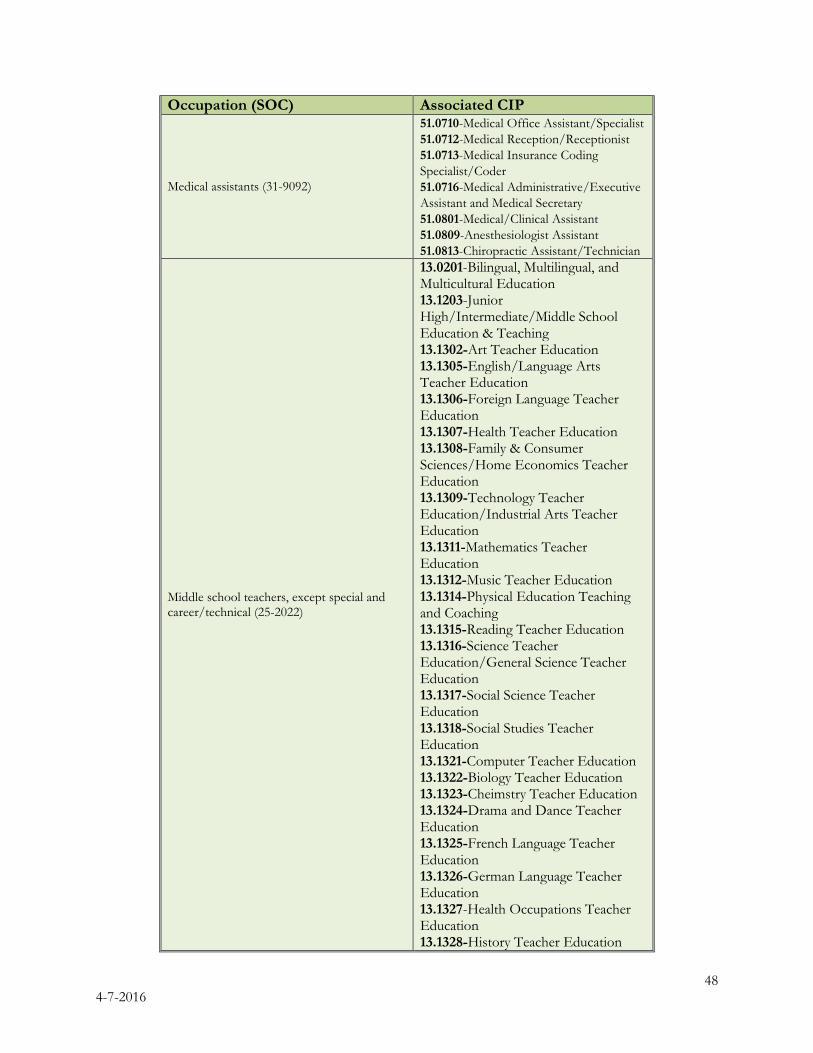
Occupation (SOC) Associated CIP
Medical assistants (31-9092)
51.0710-Medical Office Assistant/Specialist 51.0712-Medical Reception/Receptionist 51.0713-Medical Insurance Coding Specialist/Coder 51.0716-Medical Administrative/Executive Assistant and Medical Secretary 51.0801-Medical/Clinical Assistant 51.0809-Anesthesiologist Assistant 51.0813-Chiropractic Assistant/Technician
Middle school teachers, except special and career/technical (25-2022)
13.0201-Bilingual, Multilingual, and Multicultural Education 13.1203-Junior High/Intermediate/Middle School Education & Teaching 13.1302-Art Teacher Education 13.1305-English/Language Arts Teacher Education 13.1306-Foreign Language Teacher Education 13.1307-Health Teacher Education 13.1308-Family & Consumer Sciences/Home Economics Teacher Education 13.1309-Technology Teacher Education/Industrial Arts Teacher Education 13.1311-Mathematics Teacher Education 13.1312-Music Teacher Education 13.1314-Physical Education Teaching and Coaching 13.1315-Reading Teacher Education 13.1316-Science Teacher Education/General Science Teacher Education 13.1317-Social Science Teacher Education 13.1318-Social Studies Teacher Education 13.1321-Computer Teacher Education 13.1322-Biology Teacher Education 13.1323-Cheimstry Teacher Education 13.1324-Drama and Dance Teacher Education 13.1325-French Language Teacher Education 13.1326-German Language Teacher Education 13.1327-Health Occupations Teacher Education 13.1328-History Teacher Education
48 4-7-2016
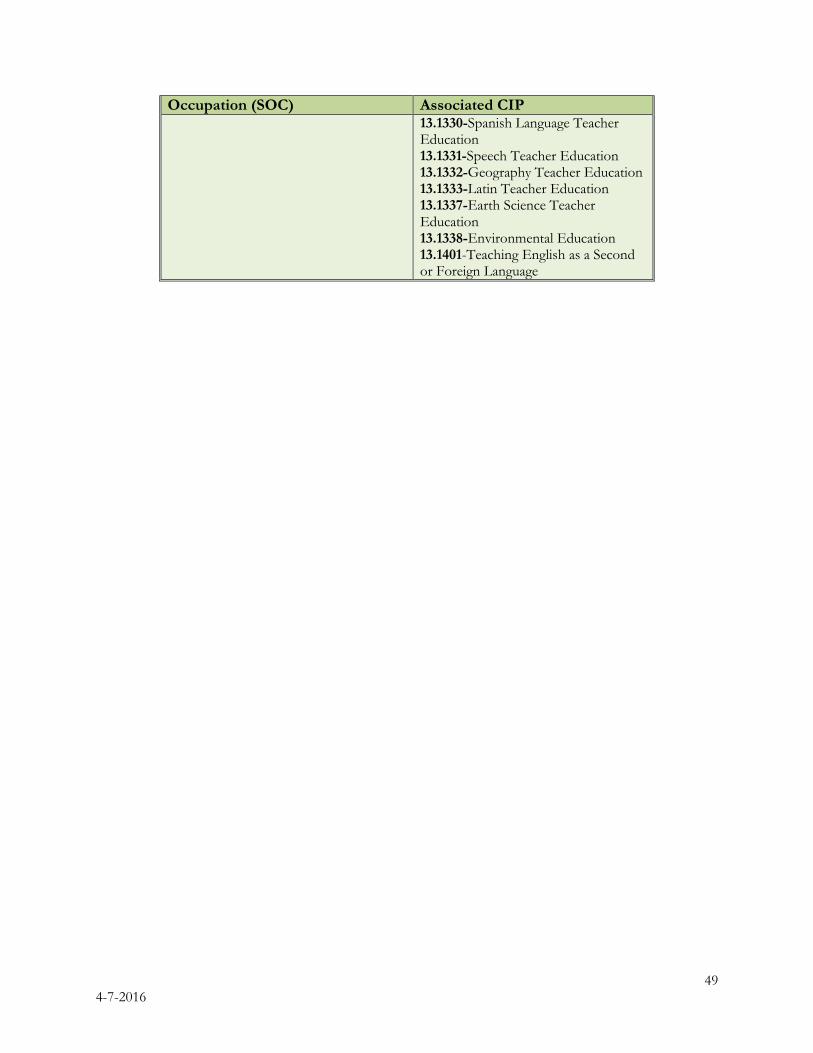
Occupation (SOC) Associated CIP 13.1330-Spanish Language Teacher Education 13.1331-Speech Teacher Education 13.1332-Geography Teacher Education 13.1333-Latin Teacher Education 13.1337-Earth Science Teacher Education 13.1338-Environmental Education 13.1401-Teaching English as a Second or Foreign Language
49 4-7-2016
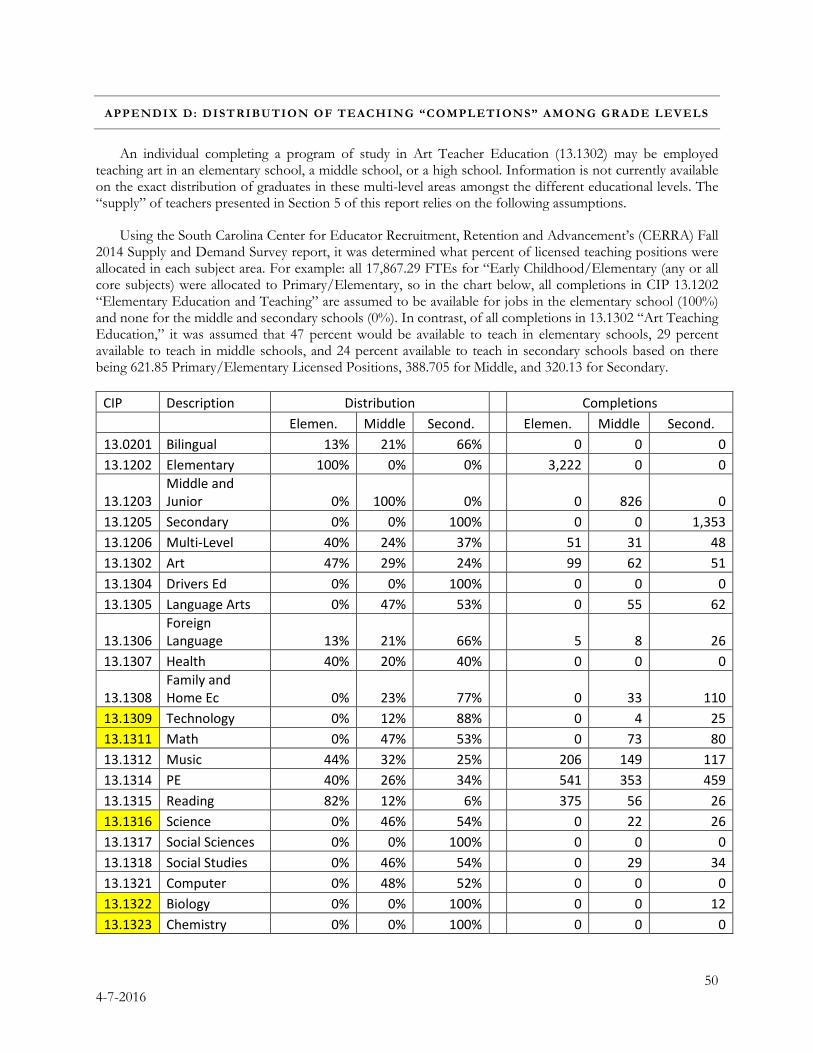
APPENDIX D: DIST RIBUTION OF TEACHING “COMPLETIONS” AMONG GRADE LEVELS
An individual completing a program of study in Art Teacher Education (13.1302) may be employed teaching art in an elementary school, a middle school, or a high school. Information is not currently available on the exact distribution of graduates in these multi-level areas amongst the different educational levels. The “supply” of teachers presented in Section 5 of this report relies on the following assumptions.
Using the South Carolina Center for Educator Recruitment, Retention and Advancement’s (CERRA) Fall 2014 Supply and Demand Survey report, it was determined what percent of licensed teaching positions were allocated in each subject area. For example: all 17,867.29 FTEs for “Early Childhood/Elementary (any or all core subjects) were allocated to Primary/Elementary, so in the chart below, all completions in CIP 13.1202 “Elementary Education and Teaching” are assumed to be available for jobs in the elementary school (100%) and none for the middle and secondary schools (0%). In contrast, of all completions in 13.1302 “Art Teaching Education,” it was assumed that 47 percent would be available to teach in elementary schools, 29 percent available to teach in middle schools, and 24 percent available to teach in secondary schools based on there being 621.85 Primary/Elementary Licensed Positions, 388.705 for Middle, and 320.13 for Secondary.
CIP Description Distribution Completions Elemen. Middle Second. Elemen. Middle Second. 13.0201 Bilingual 13% 21% 66% 0 0 0 13.1202 Elementary 100% 0% 0% 3,222 0 0
13.1203 Middle and Junior 0% 100% 0% 0 826 0
13.1205 Secondary 0% 0% 100% 0 0 1,353 13.1206 Multi-Level 40% 24% 37% 51 31 48 13.1302 Art 47% 29% 24% 99 62 51 13.1304 Drivers Ed 0% 0% 100% 0 0 0 13.1305 Language Arts 0% 47% 53% 0 55 62
13.1306 Foreign Language 13% 21% 66% 5 8 26
13.1307 Health 40% 20% 40% 0 0 0
13.1308 Family and Home Ec 0% 23% 77% 0 33 110
13.1309 Technology 0% 12% 88% 0 4 25 13.1311 Math 0% 47% 53% 0 73 80 13.1312 Music 44% 32% 25% 206 149 117 13.1314 PE 40% 26% 34% 541 353 459 13.1315 Reading 82% 12% 6% 375 56 26 13.1316 Science 0% 46% 54% 0 22 26 13.1317 Social Sciences 0% 0% 100% 0 0 0 13.1318 Social Studies 0% 46% 54% 0 29 34 13.1321 Computer 0% 48% 52% 0 0 0 13.1322 Biology 0% 0% 100% 0 0 12 13.1323 Chemistry 0% 0% 100% 0 0 0
50 4-7-2016
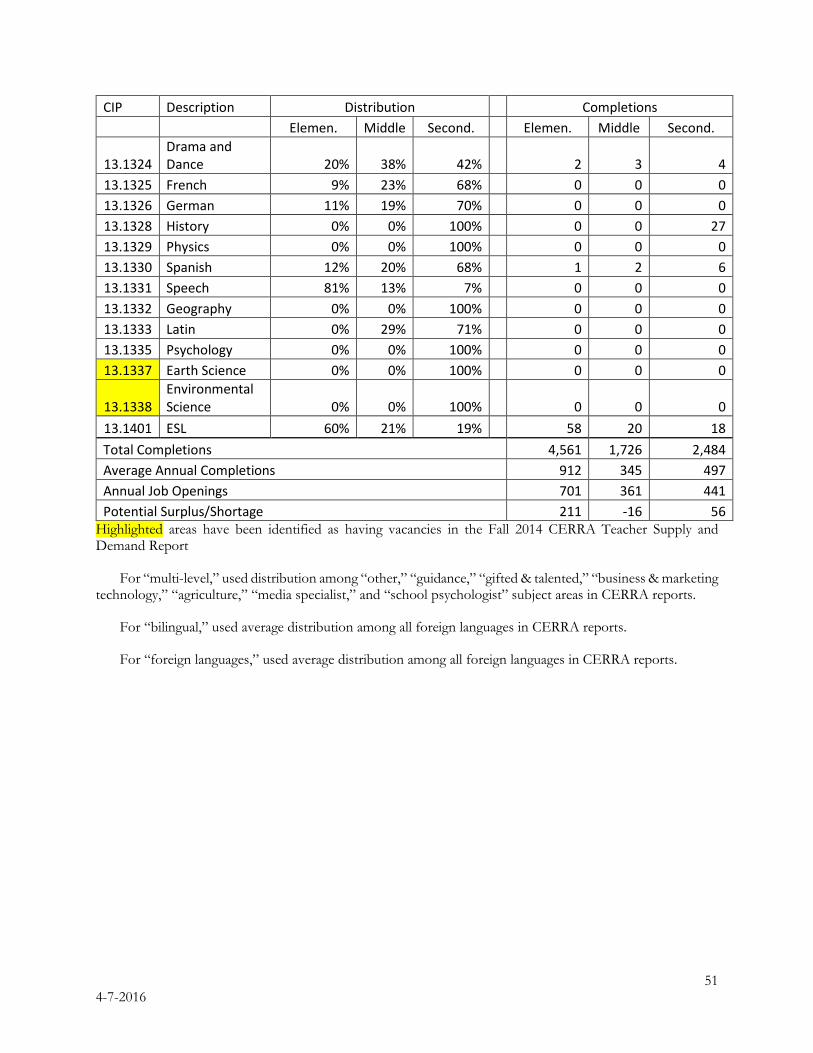
CIP Description Distribution Completions Elemen. Middle Second. Elemen. Middle Second.
13.1324 Drama and Dance 20% 38% 42% 2 3 4
13.1325 French 9% 23% 68% 0 0 0 13.1326 German 11% 19% 70% 0 0 0 13.1328 History 0% 0% 100% 0 0 27 13.1329 Physics 0% 0% 100% 0 0 0 13.1330 Spanish 12% 20% 68% 1 2 6 13.1331 Speech 81% 13% 7% 0 0 0 13.1332 Geography 0% 0% 100% 0 0 0 13.1333 Latin 0% 29% 71% 0 0 0 13.1335 Psychology 0% 0% 100% 0 0 0 13.1337 Earth Science 0% 0% 100% 0 0 0
13.1338 Environmental Science 0% 0% 100% 0 0 0
13.1401 ESL 60% 21% 19% 58 20 18 Total Completions 4,561 1,726 2,484 Average Annual Completions 912 345 497 Annual Job Openings 701 361 441 Potential Surplus/Shortage 211 -16 56
Highlighted areas have been identified as having vacancies in the Fall 2014 CERRA Teacher Supply and Demand Report
For “multi-level,” used distribution among “other,” “guidance,” “gifted & talented,” “business & marketing technology,” “agriculture,” “media specialist,” and “school psychologist” subject areas in CERRA reports.
For “bilingual,” used average distribution among all foreign languages in CERRA reports.
For “foreign languages,” used average distribution among all foreign languages in CERRA reports.
51 4-7-2016