alberta’s occupational outlook€¦ · alberta’s occupational outlook | 2019-2028 4 executive...
TRANSCRIPT
Alberta’s Occupational Outlook 2019 - 2028
Alberta’s Occupational Outlook | 2019-2028 1
Labour and Immigration, Government of Alberta October 2019 Alberta’s Occupational Outlook, 2019-2028 ISBN 978-1-4601-4370-4 © 2019 Government of Alberta. Printed in Canada for free distribution. Published: September 2019

Alberta’s Occupational Outlook | 2019-2028 2
Table of Contents Disclaimer statement……………………………………………………………………………………………………………………….….3
Executive Summary…………………………………………………………………………………………………………………...............4
Overview……………………………………………………………………………………………………………...…………………….…....5
Demand and Supply models……………………………………………………………………………………………………………..…..5
How they are used……………………………………………………………………………………………………………………….…....5
What influences Labour Markets ..................................................................................................................................................... 5
How labour imbalances are estimated ............................................................................................................................................. 5
What is new in the 2019-2028 Outlook ............................................................................................................................................ 5
Model results and feedback ............................................................................................................................................................. 5
Alberta 10-Year Labour Market Outlook………………………………………………………………………………………………..…..6
Sources of Job Openings ................................................................................................................................................................. 7
Sources of Job Seekers ................................................................................................................................................................... 7
Occupational Outlook Highlights ..................................................................................................................................................... 8
Job Openings by 1-Digit NOC………………………………………………………………………………… ………………………..……8
Job Seekers by 1-Digit NOC ............................................................................................................................................................ 9
Appendix A…………………………………………………………………………………………………....…………………………. . …..10
Alberta occupational demand and supply outlook models’ methodologies ................................................................................... 10
Appendix B……………………………………………………………………………………………………………………………………..11
Alberta occupational supply outlook model assumptions ……………………………………………………………………………….12
Appendix C ….…………………………………………………………………………………………………………………………….........13

Alberta’s Occupational Outlook | 2019-2028 3
Disclaimer statement Alberta Labour and Immigration provides labour market information to assist both the government and the public in decision-making. Occupational outlooks models are affected by a variety of factors and will change over time. When making decisions based on forecasts, multiple sources of information should always be considered.
Work began on the Alberta Occupational Demand Outlook Model 13 years ago. Currently, the model is able to forecast occupational Job openings (demand) for more than 400 occupations in Alberta.
In 2003, work began on the Alberta Occupational Supply Outlook Model, a counterpart model that helps forecast labour supply and possible supply and demand imbalances that may occur in the future.
Labour and Immigration continues to enhance the demand and supply models’ precision and encourages readers to provide advice and feedback by emailing [email protected].

Alberta’s Occupational Outlook | 2019-2028 4
Executive Summary
The 10-year Alberta Occupational Outlook provides a long-term assessment of potential imbalances in the provincial labour market. Expected trends in job openings are compared to the potential pool of job seekers to identify occupations that might face shortages or surpluses.
Balanced labour market conditions are expected by 2028. Overall, the 2019-2028 Outlook shows by 2028, Alberta is expected to have a fairly balanced labour market. The number of expected job openings is expected to keep pace with the number of new job seekers; however, the provincial labour market is forecasted to see some shortages reaching around 7,200 in 2023. For the most part, the shortages will be driven by the need to replace workers who are due to retire. In 2023, 36 per cent or 49,700 of total job openings will come from expansion demand and 64 per cent or 87,300 will come from replacement demand. This result is a shift from the labour shortage seen in previous 10-year forecast until 2025. The 10-year forecasted trends show a continued shift from the previous 2015-2025 occupational outlook that had forecasted an overall shortage of around 49,000 by 2025.
The continuing soft economic conditions and the anticipated increase in the workforce are the major drivers behind this trend. The expected overall shift from a general shortage to a more balanced labour market is due to: • continued soft economic conditions that will
impact long-term unemployment; and • higher post-secondary enrolment and graduation
that will continue to boost the provincial workforce.
Despite the projected overall balanced labour market conditions in Alberta by 2028, shortages and surpluses are expected to occur in some occupations in specific periods over the next 10 years. Labour shortages are forecasted in:
• college-level administration occupations in the field of finance;
• health occupations across education levels, clustered around nursing;
• educators in primary school and college; and • some trades and engineering occupations
related to construction and the oil and gas industry.
Labour surpluses are highly concentrated in:
• occupations associated with retail trade and customer service;
• occupations in front-line public protection services;
• Policy and program researchers, consultants and officers;
• Petroleum, gas and chemical process operators; and
• Power engineers and power systems operators.
Retirement is one of the leading drivers behind the differences in the outlook across occupations. The causes of labour market imbalances vary across occupations, but the retirement of the baby-boomer cohort will be a significant contributor to labour shortages. Over the next 10 years, retirement is expected to grow by 50 per cent and by 2028, retirements are expected to account for the highest share of job openings at around 32 per cent, up from 24 per cent in 2019. By 2028, nearly all the baby boomers, who made up approximately 20 per cent of the workforce in 2017, will have exited the labour market. Growth in some industries and aging workforce also explain the distinctive trends among the occupations. A second clear driver of occupational shortages is economic growth in some key industries such as construction, which is expected to have above average growth. The Health care industry is also expected to have above average growth partly due strong population growth and aging population. Health sector demographic trends show the share of Alberta’s labour force aged 55 years and over was 12 per cent in 1998 and 19 per cent in 2018. In Construction sector, it was nine per cent in 1998 and up to 17 per cent in 2018.

Alberta’s Occupational Outlook | 2019-2028 5
Overview As part of the ongoing efforts to better understand and respond to future labour market needs, Alberta Labour and Immigration contracted the Conference Board of Canada (CBoC) to forecast potential future occupational imbalances using Alberta’s Occupational Demand and Supply models. Demand and Supply models Figure 1 provides an overview of the two models. These models provide forecasts for job openings and job seekers for different occupations in Alberta from 2019 to 2028. Each model can be broken down into sub-models. The Alberta Occupational Supply Outlook Model (AOSOM) has several linked sub-models and over 100,000 data series.
The Alberta Occupational Demand Outlook Model (AODOM) has been used for more than 13 years and has proven to be reliable. Once occupational job openings and seekers are forecasted, the cumulative labour surpluses/shortages are calculated to measure occupational imbalances. How they are used Results from the two models help users make better decisions about developing and funding programs and policies as well as personal decisions about education, jobs and careers.
It should be noted that both of these models produce forecasts and therefore carry assumptions that may change in the future. Hence, a labour shortage or surplus may not be as precise as the models predict.
For example, as occupational conditions change, individuals may decide to enter a field of study that reflects these current conditions and more people may be attracted to the province. The results of these models are intended as indicators of where the current situation in Alberta may lead in future years.
What influences Labour Markets Factors such as demographics, technological change, economic growth, globalization, and consumer behaviour can all heavily influence the outcome for labour markets. The number and types of jobs in tomorrow’s economy will largely depend on these factors. How labour imbalances are estimated There are different measures used to determine labour shortages/surpluses (imbalances). In this report, labour surpluses/shortages are defined and estimated as net new jobs that are unfilled resulting from the difference between forecasted job openings compared to job seekers. These are the new net positions that are “hard to fill.” What is new in the 2019-2028 Outlook Results presented in this report are focused on identifying the total number of job openings (estimated from both expansion and replacement demand) and the total number of labour market entrants or job seekers who are expected to join Alberta’s labour market over the next 10 years.
Previous outlook reported openings that were estimated from expansion demand and the replacement components were incorporated in the labour supply component. Model results and feedback This year’s findings of the two models are provided in this report. Alberta Labour and Immigration believes that continued work on the development of AOSOM will help to provide important information on labour market imbalances. Readers are encouraged to provide advice and feedback on the models usefulness, construction and results. Please see Appendices A and B for a detailed view of the models methodology and assumptions.
Figure 1: An overview of the occupational demand and supply models
Alberta’s Occupational Outlook | 2019-2028 6
Alberta 10-Year Labour Market Outlook
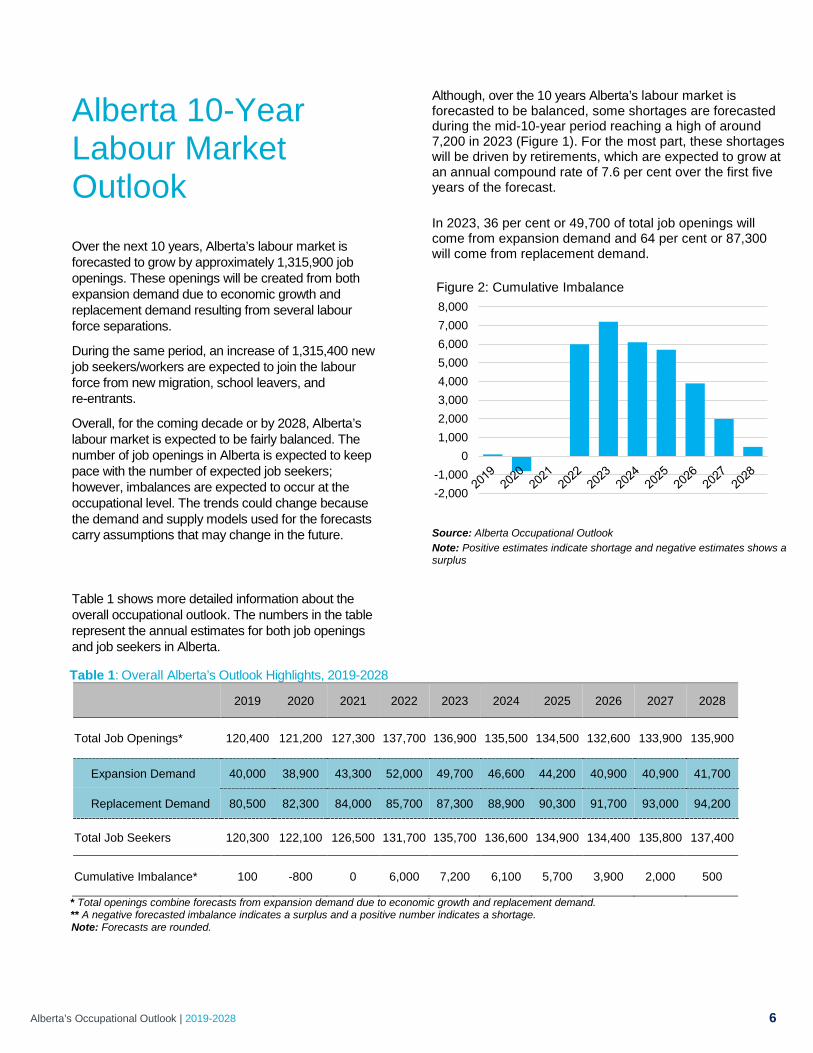
Over the next 10 years, Alberta’s labour market is forecasted to grow by approximately 1,315,900 job openings. These openings will be created from both expansion demand due to economic growth and replacement demand resulting from several labour force separations.
During the same period, an increase of 1,315,400 new job seekers/workers are expected to join the labour force from new migration, school leavers, and re-entrants.
Overall, for the coming decade or by 2028, Alberta’s labour market is expected to be fairly balanced. The number of job openings in Alberta is expected to keep pace with the number of expected job seekers; however, imbalances are expected to occur at the occupational level. The trends could change because the demand and supply models used for the forecasts carry assumptions that may change in the future.
Although, over the 10 years Alberta’s labour market is forecasted to be balanced, some shortages are forecasted during the mid-10-year period reaching a high of around 7,200 in 2023 (Figure 1). For the most part, these shortages will be driven by retirements, which are expected to grow at an annual compound rate of 7.6 per cent over the first five years of the forecast. In 2023, 36 per cent or 49,700 of total job openings will come from expansion demand and 64 per cent or 87,300 will come from replacement demand.
Source: Alberta Occupational Outlook Note: Positive estimates indicate shortage and negative estimates shows a surplus
Table 1 shows more detailed information about the overall occupational outlook. The numbers in the table represent the annual estimates for both job openings and job seekers in Alberta.
Table 1: Overall Alberta’s Outlook Highlights, 2019-2028
2019 2020 2021 2022 2023 2024 2025 2026 2027 2028
Total Job Openings* 120,400 121,200 127,300 137,700 136,900 135,500 134,500 132,600 133,900 135,900
Expansion Demand 40,000 38,900 43,300 52,000 49,700 46,600 44,200 40,900 40,900 41,700
Replacement Demand 80,500 82,300 84,000 85,700 87,300 88,900 90,300 91,700 93,000 94,200
Total Job Seekers 120,300 122,100 126,500 131,700 135,700 136,600 134,900 134,400 135,800 137,400
Cumulative Imbalance* 100 -800 0 6,000 7,200 6,100 5,700 3,900 2,000 500
* Total openings combine forecasts from expansion demand due to economic growth and replacement demand. ** A negative forecasted imbalance indicates a surplus and a positive number indicates a shortage. Note: Forecasts are rounded.
-2,000-1,000
01,0002,0003,0004,0005,0006,0007,0008,000Figure 2: Cumulative Imbalance

Alberta’s Occupational Outlook | 2019-2028 7
Sources of Job Openings Over the next 10 years, job openings created through replacement demand (i.e. retirements, out-migration and deaths) will account for the largest share at 66.7 per cent or 877,800 compared to 33.3 per cent job openings that are expected to be created through expansions demand or economic growth (Figure 3). In 2019, out-migration is expected to account for larger share of job openings at 37.5 per cent or 45,200, following by openings from expansion demand at 33.2 per cent or 40,000. By 2028, retirements will account for largest share of openings at 32.1 per cent or 43,600; followed by out-migration at 31.4 per cent or 42,600; and expansion demand at 30.7 per cent or 41,700 (Figure 3). The following sources will be the main sources of new job openings:
• economic growth (expansion demand); • retirements; • out-migration; and • deaths.
Sources of Job Seekers Over the 10 year period, the largest share of labour market entrants or job seekers will come from in-migration at 55.8 per cent or 733,400, followed by school leavers at 42.8 per cent of 563,300 (Figure 4). By 2028, the share of new job seekers from immigration will decline to 54.4 per cent from 58.4 per cent in 2019. The share of job seekers from school leaver will also fall from 45.4 per cent in 2019 to 43.2 per cent in 2028, and the share of re-entrants will increase to 2.3 per cent from a negative outflow of 3.8 per cent. The following sources will be the main sources of new job seekers:
• New entrants – school leavers; • Migration – interprovincial and
international; and • Labour force re-entrants.
Source: Alberta Occupational Outlook: 2019-2028
Source: Alberta Occupational Outlook: 2019-2028 * Re-entrants refers to individuals who rejoin the workforce after previously dropping out.
0
20,000
40,000
60,000
80,000
100,000
120,000
140,000
160,000
Figure 3: Sources of Job Openings
Expansion Demand Retirements Deaths Out-Migration
-20,000
0
20,000
40,000
60,000
80,000
100,000
120,000
140,000
160,000
Figure 4: Sources of Job Seekers
In-Migration School Leavers Net Re-entrants*

Alberta’s Occupational Outlook | 2019-2028 8
Occupational Outlook Highlights Job Openings by 1- Digit NOC
Over the 2019-2028 projection period, most job openings will be concentrated in:
• sales and service occupations, +280,000; • trades and transport occupations, +215,900;
and business, finance, and administration occupations, +203,700 (Figure 5).
Job openings from replacement demand will account
for a higher share in all occupational groupings except health occupations where an average of 7,200 job openings per year are projected to be produced through expansion demand, and an average of 6,000 job openings per year are projected to be produced through replacement demand. The occupational groupings affected by attrition factors will be: Manufacturing and utilities, Management, and Trades, transport and equipment operators (Figure 5).
Figure 5: Job Openings , 1-Digit NOC
0 100,000 200,000 300,000
Management occupations
Business, finance and administration occupations
Natural and applied sciences and related occupations
Health occupations
Occupations in education, law and social, community andgovernment services
Occupations in art, culture, recreation and sport
Sales and service occupations
Trades, transport and equipment operators and relatedoccupations
Natural resources, agriculture and related productionoccupations
Occupations in manufacturing and utilities
Job Openings: Expansion Demand Job Openings: Replacement Demand

Alberta’s Occupational Outlook | 2019-2028 9
Job Seekers by 1-Digit NOC
Most job seekers will go into the following occupational groupings with the largest number of job openings: sales and services; trades, transport and equipment operators; and Business, finance and administration (Figure 6).
The occupational groupings that will receive the most migrant workers as a share of their total job seekers are in:
• sales and services, 67.4 per cent or 219, 900; • natural resources, agriculture and related production
occupations, 61.3 per cent or 24,100; and • trades, transport and equipment operators and related
occupations, 57.6 per cent or 124,500.
0 100,000 200,000 300,000 400,000
Management occupations
Business, finance and administration occupations
Natural and applied sciences and related occupations
Health occupations
Occupations in education, law and social, community andgovernment services
Occupations in art, culture, recreation and sport
Sales and service occupations
Trades, transport and equipment operators and relatedoccupations
Natural resources, agriculture and related production occupations
Occupations in manufacturing and utilities
Figure 6: Job Seekers by 1-Digit NOC
School Leavers In-migration Net re-entrants

Alberta’s Occupational Outlook | 2019-2028 10
Appendix A
Alberta occupational demand and supply outlook models’ methodologies
Figure 2 provides a detailed view of how occupational imbalances are forecasted. Two main components in the Alberta Occupational Demand Outlook Model (AODOM) are the economic and occupational components. The economic component produces an outlook of Alberta’s economy. Once the performance of the economy is forecasted, the occupational component calculates the employment that is required to maintain the forecasted growth.
The Alberta Occupational Supply Outlook Model (AOSOM) makes occupational supply forecasts with a series of changes that begin with a demographic outlook and end with occupational supply for occupations. The model has three major components: demographic, education and replacement demand. Education has a central importance in this model because of its role in training the labour force.
Figure 7: Alberta Occupational Outlook Methodology
Alberta’s Occupational Outlook | 2019-2028 11
Appendix B
Alberta occupational outlook assumptions
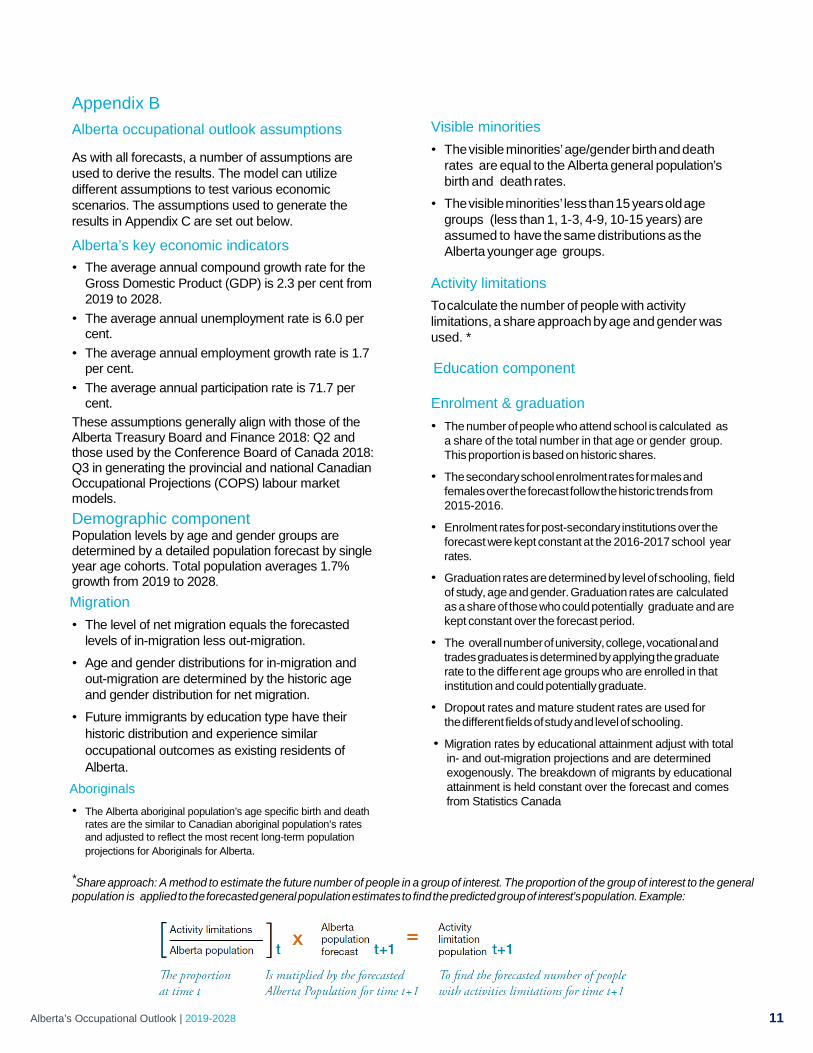
As with all forecasts, a number of assumptions are used to derive the results. The model can utilize different assumptions to test various economic scenarios. The assumptions used to generate the results in Appendix C are set out below.
Alberta’s key economic indicators • The average annual compound growth rate for the
Gross Domestic Product (GDP) is 2.3 per cent from 2019 to 2028.
• The average annual unemployment rate is 6.0 per cent.
• The average annual employment growth rate is 1.7 per cent.
• The average annual participation rate is 71.7 per cent.
These assumptions generally align with those of the Alberta Treasury Board and Finance 2018: Q2 and those used by the Conference Board of Canada 2018: Q3 in generating the provincial and national Canadian Occupational Projections (COPS) labour market models.
Demographic component Population levels by age and gender groups are determined by a detailed population forecast by single year age cohorts. Total population averages 1.7% growth from 2019 to 2028.
Migration • The level of net migration equals the forecasted
levels of in-migration less out-migration. • Age and gender distributions for in-migration and
out-migration are determined by the historic age and gender distribution for net migration.
• Future immigrants by education type have their historic distribution and experience similar occupational outcomes as existing residents of Alberta.
Aboriginals • The Alberta aboriginal population’s age specific birth and death
rates are the similar to Canadian aboriginal population’s rates and adjusted to reflect the most recent long-term population projections for Aboriginals for Alberta.
Visible minorities • The visible minorities’ age/gender birth and death
rates are equal to the Alberta general population’s birth and death rates.
• The visible minorities’ less than 15 years old age groups (less than 1, 1-3, 4-9, 10-15 years) are assumed to have the same distributions as the Alberta younger age groups.
Activity limitations To calculate the number of people with activity limitations, a share approach by age and gender was used. *
Education component Enrolment & graduation • The number of people who attend school is calculated as
a share of the total number in that age or gender group. This proportion is based on historic shares.
• The secondary school enrolment rates for males and females over the forecast follow the historic trends from 2015-2016.
• Enrolment rates for post-secondary institutions over the forecast were kept constant at the 2016-2017 school year rates.
• Graduation rates are determined by level of schooling, field of study, age and gender. Graduation rates are calculated as a share of those who could potentially graduate and are kept constant over the forecast period.
• The overall number of university, college, vocational and trades graduates is determined by applying the graduate rate to the different age groups who are enrolled in that institution and could potentially graduate.
• Dropout rates and mature student rates are used for the different fields of study and level of schooling.
• Migration rates by educational attainment adjust with total in- and out-migration projections and are determined exogenously. The breakdown of migrants by educational attainment is held constant over the forecast and comes from Statistics Canada
*Share approach: A method to estimate the future number of people in a group of interest. The proportion of the group of interest to the general population is applied to the forecasted general population estimates to find the predicted group of interest’s population. Example:
Alberta’s Occupational Outlook | 2019-2028 12
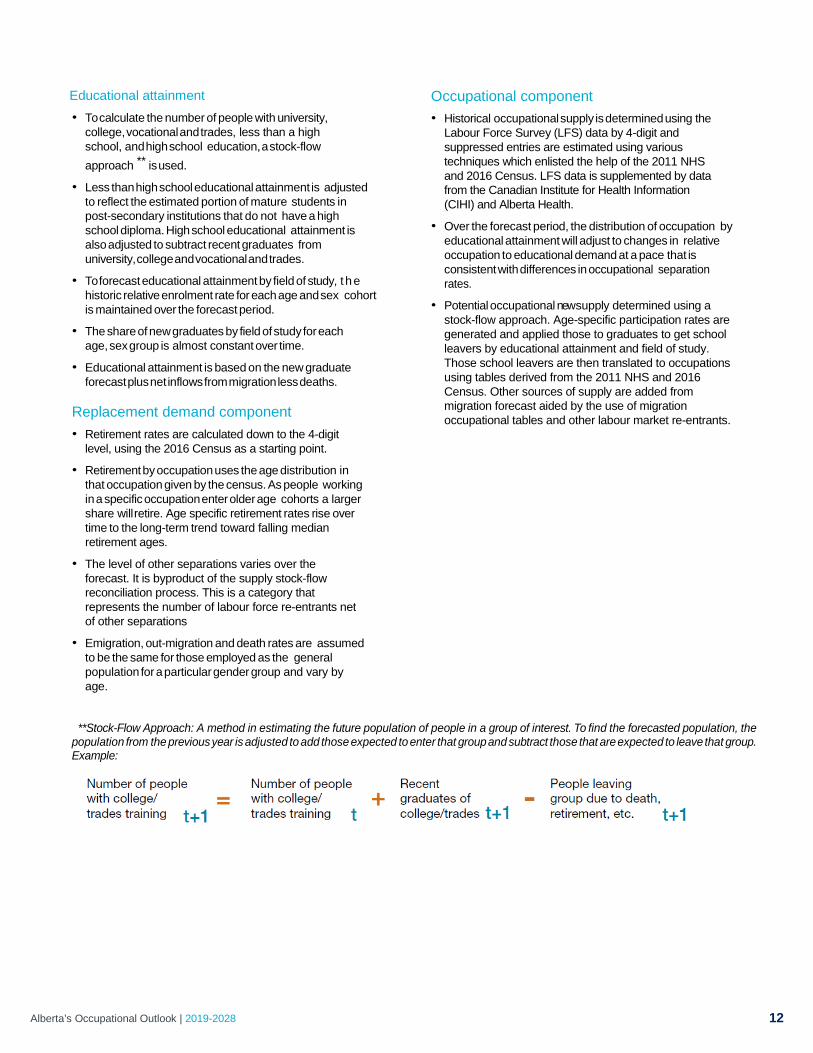
Educational attainment • To calculate the number of people with university,
college, vocational and trades, less than a high school, and high school education, a stock-flow approach ** is used.
• Less than high school educational attainment is adjusted to reflect the estimated portion of mature students in post-secondary institutions that do not have a high school diploma. High school educational attainment is also adjusted to subtract recent graduates from university, college and vocational and trades.
• To forecast educational attainment by field of study, t he historic relative enrolment rate for each age and sex cohort is maintained over the forecast period.
• The share of new graduates by field of study for each age, sex group is almost constant over time.
• Educational attainment is based on the new graduate forecast plus net inflows from migration less deaths.
Replacement demand component • Retirement rates are calculated down to the 4-digit
level, using the 2016 Census as a starting point.
• Retirement by occupation uses the age distribution in that occupation given by the census. As people working in a specific occupation enter older age cohorts a larger share will retire. Age specific retirement rates rise over time to the long-term trend toward falling median retirement ages.
• The level of other separations varies over the forecast. It is byproduct of the supply stock-flow reconciliation process. This is a category that represents the number of labour force re-entrants net of other separations
• Emigration, out-migration and death rates are assumed to be the same for those employed as the general population for a particular gender group and vary by age.
Occupational component • Historical occupational supply is determined using the
Labour Force Survey (LFS) data by 4-digit and suppressed entries are estimated using various techniques which enlisted the help of the 2011 NHS and 2016 Census. LFS data is supplemented by data from the Canadian Institute for Health Information (CIHI) and Alberta Health.
• Over the forecast period, the distribution of occupation by educational attainment will adjust to changes in relative occupation to educational demand at a pace that is consistent with differences in occupational separation rates.
• Potential occupational new supply determined using a stock-flow approach. Age-specific participation rates are generated and applied those to graduates to get school leavers by educational attainment and field of study. Those school leavers are then translated to occupations using tables derived from the 2011 NHS and 2016 Census. Other sources of supply are added from migration forecast aided by the use of migration occupational tables and other labour market re-entrants.
**Stock-Flow Approach: A method in estimating the future population of people in a group of interest. To find the forecasted population, the population from the previous year is adjusted to add those expected to enter that group and subtract those that are expected to leave that group. Example:

Appendix C
2019 2020 2021 2022 2023 2024 2025 2026 2027 2028
Total Job Openings 120,433 121,182 127,314 137,718 136,949 135,480 134,489 132,603 133,866 135,906
Total Job Seekers 120,321 122,116 126,544 131,652 135,668 136,553 134,936 134,416 135,762 137,367
Cumulative Imbalance 112 -822 -52 6,014 7,295 6,222 5,775 3,962 2,066 605
0012 Senior government managers and officials
Job Openings 90 89 89 98 101 102 104 105 107 110
Job Seekers 102 102 104 105 106 107 107 108 109 110
Cumulative Imbalance -12 -25 -40 -47 -52 -57 -60 -63 -65 -65
0013 Senior managers - financial, communications and other business services
Job Openings 276 278 282 303 303 308 311 310 315 319
Job Seekers 277 279 283 288 291 293 294 296 299 302
Cumulative Imbalance -1 -2 -3 12 24 39 56 70 86 103
0014 Senior managers - health, education, social and community services and membership organizations
Job Openings 122 125 131 140 142 144 147 148 150 151
Job Seekers 133 134 135 137 138 139 140 141 143 144
Cumulative Imbalance -11 -20 -24 -21 -17 -12 -5 2 9 16
0015 Senior managers - trade, broadcasting and other services, n.e.c.
Job Openings 159 164 168 174 179 183 188 192 196 200
Job Seekers 190 183 186 183 182 186 188 192 194 198
Cumulative Imbalance -31 -50 -68 -77 -80 -83 -83 -83 -81 -79
0016 Senior managers - construction, transportation, production and utilities
Job Openings 350 366 385 375 387 395 401 414 420 431
Job Seekers 367 368 373 379 381 384 387 389 392 396
Cumulative Imbalance -17 -19 -7 -11 -5 6 20 45 73 108
0111 Financial managers
Job Openings 415 428 437 486 485 478 480 483 494 509
Job Seekers 391 395 409 425 439 441 436 435 440 446
Cumulative Imbalance 24 57 85 146 192 229 273 321 375 438
0112 Human resources managers
Job Openings 278 278 290 308 310 311 315 323 332 344
Job Seekers 317 320 327 336 342 345 343 344 348 352
Cumulative Imbalance -39 -81 -118 -146 -178 -212 -240 -261 -277 -285
0113 Purchasing managers
Job Openings 129 129 133 144 144 143 145 150 154 160
Job Seekers 143 145 148 152 155 156 156 156 158 159
Cumulative Imbalance -14 -30 -45 -53 -64 -77 -88 -94 -98 -97
0114 Other administrative services managers
Job Openings 149 152 157 165 169 173 177 180 185 189
Job Seekers 189 190 193 195 196 198 199 201 202 204
Cumulative Imbalance -40 -78 -114 -144 -171 -196 -218 -239 -256 -271
Alberta Occupational Outlook: 2019 - 2028

2019 2020 2021 2022 2023 2024 2025 2026 2027 2028
Alberta Occupational Outlook: 2019 - 2028
0121 Insurance, real estate and financial brokerage managers
Job Openings 156 194 188 214 214 212 214 211 215 216
Job Seekers 177 179 182 187 190 191 191 192 194 196
Cumulative Imbalance -21 -6 0 27 51 72 95 114 135 155
0122 Banking, credit and other investment managers
Job Openings 187 271 248 322 319 311 316 311 323 329
Job Seekers 279 282 291 301 309 311 309 308 312 316
Cumulative Imbalance -92 -103 -146 -125 -115 -115 -108 -105 -94 -81
0124 Advertising, marketing and public relations managers
Job Openings 213 205 210 233 232 234 236 236 242 248
Job Seekers 290 292 297 304 308 311 311 312 316 319
Cumulative Imbalance -77 -164 -251 -322 -398 -475 -550 -626 -700 -771
0125 Other business services managers
Job Openings 120 123 126 130 132 135 137 139 141 143
Job Seekers 148 149 151 153 153 154 156 157 158 160
Cumulative Imbalance -28 -54 -79 -102 -123 -142 -161 -179 -196 -213
0131 Telecommunication carriers managers
Job Openings 75 61 65 73 70 72 72 70 72 74
Job Seekers 58 59 61 63 65 65 65 64 65 66
Cumulative Imbalance 17 19 23 33 38 45 52 58 65 73
0132 Postal and courier services managers
Job Openings 16 19 14 26 20 18 19 18 19 19
Job Seekers 16 16 17 18 18 18 18 18 18 19
Cumulative Imbalance 0 3 0 8 10 10 11 11 12 12
0211 Engineering managers
Job Openings 204 175 181 204 194 186 186 194 200 212
Job Seekers 108 110 116 124 130 131 127 125 126 128
Cumulative Imbalance 96 161 226 306 370 425 484 553 627 711
0212 Architecture and science managers
Job Openings 83 70 74 94 90 86 85 83 85 88
Job Seekers 62 63 66 69 73 73 71 71 72 73
Cumulative Imbalance 21 28 36 61 78 91 105 117 130 145
0213 Computer and information systems managers
Job Openings 302 272 277 330 320 317 321 322 334 345
Job Seekers 307 309 318 328 337 339 336 336 340 345
Cumulative Imbalance -5 -42 -83 -81 -98 -120 -135 -149 -155 -155
0311 Managers in health care
Job Openings 216 218 253 307 311 303 309 304 313 314
Job Seekers 210 212 218 224 230 232 230 230 233 236
Cumulative Imbalance 6 12 47 130 211 282 361 435 515 593
2019 2020 2021 2022 2023 2024 2025 2026 2027 2028
Alberta Occupational Outlook: 2019 - 2028
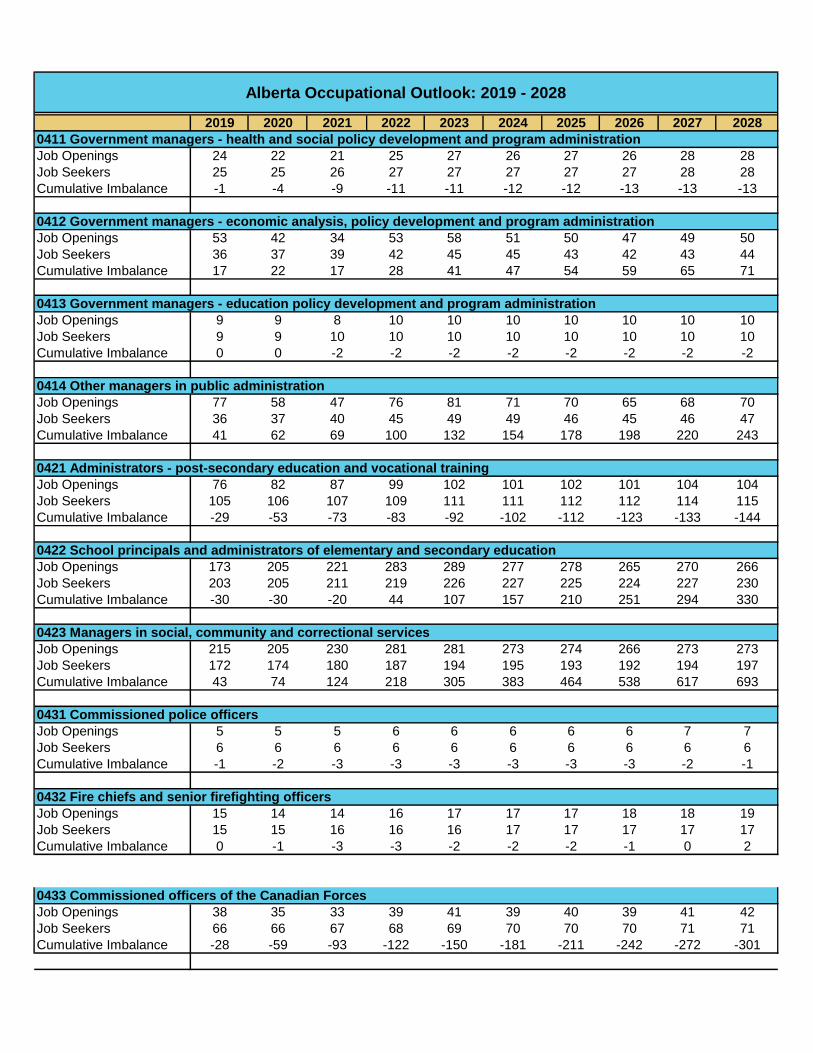
0411 Government managers - health and social policy development and program administration
Job Openings 24 22 21 25 27 26 27 26 28 28
Job Seekers 25 25 26 27 27 27 27 27 28 28
Cumulative Imbalance -1 -4 -9 -11 -11 -12 -12 -13 -13 -13
0412 Government managers - economic analysis, policy development and program administration
Job Openings 53 42 34 53 58 51 50 47 49 50
Job Seekers 36 37 39 42 45 45 43 42 43 44
Cumulative Imbalance 17 22 17 28 41 47 54 59 65 71
0413 Government managers - education policy development and program administration
Job Openings 9 9 8 10 10 10 10 10 10 10
Job Seekers 9 9 10 10 10 10 10 10 10 10
Cumulative Imbalance 0 0 -2 -2 -2 -2 -2 -2 -2 -2
0414 Other managers in public administration
Job Openings 77 58 47 76 81 71 70 65 68 70
Job Seekers 36 37 40 45 49 49 46 45 46 47
Cumulative Imbalance 41 62 69 100 132 154 178 198 220 243
0421 Administrators - post-secondary education and vocational training
Job Openings 76 82 87 99 102 101 102 101 104 104
Job Seekers 105 106 107 109 111 111 112 112 114 115
Cumulative Imbalance -29 -53 -73 -83 -92 -102 -112 -123 -133 -144
0422 School principals and administrators of elementary and secondary education
Job Openings 173 205 221 283 289 277 278 265 270 266
Job Seekers 203 205 211 219 226 227 225 224 227 230
Cumulative Imbalance -30 -30 -20 44 107 157 210 251 294 330
0423 Managers in social, community and correctional services
Job Openings 215 205 230 281 281 273 274 266 273 273
Job Seekers 172 174 180 187 194 195 193 192 194 197
Cumulative Imbalance 43 74 124 218 305 383 464 538 617 693
0431 Commissioned police officers
Job Openings 5 5 5 6 6 6 6 6 7 7
Job Seekers 6 6 6 6 6 6 6 6 6 6
Cumulative Imbalance -1 -2 -3 -3 -3 -3 -3 -3 -2 -1
0432 Fire chiefs and senior firefighting officers
Job Openings 15 14 14 16 17 17 17 18 18 19
Job Seekers 15 15 16 16 16 17 17 17 17 17
Cumulative Imbalance 0 -1 -3 -3 -2 -2 -2 -1 0 2
0433 Commissioned officers of the Canadian Forces
Job Openings 38 35 33 39 41 39 40 39 41 42
Job Seekers 66 66 67 68 69 70 70 70 71 71
Cumulative Imbalance -28 -59 -93 -122 -150 -181 -211 -242 -272 -301

2019 2020 2021 2022 2023 2024 2025 2026 2027 2028
Alberta Occupational Outlook: 2019 - 2028
0511 Library, archive, museum and art gallery managers
Job Openings 40 35 36 40 39 39 39 38 39 39
Job Seekers 37 37 38 39 40 40 40 40 41 41
Cumulative Imbalance 3 1 -1 0 -1 -2 -3 -5 -7 -9
0512 Managers - publishing, motion pictures, broadcasting and performing arts
Job Openings 29 25 26 29 29 29 30 29 30 30
Job Seekers 23 23 24 25 25 25 25 25 26 26
Cumulative Imbalance 6 8 10 14 18 22 27 31 35 39
0513 Recreation, sports and fitness program and service directors
Job Openings 81 71 73 83 81 82 82 80 82 84
Job Seekers 76 77 79 81 83 84 83 84 85 86
Cumulative Imbalance 5 -1 -7 -5 -7 -9 -10 -14 -17 -19
0601 Corporate sales managers
Job Openings 264 275 276 304 308 310 317 321 329 337
Job Seekers 326 328 335 342 346 348 349 351 354 358
Cumulative Imbalance -62 -115 -174 -212 -250 -288 -320 -350 -375 -396
0621 Retail and wholesale trade managers
Job Openings 2,128 2,279 2,070 2,710 2,734 2,661 2,685 2,602 2,669 2,694
Job Seekers 2,089 2,118 2,192 2,277 2,343 2,359 2,334 2,327 2,351 2,379
Cumulative Imbalance 39 200 78 511 902 1,204 1,555 1,830 2,148 2,463
0631 Restaurant and food service managers
Job Openings 967 759 795 913 856 884 877 848 865 885
Job Seekers 676 687 714 746 772 777 766 762 770 781
Cumulative Imbalance 291 363 444 611 695 802 913 999 1,094 1,198
0632 Accommodation service managers
Job Openings 310 233 246 298 272 276 270 253 255 258
Job Seekers 124 127 137 148 158 159 153 150 152 155
Cumulative Imbalance 186 292 401 551 665 782 899 1,002 1,105 1,208
0651 Managers in customer and personal services, n.e.c.
Job Openings 205 182 189 210 204 208 209 205 208 211
Job Seekers 176 178 183 189 193 195 194 194 195 197
Cumulative Imbalance 29 33 39 60 71 84 99 110 123 137
0711 Construction managers
Job Openings 701 948 1,288 447 710 906 864 932 870 918
Job Seekers 690 699 725 755 780 784 773 768 776 785
Cumulative Imbalance 11 260 823 515 445 567 658 822 916 1,049
0712 Home building and renovation managers
Job Openings 382 815 1,382 -136 318 653 564 661 532 589
Job Seekers 235 245 272 306 338 339 317 306 311 320
Cumulative Imbalance 147 717 1,827 1,385 1,365 1,679 1,926 2,281 2,502 2,771

2019 2020 2021 2022 2023 2024 2025 2026 2027 2028
Alberta Occupational Outlook: 2019 - 2028
0714 Facility operation and maintenance managers
Job Openings 395 410 410 467 460 454 459 462 473 483
Job Seekers 380 384 394 405 413 416 414 414 418 422
Cumulative Imbalance 15 41 57 119 166 204 249 297 352 413
0731 Managers in transportation
Job Openings 225 256 211 340 270 251 258 250 260 263
Job Seekers 197 201 210 220 229 230 226 224 227 230
Cumulative Imbalance 28 83 84 204 245 266 298 324 357 390
0811 Managers in natural resources production and fishing
Job Openings 269 254 265 319 303 260 261 312 335 372
Job Seekers 234 238 247 259 268 270 265 263 266 270
Cumulative Imbalance 35 51 69 129 164 154 150 199 268 370
0821 Managers in agriculture
Job Openings 605 1,816 1,668 1,945 1,858 1,695 1,606 1,529 1,521 1,471
Job Seekers 1,263 1,283 1,333 1,389 1,431 1,440 1,422 1,416 1,429 1,445
Cumulative Imbalance -658 -125 210 766 1,193 1,448 1,632 1,745 1,837 1,863
0822 Managers in horticulture
Job Openings -41 23 16 34 31 24 21 19 21 21
Job Seekers 20 21 23 25 28 28 26 25 26 26
Cumulative Imbalance -61 -59 -66 -57 -54 -58 -63 -69 -74 -79
0823 Managers in aquaculture
Job Openings 1 2 2 2 2 2 2 2 2 2
Job Seekers 1 1 2 2 2 2 2 2 2 2
Cumulative Imbalance 0 1 1 1 1 1 1 1 1 1
0911 Manufacturing managers
Job Openings 306 296 275 357 325 297 312 301 303 303
Job Seekers 285 290 300 313 323 325 320 319 322 326
Cumulative Imbalance 21 27 2 46 48 20 12 -6 -25 -48
0912 Utilities managers
Job Openings 196 147 142 156 151 144 147 148 150 157
Job Seekers 102 103 108 114 120 120 117 116 118 119
Cumulative Imbalance 94 138 172 214 245 269 299 331 363 401
1111 Financial auditors and accountants
Job Openings 1,611 1,431 1,466 1,680 1,612 1,561 1,546 1,563 1,600 1,661
Job Seekers 1,497 1,513 1,562 1,623 1,674 1,684 1,662 1,656 1,677 1,701
Cumulative Imbalance 114 32 -64 -7 -69 -192 -308 -401 -478 -518
1112 Financial and investment analysts
Job Openings 154 174 162 216 207 191 191 192 199 207
Job Seekers 218 220 227 236 244 245 242 241 244 248
Cumulative Imbalance -64 -110 -175 -195 -232 -286 -337 -386 -431 -472
2019 2020 2021 2022 2023 2024 2025 2026 2027 2028
Alberta Occupational Outlook: 2019 - 2028
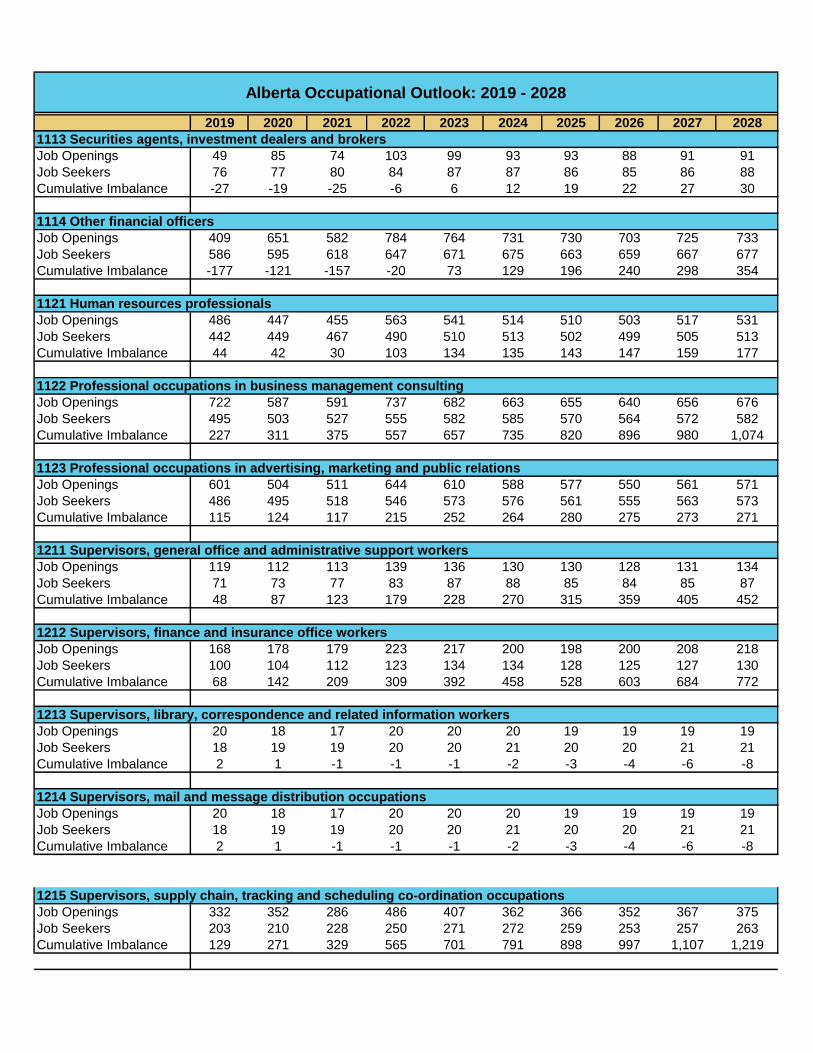
1113 Securities agents, investment dealers and brokers
Job Openings 49 85 74 103 99 93 93 88 91 91
Job Seekers 76 77 80 84 87 87 86 85 86 88
Cumulative Imbalance -27 -19 -25 -6 6 12 19 22 27 30
1114 Other financial officers
Job Openings 409 651 582 784 764 731 730 703 725 733
Job Seekers 586 595 618 647 671 675 663 659 667 677
Cumulative Imbalance -177 -121 -157 -20 73 129 196 240 298 354
1121 Human resources professionals
Job Openings 486 447 455 563 541 514 510 503 517 531
Job Seekers 442 449 467 490 510 513 502 499 505 513
Cumulative Imbalance 44 42 30 103 134 135 143 147 159 177
1122 Professional occupations in business management consulting
Job Openings 722 587 591 737 682 663 655 640 656 676
Job Seekers 495 503 527 555 582 585 570 564 572 582
Cumulative Imbalance 227 311 375 557 657 735 820 896 980 1,074
1123 Professional occupations in advertising, marketing and public relations
Job Openings 601 504 511 644 610 588 577 550 561 571
Job Seekers 486 495 518 546 573 576 561 555 563 573
Cumulative Imbalance 115 124 117 215 252 264 280 275 273 271
1211 Supervisors, general office and administrative support workers
Job Openings 119 112 113 139 136 130 130 128 131 134
Job Seekers 71 73 77 83 87 88 85 84 85 87
Cumulative Imbalance 48 87 123 179 228 270 315 359 405 452
1212 Supervisors, finance and insurance office workers
Job Openings 168 178 179 223 217 200 198 200 208 218
Job Seekers 100 104 112 123 134 134 128 125 127 130
Cumulative Imbalance 68 142 209 309 392 458 528 603 684 772
1213 Supervisors, library, correspondence and related information workers
Job Openings 20 18 17 20 20 20 19 19 19 19
Job Seekers 18 19 19 20 20 21 20 20 21 21
Cumulative Imbalance 2 1 -1 -1 -1 -2 -3 -4 -6 -8
1214 Supervisors, mail and message distribution occupations
Job Openings 20 18 17 20 20 20 19 19 19 19
Job Seekers 18 19 19 20 20 21 20 20 21 21
Cumulative Imbalance 2 1 -1 -1 -1 -2 -3 -4 -6 -8
1215 Supervisors, supply chain, tracking and scheduling co-ordination occupations
Job Openings 332 352 286 486 407 362 366 352 367 375
Job Seekers 203 210 228 250 271 272 259 253 257 263
Cumulative Imbalance 129 271 329 565 701 791 898 997 1,107 1,219

2019 2020 2021 2022 2023 2024 2025 2026 2027 2028
Alberta Occupational Outlook: 2019 - 2028
1221 Administrative officers
Job Openings 1,727 1,746 1,866 1,974 2,001 2,001 2,002 2,004 2,033 2,078
Job Seekers 1,526 1,546 1,600 1,663 1,714 1,726 1,708 1,705 1,725 1,748
Cumulative Imbalance 201 401 667 978 1,265 1,540 1,834 2,133 2,441 2,771
1222 Executive assistants
Job Openings 308 300 311 355 355 348 347 344 352 361
Job Seekers 234 237 248 260 271 273 268 266 269 274
Cumulative Imbalance 74 137 200 295 379 454 533 611 694 781
1223 Human resources and recruitment officers
Job Openings 150 135 141 163 159 156 155 153 157 161
Job Seekers 151 153 158 164 169 171 169 168 171 173
Cumulative Imbalance -1 -19 -36 -37 -47 -62 -76 -91 -105 -117
1224 Property administrators
Job Openings 271 328 317 354 351 343 341 333 335 334
Job Seekers 261 263 271 279 285 287 286 286 289 292
Cumulative Imbalance 10 75 121 196 262 318 373 420 466 508
1225 Purchasing agents and officers
Job Openings 484 469 480 551 536 491 490 528 549 586
Job Seekers 377 384 402 424 443 445 436 432 438 445
Cumulative Imbalance 107 192 270 397 490 536 590 686 797 938
1226 Conference and event planners
Job Openings 150 126 131 160 151 150 148 140 143 144
Job Seekers 117 119 124 131 136 137 134 133 135 138
Cumulative Imbalance 33 40 47 76 91 104 118 125 133 139
1227 Court officers and justices of the peace
Job Openings 16 16 16 16 16 16 16 16 16 16
Job Seekers 17 17 17 17 17 18 18 18 18 18
Cumulative Imbalance -1 -2 -3 -4 -5 -7 -9 -11 -13 -15
1228 Employment insurance, immigration, border services and revenue officers
Job Openings 120 99 85 120 128 118 117 110 115 117
Job Seekers 99 100 105 111 116 117 114 113 115 117
Cumulative Imbalance 21 20 0 9 21 22 25 22 22 22
1241 Administrative assistants
Job Openings 1,419 1,455 1,520 1,651 1,665 1,651 1,644 1,627 1,648 1,676
Job Seekers 1,154 1,172 1,219 1,275 1,319 1,329 1,311 1,306 1,322 1,340
Cumulative Imbalance 265 548 849 1,225 1,571 1,893 2,226 2,547 2,873 3,209
1242 Legal administrative assistants
Job Openings 398 313 323 382 357 362 356 341 347 355
Job Seekers 242 246 258 272 285 287 280 278 282 287
Cumulative Imbalance 156 223 288 398 470 545 621 684 749 817

2019 2020 2021 2022 2023 2024 2025 2026 2027 2028
Alberta Occupational Outlook: 2019 - 2028
1243 Medical administrative assistants
Job Openings 259 259 306 380 382 367 371 359 367 364
Job Seekers 199 202 210 220 228 230 226 225 228 232
Cumulative Imbalance 60 117 213 373 527 664 809 943 1,082 1,214
1251 Court reporters, medical transcriptionists and related occupations
Job Openings 120 104 118 149 145 141 140 133 136 136
Job Seekers 64 65 69 74 78 79 76 75 77 78
Cumulative Imbalance 56 95 144 219 286 348 412 470 529 587
1252 Health information management occupations
Job Openings 26 26 28 31 32 32 34 34 35 36
Job Seekers 33 33 33 34 34 34 35 35 35 36
Cumulative Imbalance -7 -14 -19 -22 -24 -26 -27 -28 -28 -28
1253 Records management technicians
Job Openings 30 30 31 33 34 34 35 37 38 39
Job Seekers 37 37 38 39 39 39 39 40 40 41
Cumulative Imbalance -7 -14 -21 -27 -32 -37 -41 -44 -46 -48
1254 Statistical officers and related research support occupations
Job Openings 15 15 15 17 17 17 18 18 18 19
Job Seekers 22 22 23 23 23 23 24 24 24 24
Cumulative Imbalance -7 -14 -22 -28 -34 -40 -46 -52 -58 -63
1311 Accounting technicians and bookkeepers
Job Openings 1,370 1,341 1,433 1,468 1,447 1,466 1,439 1,421 1,427 1,458
Job Seekers 1,066 1,083 1,129 1,183 1,231 1,238 1,213 1,203 1,217 1,234
Cumulative Imbalance 304 562 866 1,151 1,367 1,595 1,821 2,039 2,249 2,473
1312 Insurance adjusters and claims examiners
Job Openings 86 145 130 171 168 162 163 158 163 165
Job Seekers 163 165 169 175 180 181 179 179 181 183
Cumulative Imbalance -77 -97 -136 -140 -152 -171 -187 -208 -226 -244
1313 Insurance underwriters
Job Openings 43 54 52 60 60 60 61 61 63 64
Job Seekers 91 92 93 94 95 96 96 97 98 98
Cumulative Imbalance -48 -86 -127 -161 -196 -232 -267 -303 -338 -372
1314 Assessors, valuators and appraisers
Job Openings 55 68 62 80 80 76 75 72 74 74
Job Seekers 78 79 81 84 86 87 86 85 86 87
Cumulative Imbalance -23 -34 -53 -57 -63 -74 -85 -98 -110 -123
1315 Customs, ship and other brokers
Job Openings 10 10 10 12 11 11 12 12 12 12
Job Seekers 15 15 15 15 15 15 15 15 16 16
Cumulative Imbalance -5 -10 -15 -18 -22 -26 -29 -32 -36 -40

2019 2020 2021 2022 2023 2024 2025 2026 2027 2028
Alberta Occupational Outlook: 2019 - 2028
1411 General office support workers
Job Openings 1,579 1,599 1,701 1,910 1,918 1,888 1,892 1,864 1,894 1,916
Job Seekers 1,420 1,440 1,491 1,552 1,601 1,612 1,594 1,590 1,608 1,630
Cumulative Imbalance 159 318 528 886 1,203 1,479 1,777 2,051 2,337 2,623
1414 Receptionists
Job Openings 1,178 1,142 1,265 1,502 1,491 1,455 1,457 1,411 1,436 1,438
Job Seekers 958 973 1,013 1,060 1,100 1,109 1,092 1,086 1,099 1,115
Cumulative Imbalance 220 389 641 1,083 1,474 1,820 2,185 2,510 2,847 3,170
1415 Personnel clerks
Job Openings 46 47 49 53 54 54 55 56 57 58
Job Seekers 64 64 65 67 68 68 68 69 69 70
Cumulative Imbalance -18 -35 -51 -65 -79 -93 -106 -119 -131 -143
1416 Court clerks
Job Openings 22 21 20 23 24 24 24 24 25 25
Job Seekers 28 28 29 29 30 30 30 30 30 31
Cumulative Imbalance -6 -13 -22 -28 -34 -40 -46 -52 -57 -63
1422 Data entry clerks
Job Openings 224 223 222 268 260 253 255 255 262 268
Job Seekers 216 219 226 235 242 243 241 241 244 247
Cumulative Imbalance 8 12 8 41 59 69 83 97 115 136
1423 Desktop publishing operators and related occupations
Job Openings 6 6 6 7 7 7 7 7 7 7
Job Seekers 7 7 7 7 8 8 8 8 8 8
Cumulative Imbalance -1 -2 -3 -3 -4 -5 -6 -7 -8 -9
1431 Accounting and related clerks
Job Openings 937 932 958 1,062 1,047 1,032 1,032 1,036 1,056 1,085
Job Seekers 830 842 873 909 939 945 933 930 941 954
Cumulative Imbalance 107 197 282 435 543 630 729 835 950 1,081
1432 Payroll clerks
Job Openings 257 262 282 290 295 292 290 296 302 314
Job Seekers 213 216 226 238 247 249 244 242 246 249
Cumulative Imbalance 44 90 146 198 246 289 335 389 445 510
1434 Banking, insurance and other financial clerks
Job Openings 72 105 96 124 123 119 120 117 121 122
Job Seekers 97 98 101 106 109 110 108 108 109 111
Cumulative Imbalance -25 -18 -23 -5 9 18 30 39 51 62
1435 Collectors
Job Openings 51 48 44 60 58 55 55 53 54 56
Job Seekers 36 37 39 41 44 44 43 42 43 43
Cumulative Imbalance 15 26 31 50 64 75 87 98 109 122
2019 2020 2021 2022 2023 2024 2025 2026 2027 2028
Alberta Occupational Outlook: 2019 - 2028
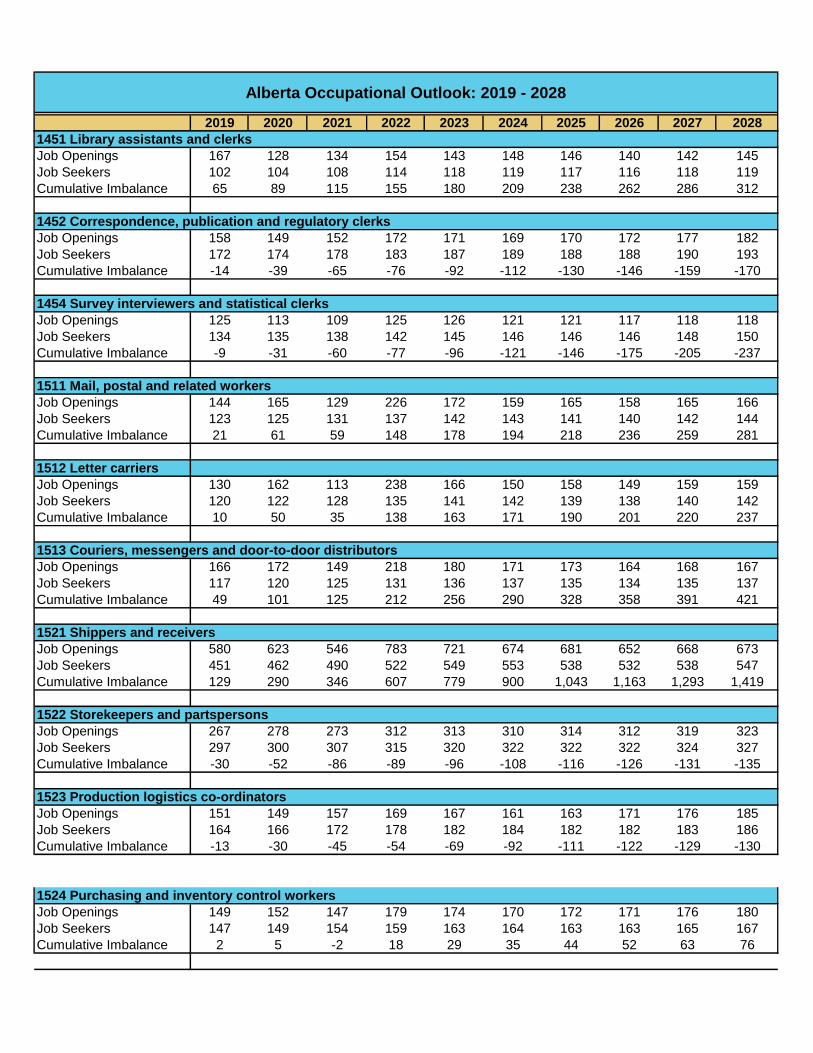
1451 Library assistants and clerks
Job Openings 167 128 134 154 143 148 146 140 142 145
Job Seekers 102 104 108 114 118 119 117 116 118 119
Cumulative Imbalance 65 89 115 155 180 209 238 262 286 312
1452 Correspondence, publication and regulatory clerks
Job Openings 158 149 152 172 171 169 170 172 177 182
Job Seekers 172 174 178 183 187 189 188 188 190 193
Cumulative Imbalance -14 -39 -65 -76 -92 -112 -130 -146 -159 -170
1454 Survey interviewers and statistical clerks
Job Openings 125 113 109 125 126 121 121 117 118 118
Job Seekers 134 135 138 142 145 146 146 146 148 150
Cumulative Imbalance -9 -31 -60 -77 -96 -121 -146 -175 -205 -237
1511 Mail, postal and related workers
Job Openings 144 165 129 226 172 159 165 158 165 166
Job Seekers 123 125 131 137 142 143 141 140 142 144
Cumulative Imbalance 21 61 59 148 178 194 218 236 259 281
1512 Letter carriers
Job Openings 130 162 113 238 166 150 158 149 159 159
Job Seekers 120 122 128 135 141 142 139 138 140 142
Cumulative Imbalance 10 50 35 138 163 171 190 201 220 237
1513 Couriers, messengers and door-to-door distributors
Job Openings 166 172 149 218 180 171 173 164 168 167
Job Seekers 117 120 125 131 136 137 135 134 135 137
Cumulative Imbalance 49 101 125 212 256 290 328 358 391 421
1521 Shippers and receivers
Job Openings 580 623 546 783 721 674 681 652 668 673
Job Seekers 451 462 490 522 549 553 538 532 538 547
Cumulative Imbalance 129 290 346 607 779 900 1,043 1,163 1,293 1,419
1522 Storekeepers and partspersons
Job Openings 267 278 273 312 313 310 314 312 319 323
Job Seekers 297 300 307 315 320 322 322 322 324 327
Cumulative Imbalance -30 -52 -86 -89 -96 -108 -116 -126 -131 -135
1523 Production logistics co-ordinators
Job Openings 151 149 157 169 167 161 163 171 176 185
Job Seekers 164 166 172 178 182 184 182 182 183 186
Cumulative Imbalance -13 -30 -45 -54 -69 -92 -111 -122 -129 -130
1524 Purchasing and inventory control workers
Job Openings 149 152 147 179 174 170 172 171 176 180
Job Seekers 147 149 154 159 163 164 163 163 165 167
Cumulative Imbalance 2 5 -2 18 29 35 44 52 63 76

2019 2020 2021 2022 2023 2024 2025 2026 2027 2028
Alberta Occupational Outlook: 2019 - 2028
1525 Dispatchers
Job Openings 234 240 210 314 265 245 248 244 254 260
Job Seekers 198 202 213 225 236 237 232 229 232 236
Cumulative Imbalance 36 74 71 160 189 197 213 228 250 274
1526 Transportation route and crew schedulers
Job Openings 29 30 30 34 33 32 33 33 33 33
Job Seekers 36 36 37 38 38 39 39 39 39 40
Cumulative Imbalance -7 -13 -20 -24 -29 -36 -42 -48 -54 -61
2111 Physicists and astronomers
Job Openings 9 9 9 9 10 10 10 10 10 11
Job Seekers 17 17 17 17 17 17 17 17 18 18
Cumulative Imbalance -8 -16 -24 -32 -39 -46 -53 -60 -68 -75
2112 Chemists
Job Openings 77 69 69 84 79 73 73 72 73 75
Job Seekers 117 118 120 123 126 127 126 126 128 130
Cumulative Imbalance -40 -89 -140 -179 -226 -280 -333 -387 -442 -497
2113 Geoscientists and oceanographers
Job Openings 279 247 254 302 287 258 256 285 300 323
Job Seekers 452 454 460 470 477 480 479 482 489 496
Cumulative Imbalance -173 -380 -586 -754 -944 -1,166 -1,389 -1,586 -1,775 -1,948
2114 Meteorologists and climatologists
Job Openings 7 7 7 7 7 8 8 8 8 8
Job Seekers 15 15 15 15 15 15 15 15 16 16
Cumulative Imbalance -8 -16 -24 -32 -40 -47 -54 -61 -69 -77
2115 Other professional occupations in physical sciences
Job Openings 8 7 7 7 7 7 7 7 7 7
Job Seekers 12 12 12 12 12 12 12 12 13 13
Cumulative Imbalance -4 -9 -14 -19 -24 -29 -34 -39 -45 -51
2121 Biologists and related scientists
Job Openings 157 135 139 164 158 155 153 147 149 151
Job Seekers 207 208 213 219 223 225 223 224 227 230
Cumulative Imbalance -50 -123 -197 -252 -317 -387 -457 -534 -612 -691
2122 Forestry professionals
Job Openings 21 22 22 23 23 23 24 24 24 25
Job Seekers 20 20 21 21 21 21 21 21 21 21
Cumulative Imbalance 1 3 4 6 8 10 13 16 19 23
2123 Agricultural representatives, consultants and specialists
Job Openings 54 72 65 87 83 77 75 71 72 72
Job Seekers 92 93 96 99 102 103 102 101 103 104
Cumulative Imbalance -38 -59 -90 -102 -121 -147 -174 -204 -235 -267

2019 2020 2021 2022 2023 2024 2025 2026 2027 2028
Alberta Occupational Outlook: 2019 - 2028
2131 Civil engineers
Job Openings 583 532 564 551 552 563 557 556 558 571
Job Seekers 399 405 422 440 452 455 449 445 448 451
Cumulative Imbalance 184 311 453 564 664 772 880 991 1,101 1,221
2132 Mechanical engineers
Job Openings 452 407 416 458 441 428 429 441 451 470
Job Seekers 322 327 341 356 366 368 363 360 362 364
Cumulative Imbalance 130 210 285 387 462 522 588 669 758 864
2133 Electrical and electronics engineers
Job Openings 478 389 391 440 421 409 411 412 418 433
Job Seekers 287 292 306 321 332 334 328 325 327 330
Cumulative Imbalance 191 288 373 492 581 656 739 826 917 1,020
2134 Chemical engineers
Job Openings 188 175 176 198 191 183 185 193 199 207
Job Seekers 153 155 160 165 168 169 168 168 168 169
Cumulative Imbalance 35 55 71 104 127 141 158 183 214 252
2141 Industrial and manufacturing engineers
Job Openings 103 94 95 112 106 98 99 107 111 118
Job Seekers 95 96 100 103 106 106 105 105 105 106
Cumulative Imbalance 8 6 1 10 10 2 -4 -2 4 16
2142 Metallurgical and materials engineers
Job Openings 30 29 29 30 30 30 30 30 30 30
Job Seekers 29 29 30 30 30 31 31 31 31 31
Cumulative Imbalance 1 1 0 0 0 -1 -2 -3 -4 -5
2143 Mining engineers
Job Openings 49 38 38 54 47 35 34 44 49 57
Job Seekers 24 25 27 30 32 32 31 30 30 30
Cumulative Imbalance 25 38 49 73 88 91 94 108 127 154
2144 Geological engineers
Job Openings 24 23 24 25 25 25 25 26 26 27
Job Seekers 22 22 22 23 23 23 23 23 23 24
Cumulative Imbalance 2 3 5 7 9 11 13 16 19 22
2145 Petroleum engineers
Job Openings 483 392 399 543 483 371 362 461 502 575
Job Seekers 245 254 275 299 320 321 306 299 302 307
Cumulative Imbalance 238 376 500 744 907 957 1,013 1,175 1,375 1,643
2146 Aerospace engineers
Job Openings 5 5 5 6 5 6 6 6 6 6
Job Seekers 5 5 5 5 5 5 5 5 6 6
Cumulative Imbalance 0 0 0 1 1 2 3 4 4 4

2019 2020 2021 2022 2023 2024 2025 2026 2027 2028
Alberta Occupational Outlook: 2019 - 2028
2147 Computer engineers (except software engineers and designers)
Job Openings 121 105 107 122 117 116 116 115 117 121
Job Seekers 107 108 111 116 119 119 118 118 119 120
Cumulative Imbalance 14 11 7 13 11 8 6 3 1 2
2148 Other professional engineers, n.e.c.
Job Openings 53 48 44 75 62 55 53 50 53 54
Job Seekers 15 17 20 23 27 27 24 23 23 24
Cumulative Imbalance 38 69 93 145 180 208 237 264 294 324
2151 Architects
Job Openings 73 68 71 72 72 73 73 72 73 74
Job Seekers 127 127 128 130 131 132 132 133 135 136
Cumulative Imbalance -54 -113 -170 -228 -287 -346 -405 -466 -528 -590
2152 Landscape architects
Job Openings 9 8 9 9 9 9 9 9 9 9
Job Seekers 14 14 14 14 14 14 15 15 15 15
Cumulative Imbalance -5 -11 -16 -21 -26 -31 -37 -43 -49 -55
2153 Urban and land use planners
Job Openings 129 113 111 127 128 123 121 120 122 125
Job Seekers 154 156 160 165 169 170 168 168 170 173
Cumulative Imbalance -25 -68 -117 -155 -196 -243 -290 -338 -386 -434
2154 Land surveyors
Job Openings 111 95 105 97 97 101 99 99 99 102
Job Seekers 85 87 90 94 97 98 96 96 97 98
Cumulative Imbalance 26 34 49 52 52 55 58 61 63 67
2161 Mathematicians, statisticians and actuaries
Job Openings 25 24 25 27 27 26 26 26 26 27
Job Seekers 45 45 46 47 47 47 48 48 48 49
Cumulative Imbalance -20 -41 -62 -82 -102 -123 -145 -167 -189 -211
2171 Information systems analysts and consultants
Job Openings 1,086 959 970 1,159 1,114 1,093 1,094 1,081 1,110 1,139
Job Seekers 1,179 1,190 1,224 1,265 1,296 1,304 1,293 1,292 1,306 1,323
Cumulative Imbalance -93 -324 -578 -684 -866 -1,077 -1,276 -1,487 -1,683 -1,867
2172 Database analysts and data administrators
Job Openings 163 137 138 175 165 156 155 154 160 166
Job Seekers 141 143 149 156 163 164 160 159 161 164
Cumulative Imbalance 22 16 5 24 26 18 13 8 7 9
2173 Software engineers and designers
Job Openings 200 168 168 204 190 187 186 182 187 192
Job Seekers 191 194 200 208 215 216 213 212 214 217
Cumulative Imbalance 9 -17 -49 -53 -78 -107 -134 -164 -191 -216

2019 2020 2021 2022 2023 2024 2025 2026 2027 2028
Alberta Occupational Outlook: 2019 - 2028
2174 Computer programmers and interactive media developers
Job Openings 605 477 490 594 545 543 533 509 519 532
Job Seekers 505 512 533 559 582 585 573 569 577 586
Cumulative Imbalance 100 65 22 57 20 -22 -62 -122 -180 -234
2175 Web designers and developers
Job Openings 143 111 113 142 130 130 126 118 120 121
Job Seekers 115 117 123 129 135 135 132 131 133 135
Cumulative Imbalance 28 22 12 25 20 15 9 -4 -17 -31
2211 Chemical technologists and technicians
Job Openings 164 149 148 172 165 158 160 161 165 170
Job Seekers 227 228 233 239 243 244 244 245 247 250
Cumulative Imbalance -63 -142 -227 -294 -372 -458 -542 -626 -708 -788
2212 Geological and mineral technologists and technicians
Job Openings 139 129 133 153 148 136 137 151 159 170
Job Seekers 174 175 180 184 188 189 189 189 191 193
Cumulative Imbalance -35 -81 -128 -159 -199 -252 -304 -342 -374 -397
2221 Biological technologists and technicians
Job Openings 38 38 39 40 41 41 41 41 42 42
Job Seekers 69 69 70 71 71 72 72 73 74 74
Cumulative Imbalance -31 -62 -93 -124 -154 -185 -216 -248 -280 -312
2222 Agricultural and fish products inspectors
Job Openings 26 27 27 29 29 29 30 30 30 30
Job Seekers 39 40 40 41 41 41 41 42 42 42
Cumulative Imbalance -13 -26 -39 -51 -63 -75 -86 -98 -110 -122
2223 Forestry technologists and technicians
Job Openings 30 36 31 47 44 39 38 34 35 35
Job Seekers 23 24 26 29 32 32 30 29 30 30
Cumulative Imbalance 7 19 24 42 54 61 69 74 79 84
2224 Conservation and fishery officers
Job Openings 18 18 18 19 19 20 20 20 21 22
Job Seekers 24 24 24 25 25 25 25 25 25 25
Cumulative Imbalance -6 -12 -18 -24 -30 -35 -40 -45 -49 -52
2225 Landscape and horticulture technicians and specialists
Job Openings 118 102 104 120 114 115 114 110 112 113
Job Seekers 101 102 106 110 114 114 113 113 114 115
Cumulative Imbalance 17 17 15 25 25 26 27 24 22 20
2231 Civil engineering technologists and technicians
Job Openings 208 187 203 185 190 196 192 191 190 195
Job Seekers 170 172 179 187 193 194 191 190 192 195
Cumulative Imbalance 38 53 77 75 72 74 75 76 74 74

2019 2020 2021 2022 2023 2024 2025 2026 2027 2028
Alberta Occupational Outlook: 2019 - 2028
2232 Mechanical engineering technologists and technicians
Job Openings 113 105 109 116 113 110 109 112 114 118
Job Seekers 115 116 120 124 127 128 127 127 128 129
Cumulative Imbalance -2 -13 -24 -32 -46 -64 -82 -97 -111 -122
2233 Industrial engineering and manufacturing technologists and technicians
Job Openings 93 87 86 100 96 90 92 92 94 97
Job Seekers 96 98 101 105 108 109 107 107 108 109
Cumulative Imbalance -3 -14 -29 -34 -46 -65 -80 -95 -109 -121
2234 Construction estimators
Job Openings 228 284 369 160 223 270 258 273 256 267
Job Seekers 236 239 248 258 265 266 263 262 264 267
Cumulative Imbalance -8 37 158 60 18 22 17 28 20 20
2241 Electrical and electronics engineering technologists and technicians
Job Openings 245 238 252 248 254 257 258 263 266 273
Job Seekers 275 278 284 292 297 299 298 298 301 304
Cumulative Imbalance -30 -70 -102 -146 -189 -231 -271 -306 -341 -372
2242 Electronic service technicians (household and business equipment)
Job Openings 373 364 387 377 386 398 394 387 387 395
Job Seekers 337 342 355 370 382 384 380 378 382 386
Cumulative Imbalance 36 58 90 97 101 115 129 138 143 152
2243 Industrial instrument technicians and mechanics
Job Openings 164 156 163 171 167 156 156 169 174 185
Job Seekers 211 213 219 225 230 231 230 230 231 233
Cumulative Imbalance -47 -104 -160 -214 -277 -352 -426 -487 -544 -592
2244 Aircraft instrument, electrical and avionics mechanics, technicians and inspectors
Job Openings 31 34 28 44 36 33 34 33 35 35
Job Seekers 42 42 43 45 46 46 46 46 46 46
Cumulative Imbalance -11 -19 -34 -35 -45 -58 -70 -83 -94 -105
2251 Architectural technologists and technicians
Job Openings 104 87 98 89 89 95 93 90 89 91
Job Seekers 86 87 91 95 98 99 97 97 98 99
Cumulative Imbalance 18 18 25 19 10 6 2 -5 -14 -22
2252 Industrial designers
Job Openings 25 25 26 26 27 27 28 28 29 29
Job Seekers 35 35 36 36 37 37 37 37 38 38
Cumulative Imbalance -10 -20 -30 -40 -50 -60 -69 -78 -87 -96
2253 Drafting technologists and technicians
Job Openings 383 326 354 347 339 343 337 338 339 353
Job Seekers 273 278 291 307 321 322 315 312 316 321
Cumulative Imbalance 110 158 221 261 279 300 322 348 371 403

2019 2020 2021 2022 2023 2024 2025 2026 2027 2028
Alberta Occupational Outlook: 2019 - 2028
2254 Land survey technologists and technicians
Job Openings 149 101 113 114 106 110 104 98 98 102
Job Seekers 30 32 38 45 52 52 47 44 46 47
Cumulative Imbalance 119 188 263 332 386 444 501 555 607 662
2255 Technical occupations in geomatics and meteorology
Job Openings 98 84 83 99 95 92 91 90 92 95
Job Seekers 104 105 108 112 115 116 115 114 116 117
Cumulative Imbalance -6 -27 -52 -65 -85 -109 -133 -157 -181 -203
2261 Non-destructive testers and inspection technicians
Job Openings 152 135 143 149 144 144 143 147 149 155
Job Seekers 165 167 171 177 181 182 181 180 182 184
Cumulative Imbalance -13 -45 -73 -101 -138 -176 -214 -247 -280 -309
2262 Engineering inspectors and regulatory officers
Job Openings 65 59 59 69 66 62 62 65 68 71
Job Seekers 64 65 67 69 71 71 70 70 71 72
Cumulative Imbalance 1 -5 -13 -13 -18 -27 -35 -40 -43 -44
2263 Inspectors in public and environmental health and occupational health and safety
Job Openings 482 471 509 503 509 503 500 519 528 551
Job Seekers 486 492 509 528 542 546 540 539 544 551
Cumulative Imbalance -4 -25 -25 -50 -83 -126 -166 -186 -202 -202
2264 Construction inspectors
Job Openings 214 223 275 167 199 220 210 219 212 223
Job Seekers 143 147 155 165 174 175 170 167 169 172
Cumulative Imbalance 71 147 267 269 294 339 379 431 474 525
2271 Air pilots, flight engineers and flying instructors
Job Openings 129 159 108 236 160 140 146 134 142 139
Job Seekers 110 113 120 127 134 134 131 129 130 132
Cumulative Imbalance 19 65 53 162 188 194 209 214 226 233
2272 Air traffic controllers and related occupations
Job Openings 27 29 26 34 30 29 30 30 31 31
Job Seekers 37 37 38 39 39 40 40 40 40 41
Cumulative Imbalance -10 -18 -30 -35 -44 -55 -65 -75 -84 -94
2273 Deck officers, water transport
Job Openings 5 4 4 5 5 5 5 5 5 5
Job Seekers 6 6 7 7 7 7 7 7 7 7
Cumulative Imbalance -1 -3 -6 -8 -10 -12 -14 -16 -18 -20
2274 Engineer officers, water transport
Job Openings 1 1 1 1 1 1 1 1 1 1
Job Seekers 1 1 1 1 1 1 1 1 1 1
Cumulative Imbalance 0 0 0 0 0 0 0 0 0 0

2019 2020 2021 2022 2023 2024 2025 2026 2027 2028
Alberta Occupational Outlook: 2019 - 2028
2275 Railway traffic controllers and marine traffic regulators
Job Openings 13 14 13 16 15 15 15 15 16 16
Job Seekers 18 18 18 19 19 19 19 19 19 20
Cumulative Imbalance -5 -9 -14 -17 -21 -25 -29 -33 -36 -40
2281 Computer network technicians
Job Openings 327 309 315 355 349 347 349 349 358 366
Job Seekers 425 428 438 449 456 459 459 460 465 469
Cumulative Imbalance -98 -217 -340 -434 -541 -653 -763 -874 -981 -1,084
2282 User support technicians
Job Openings 317 271 272 354 331 316 311 299 306 313
Job Seekers 200 205 217 233 248 249 240 237 240 245
Cumulative Imbalance 117 183 238 359 442 509 580 642 708 776
2283 Information systems testing technicians
Job Openings 26 25 25 28 28 28 28 28 29 29
Job Seekers 42 42 43 43 44 44 44 44 45 45
Cumulative Imbalance -16 -33 -51 -66 -82 -98 -114 -130 -146 -162
3011 Nursing co-ordinators and supervisors
Job Openings 129 128 158 204 205 195 197 189 194 192
Job Seekers 85 86 90 96 101 102 99 98 99 101
Cumulative Imbalance 44 86 154 262 366 459 557 648 743 834
3012 Registered nurses and registered psychiatric nurses
Job Openings 2,438 2,427 2,833 3,464 3,483 3,354 3,392 3,301 3,378 3,362
Job Seekers 2,657 2,682 2,755 2,843 2,917 2,938 2,914 2,912 2,945 2,984
Cumulative Imbalance -219 -474 -396 225 791 1,207 1,685 2,074 2,507 2,885
3111 Specialist physicians
Job Openings 356 354 410 497 497 477 479 463 470 464
Job Seekers 390 393 403 414 424 427 423 423 427 432
Cumulative Imbalance -34 -73 -66 17 90 140 196 236 279 311
3112 General practitioners and family physicians
Job Openings 434 434 498 598 600 579 584 568 579 575
Job Seekers 545 548 560 574 586 590 587 587 593 599
Cumulative Imbalance -111 -225 -287 -263 -249 -260 -263 -282 -296 -320
3113 Dentists
Job Openings 172 171 200 245 246 237 239 232 237 235
Job Seekers 191 192 197 203 208 210 208 207 209 212
Cumulative Imbalance -19 -40 -37 5 43 70 101 126 154 177
3114 Veterinarians
Job Openings 116 87 90 107 99 101 98 92 93 95
Job Seekers 95 96 99 104 108 108 106 105 107 108
Cumulative Imbalance 21 12 3 6 -3 -10 -18 -31 -45 -58
2019 2020 2021 2022 2023 2024 2025 2026 2027 2028
Alberta Occupational Outlook: 2019 - 2028
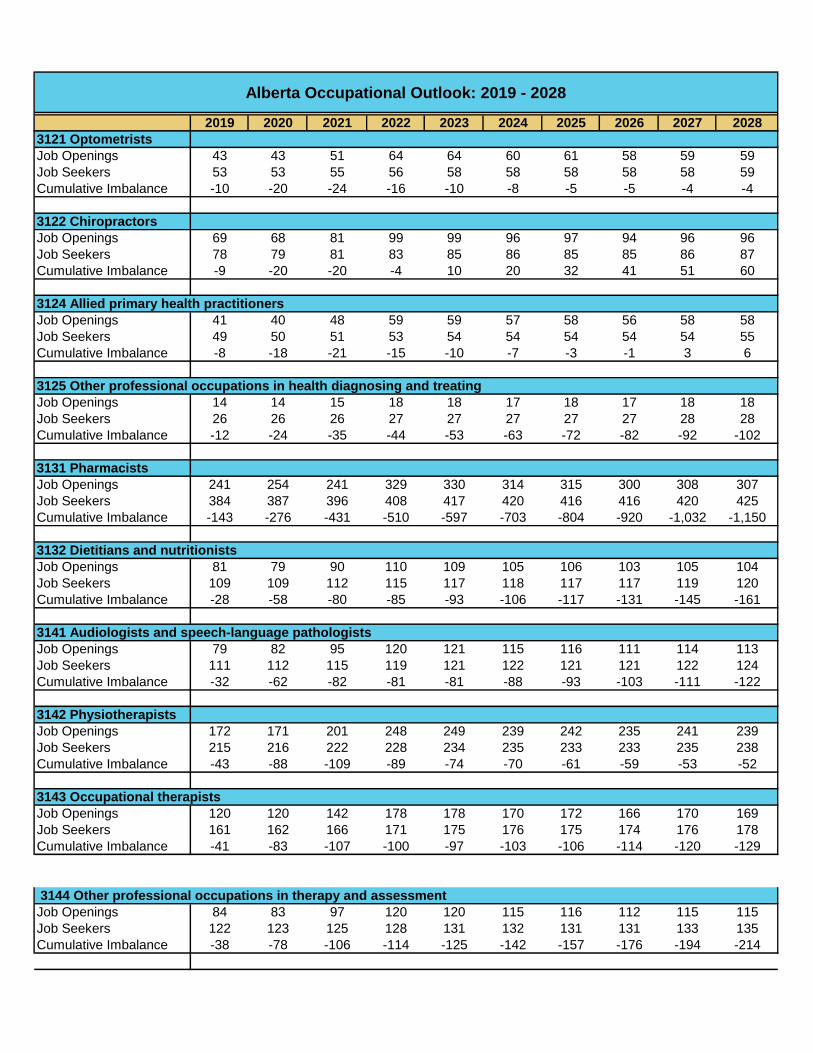
3121 Optometrists
Job Openings 43 43 51 64 64 60 61 58 59 59
Job Seekers 53 53 55 56 58 58 58 58 58 59
Cumulative Imbalance -10 -20 -24 -16 -10 -8 -5 -5 -4 -4
3122 Chiropractors
Job Openings 69 68 81 99 99 96 97 94 96 96
Job Seekers 78 79 81 83 85 86 85 85 86 87
Cumulative Imbalance -9 -20 -20 -4 10 20 32 41 51 60
3124 Allied primary health practitioners
Job Openings 41 40 48 59 59 57 58 56 58 58
Job Seekers 49 50 51 53 54 54 54 54 54 55
Cumulative Imbalance -8 -18 -21 -15 -10 -7 -3 -1 3 6
3125 Other professional occupations in health diagnosing and treating
Job Openings 14 14 15 18 18 17 18 17 18 18
Job Seekers 26 26 26 27 27 27 27 27 28 28
Cumulative Imbalance -12 -24 -35 -44 -53 -63 -72 -82 -92 -102
3131 Pharmacists
Job Openings 241 254 241 329 330 314 315 300 308 307
Job Seekers 384 387 396 408 417 420 416 416 420 425
Cumulative Imbalance -143 -276 -431 -510 -597 -703 -804 -920 -1,032 -1,150
3132 Dietitians and nutritionists
Job Openings 81 79 90 110 109 105 106 103 105 104
Job Seekers 109 109 112 115 117 118 117 117 119 120
Cumulative Imbalance -28 -58 -80 -85 -93 -106 -117 -131 -145 -161
3141 Audiologists and speech-language pathologists
Job Openings 79 82 95 120 121 115 116 111 114 113
Job Seekers 111 112 115 119 121 122 121 121 122 124
Cumulative Imbalance -32 -62 -82 -81 -81 -88 -93 -103 -111 -122
3142 Physiotherapists
Job Openings 172 171 201 248 249 239 242 235 241 239
Job Seekers 215 216 222 228 234 235 233 233 235 238
Cumulative Imbalance -43 -88 -109 -89 -74 -70 -61 -59 -53 -52
3143 Occupational therapists
Job Openings 120 120 142 178 178 170 172 166 170 169
Job Seekers 161 162 166 171 175 176 175 174 176 178
Cumulative Imbalance -41 -83 -107 -100 -97 -103 -106 -114 -120 -129
3144 Other professional occupations in therapy and assessment
Job Openings 84 83 97 120 120 115 116 112 115 115
Job Seekers 122 123 125 128 131 132 131 131 133 135
Cumulative Imbalance -38 -78 -106 -114 -125 -142 -157 -176 -194 -214
2019 2020 2021 2022 2023 2024 2025 2026 2027 2028
Alberta Occupational Outlook: 2019 - 2028
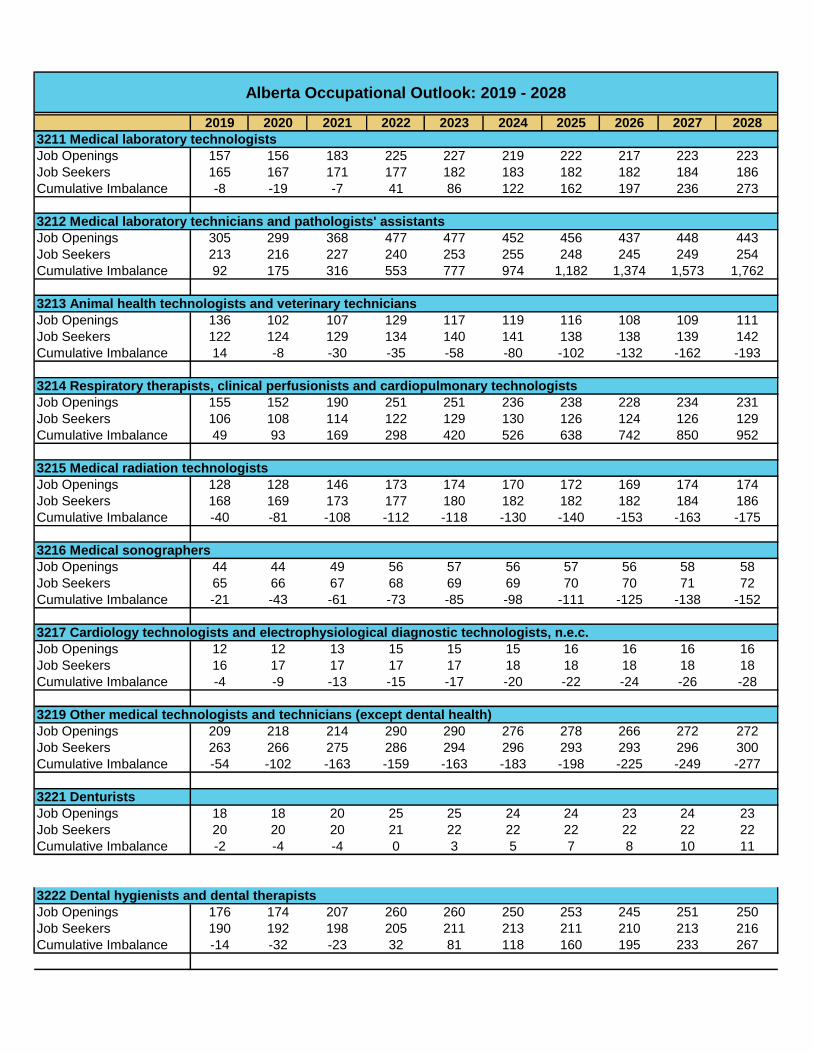
3211 Medical laboratory technologists
Job Openings 157 156 183 225 227 219 222 217 223 223
Job Seekers 165 167 171 177 182 183 182 182 184 186
Cumulative Imbalance -8 -19 -7 41 86 122 162 197 236 273
3212 Medical laboratory technicians and pathologists' assistants
Job Openings 305 299 368 477 477 452 456 437 448 443
Job Seekers 213 216 227 240 253 255 248 245 249 254
Cumulative Imbalance 92 175 316 553 777 974 1,182 1,374 1,573 1,762
3213 Animal health technologists and veterinary technicians
Job Openings 136 102 107 129 117 119 116 108 109 111
Job Seekers 122 124 129 134 140 141 138 138 139 142
Cumulative Imbalance 14 -8 -30 -35 -58 -80 -102 -132 -162 -193
3214 Respiratory therapists, clinical perfusionists and cardiopulmonary technologists
Job Openings 155 152 190 251 251 236 238 228 234 231
Job Seekers 106 108 114 122 129 130 126 124 126 129
Cumulative Imbalance 49 93 169 298 420 526 638 742 850 952
3215 Medical radiation technologists
Job Openings 128 128 146 173 174 170 172 169 174 174
Job Seekers 168 169 173 177 180 182 182 182 184 186
Cumulative Imbalance -40 -81 -108 -112 -118 -130 -140 -153 -163 -175
3216 Medical sonographers
Job Openings 44 44 49 56 57 56 57 56 58 58
Job Seekers 65 66 67 68 69 69 70 70 71 72
Cumulative Imbalance -21 -43 -61 -73 -85 -98 -111 -125 -138 -152
3217 Cardiology technologists and electrophysiological diagnostic technologists, n.e.c.
Job Openings 12 12 13 15 15 15 16 16 16 16
Job Seekers 16 17 17 17 17 18 18 18 18 18
Cumulative Imbalance -4 -9 -13 -15 -17 -20 -22 -24 -26 -28
3219 Other medical technologists and technicians (except dental health)
Job Openings 209 218 214 290 290 276 278 266 272 272
Job Seekers 263 266 275 286 294 296 293 293 296 300
Cumulative Imbalance -54 -102 -163 -159 -163 -183 -198 -225 -249 -277
3221 Denturists
Job Openings 18 18 20 25 25 24 24 23 24 23
Job Seekers 20 20 20 21 22 22 22 22 22 22
Cumulative Imbalance -2 -4 -4 0 3 5 7 8 10 11
3222 Dental hygienists and dental therapists
Job Openings 176 174 207 260 260 250 253 245 251 250
Job Seekers 190 192 198 205 211 213 211 210 213 216
Cumulative Imbalance -14 -32 -23 32 81 118 160 195 233 267

2019 2020 2021 2022 2023 2024 2025 2026 2027 2028
Alberta Occupational Outlook: 2019 - 2028
3231 Opticians
Job Openings 69 72 71 88 89 87 88 85 87 88
Job Seekers 81 81 84 86 88 89 88 88 89 90
Cumulative Imbalance -12 -21 -34 -32 -31 -33 -33 -36 -38 -40
3232 Practitioners of natural healing
Job Openings 61 60 66 75 75 74 75 74 75 75
Job Seekers 72 72 74 76 77 77 77 78 79 79
Cumulative Imbalance -11 -23 -31 -32 -34 -37 -39 -43 -47 -51
3233 Licensed practical nurses
Job Openings 664 654 795 1,013 1,014 963 972 934 957 947
Job Seekers 515 524 546 574 600 605 593 589 597 608
Cumulative Imbalance 149 279 528 967 1,381 1,739 2,118 2,463 2,823 3,162
3234 Paramedical occupations
Job Openings 289 279 335 431 432 407 410 393 403 400
Job Seekers 255 259 270 283 295 298 292 290 294 299
Cumulative Imbalance 34 54 119 267 404 513 631 734 843 944
3236 Massage therapists
Job Openings 358 341 405 507 504 484 488 470 482 479
Job Seekers 324 328 340 355 368 371 365 363 368 374
Cumulative Imbalance 34 47 112 264 400 513 636 743 857 962
3237 Other technical occupations in therapy and assessment
Job Openings 104 104 124 160 160 151 152 146 149 147
Job Seekers 90 91 95 99 104 104 103 102 103 105
Cumulative Imbalance 14 27 56 117 173 220 269 313 359 401
3411 Dental assistants
Job Openings 311 309 369 463 465 446 452 438 450 449
Job Seekers 335 339 350 363 374 377 373 372 376 381
Cumulative Imbalance -24 -54 -35 65 156 225 304 370 444 512
3413 Nurse aides, orderlies and patient service associates
Job Openings 2,019 1,987 2,380 2,994 3,001 2,870 2,900 2,800 2,869 2,848
Job Seekers 1,532 1,557 1,623 1,704 1,776 1,789 1,754 1,740 1,762 1,790
Cumulative Imbalance 487 917 1,674 2,964 4,189 5,270 6,416 7,476 8,583 9,641
3414 Other assisting occupations in support of health services
Job Openings 331 330 377 465 467 449 454 441 451 449
Job Seekers 319 323 334 347 357 359 356 355 359 363
Cumulative Imbalance 12 19 62 180 290 380 478 564 656 742
4011 University professors and lecturers
Job Openings 372 420 442 533 538 516 510 483 483 471
Job Seekers 533 536 547 561 571 575 573 575 582 589
Cumulative Imbalance -161 -277 -382 -410 -443 -502 -565 -657 -756 -874
2019 2020 2021 2022 2023 2024 2025 2026 2027 2028
Alberta Occupational Outlook: 2019 - 2028
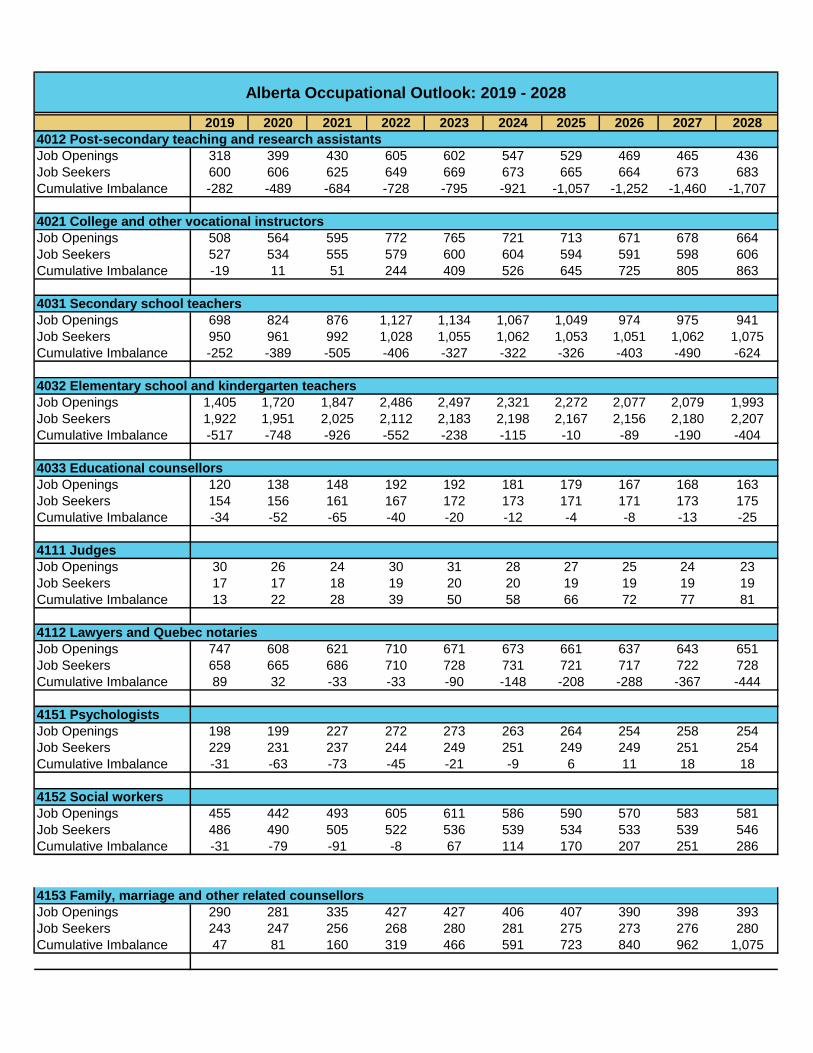
4012 Post-secondary teaching and research assistants
Job Openings 318 399 430 605 602 547 529 469 465 436
Job Seekers 600 606 625 649 669 673 665 664 673 683
Cumulative Imbalance -282 -489 -684 -728 -795 -921 -1,057 -1,252 -1,460 -1,707
4021 College and other vocational instructors
Job Openings 508 564 595 772 765 721 713 671 678 664
Job Seekers 527 534 555 579 600 604 594 591 598 606
Cumulative Imbalance -19 11 51 244 409 526 645 725 805 863
4031 Secondary school teachers
Job Openings 698 824 876 1,127 1,134 1,067 1,049 974 975 941
Job Seekers 950 961 992 1,028 1,055 1,062 1,053 1,051 1,062 1,075
Cumulative Imbalance -252 -389 -505 -406 -327 -322 -326 -403 -490 -624
4032 Elementary school and kindergarten teachers
Job Openings 1,405 1,720 1,847 2,486 2,497 2,321 2,272 2,077 2,079 1,993
Job Seekers 1,922 1,951 2,025 2,112 2,183 2,198 2,167 2,156 2,180 2,207
Cumulative Imbalance -517 -748 -926 -552 -238 -115 -10 -89 -190 -404
4033 Educational counsellors
Job Openings 120 138 148 192 192 181 179 167 168 163
Job Seekers 154 156 161 167 172 173 171 171 173 175
Cumulative Imbalance -34 -52 -65 -40 -20 -12 -4 -8 -13 -25
4111 Judges
Job Openings 30 26 24 30 31 28 27 25 24 23
Job Seekers 17 17 18 19 20 20 19 19 19 19
Cumulative Imbalance 13 22 28 39 50 58 66 72 77 81
4112 Lawyers and Quebec notaries
Job Openings 747 608 621 710 671 673 661 637 643 651
Job Seekers 658 665 686 710 728 731 721 717 722 728
Cumulative Imbalance 89 32 -33 -33 -90 -148 -208 -288 -367 -444
4151 Psychologists
Job Openings 198 199 227 272 273 263 264 254 258 254
Job Seekers 229 231 237 244 249 251 249 249 251 254
Cumulative Imbalance -31 -63 -73 -45 -21 -9 6 11 18 18
4152 Social workers
Job Openings 455 442 493 605 611 586 590 570 583 581
Job Seekers 486 490 505 522 536 539 534 533 539 546
Cumulative Imbalance -31 -79 -91 -8 67 114 170 207 251 286
4153 Family, marriage and other related counsellors
Job Openings 290 281 335 427 427 406 407 390 398 393
Job Seekers 243 247 256 268 280 281 275 273 276 280
Cumulative Imbalance 47 81 160 319 466 591 723 840 962 1,075

2019 2020 2021 2022 2023 2024 2025 2026 2027 2028
Alberta Occupational Outlook: 2019 - 2028
4154 Professional occupations in religion
Job Openings 360 297 309 346 327 333 329 316 318 321
Job Seekers 286 289 298 308 316 318 315 314 318 321
Cumulative Imbalance 74 82 93 131 142 157 171 173 173 173
4155 Probation and parole officers and related occupations
Job Openings 29 27 26 30 31 30 30 29 30 30
Job Seekers 51 51 52 53 54 54 54 54 55 55
Cumulative Imbalance -22 -46 -72 -95 -118 -142 -166 -191 -216 -241
4156 Employment counsellors
Job Openings 123 108 113 143 141 136 135 128 130 130
Job Seekers 100 102 106 111 116 116 114 113 114 116
Cumulative Imbalance 23 29 36 68 93 113 134 149 165 179
4161 Natural and applied science policy researchers, consultants and program officers
Job Openings 271 224 222 270 257 245 243 241 248 255
Job Seekers 274 277 286 296 303 305 302 301 304 307
Cumulative Imbalance -3 -56 -120 -146 -192 -252 -311 -371 -427 -479
4162 Economists and economic policy researchers and analysts
Job Openings 104 97 89 118 112 102 102 101 104 107
Job Seekers 120 122 126 131 135 135 133 133 134 136
Cumulative Imbalance -16 -41 -78 -91 -114 -147 -178 -210 -240 -269
4163 Business development officers and marketing researchers and consultants
Job Openings 366 352 355 394 386 382 382 383 390 400
Job Seekers 478 482 493 507 516 519 517 518 523 528
Cumulative Imbalance -112 -242 -380 -493 -623 -760 -895 -1,030 -1,163 -1,291
4164 Social policy researchers, consultants and program officers
Job Openings 198 173 172 215 214 205 203 194 198 200
Job Seekers 210 212 219 228 235 236 233 232 234 237
Cumulative Imbalance -12 -51 -98 -111 -132 -163 -193 -231 -267 -304
4165 Health policy researchers, consultants and program officers
Job Openings 221 212 234 288 288 278 280 271 277 277
Job Seekers 258 261 268 276 283 285 283 282 285 289
Cumulative Imbalance -37 -86 -120 -108 -103 -110 -113 -124 -132 -144
4166 Education policy researchers, consultants and program officers
Job Openings 158 172 183 239 240 225 221 204 205 199
Job Seekers 192 194 201 210 217 218 214 213 216 218
Cumulative Imbalance -34 -56 -74 -45 -22 -15 -8 -17 -28 -47
4167 Recreation, sports and fitness policy researchers, consultants and program officers
Job Openings 104 82 84 112 108 103 101 94 96 96
Job Seekers 84 85 89 94 99 99 97 96 97 99
Cumulative Imbalance 20 17 12 30 39 43 47 45 44 41
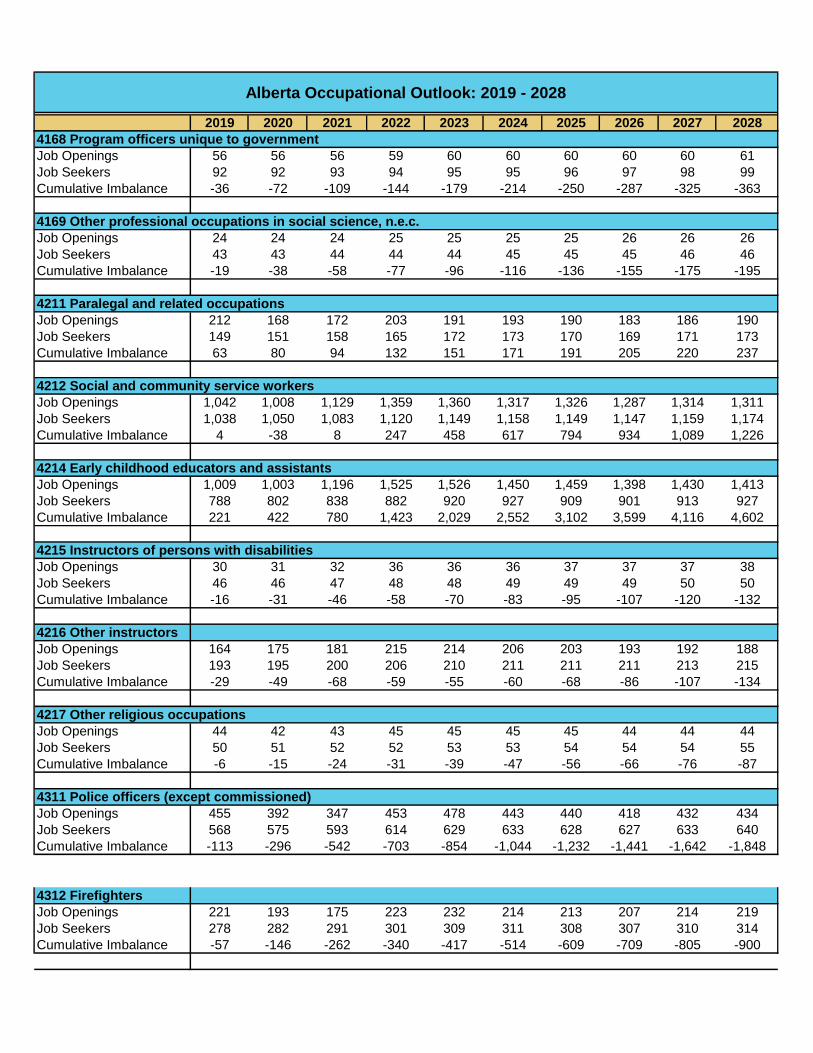
2019 2020 2021 2022 2023 2024 2025 2026 2027 2028
Alberta Occupational Outlook: 2019 - 2028
4168 Program officers unique to government
Job Openings 56 56 56 59 60 60 60 60 60 61
Job Seekers 92 92 93 94 95 95 96 97 98 99
Cumulative Imbalance -36 -72 -109 -144 -179 -214 -250 -287 -325 -363
4169 Other professional occupations in social science, n.e.c.
Job Openings 24 24 24 25 25 25 25 26 26 26
Job Seekers 43 43 44 44 44 45 45 45 46 46
Cumulative Imbalance -19 -38 -58 -77 -96 -116 -136 -155 -175 -195
4211 Paralegal and related occupations
Job Openings 212 168 172 203 191 193 190 183 186 190
Job Seekers 149 151 158 165 172 173 170 169 171 173
Cumulative Imbalance 63 80 94 132 151 171 191 205 220 237
4212 Social and community service workers
Job Openings 1,042 1,008 1,129 1,359 1,360 1,317 1,326 1,287 1,314 1,311
Job Seekers 1,038 1,050 1,083 1,120 1,149 1,158 1,149 1,147 1,159 1,174
Cumulative Imbalance 4 -38 8 247 458 617 794 934 1,089 1,226
4214 Early childhood educators and assistants
Job Openings 1,009 1,003 1,196 1,525 1,526 1,450 1,459 1,398 1,430 1,413
Job Seekers 788 802 838 882 920 927 909 901 913 927
Cumulative Imbalance 221 422 780 1,423 2,029 2,552 3,102 3,599 4,116 4,602
4215 Instructors of persons with disabilities
Job Openings 30 31 32 36 36 36 37 37 37 38
Job Seekers 46 46 47 48 48 49 49 49 50 50
Cumulative Imbalance -16 -31 -46 -58 -70 -83 -95 -107 -120 -132
4216 Other instructors
Job Openings 164 175 181 215 214 206 203 193 192 188
Job Seekers 193 195 200 206 210 211 211 211 213 215
Cumulative Imbalance -29 -49 -68 -59 -55 -60 -68 -86 -107 -134
4217 Other religious occupations
Job Openings 44 42 43 45 45 45 45 44 44 44
Job Seekers 50 51 52 52 53 53 54 54 54 55
Cumulative Imbalance -6 -15 -24 -31 -39 -47 -56 -66 -76 -87
4311 Police officers (except commissioned)
Job Openings 455 392 347 453 478 443 440 418 432 434
Job Seekers 568 575 593 614 629 633 628 627 633 640
Cumulative Imbalance -113 -296 -542 -703 -854 -1,044 -1,232 -1,441 -1,642 -1,848
4312 Firefighters
Job Openings 221 193 175 223 232 214 213 207 214 219
Job Seekers 278 282 291 301 309 311 308 307 310 314
Cumulative Imbalance -57 -146 -262 -340 -417 -514 -609 -709 -805 -900
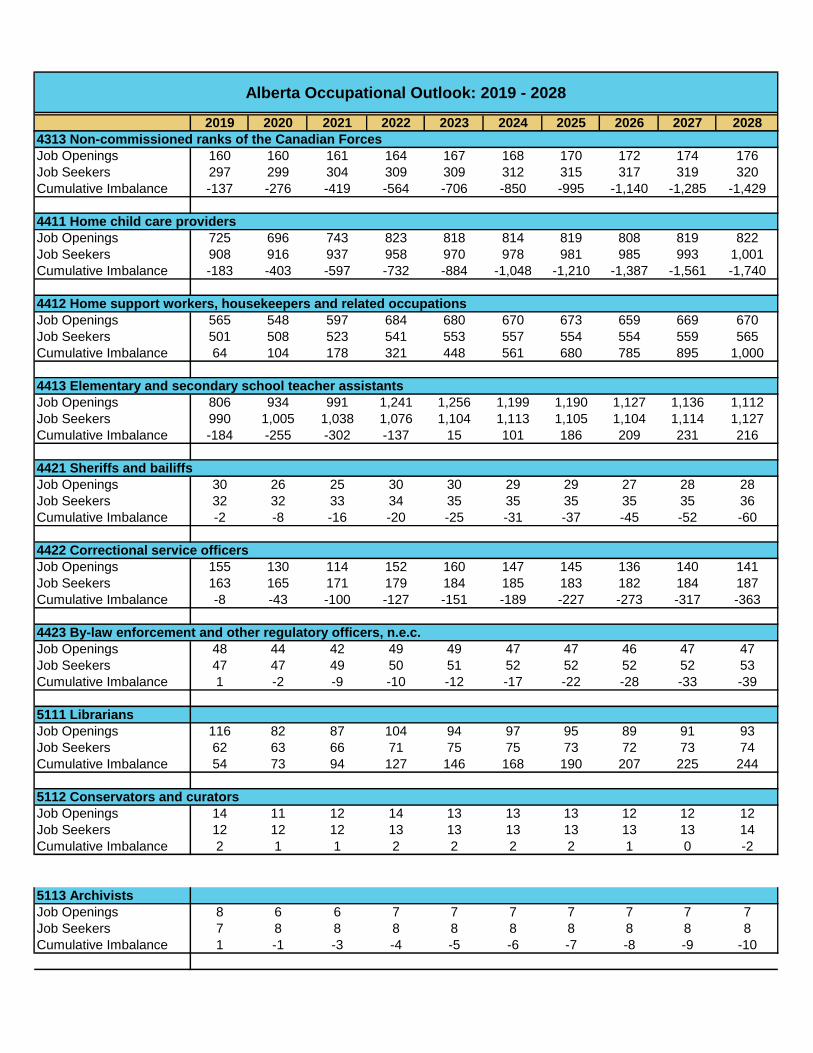
2019 2020 2021 2022 2023 2024 2025 2026 2027 2028
Alberta Occupational Outlook: 2019 - 2028
4313 Non-commissioned ranks of the Canadian Forces
Job Openings 160 160 161 164 167 168 170 172 174 176
Job Seekers 297 299 304 309 309 312 315 317 319 320
Cumulative Imbalance -137 -276 -419 -564 -706 -850 -995 -1,140 -1,285 -1,429
4411 Home child care providers
Job Openings 725 696 743 823 818 814 819 808 819 822
Job Seekers 908 916 937 958 970 978 981 985 993 1,001
Cumulative Imbalance -183 -403 -597 -732 -884 -1,048 -1,210 -1,387 -1,561 -1,740
4412 Home support workers, housekeepers and related occupations
Job Openings 565 548 597 684 680 670 673 659 669 670
Job Seekers 501 508 523 541 553 557 554 554 559 565
Cumulative Imbalance 64 104 178 321 448 561 680 785 895 1,000
4413 Elementary and secondary school teacher assistants
Job Openings 806 934 991 1,241 1,256 1,199 1,190 1,127 1,136 1,112
Job Seekers 990 1,005 1,038 1,076 1,104 1,113 1,105 1,104 1,114 1,127
Cumulative Imbalance -184 -255 -302 -137 15 101 186 209 231 216
4421 Sheriffs and bailiffs
Job Openings 30 26 25 30 30 29 29 27 28 28
Job Seekers 32 32 33 34 35 35 35 35 35 36
Cumulative Imbalance -2 -8 -16 -20 -25 -31 -37 -45 -52 -60
4422 Correctional service officers
Job Openings 155 130 114 152 160 147 145 136 140 141
Job Seekers 163 165 171 179 184 185 183 182 184 187
Cumulative Imbalance -8 -43 -100 -127 -151 -189 -227 -273 -317 -363
4423 By-law enforcement and other regulatory officers, n.e.c.
Job Openings 48 44 42 49 49 47 47 46 47 47
Job Seekers 47 47 49 50 51 52 52 52 52 53
Cumulative Imbalance 1 -2 -9 -10 -12 -17 -22 -28 -33 -39
5111 Librarians
Job Openings 116 82 87 104 94 97 95 89 91 93
Job Seekers 62 63 66 71 75 75 73 72 73 74
Cumulative Imbalance 54 73 94 127 146 168 190 207 225 244
5112 Conservators and curators
Job Openings 14 11 12 14 13 13 13 12 12 12
Job Seekers 12 12 12 13 13 13 13 13 13 14
Cumulative Imbalance 2 1 1 2 2 2 2 1 0 -2
5113 Archivists
Job Openings 8 6 6 7 7 7 7 7 7 7
Job Seekers 7 8 8 8 8 8 8 8 8 8
Cumulative Imbalance 1 -1 -3 -4 -5 -6 -7 -8 -9 -10

2019 2020 2021 2022 2023 2024 2025 2026 2027 2028
Alberta Occupational Outlook: 2019 - 2028
5121 Authors and writers
Job Openings 164 135 139 159 150 151 149 143 144 145
Job Seekers 136 138 142 147 152 153 151 150 152 154
Cumulative Imbalance 28 25 22 34 32 30 28 21 13 4
5122 Editors
Job Openings 51 49 50 53 53 53 53 52 53 53
Job Seekers 70 70 71 72 73 73 74 74 75 76
Cumulative Imbalance -19 -40 -61 -80 -100 -120 -141 -163 -185 -208
5123 Journalists
Job Openings 36 33 34 36 36 37 37 36 37 37
Job Seekers 52 53 53 54 55 55 55 56 56 57
Cumulative Imbalance -16 -36 -55 -73 -92 -110 -128 -148 -167 -187
5125 Translators, terminologists and interpreters
Job Openings 85 62 66 85 78 77 74 68 69 69
Job Seekers 37 39 42 45 49 49 47 46 47 48
Cumulative Imbalance 48 71 95 135 164 192 219 241 263 284
5131 Producers, directors, choreographers and related occupations
Job Openings 131 99 104 123 113 115 112 105 106 107
Job Seekers 86 88 92 97 101 102 99 98 100 101
Cumulative Imbalance 45 56 68 94 106 119 132 139 145 151
5132 Conductors, composers and arrangers
Job Openings 11 11 11 11 11 11 11 10 10 10
Job Seekers 14 14 14 15 15 15 15 15 15 15
Cumulative Imbalance -3 -6 -9 -13 -17 -21 -25 -30 -35 -40
5133 Musicians and singers
Job Openings 197 202 210 247 244 236 232 219 219 214
Job Seekers 217 219 225 232 237 238 237 237 240 242
Cumulative Imbalance -20 -37 -52 -37 -30 -32 -37 -55 -76 -104
5134 Dancers
Job Openings 32 33 33 36 36 36 36 35 35 35
Job Seekers 69 70 71 72 72 73 73 74 74 75
Cumulative Imbalance -37 -74 -112 -148 -184 -221 -258 -297 -336 -376
5135 Actors and comedians
Job Openings 58 42 45 58 52 52 50 45 45 45
Job Seekers 28 29 31 34 36 36 35 34 35 35
Cumulative Imbalance 30 43 57 81 97 113 128 139 149 159
5136 Painters, sculptors and other visual artists
Job Openings 139 124 131 136 133 135 132 126 125 124
Job Seekers 110 111 115 120 123 124 122 122 123 125
Cumulative Imbalance 29 42 58 74 84 95 105 109 111 110

2019 2020 2021 2022 2023 2024 2025 2026 2027 2028
Alberta Occupational Outlook: 2019 - 2028
5211 Library and public archive technicians
Job Openings 63 66 68 72 74 76 77 79 81 82
Job Seekers 78 79 80 81 81 82 83 83 84 85
Cumulative Imbalance -15 -28 -40 -49 -56 -62 -68 -72 -75 -78
5212 Technical occupations related to museums and art galleries
Job Openings 75 54 54 69 64 63 61 55 56 56
Job Seekers 39 40 43 46 49 49 47 47 47 48
Cumulative Imbalance 36 50 61 84 99 113 127 135 144 152
5221 Photographers
Job Openings 164 122 127 149 136 139 135 127 128 129
Job Seekers 118 119 125 131 136 137 134 133 135 137
Cumulative Imbalance 46 49 51 69 69 71 72 66 59 51
5222 Film and video camera operators
Job Openings 18 16 16 17 17 17 17 17 17 17
Job Seekers 20 20 21 21 21 22 22 22 22 22
Cumulative Imbalance -2 -6 -11 -15 -19 -24 -29 -34 -39 -44
5223 Graphic arts technicians
Job Openings 14 13 14 15 14 14 14 14 14 14
Job Seekers 18 18 19 19 19 20 20 20 20 20
Cumulative Imbalance -4 -9 -14 -18 -23 -29 -35 -41 -47 -53
5224 Broadcast technicians
Job Openings 11 10 10 11 10 11 11 11 11 11
Job Seekers 12 12 12 13 13 13 13 13 13 13
Cumulative Imbalance -1 -3 -5 -7 -10 -12 -14 -16 -18 -20
5225 Audio and video recording technicians
Job Openings 32 30 31 33 32 33 33 33 34 34
Job Seekers 41 42 43 43 44 44 44 45 45 45
Cumulative Imbalance -9 -21 -33 -43 -55 -66 -77 -89 -100 -111
5226 Other technical and co-ordinating occupations in motion pictures, broadcasting and the performing arts
Job Openings 65 53 55 68 64 64 63 60 61 62
Job Seekers 46 46 49 52 54 55 53 53 53 54
Cumulative Imbalance 19 26 32 48 58 67 77 84 92 100
5227 Support occupations in motion pictures, broadcasting, photography and the performing arts
Job Openings 23 22 22 24 24 24 25 25 25 26
Job Seekers 28 28 29 29 30 30 30 30 30 31
Cumulative Imbalance -5 -11 -18 -23 -29 -35 -40 -45 -50 -55
5231 Announcers and other broadcasters
Job Openings 42 31 33 39 36 37 36 35 35 36
Job Seekers 27 27 29 30 32 32 31 31 31 32
Cumulative Imbalance 15 19 23 32 36 41 46 50 54 58

2019 2020 2021 2022 2023 2024 2025 2026 2027 2028
Alberta Occupational Outlook: 2019 - 2028
5232 Other performers, n.e.c.
Job Openings 40 30 32 38 35 36 35 33 34 35
Job Seekers 29 30 31 33 34 34 34 33 34 34
Cumulative Imbalance 11 11 12 17 18 20 21 21 21 22
5241 Graphic designers and illustrators
Job Openings 301 245 248 297 276 275 272 257 259 262
Job Seekers 242 246 256 268 278 280 275 273 277 281
Cumulative Imbalance 59 58 50 79 77 72 69 53 35 16
5242 Interior designers and interior decorators
Job Openings 131 123 132 129 131 137 137 136 137 140
Job Seekers 148 149 153 157 160 161 161 161 163 165
Cumulative Imbalance -17 -43 -64 -92 -121 -145 -169 -194 -220 -245
5243 Theatre, fashion, exhibit and other creative designers
Job Openings 38 38 38 41 41 41 41 41 42 42
Job Seekers 60 60 61 62 62 63 63 64 64 65
Cumulative Imbalance -22 -44 -67 -88 -109 -131 -153 -176 -198 -221
5244 Artisans and craftspersons
Job Openings 71 71 71 73 73 72 72 71 71 70
Job Seekers 74 75 76 77 78 78 79 79 80 81
Cumulative Imbalance -3 -7 -12 -16 -21 -27 -34 -42 -51 -62
5245 Patternmakers - textile, leather and fur products
Job Openings 1 1 1 1 1 1 1 1 1 1
Job Seekers 1 1 1 1 1 1 1 1 1 1
Cumulative Imbalance 0 0 0 0 0 0 0 0 0 0
5251 Athletes
Job Openings 14 12 12 13 12 12 12 12 12 12
Job Seekers 20 20 21 21 22 22 22 22 22 22
Cumulative Imbalance -6 -14 -23 -31 -41 -51 -61 -71 -81 -91
5252 Coaches
Job Openings 90 82 88 115 110 106 103 94 94 93
Job Seekers 77 78 82 87 91 91 89 88 90 91
Cumulative Imbalance 13 17 23 51 70 85 99 105 109 111
5253 Sports officials and referees
Job Openings 25 22 22 24 23 23 22 22 22 22
Job Seekers 27 27 28 29 29 30 30 30 30 30
Cumulative Imbalance -2 -7 -13 -18 -24 -31 -39 -47 -55 -63
5254 Program leaders and instructors in recreation, sport and fitness
Job Openings 696 583 600 733 699 684 669 624 630 628
Job Seekers 664 674 700 731 755 760 751 748 756 766
Cumulative Imbalance 32 -59 -159 -157 -213 -289 -371 -495 -621 -759

2019 2020 2021 2022 2023 2024 2025 2026 2027 2028
Alberta Occupational Outlook: 2019 - 2028
6211 Retail sales supervisors
Job Openings 640 708 543 953 936 861 850 766 789 786
Job Seekers 631 650 694 746 795 798 768 753 763 776
Cumulative Imbalance 9 67 -84 123 264 327 409 422 448 458
6221 Technical sales specialists - wholesale trade
Job Openings 739 709 683 838 812 769 765 757 773 797
Job Seekers 814 829 863 903 937 942 926 920 929 941
Cumulative Imbalance -75 -195 -375 -440 -565 -738 -899 -1,062 -1,218 -1,362
6222 Retail and wholesale buyers
Job Openings 176 182 175 203 203 199 201 198 201 204
Job Seekers 267 270 277 284 288 290 291 291 294 296
Cumulative Imbalance -91 -179 -281 -362 -447 -538 -628 -721 -814 -906
6231 Insurance agents and brokers
Job Openings 278 426 386 493 484 467 468 455 467 470
Job Seekers 534 542 558 575 588 593 589 589 595 601
Cumulative Imbalance -256 -372 -544 -626 -730 -856 -977 -1,111 -1,239 -1,370
6232 Real estate agents and salespersons
Job Openings 401 669 595 782 763 727 722 691 704 702
Job Seekers 701 712 736 764 786 791 783 780 788 797
Cumulative Imbalance -300 -343 -484 -466 -489 -553 -614 -703 -787 -882
6235 Financial sales representatives
Job Openings 238 346 318 404 398 386 389 381 393 398
Job Seekers 532 538 552 567 577 581 580 581 586 591
Cumulative Imbalance -294 -486 -720 -883 -1,062 -1,257 -1,448 -1,648 -1,841 -2,034
6311 Food service supervisors
Job Openings 533 390 408 488 443 452 442 415 421 428
Job Seekers 423 433 453 476 495 498 490 486 492 498
Cumulative Imbalance 110 67 22 34 -18 -64 -112 -183 -254 -324
6312 Executive housekeepers
Job Openings 40 35 37 41 40 41 41 41 42 42
Job Seekers 37 38 39 40 41 41 41 41 42 42
Cumulative Imbalance 3 0 -2 -1 -2 -2 -2 -2 -2 -2
6313 Accommodation, travel, tourism and related services supervisors
Job Openings 93 66 67 90 76 77 75 69 70 71
Job Seekers 37 39 42 47 51 51 48 47 48 49
Cumulative Imbalance 56 83 108 151 176 202 229 251 273 295
6314 Customer and information services supervisors
Job Openings 36 38 36 44 43 42 43 42 43 44
Job Seekers 52 52 54 56 57 57 57 57 58 58
Cumulative Imbalance -16 -30 -48 -60 -74 -89 -103 -118 -133 -147
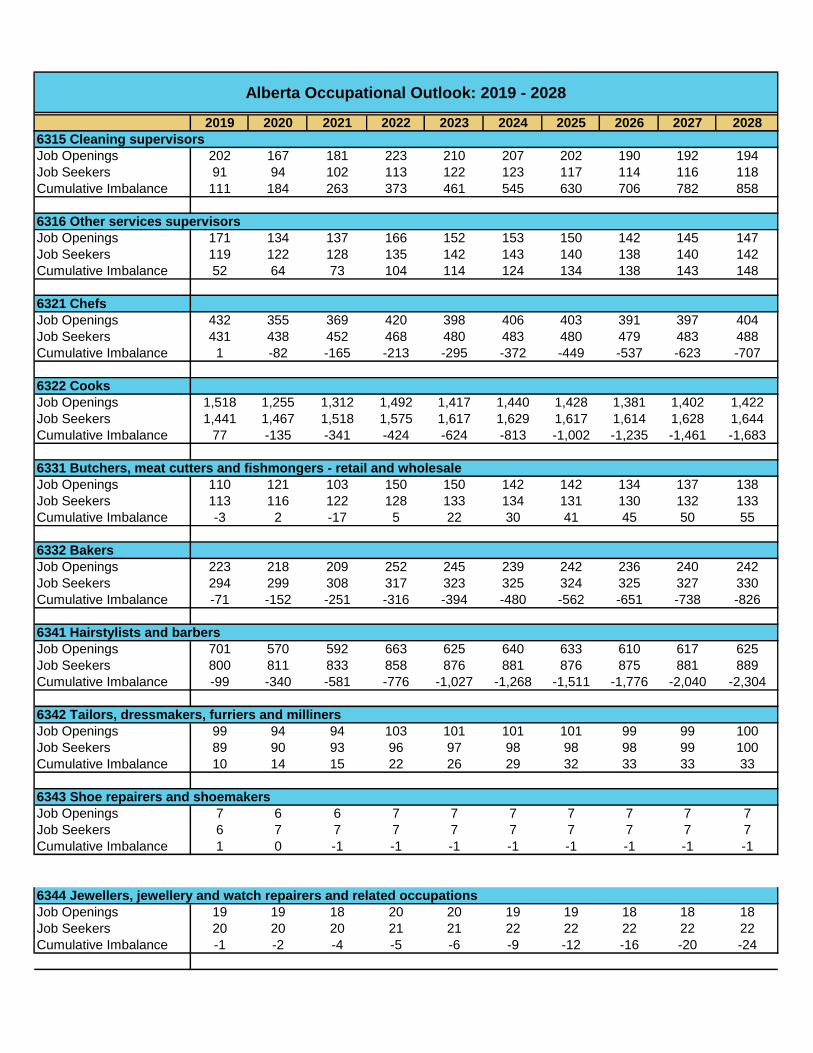
2019 2020 2021 2022 2023 2024 2025 2026 2027 2028
Alberta Occupational Outlook: 2019 - 2028
6315 Cleaning supervisors
Job Openings 202 167 181 223 210 207 202 190 192 194
Job Seekers 91 94 102 113 122 123 117 114 116 118
Cumulative Imbalance 111 184 263 373 461 545 630 706 782 858
6316 Other services supervisors
Job Openings 171 134 137 166 152 153 150 142 145 147
Job Seekers 119 122 128 135 142 143 140 138 140 142
Cumulative Imbalance 52 64 73 104 114 124 134 138 143 148
6321 Chefs
Job Openings 432 355 369 420 398 406 403 391 397 404
Job Seekers 431 438 452 468 480 483 480 479 483 488
Cumulative Imbalance 1 -82 -165 -213 -295 -372 -449 -537 -623 -707
6322 Cooks
Job Openings 1,518 1,255 1,312 1,492 1,417 1,440 1,428 1,381 1,402 1,422
Job Seekers 1,441 1,467 1,518 1,575 1,617 1,629 1,617 1,614 1,628 1,644
Cumulative Imbalance 77 -135 -341 -424 -624 -813 -1,002 -1,235 -1,461 -1,683
6331 Butchers, meat cutters and fishmongers - retail and wholesale
Job Openings 110 121 103 150 150 142 142 134 137 138
Job Seekers 113 116 122 128 133 134 131 130 132 133
Cumulative Imbalance -3 2 -17 5 22 30 41 45 50 55
6332 Bakers
Job Openings 223 218 209 252 245 239 242 236 240 242
Job Seekers 294 299 308 317 323 325 324 325 327 330
Cumulative Imbalance -71 -152 -251 -316 -394 -480 -562 -651 -738 -826
6341 Hairstylists and barbers
Job Openings 701 570 592 663 625 640 633 610 617 625
Job Seekers 800 811 833 858 876 881 876 875 881 889
Cumulative Imbalance -99 -340 -581 -776 -1,027 -1,268 -1,511 -1,776 -2,040 -2,304
6342 Tailors, dressmakers, furriers and milliners
Job Openings 99 94 94 103 101 101 101 99 99 100
Job Seekers 89 90 93 96 97 98 98 98 99 100
Cumulative Imbalance 10 14 15 22 26 29 32 33 33 33
6343 Shoe repairers and shoemakers
Job Openings 7 6 6 7 7 7 7 7 7 7
Job Seekers 6 7 7 7 7 7 7 7 7 7
Cumulative Imbalance 1 0 -1 -1 -1 -1 -1 -1 -1 -1
6344 Jewellers, jewellery and watch repairers and related occupations
Job Openings 19 19 18 20 20 19 19 18 18 18
Job Seekers 20 20 20 21 21 22 22 22 22 22
Cumulative Imbalance -1 -2 -4 -5 -6 -9 -12 -16 -20 -24

2019 2020 2021 2022 2023 2024 2025 2026 2027 2028
Alberta Occupational Outlook: 2019 - 2028
6345 Upholsterers
Job Openings 28 26 26 28 27 27 27 26 26 26
Job Seekers 20 20 21 22 22 22 22 22 22 22
Cumulative Imbalance 8 14 19 25 30 35 40 44 48 52
6346 Funeral directors and embalmers
Job Openings 70 48 50 60 54 55 53 49 49 50
Job Seekers 31 32 34 37 40 40 38 37 38 39
Cumulative Imbalance 39 55 71 94 108 123 138 150 161 172
6411 Sales and account representatives - wholesale trade (non-technical)
Job Openings 877 878 792 1,077 1,029 977 972 917 932 938
Job Seekers 756 776 818 868 911 917 894 884 895 908
Cumulative Imbalance 121 223 197 406 524 584 662 695 732 762
6421 Retail salespersons
Job Openings 3,738 3,934 3,625 4,496 4,483 4,341 4,324 4,149 4,192 4,181
Job Seekers 5,094 5,176 5,334 5,504 5,623 5,668 5,649 5,654 5,701 5,755
Cumulative Imbalance -1,356 -2,598 -4,307 -5,315 -6,455 -7,782 -9,107 -10,612 -12,121 -13,695
6511 Maîtres d'hôtel and hosts/hostesses
Job Openings 332 229 240 285 253 260 251 231 233 236
Job Seekers 204 210 223 238 250 252 245 242 245 249
Cumulative Imbalance 128 147 164 211 214 222 228 217 205 192
6512 Bartenders
Job Openings 321 243 252 291 266 272 266 252 254 258
Job Seekers 328 334 346 360 370 373 370 369 372 376
Cumulative Imbalance -7 -98 -192 -261 -365 -466 -570 -687 -805 -923
6513 Food and beverage servers
Job Openings 1,510 1,179 1,220 1,378 1,279 1,308 1,284 1,226 1,238 1,256
Job Seekers 1,665 1,694 1,751 1,813 1,858 1,873 1,863 1,862 1,879 1,898
Cumulative Imbalance -155 -670 -1,201 -1,636 -2,215 -2,780 -3,359 -3,995 -4,636 -5,278
6521 Travel counsellors
Job Openings 151 128 131 149 140 143 142 138 140 142
Job Seekers 144 146 151 156 160 161 160 160 162 163
Cumulative Imbalance 7 -11 -31 -38 -58 -76 -94 -116 -138 -159
6522 Pursers and flight attendants
Job Openings 108 138 84 214 135 115 121 109 116 114
Job Seekers 149 152 159 167 174 175 172 171 172 175
Cumulative Imbalance -41 -55 -130 -83 -122 -182 -233 -295 -351 -412
6523 Airline ticket and service agents
Job Openings 104 123 91 172 124 113 117 110 115 114
Job Seekers 143 145 151 156 161 162 161 160 162 164
Cumulative Imbalance -39 -61 -121 -105 -142 -191 -235 -285 -332 -382

2019 2020 2021 2022 2023 2024 2025 2026 2027 2028
Alberta Occupational Outlook: 2019 - 2028
6524 Ground and water transport ticket agents, cargo service representatives and related clerks
Job Openings 8 8 8 9 8 8 8 8 8 8
Job Seekers 11 12 12 12 12 12 12 12 12 13
Cumulative Imbalance -3 -7 -11 -14 -18 -22 -26 -30 -34 -39
6525 Hotel front desk clerks
Job Openings 193 150 156 178 165 170 167 160 162 165
Job Seekers 193 196 203 210 216 218 216 216 218 220
Cumulative Imbalance 0 -46 -93 -125 -176 -224 -273 -329 -385 -440
6531 Tour and travel guides
Job Openings 8 8 8 9 9 9 9 9 10 10
Job Seekers 16 16 17 17 17 17 17 17 17 18
Cumulative Imbalance -8 -16 -25 -33 -41 -49 -57 -65 -72 -80
6532 Outdoor sport and recreational guides
Job Openings 15 15 15 16 16 16 16 16 16 17
Job Seekers 28 29 29 30 30 30 30 30 31 31
Cumulative Imbalance -13 -27 -41 -55 -69 -83 -97 -111 -126 -140
6533 Casino occupations
Job Openings 144 121 125 138 132 135 135 132 134 136
Job Seekers 143 145 149 154 157 159 158 158 159 161
Cumulative Imbalance 1 -23 -47 -63 -88 -112 -135 -161 -186 -211
6541 Security guards and related security service occupations
Job Openings 785 676 689 777 738 743 734 708 713 717
Job Seekers 762 774 798 825 844 850 846 846 854 863
Cumulative Imbalance 23 -75 -184 -232 -338 -445 -557 -695 -836 -982
6551 Customer services representatives - financial institutions
Job Openings 247 393 351 462 453 435 436 421 434 437
Job Seekers 468 475 492 510 524 528 524 523 528 534
Cumulative Imbalance -221 -303 -444 -492 -563 -656 -744 -846 -940 -1,037
6552 Other customer and information services representatives
Job Openings 907 888 855 1,023 996 977 979 953 970 980
Job Seekers 1,192 1,210 1,247 1,286 1,314 1,324 1,320 1,321 1,332 1,345
Cumulative Imbalance -285 -607 -999 -1,262 -1,580 -1,927 -2,268 -2,636 -2,998 -3,363
6561 Image, social and other personal consultants
Job Openings 25 21 21 25 23 23 23 22 22 22
Job Seekers 26 26 27 28 29 29 29 29 29 29
Cumulative Imbalance -1 -6 -12 -15 -21 -27 -33 -40 -47 -54
6562 Estheticians, electrologists and related occupations
Job Openings 386 320 325 375 355 360 356 343 348 353
Job Seekers 446 453 467 482 493 497 494 494 498 502
Cumulative Imbalance -60 -193 -335 -442 -580 -717 -855 -1,006 -1,156 -1,305

2019 2020 2021 2022 2023 2024 2025 2026 2027 2028
Alberta Occupational Outlook: 2019 - 2028
6563 Pet groomers and animal care workers
Job Openings 218 172 175 209 194 196 192 182 185 187
Job Seekers 189 193 202 211 219 220 217 216 218 221
Cumulative Imbalance 29 8 -19 -21 -46 -70 -95 -129 -162 -196
6564 Other personal service occupations
Job Openings 24 21 23 27 26 26 26 26 26 27
Job Seekers 21 22 23 23 24 24 24 24 24 24
Cumulative Imbalance 3 2 2 6 8 10 12 14 16 19
6611 Cashiers
Job Openings 1,745 1,719 1,545 2,077 2,032 1,957 1,940 1,826 1,857 1,857
Job Seekers 2,063 2,105 2,188 2,280 2,352 2,370 2,345 2,336 2,358 2,384
Cumulative Imbalance -318 -704 -1,347 -1,550 -1,870 -2,283 -2,688 -3,198 -3,699 -4,226
6621 Service station attendants
Job Openings 97 102 92 119 119 114 114 110 112 112
Job Seekers 131 133 138 142 145 146 146 146 147 148
Cumulative Imbalance -34 -65 -111 -134 -160 -192 -224 -260 -295 -331
6622 Store shelf stockers, clerks and order fillers
Job Openings 922 995 852 1,217 1,196 1,135 1,134 1,071 1,094 1,092
Job Seekers 1,116 1,139 1,186 1,237 1,277 1,287 1,272 1,267 1,279 1,293
Cumulative Imbalance -194 -338 -672 -692 -773 -925 -1,063 -1,259 -1,444 -1,645
6623 Other sales related occupations
Job Openings 214 209 198 241 236 229 225 213 214 213
Job Seekers 227 231 239 248 256 258 255 255 257 260
Cumulative Imbalance -13 -35 -76 -83 -103 -132 -162 -204 -247 -294
6711 Food counter attendants, kitchen helpers and related support occupations
Job Openings 2,788 2,243 2,347 2,738 2,571 2,594 2,559 2,441 2,473 2,499
Job Seekers 2,599 2,650 2,752 2,866 2,953 2,976 2,946 2,936 2,963 2,995
Cumulative Imbalance 189 -218 -623 -751 -1,133 -1,515 -1,902 -2,397 -2,887 -3,383
6721 Support occupations in accommodation, travel and facilities set-up services
Job Openings 22 20 20 23 22 22 22 22 23 23
Job Seekers 28 28 29 30 30 30 30 31 31 31
Cumulative Imbalance -6 -14 -23 -30 -38 -46 -54 -63 -71 -79
6722 Operators and attendants in amusement, recreation and sport
Job Openings 337 264 269 315 294 294 287 269 271 272
Job Seekers 270 276 288 302 313 316 311 309 312 316
Cumulative Imbalance 67 55 36 49 30 8 -16 -56 -97 -141
6731 Light duty cleaners
Job Openings 1,935 1,679 1,792 2,025 1,954 1,972 1,961 1,900 1,926 1,946
Job Seekers 1,561 1,592 1,654 1,724 1,779 1,792 1,773 1,766 1,782 1,801
Cumulative Imbalance 374 461 599 900 1,075 1,255 1,443 1,577 1,721 1,866

2019 2020 2021 2022 2023 2024 2025 2026 2027 2028
Alberta Occupational Outlook: 2019 - 2028
6732 Specialized cleaners
Job Openings 355 322 322 373 356 353 349 337 342 348
Job Seekers 333 340 355 372 385 388 382 380 384 388
Cumulative Imbalance 22 4 -29 -28 -57 -92 -125 -168 -210 -250
6733 Janitors, caretakers and building superintendents
Job Openings 1,633 1,613 1,671 1,835 1,820 1,813 1,804 1,765 1,776 1,783
Job Seekers 1,625 1,652 1,704 1,759 1,798 1,812 1,804 1,803 1,817 1,833
Cumulative Imbalance 8 -31 -64 12 34 35 35 -3 -44 -94
6741 Dry cleaning, laundry and related occupations
Job Openings 196 170 181 206 199 202 203 198 202 205
Job Seekers 152 155 161 167 172 173 172 171 173 175
Cumulative Imbalance 44 59 79 118 145 174 205 232 261 291
6742 Other service support occupations, n.e.c.
Job Openings 228 192 188 236 219 216 211 196 197 197
Job Seekers 177 181 190 200 208 210 206 204 206 209
Cumulative Imbalance 51 62 60 96 107 113 118 110 101 89
7201 Contractors and supervisors, machining, metal forming, shaping and erecting trades and related occupations
Job Openings 175 191 218 160 174 182 178 182 176 182
Job Seekers 163 166 173 182 189 190 186 184 185 187
Cumulative Imbalance 12 37 82 60 45 37 29 27 18 13
7202 Contractors and supervisors, electrical trades and telecommunications occupations
Job Openings 199 258 368 85 168 226 209 231 208 224
Job Seekers 164 168 177 188 197 198 192 189 191 194
Cumulative Imbalance 35 125 316 213 184 212 229 271 288 318
7203 Contractors and supervisors, pipefitting trades
Job Openings 111 162 239 46 102 138 125 145 130 143
Job Seekers 93 96 102 109 116 116 112 110 111 113
Cumulative Imbalance 18 84 221 158 144 166 179 214 233 263
7204 Contractors and supervisors, carpentry trades
Job Openings 165 252 366 70 159 225 209 228 203 216
Job Seekers 168 171 179 188 195 196 192 190 192 194
Cumulative Imbalance -3 78 265 147 111 140 157 195 206 228
7205 Contractors and supervisors, other construction trades, installers, repairers and servicers
Job Openings 389 586 857 157 368 524 483 530 471 502
Job Seekers 340 348 367 389 408 410 399 393 397 402
Cumulative Imbalance 49 287 777 545 505 619 703 840 914 1,014
7231 Machinists and machining and tooling inspectors
Job Openings 231 212 195 269 237 204 210 206 208 212
Job Seekers 213 217 227 240 250 251 245 242 244 247
Cumulative Imbalance 18 13 -19 10 -3 -50 -85 -121 -157 -192

2019 2020 2021 2022 2023 2024 2025 2026 2027 2028
Alberta Occupational Outlook: 2019 - 2028
7232 Tool and die makers
Job Openings 15 15 15 17 16 15 15 16 16 16
Job Seekers 13 13 14 14 15 15 15 15 15 15
Cumulative Imbalance 2 4 5 8 9 9 9 10 11 12
7233 Sheet metal workers
Job Openings 136 181 238 90 135 167 159 168 154 160
Job Seekers 171 173 179 186 191 192 190 189 190 191
Cumulative Imbalance -35 -27 32 -64 -120 -145 -176 -197 -233 -264
7234 Boilermakers
Job Openings 50 51 55 50 51 50 50 52 52 54
Job Seekers 64 65 66 68 70 70 70 69 70 70
Cumulative Imbalance -14 -28 -39 -57 -76 -96 -116 -133 -151 -167
7235 Structural metal and platework fabricators and fitters
Job Openings 28 28 29 30 29 28 28 28 28 29
Job Seekers 31 32 33 34 35 35 35 35 35 35
Cumulative Imbalance -3 -7 -11 -15 -21 -28 -35 -42 -49 -55
7236 Ironworkers
Job Openings 147 212 305 65 134 182 168 183 162 173
Job Seekers 145 148 157 167 175 176 170 168 169 172
Cumulative Imbalance 2 66 214 112 71 77 75 90 83 84
7237 Welders and related machine operators
Job Openings 953 934 1,015 922 928 932 925 943 938 972
Job Seekers 1,130 1,143 1,179 1,220 1,250 1,256 1,242 1,236 1,244 1,255
Cumulative Imbalance -177 -386 -550 -848 -1,170 -1,494 -1,811 -2,104 -2,410 -2,693
7241 Electricians (except industrial and power system)
Job Openings 695 1,006 1,419 346 670 911 850 920 831 875
Job Seekers 997 1,008 1,039 1,074 1,100 1,106 1,095 1,090 1,098 1,108
Cumulative Imbalance -302 -304 76 -652 -1,082 -1,277 -1,522 -1,692 -1,959 -2,192
7242 Industrial electricians
Job Openings 243 267 305 233 253 260 257 277 275 290
Job Seekers 372 375 384 393 400 402 400 399 402 405
Cumulative Imbalance -129 -237 -316 -476 -623 -765 -908 -1,030 -1,157 -1,272
7243 Power system electricians
Job Openings 42 40 43 35 38 40 40 41 40 41
Job Seekers 64 64 65 66 67 67 67 68 68 68
Cumulative Imbalance -22 -46 -68 -99 -128 -155 -182 -209 -237 -264
7244 Electrical power line and cable workers
Job Openings 186 139 150 102 117 122 122 122 116 121
Job Seekers 118 120 125 130 135 136 133 132 133 134
Cumulative Imbalance 68 87 112 84 66 52 41 31 14 1

2019 2020 2021 2022 2023 2024 2025 2026 2027 2028
Alberta Occupational Outlook: 2019 - 2028
7245 Telecommunications line and cable workers
Job Openings 74 71 84 60 66 74 72 73 71 74
Job Seekers 57 58 61 64 66 67 66 65 66 66
Cumulative Imbalance 17 30 53 49 49 56 62 70 75 83
7246 Telecommunications installation and repair workers
Job Openings 163 144 156 150 150 158 156 155 156 160
Job Seekers 147 149 154 159 163 164 162 162 163 165
Cumulative Imbalance 16 11 13 4 -9 -15 -21 -28 -35 -40
7247 Cable television service and maintenance technicians
Job Openings 2 2 2 2 2 2 2 2 3 3
Job Seekers 2 2 2 2 2 2 2 2 2 2
Cumulative Imbalance 0 0 0 0 0 0 0 0 1 2
7251 Plumbers
Job Openings 395 564 788 204 381 512 480 518 470 494
Job Seekers 575 581 598 618 631 634 629 627 631 636
Cumulative Imbalance -180 -197 -7 -421 -671 -793 -942 -1,051 -1,212 -1,354
7252 Steamfitters, pipefitters and sprinkler system installers
Job Openings 318 393 511 237 316 363 346 384 367 393
Job Seekers 395 400 414 430 442 444 438 435 438 442
Cumulative Imbalance -77 -84 13 -180 -306 -387 -479 -530 -601 -650
7253 Gas fitters
Job Openings 61 54 57 50 53 53 54 55 55 57
Job Seekers 65 66 67 69 70 70 70 70 70 71
Cumulative Imbalance -4 -16 -26 -45 -62 -79 -95 -110 -125 -139
7271 Carpenters
Job Openings 896 1,179 1,553 609 902 1,121 1,073 1,141 1,066 1,110
Job Seekers 1,080 1,093 1,125 1,161 1,184 1,192 1,184 1,181 1,189 1,198
Cumulative Imbalance -184 -98 330 -222 -504 -575 -686 -726 -849 -937
7272 Cabinetmakers
Job Openings 92 99 106 91 94 96 96 96 94 94
Job Seekers 108 109 112 116 118 119 118 118 119 119
Cumulative Imbalance -16 -26 -32 -57 -81 -104 -126 -148 -173 -198
7281 Bricklayers
Job Openings 76 126 193 19 71 110 101 113 99 106
Job Seekers 86 87 91 96 100 100 98 97 98 99
Cumulative Imbalance -10 29 131 54 25 35 38 54 55 62
7282 Concrete finishers
Job Openings 92 129 178 51 90 118 111 120 109 115
Job Seekers 100 102 106 110 113 114 113 112 113 114
Cumulative Imbalance -8 19 91 32 9 13 11 19 15 16

2019 2020 2021 2022 2023 2024 2025 2026 2027 2028
Alberta Occupational Outlook: 2019 - 2028
7283 Tilesetters
Job Openings 59 83 114 34 59 77 73 78 72 76
Job Seekers 71 72 74 77 79 79 79 78 79 80
Cumulative Imbalance -12 -1 39 -4 -24 -26 -32 -32 -39 -43
7284 Plasterers, drywall installers and finishers and lathers
Job Openings 239 357 514 105 229 321 299 328 295 312
Job Seekers 238 243 253 266 275 276 272 270 272 275
Cumulative Imbalance 1 115 376 215 169 214 241 299 322 359
7291 Roofers and shinglers
Job Openings 137 159 194 114 136 156 150 153 146 151
Job Seekers 132 134 140 147 152 153 150 149 150 152
Cumulative Imbalance 5 30 84 51 35 38 38 42 38 37
7292 Glaziers
Job Openings 77 93 115 59 75 88 85 88 83 86
Job Seekers 80 81 84 88 90 91 90 89 90 91
Cumulative Imbalance -3 9 40 11 -4 -7 -12 -13 -20 -25
7293 Insulators
Job Openings 157 218 301 92 155 200 189 208 192 205
Job Seekers 183 186 192 200 206 207 204 203 205 207
Cumulative Imbalance -26 6 115 7 -44 -51 -66 -61 -74 -76
7294 Painters and decorators (except interior decorators)
Job Openings 320 448 615 189 322 420 398 428 395 414
Job Seekers 336 341 354 368 378 381 377 375 378 381
Cumulative Imbalance -16 91 352 173 117 156 177 230 247 280
7295 Floor covering installers
Job Openings 107 145 195 68 108 138 132 141 131 137
Job Seekers 119 121 125 130 133 133 132 132 133 134
Cumulative Imbalance -12 12 82 20 -5 0 0 9 7 10
7301 Contractors and supervisors, mechanic trades
Job Openings 325 356 418 290 315 336 319 332 322 343
Job Seekers 164 171 188 210 230 230 216 209 212 217
Cumulative Imbalance 161 346 576 656 741 847 950 1,073 1,183 1,309
7302 Contractors and supervisors, heavy equipment operator crews
Job Openings 381 515 693 245 381 479 454 492 459 486
Job Seekers 332 338 354 372 387 389 381 378 381 385
Cumulative Imbalance 49 226 565 438 432 522 595 709 787 888
7303 Supervisors, printing and related occupations
Job Openings 10 9 9 12 11 10 10 9 9 9
Job Seekers 9 9 9 10 10 10 10 10 10 10
Cumulative Imbalance 1 1 1 3 4 4 4 3 2 1
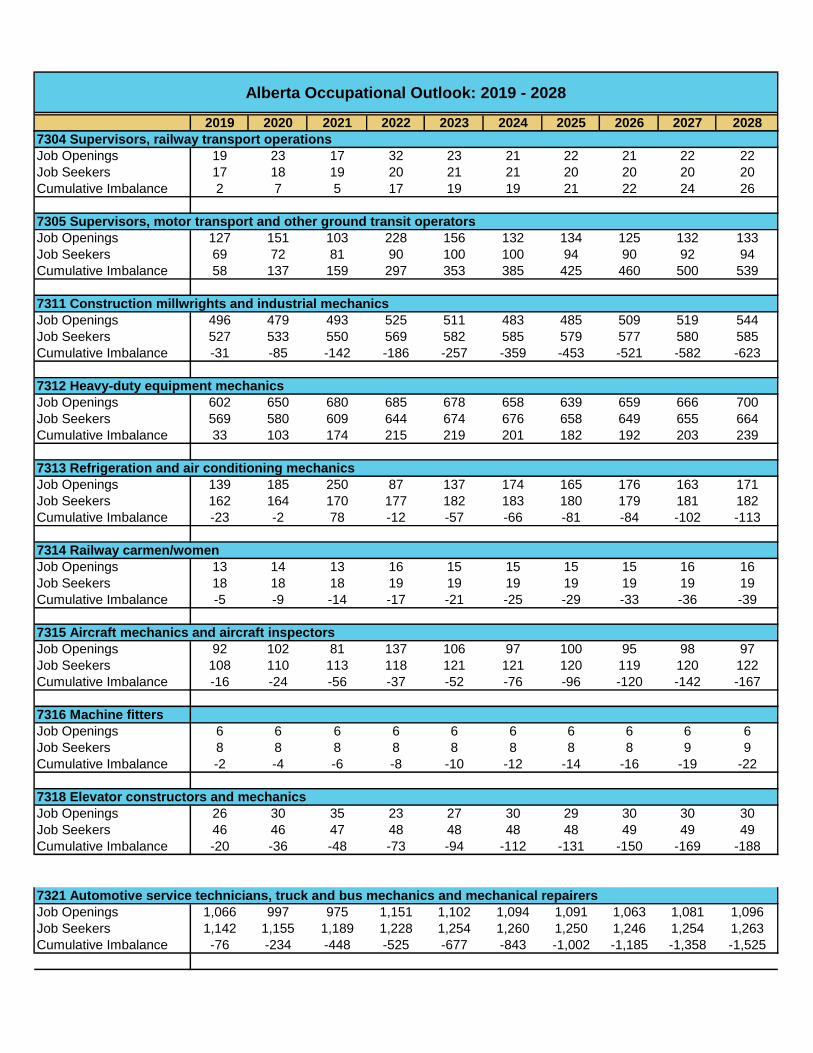
2019 2020 2021 2022 2023 2024 2025 2026 2027 2028
Alberta Occupational Outlook: 2019 - 2028
7304 Supervisors, railway transport operations
Job Openings 19 23 17 32 23 21 22 21 22 22
Job Seekers 17 18 19 20 21 21 20 20 20 20
Cumulative Imbalance 2 7 5 17 19 19 21 22 24 26
7305 Supervisors, motor transport and other ground transit operators
Job Openings 127 151 103 228 156 132 134 125 132 133
Job Seekers 69 72 81 90 100 100 94 90 92 94
Cumulative Imbalance 58 137 159 297 353 385 425 460 500 539
7311 Construction millwrights and industrial mechanics
Job Openings 496 479 493 525 511 483 485 509 519 544
Job Seekers 527 533 550 569 582 585 579 577 580 585
Cumulative Imbalance -31 -85 -142 -186 -257 -359 -453 -521 -582 -623
7312 Heavy-duty equipment mechanics
Job Openings 602 650 680 685 678 658 639 659 666 700
Job Seekers 569 580 609 644 674 676 658 649 655 664
Cumulative Imbalance 33 103 174 215 219 201 182 192 203 239
7313 Refrigeration and air conditioning mechanics
Job Openings 139 185 250 87 137 174 165 176 163 171
Job Seekers 162 164 170 177 182 183 180 179 181 182
Cumulative Imbalance -23 -2 78 -12 -57 -66 -81 -84 -102 -113
7314 Railway carmen/women
Job Openings 13 14 13 16 15 15 15 15 16 16
Job Seekers 18 18 18 19 19 19 19 19 19 19
Cumulative Imbalance -5 -9 -14 -17 -21 -25 -29 -33 -36 -39
7315 Aircraft mechanics and aircraft inspectors
Job Openings 92 102 81 137 106 97 100 95 98 97
Job Seekers 108 110 113 118 121 121 120 119 120 122
Cumulative Imbalance -16 -24 -56 -37 -52 -76 -96 -120 -142 -167
7316 Machine fitters
Job Openings 6 6 6 6 6 6 6 6 6 6
Job Seekers 8 8 8 8 8 8 8 8 9 9
Cumulative Imbalance -2 -4 -6 -8 -10 -12 -14 -16 -19 -22
7318 Elevator constructors and mechanics
Job Openings 26 30 35 23 27 30 29 30 30 30
Job Seekers 46 46 47 48 48 48 48 49 49 49
Cumulative Imbalance -20 -36 -48 -73 -94 -112 -131 -150 -169 -188
7321 Automotive service technicians, truck and bus mechanics and mechanical repairers
Job Openings 1,066 997 975 1,151 1,102 1,094 1,091 1,063 1,081 1,096
Job Seekers 1,142 1,155 1,189 1,228 1,254 1,260 1,250 1,246 1,254 1,263
Cumulative Imbalance -76 -234 -448 -525 -677 -843 -1,002 -1,185 -1,358 -1,525

2019 2020 2021 2022 2023 2024 2025 2026 2027 2028
Alberta Occupational Outlook: 2019 - 2028
7322 Motor vehicle body repairers
Job Openings 262 223 229 258 246 252 251 244 248 253
Job Seekers 224 227 234 243 248 250 247 246 248 250
Cumulative Imbalance 38 34 29 44 42 44 48 46 46 49
7331 Oil and solid fuel heating mechanics
Job Openings 11 14 17 9 12 13 13 14 13 14
Job Seekers 13 13 13 14 14 14 14 14 14 14
Cumulative Imbalance -2 -1 3 -2 -4 -5 -6 -6 -7 -7
7332 Appliance servicers and repairers
Job Openings 53 52 54 50 51 52 51 50 49 50
Job Seekers 46 46 47 49 50 50 50 50 50 51
Cumulative Imbalance 7 13 20 21 22 24 25 25 24 23
7333 Electrical mechanics
Job Openings 30 27 28 29 29 29 29 29 29 30
Job Seekers 28 29 30 31 31 31 31 31 31 31
Cumulative Imbalance 2 0 -2 -4 -6 -8 -10 -12 -14 -15
7334 Motorcycle, all-terrain vehicle and other related mechanics
Job Openings 31 30 29 35 34 34 34 34 35 35
Job Seekers 35 36 37 38 39 39 39 38 39 39
Cumulative Imbalance -4 -10 -18 -21 -26 -31 -36 -40 -44 -48
7335 Other small engine and small equipment repairers
Job Openings 23 22 22 24 24 24 24 23 23 23
Job Seekers 19 19 20 20 21 21 21 21 21 21
Cumulative Imbalance 4 7 9 13 16 19 22 24 26 28
7361 Railway and yard locomotive engineers
Job Openings 36 45 30 67 45 40 42 39 41 41
Job Seekers 31 31 33 36 37 38 37 36 36 37
Cumulative Imbalance 5 19 16 47 55 57 62 65 70 74
7362 Railway conductors and brakemen/women
Job Openings 33 41 27 61 40 35 37 33 35 35
Job Seekers 37 37 39 41 43 43 42 42 42 43
Cumulative Imbalance -4 0 -12 8 5 -3 -8 -17 -24 -32
7371 Crane operators
Job Openings 127 153 184 110 131 146 141 150 145 151
Job Seekers 103 105 109 114 118 118 117 116 116 117
Cumulative Imbalance 24 72 147 143 156 184 208 242 271 305
7372 Drillers and blasters - surface mining, quarrying and construction
Job Openings 10 11 12 10 11 11 11 12 12 12
Job Seekers 14 14 14 15 15 15 15 15 15 15
Cumulative Imbalance -4 -7 -9 -14 -18 -22 -26 -29 -32 -35
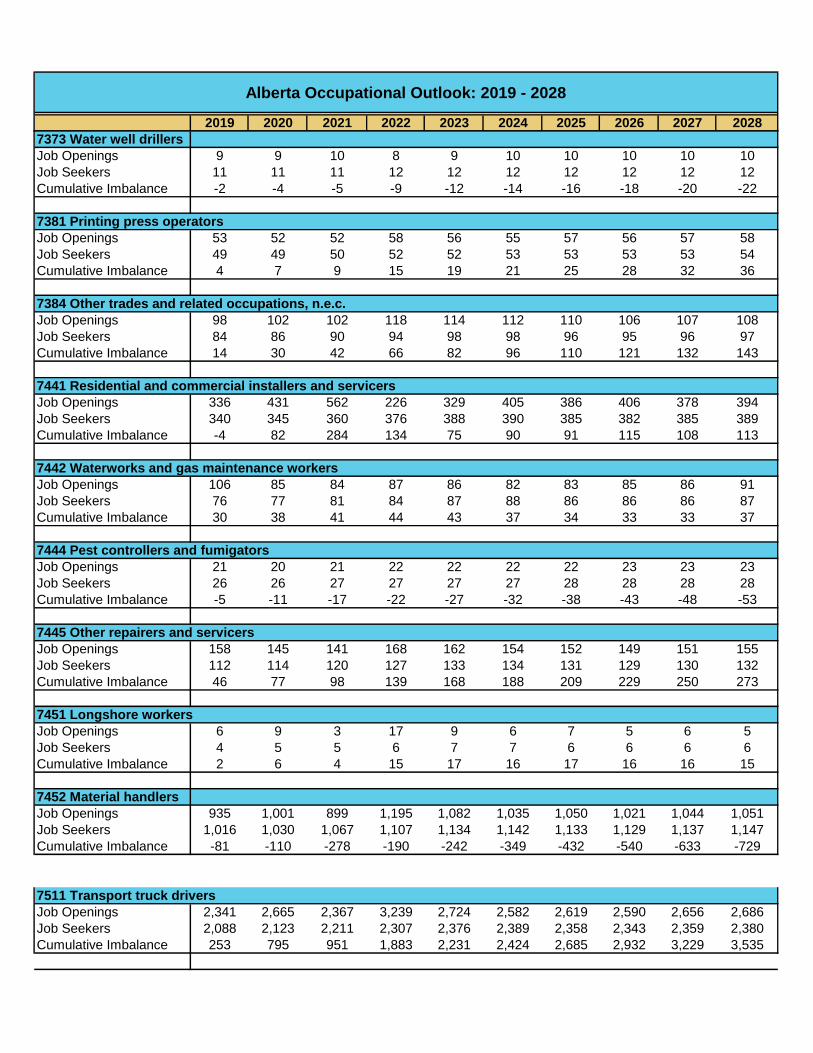
2019 2020 2021 2022 2023 2024 2025 2026 2027 2028
Alberta Occupational Outlook: 2019 - 2028
7373 Water well drillers
Job Openings 9 9 10 8 9 10 10 10 10 10
Job Seekers 11 11 11 12 12 12 12 12 12 12
Cumulative Imbalance -2 -4 -5 -9 -12 -14 -16 -18 -20 -22
7381 Printing press operators
Job Openings 53 52 52 58 56 55 57 56 57 58
Job Seekers 49 49 50 52 52 53 53 53 53 54
Cumulative Imbalance 4 7 9 15 19 21 25 28 32 36
7384 Other trades and related occupations, n.e.c.
Job Openings 98 102 102 118 114 112 110 106 107 108
Job Seekers 84 86 90 94 98 98 96 95 96 97
Cumulative Imbalance 14 30 42 66 82 96 110 121 132 143
7441 Residential and commercial installers and servicers
Job Openings 336 431 562 226 329 405 386 406 378 394
Job Seekers 340 345 360 376 388 390 385 382 385 389
Cumulative Imbalance -4 82 284 134 75 90 91 115 108 113
7442 Waterworks and gas maintenance workers
Job Openings 106 85 84 87 86 82 83 85 86 91
Job Seekers 76 77 81 84 87 88 86 86 86 87
Cumulative Imbalance 30 38 41 44 43 37 34 33 33 37
7444 Pest controllers and fumigators
Job Openings 21 20 21 22 22 22 22 23 23 23
Job Seekers 26 26 27 27 27 27 28 28 28 28
Cumulative Imbalance -5 -11 -17 -22 -27 -32 -38 -43 -48 -53
7445 Other repairers and servicers
Job Openings 158 145 141 168 162 154 152 149 151 155
Job Seekers 112 114 120 127 133 134 131 129 130 132
Cumulative Imbalance 46 77 98 139 168 188 209 229 250 273
7451 Longshore workers
Job Openings 6 9 3 17 9 6 7 5 6 5
Job Seekers 4 5 5 6 7 7 6 6 6 6
Cumulative Imbalance 2 6 4 15 17 16 17 16 16 15
7452 Material handlers
Job Openings 935 1,001 899 1,195 1,082 1,035 1,050 1,021 1,044 1,051
Job Seekers 1,016 1,030 1,067 1,107 1,134 1,142 1,133 1,129 1,137 1,147
Cumulative Imbalance -81 -110 -278 -190 -242 -349 -432 -540 -633 -729
7511 Transport truck drivers
Job Openings 2,341 2,665 2,367 3,239 2,724 2,582 2,619 2,590 2,656 2,686
Job Seekers 2,088 2,123 2,211 2,307 2,376 2,389 2,358 2,343 2,359 2,380
Cumulative Imbalance 253 795 951 1,883 2,231 2,424 2,685 2,932 3,229 3,535

2019 2020 2021 2022 2023 2024 2025 2026 2027 2028
Alberta Occupational Outlook: 2019 - 2028
7512 Bus drivers, subway operators and other transit operators
Job Openings 746 821 694 1,062 883 821 830 788 804 791
Job Seekers 646 656 682 710 732 736 726 722 728 735
Cumulative Imbalance 100 265 277 629 780 865 969 1,035 1,111 1,167
7513 Taxi and limousine drivers and chauffeurs
Job Openings 431 489 403 635 507 472 480 455 466 459
Job Seekers 377 383 398 414 426 429 423 421 425 429
Cumulative Imbalance 54 160 165 386 467 510 567 601 642 672
7514 Delivery and courier service drivers
Job Openings 491 519 465 632 556 533 535 512 520 518
Job Seekers 450 458 476 496 511 514 508 505 509 514
Cumulative Imbalance 41 102 91 227 272 291 318 325 336 340
7521 Heavy equipment operators (except crane)
Job Openings 882 995 1,173 818 932 980 960 1,047 1,038 1,099
Job Seekers 856 868 899 932 953 959 952 949 955 962
Cumulative Imbalance 26 153 427 313 292 313 321 419 502 639
7522 Public works maintenance equipment operators and related workers
Job Openings 203 181 186 194 194 196 194 191 192 196
Job Seekers 142 145 151 159 164 165 162 161 162 164
Cumulative Imbalance 61 97 132 167 197 228 260 290 320 352
7531 Railway yard and track maintenance workers
Job Openings 33 37 32 46 38 37 38 37 39 39
Job Seekers 42 42 44 45 45 46 46 46 46 46
Cumulative Imbalance -9 -14 -26 -25 -32 -41 -49 -58 -65 -72
7532 Water transport deck and engine room crew
Job Openings 1 1 1 2 2 2 2 2 2 2
Job Seekers 1 1 1 1 1 1 1 1 1 1
Cumulative Imbalance 0 0 0 1 2 3 4 5 6 7
7533 Boat and cable ferry operators and related occupations
Job Openings 1 1 1 1 1 1 1 1 1 1
Job Seekers 1 1 1 1 1 1 1 1 1 1
Cumulative Imbalance 0 0 0 0 0 0 0 0 0 0
7534 Air transport ramp attendants
Job Openings 68 81 57 116 81 71 74 68 72 70
Job Seekers 88 90 93 97 100 101 99 99 100 101
Cumulative Imbalance -20 -29 -65 -46 -65 -95 -120 -151 -179 -210
7535 Other automotive mechanical installers and servicers
Job Openings 180 170 161 200 193 186 184 180 183 187
Job Seekers 175 178 185 193 199 200 198 196 198 200
Cumulative Imbalance 5 -3 -27 -20 -26 -40 -54 -70 -85 -98
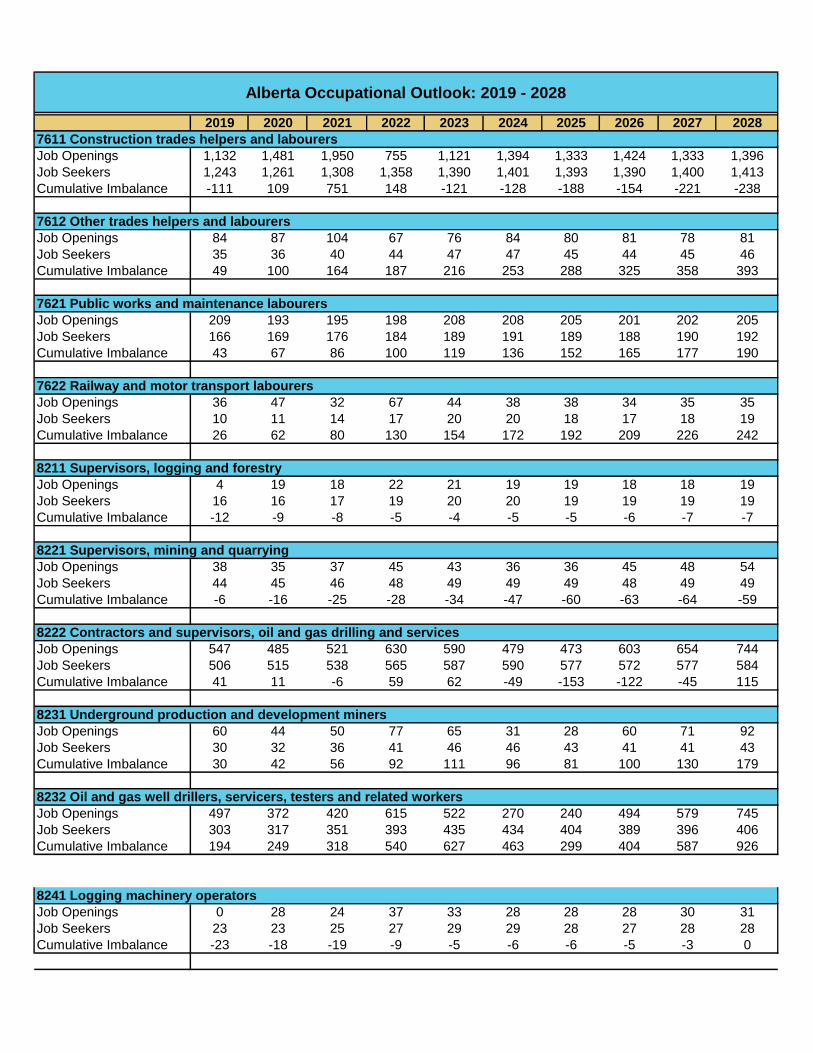
2019 2020 2021 2022 2023 2024 2025 2026 2027 2028
Alberta Occupational Outlook: 2019 - 2028
7611 Construction trades helpers and labourers
Job Openings 1,132 1,481 1,950 755 1,121 1,394 1,333 1,424 1,333 1,396
Job Seekers 1,243 1,261 1,308 1,358 1,390 1,401 1,393 1,390 1,400 1,413
Cumulative Imbalance -111 109 751 148 -121 -128 -188 -154 -221 -238
7612 Other trades helpers and labourers
Job Openings 84 87 104 67 76 84 80 81 78 81
Job Seekers 35 36 40 44 47 47 45 44 45 46
Cumulative Imbalance 49 100 164 187 216 253 288 325 358 393
7621 Public works and maintenance labourers
Job Openings 209 193 195 198 208 208 205 201 202 205
Job Seekers 166 169 176 184 189 191 189 188 190 192
Cumulative Imbalance 43 67 86 100 119 136 152 165 177 190
7622 Railway and motor transport labourers
Job Openings 36 47 32 67 44 38 38 34 35 35
Job Seekers 10 11 14 17 20 20 18 17 18 19
Cumulative Imbalance 26 62 80 130 154 172 192 209 226 242
8211 Supervisors, logging and forestry
Job Openings 4 19 18 22 21 19 19 18 18 19
Job Seekers 16 16 17 19 20 20 19 19 19 19
Cumulative Imbalance -12 -9 -8 -5 -4 -5 -5 -6 -7 -7
8221 Supervisors, mining and quarrying
Job Openings 38 35 37 45 43 36 36 45 48 54
Job Seekers 44 45 46 48 49 49 49 48 49 49
Cumulative Imbalance -6 -16 -25 -28 -34 -47 -60 -63 -64 -59
8222 Contractors and supervisors, oil and gas drilling and services
Job Openings 547 485 521 630 590 479 473 603 654 744
Job Seekers 506 515 538 565 587 590 577 572 577 584
Cumulative Imbalance 41 11 -6 59 62 -49 -153 -122 -45 115
8231 Underground production and development miners
Job Openings 60 44 50 77 65 31 28 60 71 92
Job Seekers 30 32 36 41 46 46 43 41 41 43
Cumulative Imbalance 30 42 56 92 111 96 81 100 130 179
8232 Oil and gas well drillers, servicers, testers and related workers
Job Openings 497 372 420 615 522 270 240 494 579 745
Job Seekers 303 317 351 393 435 434 404 389 396 406
Cumulative Imbalance 194 249 318 540 627 463 299 404 587 926
8241 Logging machinery operators
Job Openings 0 28 24 37 33 28 28 28 30 31
Job Seekers 23 23 25 27 29 29 28 27 28 28
Cumulative Imbalance -23 -18 -19 -9 -5 -6 -6 -5 -3 0

2019 2020 2021 2022 2023 2024 2025 2026 2027 2028
Alberta Occupational Outlook: 2019 - 2028
8252 Agricultural service contractors, farm supervisors and specialized livestock workers
Job Openings 31 84 77 98 93 87 84 80 82 81
Job Seekers 90 91 95 99 102 103 101 101 102 103
Cumulative Imbalance -59 -66 -84 -85 -94 -110 -127 -148 -168 -190
8255 Contractors and supervisors, landscaping, grounds maintenance and horticulture services
Job Openings 204 163 172 193 182 188 184 175 177 181
Job Seekers 146 149 156 164 170 171 168 166 168 170
Cumulative Imbalance 58 72 88 117 129 146 162 171 180 191
8261 Fishing masters and officers
Job Openings -1 0 0 0 0 0 0 0 0 0
Job Seekers 0 0 0 0 0 0 0 0 0 0
Cumulative Imbalance -1 -1 -1 -1 -1 -1 -1 -1 -1 -1
8262 Fishermen/women
Job Openings -3 2 1 3 2 2 2 2 2 2
Job Seekers 3 3 4 4 4 4 4 4 4 4
Cumulative Imbalance -6 -7 -10 -11 -13 -15 -17 -19 -21 -23
8411 Underground mine service and support workers
Job Openings 10 9 13 12 11 6 5 12 13 17
Job Seekers -4 -3 -2 -1 0 0 -1 -2 -1 -1
Cumulative Imbalance 14 26 41 54 65 71 77 91 105 123
8412 Oil and gas well drilling and related workers and services operators
Job Openings 189 184 209 202 202 172 167 214 227 258
Job Seekers 191 194 203 213 221 222 219 217 220 223
Cumulative Imbalance -2 -12 -6 -17 -36 -86 -138 -141 -134 -99
8421 Chain saw and skidder operators
Job Openings 10 12 13 13 14 14 14 14 14 14
Job Seekers 11 11 11 11 11 11 12 12 12 12
Cumulative Imbalance -1 0 2 4 7 10 12 14 16 18
8422 Silviculture and forestry workers
Job Openings 18 22 22 23 24 23 23 23 24 24
Job Seekers 27 27 28 29 29 29 29 30 30 30
Cumulative Imbalance -9 -14 -20 -26 -31 -37 -43 -50 -56 -62
8431 General farm workers
Job Openings 93 660 590 732 693 619 583 551 554 536
Job Seekers 554 565 591 620 641 645 637 634 640 647
Cumulative Imbalance -461 -366 -367 -255 -203 -229 -283 -366 -452 -563
8432 Nursery and greenhouse workers
Job Openings -15 59 51 75 72 64 62 59 62 62
Job Seekers 50 51 55 58 62 62 60 60 60 61
Cumulative Imbalance -65 -57 -61 -44 -34 -32 -30 -31 -29 -28

2019 2020 2021 2022 2023 2024 2025 2026 2027 2028
Alberta Occupational Outlook: 2019 - 2028
8441 Fishing vessel deckhands
Job Openings 0 0 0 0 0 0 0 0 0 0
Job Seekers 0 0 0 0 0 0 0 0 0 0
Cumulative Imbalance 0 0 0 0 0 0 0 0 0 0
8442 Trappers and hunters
Job Openings 0 1 1 1 1 1 1 1 1 1
Job Seekers 1 1 1 1 1 1 1 1 1 1
Cumulative Imbalance -1 -1 -1 -1 -1 -1 -1 -1 -1 -1
8611 Harvesting labourers
Job Openings -4 8 7 10 9 8 8 8 9 9
Job Seekers 9 9 10 10 11 11 10 10 10 11
Cumulative Imbalance -13 -14 -17 -17 -19 -22 -24 -26 -27 -29
8612 Landscaping and grounds maintenance labourers
Job Openings 770 643 658 741 705 709 695 662 665 670
Job Seekers 590 600 626 654 676 681 673 670 677 686
Cumulative Imbalance 180 223 255 342 371 399 421 413 401 385
8613 Aquaculture and marine harvest labourers
Job Openings 1 1 1 1 1 1 1 1 1 1
Job Seekers 1 1 1 1 1 1 1 1 1 1
Cumulative Imbalance 0 0 0 0 0 0 0 0 0 0
8614 Mine labourers
Job Openings 10 9 10 12 11 9 9 12 13 15
Job Seekers 11 11 11 12 12 12 12 12 12 13
Cumulative Imbalance -1 -3 -4 -4 -5 -8 -11 -11 -10 -8
8615 Oil and gas drilling, servicing and related labourers
Job Openings 195 183 199 222 212 173 169 218 235 268
Job Seekers 171 175 184 195 203 204 200 199 201 204
Cumulative Imbalance 24 32 47 74 83 52 21 40 74 138
8616 Logging and forestry labourers
Job Openings 2 10 9 11 11 10 10 10 10 10
Job Seekers 12 12 13 13 14 14 14 14 14 14
Cumulative Imbalance -10 -12 -16 -18 -21 -25 -29 -33 -37 -41
9211 Supervisors, mineral and metal processing
Job Openings 32 32 33 33 33 32 32 33 33 34
Job Seekers 42 42 44 45 46 46 46 46 46 47
Cumulative Imbalance -10 -20 -31 -43 -56 -70 -84 -97 -110 -123
9212 Supervisors, petroleum, gas and chemical processing and utilities
Job Openings 273 218 211 274 249 205 206 236 249 275
Job Seekers 200 205 216 229 241 242 235 232 235 238
Cumulative Imbalance 73 86 81 126 134 97 68 72 86 123

2019 2020 2021 2022 2023 2024 2025 2026 2027 2028
Alberta Occupational Outlook: 2019 - 2028
9213 Supervisors, food, beverage and associated products processing
Job Openings 66 58 41 85 65 48 52 42 41 38
Job Seekers 50 52 57 63 68 68 65 63 64 65
Cumulative Imbalance 16 22 6 28 25 5 -8 -29 -52 -79
9214 Supervisors, plastic and rubber products manufacturing
Job Openings 14 13 13 16 15 14 14 14 14 14
Job Seekers 18 19 19 20 20 20 20 20 20 20
Cumulative Imbalance -4 -10 -16 -20 -25 -31 -37 -43 -49 -55
9215 Supervisors, forest products processing
Job Openings 35 36 31 47 40 34 36 33 33 32
Job Seekers 32 33 36 38 41 41 40 39 39 40
Cumulative Imbalance 3 6 1 10 9 2 -2 -8 -14 -22
9217 Supervisors, textile, fabric, fur and leather products processing and manufacturing
Job Openings 5 5 5 6 6 5 5 5 5 5
Job Seekers 6 6 6 6 6 6 6 6 6 7
Cumulative Imbalance -1 -2 -3 -3 -3 -4 -5 -6 -7 -9
9221 Supervisors, motor vehicle assembling
Job Openings 5 5 4 7 5 4 4 4 4 4
Job Seekers 4 4 4 5 5 5 5 5 5 5
Cumulative Imbalance 1 2 2 4 4 3 2 1 0 -1
9222 Supervisors, electronics manufacturing
Job Openings 6 6 5 8 7 6 6 6 5 5
Job Seekers 5 5 5 6 6 6 6 6 6 6
Cumulative Imbalance 1 2 2 4 5 5 5 5 4 3
9223 Supervisors, electrical products manufacturing
Job Openings 10 9 9 12 10 9 9 8 8 8
Job Seekers 7 7 7 8 8 8 8 8 8 8
Cumulative Imbalance 3 5 7 11 13 14 15 15 15 15
9224 Supervisors, furniture and fixtures manufacturing
Job Openings 12 11 10 13 11 9 9 8 7 7
Job Seekers 9 9 10 11 12 12 11 11 11 11
Cumulative Imbalance 3 5 5 7 6 3 1 -2 -6 -10
9226 Supervisors, other mechanical and metal products manufacturing
Job Openings 54 42 31 65 45 26 29 21 19 17
Job Seekers 12 14 19 26 32 32 27 24 25 26
Cumulative Imbalance 42 70 82 121 134 128 130 127 121 112
9227 Supervisors, other products manufacturing and assembly
Job Openings 29 28 28 31 27 24 24 22 21 21
Job Seekers 17 18 20 22 25 25 23 22 23 23
Cumulative Imbalance 12 22 30 39 41 40 41 41 39 37
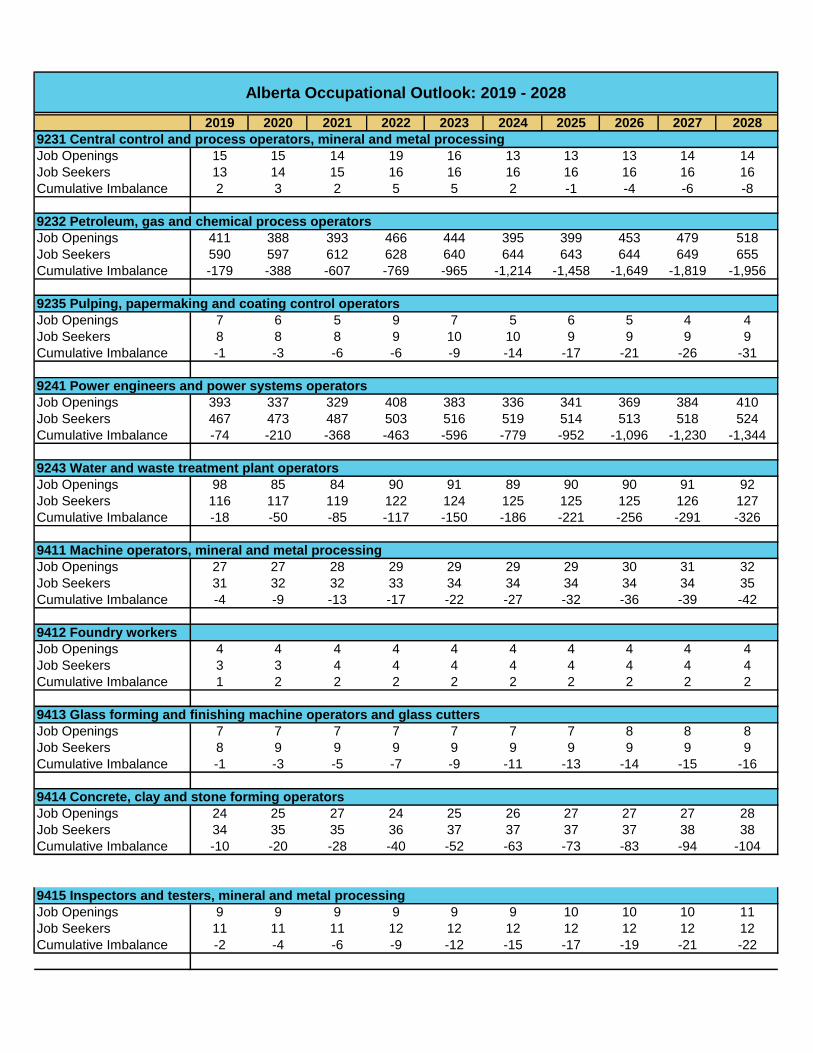
2019 2020 2021 2022 2023 2024 2025 2026 2027 2028
Alberta Occupational Outlook: 2019 - 2028
9231 Central control and process operators, mineral and metal processing
Job Openings 15 15 14 19 16 13 13 13 14 14
Job Seekers 13 14 15 16 16 16 16 16 16 16
Cumulative Imbalance 2 3 2 5 5 2 -1 -4 -6 -8
9232 Petroleum, gas and chemical process operators
Job Openings 411 388 393 466 444 395 399 453 479 518
Job Seekers 590 597 612 628 640 644 643 644 649 655
Cumulative Imbalance -179 -388 -607 -769 -965 -1,214 -1,458 -1,649 -1,819 -1,956
9235 Pulping, papermaking and coating control operators
Job Openings 7 6 5 9 7 5 6 5 4 4
Job Seekers 8 8 8 9 10 10 9 9 9 9
Cumulative Imbalance -1 -3 -6 -6 -9 -14 -17 -21 -26 -31
9241 Power engineers and power systems operators
Job Openings 393 337 329 408 383 336 341 369 384 410
Job Seekers 467 473 487 503 516 519 514 513 518 524
Cumulative Imbalance -74 -210 -368 -463 -596 -779 -952 -1,096 -1,230 -1,344
9243 Water and waste treatment plant operators
Job Openings 98 85 84 90 91 89 90 90 91 92
Job Seekers 116 117 119 122 124 125 125 125 126 127
Cumulative Imbalance -18 -50 -85 -117 -150 -186 -221 -256 -291 -326
9411 Machine operators, mineral and metal processing
Job Openings 27 27 28 29 29 29 29 30 31 32
Job Seekers 31 32 32 33 34 34 34 34 34 35
Cumulative Imbalance -4 -9 -13 -17 -22 -27 -32 -36 -39 -42
9412 Foundry workers
Job Openings 4 4 4 4 4 4 4 4 4 4
Job Seekers 3 3 4 4 4 4 4 4 4 4
Cumulative Imbalance 1 2 2 2 2 2 2 2 2 2
9413 Glass forming and finishing machine operators and glass cutters
Job Openings 7 7 7 7 7 7 7 8 8 8
Job Seekers 8 9 9 9 9 9 9 9 9 9
Cumulative Imbalance -1 -3 -5 -7 -9 -11 -13 -14 -15 -16
9414 Concrete, clay and stone forming operators
Job Openings 24 25 27 24 25 26 27 27 27 28
Job Seekers 34 35 35 36 37 37 37 37 38 38
Cumulative Imbalance -10 -20 -28 -40 -52 -63 -73 -83 -94 -104
9415 Inspectors and testers, mineral and metal processing
Job Openings 9 9 9 9 9 9 10 10 10 11
Job Seekers 11 11 11 12 12 12 12 12 12 12
Cumulative Imbalance -2 -4 -6 -9 -12 -15 -17 -19 -21 -22
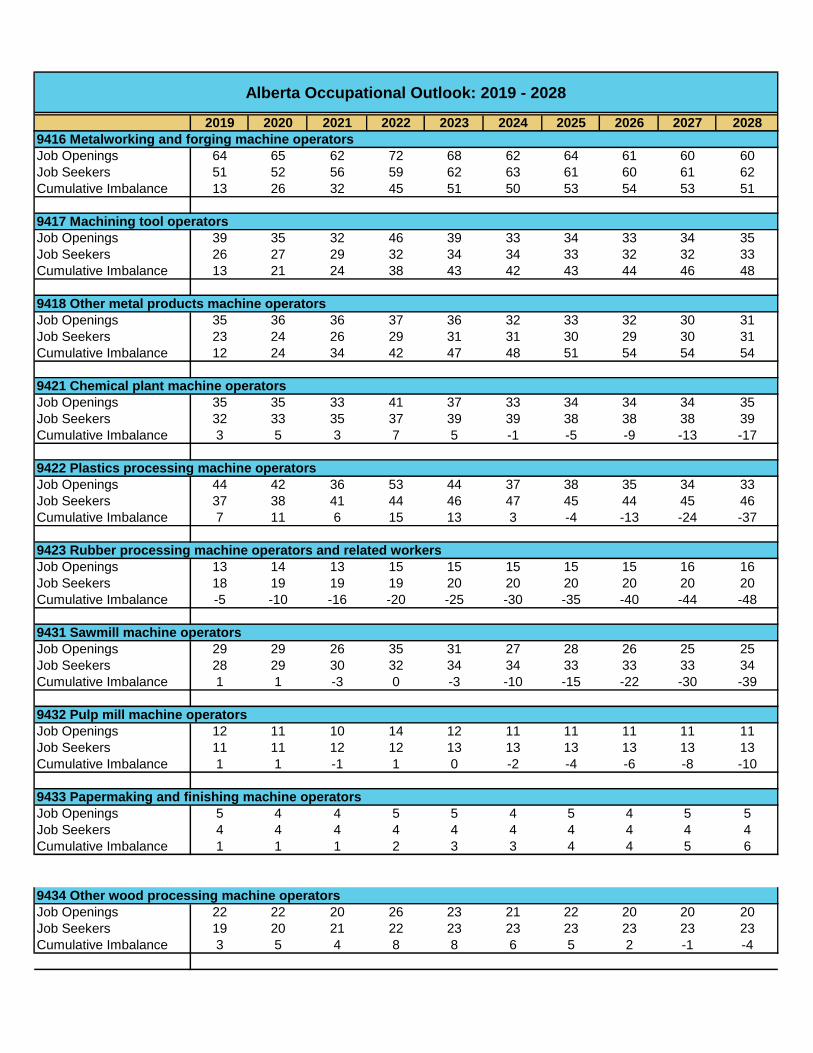
2019 2020 2021 2022 2023 2024 2025 2026 2027 2028
Alberta Occupational Outlook: 2019 - 2028
9416 Metalworking and forging machine operators
Job Openings 64 65 62 72 68 62 64 61 60 60
Job Seekers 51 52 56 59 62 63 61 60 61 62
Cumulative Imbalance 13 26 32 45 51 50 53 54 53 51
9417 Machining tool operators
Job Openings 39 35 32 46 39 33 34 33 34 35
Job Seekers 26 27 29 32 34 34 33 32 32 33
Cumulative Imbalance 13 21 24 38 43 42 43 44 46 48
9418 Other metal products machine operators
Job Openings 35 36 36 37 36 32 33 32 30 31
Job Seekers 23 24 26 29 31 31 30 29 30 31
Cumulative Imbalance 12 24 34 42 47 48 51 54 54 54
9421 Chemical plant machine operators
Job Openings 35 35 33 41 37 33 34 34 34 35
Job Seekers 32 33 35 37 39 39 38 38 38 39
Cumulative Imbalance 3 5 3 7 5 -1 -5 -9 -13 -17
9422 Plastics processing machine operators
Job Openings 44 42 36 53 44 37 38 35 34 33
Job Seekers 37 38 41 44 46 47 45 44 45 46
Cumulative Imbalance 7 11 6 15 13 3 -4 -13 -24 -37
9423 Rubber processing machine operators and related workers
Job Openings 13 14 13 15 15 15 15 15 16 16
Job Seekers 18 19 19 19 20 20 20 20 20 20
Cumulative Imbalance -5 -10 -16 -20 -25 -30 -35 -40 -44 -48
9431 Sawmill machine operators
Job Openings 29 29 26 35 31 27 28 26 25 25
Job Seekers 28 29 30 32 34 34 33 33 33 34
Cumulative Imbalance 1 1 -3 0 -3 -10 -15 -22 -30 -39
9432 Pulp mill machine operators
Job Openings 12 11 10 14 12 11 11 11 11 11
Job Seekers 11 11 12 12 13 13 13 13 13 13
Cumulative Imbalance 1 1 -1 1 0 -2 -4 -6 -8 -10
9433 Papermaking and finishing machine operators
Job Openings 5 4 4 5 5 4 5 4 5 5
Job Seekers 4 4 4 4 4 4 4 4 4 4
Cumulative Imbalance 1 1 1 2 3 3 4 4 5 6
9434 Other wood processing machine operators
Job Openings 22 22 20 26 23 21 22 20 20 20
Job Seekers 19 20 21 22 23 23 23 23 23 23
Cumulative Imbalance 3 5 4 8 8 6 5 2 -1 -4

2019 2020 2021 2022 2023 2024 2025 2026 2027 2028
Alberta Occupational Outlook: 2019 - 2028
9435 Paper converting machine operators
Job Openings 8 7 7 9 8 7 8 7 8 8
Job Seekers 6 6 7 7 7 8 7 7 7 7
Cumulative Imbalance 2 3 3 5 6 5 6 6 7 8
9436 Lumber graders and other wood processing inspectors and graders
Job Openings 12 12 10 15 13 12 12 12 12 12
Job Seekers 11 11 12 12 13 13 13 12 13 13
Cumulative Imbalance 1 2 0 3 3 2 1 1 0 -1
9437 Woodworking machine operators
Job Openings 20 21 22 20 20 19 19 19 18 18
Job Seekers 18 19 20 21 22 22 21 21 21 22
Cumulative Imbalance 2 4 6 5 3 0 -2 -4 -7 -11
9441 Textile fibre and yarn, hide and pelt processing machine operators and workers
Job Openings 6 6 6 6 6 6 6 6 6 6
Job Seekers 7 7 7 7 8 8 8 8 8 8
Cumulative Imbalance -1 -2 -3 -4 -6 -8 -10 -12 -14 -16
9442 Weavers, knitters and other fabric making occupations
Job Openings 14 14 13 14 14 14 14 14 14 14
Job Seekers 12 13 13 13 13 14 14 14 14 14
Cumulative Imbalance 2 3 3 4 5 5 5 5 5 5
9445 Fabric, fur and leather cutters
Job Openings 7 7 7 7 7 7 7 7 6 6
Job Seekers 5 5 5 5 5 5 5 5 5 5
Cumulative Imbalance 2 4 6 8 10 12 14 16 17 18
9446 Industrial sewing machine operators
Job Openings 35 36 36 40 40 40 42 42 43 44
Job Seekers 29 30 31 32 32 32 32 32 33 33
Cumulative Imbalance 6 12 17 25 33 41 51 61 71 82
9461 Process control and machine operators, food, beverage and associated products processing
Job Openings 107 106 90 137 118 101 106 97 97 95
Job Seekers 95 97 103 110 116 117 114 113 114 116
Cumulative Imbalance 12 21 8 35 37 21 13 -3 -20 -41
9462 Industrial butchers and meat cutters, poultry preparers and related workers
Job Openings 127 121 98 159 131 105 112 99 97 93
Job Seekers 123 127 135 144 152 153 149 147 149 151
Cumulative Imbalance 4 -2 -39 -24 -45 -93 -130 -178 -230 -288
9463 Fish and seafood plant workers
Job Openings 1 1 1 1 1 1 1 1 1 1
Job Seekers 1 1 1 1 1 1 1 1 1 1
Cumulative Imbalance 0 0 0 0 0 0 0 0 0 0
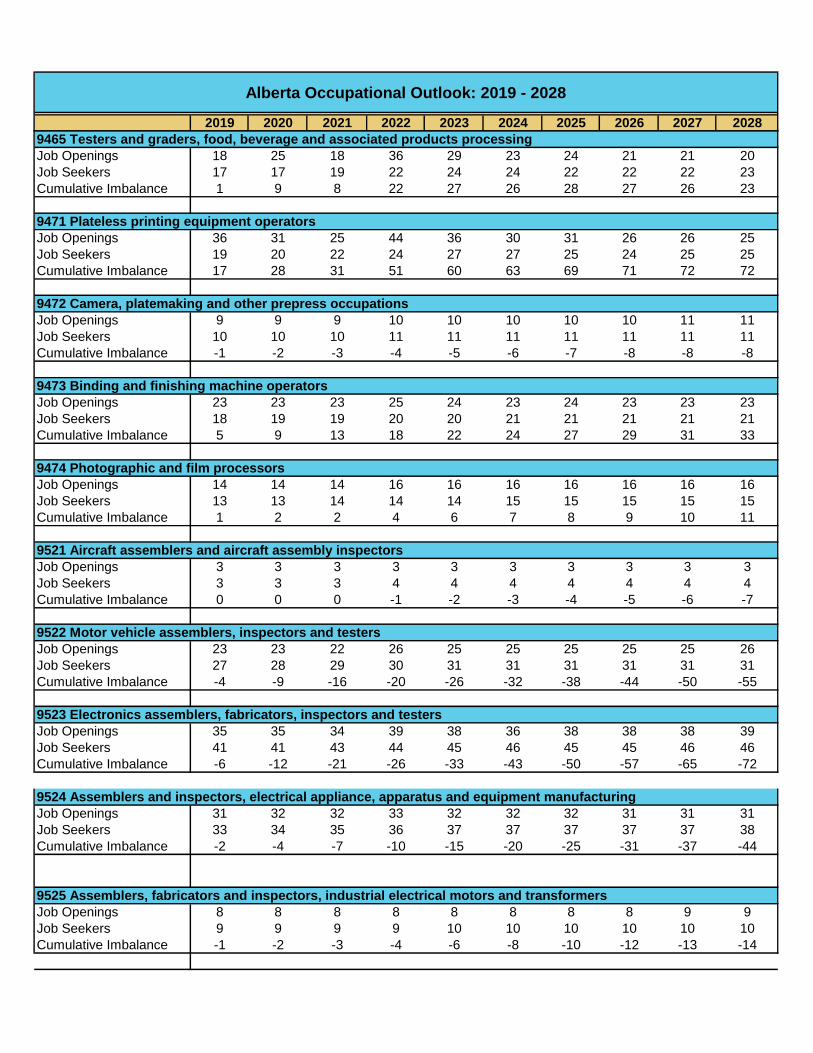
2019 2020 2021 2022 2023 2024 2025 2026 2027 2028
Alberta Occupational Outlook: 2019 - 2028
9465 Testers and graders, food, beverage and associated products processing
Job Openings 18 25 18 36 29 23 24 21 21 20
Job Seekers 17 17 19 22 24 24 22 22 22 23
Cumulative Imbalance 1 9 8 22 27 26 28 27 26 23
9471 Plateless printing equipment operators
Job Openings 36 31 25 44 36 30 31 26 26 25
Job Seekers 19 20 22 24 27 27 25 24 25 25
Cumulative Imbalance 17 28 31 51 60 63 69 71 72 72
9472 Camera, platemaking and other prepress occupations
Job Openings 9 9 9 10 10 10 10 10 11 11
Job Seekers 10 10 10 11 11 11 11 11 11 11
Cumulative Imbalance -1 -2 -3 -4 -5 -6 -7 -8 -8 -8
9473 Binding and finishing machine operators
Job Openings 23 23 23 25 24 23 24 23 23 23
Job Seekers 18 19 19 20 20 21 21 21 21 21
Cumulative Imbalance 5 9 13 18 22 24 27 29 31 33
9474 Photographic and film processors
Job Openings 14 14 14 16 16 16 16 16 16 16
Job Seekers 13 13 14 14 14 15 15 15 15 15
Cumulative Imbalance 1 2 2 4 6 7 8 9 10 11
9521 Aircraft assemblers and aircraft assembly inspectors
Job Openings 3 3 3 3 3 3 3 3 3 3
Job Seekers 3 3 3 4 4 4 4 4 4 4
Cumulative Imbalance 0 0 0 -1 -2 -3 -4 -5 -6 -7
9522 Motor vehicle assemblers, inspectors and testers
Job Openings 23 23 22 26 25 25 25 25 25 26
Job Seekers 27 28 29 30 31 31 31 31 31 31
Cumulative Imbalance -4 -9 -16 -20 -26 -32 -38 -44 -50 -55
9523 Electronics assemblers, fabricators, inspectors and testers
Job Openings 35 35 34 39 38 36 38 38 38 39
Job Seekers 41 41 43 44 45 46 45 45 46 46
Cumulative Imbalance -6 -12 -21 -26 -33 -43 -50 -57 -65 -72
9524 Assemblers and inspectors, electrical appliance, apparatus and equipment manufacturing
Job Openings 31 32 32 33 32 32 32 31 31 31
Job Seekers 33 34 35 36 37 37 37 37 37 38
Cumulative Imbalance -2 -4 -7 -10 -15 -20 -25 -31 -37 -44
9525 Assemblers, fabricators and inspectors, industrial electrical motors and transformers
Job Openings 8 8 8 8 8 8 8 8 9 9
Job Seekers 9 9 9 9 10 10 10 10 10 10
Cumulative Imbalance -1 -2 -3 -4 -6 -8 -10 -12 -13 -14

2019 2020 2021 2022 2023 2024 2025 2026 2027 2028
Alberta Occupational Outlook: 2019 - 2028
9526 Mechanical assemblers and inspectors
Job Openings 33 33 31 38 35 32 33 32 32 32
Job Seekers 39 40 41 43 44 44 44 44 44 45
Cumulative Imbalance -6 -13 -23 -28 -37 -49 -60 -72 -84 -97
9527 Machine operators and inspectors, electrical apparatus manufacturing
Job Openings 5 5 5 6 5 5 5 5 5 6
Job Seekers 6 6 6 6 6 6 6 6 6 6
Cumulative Imbalance -1 -2 -3 -3 -4 -5 -6 -7 -8 -8
9532 Furniture and fixture assemblers and inspectors
Job Openings 30 31 31 34 34 33 34 34 34 35
Job Seekers 31 32 33 34 35 35 35 35 35 35
Cumulative Imbalance -1 -2 -4 -4 -5 -7 -8 -9 -10 -10
9533 Other wood products assemblers and inspectors
Job Openings 37 38 38 39 38 37 38 37 37 37
Job Seekers 41 42 43 45 46 46 46 46 46 47
Cumulative Imbalance -4 -8 -13 -19 -27 -36 -44 -53 -62 -72
9534 Furniture finishers and refinishers
Job Openings 31 31 32 31 32 32 32 32 32 32
Job Seekers 26 26 27 28 29 29 29 29 29 29
Cumulative Imbalance 5 10 15 18 21 24 27 30 33 36
9535 Plastic products assemblers, finishers and inspectors
Job Openings 25 26 25 30 28 27 28 28 28 28
Job Seekers 30 31 32 33 33 34 33 33 34 34
Cumulative Imbalance -5 -10 -17 -20 -25 -32 -37 -42 -48 -54
9536 Industrial painters, coaters and metal finishing process operators
Job Openings 70 77 84 71 73 73 73 74 72 74
Job Seekers 77 78 82 86 89 90 88 88 89 90
Cumulative Imbalance -7 -8 -6 -21 -37 -54 -69 -83 -100 -116
9537 Other products assemblers, finishers and inspectors
Job Openings 105 101 98 118 110 101 103 99 98 99
Job Seekers 94 97 102 108 113 114 111 110 111 113
Cumulative Imbalance 11 15 11 21 18 5 -3 -14 -27 -41
9611 Labourers in mineral and metal processing
Job Openings 26 26 26 27 27 26 27 27 27 28
Job Seekers 33 33 34 35 35 36 36 36 36 36
Cumulative Imbalance -7 -14 -22 -30 -38 -48 -57 -66 -75 -83
9612 Labourers in metal fabrication
Job Openings 65 64 65 68 65 62 63 61 60 60
Job Seekers 75 77 80 84 87 87 86 85 86 87
Cumulative Imbalance -10 -23 -38 -54 -76 -101 -124 -148 -174 -201
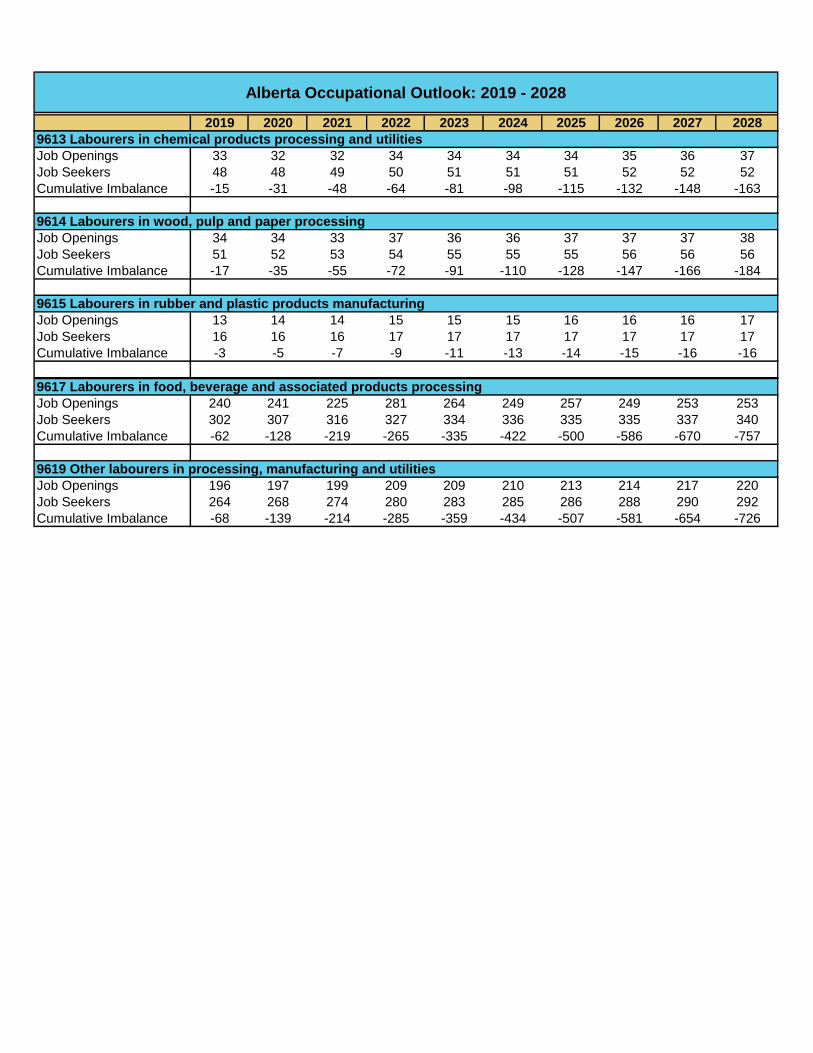
2019 2020 2021 2022 2023 2024 2025 2026 2027 2028
Alberta Occupational Outlook: 2019 - 2028
9613 Labourers in chemical products processing and utilities
Job Openings 33 32 32 34 34 34 34 35 36 37
Job Seekers 48 48 49 50 51 51 51 52 52 52
Cumulative Imbalance -15 -31 -48 -64 -81 -98 -115 -132 -148 -163
9614 Labourers in wood, pulp and paper processing
Job Openings 34 34 33 37 36 36 37 37 37 38
Job Seekers 51 52 53 54 55 55 55 56 56 56
Cumulative Imbalance -17 -35 -55 -72 -91 -110 -128 -147 -166 -184
9615 Labourers in rubber and plastic products manufacturing
Job Openings 13 14 14 15 15 15 16 16 16 17
Job Seekers 16 16 16 17 17 17 17 17 17 17
Cumulative Imbalance -3 -5 -7 -9 -11 -13 -14 -15 -16 -16
9616 Labourers in textile processing
9617 Labourers in food, beverage and associated products processing
Job Openings 240 241 225 281 264 249 257 249 253 253
Job Seekers 302 307 316 327 334 336 335 335 337 340
Cumulative Imbalance -62 -128 -219 -265 -335 -422 -500 -586 -670 -757
9619 Other labourers in processing, manufacturing and utilities
Job Openings 196 197 199 209 209 210 213 214 217 220
Job Seekers 264 268 274 280 283 285 286 288 290 292
Cumulative Imbalance -68 -139 -214 -285 -359 -434 -507 -581 -654 -726