october 2014 assessing biosimilar uptake and competition ... · assessing biosimilar uptake and...
TRANSCRIPT

October 2014
Assessing biosimilar uptake and competition in European markets

Assessing biosimilar uptake and competition in European markets. Report by the IMS Institute for Healthcare Informatics.
1
Introduction
Biologic medicines today account for 27% of the pharmaceutical sales in Europe and are growing at 5.5% vs. total market growth of 1.9% in value sales between 2012 and 2013.1 With many of Europe’s top selling biologic molecules facing patent expiration before 2020 (see Exhibit 1), expectations are high from payers looking to generate savings as these products face direct competition for the first time from biosimilars. These expectations are often built on the savings achieved from small molecule generics (see Appendix 2).
A biosimilar is defined as “a biological medicinal product that contains a version of the active substance of an already authorised original biological medicinal product (reference medicinal product). A biosimilar demonstrates similarity to the reference medicinal product in terms of quality characteristics, biological activity, safety and efficacy based on a comprehensive comparability exercise”.2
1
1 IMS MIDAS, 2013. Europe defined as EU28 plus Norway and Switzerland and excluding Malta and Cyprus where IMS Health does not have an audit. Pharmaceutical sales valued at ex-manufacturer price excluding the impact of rebates and discounts.
2 Draft Guideline on Similar Biological Medicinal Products CHMP/437/04 Rev 1, which, once adopted, will replace guideline CHMP/437/04.
Exhibit 1: Top 10 pharmaceutical products in Europe
PRODUCT TYPE PRODUCT EU VALUE MARKET SHARE EU EXPIRY DATE
BIOLOGIC HUMIRA 1.7% 2018
BIOLOGIC ENBREL 1.2% 2015
NON-BIOLOGIC SERETIDE 1.2%
BIOLOGIC HERCEPTIN 1.1% 2014
BIOLOGIC REMICADE 1.0% EXPIRED
BIOLOGIC MABTHERA 1.0% EXPIRED
BIOLOGIC AVASTIN 1.0% 2019
BIOLOGIC LOVENOX 1.0% EXPIRED
NON-BIOLOGIC LYRICA 0.9%
BIOLOGIC LUCENTIS 0.9% 2016
Source: IMS MIDAS, 2013; based on market sales at ex-manufacturer price before rebates and discounts

INTRODUCTION 2
In such an environment there is strong interest by healthcare stakeholders in the measurement of biosimilar utilization, the factors influencing their uptake, and the impact that biosimilars are having on competition and ultimately cost in the relevant biologic therapy areas.
The introduction of biosimilar versions of certain molecules has occurred progressively across Europe over recent years and are now present in the following four areas:
1. Erythropoietin (EPO) is a glycoprotein hormone that controls erythropoietin, or red blood cell production. It is commonly used in combination with dialysis and oncology treatments.
2. Human growth hormone (HGH), also known as somatropin, is a peptide hormone that stimulates growth, cell reproduction and regeneration in humans. It is used to treat children’s growth disorders and adult growth hormone deficiency.
3. Granulocyte colony-stimulating factor (G-CSF) is a glycoprotein that stimulates the bone marrow to produce granulocytes and stem cells and release them into the bloodstream. G-CSF is used with certain cancer patients to accelerate recovery from neutropenia after chemotherapy, allowing higher-intensity treatment regimens.
4. Anti-tumour necrosis factor (Anti-TNF), specifically the molecule infliximab, which is a mono-clonal antibody used to treat auto-immune diseases such as rheumatoid arthritis, psoriasis and Crohn’s disease.3
The purpose of this report is to summarize the findings of a study undertaken by IMS Health to assess drivers of biosimilar uptake and to measure the impact of biosimilar competition in Europe. This research was funded by the European Federation of Pharmaceutical Industries and Associations (EFPIA). The interpretation of the study results and preparation of this summary was undertaken independently by a team from the IMS Institute for Healthcare Informatics which is part of IMS Health but operates separately and according to its own mission, research agenda and guiding principles.4 The activities undertaken by the Institute were conducted independently and without industry or government funding.
Assessing biosimilar uptake and competition in European markets. Report by the IMS Institute of Healthcare Informatics
3 Biosimilar infliximab was first launched in the European market in October 2013. As there is limited historic data to analyse trends in this market it has been excluded from the report.
4 See page 24 of this report, or visit the IMS Institute website www.theimsinstitute.org
Assessing biosimilar uptake and competition in European markets. Report by the IMS Institute for Healthcare Informatics.
3
5 EU countries not currently covered by IMS Health audits are Malta and Cyprus; furthermore, countries where IMS Health does not currently audit the hospital channel have been excluded (Estonia, Greece, Latvia, Luxembourg and the Netherlands) to accurately reflect market consumption. IMS Health did not audit the Portugal hospital market prior to 2010, and for this reason Portugal is excluded from any analysis looking at historic trends.
Approach and sources
The assessment of biosimilar uptake has been based on longitudinal analysis of the volume and price of relevant products (both original biologics and biosimilars) across European Union (EU) member states, Norway and Switzerland.5 The primary data source is IMS Health country sales audits. These audits track the volume and pricing of small and large molecules, including original biologics and biosimilars across 21 of the 28 EU member states, Norway and Switzerland. Since 2006, biosimilar versions of EPO, HGH and G-CSF have been tracked and reported on a monthly basis in countries where they are marketed.
Volume information is based on channel audits for retail and non-retail channels, which cover the vast majority of volume consumed in a country market, though may exclude some direct sales made from manufacturer to dispensing locations. Pricing information is based on a variety of sources including list price and wholesaler transactions, but does not reflect rebates and discounts which in some countries and channels may be significant. Country volumes may also be impacted by unknown parallel exports or imports which cannot be identified or adjusted for.
Biologics consumption is measured in terms of number of treatment days or defined daily dose (DDD), based on conversion factors maintained and published by the World Health Organization (WHO).

Assessing biosimilar uptake and competition in European markets. Report by the IMS Institute for Healthcare Informatics.
4
Methodology and definitions
Methodology and definitions
A series of metrics was developed for each molecule and each country during the period January 1, 2006, to December 31, 2013. The definitions used were as follows:
• Accessible markets include the following three product categories: 1. Reference Medicinal Product: Original product, granted market exclusivity at the
start of its life, exclusivity is now expired and the product has been referenced.
2. Un-protected non medicinal reference products: Original product, granted market exclusivity at the start of its life, exclusivity is now expired and the product has never been referenced or may have been referenced but the referencing biosimilar has not launched.
3. Biosimilar: Product, granted regulatory approval, demonstrating similarity to the reference medicinal product in terms of quality characteristics, biological activity, safety and efficacy.
• Non-accessible markets include those biologic molecules which have market exclusivity. These are typically second-generation versions of molecules, including long-acting original products.
• Volume measures are based on number of DDD’s applied consistently to each molecule across all countries. Consumption of long and short-acting G-CSFs are not directly comparable using DDDs, and therefore treatment cycles have been used instead. Consumption measures are not adjusted for the indication for which the molecule is used, clinical practice guidelines, patient characteristics or other factors that may result in different volumes utilised on a per patient treatment day basis.
• Biosimilar penetration is calculated based on the volume share of the accessible market taken by the biosimilar product.
• Accessible market price erosion is calculated based on the volume weighted average price of all products within the accessible market compared to the average originator price in 2006, used as a proxy for price prior to loss of exclusivity.
• Treatment market volume development is based on the evolution in the number of treatments from all biologics, including accessible and non-accessible products.
• Medicine cost evolution is based on the change in the total cost (medicine price x volume) across all biologics, including accessible and non-accessible products.

Assessing biosimilar uptake and competition in European markets. Report by the IMS Institute for Healthcare Informatics.
5
Findings
Evolution of medicine price within accessible marketsBiosimilar uptake within accessible markets – comprising of medicinal reference products, un-protected non-medicinal reference products and biosimilars - varies widely between countries and therapy areas (see Exhibit 2). The range of biosimilar penetration for HGH ranges from a low of 2% in Norway to a high of 99% in Poland. EPO biosimilar penetration is in a narrower range, from 1% in Croatia to 62% in Bulgaria. G-CSF biosimilar penetration is lowest in Belgium with 2% share and highest, with nearly 100% share of the accessible market in Croatia, Czech Republic, Hungary and Romania. Similarly, very high ranges of biosimilar penetration are observed between therapy areas in the same country, including Sweden where biosimilar HGH has an 18% share of the volume while biosimilar G-CSF has a share of 81%. (See Appendix 2, Table 1 for detailed results.)
Source: IMS MIDAS 2013
% of treatment days 2013
%100
90
80
70
60
50
40
30
20
10
0
Aust
ria
Belg
ium
Bulg
aria
Croa
tia
Czec
h Re
publ
ic
Den
mar
k
Finl
and
Fran
ce
Ger
man
y
Hun
gary
Irela
nd
Italy
Nor
way
Pola
nd
Port
ugal
Rom
ania
Slov
akia
Slov
enia
Spai
n
Swed
en
Switz
erla
nd
UK
EPOHGH G-CSF
Exhibit 2: Biosimilar penetration of accessible markets
Assessing biosimilar uptake and competition in European markets. Report by the IMS Institute for Healthcare Informatics.
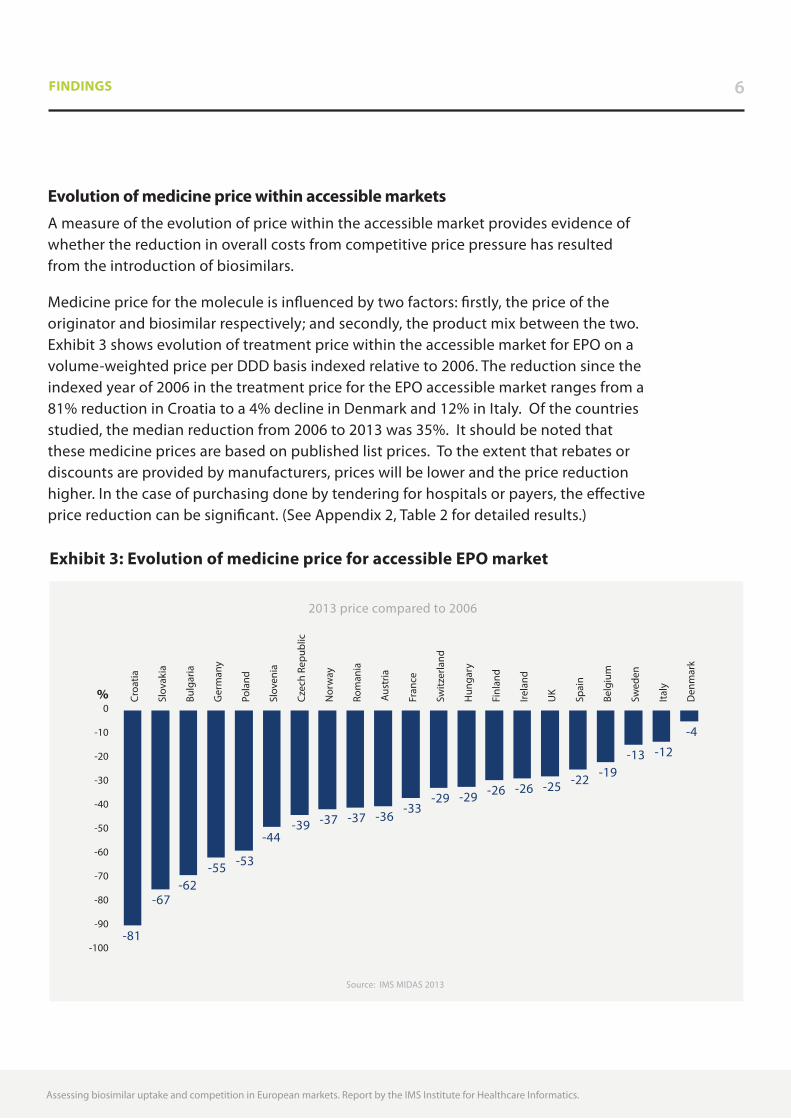
Evolution of medicine price within accessible marketsA measure of the evolution of price within the accessible market provides evidence of whether the reduction in overall costs from competitive price pressure has resulted from the introduction of biosimilars.
Medicine price for the molecule is influenced by two factors: firstly, the price of the originator and biosimilar respectively; and secondly, the product mix between the two. Exhibit 3 shows evolution of treatment price within the accessible market for EPO on a volume-weighted price per DDD basis indexed relative to 2006. The reduction since the indexed year of 2006 in the treatment price for the EPO accessible market ranges from a 81% reduction in Croatia to a 4% decline in Denmark and 12% in Italy. Of the countries studied, the median reduction from 2006 to 2013 was 35%. It should be noted that these medicine prices are based on published list prices. To the extent that rebates or discounts are provided by manufacturers, prices will be lower and the price reduction higher. In the case of purchasing done by tendering for hospitals or payers, the effective price reduction can be significant. (See Appendix 2, Table 2 for detailed results.)
6FINDINGS
Source: IMS MIDAS 2013
2013 price compared to 2006
%0
-10
-20
-30
-40
-50
-60
-70
-80
-90
-100
Croa
tia
Slov
akia
Bulg
aria
Ger
man
y
Pola
nd
Slov
enia
Czec
h Re
publ
ic
Nor
way
Rom
ania
Aust
ria
Fran
ce
Switz
erla
nd
Hun
gary
Finl
and
Irela
nd
UK
Spai
n
Belg
ium
Swed
en
Italy
Den
mar
k
-81
-67-62
-55 -53
-44 -39 -37 -37 -36
-33-29 -29 -26 -26 -25 -22 -19
-13 -12
-4
Exhibit 3: Evolution of medicine price for accessible EPO market

Assessing biosimilar uptake and competition in European markets. Report by the IMS Institute for Healthcare Informatics.
7FINDINGS
Patient access to innovationAn additional measure focuses on the extent to which selected patients are being provided access to those medicines which can bring greater clinical benefit and improved outcomes for their specific needs. This goal of payers and providers is often pursued through the introduction and use of second generation treatments which often command some level of price premium. To the extent that biosimilar introduction is intended to lower accessible market costs, then these savings can be reinvested in providing patient access where appropriate to more expensive treatment options. In the case of EPO, the percentage of total treatment days for which second generation EPOs are used provides a measure of the extent to which this occurs (see Exhibit 4). Second generation molecules are used in 96% of the treatment days in Denmark, but only 17% in Poland. (See Appendix 2, Table 3 for detailed results.)
Source: IMS MIDAS 2013
Second generation EPO as % of total treatment days in 2013
17
31 33 34 36 3741 41 42 44 45
55 57 5963 63 65
78 80
9196
Pola
nd
Italy
Bulg
aria
Czec
h Re
publ
ic
Aust
ria
Rom
ania
Hun
gary
Slov
enia
Spai
n
Slov
akia
Ger
man
y
Croa
tia
Irela
nd
Fran
ce
UK
Belg
ium
Swed
en
Switz
erla
nd
Finl
and
Nor
way
Den
mar
k
%100
90
80
70
60
50
40
30
20
10
0
Exhibit 4: Patient access to innovation in EPO market

Assessing biosimilar uptake and competition in European markets. Report by the IMS Institute for Healthcare Informatics.
FINDINGS 8
Access to treatmentOverall population access to biologic treatment options is an important measure of the extent to which the use of biosimilars contributes to extending patient care to all those who would benefit from treatment. Several factors can influence total treatment volume, including the clinical profile and indications of the biologic, changing disease prevalence and diagnosis rates, and new treatment guidelines that may be precipitated by the availability of more treatment options. There are two useful metrics to monitor this; the first is the growth in the number of treatment days (on a DDD basis) per capita since a base period (see Appendix 2, table 4) and the second is the absolute consumption per capita (see Appendix 2, table 5). For G-CSF’s the absolute consumption in 2006 and 2013 - in both the accessible and non-accessible markets - is shown in Exhibit 5. This illustrates that on an absolute basis consumption and change in consumption varies between countries, with some of the “under-served “markets such as Romania and Slovakia beginning to reach levels of their European peers in 2013.
Source: IMS MIDAS 2013
Number of treatment days per capita
20132006
0
500
1,000
1,500
2,000
2,500
3,000
Bulg
aria
Czec
h Re
publ
ic
Croa
tia
Rom
ania
Den
mar
k
Nor
way
Belg
ium UK
Slov
enia
Switz
erla
nd
Slov
akia
Pola
nd
Ger
man
y
Swed
en
Italy
Spai
n
Irela
nd
Finl
and
Hun
gary
Aust
ria
Fran
ce
Exhibit 5: Treatment consumption in the G-CSF market 2006 and 2013

9
Assessing biosimilar uptake and competition in European markets. Report by the IMS Institute for Healthcare Informatics.
9FINDINGS
Evolution of overall medicine costThe evolution of overall medicine cost – incorporating changes in the treatment price within the accessible market, the use of innovation in the non-accessible market, and overall change in treatment access – provides a useful measure to policymakers and payers of the impact of biosimilar competition overall. Since payers are often operating in a budget constrained environment, the measure can reflect the combination of influences in a way that can compare performance over time, across therapy areas and between countries. In the case of overall medicine cost involving EPO, the results are shown in Exhibit 6, which compares total medicine cost in 2013 to the total in 2006.
Source: IMS MIDAS 2013
2013 medicine cost (price x volume) compared to 2006
46 43 39
10 10 94
-18 -20 -20-26 -26
-30 -31-36 -40 -40 -44
-52-61
-68
Czec
h Re
publ
ic
Italy
Bulg
aria UK
Pola
nd
Den
mar
k
Rom
ania
Finl
and
Slov
akia
Spai
n
Switz
erla
nd
Nor
way
Swed
en
Fran
ce
Irela
nd
Belg
ium
Slov
enia
Hun
gary
Aust
ria
Ger
man
y
Croa
tia
%60
40
20
0
-20
-40
-60
-80
Exhibit 6: Evolution of overall medicine cost for the EPO market

10
Assessing biosimilar uptake and competition in European markets. Report by the IMS Institute for Healthcare Informatics.
10FINDINGS
A broad range of medicine cost evolution for EPO from 2006 to 2013 has occurred across the Europe, ranging from growth of more than 40% in the Czech Republic and Italy, to declines of 40% or more in Belgium, Slovenia, Hungary, Austria, Germany and Croatia.
Overall medicine cost evolution also differs within countries between therapy areas (see Exhibit 7 and Appendix 2, Table 6 for detailed results).
Source: IMS MIDAS 2013
2013 medicine cost (price x volume) compared to 2006
EPOHGH G-CSF
-200
-100
0
100
200
300
400
Aust
ria
Belg
ium
Bulg
aria
Croa
tia
Czec
h
Den
mar
k
Finl
and
Fran
ce
Ger
man
y
Hun
gary
Irela
nd
Italy
Nor
way
Pola
nd
Rom
ania
Slov
akia
Slov
enia
Spai
n
Swed
en
Switz
erla
nd UK
600%%
Exhibit 7: Evolution of overall medicine cost across all markets

Assessing biosimilar uptake and competition in European markets. Report by the IMS Institute for Healthcare Informatics.
11
Limitations
The analysis of biosimilar uptake evolution of patient treatment and medicine cost trends in EU markets as undertaken in this report is subject to limitations of data availability and accuracy, interpretation of treatment practices, and impact of changing market dynamics not captured in the data analyzed.
• Data availability and accuracy as mentioned in the approach and sources section can impact volume measures due to unreported direct sales or parallel exporting. This may be extensive in some individual countries.
• Pricing measures do not reflect rebates and discounts which in some countries and channels are known to be significant. As these also change over time, they can lead to distortions in absolute and relative price during the period of analysis.
• Interpretation of treatment practices is necessarily simplified in order to allow calculations of volume use in a way that is comparable across countries and over time. As a base the WHO DDDs have been used but in some circumstances these have been adjusted to account for treatment cycles e.g. when comparing short acting with long-acting G-CSF. However, no consideration is given to differences in treatment practice, patient profiles or clinical protocols which may result in significant differences in volume measures on a per patient basis. Moreover, no adjustment for country-level epidemiology and level of diagnosis has been made and therefore per capita measures of volume may be of limited in their usefulness.
• The impact of market dynamics not captured in data analyzed and which may change over time are not included in this analysis or interpretation. For example, the impact of pricing or market entry decisions guided by the risk of parallel trade may be significant and subject to change based on relative pricing and exchange rates.
• For all metrics, market evolution has been benchmarked to 2006 as a proxy for the situation before biosimilar entry. However, the timing of entry of biosimilars differs by country and by molecule, and therefore the 2006 benchmark may differ from the actual price or volume in the year immediately prior to the entry of a biosimilar.

Assessing biosimilar uptake and competition in European markets. Report by the IMS Institute for Healthcare Informatics.
1212
Discussion
The role of biologics in patient care is growing in importance as more innovative biologics are launched and market competition expands with the increased availability of biosimilars following the expiry of patents or other forms of market exclusivity. Relevant measures are needed to assess the impact of biosimilars on patient care, payers and health systems.
Biosimilar penetration of the accessible market is only relevant when there is significant price difference between the originator and biosimilar, and where treatment options are limited to the molecule for which biosimilars are available. If the therapy area also has products that have been launched more recently, are still patent protected and which bring differential clinical benefit to patients or segments of patients who do not respond to other therapies, then payers and health systems should more usefully understand the role of biosimilars in the context of the total class of therapeutic options.
The very broad ranges of each measure developed for this study and observed from the data, suggest there are important factors driving biosimilar market performance which play out differently across therapy areas and countries. These factors may be important in assessing the role of biosimilars in bringing sustainability to healthcare systems by balancing the availability, use and cost of biosimilars with the availability, use and cost of original biologics including second-generation innovation patient treatments.
The most important factor is the payer environment, and the specific approaches that payers across European markets have adopted or evolved to influence price and uptake of original biologics and biosimilars. These approaches in turn are often influenced by budgetary or financing measures imposed on healthcare payers and those with responsibility for managing the drug expenditure budget.

Assessing biosimilar uptake and competition in European markets. Report by the IMS Institute for Healthcare Informatics.
1313DISCUSSION
A number of payer archetypes exist across Europe and appear to influence the uptake of biosimilars:
1. Tender model: In this approach, payers implement strict tendering schemes with the objective of achieving the lowest cost for a therapy class. Maximum biosimilar uptake could be achieved when a national single win tender for coverage of the entire therapy area is implemented. Countries exhibiting this archetype include Poland, Norway and Hungary to some degree, although volume exclusivity is not guaranteed to the winner of the blind-bidding process.
2. Hospital or plan purchasing: This approach is typically used where national purchasing does not occur and relies on the ability of hospitals or plans to negotiate with competing manufacturers of biologics. Discounts from list price can be achieved, particularly when negotiating is done at a regional level. Countries exhibiting this approach include Italy, Spain, Germany and UK.
3. Competition driven free market: The archetype involves little to no direct involvement by the payer in setting or negotiating prices. Instead, manufacturers are free to set their own price - below a specific level - and free market competition forces set the final price for the drugs. Countries adopting this approach include Belgium, Finland and Switzerland.
4. Prescribing, substitution and switching guidelines and mandates:6 This archetype can be in isolation or combination with those above which influence price. It is characterized by mechanisms implemented to drive usage through direct mandates or the use of guidelines to recommend the use of a particular product, generally only applicable to naive patients. In this scenario, a biosimilar may be mandated as first choice in therapy, or prescribing guidelines may recommend its use as the preferred first choice treatment. Countries exhibiting this archetype include Denmark.
5 Substitution defined as the practice of dispensing one medicine instead of another equivalent and interchangeable medicine at the pharmacy level without consulting the prescriber. Switching defined as the decision by the treating physician to exchange one medicine for another medicine with the same therapeutic intent in patients who are undergoing treatment. European Commission Consensus Information Paper 2013, What you need to know about biosimilar medicinal products.

Assessing biosimilar uptake and competition in European markets. Report by the IMS Institute for Healthcare Informatics.
DISCUSSION 14
The impact on biosimilar uptake and mix of first and second-generation products can be illustrated by the following examples:
Tender Model examples: Hungary and Poland. Following an initiative by key opinion leaders to increase the use of biosimilars in Hungary, biologics and biosimilars were included in Hungary’s reference price or “preferred pricing” system. This system is used to set reimbursement price through a blind-bidding process for drugs with the same active ingredient. The policy is designed to ensure that products priced at (or only slightly above) the reference price are reimbursed at a higher level than those outside the preferred reference price range. From 2012, “preferred drug status” was applied to biological drugs priced within 10% of the cheapest daily treatment cost. Poland shows a similar trend in the evolution of HGH treatment as a result of the use of tenders for procurement (see Exhibit 8).
Source: IMS MIDAS 2013
% treatment days 2006-2013
%100
90
80
70
60
50
40
30
20
10
0
%100
90
80
70
60
50
40
30
20
10
0
2006 2007 2008 2009 2010 2011 2013 2006 2007 2008 2009 2010 2011 2012 2013
Long active non-referenceproduct (innovation)
Short active non-reference product
Short actingreference product
Short actingreference product
Short acting biosimilar
Hungary G-CSF Poland HGH
Short acting biosimilar
2012
Introduction of tendersystem Q1 2012
Exhibit 8: Evolution of market volume dynamics under tender/blind-bidding procurement systems

Assessing biosimilar uptake and competition in European markets. Report by the IMS Institute for Healthcare Informatics.
DISCUSSION 15
Prescribing Guidelines example: Denmark. In general Denmark has very low cost for traditional treatment areas as low-priced generics are used as first line treatment while more expensive patent protected products are only used when appropriate. However, for EPO’s, the benefit of long-acting has been truly recognized, with 96% of usage based on long-acting. For G-CSF, in 2014 the Danish Council for the Use of Expensive Hospital Medicine (RADS) implemented strict prescribing guidelines, which promoted the use of long-acting G-CSF’s over short-acting for certain indications – for example, following chemotherapy.7 Exhibit 9 illustrates the different consumption patterns of the two areas.
Hospital Purchasing example: Italy. Large variations in uptake occur across Italy due to differences in regulation at the regional level. In some regions biosimilars are advised or mandated for naïve patients (Campania, Dcr 15/03/2012) whereas Lombardia established ‘tender bioequivalence’ between biosimilars and originators on new patients (Dcr 06/07/2011). However, the tendency to dispense through the hospital channel, where large discounts can be secured by payers, has helped encourage biosimilar G-CSF uptake through regional tenders.
Source: IMS MIDAS 2013
% Treatment Days 2006-2013
%100
90
80
70
60
50
40
30
20
10
0
%100
90
80
70
60
50
40
30
20
10
0
2006 2007 2008 2009 2010 2011 2013 2006 2007 2008 2009 2010 2011 2012 2013
EPO G-CSF
2012
Long active non-referenceproduct (innovation)
Short activenon-reference
product
Short actingreferenceproduct
Short actingreferenceproduct
Short actingbiosimilar
Short active non-reference product
Long active non-referenceproduct (innovation)
Exhibit 9: Evolution of market volume dynamics in Denmark
7 www.regioner.dk/sundhed/medicin/rådet+for+anvendelse+af+dyr+sygehusmedicin+rads/behandlingsvejledninger
Assessing biosimilar uptake and competition in European markets. Report by the IMS Institute for Healthcare Informatics.
DISCUSSION 16
In addition to funding and the payer environment there are other factors which could potentially influence the use of biologics, including physician attitudes, competitive actions by manufacturers, the role of pharmacists, and patient input.
Within each country’s health system, physicians display a range of attitudes and behaviors that influence their prescribing of biosimilars for patient treatment in the three therapy areas examined here. Three broad segments can be observed, covering “conservative”, “open-minded” and “enterprising” prescribers:
1. Conservative prescribers: These doctors tend to be late adopters of new technologies, are more likely to follow published clinical treatment guidelines, and may not be aware of or educated on the availability of potential use of biosimilars.
2. Open-minded prescribers: This archetype includes physicians who tend to be the most responsive to new information about treatment options, particularly where experience and knowledge of biologics may be low and educational program can be effective in impacting usage.
3. Enterprising prescribers: This segment of prescribers is most likely to search out information from all sources, and be open to trying different options for patient care including including biosimilars as well as innovative treatments.
In addition to these archetypes of physician attitudes, prescribing behavior may also be influenced or determined by prescribing guidelines, the use of prescribing incentives or penalties, as well as the use of promotional activities by either originator or biosimilar manufacturers, or payers. Moreover, in strict tender markets or those with mandatory substitution, physician choice may be restricted and therefore the impact of physician attitude is minimal in determining the uptake of biosimilars.
Actions taken by manufacturers in specific markets are also observed as having an impact on biosimilar uptake and affecting the competitive environment. These actions are typically driven by the payer environment and an individual company assessment - by both originator and biosimilar manufacturers - of actions that can be taken to maximize their business opportunity. For some, this means an approach to compete through the introduction of innovative products with clear clinical evidence and leading to improvement in the existing standard of care. In those markets where the combination of payers and prescriber actions may slightly favour biosimilars, originators can compete through further product differentiation, promotion efforts based on track record of safety

Assessing biosimilar uptake and competition in European markets. Report by the IMS Institute for Healthcare Informatics.
DISCUSSION 17
and efficacy, and reducing price selectively by tracking or matching biosimilar price levels. Biosimilar manufacturers can be expected to compete aggressively on price while demonstrating the safety and quality of their products.
Pharmacists currently play a limited role in biosimilar uptake across European markets due to restrictions in their ability to substitute a biosimilar for an original biologic, or to substitute between biosimilars.
Patients can also influence the shape of biologic markets and the uptake of biosimilars through their advocacy voice, typically through patient groups that represent the interests of those suffering from certain diseases. Patient groups vary widely across Europe in their degree of organization, their approaches to advocacy and their influence among decision-makers. As the range of disease conditions treated by biologics increases and the number of patients potentially benefiting from their use grows, stronger patient voices can be expected, bringing an important stakeholder to more directly influence the uptake of biosimilars and competition dynamics within therapy areas.
Taken together, these spheres of influence – healthcare and drug budget funding, payers, prescribers, manufacturers and patients – are the major drivers of the relative uptake of biosimilars, both at a country and therapy area level (see Exhibit 10).
Healthcare Budgets and FinancingThe over-arching influence on all healthcare market dynamics
PayersSet the market environment that other stakeholders respond to
Prescribers • Pharmacists • Manufacturers • PatientsActions influenced by financing and payer decisions
Exhibit 10: Spheres of influence on biosimilar uptake
Assessing biosimilar uptake and competition in European markets. Report by the IMS Institute for Healthcare Informatics.
18
Conclusion
The sustainability of medical innovation is a priority for all stakeholders, as is the affordability of healthcare services including the use of medicines. In this context, the extent to which competition exists among multiple providers of medicines – both original and biosimilar – is a critical element in restraining costs over the long term while also providing adequate incentives for manufacturers of both original and biosimilar products. The ongoing investment in research and development to sustain the advances in patient care is predicated in part on the balance between risk and reward and therefore influenced by the evolution of competition within these markets.
Current differences in the use of biosimilars and competition dynamics across European markets are not just explained by epidemiology and disease factors, but instead reflect local adoption of treatment practices and guidelines influenced by funding decisions and payer actions. These decisions are often made in silos, with a narrow focus on medicine costs rather than a broader view that considers the full cost of administering the medicine to patients. Moreover, few healthcare systems manage their costs in a horizontal, disease-based way, in which case both the costs and benefits of specific elements – including medicines – are seen in context. This approach also enables patient outcomes and satisfaction to be more directly factored into decision-making.
Relevant measures and use of real world evidence are needed to bring policy-makers the level of transparency and visibility they need to assess options, make decisions and monitor the results. With respect to the use of biosimilars, these measures may include the appropriate expansion of access to patients who will benefit from biologics, the evolution of medicine cost, as well as the evolution of overall patient treatment cost and health outcomes.

APPENDIX 1 19
Table 1: Biosimilar penetration of accessible markets (% of TD, 2013)
Country HGH EPO G-CSF
AUSTRIA 12% 27% 80%
BELGIUM 9% 0% 2%
BULGARIA 6% 62% 83%
CROATIA 0% 1% 100%
CZECH REPUBLIC 3% 22% 98%
DENMARK 34% 15% 57%
FINLAND 9% 30% 87%
FRANCE 12% 16% 35%
GERMANY 9% 53% 51%
HUNGARY 2% 50% 99%
IRELAND 0% 4% 15%
ITALY 8% 20% 53%
NORWAY 2% 58% 82%
POLAND 99% 21% 71%
PORTUGAL 0% 34% 83%
ROMANIA 28% 13% 100%
SLOVAKIA 0% 66% 96%
SLOVENIA 3% 17% 59%
SPAIN 19% 28% 73%
SWEDEN 18% 53% 91%
SWITZERLAND 4% 4% 35%
UK 5% 20% 73%
Table 2: Evolution of medicine price for accessible market (2013 price compared to 2006)
Country HGH EPO G-CSF
AUSTRIA -5% -36% -42%
BELGIUM -4% -19% -24%
BULGARIA 1% -62% -79%
CROATIA -11% -81% -29%
CZECH REPUBLIC -16% -39% -23%
DENMARK -6% -4% -30%
FINLAND -51% -26% -30%
FRANCE -9% -33% -22%
GERMANY 6% -55% -28%
HUNGARY -11% -29% -37%
IRELAND 9% -26% -21%
ITALY -9% -12% -25%
NORWAY -19% -37% -50%
POLAND -44% -53% -50%
ROMANIA -28% -37% -49%
SLOVAKIA -47% -67% -73%
SLOVENIA -43% -44% -64%
SPAIN -19% -22% -40%
SWEDEN -18% -13% -46%
SWITZERLAND -24% -29% -34%
UK -16% -25% -14%
Assessing biosimilar uptake and competition in European markets. Report by the IMS Institute for Healthcare Informatics.
Appendix 1: Tables of results

APPENDIX 1 20
Assessing biosimilar uptake and competition in European markets. Report by the IMS Institute for Healthcare Informatics.
Table 4: Evolution of treatment volume (2013 volume of treatement days compared to 2006)
Country HGH EPO G-CSF
AUSTRIA 38% -37% 43%
BELGIUM 34% -36% 25%
BULGARIA 26% 189% 373%
CROATIA 122% 53% 70%
CZECH REPUBLIC 87% 132% 17%
DENMARK 37% 15% 43%
FINLAND 44% -5% 42%
FRANCE 25% -1% 47%
GERMANY 26% -28% 46%
HUNGARY 20% -30% 149%
IRELAND 16% -29% 16%
ITALY 48% 52% 49%
NORWAY 20% -12% 65%
POLAND 37% 96% 141%
ROMANIA 378% 76% 759%
SLOVAKIA 72% 91% 322%
SLOVENIA 4% 5% 105%
SPAIN 20% -12% 15%
SWEDEN -11% 10% 106%
SWITZERLAND 67% -10% 38%
UK 27% 24% 92%
Table 3: Patient access to innovation in market (2nd generation product as a % of total treatment days in 2013)
Country HGH EPO G-CSF
AUSTRIA N/A 36% 39%
BELGIUM N/A 63% 60%
BULGARIA N/A 33% 26%
CROATIA N/A 55% 9%
CZECH REPUBLIC N/A 34% 8%
DENMARK N/A 96% 55%
FINLAND N/A 80% 49%
FRANCE N/A 59% 31%
GERMANY N/A 45% 34%
HUNGARY N/A 41% 7%
IRELAND N/A 57% 53%
ITALY N/A 31% 22%
NORWAY N/A 91% 57%
POLAND N/A 17% 26%
ROMANIA N/A 37% 25%
SLOVAKIA N/A 44% 39%
SLOVENIA N/A 41% 31%
SPAIN N/A 42% 9%
SWEDEN N/A 65% 11%
SWITZERLAND N/A 78% 30%
UK N/A 63% 16%

21
Assessing biosimilar uptake and competition in European markets. Report by the IMS Institute for Healthcare Informatics.
APPENDIX 1
Table 6: Evolution of overall medicine cost (2013 medicine cost (price x volume) compared to 2006)
Country HGH EPO G-CSF
AUSTRIA 35% -52% 14%
BELGIUM 38% -40% 62%
BULGARIA 20% 39% 179%
CROATIA 95% -68% 53%
CZECH REPUBLIC 61% 46% 3%
DENMARK 33% 9% 155%
FINLAND -27% -18% 44%
FRANCE 18% -31% 22%
GERMANY 34% -61% 49%
HUNGARY 5% -44% 20%
IRELAND 38% -36% 40%
ITALY 38% 43% 36%
NORWAY 6% -26% 55%
POLAND -14% 10% 213%
ROMANIA 224% 4% 600%
SLOVAKIA -8% -20% 185%
SLOVENIA -39% -40% 61%
SPAIN 3% -20% -18%
SWEDEN -23% 30% 6%
SWITZERLAND 37% -26% 30%
UK 13% 10% 98%
Table 5: Treatment volume (2013 volume of treatement days/capita)
Country HGH EPO G-CSF
2006 2013 2006 2013 2006 2013
AUSTRIA 3,203 4,427 49,823 39,554 1,973 2,824
BELGIUM 7,713 10,373 45,426 19,484 1,121 1,397
BULGARIA 1,089 1,374 9,086 17,586 90 427
CROATIA 1,950 4,335 11,312 7,840 325 554
CZECH REPUBLIC 6,176 11,528 4,509 6,890 421 492
DENMARK 9,593 13,161 17,698 1,765 645 920
FINLAND 6,293 9,038 13,077 6,533 1,386 1,970
FRANCE 10,221 12,821 45,073 37,526 1,919 2,829
GERMANY 6,246 7,899 23,657 15,440 1,113 1,623
HUNGARY 4,332 5,204 30,667 16,912 836 2,080
IRELAND 5,360 6,219 35,048 16,861 1,703 1,968
ITALY 6,900 10,217 42,838 71,393 1,260 1,872
NORWAY 13,150 15,796 6,139 1,895 654 1,077
POLAND 4,217 5,761 1,836 4,283 674 1,622
ROMANIA 1,181 5,644 15,449 17,089 96 821
SLOVAKIA 4,065 7,006 26,656 30,261 367 1,548
SLOVENIA 5,534 5,759 37,588 30,814 709 1,453
SPAIN 10,147 12,197 43,989 37,847 1,667 1,922
SWEDEN 16,546 14,763 33,067 20,727 875 1,807
SWITZERLAND 5,212 8,698 21,585 7,944 1,096 1,515
UK 4,105 5,233 12,532 10,040 746 1,429

APPENDIX 2 22
Appendix 2: Learnings from the small molecule generics market
The EMA has stated that: “by definition, similar biological medicinal products are not generic medicinal products [emphasis added], since it could be expected that there may be subtle differences between similar biological medicinal products from different manufacturers or compared with reference products, which may not be fully apparent until greater experience in their use has been established. Therefore, in order to support pharmacovigilance monitoring, the specific medicinal product given to the patient should be clearly identified.”8
Even if biosimilars are not the same as small molecule generics, it can be useful to assess the parallels between the two market types. When discussing the high volume penetration and large price reduction which is said to occur following the loss of exclusivity of generic small molecules, this is, in reality, is mainly applicable to a limited number of large volume oral solid molecules which attract a high number of competitors. The total picture is often different and generic penetration is not necessarily an accurate proxy for price reductions. The is particularly true for formulations or therapies where patient switches are typically not recommended by clinical guidelines e.g. inhalers or CNS drugs such as anti-epileptics, or where there are low levels of competition.
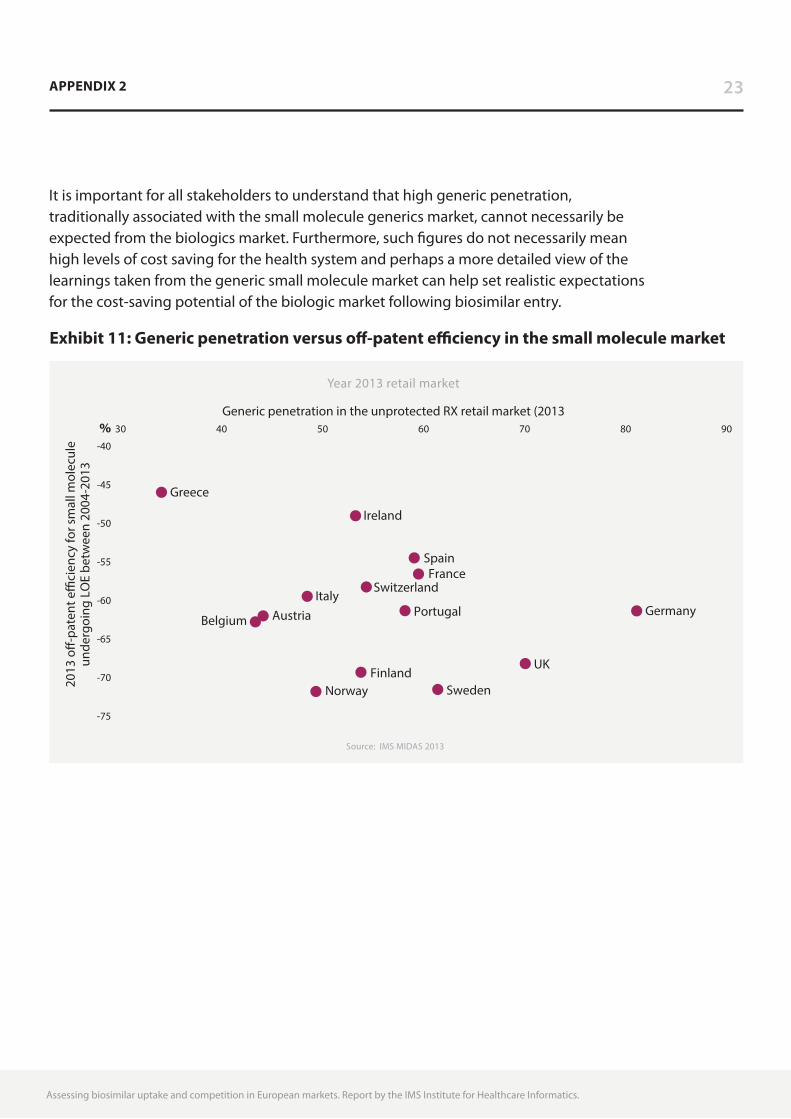
A better measure is off-patent efficiency, defined as “as the extent to which markets reduce spending post-patent expiry compared to pre-expiry pricing levels”,9 taking into account total cost and the product mix. In Europe this varies between -46% in Greece and -72%% in Norway in 2013, and may differ significantly from generic penetration measures (see Exhibit 11). For example, both the UK and Norway are highly efficient at generating cost reduction following loss of exclusivity, however, generic penetration in Norway is significantly lower than in the UK. Taking another example, similar generic penetration is seen between Ireland and Finland, however overall efficiency in Ireland is much lower.
Assessing biosimilar uptake and competition in European markets. Report by the IMS Institute for Healthcare Informatics.
8 EMA, Guideline on similar biological medicine products CHMP/437/04
9 IMS Institute for Healthcare Informatics Harbingers of Change in Healthcare: implication for the role and use of medicines, 2014
Assessing biosimilar uptake and competition in European markets. Report by the IMS Institute for Healthcare Informatics.
APPENDIX 2 23
It is important for all stakeholders to understand that high generic penetration, traditionally associated with the small molecule generics market, cannot necessarily be expected from the biologics market. Furthermore, such figures do not necessarily mean high levels of cost saving for the health system and perhaps a more detailed view of the learnings taken from the generic small molecule market can help set realistic expectations for the cost-saving potential of the biologic market following biosimilar entry.
Source: IMS MIDAS 2013
2013
o�-
pate
nt e
�ci
ency
for s
mal
l mol
ecul
eun
derg
oing
LO
E be
twee
n 20
04-2
013
Year 2013 retail market
%-40
-45
-50
-55
-60
-65
-70
-75
30 40 50 60 70 80 90
Generic penetration in the unprotected RX retail market (2013
Norway Sweden
UK
Belgium Austria Germany Portugal Italy
Switzerland France
Spain
Ireland
Greece
Finland
Exhibit 11: Generic penetration versus off-patent efficiency in the small molecule market
24
Assessing biosimilar uptake and competition in European markets. Report by the IMS Institute of Healthcare Informatics.
About the Institute
The IMS Institute for Healthcare Informatics leverages collaborative relationships in the public and private sectors to strengthen the vital role of information in advancing healthcare globally. Its mission is to provide key policy setters and decision makers in the global health sector with unique and transformational insights into healthcare dynamics derived from granular analysis of information.
Fulfilling an essential need within healthcare, the Institute delivers objective, relevant insights and research that accelerate understanding and innovation critical to sound decision making and improved patient care. With access to IMS Health’s extensive global data assets and analytics, the Institute works in tandem with a broad set of healthcare stakeholders, including government agencies, academic institutions, the life sciences industry and payers, to drive a research agenda dedicated to addressing today’s healthcare challenges.
By collaborating on research of common interest, it builds on a long-standing and extensive tradition of using IMS Health information and expertise to support the advancement of evidence-based healthcare around the world.
25ABOUT THE INSTITUTE
Research Agenda
The research agenda for the Institute centers on five areas considered vital to the advancement of healthcare globally:
The effective use of information by healthcare stakeholders globally to improve health outcomes, reduce costs and increase access to available treatments.
Optimizing the performance of medical care through better understanding of disease causes, treatment consequences and measures to improve quality and cost of healthcare delivered to patients.
Understanding the future global role for biopharmaceuticals, the dynamics that shape the market and implications for manufacturers, public and private payers, providers, patients, pharmacists and distributors.
Researching the role of innovation in health system products, processes and delivery systems, and the business and policy systems that drive innovation.
Informing and advancing the healthcare agendas in developing nations through information and analysis.
Guiding Principles
The Institute operates from a set of Guiding Principles:
The advancement of healthcare globally is a vital, continuous process.
Timely, high-quality and relevant information is critical to sound healthcare decision making.
Insights gained from information and analysis should be made widely available to healthcare stakeholders.
Effective use of information is often complex, requiring unique knowledge and expertise.
The ongoing innovation and reform in all aspects of healthcare require a dynamic approach to understanding the entire healthcare system.
Personal health information is confidential and patient privacy must be protected.
The private sector has a valuable role to play in collaborating with the public sector related to the use of healthcare data.
Assessing biosimilar uptake and competition in European markets. Report by the IMS Institute for Healthcare Informatics.

IMS Institute for Healthcare Informatics, 100 IMS Drive, Parsippany, NJ 07054 [email protected] www.theimsinstitute.org