october 2018 oct. 2018 - creb.com 2018 calgary... · monthly statistics package. city of calgary ....
TRANSCRIPT

Oct. 2018October 2018

MONTHLY STATISTICS PACKAGE
City of Calgary Oversupplied market weighs on prices Oct. 2018
HOUSING MARKET FACTSDetached• Detached sales in October totalled 829 units, for a 8.6-per-cent
decline, resulting in a year-to-date decline of 15 per cent. This is the slowest level of detached sales since the late ’90s.
• Year-to-date, the largest decline in sales occurred in the $600,000 – $999,999 price range, reflecting slow demand coming from move-up buyers.
• For the second month in a row, new-listing growth eased, helping prevent further inventory gains. However, as this segment remains oversupplied, prices continue to trend down.
• Detached benchmark prices totalled $490,200 in October. This is below last month and three per cent below last year. On a year-to-date basis, prices remain one per cent below last year’s levels.
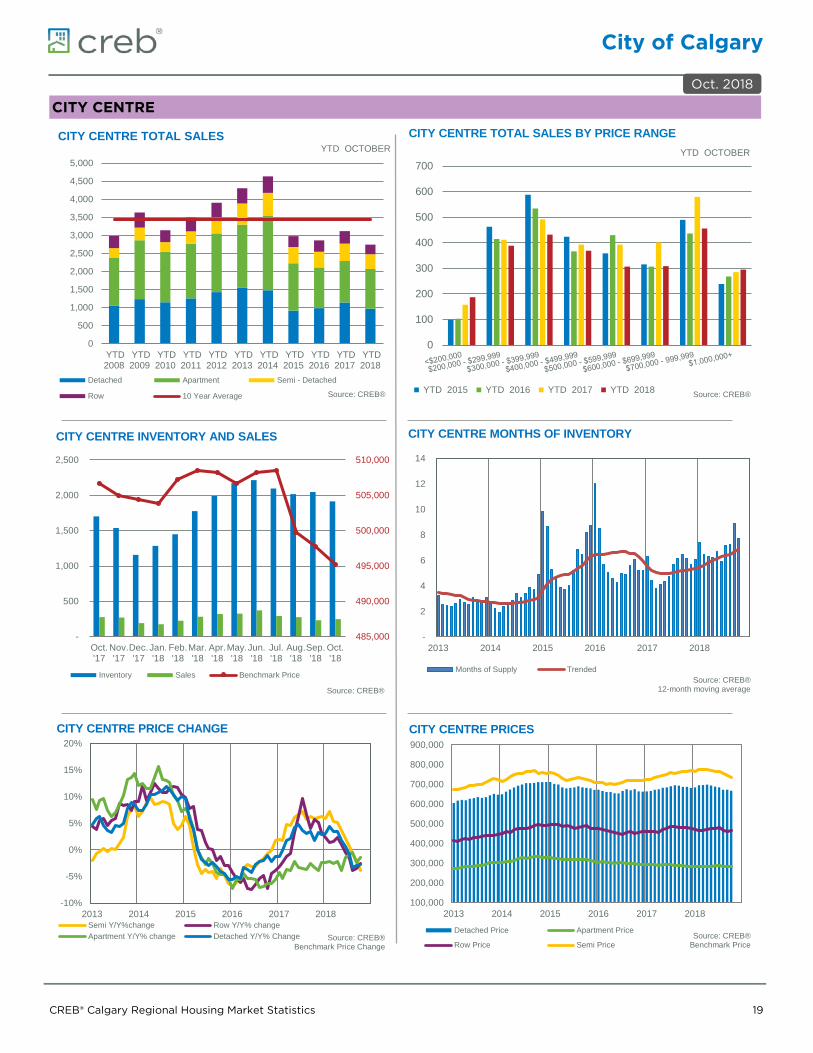
• As of October, year-over-year prices have eased across all districts, with the largest declines occurring in the North East, North West, South and South East districts. This is likely a result of added competition from the new-home sector.
Apartment• Year-to-date apartment sales have totalled 2,316 units, nearly
seven per cent below last year. New listings have also eased by six per cent, helping reduce the amount of inventory in the market.
• Despite the easing inventories, the months of supply remains elevated at 7 months.
• Year-to-date apartment condominium prices have eased by 2.8 per cent and remain 14 per cent below 2014 highs. Declines occurred across all districts, with the steepest declines occurring in the North East, East and South districts.
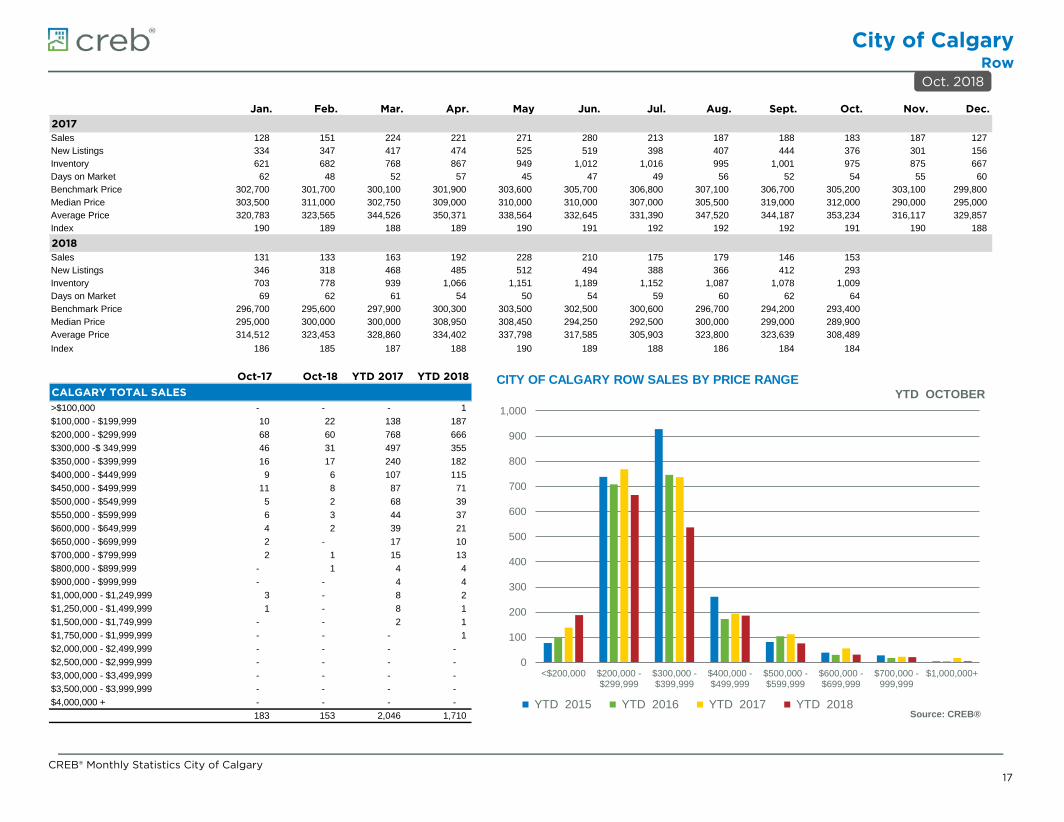
Attached• The attached sector has recorded year-to-date sales of 3,098. This
is 15 per cent below last year and 14 per cent below long-term averages.
• Meanwhile, despite recent easing in new listings, October inventories are the highest level on record.
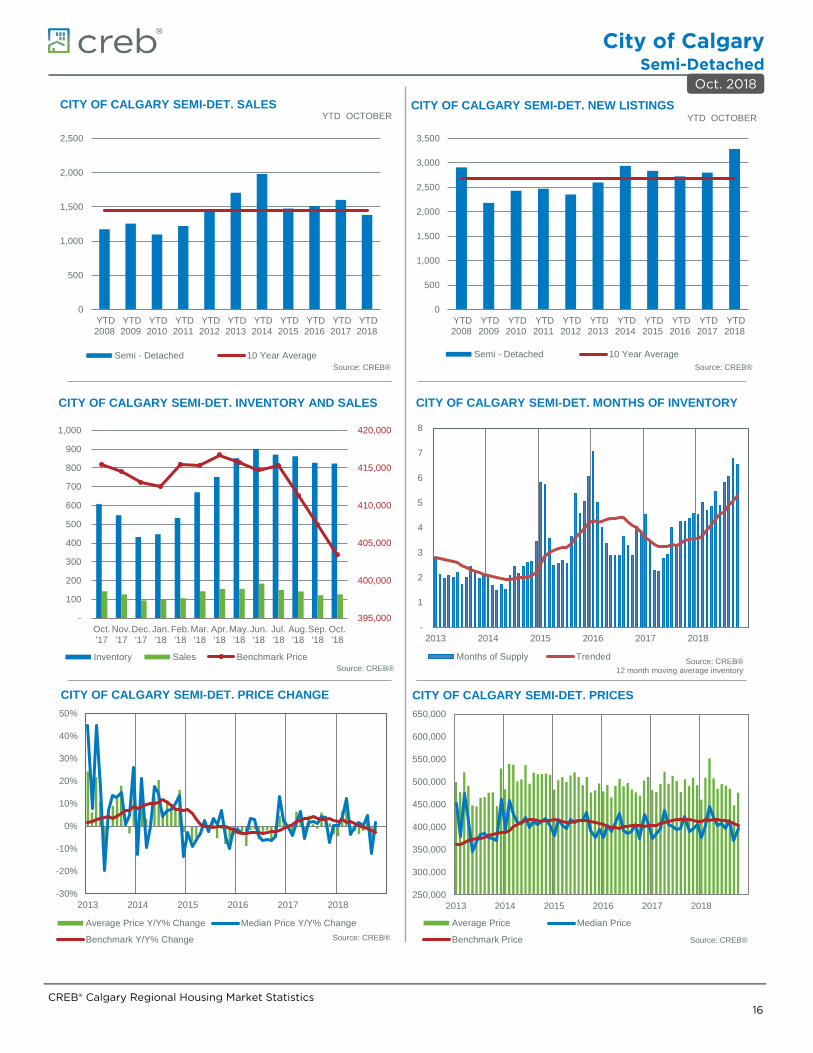
• The oversupply is affecting both the semi-detached and row sectors, which have seen prices trend down over the past 5 months.
• Year-to-date, row benchmark prices have averaged $298,140 this year, nearly two per cent below last year and nine per cent below previous highs. However, prices have remained relatively flat in both the City Centre and North West districts.
• As of October, semi-detached prices were $403,400, one per cent lower than last month and nearly three per cent lower than last year. Despite recent declines, year-to-date citywide prices remain relatively flat compared to last year. This was most due to gains in the City Centre, North East and East districts offsetting declines in the North West, South and South East.
-20%-10%0%10%20%30%40%50%60%70%
0123456789
10
2005 2006 2007 2008 2009 2010 2011 2012 2013 2014 2015 2016 2017 2018
RESIDENTIALMONTHS OF SUPPLY AND PRICE CHANGES
Months of Supply Trended Y/Y Benchmark Price Change Source: CREB®
City of Calgary, November 1, 2018 – Elevated inventory levels compared to sales, are causing prices to ease further in Calgary’s housing market.
Citywide benchmark prices totalled $426,300 in October, trending down for the fifth consecutive month and resulting in a year-over-year decline of 2.9 per cent.
“Job growth in this city remains a concern, as unemployment levels remain well above levels expected for this year. Rising costs of ownership also continue to weigh on housing demand,” said CREB® chief economist Ann-Marie Lurie.
“At the same time, housing supply levels are not adjusting fast enough to current conditions, resulting in price adjustments.”
Inventories and sales totalled 7,345 and 1,322 in October. This has resulted in months of supply of 5.6, above levels typical for this month. While some easing in new listing growth will help prevent further inventory gains, inventory levels remain near record highs for the month of October.
“With these types of market conditions, many potential buyers should be able to find the home that they are looking for with well priced listings appearing in certain price ranges,” said CREB® president Tom Westcott. “Sellers need to manage expectations and have accurate data in order to be aware of what is selling in their community.”
For each of the property types, sales activity has improved in the lower price ranges, leaving most of those segments relatively balanced. However, the upper end of the ranges has seen significant gains in supply compared to demand, which is likely having more of an impact on prices in those ranges.
CREB® Monthly Statistics City of Calgary 2
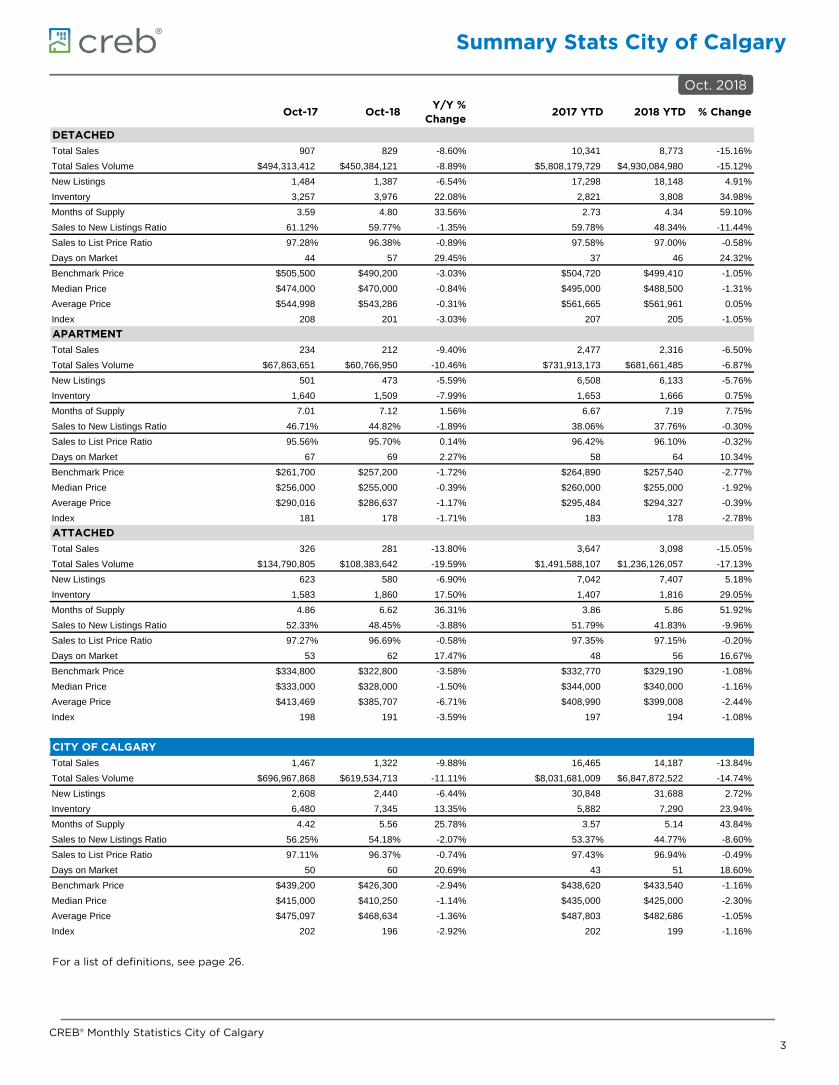
Summary Stats City of Calgary
Oct-17 Oct-18Y/Y %
Change2017 YTD 2018 YTD % Change
DETACHEDTotal Sales 907 829 -8.60% 10,341 8,773 -15.16%Total Sales Volume $494,313,412 $450,384,121 -8.89% $5,808,179,729 $4,930,084,980 -15.12%New Listings 1,484 1,387 -6.54% 17,298 18,148 4.91%Inventory 3,257 3,976 22.08% 2,821 3,808 34.98%Months of Supply 3.59 4.80 33.56% 2.73 4.34 59.10%Sales to New Listings Ratio 61.12% 59.77% -1.35% 59.78% 48.34% -11.44%Sales to List Price Ratio 97.28% 96.38% -0.89% 97.58% 97.00% -0.58%Days on Market 44 57 29.45% 37 46 24.32%Benchmark Price $505,500 $490,200 -3.03% $504,720 $499,410 -1.05%Median Price $474,000 $470,000 -0.84% $495,000 $488,500 -1.31%Average Price $544,998 $543,286 -0.31% $561,665 $561,961 0.05%Index 208 201 -3.03% 207 205 -1.05%APARTMENTTotal Sales 234 212 -9.40% 2,477 2,316 -6.50%Total Sales Volume $67,863,651 $60,766,950 -10.46% $731,913,173 $681,661,485 -6.87%New Listings 501 473 -5.59% 6,508 6,133 -5.76%Inventory 1,640 1,509 -7.99% 1,653 1,666 0.75%Months of Supply 7.01 7.12 1.56% 6.67 7.19 7.75%Sales to New Listings Ratio 46.71% 44.82% -1.89% 38.06% 37.76% -0.30%Sales to List Price Ratio 95.56% 95.70% 0.14% 96.42% 96.10% -0.32%Days on Market 67 69 2.27% 58 64 10.34%Benchmark Price $261,700 $257,200 -1.72% $264,890 $257,540 -2.77%Median Price $256,000 $255,000 -0.39% $260,000 $255,000 -1.92%Average Price $290,016 $286,637 -1.17% $295,484 $294,327 -0.39%Index 181 178 -1.71% 183 178 -2.78%ATTACHEDTotal Sales 326 281 -13.80% 3,647 3,098 -15.05%Total Sales Volume $134,790,805 $108,383,642 -19.59% $1,491,588,107 $1,236,126,057 -17.13%New Listings 623 580 -6.90% 7,042 7,407 5.18%Inventory 1,583 1,860 17.50% 1,407 1,816 29.05%Months of Supply 4.86 6.62 36.31% 3.86 5.86 51.92%Sales to New Listings Ratio 52.33% 48.45% -3.88% 51.79% 41.83% -9.96%Sales to List Price Ratio 97.27% 96.69% -0.58% 97.35% 97.15% -0.20%Days on Market 53 62 17.47% 48 56 16.67%Benchmark Price $334,800 $322,800 -3.58% $332,770 $329,190 -1.08%Median Price $333,000 $328,000 -1.50% $344,000 $340,000 -1.16%Average Price $413,469 $385,707 -6.71% $408,990 $399,008 -2.44%Index 198 191 -3.59% 197 194 -1.08%
CITY OF CALGARYTotal Sales 1,467 1,322 -9.88% 16,465 14,187 -13.84%Total Sales Volume $696,967,868 $619,534,713 -11.11% $8,031,681,009 $6,847,872,522 -14.74%New Listings 2,608 2,440 -6.44% 30,848 31,688 2.72%Inventory 6,480 7,345 13.35% 5,882 7,290 23.94%Months of Supply 4.42 5.56 25.78% 3.57 5.14 43.84%Sales to New Listings Ratio 56.25% 54.18% -2.07% 53.37% 44.77% -8.60%Sales to List Price Ratio 97.11% 96.37% -0.74% 97.43% 96.94% -0.49%Days on Market 50 60 20.69% 43 51 18.60%Benchmark Price $439,200 $426,300 -2.94% $438,620 $433,540 -1.16%Median Price $415,000 $410,250 -1.14% $435,000 $425,000 -2.30%Average Price $475,097 $468,634 -1.36% $487,803 $482,686 -1.05%Index 202 196 -2.92% 202 199 -1.16%
For a list of definitions, see page 26.
Oct. 2018
CREB® Monthly Statistics City of Calgary 3

Summary Stats City of Calgary
Oct-17 Oct-18Y/Y %
Change2017 YTD 2018 YTD % Change
CITY OF CALGARY SEMI-DETACHED
Total Sales 143 126 -11.89% 1,601 1,383 -13.62%
Total Sales Volume $70,148,990 $59,972,800 -14.51% $797,251,264 $681,000,256 -14.58%
Share of Sales with Condo Title 21.68% 16.67% -5.01% 16.77% 16.30% -0.47%
New Listings 247 279 12.96% 2,800 3,282 17.21%
Inventory 607 823 35.58% 518 754 45.47%
Months of Supply 4.24 6.53 53.88% 3.24 5.45 68.39%
Sales to New Listings Ratio 57.89% 45.16% -12.73% 57.18% 42.14% -15.04%
Sales to List Price Ratio 97.44% 96.86% -0.58% 97.50% 97.33% -0.18%
Days on Market 52 60 15.65% 45 52 15.56%
Benchmark Price $415,500 $403,400 -2.91% $411,540 $412,780 0.30%
Median Price $390,000 $396,750 1.73% $404,900 $402,500 -0.59%
Average Price $490,552 $475,975 -2.97% $497,971 $492,408 -1.12%
Index 210 204 -2.90% 208 209 0.30%
CITY OF CALGARY ROW
Total Sales 183 153 -16.39% 2,046 1,710 -16.42%
Total Sales Volume $64,641,815 $47,198,842 -26.98% $694,336,843 $551,683,801 -20.55%
Share of Sales with Condo Title 93.44% 89.54% -3.90% 94.81% 92.99% -1.82%
New Listings 376 293 -22.07% 4,241 4,082 -3.75%
Inventory 975 1,009 3.49% 889 1,015 14.25%
Months of Supply 5.33 6.59 23.78% 4.34 5.94 36.70%
Sales to New Listings Ratio 48.67% 52.22% 3.55% 48.24% 41.89% -6.35%
Sales to List Price Ratio 97.09% 96.47% -0.62% 97.17% 96.95% -0.22%
Days on Market 54 64 19.77% 51 59 15.69%
Benchmark Price $305,200 $293,400 -3.87% $304,150 $298,140 -1.98%
Median Price $312,000 $289,900 -7.08% $310,000 $300,000 -3.23%
Average Price $353,234 $308,489 -12.67% $339,363 $322,622 -4.93%
Index 191 184 -3.87% 190 187 -1.97%
CITY OF CALGARY ATTACHED
Total Sales 326 281 -13.80% 3,647 3,098 -15.05%
Total Sales Volume $134,790,805 $108,383,642 -19.59% $1,491,588,107 $1,236,126,057 -17.13%
Share of Sales with Condo Title 61.96% 56.23% -9.26% 60.67% 58.58% -3.45%
New Listings 623 580 -6.90% 7,042 7,407 5.18%
Inventory 1,583 1,860 17.50% 1,407 1,816 29.05%
Months of Supply 4.86 6.62 36.31% 3.86 5.86 51.92%
Sales to New Listings Ratio 52.33% 48.45% -3.88% 51.79% 41.83% -9.96%
Sales to List Price Ratio 97.27% 96.69% -0.58% 97.35% 97.15% -0.20%
Days on Market 53 62 17.47% 48 56 16.67%
Benchmark Price $334,800 $322,800 -3.58% $332,770 $329,190 -1.08%
Median Price $333,000 $328,000 -1.50% $344,000 $340,000 -1.16%
Average Price $413,469 $385,707 -6.71% $408,990 $399,008 -2.44%
Index 198 191 -3.59% 197 194 -1.08%
For a list of definitions, see page 26.
Oct. 2018
CREB® Monthly Statistics City of Calgary 4

Calgary Districts
October 2018 SalesNew Listings
Sales to New Listings Ratio Inventory
Months of Supply Benchmark Price
Year-over-year benchmark price change
Month-over-month benchmark price change
DetachedCity Centre 86 160 53.75% 566 6.58 $667,500 -2.77% -0.73%North East 97 177 54.80% 434 4.47 $364,800 -4.50% -0.84%North 126 162 77.78% 524 4.16 $424,500 -2.55% -0.31%North West 120 230 52.17% 558 4.65 $527,000 -3.73% 0.00%West 75 136 55.15% 469 6.25 $720,800 -2.21% 0.60%South 175 281 62.28% 784 4.48 $461,900 -3.19% -1.43%South East 126 206 61.17% 535 4.25 $436,100 -3.09% -0.77%East 25 38 65.79% 105 4.20 $344,200 -2.91% -1.69%
TOTAL CITY 829 1,387 59.77% 3,976 4.80 $490,200 -3.03% -0.59%
ApartmentCity Centre 104 237 43.88% 774 7.44 $283,000 -1.53% 0.11%North East 13 21 61.90% 65 5.00 $228,100 -1.26% -0.22%North 6 31 19.35% 91 15.17 $210,800 -5.81% 1.44%North West 23 47 48.94% 123 5.35 $239,500 -2.13% -1.76%West 17 45 37.78% 169 9.94 $241,400 -1.99% -0.58%South 28 54 51.85% 160 5.71 $228,000 -1.85% 0.57%South East 17 32 53.13% 99 5.82 $249,300 0.00% 1.76%East 4 6 66.67% 28 7.00 $187,200 -3.01% -0.48%
TOTAL CITY 212 473 44.82% 1,509 7.12 $257,200 -1.72% 0.00%
Semi-detachedCity Centre 41 102 40.20% 356 8.68 $734,600 -3.91% -1.61%North East 11 35 31.43% 82 7.45 $291,000 -3.61% -0.14%North 13 29 44.83% 63 4.85 $330,000 3.06% 0.46%North West 16 18 88.89% 65 4.06 $380,500 -2.93% -0.81%West 10 29 34.48% 83 8.30 $502,500 -3.59% -1.18%South 16 28 57.14% 72 4.50 $322,500 -4.27% -1.23%South East 13 23 56.52% 67 5.15 $310,800 -3.33% -0.54%East 6 15 40.00% 35 5.83 $291,700 -2.47% -0.78%
TOTAL CITY 126 279 45.16% 823 6.53 $403,400 -2.91% -0.98%
RowCity Centre 16 57 28.07% 203 12.69 $466,700 -2.57% 0.82%North East 28 34 82.35% 108 3.86 $194,900 -6.43% 0.05%North 23 45 51.11% 146 6.35 $252,700 -5.32% -1.79%North West 24 24 100.00% 83 3.46 $304,500 -1.33% -1.55%West 15 50 30.00% 171 11.40 $332,600 -4.56% 1.50%South 26 40 65.00% 144 5.54 $250,800 -6.52% -0.63%South East 15 36 41.67% 127 8.47 $291,100 -1.59% -0.58%East 8 8 100.00% 28 3.50 $172,000 -9.14% 1.06%
TOTAL CITY 153 293 52.22% 1,009 6.59 $293,400 -3.87% -0.27%
*Total city figures can include activity from areas not yet represented by a community / district
Oct. 2018
CREB® Monthly Statistics City of Calgary 5

District Trends
0
500
1,000
1,500
2,000
2,500
Oct.'04
Oct.'05
Oct.'06
Oct.'07
Oct.'08
Oct.'09
Oct.'10
Oct.'11
Oct.'12
Oct.'13
Oct.'14
Oct.'15
Oct.'16
Oct.'17
Oct.'18
TOTAL SALES
City Centre South East South West North West North North East East Source: CREB®
OCTOBER
-
2.0
4.0
6.0
8.0
10.0
12.0
14.0
16.0
Detached Apartment Semi - Detached Row
MONTHS OF SUPPLY
City Centre South East South West North West North North East East Calgary Source: CREB®
OCTOBER
0
1,000
2,000
3,000
4,000
5,000
6,000
7,000
8,000
9,000
Oct.'04
Oct.'05
Oct.'06
Oct.'07
Oct.'08
Oct.'09
Oct.'10
Oct.'11
Oct.'12
Oct.'13
Oct.'14
Oct.'15
Oct.'16
Oct.'17
Oct.'18
TOTAL INVENTORY
City Centre South East South West North West North North East East Source: CREB®
OCTOBER
Oct. 2018
CREB® Monthly Statistics City of Calgary 6

Price Comparisons
TYPICAL HOME ATTRIBUTES - DETACHED HOMES
City Centre North East North
North West West South
South East East
City of Calgary
Gross Living Area (Above Ground) 1,233 1,170 1,338 1,501 1,703 1,365 1,468 1,091 1,341Lot Size 5,528 4,070 4,396 5,328 5,625 5,242 4,273 4,805 4,908Above Ground Bedrooms 2 3 3 3 3 3 3 3 3Year Built 1951 1985 1997 1994 1997 1983 1999 1974 1991Full Bathrooms 2 2 2 2 2 2 2 2 2Half Bathrooms 0 1 1 1 1 1 1 0 1
-
100,000
200,000
300,000
400,000
500,000
600,000
700,000
800,000
Detached Apartment Semi - Detached Row Total Residential
BENCHMARK PRICE - OCTOBER
City Centre North East North North West West South South East East CalgarySource: CREB®
-10%
-8%
-6%
-4%
-2%
0%
2%
4%
Detached Apartment Semi - Detached Row Total Residential
YEAR OVER YEAR PRICE GROWTH COMPARISON - OCTOBER
City Centre North East North North West West South South East East Calgary
Source: CREB®
Oct. 2018
CREB® Monthly Statistics City of Calgary 7

District Graphs
0
200
400
600
800
1,000
1,200
1,400
1,600
<$200,000 $200,000 -$299,999
$300,000 -$399,999
$400,000 -$499,999
$500,000 -$599,999
$600,000 -$699,999
$700,000 -999,999
$1,000,000+
TOTAL INVENTORY BY PRICE RANGE - OCTOBER
City Centre North East North North West West South South East EastSource: CREB®
8697
126 120
75
175
126
25
104
13
6 23
17
28
17
41
11
1316
10
16
13
16
2823
24
15
26
15
0
50
100
150
200
250
300
City Centre North East North North West West South South East East
SALES BY PROPERTY TYPE - OCTOBER
Detached Apartment Semi - Detached Row Source: CREB®
10% 12% 15% 14% 9%21% 15%
3%
49%
6% 3%11%
8%
13%8%
33%
9% 10%13%
8%
13%
10%
10%
18% 15%
16%
10%
17%
10%
0%
20%
40%
60%
80%
100%
120%
City Centre North East North North West West South South East East
SHARE OF CITY WIDE SALES - OCTOBER
Detached Apartment Semi - Detached Row Source: CREB®
0
50
100
150
200
250
300
350
400
<$200,000 $200,000 -$299,999
$300,000 -$399,999
$400,000 -$499,999
$500,000 -$599,999
$600,000 -$699,999
$700,000 -999,999
$1,000,000+
TOTAL SALES BY PRICE RANGE - OCTOBER
City Centre North East North North West West South South East EastSource: CREB®
Oct. 2018
CREB® Monthly Statistics City of Calgary 8

City of CalgaryTotal Residential
Jan. Feb. Mar. Apr. May Jun. Jul. Aug. Sept. Oct. Nov. Dec.2017 01/01/17 02/01/17 03/01/17 04/01/17 05/01/17 06/01/17 07/01/17 08/01/17 09/01/17 10/01/17 11/01/17 12/01/17Sales 943 1,334 1,890 1,900 2,115 2,136 1,625 1,595 1,460 1,467 1,411 1,009 New Listings 2,383 2,459 3,240 3,295 3,864 3,754 2,978 3,004 3,263 2,608 2,061 1,221 Inventory 4,110 4,502 5,124 5,518 6,213 6,670 6,697 6,620 6,883 6,480 5,684 4,323 Days on Market 53 48 42 39 37 38 43 45 45 50 52 58 Benchmark Price 433,700 433,500 434,600 435,900 439,600 441,600 443,700 442,600 441,800 439,200 436,800 433,300 Median Price 425,000 428,000 435,000 445,000 448,000 452,500 425,000 428,000 423,000 415,000 412,000 410,000 Average Price 467,509 480,786 490,980 495,002 504,230 500,889 477,948 478,280 485,041 475,097 462,408 453,239 Index 200 199 200 201 202 203 204 204 203 202 201 199 2018 01/01/18 02/01/18 03/01/18 04/01/18 05/01/18 06/01/18 07/01/18 08/01/18 09/01/18 10/01/18 11/01/18 12/01/18Sales 959 1,089 1,370 1,514 1,725 1,895 1,548 1,492 1,273 1,322 New Listings 2,456 2,404 3,448 3,567 4,371 3,872 2,967 3,067 3,096 2,440 Inventory 4,641 5,209 6,394 7,342 8,470 8,845 8,492 8,167 7,992 7,345 Days on Market 61 51 45 47 46 46 52 56 56 60 Benchmark Price 432,400 434,600 435,700 436,600 437,000 436,600 435,500 432,000 428,700 426,300 Median Price 415,000 425,000 439,000 430,500 428,000 434,000 423,500 427,250 414,500 410,250 Average Price 468,023 493,008 495,396 478,116 490,207 494,035 479,159 483,927 467,007 468,634 Index 199 200 200 201 201 201 200 199 197 196
Oct-17 Oct-18 YTD 2017 YTD 2018CALGARY TOTAL SALES 10/01/17 10/01/18 10/01/17 10/01/18>$100,000 1 1 2 7 $100,000 - $199,999 59 75 645 786 $200,000 - $299,999 230 202 2,242 2,015 $300,000 -$ 349,999 177 153 1,739 1,520 $350,000 - $399,999 211 185 2,117 1,764 $400,000 - $449,999 176 157 2,021 1,790 $450,000 - $499,999 134 132 1,667 1,343 $500,000 - $549,999 114 95 1,391 1,166 $550,000 - $599,999 70 81 1,064 881 $600,000 - $649,999 58 51 797 621 $650,000 - $699,999 50 43 660 473 $700,000 - $799,999 71 55 794 658 $800,000 - $899,999 38 28 484 389 $900,000 - $999,999 27 18 238 215 $1,000,000 - $1,249,999 23 15 308 241 $1,250,000 - $1,499,999 9 11 142 136 $1,500,000 - $1,749,999 6 8 64 70 $1,750,000 - $1,999,999 7 5 39 45 $2,000,000 - $2,499,999 4 5 22 38 $2,500,000 - $2,999,999 2 2 17 15 $3,000,000 - $3,499,999 - - 4 8 $3,500,000 - $3,999,999 - - 6 4 $4,000,000 + - - 2 2
1,467 1,322 16,465 14,187
0
500
1,000
1,500
2,000
2,500
3,000
3,500
4,000
4,500
<$200,000 $200,000 -$299,999
$300,000 -$399,999
$400,000 -$499,999
$500,000 -$599,999
$600,000 -$699,999
$700,000 -999,999
$1,000,000+
YTD OCTOBERCITY OF CALGARY TOTAL SALES BY PRICE RANGE
YTD 2015 YTD 2016 YTD 2017 YTD 2018Source: CREB®
Oct. 2018
CREB® Monthly Statistics City of Calgary 9

City of CalgaryTotal Residential
0
5,000
10,000
15,000
20,000
25,000
YTD2008
YTD2009
YTD2010
YTD2011
YTD2012
YTD2013
YTD2014
YTD2015
YTD2016
YTD2017
YTD2018
YTD OCTOBER
Detached Apartment Semi - DetachedRow 10 Year Average Source: CREB®
CITY OF CALGARY TOTAL SALES
0
5,000
10,000
15,000
20,000
25,000
30,000
35,000
40,000
45,000
YTD2008
YTD2009
YTD2010
YTD2011
YTD2012
YTD2013
YTD2014
YTD2015
YTD2016
YTD2017
YTD2018
YTD OCTOBER
Detached Apartment Semi - Detached
Row 10 Year Average Source: CREB®
CITY OF CALGARY TOTAL NEW LISTINGS
415,000
420,000
425,000
430,000
435,000
440,000
445,000
-
1,000
2,000
3,000
4,000
5,000
6,000
7,000
8,000
9,000
10,000
Oct.'17
Nov.'17
Dec.'17
Jan.'18
Feb.'18
Mar.'18
Apr.'18
May.'18
Jun.'18
Jul.'18
Aug.'18
Sep.'18
Oct.'18
Inventory Sales Benchmark PriceSource: CREB®
CITY OF CALGARY TOTAL INVENTORY AND SALES
-
1
2
3
4
5
6
7
2013 2014 2015 2016 2017 2018
Months of Supply Trended Source: CREB®12 month moving average inventory
CITY OF CALGARY TOTAL MONTHS OF INVENTORY
-10%
-5%
0%
5%
10%
15%
2013 2014 2015 2016 2017 2018
Average Price Y/Y% Change Median Price Y/Y% Change
Benchmark Y/Y% Change Source: CREB®
CITY OF CALGARY TOTAL PRICE CHANGE
320,000
340,000
360,000
380,000
400,000
420,000
440,000
460,000
480,000
500,000
520,000
2013 2014 2015 2016 2017 2018
Average Price Median Price
Benchmark Price Source: CREB®
CITY OF CALGARY TOTAL PRICES
Oct. 2018
CREB® Calgary Regional Housing Market Statistics 10

City of CalgaryDetached
Jan. Feb. Mar. Apr. May Jun. Jul. Aug. Sept. Oct. Nov. Dec.2017 01/01/17 02/01/17 03/01/17 04/01/17 05/01/17 06/01/17 07/01/17 08/01/17 09/01/17 10/01/17 11/01/17 12/01/17Sales 581 822 1,171 1,192 1,374 1,381 1,011 983 919 907 874 617 New Listings 1,228 1,293 1,796 1,861 2,239 2,165 1,688 1,674 1,870 1,484 1,122 675 Inventory 1,848 1,995 2,324 2,543 2,966 3,227 3,280 3,277 3,494 3,257 2,765 2,040 Days on Market 47 42 38 32 31 32 38 40 42 44 48 52 Benchmark Price 497,700 498,500 499,700 501,600 506,000 508,700 511,100 510,200 508,200 505,500 503,300 498,700 Median Price 485,000 492,250 490,000 502,250 510,000 513,000 495,000 491,000 482,500 474,000 465,000 462,000 Average Price 545,857 557,661 571,725 562,626 580,590 569,822 553,430 552,007 556,463 544,998 534,454 522,751 Index 204 205 205 206 208 209 210 210 209 208 207 205 2018 01/01/18 02/01/18 03/01/18 04/01/18 05/01/18 06/01/18 07/01/18 08/01/18 09/01/18 10/01/18 11/01/18 12/01/18Sales 584 653 845 906 1,059 1,209 969 928 791 829 New Listings 1,288 1,294 1,870 2,005 2,661 2,304 1,733 1,821 1,785 1,387 Inventory 2,200 2,458 3,078 3,651 4,504 4,816 4,593 4,446 4,357 3,976 Days on Market 55 45 37 41 40 41 49 51 52 57 Benchmark Price 498,700 502,100 502,800 503,800 503,600 502,100 500,700 497,000 493,100 490,200 Median Price 474,000 497,000 509,900 495,000 500,000 496,500 485,000 485,000 472,000 470,000 Average Price 545,711 575,329 568,602 558,840 577,253 573,729 560,534 563,704 540,218 543,286 Index 205 206 207 207 207 206 206 204 203 201
Oct-17 Oct-18 YTD 2017 YTD 2018CALGARY TOTAL SALES 10/01/17 10/01/18 10/01/17 10/01/18>$100,000 - - - - $100,000 - $199,999 1 - 5 2 $200,000 - $299,999 24 27 179 218 $300,000 -$ 349,999 74 75 639 632 $350,000 - $399,999 153 136 1,355 1,194 $400,000 - $449,999 151 134 1,643 1,441 $450,000 - $499,999 111 107 1,448 1,113 $500,000 - $549,999 101 84 1,215 1,038 $550,000 - $599,999 55 74 945 774 $600,000 - $649,999 47 40 676 524 $650,000 - $699,999 44 32 557 394 $700,000 - $799,999 53 41 596 480 $800,000 - $899,999 32 22 368 304 $900,000 - $999,999 22 16 185 168 $1,000,000 - $1,249,999 16 13 260 201 $1,250,000 - $1,499,999 6 9 124 123 $1,500,000 - $1,749,999 5 7 60 62 $1,750,000 - $1,999,999 7 5 38 42 $2,000,000 - $2,499,999 3 5 20 36 $2,500,000 - $2,999,999 2 2 17 13 $3,000,000 - $3,499,999 - - 4 8 $3,500,000 - $3,999,999 - - 6 4 $4,000,000 + - - 1 2
907 829 10,341 8,773
0
500
1,000
1,500
2,000
2,500
3,000
3,500
4,000
<$200,000 $200,000 -$299,999
$300,000 -$399,999
$400,000 -$499,999
$500,000 -$599,999
$600,000 -$699,999
$700,000 -999,999
$1,000,000+
YTD OCTOBERCITY OF CALGARY DETACHED SALES BY PRICE RANGE
YTD 2015 YTD 2016 YTD 2017 YTD 2018Source: CREB®
Oct. 2018
CREB® Monthly Statistics City of Calgary 11

City of CalgaryDetached
0
2,000
4,000
6,000
8,000
10,000
12,000
14,000
16,000
YTD2008
YTD2009
YTD2010
YTD2011
YTD2012
YTD2013
YTD2014
YTD2015
YTD2016
YTD2017
YTD2018
YTD OCTOBER
Detached 10 Year AverageSource: CREB®
CITY OF CALGARY DETACHED SALES
0
5,000
10,000
15,000
20,000
25,000
30,000
YTD2008
YTD2009
YTD2010
YTD2011
YTD2012
YTD2013
YTD2014
YTD2015
YTD2016
YTD2017
YTD2018
YTD OCTOBER
Detached 10 Year AverageSource: CREB®
CITY OF CALGARY DETACHED NEW LISTINGS
480,000
485,000
490,000
495,000
500,000
505,000
510,000
-
1,000
2,000
3,000
4,000
5,000
6,000
Oct.'17
Nov.'17
Dec.'17
Jan.'18
Feb.'18
Mar.'18
Apr.'18
May.'18
Jun.'18
Jul.'18
Aug.'18
Sep.'18
Oct.'18
Inventory Sales Benchmark PriceSource: CREB®
CITY OF CALGARY DETACHED INVENTORY AND SALES
-
1
2
3
4
5
6
2013 2014 2015 2016 2017 2018
Months of Supply Trended Source: CREB®12 month moving average inventory
CITY OF CALGARY DETACHED MONTHS OF INVENTORY
-15%
-10%
-5%
0%
5%
10%
15%
2013 2014 2015 2016 2017 2018
Average Price Y/Y% Change Median Price Y/Y% Change
Benchmark Y/Y% Change Source: CREB®
CITY OF CALGARY DETACHED PRICE CHANGE
320,000
370,000
420,000
470,000
520,000
570,000
620,000
2013 2014 2015 2016 2017 2018
Average Price Median Price
Benchmark Price Source: CREB®
CITY OF CALGARY DETACHED PRICES
Oct. 2018
CREB® Calgary Regional Housing Market Statistics 12

City of CalgaryApartment
Jan. Feb. Mar. Apr. May Jun. Jul. Aug. Sept. Oct. Nov. Dec.2017 01/01/17 02/01/17 03/01/17 04/01/17 05/01/17 06/01/17 07/01/17 08/01/17 09/01/17 10/01/17 11/01/17 12/01/17Sales 151 235 297 283 282 284 254 248 209 234 224 170 New Listings 623 583 726 691 768 729 614 644 629 501 446 261 Inventory 1,266 1,390 1,578 1,653 1,781 1,871 1,813 1,767 1,774 1,640 1,495 1,183 Days on Market 68 66 56 49 55 55 59 60 56 67 66 81 Benchmark Price 265,400 264,600 265,200 264,600 267,100 265,900 266,500 263,600 264,300 261,700 258,400 257,800 Median Price 258,500 275,000 251,500 267,000 270,000 274,000 257,750 255,000 247,500 256,000 251,000 250,000 Average Price 282,429 314,498 280,130 303,361 296,999 323,341 286,643 285,254 283,796 290,016 277,269 271,340 Index 183 183 183 183 185 184 184 182 183 181 179 178 2018 01/01/18 02/01/18 03/01/18 04/01/18 05/01/18 06/01/18 07/01/18 08/01/18 09/01/18 10/01/18 11/01/18 12/01/18Sales 145 197 219 261 282 292 254 242 212 212 New Listings 588 544 721 725 776 659 541 546 560 473 Inventory 1,290 1,436 1,695 1,853 1,924 1,877 1,781 1,668 1,624 1,509 Days on Market 76 68 64 59 59 59 62 71 66 69 Benchmark Price 256,400 256,700 257,400 256,800 256,400 259,300 259,900 258,100 257,200 257,200 Median Price 255,000 270,000 252,500 255,000 250,000 260,500 245,000 258,000 252,250 255,000 Average Price 298,942 325,905 300,005 286,118 289,715 290,344 280,879 294,787 300,967 286,637 Index 177 177 178 178 177 179 180 178 178 178
Oct-17 Oct-18 YTD 2017 YTD 2018CALGARY TOTAL SALES 10/01/17 10/01/18 10/01/17 10/01/18>$100,000 1 1 2 6 $100,000 - $199,999 44 51 484 582 $200,000 - $299,999 111 91 1,066 910 $300,000 -$ 349,999 29 28 356 323 $350,000 - $399,999 25 13 234 162 $400,000 - $449,999 9 10 117 109 $450,000 - $499,999 6 8 69 87 $500,000 - $549,999 4 3 49 34 $550,000 - $599,999 1 3 23 25 $600,000 - $649,999 - 1 24 17 $650,000 - $699,999 - - 15 8 $700,000 - $799,999 - - 12 10 $800,000 - $899,999 1 - 6 9 $900,000 - $999,999 - - 8 8 $1,000,000 - $1,249,999 1 - 4 6 $1,250,000 - $1,499,999 1 2 3 8 $1,500,000 - $1,749,999 - 1 1 7 $1,750,000 - $1,999,999 - - 1 2 $2,000,000 - $2,499,999 1 - 2 1 $2,500,000 - $2,999,999 - - - 2 $3,000,000 - $3,499,999 - - - - $3,500,000 - $3,999,999 - - - - $4,000,000 + - - 1 -
234 212 2,477 2,316
0
200
400
600
800
1,000
1,200
1,400
1,600
<$200,000 $200,000 -$299,999
$300,000 -$399,999
$400,000 -$499,999
$500,000 -$599,999
$600,000 -$699,999
$700,000 -999,999
$1,000,000+
YTD OCTOBERCITY OF CALGARY APARTMENT SALES BY PRICE RANGE
YTD 2015 YTD 2016 YTD 2017 YTD 2018Source: CREB®
Oct. 2018
CREB® Monthly Statistics City of Calgary 13

City of CalgaryApartment
0
500
1,000
1,500
2,000
2,500
3,000
3,500
4,000
4,500
YTD2008
YTD2009
YTD2010
YTD2011
YTD2012
YTD2013
YTD2014
YTD2015
YTD2016
YTD2017
YTD2018
YTD OCTOBER
Apartment 10 Year AverageSource: CREB®
CITY OF CALGARY APARTMENT SALES
0
1,000
2,000
3,000
4,000
5,000
6,000
7,000
8,000
9,000
YTD2008
YTD2009
YTD2010
YTD2011
YTD2012
YTD2013
YTD2014
YTD2015
YTD2016
YTD2017
YTD2018
YTD OCTOBER
Apartment 10 Year AverageSource: CREB®
CITY OF CALGARY APARTMENT NEW LISTINGS
253,000
254,000
255,000
256,000
257,000
258,000
259,000
260,000
261,000
262,000
263,000
-
500
1,000
1,500
2,000
2,500
Oct.'17
Nov.'17
Dec.'17
Jan.'18
Feb.'18
Mar.'18
Apr.'18
May.'18
Jun.'18
Jul.'18
Aug.'18
Sep.'18
Oct.'18
Inventory Sales Benchmark PriceSource: CREB®
CITY OF CALGARY APARTMENT INVENTORY AND SALES
-
2
4
6
8
10
12
2013 2014 2015 2016 2017 2018
Months of Supply Trended Source: CREB®12 month moving average inventory
CITY OF CALGARY APARTMENT MONTHS OF INVENTORY
-25%
-20%
-15%
-10%
-5%
0%
5%
10%
15%
20%
2013 2014 2015 2016 2017 2018
Average Price Y/Y% Change Median Price Y/Y% Change
Benchmark Y/Y% Change Source: CREB®
CITY OF CALGARY APARTMENT PRICE CHANGE
200,000
220,000
240,000
260,000
280,000
300,000
320,000
340,000
360,000
2013 2014 2015 2016 2017 2018
Average Price Median Price
Benchmark Price Source: CREB®
CITY OF CALGARY APARTMENT PRICES
Oct. 2018
CREB® Calgary Regional Housing Market Statistics 14

City of CalgarySemi-Detached
Jan. Feb. Mar. Apr. May Jun. Jul. Aug. Sept. Oct. Nov. Dec.2017 01/01/17 02/01/17 03/01/17 04/01/17 05/01/17 06/01/17 07/01/17 08/01/17 09/01/17 10/01/17 11/01/17 12/01/17Sales 83 126 198 204 188 191 147 177 144 143 126 95 New Listings 198 236 301 269 332 340 278 279 320 247 192 129 Inventory 375 435 454 455 517 559 587 580 613 607 548 432 Days on Market 61 53 40 46 42 40 44 42 44 52 54 59 Benchmark Price 403,800 404,000 407,800 409,000 411,300 414,500 417,500 416,100 415,900 415,500 414,500 413,100 Median Price 375,000 386,858 396,500 436,750 405,250 400,000 395,000 396,000 423,000 390,000 396,000 405,500 Average Price 482,059 477,825 495,407 522,403 495,805 513,114 501,732 477,421 505,210 490,552 508,917 492,219 Index 204 204 206 207 208 210 211 210 210 210 210 209 2018 01/01/18 02/01/18 03/01/18 04/01/18 05/01/18 06/01/18 07/01/18 08/01/18 09/01/18 10/01/18 11/01/18 12/01/18Sales 99 106 143 155 156 184 150 142 122 126 New Listings 234 247 386 349 418 412 301 326 330 279 Inventory 447 533 670 752 852 901 871 862 827 823 Days on Market 62 48 45 52 52 47 48 56 56 60 Benchmark Price 412,500 415,500 415,300 416,700 415,700 414,700 415,300 411,300 407,400 403,400 Median Price 376,500 402,815 445,000 421,000 402,844 407,050 395,750 413,750 370,750 396,750 Average Price 460,514 509,176 551,874 507,585 484,474 495,019 491,368 484,917 447,913 475,975 Index 209 210 210 211 210 210 210 208 206 204
Oct-17 Oct-18 YTD 2017 YTD 2018CALGARY TOTAL SALES 10/01/17 10/01/18 10/01/17 10/01/18>$100,000 - - - - $100,000 - $199,999 4 2 18 15 $200,000 - $299,999 27 24 229 221 $300,000 -$ 349,999 28 19 247 210 $350,000 - $399,999 17 19 288 226 $400,000 - $449,999 7 7 154 125 $450,000 - $499,999 6 9 63 72 $500,000 - $549,999 4 6 59 55 $550,000 - $599,999 8 1 52 45 $600,000 - $649,999 7 6 58 56 $650,000 - $699,999 4 11 71 61 $700,000 - $799,999 16 13 171 154 $800,000 - $899,999 5 5 106 71 $900,000 - $999,999 5 2 41 35 $1,000,000 - $1,249,999 3 2 36 32 $1,250,000 - $1,499,999 1 - 7 4 $1,500,000 - $1,749,999 1 - 1 - $1,750,000 - $1,999,999 - - - - $2,000,000 - $2,499,999 - - - 1 $2,500,000 - $2,999,999 - - - - $3,000,000 - $3,499,999 - - - - $3,500,000 - $3,999,999 - - - - $4,000,000 + - - - -
143 126 1,601 1,383
0
100
200
300
400
500
600
<$200,000 $200,000 -$299,999
$300,000 -$399,999
$400,000 -$499,999
$500,000 -$599,999
$600,000 -$699,999
$700,000 -999,999
$1,000,000+
YTD OCTOBERCITY OF CALGARY SEMI-DETACHED SALES BY PRICE RANGE
YTD 2015 YTD 2016 YTD 2017 YTD 2018Source: CREB®
Oct. 2018
CREB® Monthly Statistics City of Calgary 15
City of CalgarySemi-Detached
0
500
1,000
1,500
2,000
2,500
YTD2008
YTD2009
YTD2010
YTD2011
YTD2012
YTD2013
YTD2014
YTD2015
YTD2016
YTD2017
YTD2018
YTD OCTOBER
Semi - Detached 10 Year AverageSource: CREB®
CITY OF CALGARY SEMI-DET. SALES
0
500
1,000
1,500
2,000
2,500
3,000
3,500
YTD2008
YTD2009
YTD2010
YTD2011
YTD2012
YTD2013
YTD2014
YTD2015
YTD2016
YTD2017
YTD2018
YTD OCTOBER
Semi - Detached 10 Year AverageSource: CREB®
CITY OF CALGARY SEMI-DET. NEW LISTINGS
395,000
400,000
405,000
410,000
415,000
420,000
-
100
200
300
400
500
600
700
800
900
1,000
Oct.'17
Nov.'17
Dec.'17
Jan.'18
Feb.'18
Mar.'18
Apr.'18
May.'18
Jun.'18
Jul.'18
Aug.'18
Sep.'18
Oct.'18
Inventory Sales Benchmark PriceSource: CREB®
CITY OF CALGARY SEMI-DET. INVENTORY AND SALES
-
1
2
3
4
5
6
7
8
2013 2014 2015 2016 2017 2018
Months of Supply Trended Source: CREB®12 month moving average inventory
CITY OF CALGARY SEMI-DET. MONTHS OF INVENTORY
-30%
-20%
-10%
0%
10%
20%
30%
40%
50%
2013 2014 2015 2016 2017 2018
Average Price Y/Y% Change Median Price Y/Y% Change
Benchmark Y/Y% Change Source: CREB®
CITY OF CALGARY SEMI-DET. PRICE CHANGE
250,000
300,000
350,000
400,000
450,000
500,000
550,000
600,000
650,000
2013 2014 2015 2016 2017 2018
Average Price Median Price
Benchmark Price Source: CREB®
CITY OF CALGARY SEMI-DET. PRICES
Oct. 2018
CREB® Calgary Regional Housing Market Statistics 16
City of CalgaryRow
Jan. Feb. Mar. Apr. May Jun. Jul. Aug. Sept. Oct. Nov. Dec.2017 01/01/17 02/01/17 03/01/17 04/01/17 05/01/17 06/01/17 07/01/17 08/01/17 09/01/17 10/01/17 11/01/17 12/01/17Sales 128 151 224 221 271 280 213 187 188 183 187 127 New Listings 334 347 417 474 525 519 398 407 444 376 301 156 Inventory 621 682 768 867 949 1,012 1,016 995 1,001 975 875 667 Days on Market 62 48 52 57 45 47 49 56 52 54 55 60 Benchmark Price 302,700 301,700 300,100 301,900 303,600 305,700 306,800 307,100 306,700 305,200 303,100 299,800 Median Price 303,500 311,000 302,750 309,000 310,000 310,000 307,000 305,500 319,000 312,000 290,000 295,000 Average Price 320,783 323,565 344,526 350,371 338,564 332,645 331,390 347,520 344,187 353,234 316,117 329,857 Index 190 189 188 189 190 191 192 192 192 191 190 188 2018 01/01/18 02/01/18 03/01/18 04/01/18 05/01/18 06/01/18 07/01/18 08/01/18 09/01/18 10/01/18 11/01/18 12/01/18Sales 131 133 163 192 228 210 175 179 146 153 New Listings 346 318 468 485 512 494 388 366 412 293 Inventory 703 778 939 1,066 1,151 1,189 1,152 1,087 1,078 1,009 Days on Market 69 62 61 54 50 54 59 60 62 64 Benchmark Price 296,700 295,600 297,900 300,300 303,500 302,500 300,600 296,700 294,200 293,400 Median Price 295,000 300,000 300,000 308,950 308,450 294,250 292,500 300,000 299,000 289,900 Average Price 314,512 323,453 328,860 334,402 337,798 317,585 305,903 323,800 323,639 308,489 Index 186 185 187 188 190 189 188 186 184 184
Oct-17 Oct-18 YTD 2017 YTD 2018CALGARY TOTAL SALES 10/01/17 10/01/18 10/01/17 10/01/18>$100,000 - - - 1 $100,000 - $199,999 10 22 138 187 $200,000 - $299,999 68 60 768 666 $300,000 -$ 349,999 46 31 497 355 $350,000 - $399,999 16 17 240 182 $400,000 - $449,999 9 6 107 115 $450,000 - $499,999 11 8 87 71 $500,000 - $549,999 5 2 68 39 $550,000 - $599,999 6 3 44 37 $600,000 - $649,999 4 2 39 21 $650,000 - $699,999 2 - 17 10 $700,000 - $799,999 2 1 15 13 $800,000 - $899,999 - 1 4 4 $900,000 - $999,999 - - 4 4 $1,000,000 - $1,249,999 3 - 8 2 $1,250,000 - $1,499,999 1 - 8 1 $1,500,000 - $1,749,999 - - 2 1 $1,750,000 - $1,999,999 - - - 1 $2,000,000 - $2,499,999 - - - - $2,500,000 - $2,999,999 - - - - $3,000,000 - $3,499,999 - - - - $3,500,000 - $3,999,999 - - - - $4,000,000 + - - - -
183 153 2,046 1,710
0
100
200
300
400
500
600
700
800
900
1,000
<$200,000 $200,000 -$299,999
$300,000 -$399,999
$400,000 -$499,999
$500,000 -$599,999
$600,000 -$699,999
$700,000 -999,999
$1,000,000+
YTD OCTOBERCITY OF CALGARY ROW SALES BY PRICE RANGE
YTD 2015 YTD 2016 YTD 2017 YTD 2018Source: CREB®
Oct. 2018
CREB® Monthly Statistics City of Calgary 17

City of CalgaryRow
0
500
1,000
1,500
2,000
2,500
3,000
3,500
YTD2008
YTD2009
YTD2010
YTD2011
YTD2012
YTD2013
YTD2014
YTD2015
YTD2016
YTD2017
YTD2018
YTD OCTOBER
Row 10 Year AverageSource: CREB®
CITY OF CALGARY ROW SALES
0
500
1,000
1,500
2,000
2,500
3,000
3,500
4,000
4,500
5,000
YTD2008
YTD2009
YTD2010
YTD2011
YTD2012
YTD2013
YTD2014
YTD2015
YTD2016
YTD2017
YTD2018
YTD OCTOBER
Row 10 Year AverageSource: CREB®
CITY OF CALGARY ROW NEW LISTINGS
286,000
288,000
290,000
292,000
294,000
296,000
298,000
300,000
302,000
304,000
306,000
308,000
-
200
400
600
800
1,000
1,200
1,400
Oct.'17
Nov.'17
Dec.'17
Jan.'18
Feb.'18
Mar.'18
Apr.'18
May.'18
Jun.'18
Jul.'18
Aug.'18
Sep.'18
Oct.'18
Inventory Sales Benchmark PriceSource: CREB®
CITY OF CALGARY ROW INVENTORY AND SALES
-
1
2
3
4
5
6
7
8
2013 2014 2015 2016 2017 2018
Months of Supply Trended Source: CREB®12 month moving average inventory
CITY OF CALGARY ROW MONTHS OF INVENTORY
-15%
-10%
-5%
0%
5%
10%
15%
20%
25%
2013 2014 2015 2016 2017 2018
Average Price Y/Y% Change Median Price Y/Y% Change
Benchmark Y/Y% Change Source: CREB®
CITY OF CALGARY ROW PRICE CHANGE
200,000
220,000
240,000
260,000
280,000
300,000
320,000
340,000
360,000
380,000
400,000
2013 2014 2015 2016 2017 2018
Average Price Median Price
Benchmark Price Source: CREB®
CITY OF CALGARY ROW PRICES
Oct. 2018
CREB® Calgary Regional Housing Market Statistics 18
City of Calgary
CITY CENTRE CITY CENT CITY CENT CITY CENT CITY CENT CITY CENT CITY CENTRE PRICES
0
500
1,000
1,500
2,000
2,500
3,000
3,500
4,000
4,500
5,000
YTD2008
YTD2009
YTD2010
YTD2011
YTD2012
YTD2013
YTD2014
YTD2015
YTD2016
YTD2017
YTD2018
YTD OCTOBERCITY CENTRE TOTAL SALES
Detached Apartment Semi - Detached
Row 10 Year Average Source: CREB®
485,000
490,000
495,000
500,000
505,000
510,000
-
500
1,000
1,500
2,000
2,500
Oct.'17
Nov.'17
Dec.'17
Jan.'18
Feb.'18
Mar.'18
Apr.'18
May.'18
Jun.'18
Jul.'18
Aug.'18
Sep.'18
Oct.'18
CITY CENTRE INVENTORY AND SALES
Inventory Sales Benchmark Price
Source: CREB®
-
2
4
6
8
10
12
14
2013 2014 2015 2016 2017 2018
CITY CENTRE MONTHS OF INVENTORY
Months of Supply TrendedSource: CREB®
12-month moving average
-10%
-5%
0%
5%
10%
15%
20%
2013 2014 2015 2016 2017 2018
CITY CENTRE PRICE CHANGE
Semi Y/Y%change Row Y/Y% changeApartment Y/Y% change Detached Y/Y% Change Source: CREB®
Benchmark Price Change
100,000
200,000
300,000
400,000
500,000
600,000
700,000
800,000
900,000
2013 2014 2015 2016 2017 2018
CITY CENTRE PRICES
Detached Price Apartment Price
Row Price Semi PriceSource: CREB®
Benchmark Price
0
100
200
300
400
500
600
700YTD OCTOBER
CITY CENTRE TOTAL SALES BY PRICE RANGE
YTD 2015 YTD 2016 YTD 2017 YTD 2018 Source: CREB®
Oct. 2018
CREB® Calgary Regional Housing Market Statistics 19
City of Calgary
NORTHEAST NORTHEA NORTHEA NORTHEA NORTHEA NORTHEA NORTHEAST PRICES
0
500
1,000
1,500
2,000
2,500
3,000
YTD2008
YTD2009
YTD2010
YTD2011
YTD2012
YTD2013
YTD2014
YTD2015
YTD2016
YTD2017
YTD2018
YTD OCTOBERNORTHEAST TOTAL SALES
Detached Apartment Semi - Detached
Row 10 Year Average Source: CREB®
325,000
330,000
335,000
340,000
345,000
350,000
355,000
-
100
200
300
400
500
600
700
800
900
Oct.'17
Nov.'17
Dec.'17
Jan.'18
Feb.'18
Mar.'18
Apr.'18
May.'18
Jun.'18
Jul.'18
Aug.'18
Sep.'18
Oct.'18
NORTHEAST INVENTORY AND SALES
Inventory Sales Benchmark Price
Source: CREB®
-
1
2
3
4
5
6
7
2013 2014 2015 2016 2017 2018
NORTHEAST MONTHS OF INVENTORY
Months of Supply TrendedSource: CREB®
12-month moving average
-15%
-10%
-5%
0%
5%
10%
15%
20%
25%
30%
2013 2014 2015 2016 2017 2018
NORTHEAST PRICE CHANGE
Semi Y/Y%change Row Y/Y% changeApartment Y/Y% change Detached Y/Y% Change Source: CREB®
Benchmark Price Change
100,000
150,000
200,000
250,000
300,000
350,000
400,000
450,000
2013 2014 2015 2016 2017 2018
NORTHEAST PRICES
Detached Price Apartment Price
Row Price Semi PriceSource: CREB®
Benchmark Price
0
100
200
300
400
500
600
700
800
900.
NORTHEAST TOTAL SALES BY PRICE RANGE
YTD 2015 YTD 2016 YTD 2017 YTD 2018Source: CREB®
Oct. 2018
CREB® Calgary Regional Housing Market Statistics 20

City of Calgary
NORTH NORTH TO NORTH TO NORTH IN NORTH M NORTH P NORTH PRICES
0
500
1,000
1,500
2,000
2,500
3,000
YTD2008
YTD2009
YTD2010
YTD2011
YTD2012
YTD2013
YTD2014
YTD2015
YTD2016
YTD2017
YTD2018
YTD OCTOBERNORTH TOTAL SALES
Detached Apartment Semi - Detached
Row 10 Year Average Source: CREB®
372,000
374,000
376,000
378,000
380,000
382,000
384,000
386,000
388,000
390,000
392,000
-
200
400
600
800
1,000
1,200
Oct.'17
Nov.'17
Dec.'17
Jan.'18
Feb.'18
Mar.'18
Apr.'18
May.'18
Jun.'18
Jul.'18
Aug.'18
Sep.'18
Oct.'18
NORTH INVENTORY AND SALES
Inventory Sales Benchmark Price
Source: CREB®
-
1
2
3
4
5
6
7
2013 2014 2015 2016 2017 2018
NORTH MONTHS OF INVENTORY
Months of Supply TrendedSource: CREB®
12-month moving average
-15%
-10%
-5%
0%
5%
10%
15%
2013 2014 2015 2016 2017 2018
NORTH PRICE CHANGE
Semi Y/Y%change Row Y/Y% changeApartment Y/Y% change Detached Y/Y% Change Source: CREB®
Benchmark Price Change
100,000
150,000
200,000
250,000
300,000
350,000
400,000
450,000
500,000
2013 2014 2015 2016 2017 2018
NORTH PRICES
Detached Price Apartment Price
Row Price Semi PriceSource: CREB®
Benchmark Price
0
100
200
300
400
500
600
700
800YTD OCTOBER
NORTH TOTAL SALES BY PRICE RANGE
YTD 2015 YTD 2016 YTD 2017 YTD 2018Source: CREB®
Oct. 2018
CREB® Calgary Regional Housing Market Statistics 21

City of Calgary
NORTHWEST NORTHW NORTHW NORTHW NORTHW NORTHW NORTHWEST PRICES
0
500
1,000
1,500
2,000
2,500
3,000
3,500
YTD2008
YTD2009
YTD2010
YTD2011
YTD2012
YTD2013
YTD2014
YTD2015
YTD2016
YTD2017
YTD2018
YTD OCTOBERNORTHWEST TOTAL SALES
Detached Apartment Semi - Detached
Row 10 Year Average Source: CREB®
455,000
460,000
465,000
470,000
475,000
480,000
-
200
400
600
800
1,000
1,200
Oct.'17
Nov.'17
Dec.'17
Jan.'18
Feb.'18
Mar.'18
Apr.'18
May.'18
Jun.'18
Jul.'18
Aug.'18
Sep.'18
Oct.'18
NORTHWEST INVENTORY AND SALES
Inventory Sales Benchmark Price
Source: CREB®
-
1
2
3
4
5
6
7
2013 2014 2015 2016 2017 2018
NORTHWEST MONTHS OF INVENTORY
Months of Supply TrendedSource: CREB®
12-month moving average
-10%
-5%
0%
5%
10%
15%
20%
2013 2014 2015 2016 2017 2018
NORTHWEST PRICE CHANGE
Semi Y/Y%change Row Y/Y% changeApartment Y/Y% change Detached Y/Y% Change Source: CREB®
Benchmark Price Change
100,000
200,000
300,000
400,000
500,000
600,000
700,000
2013 2014 2015 2016 2017 2018
NORTHWEST PRICES
Detached Price Apartment Price
Row Price Semi PriceSource: CREB®
Benchmark Price
0
100
200
300
400
500
600
700YTD OCTOBER
NORTHWEST TOTAL SALES BY PRICE RANGE
YTD 2015 YTD 2016 YTD 2017 YTD 2018Source: CREB®
Oct. 2018
CREB® Calgary Regional Housing Market Statistics 22

City of Calgary
WEST WEST TOT WEST TOT WEST INV WEST MO WEST PRI WEST PRICES
0
500
1,000
1,500
2,000
2,500
3,000
YTD2008
YTD2009
YTD2010
YTD2011
YTD2012
YTD2013
YTD2014
YTD2015
YTD2016
YTD2017
YTD2018
YTD OCTOBERWEST TOTAL SALES
Detached Apartment Semi - Detached
Row 10 Year Average Source: CREB®
540,000
545,000
550,000
555,000
560,000
565,000
570,000
575,000
-
200
400
600
800
1,000
1,200
Oct.'17
Nov.'17
Dec.'17
Jan.'18
Feb.'18
Mar.'18
Apr.'18
May.'18
Jun.'18
Jul.'18
Aug.'18
Sep.'18
Oct.'18
WEST INVENTORY AND SALES
Inventory Sales Benchmark Price
Source: CREB®
-
1
2
3
4
5
6
7
8
9
10
2013 2014 2015 2016 2017 2018
WEST MONTHS OF INVENTORY
Months of Supply TrendedSource: CREB®
12-month moving average
-15%
-10%
-5%
0%
5%
10%
15%
2013 2014 2015 2016 2017 2018
WEST PRICE CHANGE
Semi Y/Y%change Row Y/Y% changeApartment Y/Y% change Detached Y/Y% Change Source: CREB®
Benchmark Price Change
100,000
200,000
300,000
400,000
500,000
600,000
700,000
800,000
2013 2014 2015 2016 2017 2018
WEST PRICES
Detached Price Apartment Price
Row Price Semi PriceSource: CREB®
Benchmark Price
0
50
100
150
200
250
300
350
400
450YTD OCTOBER
WEST TOTAL SALES BY PRICE RANGE
YTD 2015 YTD 2016 YTD 2017 YTD 2018Source: CREB®
Oct. 2018
CREB® Calgary Regional Housing Market Statistics 23

City of Calgary
SOUTH SOUTH TO SOUTH TO SOUTH IN SOUTH M SOUTH PR SOUTH PRICES
0
500
1,000
1,500
2,000
2,500
3,000
3,500
4,000
4,500
YTD2008
YTD2009
YTD2010
YTD2011
YTD2012
YTD2013
YTD2014
YTD2015
YTD2016
YTD2017
YTD2018
YTD OCTOBERSOUTH TOTAL SALES
Detached Apartment Semi - Detached
Row 10 Year Average Source: CREB®
390,000
395,000
400,000
405,000
410,000
415,000
-
200
400
600
800
1,000
1,200
1,400
1,600
Oct.'17
Nov.'17
Dec.'17
Jan.'18
Feb.'18
Mar.'18
Apr.'18
May.'18
Jun.'18
Jul.'18
Aug.'18
Sep.'18
Oct.'18
SOUTH INVENTORY AND SALES
Inventory Sales Benchmark Price
Source: CREB®
-
1
2
3
4
5
6
2013 2014 2015 2016 2017 2018
SOUTH MONTHS OF INVENTORY
Months of Supply TrendedSource: CREB®
12-month moving average
-15%
-10%
-5%
0%
5%
10%
15%
2013 2014 2015 2016 2017 2018
SOUTH PRICE CHANGE
Semi Y/Y%change Row Y/Y% changeApartment Y/Y% change Detached Y/Y% Change Source: CREB®
Benchmark Price Change
100,000
150,000
200,000
250,000
300,000
350,000
400,000
450,000
500,000
550,000
2013 2014 2015 2016 2017 2018
SOUTH PRICES
Detached Price Apartment Price
Row Price Semi PriceSource: CREB®
Benchmark Price
0
200
400
600
800
1000
1200YTD OCTOBER
SOUTH TOTAL SALES BY PRICE RANGE
YTD 2015 YTD 2016 YTD 2017 YTD 2018Source: CREB®
Oct. 2018
CREB® Calgary Regional Housing Market Statistics 24

City of Calgary
SOUTHEAST SOUTHEA SOUTHEA SOUTHEA SOUTHEA SOUTHEA SOUTHEAST PRICES
0
500
1,000
1,500
2,000
2,500
3,000
YTD2008
YTD2009
YTD2010
YTD2011
YTD2012
YTD2013
YTD2014
YTD2015
YTD2016
YTD2017
YTD2018
YTD OCTOBERSOUTHEAST TOTAL SALES
Detached Apartment Semi - Detached
Row 10 Year Average Source: CREB®
405,000
410,000
415,000
420,000
425,000
430,000
-
200
400
600
800
1,000
1,200
Oct.'17
Nov.'17
Dec.'17
Jan.'18
Feb.'18
Mar.'18
Apr.'18
May.'18
Jun.'18
Jul.'18
Aug.'18
Sep.'18
Oct.'18
SOUTHEAST INVENTORY AND SALES
Inventory Sales Benchmark Price
Source: CREB®
-
1
2
3
4
5
6
2013 2014 2015 2016 2017 2018
SOUTHEAST MONTHS OF INVENTORY
Months of Supply TrendedSource: CREB®
12-month moving average
-10%
-5%
0%
5%
10%
15%
20%
2013 2014 2015 2016 2017 2018
SOUTHEAST PRICE CHANGE
Semi Y/Y%change Row Y/Y% change
Apartment Y/Y% change Detached Y/Y% Change Source: CREB®Benchmark Price Change
100,000
150,000
200,000
250,000
300,000
350,000
400,000
450,000
500,000
2013 2014 2015 2016 2017 2018
SOUTHEAST PRICES
Detached Price Apartment Price
Row Price Semi PriceSource: CREB®
Benchmark Price
0
100
200
300
400
500
600
700
800
900YTD OCTOBER
SOUTHEAST TOTAL SALES BY PRICE RANGE
YTD 2015 YTD 2016 YTD 2017 YTD 2018Source: CREB®
Oct. 2018
CREB® Calgary Regional Housing Market Statistics 25

City of Calgary
EAST EAST TOT EAST TOT EAST INV EAST MO EAST PRIC EAST PRICES
0
100
200
300
400
500
600
700
800
YTD2008
YTD2009
YTD2010
YTD2011
YTD2012
YTD2013
YTD2014
YTD2015
YTD2016
YTD2017
YTD2018
YTD OCTOBEREAST TOTAL SALES
Detached Apartment Semi - Detached
Row 10 Year Average Source: CREB®
290,000
292,000
294,000
296,000
298,000
300,000
302,000
304,000
306,000
-
50
100
150
200
250
Oct.'17
Nov.'17
Dec.'17
Jan.'18
Feb.'18
Mar.'18
Apr.'18
May.'18
Jun.'18
Jul.'18
Aug.'18
Sep.'18
Oct.'18
EAST INVENTORY AND SALES
Inventory Sales Benchmark Price
Source: CREB®
-
1
2
3
4
5
6
7
8
2013 2014 2015 2016 2017 2018
EAST MONTHS OF INVENTORY
Months of Supply TrendedSource: CREB®
12-month moving average
-15%
-10%
-5%
0%
5%
10%
15%
20%
25%
2013 2014 2015 2016 2017 2018
EAST PRICE CHANGE
Semi Y/Y%change Row Y/Y% changeApartment Y/Y% change Detached Y/Y% Change Source: CREB®
Benchmark Price Change
100,000
150,000
200,000
250,000
300,000
350,000
400,000
2013 2014 2015 2016 2017 2018
EAST PRICES
Detached Price Apartment Price
Row Price Semi PriceSource: CREB®
Benchmark Price
0
50
100
150
200
250
300YTD OCTOBER
EAST TOTAL SALES BY PRICE RANGE
YTD 2015 YTD 2016 YTD 2017 YTD 2018Source: CREB®
Oct. 2018
CREB® Calgary Regional Housing Market Statistics 26

CREB® Definitions
143 126
DEFINITIONS
Benchmark Price- Represents the monthly price of the typical home based on its attributes such as size, location and number of bedrooms.MLS® Home Price Index – Changes in home prices by comparing current price levels relative to January 2005 price level. Absorption Rate – Refers to the ratio between the amount of sales occurring in the market relative to the amount of inventory.Months of Supply – Refers to the ratio between Inventory and sales which represents at the current pace of sales how long it would take to clear existing inventory. Detached - A unit that is not attached to any other unit.Semi-detached - A single dwelling built as one of a pair that share one common wall. Row - A single dwelling attached to each other by a common wall with more than two properties in the complex.Attached - Both row and semi-detached properties.Apartment - A unit within a high rise or low rise condominium building with access through an interior hallway. Total Residential - Includes detached, attached and apartment style properties.Exclusions – Data included in this package do not include activity related to multiple-unit sales, rental, land or leased properties.
ABOUT CREB®CREB® is a professional body of more than 5,100 licensed brokers and registered associates, representing 245 member offices. CREB® is dedicated to enhancing the value, integrity and expertise of its REALTOR® members. Our REALTORS® are committed to a high standard of professional conduct, ongoing education, and a strict Code of Ethics and standards of business practice. Any use or reference to CREB® data and statistics must acknowledge CREB® as the source. The board does not generate statistics or analysis of any individual member or company’s market share. All MLS® active listings for Calgary and area may be found on the board’s website at ww.creb.com. CREB® is a registered trademark of the Calgary Real Estate Board Cooperative. The trademarks MLS® and Multiple Listing Service® are owned by the Canadian Real Estate Association (CREA) and identify the quality of services provided by real estate professionals who are members of CREA. The trademarks REALTOR® and REALTORS® are controlled by CREA and identify real estate professionals who are members of CREA, and subsequently the Alberta Real Estate Association and CREB®, used under licence.
Oct. 2018
CREB® Monthly Statistics City of Calgary 27