of the collegium of management and finance...... b. snowdon, h. r. vane, modern macroeconomics, ......
TRANSCRIPT

STUDIES AND WORKSOF THE
COLLEGIUMOF MANAGEMENT
AND FINANCE
VOLUME 83
Warsaw School of Economics

Reviewersdr Grzegorz Gołębiowski
dr hab. Bogdan Mróz, prof. SGHprof. dr hab. Jerzy Nowakowski
dr Agnieszka Sopińskaprof. dr hab. Kazimierz Starzyk
prof. dr hab. Michał Trockiprof. dr hab. Małgorzata Zaleska
Typesetting and Printed by:Dom Wydawniczy ELIPSA, ul. Inflancka 15/198, 00-189 Warszawatel./fax (0 22) 635 03 01, (0 22) 635 17 85, e-mail: [email protected], www.elipsa.pl
THE SCIENTIFIC COUNCIL OF STUDIES AND WORKSOF THE COLLEGIUM OF MANAGEMENT AND FINANCE
Translation(except articles submitted by the authors in English)
mgr Jolanta Pietrasikmgr Ewa Polakowska
mgr Mirosław Szymański
© Copyright by Warsaw School of Economics, 2007
ISSN 1234-8872
Circulation 320 copies
prof. dr hab. Janusz Ostaszewski – Chairmandr hab. Ryszard Bartkowiak, prof. SGH – Vice-Chairman
prof. dr hab. inż. Jan Adamczykdr hab. Stefan Doroszewicz, prof. SGH
prof. dr hab. Jan Głuchowskidr hab. Małgorzata Iwanicz-Drozdowska, prof. SGH
prof. dr hab. Jan Kajadr hab. Jan Komorowski, prof. SGH
dr hab. Tomasz Michalski, prof. SGHprof. dr hab. Zygmunt Niewiadomski
prof. dr hab. Jerzy Nowakowskidr hab. Wojciech Pacho, prof. SGHdr hab. Piotr Płoszajski, prof. SGHprof. dr hab. Maria Romanowska
dr hab. Anna Skowronek-Mielczarek, prof. SGHdr hab. Teresa Słaby, prof. SGH
dr hab. Marian Żukowski, prof. UMCS
Technical assistantEwa Niewiarowicz

CONTENTS
From the Editing Committee . . . . . . . . . . . . . . . . . . . . . . . . . . . . . . . . . . . . . . . . . . . . . . 5
Inflation Goal of Monetary Policy in the neo-Keynesian Model of EconomyAndrzej Kaźmierczak . . . . . . . . . . . . . . . . . . . . . . . . . . . . . . . . . . . . . . . . . . . . . . . . . . . . 7
Consumers – the Motor of Their Own Role on the MarketAnna Dąbrowska, Mirosława Janoś-Kresło . . . . . . . . . . . . . . . . . . . . . . . . . . . . . . . . . . 21
Hypercompetitive Trends as a Premise to Create Co-opetitive RelationsJoanna Cygler . . . . . . . . . . . . . . . . . . . . . . . . . . . . . . . . . . . . . . . . . . . . . . . . . . . . . . . . . . 35
The Impact of Information about Mergers and Acquisitions on Commercial Banks’Market Evaluation in PolandMałgorzata Zaleska, Zbigniew Korzeb . . . . . . . . . . . . . . . . . . . . . . . . . . . . . . . . . . . . . . 49
Cooperative Banks and Credit Societies – Comparative Analysis of Regulationsand Effects of Their ActivitiesAgnieszka Alińska . . . . . . . . . . . . . . . . . . . . . . . . . . . . . . . . . . . . . . . . . . . . . . . . . . . . . . . 62
Financial Covenants and Outside Rating as Factors Restricting InformationAsymmetry on the Syndicated Loan MarketPaweł Niedziółka . . . . . . . . . . . . . . . . . . . . . . . . . . . . . . . . . . . . . . . . . . . . . . . . . . . . . . . . 74
Directions of Development of Supply ChainsAleksandra Laskowska-Rutkowska . . . . . . . . . . . . . . . . . . . . . . . . . . . . . . . . . . . . . . . . . 86
Applied Forms of Structured Products on the Retail Marketof Structured ProductsKrzysztof Borowski . . . . . . . . . . . . . . . . . . . . . . . . . . . . . . . . . . . . . . . . . . . . . . . . . . . . . . 99
Working Capital Management in IT Companies. Selected AspectsAnna Miarecka, Patrycja Ptaszek-Strączyńska . . . . . . . . . . . . . . . . . . . . . . . . . . . . . . . 109
Privatization of State Enterprises in Russia – What Went Wrong and Why?Ludmiła Słobodzian, Monika Stępińska . . . . . . . . . . . . . . . . . . . . . . . . . . . . . . . . . . . . . 121
Summary . . . . . . . . . . . . . . . . . . . . . . . . . . . . . . . . . . . . . . . . . . . . . . . . . . . . . . . . . . . . . . . 129


FROM THE SCIENTIFIC COUNCIL
We very much appreciate the opportunity to present you with the next volume of the ‘Studies and Works of the Collegium of management and Finance’, which is the result of research conducted by the scientific staff of the Faculty of Management and Finance of Warsaw School of Economics (Szkoła Główna Handlowa w Warszawie).
The main focus of the papers the volume contains is on Polish economic system, especially macroeconomic policy, financial issues and behaviour of economic agents, such as banks, firms, and households. Due to the fact that since 2004 Poland is a member country of the European Union, some problems are put in a broader European context.
The volume reaches all the centres of higher economic education, economic libraries, and central institutions in Poland as well as universities and scientific centres in other countries that co-operate with the Faculty of Management and Finance on a permanent basis.
We believe that the volume we offer to you will be a valuable inspiration for further scientific research and will deepen the co-operation that we consider so fruitful for both sides.
For the Editors – Ryszard Bartkowiak, Vice-Dean of the Faculty


Andrzej KaźmierczakWarsaw School of Economics
Inflation Goal of Monetary Policy in the neo-Keynesian Model of Economy
1. Dispute over the Role of State in Developing Global Demand and Economic Activity
The dispute over the efficiency of the market mechanism and the role of state in developing economic activity carried on for years between the neo-Keynesian trend and the classical school has not been settled yet. However, there is a clear convergence in the basic macroeconomic questions. It concerns the role of money in developing real activity processes in the long term, i.e. within a few full business cycles. The classical school claims consistently that there is a slim impact of monetary phenomena on the real production, in particular in the long term. This is a well-known theory of the neutrality of money. But, according to the neo-classics, only within one business cycle, emergency activisation of economy through the stimulation of the global demand is harmful. Such solutions eventually bring about negative results that tend to self-consolidate. In particular, they strengthen inflation expectations in the society, which later on transform into real inflation. And inflation is one of the most important impediments to a long-term well-balanced economic growth. Anti-cyclical policy is harmful to a long term economic growth. According to the neo-classics the contemporary market is efficient. It adjusts the volume of production and employment in the economy to the optimum state thanks to the elasticity of prices and wages. Possible deviations of economic activity from the optimum state are only short term episodes of a passing nature. Hence all actions carried out by the state aiming at correction of market deficiencies are not only unnecessary but simply detrimental.
However, the contemporary neo-Keynesian thought supports a fundamental thesis of the orthodox Keynesianism on the market mechanism deficiency and production fluctuations resulting from it. The market left to unrestrained automatic adjustment processes is not able to prevent temporary production declines because of the existence of imperfect competition and the lack of full elasticity of prices and wages. The state of optimum utilisation of factors of production in the economy is not something natural at all. In the economy there are frequent fluctuations of global demand. They may result from both conscious state revenue policy and

� Andrzej Kaźmierczak
supply-demand factors, absolutely independent of the economic authorities. The reason for the fluctuations of global demand may be e.g. changes in raw material prices, unfavourable crop conditions, technological changes resulting in changes in productivity, natural disasters, strikes, changes in consumer preferences, international capital flows and the accompanying changes in the balance of payment. There is no impact of state on these phenomena. The effects of the above exogenic factors may be strong enough to give rise to significant changes in global demand and then to harmful changes in production which must eventually adjust itself to the changes in demand so as to recover the market balance in the economy.
Figure 1. Impact of changes in global demand on prices and production in short and long term
where:Y – production,P – prices,E – supply demand balance,AD – global demand,LRAS – long term output,SRAS – short term output.
Source: B. Snowdon, H. R. Vane, Modern Macroeconomics, Publ. Edward Elgar, 2005, p. 368.
The adjustment of supply to demand may be effected in two ways: 1) through changes in prices and wages in such a way that production remains at the unchanged current level. Their full elasticity is a prerequisite. For instance, the decline in prices and wages as a result of the decline in global demand makes global demand unchanged in real terms. Production does not have to be limited to maintain the market balance. The neo-Keynesian school rejects the existence

Inflation Goal of Monetary Policy in the neo-Keynesian Model of Economy �
of this sort of situation in the contemporary market economy. 2) with rigid prices and wages assumed by this school, the adjustment processes are effected on the production side. As a result of global demand fluctuations they can bring about harmful fluctuations of economic activity as well as temporary unemployment. For instance, an exogenic (not resulting from the economic policy) decline in global demand with prices and wages unchanged must also lead to a decline in demand in real terms. The limitation of production is inevitable in order to adjust supply to demand on the market of material goods. It is illustrated in Fig. 1.
According to the neo-Keynesiam school in the above situation the state should not be passive, expecting a salutary market impact leading the economic optimum and to the state of maximum utilisation of labour force resources. Negative general economic phenomena tend to repeat and consolidate themselves.
The rigidity of prices and wages results from the existence of monopolies in modern economies. Monopolies try to counteract declines in prices occurring as a reaction to lower demand. For variety of reasons they may prefer the reduction of production and employment. It is similar on the labour market. The power of trade unions is big enough not to allow declines in wages in the periods of recession. A general custom of concluding wage contracts for several years makes labour costs and general production costs rigid. This, in turn, discourages companies from lowering prices even in the case of overproduction.
In this place we will not carry out considerations on the abundant literature in the area. These are the issues of the theory of economy. Let us say though that orthodox Keynesianism accepted a priori the condition of price and wage rigidity. However, neo-Keynesianism made an effort to empirically verify this assumption. It did comprehensive research as to the functioning of economic entities whose aim was to show the entrepreneurs’ motivation to counteract reductions of prices. In order to authenticate its theory neo-Keynesianism tried to base the formulated theses on the modern economic reality.
The neo-Keynesian camp eventually accepted the fundamental statement of the neoclassical school on the negative impact of monetary impulses on the economy in the long run. However, neo-Keynesianism regards as purposeful the state influence on global demand through its macroeconomic financial policy. Its role is to correct the fluctuations of global demand and to stabilise production at such a level as to ensure full employment of the labour force and optimum utilisation of factors of production. The idea of full employment means the existence of some natural seasonal unemployment only.
As long as orthodox Keynesianism tended to correct the fluctuations of global demand through active fiscal policy, then the contemporary neo-Keynesian camp tends rather to use the monetary instruments of the central bank to activate

10 Andrzej Kaźmierczak
economy. There is a dominating view at present claiming that fiscal balance is indispensable to maintain the macroeconomic financial balance and stability of financial markets. Enlarging budget deficit in order to stimulate global demand could rather undermine the confidence of investors to financial market savings redistribution function. That is why it is more effective to correct undesirable changes in global demand through the impact of the central bank on money supply and interest rates. An active monetary policy consisting in conscious changes in money supply does not mean at all the switch of the Neo-Keynesian camp to the side of monetarism. Money supply changes are aimed at effecting interest rates on the interbank market and on the market of deposit and credit retail transactions. They are indispensable in order to implement the monetary policy.
As suggested before, the deficiencies of the market result, first of all, from the rigidity of prices and wages in modern economies, which are characterised by imperfect competition. The modern neo-Keynesianism recommends taking advantage of the deficiencies to implement the anti-cyclical monetary policy. The anti-cyclical policy is desirable because automatic adjustment processes are too slow.
2. The Concept of Inflation Goal
The neo-Keynesian trend of modern macroeconomics underlines the significance of the central bank in moderating business cycles. It shares the view of the neoclassical camp that the monetary policy should be trustworthy and transparent for the society. The conditions of the “constant rule” are met by the inflation goal of the monetary policy. The inflation goal is in fact a proposal of the neoclassical school opting for the passive role of the monetary policy. Its implementation consists, as a rule, in maintaining the price growth index at a low level close to 2–3% annually. The theory assumes that low inflation determines long term stabilised high production growth and low unemployment.
However, the legitimacy of inflation goal application is shared also by the neo-Keynesian school, on the other hand in favour of active monetary policy. It is so because the implementation of the inflation goal does not have to mean automatically the passivity of the central bank in the field of development of real economic processes. Everything depends on the height of acceptable inflation within the discussed goal. The neo-Keynesian camp is inclined to accept a higher inflation goal than recommended by the neo-classics. In the countries where the inflation goal is applied, annual growth index is set around 2.5%. Yet, it disputable whether or not a higher level of inflation poses a threat to the economic balance. According to some opinions a little higher price growth is not only not dangerous

Inflation Goal of Monetary Policy in the neo-Keynesian Model of Economy 11
for the financial balance but on the contrary – it stimulates the production growth. Higher prices of the sold production do improve the company profitability. Besides, inflation goal may be described in the form of permissible range of fluctuation of the price change index, e.g. +/- 1% about the set benchmark. Such a formula of inflation goal certainly creates proper conditions for the implementation of the active monetary policy.
Inflation goal is a clearly defined and publicly announced index for annual or longer periods. It is simple and understood by the whole society. The implementation of the inflation goal requires openness from the central bank in its information policy concerning the applied instruments of its monetary policy. Moreover, the effectiveness of monetary policy is easy to assess. After all, inflation rate is easy to notice, and possible mistakes difficult to conceal. Hence, the monetary policy carried out in the conditions of inflation goal must be highly professional and responsible.
The inflation goal requires that the central bank should formulate inflation expectations. Inflation forecast becomes simply an indirect goal of the central bank. As mentioned before, inflation goal is to be rated among the so-called “constant rule goals.” Central bank determines constant price growth index for annual and longer periods. Since inflation is affected by a variety of factors, the area of impact of the monetary policy on financial and real processes must be considerable. The majority of countries applying the inflation goal have recently built an element of elasticity in it. Inflation goal began to be described in the form of inflation range.
As it was mentioned earlier, inflation goal as an objective of monetary policy has some significant drawbacks. The central bank can influence only part of price determining factors. These are demand factors, i.e. the factors creating society’s global income. Thus, there is a possibility to control the so-called demand inflation. The central bank has no impact on the so-called supply factors, which determine production costs and then prices. Thus the central bank has no impact on cost inflation. The objective of its activity is then partially the supervision of phenomena beyond its control.
As it was mentioned above, inflation goal is to be classified among the so-called permanent rules of monetary policy. Irrespective of the current economic situation, the central bank is consistently, irrespective of temporary circumstances, obliged to follow the accepted formula. Thus, the central bank, is not able to carry anti-cyclical policy. It cannot correct undesirable production fluctuations and fight against unemployment. The level of economic activity is not an object of its interest. The only parameter within the interest of the central bank is the price growth index whose implementation is its only responsibility. Inflation goal

12 Andrzej Kaźmierczak
as an objective of the monetary policy is thus especially difficult to accept in less developed countries forcing through the policy of accelerated economic growth.
The effectiveness of implementation of inflation goal requires meeting certain conditions by the financial system of the country. First of all, the stability of the country’s financial system is indispensable. The financial system balance determines a lot of freedom in the monetary policy choice. It determines the operational freedom of the central bank.
Inflation goal cannot be implemented effectively in the face of high budget deficit creating additional incomes in the economy and leading to demand inflation. Thus, in the case of budget gap the central bank has no impact on prices.
The effective implementation of the inflation goal in the open economy requires the application of a floating exchange rate. It does not require central bank’s currency interventions resulting in internal money supply changes. Market exchange rate allows to fully control the amount of money in circulation in the country and to control the changes in prices. The fluctuations of external price of currency to a large extent isolate the internal economy from the impact of external economic factors.
3. Neo-Keynesian Approach to the Implementation of Inflation Goal
According to the neo-Keynesian concept of monetary policy, deficiencies in market mechanism operation and nominal price and wage rigidity in the economy enable to efficiently apply the monetary policy in order to influence the economic situation within a single business cycle. In a short run there is a positive correlation between inflation and unemployment. “The Phillips curve” works. Production growth leads to employment growth in the economy and rise in wage demands, then to more intense inflation expectations and to real inflation. And on the contrary, production decline results in unemployment growth and reduction in wage demands. And these phenomena impede inflation expectations and real price growth.
Let us remark that the neo-Keynesian camp perceives the above interde-pendence in a completely different way in the so-called long run or within a few business cycles. In this respect it shares the view of the neoclassical school. It confirms the correlation between production and inflation. Price growth as an indication of the lack financial balance in the country is harmful for the long run production growth.
However, for the Keynesian school, in contrast with the neoclassical camp, short run is important. Short run is important because of harmful impact of exogenic factors and external shocks on domectic equillibrium.

Inflation Goal of Monetary Policy in the neo-Keynesian Model of Economy 13
In the Keynesian concept of inflation goal the real interest rate is essential too, it is to be understood as a nominal rate reduced by the inflation index. There is also an expected real interest rate which consists of expected nominal interest rate and expected inflation. Expected inflation growth with the given nominal interest rate must lead to the decline in expected real interest rate. This, in turn, must result in global demand growth and real price growth.
There may be a positive and negative interest rate. The real rate is positive when its nominal level exceeds the inflation index. When the growth rate is higher than nominal rate, then in real terms the market interest rate is negative.
So far in the theoretical disputes over the role of the market and state in influencing the economic situation as well as economic growth standard graphic models LM and AS-AD have been used. At the end of the last century the neo-Keynesian trend presented the synthesis of both models called AD-IA. The acronym AD stands for aggregate demand and IA stands for inflation adjustment to production gap.
The Keynesian model of stabilisation of monetary policy considers four basic relations: 1) negative relation between real interest rate on one and production and
national income on the other hand. Real interest rate growth causes the decline in global demand, consumption and investment. It worsens the balance of foreign trade turnover. Real interest rate growth results in portfolio capital inflow to the country due to interest rate parity. Exchange rate appreciation worsens export price competitiveness and improves import price competitiveness. This impedes the output of export and anti-import sector. In all, the national income decline deepens. The consideration of the impact of interest rate shifts on the exchange rate may be perceived as a tentative attempt of analysis of monetary policy in the open economy.
The relation between real interest rate and production is shown in the upper part of Fig. 2:
The relation between real interest rate and production is presented by supply curve IS. It shows the state of market balance at different levels of real interest rate (r) and corresponding production values. Interest rate r0 corresponds to production Y0. Loan capital price rise up to r1 causes decline in production and GDP down to Y1. Of course, the reverse occurs when the interest rate falls. The relation presented above in analogous to the one presented in standard IS-LM model.

14 Andrzej Kaźmierczak
Figure 2. Relations between inflation, interest rate, global demand and production
Source: B. Snowdon, H. R. Vane, Modern Macroeconomics, Publ. Edward Elgar, 2005, p. 425.

Inflation Goal of Monetary Policy in the neo-Keynesian Model of Economy 15
2) positive relation between inflation and real interest rate. When inflation grows, the central bank raises the nominal interest rate. In this way it tries to maintain the real rate at least at the current level. If the central bank wants to raise also the real interest rate, then its nominal growth must higher than the inflation index. This relation is also demonstrated in the upper part of Fig. 2. When horizontal line MP expressing the height of inflation goal grows, real interest rate r also grows.
3) negative relation between inflation and production. It is shown by part b of Fig. 2. Inflation growth (P) reduces in real terms the society’s financial resources. It reduces then the global demand (AD) and expenditure in the whole economy. This, in turn, results in the production fall (Y). As shown in the upper part of the diagram, inflation growth additionally makes the central bank raise the interest rate. The rise in loan capital price reduces the demand for corporate and retail credits, which also results in the global demand decline.
4) positive relation between inflation and the degree of use of production capacity of the economy. It is the so-called modified Phillips curve IA. The relation is illustrated by Fig. 3.
Figure 3. Modified Phillips Curve – IA
Source: author’s own material on the basis of Fig. 4 below from B. Snowdon, H. Vane, Modern Macroeconomics, Publ. Edward Elgar, 2005.

16 Andrzej Kaźmierczak
This relation shows that inflation grows (with delay) when the current production is higher than the production that guarantees the optimum use of factors of production. Optimum production does not mean yet the full use of production capacities. Optimum production enables the employment of labour force resources at a natural level. In production optimum ensuring employment at the natural level only seasonal unemployment occurs. There is no structural unemployment.
When the current production is lower than the optimum level, inflation falls, with delay though. If the current production is equal to optimum utilisation of production capacities, the inflation index remains unchanged. Thus, if
y > y* then P↑y < y* then P↓
y = y* then P = const.
where:y – current production,y* – optimum production,P – inflation.
A certain delay in the change of price level results from nominal wage rigidity. In the contemporary economies of high-developed countries there are a few years’ wage contracts between employers and employees. Nominal wages are characterised by the rigidity also in the situations in which production changes together with labour force demand following it. New wage demands and nominal wages do not adjust to the new situation on the labour market until the current wage contracts expire. If, for instance, production grows, then despite a higher demand for labour force, wage demands and real wages will not rise until the old wage contracts expire, no sooner. As a result also the change in the level of prices will follow with a slight delay. Naturally, price delays are much smaller than wage delays. Prices react to market changes much faster than wages. The level of prices is influenced by a number of factors, not only wage costs.
The feature of nominal wage rigidity and price delay resulting from it, point to the neo-Keynesian model of monetary policy in the condition of implementation of inflation goal. As mentioned before, the Keynesian camp is inclined to use the element of nominal wage rigidity in order to implement an active stabilisation policy. If, in the period of validity of wage contracts, in the given country, money supply declines for reasons beyond control of the central bank (eg: outflow of speculative capital abroad), it creates an unfavourable deflationary situation in the economy. Production falls and unemployment grows. Unfavourable deflation may then be caused by reasons beyond the state’s control. Should one accept the

Inflation Goal of Monetary Policy in the neo-Keynesian Model of Economy 17
negative effects and wait till they pass and the market mechanism itself brings the economy back to the state of production optimum? This solution would be recommended by the neoclassical school. The neo-Keynesian camp is not inclined to accept the situation of unempoyment caused by external circumstances. It recommends the active monetary policy which contributes to additional issue of money in the economy and interest rate change. Indeed, higher supply of money will cause higher inflation. But moderate price growth, with wage contracts valid for several years will cause a favourable decline in real wages and decline in real production costs. This, in turn, will encourage companies to increase employment. Such a policy of reaction to negative supply shocks will favour the stability of production processes.
4. Neo-Keynesian Model of Stabilisation Policy AD-IA
If we combine the bottom part of Fig. 2 showing the relation between inflation, global demand and production with Fig. 3 showing the relation between inflation and the degree of utilisation of production capacities of the economy, we will obtain a graphical model of economy AD-IA, which is a modification of AS-AD model, a modification of a standard one commonly used in research. Figure 4 shows this model.
Figure 4. Model AD – IA
Source: B. Snowdon, H. R. Vane, Modern Macroeconomics, Publ. Edward Elgar, 2005, p. 427.

1� Andrzej Kaźmierczak
When the economy is in the state of optimum use of production capacities and full employment, then a possible global demand growth will result in inflation growth. Production will remain at the same level and only prices will grow. The above diagram shows the shift of straight line IA from level IA0 to IA1. The reason for the global demand to rise may be not only the monetary policy. The rise in society’s purchasing power may be caused by factors beyond the control of the central bank. In science they are described as the so-called supply factors. It may be budget deficit growth, rise in surplus of trade balance or foreign capital outflow. All these factors cause money supply growth and global demand growth, although they are not central bank objectives. However, they result in unpredicted price growth, which may be against the monetary policy inflation goal. Supply factors may work in the opposite direction. Budget surplus, trade balance deficit or foreign capital outflow cause decline in money supply and decline in global demand. This will bear fruit in the form of decline in production and unemployment growth. In model AD-IA line IA will shift from level IA0 downwards (not shown in the diagram). The deflationary situation may also be astonishing for the central bank.
Long term economic balance in the above model requires that global demand line AD should cross line IA at point ELR0. Only this point makes production optimal and unemployment at the natural level. It is only seasonal unemployment always occurring in the economy, not to be eliminated. Natural unemployment then is tantamount to nearly full employment. Long term balance point ELR0 correponds to inflation at level P0. Let us remind you that as an effect of exogenic demand shock (not depending on the central bank) global demand in the economy will grow. It is the so-called positive demand shock causing the society’s income growth. In the described model income growth is expressed by shift of line AD0 to the right to position AD1. The initial consequence of this phenomenon is production growth from Y* to Y1. It is the level already higher than the optimum level, close to maximum use of production capacities. The phenomenon of overheating of the economic situation is observed. In this situation a bottle neck begin to appear in the economy, though inflation still remains unchanged. In the diagram this situation is exemplified by the crossing point of line AD11 with line IA0. However, because the production is higher than that ensuring optimum employment, difficulties with enough supply of labour force appear. Y1 is higher than Y* and inflation accelerates. Line IA shifts upwards. The central bank reacts to this negative phenomenon raising the nominal, and as a result real interest rate. It is shown by line MP upward shift in the upper part of Fig. 3 on page 15. In AD-IA model, line IA keeps moving up. It rises to the level in which it will cross a new curve of global demand AD1. The crossing

Inflation Goal of Monetary Policy in the neo-Keynesian Model of Economy 1�
point of both lines ELR1 marks the new level of production in the economy. It is easy to notice that it is the production corresponding again to point Y*, thus close to the optimum use of production capacities to be accompanied by natural unemployment only. However, the new point of long term balance ELR1 corresponds to inflation growth from P0 to P1. Production is back then at the initial point, but with the higher price growth rate.
The new inflation index at level P1 may be higher than the inflation goal of the monetary policy assumed by the central bank. Thus, there is a need to stop the price growth. The central bank must apply available monetary policy instruments in such a way as to shift global demand curve AD to the left. It must be a deflation policy. The simplest and the most important instrument to lower global demand is naturally raising the basic interest rate. Such operations result in the decline of production to the level lower even than optimum level Y*, which means deflation in the economy, incomplete use of production capacities and unemployment growth. As a result of global demand reduction, inflation will also decline. In the extreme situation the inflation rate may decline even below the level set for the inflation goal by the central bank. In Fig. 4 line IA may go below P0 level, which is not shown in the diagram.
It is not the end of the course of events in the economy. The weakening of price growth rate is tantamount to real interest rate growth. Wit the given nominal interest rate, inflation decline must mean its growth in real terms. In the situation of deflation and increased unemployment it is not favourable for the economy. The central bank decides to lower the nominal and as a consequence the real interest rate. There is again a recovery of global demand, growth of production and employment. Production in the economy approaches optimum level Y* ensuring nearly full employment. In the economy there is only natural seasonal unemployment. And what is most significant, a good economic situation is accompanied by a low price growth corresponding to the inflation goal.
It can be seen then that the initial positive demand shock temporarily caused a short term production and price growth. In the case of negative demand shock, short term economic effects would be, of course, exactly opposite. Temporarily, production and prices would decline and unemployment would grow. In the long run everything comes back to the initial point. Production oscillates around optimum point Y*, and the price growth index is close to the set inflation goal. In the period of many production cycles the economy develops optimally, in a well-balanced way and with full employment.
Conclusions resulting from the neo-Keynesian model of economy functioning in the long run are in fact in conformity with the views of the neoclassical school. The latter does underline the significance of self-regulating forces within

20 Andrzej Kaźmierczak
the free market economy and spontaneous, well-balanced and optimal economic growth in long periods. The neo-Keynesian theory is even inclined to share the principal neoclassical thesis that state stimulated global demand in order to fight unemployment leads eventually to inflation growth only. In the field of production and employment it does not change anything. Fig. 4 shows it clearly. The neo-Keynesian AD-IA model presented above may be just as well described as “a new neoclassical synthesis.”
However, there are still some differences between both trends of the economic theory in the field of economic policy. The neo-Keynesian school claims that the central bank should compensate for undesirable effects of global demand declines caused by factors independent of the economic policy. These are, the above mentioned, exogenic supply factors which may cause decline in production and unemployment growth. The central bank should, for instance, make up for the global demand decline in the case of budget surplus, capital outflow abroad or deficit of current foreign turnover (it is worth reminding that the above phenomena result in the decline in money supply and society’s purchasing power. Thus, the task of the intervention policy is to adjust short term unfavourable shift in global demand which the central bank regards as undesirable and which have been caused by factors beyond its control. It is the central bank that should perform an active role in determining the volume of production and employment even within one economic cycle. It is well-known that the traditional Keynesianism placed emphasis on the active budget policy as a remedy for negative effects of production fluctuations. The contemporary neo-Keynesianism, in turn, underlines the significance of the monetary policy of the central bank in correcting global demand fluctuations. The instruments to mitigate their effects are changes in nominal and real interest rates in order to implement the inflation goal.
5. Bibliography
1. Croushore D., Money and banking. A policy oriented approach, Publ. Houghton Miffin Company, 2005.
2.MishkinF.S.,Ekonomikapieniądza,bankowościirynkówfinansowych,Publ.Nauk. PWN, 2002.
3. Snowdon B., Vane H. R., Modern macroeconomics, Publ. Edward Elgar, 2005.
4. Walsh C. E., Monetary theory and policy, Publ. MIT Press, 2000.

Anna Dąbrowska, Mirosława Janoś-KresłoWarsaw School of Economics
Consumers – the Motor of Their Own Role on the Market
1. Introduction
The new European Union consumer policy for the years 2007–20131 plays a central part in meeting the challenges the Union faces, i.e. economic growth, employment and ensuring better connecting with the citizens. The Commission will have three main goals in the field of consumer policy to fulfill in the discussed period: • to empower the EU consumers, which means ensuring that their having
a dominant role is profitable for all citizens and that it stimulates competition. Consumers having a strong position on the market need authentic choice, exact information, transparent markets and trust in effective protection and reliable law,
• to enhance the level of consumer welfare in relation to prices, choice, quality, diversity, affordability and safety of goods and services. Consumer welfare is the crux of well functioning markets,
• to effectively protect consumers against serious risks and threats that they cannot deal with as individuals. A high level of protection against threats is of primary importance for consumer confidence.
The so-formulated objectives represent a continuation of the previous consumer policy goals. Nevertheless, in relation to the earlier period, a change of pace and priorities has occurred. The consumer policy for the coming years will be more closely connected with other European policies and besides, a closer cooperation with member countries, which will reflect the increasing level of interdependence between consumer policy on the national and Union level, will be established.
In order to realize the above mentioned goals, the EU consumer policy will concentrate on the following key areas: • better monitoring of consumer markets and national consumer policies, • better legal regulations in the field of consumer protection,
1 Strategia polityki konsumenckiej UE na lata 2007–2013: wzmocnienie pozycji konsumentów,polepszenie ich dobrobytu oraz zapewnienie ich skutecznej ochrony, Komunikat Komisji do Rady, Parlamentu Europejskiego i Europejskiego Komitetu Ekonomiczno-Społecznego, Bruksela, dnia13.3.2007, KOM(2007)99 wersja ostateczna.

22 Anna Dąbrowska, Mirosława Janoś-Kresło
• better ways to reinforce the applicable consumer law and mechanisms to lay claims,
• better consumer information and education, • ensuring that consumer matters are at the heart of other EU polices and
regulations.Consumers are the core of European Union economy as their consumption
represents 58% of EU GDP and well informed, confident and empowered consumers are the motor of economic changes, for it is their choices that stimulate innovation and productivity2.
This article aims at presenting consumers as the creators of their position on the market by raising consumer awareness.
2. Consumers as the more vulnerable market participants
Despite a formally equivalent position as a contracting party to purchase-sale agreements, the individual consumer’s position is the weakest among the market players. This weakness of consumer’s position has many considerations; it is worth noting, for example, that the consumers’ existence on the market in a ‘must-situation’ resulting from the necessity to meet their needs, which restricts the freedom of activity, weakens their position and causes that due to the lack of alternative solutions they are willing to accept the suggested terms. Besides, the individual consumers’ scope of knowledge, which is necessary for them to make a rational decision, and their market experience cannot be compared with the possibilities that enterprises have at their disposal3. Moreover, consumers are not always capable of dealing with new trade techniques, enforced terms of sale, aggressive marketing or pseudo-promotions. The decisions consumers take, as often believed, are forced and not sovereign and the consumers themselves are manipulated with the help of various marketing techniques. As A. Lewicka-Strałeckawrote, “it is not the consumerswho decide about the quantity, type,prices, ways and conditions of producing merchandise but it is business that effectively persuades them to make such choices as lie within its interest”4.
Violation of consumer rights may concern both individuals and groups. In 2005 UOKiK (Office of Competition and Consumer Protection) conducted 450 proceedings involving violation of consumers’ collective interests and also
2 Ibidem.3 A. Dąbrowska, M. Janoś-Kresło, Wirtuozeria działań marketingowych a świadomość konsumen-
cka, w: Edukacja konsumencka. Cele, instrumenty, dobre praktyki, redakcja naukowa A. Lewicka--Strzałecka,WydawnictwoWSPiZ,Warszawa2006.
4 A.Lewicka-Strzałecka,Oodpowiedzialnościkonsumenta, „Prakseologia”2002,Nr142, p. 162.

Consumers – the Motor of Their Own Role on the Market 23
647 times took action against entrepreneurs who attempted to remove unlawful contractual clauses from legal transactions. 524 lawsuits were completed in 2005: in 439 cases the entrepreneurs complied with the recommendations and in 85 cases statements of claim were filed to the Court of Competition and Consumer Protection; the number of clauses considered to be unlawful amounted to 2955. For this purpose regular inspections, among others in banking, education, repair and building, tourism, developer or gas sectors have been carried out (Table 1).
Table 1. The number of entrepreneurs inspected by UOKiK in 2005
SectorNumber of inspected
entrepreneursNumber of entrepreneurs
guilty of irregularities
Tourism 188 122Repair and building 221 77Insurance 4 2Financial 5 4Telecommunications 10 7Education 77 63Medical 22 2Construction 20 11Sanatoriums and health resorts 93 2Real estate management 16 15Estate developer services 4 4Stockbroker services 19 19
Source: Results of UOKiK branches in 2005.
The highest numbers of irregularities were found in the tourism sector. Most often they concerned: granting a right to a unilateral change of contract by a tourism organizer (usually the price) without a justified cause, exclusion or limitation of organizer’s liability in case of last minute offers, exclusion of obligation to return the payment to consumers in cases of their resignation from participating in the event, restricting possibilities of effective enforcement of consumers’ claims, stipulating that any possible disputes will be resolved by a court appropriate for the tourism organizer’s registered office.
In 2005 President of Office of Competition and Consumer Protection completed 59 lawsuits filed in 2004 and in 160 cases took new actions, which represents a 51% increase over 2004. Such products as toys, car sprinkler liquids, furniture, household equipment, vehicles and car accessories have been challenged.
5 Sprawozdanie z działalności Urzędu Ochrony Konkurencji i Konsumentów za 2005 rok, UOKiK,Warszawa 2006.

24 Anna Dąbrowska, Mirosława Janoś-Kresło
Legality and integrity of service providers offering the most universal and looked for services were also controlled by Trade Inspection. In the first quarter of 2006 altogether 201 entrepreneurs who were active in urban agglomerations were inspected. As a result of the inspection activities, irregularities of different levels of risk for the customers’ interests were revealed in 42% of enterprises.
Bank credits are among the most significant categories the consumers, having many reservations to their providing, bring to the attention of Commissioners for Consumer Rights. As observed on the example of Municipal Commissioner for Consumer Rights in Warsaw the following cases are predominant6: • consumer credit agreements, especially as relates to the consumer’s right
to withdraw from the credit agreement within 10 days and terms and conditions of concluding consumer credit agreements,
• legitimacy of entering consumers in the register of Credit Information Office, which cooperates with 25 banks controlling 80% of retail credit market. The Office daily passes on to banks some 15 thousand reports about persons who apply for or have received credits. Its database includes some 14mln bank clients,
• time-barred claims’ collection, • fees the banks charge for their services, changes of fees for keeping an
account after concluding an agreement, the amount of collection charges.Yet another time the Seym will consider the consumer insolvency bill, which
will enable anyone who found himself in the debt loop to declare himself bankrupt. A consumer who cannot handle repayment of the credit might once in his/her lifetime place a bankruptcy petition with the Consumer Adjudicating Collegium, which would be functioning within the UOKiK. At the time the bank could not send debt collectors or charge penalty interest but could only negotiate new terms of repayment7.
The situations presented above constitute a threat to consumer rights and interests and at the same time prove that the consumer is the more vulnerable market player whose position has to be protected.
Not only the need to realize consumer rights but also activities connected with building a domestic market have been at the bases of the Union consumer policy. For it is efficient competition that makes a very important, if not the most important, tool of consumer protection. Weakened competition favours offering goods and services not only at higher prices and of inferior quality but also of lower level of innovativeness, which causes that both consumers and the economy
6 Sądy konsumenckiew sferze usług bankowych –w praktyceMiejskiegoRzecznikaKonsumentów.A speech delivered at the conference on Banking Services Market in European Union organized byUOKiK inWarsawonJanuary25th2007.
7 Information obtained from Office of Competition and Consumer Protection.

Consumers – the Motor of Their Own Role on the Market 25
lose. “Synergy between consumers and competition policies has also brought possibilities to transfer the legal or procedural solutions which were effective in the fist area to the latter”8.
It has been shown that there are numerous examples of infringing consumer rights, which proves the need to strengthen consumer’s position on the market, especially by educational activities. Consumer education and information lie at the basis of consumer protection, for all solutions, both legal and institutional, apply only to the extent to which they exist in the consciousness of market participants, including consumers. Therefore such diverse educational and informational activities as e.g. publications informing consumers about their rights, radio and TV broadcasts and advertising (billboards) should receive a positive opinion.
However it would be difficult not to notice a reverse situation – when it is the consumer who has become the unethical party in market relations. A tendency to abuse consumer rights has been observed, which is clearly seen in cases of complaints concerning e.g. shoes, which are more numerous when the season is coming to an end, cameras and film cameras, which increase after the First Communion period; there are even attempts to return these goods as well as formal clothing on Mondays after Friday shopping. Insurance is a specific area of unlawful customer activities. According to insurance companies, the most frequent insurance frauds occur in: • motor insurance – collusions between collision participants, • property insurance – overvaluing damages and client’s property, • business insurance – overvaluing damages and company’s property, • life assurance – providing untrue information concerning the client’s health.
On the other hand, as the data provided by the Insurance and Pension Funds Supervision Commission show, complaints of insurance companies’ clients in the field of property insurance and life assurance mostly concern: refusal to pay a part or the whole of compensation (some 15% of life assurance cases and some 8% of property insurance), insurance agent’s activities (6% account for life assurance), untimely claim settlement and compensation payments.
3. Building Consumer’s Position on the Market
With reference to the question of consumers building their position on the market, we have used the results of a survey carried among consumers in 4 countries,
8 �. Banasiński, Słowo wstępne, w: Polityka ochrony konsumentów i polityka konkurencji – razem�. Banasiński, Słowowstępne, w: Polityka ochrony konsumentów i polityka konkurencji – razemczy osobno, UOKiK, Warszawa 2006, page 11. Also other papers and publications on the subjectAlso other papers and publications on the subject of relations between competition and consumer policies have been mentioned in this work.

26 Anna Dąbrowska, Mirosława Janoś-Kresło
i.e. Poland, Lithuania, Latvia and Ukraine9. The survey covered the following areas connected with the consumer’s position on the market: 1) sources of information on consumer protection, 2) knowledge of regulations concerning complaints about goods and
services, 3) accuracy of reading and verifying the contents of agreements when using
services, 4) estimating the need for a periodical dealing with consumer matters, 5) knowledge of consumer institutions and organizations.
3.1. Sources of Information on Consumer Protection
Regardless of the country, television is the main source of information on consumer protection, although the indicator percentage in each country differs, being the lowest in Ukraine. It both shows and proves the potential power of impact of television in all these countries. In all the countries press has been placed second, in Poland, Lithuania and Latvia radio is third, and in Ukraine it is friends and family. A car is the place where we listen to the radio most often but both in Lithuania and Latvia less than 50% of cars are equipped with radios.
Table 2. Sources of information on consumer protection (% of indication)
If and when have you met withinformation on consumer protection?
Lithuania(N = 301)
Latvia(N = 2��)
Ukraine(N = 1000)
Poland(N = �23)
TV 46.2 61.1 34.9 62.2Rradio 18.9 29.5 12.2 16.3Press 25.6 38.3 23.5 22.8The Internet 12.3 13.8 1.6 3.9Shop/Service point 8.0 6.4 7.1 1.8Representatives of a consumerinstitution or organization 2.7 4.0 6.0 1.9
Friends, family 11.3 17.8 15.8 5.5Never heard of it 21.6 16.1 26.3 29.8
Source: own research based on reports from a survey: Pozycja konsumenta I zmiany w konsumpcji..., op. cit.
As for Lithuania and Latvia attention needs to be drawn to a relatively high percentage of indications relating to the Internet, which is primarily the effect of
9 PozycjakonsumentaizmianywkonsumpcjiwkrajachEuropyŚrodkowo-WschodniejporozszerzeniuUnii Europejskiej. A survey financed from the means allocated by MNiSzW Nr 1 HO2C 050 29 and carried in 2006-2007 by IRWiK. A. Dąbrowska iM. Janoś-Kresło are the authoresses of theresearch tool. The research was done by GfK in 2006.

Consumers – the Motor of Their Own Role on the Market 27
availability of this source of information. In Lithuania, 20.3% of the respondents had the Internet connection at home, in Latvia – 25.5%. In Poland, 17.4% of respondents had access to the Internet. Relatively few people mentioned consumer institutions and organizations as a potential source of information on consumer matters.
A nation-wide survey conducted on a representative group of adult Poles points to differentiation due to place of living. It is enough to mention that more than 40% of rural inhabitants have never come across information on consumer protection. The index does not amount to much over 14% in urban agglomerations (Table 3).
Table 3. Places where information on consumer protection was acquired
Places where information on consumer protection was acquired(% of respondents in a given group)
Size of a locality villagetown under
500 thousandtown over
500 thousandtotal
Television 51.1 68.8 73.5 62.2Radio 17.2 13.5 25.5 16.3Press 21.7 21.3 33.7 22.8The Internet 1.7 3.7 13.3 3.9Shop/Service point 1.4 1.8 3.1 1.8Representatives ofconsumer institutionsand organizations
0.6 2.5 4.1 1.9
Friends, family 5.3 5.5 6.1 5.5Never heard of it 40.6 24.3 14.3 29.8
Source: as above in Table 2.
For several years now television has been a decided leader in communicating information about consumer protection10.
3.2. Knowledge of Regulations Referring to Complaints about Goods and Services
Consumers create their position on the market by acquiring knowledge on regulations concerning lodging complaints about goods and services. The research has shown that this knowledge is usually perfunctory. Definite majority of respondents do not know the regulations; this especially concerns Lithuanians and Latvians and to a lesser extent Ukrainians and Poles (Table 4).
10 Asseenintheearlierworksoftheauthoresses:A.Dąbrowska,M.Janoś-Kresło,I.Ozimek,Ochronaiedukacjakonsumentówwewspółczesnejgospodarcerynkowej,PWE,Warszawa2005;A.Dąbrowska,M.Janoś-Kresło,Wirtuozeriadziałańmarketingowych...,op. cit.;also:I.Ozimek,Bezpieczeństwożywnościw aspekcie ochrony konsumenta w Polsce, Wydawnictwo SGGW, Warszawa 2006, p. 202 and following.

2� Anna Dąbrowska, Mirosława Janoś-Kresło
Table 4. Knowledge of regulations referring to complaints about goods and services
SpecificationLithuania(N = 301)
Latvia(N = 2��)
Ukraine(N = 1000)
Poland(N = �23
Definitely don’t know 23.3 18.8 13.9 13.8Rather don’t know 27.6 28.9 22.1 24.2Neutral (neither knownor don’t know) 23.3 18.8 20.2 22.3
Rather know 18.6 25.2 23.4 29.5Definitely know 0.3 5.4 5.5 6.0Undiceded (Hard to say) 7.0 3.0 14.9 4.3
Source: the same as in Table 2.
Almost every fifth respondent in Latvia, every third in Lithuania and Ukraine and every fourth in Poland was unable to give a decisive answer. It should be rather regarded as unwillingness to admit to being unfamiliar with the regulations, especially that the questionnaire offered such a possibility.
In relation to the situation in Poland in the light of the Act on specific terms and conditions of consumer sale, the consumer is a person who does not purchase goods for the purpose of carrying economic activity11. On average 6% of Poles admit that they definitely know regulations concerning complaints about goods and services and the percentage increases two-fold among inhabitants of large agglomerations. In the country, only 2.5% of population claim to know the regulations (Table 5).
Table 5. Self-assessment of the level of knowledge of regulations referring to complaints about goods and services
Self-assessment of the level of knowledge of regulation referring to complaintsabout goods and services (percentage of respondents in a given group)
Size of locality villagetown under
500 thousandtown over
500 thousandtotal
Definitely don’t know 13.6 14.2 12.2 13.8Rather don’t know 27.8 23.4 14.3 24.2Neutral (Neither knownor don’t know) 23.6 20.4 25.5 22.3
Rather know 27.2 31.0 31.6 29.5Definitely know 2.5 7.3 13.3 6.0Undecided (Hard to say) 5.3 3.7 3.1 4.3
Source: as in Table 2.
11 Ustawazdnia27lipca2002r.oszczególnychwarunkachsprzedażykonsumenckiejorazozmianieKodeksu Cywilnego. Dz.U. z 2002 r. Nr 141, poz. 1176 as amended.

Consumers – the Motor of Their Own Role on the Market 2�
3.3. Accuracy of Reading and Verifying the Contents of an Agreement when Using Services
Consumers’ position on the market and their possibilities to execute their rights is defined by their consumer awareness regarding the need of accurate reading of agreements before they are signed and also verifying provisions which allow withdrawing from the agreement or claiming compensation. The results of the survey let us formulate a thesis that years of functioning in the conditions of market economy and sometimes painfully getting acquainted with the consequences of not reading the agreements had caused that consumers became more market-aware. Presently, 60–70% of Poles definitely or rather carefully read agreements and verify the most important provisions. Better results have been achieved in Latvia and Ukraine (Table 6).
Table 6. Accuracy of reading and verifying an agreement on using services before signing it
Specification Lithuania Latvia Ukraine PolandDefinitely not 3.7 0.7 3.8 3.0Rather not 7.3 7.7 6.9 14.0Neutral (Neither yes nor not) 39.2 6.4 7.9 10.7Rather yes 25.6 35.2 33.8 35.0Definitely yes 20.6 47.0 31.7 31.5Undecided (hard to say) 3.7 3.0 15.9 5.7
Source: the same as in Table 2.
As for information concerning the results of possible withdrawal from the agreement and verifying terms and conditions of lodging complaints, the percentage of answers is fairly similar. A relatively high percentage of Lithuanian respondents who chose the “neither yes nor not” and “hard to say” answers may be very well interpreted as just leafing through agreements or assumed it is just a way to avoid giving an unambiguous answer (Table 7).
Table 7. Accuracy of verifying information on effects of a possible withdrawal from the agreement
Specification Lithuania Latvia Ukraine PolandDefinitely not 2.0 1.3 4.1 3.0Rather not 13.0 9.1 6.7 17.0Neutral (Neither yes nor not) 30.6 9.1 7.7 13.4Rather yes 32.2 32.6 31.6 35.5Definitely yes 18.3 42.6 30.6 25.3Undicided (hard to say) 4.0 5.4 19.3 5.8
Source: as in Table 2.

30 Anna Dąbrowska, Mirosława Janoś-Kresło
As relates verifying agreements for terms and conditions of lodging complaints, the most advantageous situation was observed in Latvia. Consumers in Lithuania, on the other hand, paid the least attention to the problem (Table 8).
Table �. Accuracy of verifying terms and conditions of complaints
Specification Lithuania Latvia Ukraine PolandDefinitely yes 4.0 1.7 4.0 3.1Rather not 12.6 11.1 7.0 15.4Neutral (neither yes nor not) 30.9 9.1 8.3 11.9Rather yes 29.6 31.2 30.3 39.0Definitely yes 18.3 41.3 30.7 25.1Undecided (hard to say) 4.7 5.7 19.7 5.5
Source: the same as in Table 2.
Below we have presented the situation of Polish consumers divided with respect to their place of residence. Consumers living in rural areas chose the “rather” option while town inhabitants chose the “definitely” option (Table 9).
Table �. Accuracy of reading and verifying the contents of agreements when using services
Do you carefully read or verify the contents of an agreement when using paidservices? (percentage of respondents in a given group)
Size of locality villagetown under
500 thousandtown over
500 thousandtotal
Text of the agreementbefore signing
1 1.4 3.9 5.1 3.02 17.2 11.5 13.3 14.03 11.1 10.1 12.2 10.74 39.2 32.1 32.7 35.05 23.6 37.6 33.7 31.56 7.5 4.8 3.1 5.7
Possibilities andconsequencesof withdrawal fromthe contract
1 1.9 3.4 5.1 3.02 19.4 15.6 14.3 17.03 14.4 11.7 17.3 13.44 39.2 33.7 29.6 35.55 17.2 30.5 31.6 25.36 7.8 5.0 2.0 5.8
Terms and conditionsof complaints
1 1.9 3.9 4.1 3.12 19.2 11.9 17.3 15.43 12.5 11.0 13.3 11.94 43.1 36.5 35.7 39.05 15.3 32.6 27.6 25.16 8.1 4.1 2.0 5.5
1 – decidedly not; 2 – rather not; 3 – neither yes nor not; 4 – rather yes; 5 – decidedly yes; 6 – hard to say.
Source: the same as in Table 2.
Consumers – the Motor of Their Own Role on the Market 31
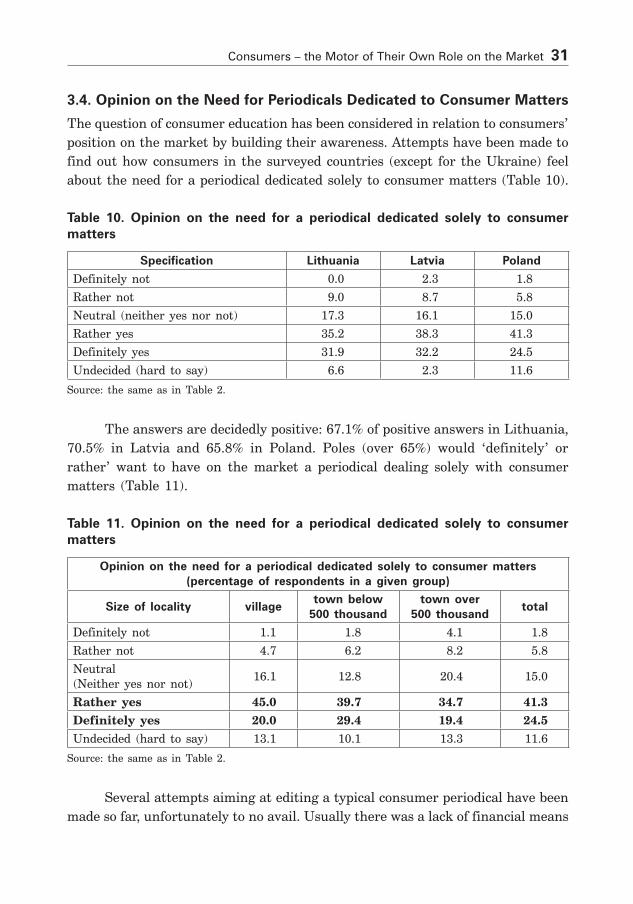
3.4. Opinion on the Need for Periodicals Dedicated to Consumer Matters
The question of consumer education has been considered in relation to consumers’ position on the market by building their awareness. Attempts have been made to find out how consumers in the surveyed countries (except for the Ukraine) feel about the need for a periodical dedicated solely to consumer matters (Table 10).
Table 10. Opinion on the need for a periodical dedicated solely to consumer matters
Specification Lithuania Latvia Poland
Definitely not 0.0 2.3 1.8Rather not 9.0 8.7 5.8Neutral (neither yes nor not) 17.3 16.1 15.0Rather yes 35.2 38.3 41.3Definitely yes 31.9 32.2 24.5Undecided (hard to say) 6.6 2.3 11.6
Source: the same as in Table 2.
The answers are decidedly positive: 67.1% of positive answers in Lithuania, 70.5% in Latvia and 65.8% in Poland. Poles (over 65%) would ‘definitely’ or rather’ want to have on the market a periodical dealing solely with consumer matters (Table 11).
Table 11. Opinion on the need for a periodical dedicated solely to consumer matters
Opinion on the need for a periodical dedicated solely to consumer matters(percentage of respondents in a given group)
Size of locality villagetown below
500 thousandtown over
500 thousandtotal
Definitely not 1.1 1.8 4.1 1.8Rather not 4.7 6.2 8.2 5.8Neutral(Neither yes nor not) 16.1 12.8 20.4 15.0
Rather yes 45.0 39.7 34.7 41.3Definitely yes 20.0 29.4 19.4 24.5Undecided (hard to say) 13.1 10.1 13.3 11.6
Source: the same as in Table 2.
Several attempts aiming at editing a typical consumer periodical have been made so far, unfortunately to no avail. Usually there was a lack of financial means

32 Anna Dąbrowska, Mirosława Janoś-Kresło
to edit such a journal. Although there is on the market “Świat konsumenta”,a low circulation journal which has been published for three years, it is not a periodical of a consumer organization.
3.5. Knowledge of Consumer Institutions and Organizations
Consumers are not solitary in their activities. Government institutions and consumer organisations care for observing the rights the consumers are entitled to. They offer the consumers help and advice, are prepared to represent them in courts of arbitration and in common courts of law. However, the consumers may take advantage of the help offered by these institutions only if they are aware of their existence.
The knowledge about these institutions has been examined only with reference to the situation in Poland. The Office of Competition and Consumer Protection is the best know among them; however it is much better known in big towns than in villages. The Consumer Federation has taken the second place (Table 12).
Table 12. Knowledge of consumer institutions and organizations
Which government institutions and social organizations deal with consumer protection and education? (percentage of respondents in a given group)
Size of locality villagetown below
500 thousandtown above
500 thousandtotal
UOKiK (Office of Competitionand Consumer Protection) 27.8 34.6 45.9 33.1
Commissioner of Consumer Rights 8.1 9.4 7.1 8.6Trade Ispection 14.7 21.1 23.5 18.8Consumer Federation 10.0 20.0 31.6 17.2European Consumer Centre 1.1 2.3 4.1 2.0Association of Polish Consumers 3.3 6.0 9.2 5.3Others 0.8 1.1 2.0 1.1Hard to say 58.0 41.7 27.6 46.8
Source: the same as in Table 2.
4. Conclusion
In the light of the results one may state that consumers’ position on the market is the more vulnerable, which is proved by numerous examples of irregular entrepreneurs’ behavior discovered by consumer institutions.
We may put forward a thesis that it is the consumers who bring about the vulnerability of their position on the market. As the surveys have shown,
Consumers – the Motor of Their Own Role on the Market 33
many consumer do not carefully read the agreements before signing them, which means that by signing the papers they agree to terms and conditions dictated by the service provider.
Market conditions and often-presented in the media poor experiences of other consumers have caused, as may be assumed on the bases of the authoresses’ former research, that more and more consumers carefully read and verify agreements before signing them, pay attention to the effects of possible withdrawal form the agreement and to terms and conditions of lodging complaints; in other words they are becoming more demanding clients, thus strengthening their position on the market in relation to service providers; they also protect their financial interests. All consumers benefit due to such responsible behaviors.
Unfortunately, even though consumers declare that when signing agreements, they pay attention to the terms and conditions of complaints, the knowledge of regulations concerning complaints about goods and services is insufficient. Consumers who have no knowledge of solutions available in this area may be subjects to specific manipulations. Consumers who are not familiar with regulations are unable to estimate if terms and conditions of complaints included in agreements comply with the applicable law or if they do not infringe their interests.
Activities which may strengthen consumers’ position on the market are connected with education. The consumers’ need for information and education is proven by a high percentage of answers concerning a regular consumer periodical which will provide objective and reliable information on consumer matters. Besides, activities of consumer institutions and organizations should be strengthened so that they might play a considerably more important role than until now in promoting and protecting consumer interests.
Finally it is worth mentioning that assisting consumers in their rights as well as ensuring their success and welfare are essential European Union values, which is reflected in the provisions of Union legislation. The basic principles stating how the EU law protects consumers, regardless of where they stay, are as follows: 1) consumers have a possibility to purchase goods at their discretion and
in a place they choose, 2) consumers have the right to return faulty goods, 3) consumers are protected by high safety standards for foodstuffs and
other consumer goods, 4) consumers have the right to know what they eat and drink, 5) consumers must be provided with fair terms and conditions of agreements, 6) consumers have the right to change their mind,

34 Anna Dąbrowska, Mirosława Janoś-Kresło
7) consumers must be allowed to compare prices, 8) consumers cannot be misled, 9) consumers need to be assured of protection while on holidays, 10) consumers need to be assured of help in effective settling cross border
disputes.
5. Bibliography
1.DąbrowskaA.,Janoś-KresłoM.,OzimekI.,Ochronaiedukacjakonsumentówwewspółczesnej gospodarce rynkowej,PWE,Warszawa2005.
2.DąbrowskaA.,Janoś-KresłoM.,Wirtuozeriadziałańmarketingowychaświa-domość konsumencka, w: Edukacja konsumencka. �ele, instrumenty, dobrepraktyki, redakcja naukowa A. Lewicka-Strzałecka, Wydawnictwo WSPiZ,Warszawa 2006.
3.Lewicka-StrzałeckaA.,Oodpowiedzialnościkonsumenta,„Prakseologia”2002,Nr 142.
4.OzimekI.,BezpieczeństwożywnościwaspekcieochronykonsumentawPolsce,Wydawnictwo SGGW, Warszawa 2006.
5.Polityka ochrony konsumentów i polityka konkurencji – razem czy osobno,UOKiK, Warszawa 2006.
6.Pozycja konsumenta i zmiany w konsumpcji w krajach Europy Środkowo--WschodniejporozszerzeniuUniiEuropejskiej.GrantfinansowanyześrodkówMNiSzW Nr 1 HO2C 050 29.
7.Sądy konsumenckie w sferze usług bankowych – w praktyce MiejskiegoRzecznikaKonsumentów.Referatwygłoszonynakonferencjint.Rynekusługbankowych w Unii Europejskiej zorganizowanej przez UOKiK, Warszawa 25 stycznia 2007 r.
8.Sprawozdanie zdziałalnościUOKiKza2005 rok. 9. Strategia polityki konsumenckiej UE na lata 2007–2013: wzmocnienie pozy-cji konsumentów, polepszenie ich dobrobytu oraz zapewnienie ich skutecznejochrony, Komunikat Komisji do Rady, Parlamentu Europejskiego i Europejskiego KomitetuEkonomiczno-Społecznego,Bruksela,dnia13.3.2007,KOM(2007)99wersja ostateczna.

Joanna CyglerWarsaw School of Economics
Hypercompetitive Trends as a Premise to Create Co-opetitive Relations
1. Introduction
The last fifty years have abounded in economic, social and political phenomena changing, both, the environment and the rules of competitors market game.
Hypercompetitive environment is marked by substantial turbulences, difficult to predict and estimate. In the hypercompetitive environment competitive advantages are of temporary nature and their temporariness depends on their speed and aggressiveness. Hypercompetition occurs mainly in technologically advanced sectors (e.g. ICT, car industry, consumer electronics, aviation, pharmaceutical and chemical industries and the mass media). Symptoms of hypercompetition can also be observed in the service sector (e.g. financial services, healthcare), shipbuilding, furniture, packaged food industries and retailing1.
2. Factors Stimulating Hypercompetition
Hypercompetition is stimulated along with globalisation of sectors and technological development, which results in increasingly fierce competition not only at a domestic but also international level. That is why hypercompetitive relations are already of global nature and are not confined to specific geographic and economic regions.
Globalisation made hypercompetition significant and visible in the relations of transnational corporations. Due to strong and mutual ties they are instantly moved from one region of the world to another, creating a global issue. Growing competition on global markets uncovers existing business models because competitive advantages more and more often based on changing economies of scope, rather than scale2. This change is related to corporations’ increasing
1 R. A. D’Aveni, R. Gunther, Hypercompetitive Rivals. Competing in Highly Dynamic Environments, The Free Press, New York 1995, p. 154; R. Makadok, Can First-Mover and Early-Mover Advantages beSustainedinanIndustrywithLowBarrierstoEntry/Imitation?,“StrategicManagementJournal”,Vol. 19, 1998, pp. 683–696, R. A. D’Aveni, Waking Up to the New Era of Hypercompetition, “The Washington Quarterly”, Vol. 21, No. 1, Winter 1998, pp. 183–195.
2 M. Harvey, M. M. Novicevic, T. Kiessling, Hypercompetition and the Future of Global Management in the Twenty-first Century, “Thunderbird International Business Review”, Vol. 43(5), 2001, pp. 599–616;

36 Joanna Cygler
inteterest in intangible assets which are more mobile and more difficult to imitate and substitute. Existing intangible assets considerably limit companies in their development of prompt reconfiguration of competitive advantages and their development on a global scale.
Globalisation is inseparably accompanied by technological innovation. On the one hand technological changes lead to mass production and to flexible specialisation on the other hand.
Mass production enables corporations to lower production costs (among others by standardization and typification), causes relocation of single departments and the production of the whole sectors to the industry (most frequently extensive) located in the regions with comparative and competitive advantages offered by the host countries3. Flexible specialisation, according to C.Freeman, is shaped by technological changes in five basic areas: information technology, biotechnology, material technology, energy technology and space technology, which concurrently are the most capital- and research-intensive4. Thanks to advances in transport and communications distances and the time necessary for world market players to cover them have shrunk. Any disruptions in the movement of goods (services) and information worldwide have been minimized. Technological advances in telecommunications and computer services have provided for globalisation and homogenisation of needs, which has resulted in increasing opportunities for corporations to benefit from the scale effect and production range, as well as, marketing activity.
Simultaneously they become incentives to make competition among corporations even more fierce. Changes in information technology contribute to the flexibility of transnational corporations (due to faster responding to market changes, abilities to adjust and new manufacturing techniques). They also arouse high capital intensity and increased demand for innovation (technical and technological) and highly-qualified workforce. The dynamic technological development brings about enormous expenditure of transnational corporations on research and development (often amounting to a few billion dollars a year)5. Such
M. Harvey, M. M. Novicevic, The hypercompetitive global marketplace: the importance of intuition and creativity in expatriate managers, “Journal of World Business”, Vol. 37, 2002, pp. 127–138.
3 M. E. Porter, Competitive Advantage of Nations, The Free Press, New York 1990, pp. 69–277; W. Kummerle, The drivers of foreign direct investment into research and development: an empirical investigation, “Journal of InternationalBusinessStudies”,Vol. 301999, pp. 1–24.
4 C. Freeman, The Challenge of New Technologies, in OECD, Interdependence and Co-operation in Tomorrow’s World, OECD, Paris 1987 pp. 123–156; World Investment Report. Transnational Corporations and Internationalization of R&D, UNCTAD, New York and Geneva 2005, pp. 107–109.
5 For example in 2006 Siemens A.G. spent E 5.7bn on R&D (28% on information and telecommunications,For example in 2006 Siemens A.G. spent E 5.7bn on R&D (28% on information and telecommunications, 20% on transport, 19% on automatic systems and control, 16% on medicine), Intel spent USD 5.9bn, HP – USD 3.5bn 3,5 mld USD, 3M – USD1.5bn.

Hypercompetitive Trends as a Premise to Create Co-opetitive Relations 37
significant financial burden entails the necessity of payback through the scale of sales and even more fierce competition in pursuit of payback in the shortest time possible. The outlays on R&D are geographically concentrated around the Triad-countries which are dominated by the United States, Canada, Great Britain, Japan,FranceandGermany(80%ofoutlaysonR&D)6. They are the main arena of competition arising from developments in technology.
Major changes determined by internationalization and technological advancement are accompanied by processes related to deregulation and privatization. The dynamics of the changes and their complexity have been growing continuously in the hypercompetitive environment, which makes the direction of development of the whole system unpredictable. Concurrently, rapid changes in the environment contribute to staggering changes in sectors – as new competitors appear the existing market players are quickly repositioned7. Considerable turbulances of the environment and unexpected changes of the rules of the competitive game pose not only serious threats but also provide ample opportunities of development. It polarizes companies and their chances of market success: some of them become great winners and others – great losers8. The necessity to redefine the sector is getting equally important. Hypercompetition does not refer to individual sectors. Rivalry among competitors diffuses across related sectors and, as a result, it becomes a widespread phenomenon9.
3. Corporate Strategic Behaviour in Hypercompetitive Environment
Hypercompetition forces participants to change the rules of the game. R.A.D’Aveni while criticising rather static concept of competitive strategies of E. M. Porter points to the changes of competitors’ behaviour in four basic areas: • price/quality,
6 Growing significance of Central and Eastern European countries and Asia (China, India, South Korea and Singapore) as world R&D investment destinations is also emphasized. The countries of Latin America and Africa have been nearly marginalized. World Investment Report. Transnational Corporations and Internationalization of R&D, UNCTAD, New York and Geneva 2005, pp. 106–107; World Investment Report. FDI from Developing and Transition Economies: Implications for Development, UNCTAD, New York and Geneva 2006, pp. 46–77; S. E. Feinberg, A. K. Gupta, Knowlwdge Spillovers and the Assigment of R&D Responsibilities to Foreign Subsidiaries, “Strategic ManagementJournal”,Vol. 25, 2004, pp. 823–845.
7 W. C. Bogner, P. S. Barr, Making Sense in Hypercompetitive Environments: A Congnitive Explanation for the Persistence of High Velocity Competition, “Organization Science”, Vol. 11, No. 2, March–April 2000, pp. 212–226.
8 E. Rühli, The Concept of Hipercompetition – a New Approach to Strategic Management in Large Multinational Firms, “Strategic Change”, Vol. 6, 1997, pp. 377-390.
9 L. G. Thomas III, The Two Faces of Competition, “Organization Science”, Vol. 7, No. 3, 1996, pp. 221–242.

3� Joanna Cygler
• know – how/timing, • stronghold creation, • deep pockets10.
Shortening the product life cycle and aggressive attacks (and retaliation) erode competitive advantages. It is clearly visible in case of creating price-quality advantages which erode as a result of price wars (open and hidden). Price wars are stimulated, among others, by customers showing arrogative attitude, who expect premium products and, at the same time, exert pressure on lowering their prices11. They burst with impatience and demand the goods to be available immediately. It makes companies (even household names) sell their products (services) at discount prices and wage price wars12.
The price-quality ratio concerns primarily the situations when companies offer relatively homogenous goods (services). Companies create competitive advantages mainly by minimizing costs or raising prices in order to increase margins. They also increase the scale of production and spread fixed costs over a larger number of production units. Companies try to offer standard, low-priced down-market products and luxury products of premium value for consumers (e.g. car industry). Aggressive imitation by competitors weakens price-quality competitive advantages. K. Ohmae pointed to the dynamics of the market game in hypercompetitive sectors and emphasised the necessity to allow for the action of responsive competitors while designing strategic operations13. In case of price-quality strategy hypercompetitive companies try to increase the distance from their rivals (mainly by an on-going escalation of requirements to create competitive advantages) and by limiting opportunities and willingness of competitors to attack aggressive rivals (mainly by effective dissuasion)14. The price-quality is most frequently observed in the sectors of electric lamps, combustion engines, home appliances, paper goods, as well as, livestock breeding. When competitive advantages are based on timing and acquisition of the unique technological or
10 J. F. Moore, Predators and Prey: A New Ecology of �ompetition, “Harvard Business Review”,May–June1993,pp.75–86;M.Harvey,M.M.Novicevic,Thehypercompetitiveglobalmarketplace:the importance of intuition and creativity in expatriate managers, “Journal of World Business”Vol. 37, 2002, pp. 127–138.
11 R. A. D’Aveni, R. Gunther, Hypercompetitive Rivals. Competing in Highly Dynamic Environments, The Free Press, New York 1995, pp. 171–176, M. E. Porter, Competitive Advantage. Creating and Sustaining Superior Performance, The Free Press, New York 1985.
12 V.Kapur,J.Peters,S.Berman,High-tech2005:thehorizontal,hypercompetitive future,“Strategy& Leadership”, Vol. 31, No. 2, 2003, pp. 34–47.
13 R. A. D’Aveni, Waking Up to the New Era of Hypercompetition, “The Washington Quarterly” Vol. 21, No. 1, Winter 1998, pp. 183–195.
14 K. Ohmae, Borderless World: Power and Strategy in the Interlinked Economy, HarperCollins, New York 1999, pp. 23–24.

Hypercompetitive Trends as a Premise to Create Co-opetitive Relations 3�
any other knowledge which ensures business success, firms adopt the role of innovators and create new products or markets15.
Innovators (first movers) reap considerable strategic benefits of temporary monopoly (and the first-mover advantage), economies of scale, image creation which is easier than in the case of followers (second movers), development and reinforcement of loyalty, promotion of their own technological and quality standards or the learning curve. Second movers take advantage of first-movers’ mistakes as they offer enhanced goods (and services) or a new generation of them but they incur lower costs of promotion or achieve technological excellence. The first mover and the second mover fight over the innovation leadership in the marketplace. Due to the competition the position of the leader is not stable and is subject to constant change (according to the strategy of leapfrogs)16. Empirical research by L. G. Thomas, M. Harvey, M. M. Novicevic, and T. Kiessling shows that the competition based on innovation and knowledge acquisition can become dominant in the hypercompetitive environment. It is mainly due to companies changing their strategic thinking about the reasons behind their competitive advantages: from shared assets of common features into the unique aspects of innovation specific for each company. In their opinion the stability of the hypercompetitive strategy will be based on company’s ability to modify its strategy faster than competitors17. Enterprises will be increasingly interested in the search for new, unknown and unused strategic assets18. An example of the first-mover strategy can be the 3M corporation which used to phase out 25 of its 50 thousand products within 5 years. After 3M entered the hypercompetitive electronics market its innovation rate rocketed by shortening its product life cycle to two months19.
Competitive advantages can be generated by putting up barriers to entry (market and administrative) which limit the access of competitors to particular sectors, market segments or geographic regions. General Motors has spent millions of dollars to establish (as a barrier to entry) a dense network of 6000 service
15 R. A. D’Aveni, R. Gunther, Hypercompetitive Rivals. Competing in Highly Dynamic Environments, The Free Press, New York 1995, pp. 35–37.
16 R. Makadok, Can First-Mover and Early-Mover Advantages be Sustained in an Industry with Low Barriers toEntry/Imitation?, “StrategicManagementJournal”,Vol. 19, 1998, pp. 683–696.
17 R. A. D’Aveni, R. Gunther: Hypercompetitive Rivals. Competing in Highly Dynamic Environments, The Free Press, New York 1995, p. 68.
18 M. Harvey, M. M. Novicevic, T. Kiessling, Hypercompetition and the Future of Global Management in the Twenty-first Century, “Thunderbird International Business Review”, Vol. 43(5), 2001, pp. 599–616.
19 L. G. Thomas III, The Two Faces of Competition, “Organization Science”, Vol. 7, No. 3, 1996, pp. 221–242.

40 Joanna Cygler
points. Japanese rivals responded by offering consumers cars which were lessdefective and more modern in terms of design and technology20.
Hypercompetitive firms try to minimize the barriers through cooperation with governments. They internationalize their operations and cooperation ties within a given sector or a suitable business ecosystem21. The cases of cooperation of transnational corporations inSpecialEconomicZones inPoland, cooperationties with local (domestic) companies in pharmaceutical and telecommunications industries, obtaining incentives from the government by global corporations from electronic, machine-tool and automotive sectors could be the examples. Barriers to entry are also lowered due to international trade agreements, both, regional (e.g. NAFTA, the UE, MERCOSUR) and global (e.g. WTO). When deep pockets – large corporations of significant strategic and financial potential – become competitors in the hypercompetitive environment, numerous cooperation ties among companies create co-opetitive relationships which constitute the crucial strategy of the rivalry22.
Due to the disproportion in competitors’ strategic potential smaller rivals avoid open confrontation with deep pockets – they try to attack by surprise or in a larger group.
According to E. M. Porter companies tend to establish relatively stable competitive advantages which will become the key to success of the companies23. In the hypercompetitive environment corporations try, above all, to change the existing rules of the market game and take the initiative to create new ones. Competitive advantages adopted by hypercompetitive companies are temporary24. Their temporariness depends on the speed and aggressiveness of competitors’ response to the hypercompetitive environment (Fig. 1).
20 M. Harvey, M. M. Novicecic, The impact of hypercompetitive “timescapes” on the development of global mindset, “Management Decision”, Vol. 39/6, 2001, pp. 448–460.
21 R. A. D’Aveni, Strategic Supremacy through Disruption and Dominance, “Sloan Management Review”, Vol. 40, No. 3, Spring 1999, pp. 127–135.
22 J. F. Moore, Predators and Prey: A New Ecology of �ompetition, “Harvard Business Review”,May–June1993, pp. 75–86.
23 R. A. D’Aveni, R. Gunther: Hypercompetitive Rivals. Competing in Highly Dynamic Environments, The Free Press, New York 1995, pp. 132–133; R. Parayre, D. Hurry, Corporate Investment and Strategic Stability in Hypercompetition, „Management and Decision Economics”, Vol. 22, 2001,pp. 281–298.
24 M. E. Porter, Competitive Advantage. Creating and Sustaining Superior Performance, The Free Press, New York 1985.

Hypercompetitive Trends as a Premise to Create Co-opetitive Relations 41
Figure 1. Creating temporary competitive advantages in hypercompetitive envi-ronments
Introducing competitiveadvantage
Exploitation
time
AdvantageNo 1
AdvantageNo 2
AdvantageNo 3 … …
Competitors’ counterattack
During competitors’ counterattack the firmfocuses its activities on creating a newcompetitive advantage
Profi
ts fr
om a
ser
ies
of a
ctio
ns
Source: own study based on I. C. MacMillan, Controlling Competitive Dynamics by Taking Strategic Initiative, “Academy of Management”, Executive 2, No. 2, 1998.
However, the company success depends on permanent search and effort to create further competitive advantages, as well as an active interaction with other competitors. Moreover, there are numerous reasons behind the competitive advantage in the highly dynamic environment. Their multitude brings about considerable flexibility and less vulnerability to competitors aggressive attacks.
4. The Concept of New 7-S in Creation of Competitive Advantage in Hypercompetitive Environments
The turbulent hypercompetitive environment has forced the revaluation of instruments which influence the creation of the competitive advantage. According to R. A. D’Aveni the concept of McKinsey consulting group based on the assumption that it is necessary to match strategic factors to the elements of the environment known as 7S (structure, strategy, style, skills, staff, shared values and sysytems) seems to be losing its relevance25. D’Aveni suggests a slightly different approach to the factors which determine success in the hypercompetitive environment. He also puts forward seven main instruments known as new 7S: 1) superior shareholder satisfaction, 2) strategic soothsaying,
25 R. A. D’Aveni, R. Gunther, Hypercompetitive Rivals. Competing in Highly Dynamic Environments, The Free Press,NewYork 1995, pp. 238–241; J. B. Quinn,H.Minzberg, Dealingwith Structureand Systems, Englewood Cliffs, Prentice Hall 1988, pp. 270–276.

42 Joanna Cygler
3) speed, 4) surprise, 5) shifting rules of competition, 6) signalling strategic intent, 7) simultaneous and sequential thrust.
New 7S instruments will enable indicating the opportunities of efficient competition in the hypercompetitive environment by disrupting the existing competition system, taking over the initiative, shifting the rules of the game in the sector and finally creating new temporary competitive advantages26. The first two instruments are focused on creating a vision of disrupting the existing rules of the market game (setting objectives and destructive strategies and identifying core competences indispensable for the company to pursue this strategy). The other two instruments are concentrated on key opportunities which can be utilized while destroying the existing competitive system. Instruments 6 and 7 are related to one another by the tactics and thrusts in the hypercompetitive environment. Both the scope and the rules of competition are redefined, new ways to satisfy customers are searched for and the entire sector undergoes transformation.
The framework of new 7S can also be utilized in 4 basic areas of competition. In the price/cost area instruments related to the supreme stakeholder satisfaction and speed (S-1 and S-3) are most often adequate. In the area of quick response – and know-how-based competitive advantages instruments like speed (S-3), surprise (S-4) and strategic soothsaying (S-2) seem to be the most effective. In case of competition based on building up strongholds instruments related to signalling strategic intent (S-6) and simultaneous and sequential thrusts (S-7) seem to be crucial. Competition with deep pockets requires instruments like simulteneous and sequential thrusts (S-7) and shifting rules of competition (S-5). The concept of new 7S clearly shows the dynamics of operations and processes in the hypercompetitive environment.. It radically shifts the approach to management science (particularly in strategic management) towards a dynamic strategic game full of surprise, uncertainty, and constantly changing rules of competitors’ operations.
The new 7S framework and the diverse behaviour allowed for the identification of four major types of hypercompetitive companies. The criteria of selection comprised the type of competition area and the scope of repositioning27. The notion of the area of competition brings up a problem whether a corporation
26 R. A. D’Aveni, Coping with hypercompetition: Utilizing the new 7S’s framework, “Academy of Management Executive”, Vol. 9, No. 9, 1995, p. 4557.
27 A.Fiegenbaum,H.Thomas,M.-J.Tang,LinkingHypercompetitionandStrategicGroupTheories:Strategic Maneuvering in the US Insurance Industry, “Management and Decision Economics”, No. 22, 2001, pp. 265–279.

Hypercompetitive Trends as a Premise to Create Co-opetitive Relations 43
competes with its rivals in an open clash or seeks the new areas. The scope of repositioning defines whether an organisation attempts to reposition itself in the hypercompetitive environment within a broad or narrow scope of the area of rivalry (Fig. 2).
Figure 2. Types of hypercompetitive organizations
Diversifiedhypercompetitive
organization
Limitedhypercompetitive
organization
Concentratedinnovative
hypercompetitiveorganization
Hypercompetitiveorganization
Current
Nar
row
Wid
e
Scop
e of
repo
sitio
ning
Areas of competition
New
Source: A. Fiegenbaum, H. Thomas, M.-J. Tang, Linking Hypercompetition and Strategic GroupTheories: Strategic Maneuvering in the US Insurance Industry, “Management and Decision Economics”, No. 22, 2001, pp. 265–279.
The lowest level of a hypercompetitive corporation consists of limited hypercompetitive organizations which attempt to reposition themselves in the narrow range of competitive areas. Another extreme is formed by hypercompetitive organizations which aim to create new competition areas and to outperform competitors in a large number of areas. Two remaining types of corporations are in between. A diversified hypercompetitive organization confines its operations to already known areas of competition. However, it repositions itself in a wide range of them. A concentrated, innovative hypercompetitive organization seeks for new areas of rivalry but it focuses on the selected ones.

44 Joanna Cygler
5. Organizational Requirements in the Hypercompetitive Environment: Establishing Co-opetitive Relationships
Hypercompetitve processes and phenomena force competitors to pursue definite types of behaviour. Competitors are also compelled to meet specific organizational requirements28. To cope with the rivalry in the hypercompetitve environment companies have to demonstrate the ability to learn fast and adapt to change, flexibility of operations and organization, ability to adopt world technical, technological and organizational standards and the ability to raise strategic resources (including finance) which will enable companies to generate new competitive advantages.
Flexibility is perceived as a crucial success factor in the hypercompetitive environment. According to H.I. Volberda company flexibility is a function of the ability to control (or to be responsible for) a company and dynamic capabilities of its managers29. From the managers’ perspective the key factors which influence the flexibility of operations are the diversity of managerial skills, the speed of response, decision making and implementation. Organizations are compelled to shape up their skills in order to master their ability to develop and strengthen new competitive advantages.
As mainly reactive action to the changes in the environment will be possible, the measures must be taken fast and decidedly30. From the organizational perspective company flexibility is mainly influenced by the structure, corporate culture and technology. H. W. Volberda points out the necessity of structural changes whose aim is to form organic, task-oriented organizations (shamrock organization). They are tailored for necessary and fast technological changes, including manufacturing techniques, which will allow for innovation in control systems and coordination of operations31. Corporate culture should also evolve from conservative (directive-type) to innovative.
Complexity of the hypercompetitive environment, aggressiveness of rival attacks, permanently changing rules of the market game and strict requirements
28 A. Y. Ilinitch, R. A. D’Aveni, A. Y. Lewin, New Organizational Forms and Strategies for Managing in Hypercompetitive Environments, “Organization Science” Vol. 7, No. 3, May–June 1996, pp. 211–220.
29 H. W. Volberda, Toward the Flexible Form: How to Remain Vital in Hypercompetitive Environments, “OrganizationScience”,Vol. 7,No. 4, July–August1996, pp. 359–374.
30 W. C. Bogner, P. S. Barr, Making Sense in Hypercompetitive Environments: A Congnitive Explanation for the Persistence of High Velocity Competition, “Organization Science”, Vol. 11, No. 2, March–April 2000, pp. 212–226.
31 H. W. Volberda, Toward the Flexible Form: How to Remain Vital in Hypercompetitive Environments, “OrganizationScience”,Vol.7,No.4,July–August1996,pp.359–374;J.B.Quinn,IntelligentEnterprise.A Knowledge and Service Based Paradigm for Industry, The Free Press, New York 1992, p. 127.

Hypercompetitive Trends as a Premise to Create Co-opetitive Relations 45
to be met by entreprises account for a rising interest in cooperative relationships32. Their form is diverse and covers both individual cooperation agreements and larger structures – by establishing networks33. Cooperation among companies includes vertical relationships (between a supplier and buyer) and horizontal – by establishing co-opetitive relationships among direct competitors34.
In the contemporary world economy enterprises see enormous opportunities of development in cooperation with competitors. It was proved by a survey of 187 transnational corporations carried out by the Economist Intelligence Unit (EIU) in 200635. According to the survey only 5% of the companies do not have cooperative relationships. The vast majority (64%) have such relationships with a few partners – over 20% of respondents cooperate with at least 10 partners.
A highly dynamic environment is the reason why competitive advantages and reasons for them have to change fast, in leaps and bounds.
The cost of change and generating new advantages exceed the organizational potential of many corporations. That is why numerous cooperative relationships foster building up and implementation of development strategies. The IBM corporation, in the United States only, cooperates with over 4 thousand companies in order to develop its products36. According to the survey by the EIU 60% of corporations indicated that joint RD activities create and widen a range of products on offer and have become a very important factor in establishing co-opetition. Another 28% considered this factor as important37. This finding is confirmed by the case of Hewlett Packard which has set up a network of alliances with suppliers, buyers and direct competitors in order to cut costs generated by delayed development and launch of new products on the hypercompetitive market. As a result revenues from the sales of products developed within cooperative relationships account for two thirds of company sales38.
32 V.Kapur,J.Peters,S.Berman,High-Tech2005:thehorizontal,hypercompetitivefuture,“Strategy& Leadership”, Vol. 31, No. 2, 2003, pp. 34–47.
33 J. Hanssen-Bauer, �h. �. Snow, Responding to Hypercompetition: the Structure and Process ofRegionalLearningNetworkOrganization,„OrganizationScience”,Vol.7,No.4,July–August1996,pp. 413–427; J.�ygler,Alianse strategiczne,Difin,Warszawa2002, pp. 161–184.
34 Co-opetitive relationships are a system of simultaneous flows and interdependent relationships between competition and cooperation among competitors who remain organisationally separate. Co-opetitive relationships are established in order to achieve definite strategic goals in a definite period of time. Their consequences have a major impact on development strategies of the parties involved.J.�ygler,Kooperencja–nowytyprelacjimiędzykonkurentami,„OrganizacjaiKierowanie”,No. 2/2007 (in press).
35 www.eiu.com36 E. Gummensson, Collaborate or Compete. Conflicting Trends Plague Services Markets, “Marketing
Management”, Fall 1997, pp. 17–20.37 www.eiu.com38 M. Harvey, M. M. Novicecic, The impact of hypercompetitive “timescapes” on the development of
global mindset, “Management Decision”, Vol. 39/6, 2001, pp. 448–460.

46 Joanna Cygler
Co-opetition fosters flexibility of company operations and their response to changing consumer requirements. The response is faster, companies can more quickly offer goods (services) which will better meet consumer requirements. 54% of the companies surveyed considered better consumer satisfaction the key factor in establishing co-opetitive relationships and another 30% found it important39.
Costs of rivalry, fierce competition (particularly at an internetional level) make co-opetitive relationships one of the main chances to survive in the hypercompetitive environment. Enterprises establish co-opetitive relationships because they realise they are not viable even for a few months. Not only small and medium-sized companies are exposed to the threat, but also the biggest, transnational corporations. What makes the difference is the length of time companies can be viable, their ability to coordinate operations on many markets and to take advantage of a stronger competitive position on local markets. That is why 53% of the companies surveyed by the EIU found competitive relationships a very important factor and 35% an important one in establishing co-opetitive relationships.
6. Conclusion
Changes occurring on the markets globally and in the competition rules in industries, which create hypercompetition, are complex and multidimensional. A complex and very rapidly changing environment (with high degree of uncertainty about the nature and scale of changes) makes companies redefine their competitive position, the causes and the nature of a competitive advantage and corporate strategic behaviour (both internationally and on particular internal markets). Processes and mechanisms which accompany hypercompetition are becoming a premise to create new phenomena which include establishing and shaping up co-opetetion. Numerous surveys prove that corporations are aware of the importance of the relationships to develop the strategy of rivalry in turbulent competitive environments.
7. Bibliography
Books: 1.�ygler J.,Alianse strategiczne,Difin,Warszawa2002. 2. D’Aveni R. A., Gunther R., Hypercompetitive Rivals. Competing in Highly
Dynamic Environments, The Free Press, New York 1995.
39 www.eiu.com

Hypercompetitive Trends as a Premise to Create Co-opetitive Relations 47
3. Freeman C., The Challenge of New Technologies, in OECD, Interdependence and Co-operation in Tomorrow’s World, OECD, Paris 1987.
4. Ohmae K., Borderless World: Power and Strategy in the Interlinked Economy, HarperCollins, New York 1999.
5. Porter M. E., Competitive Advantage. Creating and Sustaining Superior Performance, The Free Press, New York 1985.
6. Porter M. E., Competitive Advantage of Nations, The Free Press, New York 1990. 7.QuinnJ.B.,IntelligentEnterprise.AKnowledgeandServiceBasedParadigm
for Industry, The Free Press, New York 1992. 8.Quinn J. B., Minzberg H., Dealing with Structure and Systems, Englewood
Cliffs, Prentice Hall 1988. 9. World Investment Report. Transnational Corporations and Internationalization
of R&D, UNCTAD, New York and Geneva 2005. 10. World Investment Report. FDI from Developing and Transition Economies:
Implications for Development, UNCTAD, New York and Geneva 2006.
Journal articles: 1. Bogner W. C., Barr P. S., Making Sense in Hypercompetitive Environments:
A Congnitive Explanation for the Persistence of High Velocity Competition, “Organization Science”, Vol. 11, No. 2, March–April 2000.
2.�yglerJ.,Kooperencja–nowytyprelacjimiędzykonkurentami,„Organizacjai Kierowanie”, Nr 2/2007 (in press).
3. D’Aveni R. A., Coping with hypercompetition: Utilizing the new 7S’s framework, “Academy of Management Executive”, Vol. 9, No. 9, 1995.
4. D’Aveni R. A., Waking Up to the New Era of Hypercompetition, “The Washington Quarterly”, Vol. 21, No. 1, Winter 1998.
5. D’Aveni R. A., Strategic Supremacy through Disruption and Dominance, “Sloan Management Review”, Vol. 40, No. 3, Spring 1999.
6. Feinberg S. E., Gupta A. K., Knowlwdge Spillovers nad the Assigment of R&DResponsibilitiestoForeignSubsidiaries,“StrategicManagementJournal”,Vol. 25, 2004.
7.Fiegenbaum A., Thomas H., Tang M.-J., Linking Hypercompetition andStrategic Group Theories: Strategic Maneuvering in the US Insurance Industry, “Management and Decision Economics”, No. 22, 2001.
8. Gummensson E., Collaborate or Compete. Conflicting Trends Plague Services Markets, “Marketing Management”, Fall 1997.
9.Hanssen-BauerJ.,Snow�h.�.,RespondingtoHypercompetition:theStructureand Process of Regional Learning Network Organization, „OrganizationScience”,Vol. 7,No. 4, July–August1996.
10. Harvey M., Novicevic M. M., The hypercompetitive global marketplace: the importance of intuition and creativity in expatriate managers, “Journal ofWorld Business”, Vol. 37, 2002.

4� Joanna Cygler
11. Harvey M., Novicecic M. M., The impact of hypercompetitive “timescapes” on the development of global mindset, “Management Decision”, Vol. 39/6, 2001.
12. Harvey M., Novicevic M. M., Kiessling T., Hypercompetition and the Future of Global Management in the Twenty-first Century, “Thunderbird International Business Review”, Vol. 43(5), 2001.
13. Ilinitch A. Y., D’Aveni R. A., Lewin A. Y., New Organizational Forms and Strategies for Managing in Hypercompetitive Environments, “Organization Science”,Vol. 7,No. 3,May–June1996.
14.KapurV.,PetersJ.,BermanS.,High-tech2005:thehorizontal,hypercompetitivefuture, “Strategy & Leadership”, Vol. 31, No. 2, 2003.
15. Kummerle W., The drivers of foreign direct investment into research and development: an empirical investigation, “Journal of International BusinessStudies”, Vol. 30, 1999.
16. Makadok R., Can First-Mover and Early-Mover Advantages be Sustained in an Industry with Low Barriers to Entry/Imitation?, “Strategic Management Journal”,Vol. 19, 1998.
17.Moore J. F., Predators and Prey: A New Ecology of �ompetition, “HarvardBusinessReview”,May–June1993.
18. Parayre R., Hurry D., Corporate Investment and Strategic Stability in Hypercompetition, „ManagementandDecisionEconomics”,Vol. 22, 2001.
19. Rühli E., The Concept of Hipercompetition – a New Approach to Strategic Management in Large Multinational Firms, “Strategic Change”, Vol. 6, 1997.
20. Thomas III L. G., The Two Faces of Competition, “Organization Science”, Vol. 7, No. 3, 1996.
21. Wiggins R., Ruefli T. W., Schumpeter’s Ghost: is Hypercompetition Making theBest ofTimesShorter?, “StrategicManagementJournal”,Vol. 26, 2005.
22. Volberda H. W., Toward the Flexible Form: How to Remain Vital in Hypercom-petitive Environments, “Organization Science”, Vol. 7, No. 4, July–August1996.
Website: 1. www.eiu.com

Małgorzata Zaleska, Zbigniew KorzebWarsaw School of Economics
The Impact of Information about Mergers and Acquisitions on Commercial Banks’ Market Evaluation in Poland
1. Introduction
The aim of this paper is to analyze the impact of information about the prospective merger or acquisition in the banking sector on reaction of shareholders of banks listed on the Warsaw Stock Exchange. The research covered formation of additional rates of return in twenty one events which happened in the years 1994–2006.
2. Methodology of Research
The basic evaluation criterion of mergers and acquisitions in the banking sector is maximizing synergy and scale effects of the carried out consolidating transactions in the context of creating, in the long run, the value of an integrated bank. Although multilevel evaluation of merger effects may be performed ex-post, an analysis of capital market reaction to the announcement on an intended transaction plays an important role. According to A. Rappaport, “an immediate reaction of the share price of companies participating in mergers and acquisitions best reflects expectations of capital markets with regard to long term effects of transactions”1.
Eugene F. Fama was the first to present the concept of event study in 19692. The model, also described as abnormal returns method, consists of comparing departure of real return rates from the value of those expected, forecasted on the basis of parameters of a historically estimated trend. An event study found its wide use in the evaluation of investors’ reaction to the information concerning listed companies. Except for research on the impact of mergers and acquisitions as well as changes in company ownership structure on potential shareholders’ profits or losses resulting from fluctuations in quotations, the model can also be used to define the dependence of share rates on new emissions, dividend policy,
1 A. Rappaport, Creating Shareholder Value, The Free Press, New York 1998, p. 144.2 E. Fama, L. Fisher, M. Jensen, R. Roll, The Adjustment of Stock Prices to New Information,
“International Economic Review”, Vol. 10, No. 1, February 1969, pp. 1–21.

50 Małgorzata Zaleska, Zbigniew Korzeb
information on achieved financial effects and the obtained ratings, the influence of new executive regulations or even terrorist attacks and the size of the Internet spam3. For the purpose of this paper it has been accepted that the term ‘event’ means publishing official information about a concluded merger or acquisition in the banking sector in Poland.
The essence of event analysis is calculating additional rate of return on the company’s shares, i.e. the difference between real and expected rate of return on bank assets, if the event did not occur:
AR R E Rit it it= - _ i
where:ARit – additional rate of return on shares of i-th company achieved on day t,Rit – real rate of return on shares of i-th company achieved on day t in case of a merger or acquisition,E(Rit) – expected rate of return on shares of i-th company on day t in case the merger or acquisition did not happen,i = 1, 2, …, N, where N means the number of sampled companies.
The basic problem presented in the model is evaluating expected rate of return (Rit), for which the following methods are used: • Mean-Adjusted Model, • Market-Adjusted Model, • Market Model, • Capital Asset Pricing Model (CAPM), • Fama and French Three Factor Model, • Reference Portfolio, • Control Firm4.
In the conducted research we have used the market model, consisting in setting for each analyzed bank regression line parameters reflecting dependence of rate of return of a given company quotation from stock exchange index rate of return in the period preceding call.
Measurements of additional rate of return used in research are Cumulative Abnormal Returns (CAR) and Buy-and-Hold-Abnormal-Returns (BHAR).
Cumulative abnormal returns CARiT is calculated as the sum of daily abnormal rates of return from successive session days in the analyzed period T:
3 More: http://www.ssrn.com/, 15.12.2006.4 S. Sudarsanam, Creating Value from Mergers and Acquisitions, The Challenges, Financial Times/
Prentice Hall, Harlow 2003, pp. 90–91.
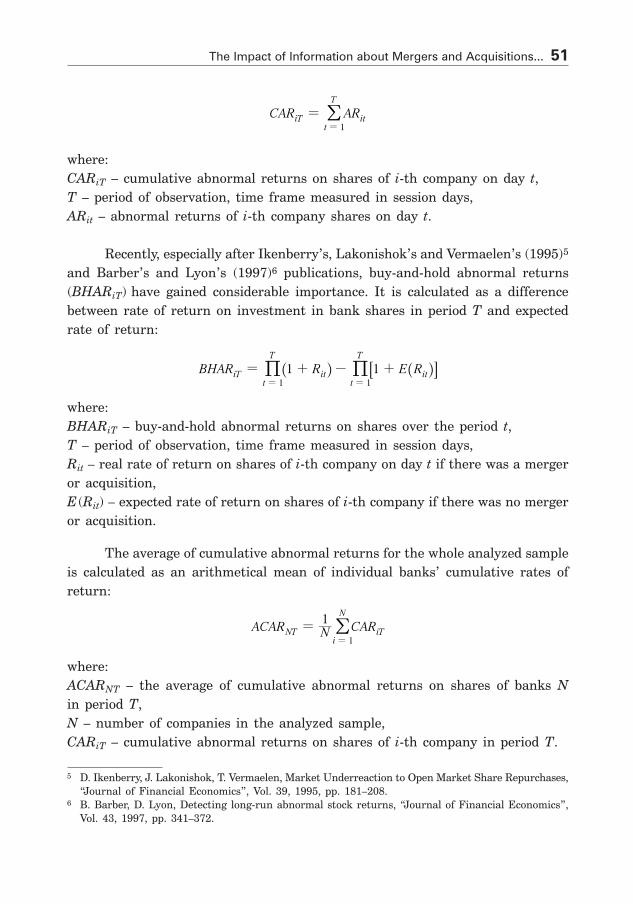
The Impact of Information about Mergers and Acquisitions... 51
CAR ARi itt
T
T1
==
/
where:CARiT – cumulative abnormal returns on shares of i-th company on day t,T – period of observation, time frame measured in session days,ARit – abnormal returns of i-th company shares on day t.
Recently, especially after Ikenberry’s, Lakonishok’s and Vermaelen’s (1995)5 and Barber’s and Lyon’s (1997)6 publications, buy-and-hold abnormal returns (BHARiT) have gained considerable importance. It is calculated as a difference between rate of return on investment in bank shares in period T and expected rate of return:
AR R E RBH 1 1i itt
T
itt
T
T1 1
= + - += =
_ _i i7 A% %
where:BHARiT – buy-and-hold abnormal returns on shares over the period t,T – period of observation, time frame measured in session days,Rit – real rate of return on shares of i-th company on day t if there was a merger or acquisition,E(Rit) – expected rate of return on shares of i-th company if there was no merger or acquisition.
The average of cumulative abnormal returns for the whole analyzed sample is calculated as an arithmetical mean of individual banks’ cumulative rates of return:
AR CARAC N1
iTi
N
NT1
==
/
where:ACARNT – the average of cumulative abnormal returns on shares of banks N in period T,N – number of companies in the analyzed sample,CARiT – cumulative abnormal returns on shares of i-th company in period T.
5 D.Ikenberry,J.Lakonishok,T.Vermaelen,MarketUnderreactiontoOpenMarketShareRepurchases,“Journal ofFinancialEconomics”,Vol. 39, 1995, pp. 181–208.
6 B.Barber,D.Lyon,Detecting long-runabnormalstockreturns,“JournalofFinancialEconomics”,Vol. 43, 1997, pp. 341–372.

52 Małgorzata Zaleska, Zbigniew Korzeb
Whereas the average of cumulative buy-and-hold abnormal returns with N shares in period T is defined as:
AR ARABH N BH1
iTi
N
NT1
==
/
where:ABHARNT – the average of cumulative buy-and-hold rates of return,N – number of companies in the analyzed sample,BHARiT – buy-and-hold abnormal returns on shares of i-th company in period T.
3. Choice of the Sample Entities
One of the most important problems with setting model parameters was to accept a criterion for setting a point of reference in relation to which abnormal rates of return would be analyzed for the conducted research. The analyses of the Polish capital market done so far have been based on methodology used on those Anglo-Saxon markets where investors’ reaction to public announcement of a call to sell shares of a particular company7 was under investigation. However, accepting such a date of the event would be insufficient and contrary to the nature of the method suggested by its authors. In accordance with the definitions included in International Accounting Standards “a merger is combining separate companies into one entity as a result of combination of net assets and activities of one company with those of another company or as a result of one company taking over control of net assets and activities of another company; whereas acquisition is such combination of companies which results in one of the entities – the acquiring company – taking control over net assets and activities of another entity – the target company – in return for transfer of assets, arising obligation or issuance of shares”8. Accepting this terminology causes that there must be some change in defining the date of official public announcement of a transaction. Information
7 Por.M.Lewandowski,M.Kamiński,Reakcjarynkukapitałowegonaogłoszonewezwaniadosprzedażyakcji–nadzwyczajnestopyzwrotu,„NaszRynekKapitałowy”,4/2000;A.Szyszka,Reakcjainwesto-równapublicznewezwaniadosprzedażyakcji,w:Zarządzaniefinansami,podred.D.Zarzeckiego,UniwersytetSzczeciński,Szczecin2002;G.Piecek,Analizaponadprzeciętnychstópzwrotuwwynikureakcji na informację o przejęciach i fuzjach, „Nasz Rynek Kapitałowy”, 4–5/2004; A. Perepeczo,D.Zarzecki, Wyniki badań efektów finansowych przejęć na podstawie danych rynkowych spółeknotowanychnaWarszawskiejGiełdziePapierówWartościowych,w:Zarządzaniefinansami.Inwestycjei wycena przedsiębiorstw, t. I, pod red. D. Zarzeckiego, Uniwersytet Szczeciński, Szczecin 2006;M.Michalewski,Z.Palica,ReakcjarynkukapitałowegonaogłoszeniewezwaniadosprzedażyakcjinotowanychnaGiełdziePapierówWartościowych, „GospodarkaNarodowa”, 1–2/2006andothers.
8 MiędzynarodoweStandardyRachunkowości2001,InternationalAccountingStandardsBoard,London2001, 22.8, p. 548.

The Impact of Information about Mergers and Acquisitions... 53
about privatization of banks and communiqués resulting from procedures of obtaining permission to perform mergers and acquisitions, issued by institutions of bank and capital market supervision, were the main determinants of important events connected with consolidation processes happening in the Polish banking sector. In this paper the call date for a company’s shares was accepted as a reference date only in two cases (annex 1), while in the remaining cases calls were merely theconsequencesofearlierdecisions.AsR.Machałapointsout,“intheeventofsuch calls, the reaction of the market is completely different. The market does not deal with estimating the possible synergy impact on the value of the company but it only adjusts market price to call price or, in the situation when the call has not been announced yet, to the future call expected price whose value is the result of regulations and past quotations”9.
In the analyzed cases behavior of return rates on bank shares as a reaction to information about concluding a merger or acquisition in two periods, from day t = –5 to day t = +5 session days and from day t = –30 to day t = +30 session days. Accepting such time horizons enables verification of direct influence of information about concluding a merger or an acquisition on quotations of bank shares. In the event of applying a wider range, mistakes resulting from impact of other information on the price of share exchange rate might arise. Estimating linear regression parameters for shares of each bank was based on dependence of share return rate on stock exchange index return rate in the period from day t = –250 to day t = –61 session days (independent period). This period has been determined by two factors. On the one hand it cannot be too distant in time from the observation period (assumption of parameter invariability) and on the other, it should be so distant from the date of merger or acquisition announcement that the impact of the event on quotations of the exchange rates of bank shares would be only slender.
The application of the market model is connected with certain inconveniences diminishing its infallibility. According to S. Surdasanam they consist of low turnovers of market companies (in the conducted research it mainly concerns Nordea and Fortis banks) as well as discrepancies between the size of the analyzed firms and the size of firms included in the stock exchange index10. However, the use of more advanced models seems to be groundless due to a small sample and difficulties in applying them in the initial stage of the Warsaw Stock Exchange.
9R.Machała,Przejęcia i fuzje.Wpływnawartość firm,Unimex,Wrocław2005, s. 209.10 S.Sudarsanam,Fuzje i przejęcia,WIG-Press,Warszawa1998, s. 220.

54 Małgorzata Zaleska, Zbigniew Korzeb
WIG-banks subindex has been accepted as an activity factor. In the earlier period, when it was not listed, calculations were based on WIG and WIG-20 (in relation to a given bank belonging to the relevant index portfolio). If a company participated in composition of both indexes, there was an attempt to choose a solution which provided for a stronger correlation between bank and index quotations, which justified regression equations. Closing prices of bank and index share quotations from given stock exchange sessions were used for calculations.
All mergers with the participation of at least one bank listed on Stock Exchange from its beginning have been subjected to investor reaction analysis. They include: • classical acquisitions of national banks by other national banks, • classical acquisitions of national banks by foreign banks, • classical acquisitions of national banks by other entities, • classical mergers on domestic market, • consolidation of national banks having the same owner, • consolidation of banks as a result of mergers and acquisitions due to
strategic investors’ intermediation outside Poland, • purchase of banks in bankruptcy or liquidation, • purchase of banks in financial trouble, • consolidation of national banks as a result of government decisions.
The research ignores consolidation processes with the participation of cooperativesector(acquisitionofSBRSamopomoc�hłopskabyINGBSK).Neitherdoes the sample include cases which did not meet the below listed criteria: • the company was listed on the stock exchange for a longer period than 250
sessions preceding the date of announcement of a merger or consolidation (e.g. acquisition of Bank Depozytowo-Powierniczy Glob S.A. in Warsaw by Kredyt Bank S.A.),
• the company was listed on the stock exchange for a period longer than 30 sessions after the date of announcement of a merger or consolidation (e.g.suspensionofquotationsofBankWspółpracyRegionalnejS.A.sharesinKraków for threemonthsafter theBankingSupervision�ommissionaccepted the intention of capital investment by Deutsche Bank AG),
• enough discrepancy between information about two different transactions with the participation of the same bank to enable building an independent period for estimation and observation (e.g. concluding an agreement between the National Bank of Poland S.A. in Warsaw and Powszechny Bank Kredytowy S.A. in Warsaw concerning acquiring shares of First Commercial Bank S.A. in Lublin and obtaining the Banking Supervision

The Impact of Information about Mergers and Acquisitions... 55
Commission’s permission to acquire by Bank Austria AG and its subsidiary, Bank Austria Creditanstalt International AG, a portfolio of shares giving the right to exercise over 33% of votes at the PBK S.A. General Meeting of Shareholders),
• interdependence between variables, stock exchange index to share quotation, which will confirm the legitimacy of regression equation (e.g. fixing share prices of Kredyt Bank S.A. at acquiring Polski Bank Inwestycyjny S.A. in Warsaw and PROSPER-BANK S.A. in Warsaw).
Verification of the companies allowed singling out twenty one events happening between 1994 and 2006 for which share prices have been analyzed (since in some instances one of the participation parties was not listed on the stock exchange, the analysis covered sixteen acquisitions of banks whose shares were listed on the stock exchange, six cases when the listed bank was the acquiring bank and three cases of consolidation of banks belonging to the same strategic shareholder). A vast majority is represented by acquisitions of national banks by foreign companies or national banks with prevailing share of foreign capital.
4. Response of Rates of Return on Shares to Information Concerning Mergers and Acquisitions in the Commercial Banking Sector
Due to a relatively small sample and its heterogeneity, the results of this research should be treated with some caution. Complexity and individualization of mergers and acquisitions in the banking sector cause that practically every transaction should be considered separately, for they focus on the principal aim of a commercial bank activity, i.e. recognized maximization of bank’s value with acceptable level of risk undertaken in current and future activities. Convergence of measurable operational, financial and tax advantages accompanying consolidation processes with elements of creating bank value is mainly displayed by synergy effect resulting from interaction of advantages after completing the transaction. The shareholders’ interest mainly focuses on potential results of transactions which may exert a considerable impact on the value of total advantages arising from bank share ownership: total rate of return on the invested capital, share exchange rate and the scale of dividends. Their forecasts in this area are reflected only in the formation of cumulative rates of return to the announcement of an intention to complete a merger or acquisition (see: Table 1).

56 Małgorzata Zaleska, Zbigniew Korzeb
Table 1. Average cumulative abnormal returns and the average ‘buy-and-hold’ cumulative returns in the analyzed cases
Specification Name of measure Periods (in days) Values (in %)
acquiredbanks
ACARfrom –5 to +5 1.02from –30 to +30 6.88
ABHARfrom –5 to +5 0.50from –30 to +30 7.87
aquiringbanks
ACARfrom –5 to +5 –1.74from –30 to +30 –1.73
ABHARfrom –5 to +5 –2.05from –30 to +30 –1.91
mergers of bankswith the samestrategic investor
ACARfrom –5 to +5 3.31
from –30 to +30 5.54
ABHARfrom –5 to +5 3.41
from –30 to +30 4.83
Source: own research.
There are no doubts that information about intended mergers or acquisitions in the Polish banking sector has influence on quotations of shares of commercial banks participating in such transactions. The observed tendencies are generally coherent with the results of research carried on mature capital markets. The above results prove that shareholders of the acquired companies achieve the best results. However, they are much lower in comparison with American market, where they amount to some 15–30% on average11. On the other hand there has been no confirmation of the research results proving that transactions may also bring advantages to the shareholders of the acquiring company. In case of commercial banks active on the Polish market, the results point to investors’ negative reaction to such ventures – a moderate loss in the share market value has been observed (negative average cumulative abnormal returns and average cumulative ‘buy-and-hold’ returns). Profits generated only by shareholders of the acquired company in a short period of time after announcing bank integration do not mean that separate acquisitions are not justified by maximizing effects of synergy and scale in the long run. Therefore complex analysis of individual merger and acquisition transactions (ex-post) should primarily focus on this aspect.
11 Por.M. Jensen, R. Ruback, TheMarket For �orporate �ontrol The Scientific Evidence, “Journalof Financial Economics”, Vol. 11, 1983, pp. 5–50.
The Impact of Information about Mergers and Acquisitions... 57
Nevertheless, it does not come as a surprise that the market reacted favorably to consolidation of banks belonging to the same strategic shareholder, for such transactions contribute to rationalization of incurred cost through closure of converging branches and departments in headquarters, reduction of employment, integration of IT systems, more effective banking risk management, transfer of the so-called ‘best practice’ standards, etc.
The basic difference in investors’ behavior towards developed capital markets can be observed in the rate of return distribution in the analyzed cases. The criterion accepted for setting a point of reference in the analyzed cases, in relation to which cumulative abnormal returns and cumulative ‘buy and hold’ returns were analyzed, causes that consistent growth of abnormal rates of return is mainly observed in the period from t = –30 session days to the announcement of intention to conclude an acquisition or a merger. It is the result of Polish banking sector and capital market specific regulations, which require that potential buyers get from supervisory institutions permission to purchase shares. The necessity of earlier appeal to the Banking Supervisory Commission and Securities and Exchange Commission for permission to exceed the specified percentage limit in the bank shareholders’ structure was an important signal for investors. Although obtaining permission from supervisory bodies did not always mean completing the transaction, publishing a communiqué about such a possibility resulted in immediate market reaction. Discounting such information caused that in the analyzed cases average cumulative abnormal returns and average cumulative ‘buy and hold’ returns were lower in the period from t = –5 days to t = 5 session days compared to the period from t = –30 days to t = 30 session days. Activities of speculative investors on the Polish stock exchange have also had some influence on the distribution of rates of return.
5. Conclusion
M. Lewandowski and M. Michalski have noticed that “although an analysis of the so-called abnormal return is fairly clear, it does not reflect the real effects of mergers and acquisitions in the longer period in which the transaction effects may be notably more transparent”12. Also R.Machała underlines that “capitalmarket participants and observers, whose only information is based on issuers’ publications, have no possibilities of analyzing financial effects of mergers and
12M.Lewandowski,M.Michalski,Korzyścinabycia.Ustaleniaempiryczne,w:Fuzjeiprzejęciaprzed-siębiorstw, editedbyW.Frąckowiak,PWE,Warszawa1998, p. 241.
5� Małgorzata Zaleska, Zbigniew Korzeb
acquisitions and their impact on the companies’ value”13. However it does not alter the fact that an analysis of rates of return on share reaction to the information about commercial banks’ mergers and acquisitions is a valuable source of knowledge about the effects of such transactions forecasted by capital markets. Although full evaluation of acquisition effects is not possible before some three years from the date of formal consolidation (ex post), the obtained results of rates of return analysis may to some extent suggest its final effect. Therefore the obtained results should be treated as complementary to a comprehensive evaluation of mergers and acquisitions in the banking sector.
6. Bibliography
1.Barber B., Lyon D., Detecting long-run abnormal stock returns, “Journal ofFinancial Economics”, Vol. 43, 1997.
2.Fama E., Fisher L., Jensen M., Roll R., The Adjustment of Stock Prices toNew Information, “International Economic Review”, Vol. 10, No. 1, February 1969.
3.Ikenberry D., Lakonishok J., Vermaelen T., Market Underreaction to OpenMarketShareRepurchases, “Journal ofFinancialEconomics”,Vol. 39, 1995.
4.Jensen M., Ruback R., The Market For �orporate �ontrol The ScientificEvidence, “Journal ofFinancialEconomics”,Vol. 11, 1983.
5.Lewandowski M., Kamiński M., Reakcja rynku kapitałowego na ogłoszonewezwania do sprzedaży akcji – nadzwyczajne stopy zwrotu, „Nasz RynekKapitałowy”, 4/2000.
6.Lewandowski M., Michalski M., Korzyści nabycia. Ustalenia empiryczne, w:Fuzje i przejęcia przedsiębiorstw, edited byW. Frąckowiak, PWE,Warszawa1998.
7.Machała R., Przejęcia i fuzje. Wpływ na wartość firm, Unimex, Wrocław2005.
8.Michalewski M., Palica Z., Reakcja rynku kapitałowego na ogłoszeniewezwaniadosprzedażyakcjinotowanychnaGiełdziePapierówWartościowych,„GospodarkaNarodowa”, 1–2/2006.
9.Międzynarodowe Standardy Rachunkowości 2001, International AccountingStandards Board, London 2001.
10.Perepeczo A., Zarzecki D., Wyniki badań efektów finansowych przejęć napodstawie danych rynkowych spółek notowanych na Warszawskiej GiełdziePapierów Wartościowych, w: Zarządzanie finansami. Inwestycje i wycenaprzedsiębiorstw,t.I,podred.D.Zarzeckiego,UniwersytetSzczeciński,Szczecin2006.
13 R.Machała,Przejęcia...,op. cit., p. 190.

The Impact of Information about Mergers and Acquisitions... 5�
11.Piecek G., Analiza ponadprzeciętnych stóp zwrotu w wyniku reakcji nainformację oprzejęciach i fuzjach, „NaszRynekKapitałowy”, 4–5/2004.
12. Rappaport A., Creating Shareholder Value, The Free Press, New York 1998. 13. Sudarsanam S., Creating Value from Mergers and Acquisitions, The Challenges,
Financial Times/Prentice Hall, Harlow 2003.14.SudarsanamS.,Fuzje i przejęcia,WIG-Press,Warszawa1998.15.Szyszka A., Reakcja inwestorów na publiczne wezwania do sprzedaży akcji,w: Zarządzanie finansami, edited by D. Zarzecki, Uniwersytet Szczeciński,Szczecin 2002.
Website: 1. www.ssrn.com

60 Małgorzata Zaleska, Zbigniew Korzeb
Appendix 1Investigated merger and acquisition transactions in banking sector
Acquirer Acquired bank
Informa- tion
announce- ment day
SpecificationExecution
dateCall date
Commerzbank BRE 18.10.94 decision concerning raising shareapital by share issuance 01.12.94 07.10.03
30.10.03
AIB EuropeanInvestments WBK 15.05.96
Finance Minister informationaboutsale of shares
25.06.96 10.05.02
ING Bank N.V. BankŚląski 03.06.96
Finance Minister informationabout accepting ING offerconcerning purchase of shareportfolio
19.07.96 08.03.01
BIG BankGdański 20.02.97
concluding an agreementbetween State Treasury,represented by Finance Minister,and the bank and its subsidiaries
26.06.97 xxx
BRE Bank Polski BankRozwoju 02.04.98 announcement of a call to sell
PBR shares 05.05.98 02.04.98
DZBank(earlier DG) Amerbank 15.10.98 announcement of call to sell
Amerbank shares 11.12.98 15.10.98 03.04.02
BayerischeHypo- undVereinsbank AG
BPH 22.10.98 sales agreement concludedby SME 4-6.01.99 29.06.99
UniCreditoItaliano SpA+ AllianzAktiengesselschaft
Pekao S.A. 23.06.99 sales agreement concludedby SME 03.08.99 xxx
Nordbanken(Nordea)
BankKomunalny 01.07.99 subscription-investment contract 15.11.99 17.11.99
20.09.00
Fortis PPA Bank 17.08.99 subscription-investment contract 01.10.99 07.10.99
Citibank BankHandlowy 11.05.00 BSC permission to acquire
shares 03.11.00 15.05.00 12.06.00
BCP and itsand itssubsidiaries Millennium 01.06.00 information about sales
of shares by Deutsche Bank 9-12.06.00 23.11.06
PBKBACreditanstaltPoland S.A.
10.08.00 BSC agreement to consolidate 31.10.00 xxx
BRE Bank Bank�zęstochowa 27.12.00 BSC agreement to take up
shares 28.02.03 10.05.02
BSK ING Bank N.V.O/W-wa 07.03.01 BSC agreement to consolidate 01.10.01 xxx
BankZachodni WBK 07.03.01 BSC agreement to consolidate 13.06.01 xxx
BPH PBK 07.11.01 BSC agreement to consolidate 31.12.01 xxx

The Impact of Information about Mergers and Acquisitions... 61
Acquirer Acquired bank
Informa- tion
announce- ment day
SpecificationExecution
dateCall date
Nordea LG PetroBank 07.05.02 concluding conditional agreement
on acquisition of bank shares 25.10.02 01.10.02 30.10.02
Pekao S.A. BPH 12.06.05
decision taken by UniCreditGroup Supervisory Board andHypoVereinsbank Managementand Supervisory Boards toconsolidate both institutions
Future 04.08.06
Getin BankWschodniBankCukrownictwa
09.09.05 signing an agreement to buyWBC shares 09.09.05 xxx
Fortis Dominet 27.10.06 signing a sales agreement 27.10.06 xxx
Source: own research paper.
Appendix 1 (continuance)

Agnieszka AlińskaWarsaw School of Economics
Cooperative Banks and Credit Societies – Comparative Analysis of Regulations and Effects of Their Activities�
1. Introduction
Activities of Cooperative Banks (CBs) and Credit Societies (called SKOKs) have a lot of common features which result not only from basic legal provisions regulating the scope of activities of the entities and their product and service offer but also from support for the target client. Both types of institutions are based on activity of local communities and mutual financial help of the members of these organizations. However, despite many similarities in the activities of CSs and SKOKs, there are also noticeable differences in legal, organizational and economic bases, which directly affect the scale of achieved results. The differences are mainly due to classification of the entities and their positioning in the financial system as well as to privileges granted to credit societies. The main reason is that CBs are banks and SKOKs belong to a group of parabanking institutions.
The aim of this publication is to pinpoint the most significant similarities and differences which are present in activities of cooperative banks and credit societies. In this context it seems essential to try to answer the question why differences existing between cooperative banks and credit societies exert a considerable influence on activities pursued by these entities on the market of financial services. It mainly refers to the scope of activities and financial and economic results achieved by commercial banks and credit societies.
The inspiration to carry analyses included in this paper has been drawn from the results of a survey carried out by PBS DGA between 1st and 3rd September, 2006. The survey has shown that more than 40% of respondents saw no difference between types of banks, cooperative banks and credit societies included. It means that clients of financial institutions, especially the entities operating in local communities, as cooperative banks and credit societies certainly are, do not pay great attention to the type of entity whose services they use. A greater importance is attributed to such factors as: • the level of interest generated income,
1 This paper has been based on research carried within the framework of the nr N113 017 3/1891This paper has been based on research carried within the framework of the nr N113 017 3/1891 project co-financed from the means allocated to studies in the years 2006–2007.

Cooperative Banks and Credit Societies – Comparative Analysis of Regulations... 63
• the level of incurred costs, mainly due to charges, commissions and interest payments,
• credit application procedures and verification rules, • required credit collateral, • service availability.
2. Specifity of Financial Activities Conducted by Cooperative Banks and Credit Unions
In accordance with legal regulations currently in force, Cooperative Banks constitute a sector of banking services the activities of which are in particular regulated by provisions of three Acts: • Act on cooperative banks’ functioning, their uniting and on uniting/second-
orderbanksofDecember7,2000(JournalofLawsof2000,No.119,item1252 as amended),
•BankingLawAct of July 29th, 1997 (Journal of Laws of 1997,Nr 140,item 939 as amended),
•�ooperativeLawActofSeptember16th,1982(JournalofLawsof1982,Nr 30, item 210 as amended).
In its turn activities performed by Credit Societies are based on provisions of the following Acts: •ActoncooperativesocietiesofDecember14th,1995(JournalofLawsof
1996, No 1, item 2 as amended), •�ooperativeLawActofSeptember16th,1982(JournalofLawsof1982,
No 30, item 210 as amended).Cooperative Banks’ and Credit Societies’ common feature is their organiza-
tional form based on the principle of members’ mutual financial aid. Hence both, cooperative banks and credit societies, are subject to provisions of cooperative law. The only difference is that cooperative banks, within the scope of their activities where there is a conflict between cooperative law and banking law, primarily have to comply with provisions regulating their activities as banks. Among others, it relates to privileges that the cooperative’s members enjoy. Besides complying with provisions of banking law, as credit institutions cooperative banks are required to comply with other regulations in the field of banking sector activities in Poland. Above all they are the result of obligations towards NBP and Bank Guarantee Fund. On the other hand credit societies (SKOKs), in accordance with regulations defined in the Accession Treaty on Poland joining EU, obtained permanent exclu-sion from European Parliament and European Council Directive of 20th March,

64 Agnieszka Alińska
2006 on undertaking and conducting activities by credit institutions (2000/12/EC). This standpoint was justified by the fact that credit societies conduct specific activity based on mutual financial aid of members of a given community. As a result of the exclusion credit societies, despite being in the category of credit institutions within the meaning of EU Directive 2000/12, obtained exemption from obligation concerning, among others, fulfilling precaution norms and their being subject to banking supervision. Besides, credit societies are not subject to provisions of the National Bank of Poland Bill referring to the necessity of maintaining obligatory reserves or the Bank Guarantee Fund Act within the scope of deposit guarantee system.
The characteristic feature of the cooperative banks’ activities is the requirement to unite in organizational structures on the level of uniting banks in the situation when their equity value is below the equivalent of 5mln Euro. A similar requirement concerning uniting applies to the activities of credit societies which, in the view of provisions of Art. 33, Credit Societies’ Act, are obliged to unite in the National Cooperative Savings and Credit Fund (referred to as the National Credit Society) regardless of their equity. As a cooperative legal entity, the National Credit Society provides for their members (exclusively the credit societies) activities which are very close to those uniting banks provide for cooperative banks.
Besides, a common characteristic for cooperative banks and credit societies as regards their functioning on the market of financial services are issues of membership and share buy-outs in these two entities. Clients of cooperative banks, especially on the side of creditors, borrowers as well as guarantee and surety users, may be obliged (though not all banks rigorously abide by this requirement) to declare their CB membership and buy at least one share. Then cooperative banks may offer their members more advantageous terms of financing. The requirement of being a CB member does not apply to clients who have their accounts or deposits in the bank. In case of cooperative banks, there are a limited number of possibilities of offering their members additional advantages and privileges due to buying out or possessing a considerable amount of shares. Among others it results from the principle applicable in cooperative banks: ‘one member – one vote’. Besides, members of cooperative banks cannot count on profits from division of balance surplus, for majority of bank branches face problems with reaching the limits required for capital assets. Hence the profits are mainly allocated to increasing the equity value. Cooperative banks are institutions of dual character. They pursue their activities both as commercial banks and cooperatives uniting their members. In case of establishing a cooperative bank on the basis of provisions of cooperative law, the minimal required number of founders (only natural persons) amounts to 10. The purpose of activities in commercial banks is more complex

Cooperative Banks and Credit Societies – Comparative Analysis of Regulations... 65
than in joint-stock banking companies, for in cooperative movement there is a more developed social responsibility, which means that a group of people want to participate in shaping conditions of their own life and exert influence on social and economic conditions of the society development2.
The aim of SKOKs’ activities is to accumulate financial means only of their members, to grant them loans and credits, to effect financial settlements in their stead and to act as an agent in concluding insurance policies. Unlike cooperative banks, SKOKs require that their clients buy at least one share and sign a membership declaration. Not only borrowers but also clients who deposit their financial funds and have current accounts are obliged to comply with the requirement.
Another issue defining the scope of similarities and differences between cooperative banks and credit societies is an analysis of the range of products and financial services provided by these institutions. The cooperative banks’ offer in this area is mainly based on provisions of Act on Banking Law. Art. 5 of the Act provides for a basic scope of activities carried out by banks. However, there are certain limitations to commercial banks’ activities, e.g. CBs can perform foreign currency transactions only after they have obtained the NBP President’s permit. Nevertheless, product and service offer of these banks systematically becomes similar to the commercial banks’ offer. Cooperative banks offer different kinds of current accounts, grant credits and loans and propose a wide range of possibilities to accumulate their clients’ free funds. Within their primary activities cooperative banks also offer debit cards, financial advice, settlements in the Eliksir and SWIFT systems as well as using banks’ services on the phone or via the Internet.
SKOKs are institutions whose activity is concentrated in local societies, therefore their product and service offer is limited to fundamental financial services in such fields as: keeping current accounts, granting credits and loans and accumulating deposits. They also have the right to grant guarantees, but only in cash. Recently various credit societies’ investment funds, whose products are sold via a network of SKOKs, have dynamically developed. However, comparing the product and service offer of CBs and SKOKs, the banks are in a decidedly better position.
3. Financial and Economic Results of Cooperative Banks and Credit Societies
The cooperative banks’ sector is characterized by certain features which distinguish these banks from the whole banking sector. To begin with, the number of their
2 W.I.Jaworski,BankSpółdzielczynarynkuniszowym,„NowoczesnyBankSpółdzielczy”,Nr10/2002,p. 9.

66 Agnieszka Alińska
branches is the largest in the whole sector. 590 cooperative banks were active on the market of banking services at the end of 2005 (Figure 1) and there are more than 3.6 thousand branches, including local offices, belonging to the cooperative banks’ sector. However, according to NBP data 6 CBs stopped their activities as separate entities in the first three quarters of 2006. In the same period the number of local branches increased by 7.2%3.
Figure 1. The number of cooperative banks in the years 2000–2005
642
605
2001 2002 2003 2004 2005
number of cooperative banks
596 590600
Source: own researchpaperbasedonBanki spółdzielczewPolsce,NBP,Warszawa2006, p. 69.
The changes observed in the number of independent cooperative banks and the network of local branches are not just the effect of market challenges and needs but primarily reflect the cooperative banks’ endeavors to fulfill the requirements concerning available capital, for cooperative banks have been obliged to raise their own funds to the equivalent of 1 mln Euro by the end of 2007. However, at the end of September in 2006 all cooperative banks had funds exceeding the equivalent of 500 thousand Euro at their disposal and only 395 CBs had more than 1mln Euro, which accounted for 62.5% of cooperative banks.
A characteristic feature of commercial banks’ activities is their limited territorial range, generally covering the area of one poviat. Nonetheless, the CBs whose own funds exceed 1 mln Euro but are lower than 5 mln Euro can operate on the area of voivodship where the headquarters are and on the area of poviats where their branches offer banking services. Commercial banks basically function in rural areas (ca. 42%), in small town communities (ca. 54%) and in typically urban areas (ca. 4%). A typical group of clients consists of people and firms related to rural economy, which is reflected in their servicing such client segments as farms, small and medium companies active in the field of rural development and
3 Financial situation of banks in the period January–September 2006. Synthesis, NBP, GINB, WarszawaFinancialsituationofbanksintheperiodJanuary–September2006.Synthesis,NBP,GINB,Warszawa2007, p. 19.

Cooperative Banks and Credit Societies – Comparative Analysis of Regulations... 67
natural persons living in rural areas. Such client structure primarily results from historical considerations and legal regulations, which at the beginning restricted the area of these banks’ activities to the commune where the cooperative bank had its seat, then to the area of one poviat and then to the neighboring poviats. This has determined the development of one of the basic features of local institutions, i.e. close contacts and familiarity with clients. These factors cause that the number of persons, firms and institutions using financial services of cooperative banks and their local branches has systematically grown. According to CBNC (KZBS) data, the number of bank accounts opened by SMB equities in 2005 increased by 30% over the previous year and 1.3 mln farmers out of 1.45 mln benefiting from EU payments used services of CBs, which accounts for almost 90%. Besides, 78% of communes and poviats use cooperative banks’ services, which represents a 10 p.p.4 increase over the previous year. These numbers reflect positive changes in the local clients’ attitudes towards product and service offer of cooperative banks.
The increase in the number of clients as well as in the number and value of cooperative banks’ financial transactions is reflected in the improvement of their financial and economic condition. Since 2002 a systematic growth in the value of cooperative banks’ assets as well as deposits taken and credits granted by these financial entities has been observed (they mainly consist of non-financial sector receivables).
Figure 2. Value and dynamics of cooperative banks’ assets
35
30
25
20
15
10
5
02000
18
117.2
21.5
119.2
23.4
108.8
assets
Years
dynamics (= 100)
120118
116114
112110
108
106
104
102
25.7
109.7
28.7
111.8
32.5
116.9
2001 2002 2003 2004 2005
billi
on z
ł
%
Source: own study paper based on NBP data.
4 M.Krześniak,BankiSpółdzielcze licząnaulgipodatkowe,„GazetaPrawna”,Nr118of20.6.2006.

6� Agnieszka Alińska
Figure 3. Value of assets, deposits and receivables in CBs
3530
2520151050
2001
assets
21.5
16.111.3
23.4
17.412.6
25.7
19.114.8
28.7
21.316.7
32.5
22.818.1
non-financial sector deposits non-financial sector receivables
billi
on z
ł
2002 2003 Years2004 09.2005
Source: own research paper based on NBP data.
Financial data and effects of SKOKs activities have been illustrated on the basis of information presenting the dynamics of growth in the number of SKOKs and their operations branches.
Figure 4. Number of SKOK and their branches
13 32106 137 168
237 290
Years
420
560680
923
1285
14611553 1564
1992
1993
1994
1995
1996
1997
1998
1999
2000
2001
2002
2003
2004
2005
2006
Source: own research paper based on National Cooperative Savings and Credit Fund data.
The increase of the number of local branches and newly-established credit societies in Poland is mainly the result of the demand declared by clients, who on the market of financial institutions look for services which are adequate to their needs and financial and economic possibilities. The level of clients using the

Cooperative Banks and Credit Societies – Comparative Analysis of Regulations... 6�
basic product and service in SKOK offer is reflected in the value of accumulated deposits and credits granted by these entities in the years 2000–2006.
Figure 5. Value of deposits and credits and the number of SKOK members in the years 2000–2006
0
1000
2000
3000
4000
5000
6000
2000 2001
The development of SKOKs
2002 2003 2004 2005 VII 2006
995.3
deposits credits number of members in thousands (right scale)
million zł
865.7
1558.41235.6
2253.9
1659.8
3111.6
2212.9
3937.9
2856.3
4985.6
3502.9
5323.6
3768.9
Source: I. Morawski, Komisja nadzoru przypilnuje SKOK-i, Rzeczpospolita of 4.11.2005.
The analysis of the above data illustrating the effects of credit societies’ sector activities, especially those relating to the value of accumulating deposits and granting credits, allows stating that in the analyzed period a fivefold increase of nominal value of deposited funds and a fourfold nominal increase in the value of granted credits have been observed. The increase of the scale of activities in this area had a direct influence on the value of SKOK’s assets. Analyzing the relation of SKOK’ assets to CBs’ assets we can see that in the years 1996–2005 there was a jump from 2.42% in 1996 to 15.72% at the end of 2005. Average annual growth rate of SKOKs assets between 1997 and 2005 amounted to 43.16% against 15.83% in the cooperative banks’ sector5. The increase of CBs’ and SKOKs basic values is presented below.
5 T. Bugajny (and others) Analiza sytuacji w sektorze bankowym według stanu na 31.12.2005 r.,„BezpiecznyBank”,Nr4/2006,BankGuaranteeFund,p. 105.

70 Agnieszka Alińska
Figure 6. Pace of changes in chosen balance values in the sector of cooperative banks and credit societies at the end of 2005 as compared with the state as of 31.12.2004
0
5
10
15
20
25
30%
18.10%
balance sheet total
cooperative banks cooperative and associating banks SKOK – banks
deposits non-financial sector receivables
21.39%
26.02%
19.90% 19.88%
26.71%
9.87% 9.29%
22.64%
Source:T.Bugajny(andothers),Analizasytuacjiwsektorzebankowymwedługstanuna31.12.2005r.,„BezpiecznyBank”,Nr4/2006,BankowyFunduszGwarancyjny,Warszawa,p. 106.
Considerably better effects of SKOKs’ activities in the area of financial and economic values are the result of a better product and service offer aimed at their clients as well as more profitable financial terms. The latter are the result of much more advantageous legal considerations, which determine financial aspects of SKOK’s activity on the market. Savings Societies offer their members lower costs of using basic financial products and services and higher financial benefits on investing their free funds than cooperative banks. A striking difference is observed in the interest paid on current accounts (more than twice) and deposits. Minor differences exist in costs incurred, especially on account of interest paid on credit. At the same time these values illustrate an interest mark-up scale the banks and savings societies charge.

Cooperative Banks and Credit Societies – Comparative Analysis of Regulations... 71
Figure 7. Comparison of mean value of interest rate on SKOKs’ and cooperative banks’ basic financial products
0 3 6 9 12 15
Cash credit
One year deposit
Current account
3.27
1.00
4.62
3.00
11.90
bank
SKOK
13.05
Source:M.Gzyl,�oproponują spółdzielczekasy, „Rzeczpospolita” of 14.12.2006.
4. Comparative Analysis of the Effects of Cooperative Banks’ and Credit Unions’ Market Activities
Cooperative Banks and Credit Unions pursue their activities in very similar environments. The common feature of these financial institutions is their functioning as a cooperative form of ownership offering their clients a basic portfolio of deposit and credit products, and basically concentrating on providing services to local clients. Another characteristic feature of local financial institutions is the fact that due to relatively small sizes and a limited range of offered services, these entities function in united structures of organizational character, which has an impact on their market position, possibilities to reach potential customers and as a result is the basis for their dynamic and safer growth on the financial service market.
However, between these two entities there are substantial differences which determine the scale and effects of their basic activities. Cooperative banks have to abide by legal provisions regulating activities of banking sector, which requires fulfilling the norms of safe and reliable functioning on the financial service market. It is particularly connected with the requirement of abiding by supervisory and guarantee regulations (executed by banking supervision and Bank Guarantee

72 Agnieszka Alińska
Fund respectively). Both, cooperative banks and credit societies incur costs for the purpose of ensuring safety of market-provided funds. The basic systemic costs for banks are obligatory reserves, contributions for BGF, costs of creating specific provisions as well as corporate income tax burdens (for SKOKs the burden of paying CIT came into force on 01.01.2007). In the SKOS’s financial system, at the level of National Credit Society, there exists the stabilization fund whose aim is to secure financial stability of united societies’ client savings accumulated in these entities. This is due to the fact that the societies are obliged to make payments amounting to the minimum of 1% of their assets for the stabilization fund. Exemption of SKOKs from duties levied on banks allows them to offer more advantageous terms and higher profits on the side of keeping accounts and deposits as well as lower costs on the side of granted credits. Besides SKOKs have less complicated and rigorous procedures as for checking creditworthiness and demanding surety. The analysis of the above characteristics of cooperative banks and credit societies allows stating that for clients of local financial institutions such financial and economic factors as profits received and costs incurred on account of using financial services are more important than safety levels characteristic for certain types of such financial institutions as cooperative banks and credit societies.
Summing up the above considerations we may assume that despite many differences between cooperative banks and credit societies, the preferences the latter enjoy considerably facilitate conducting their financial activities. These entities are capable of reaching their clients, who are mostly less affluent and therefore less demanding, and persuading them to use the services and products they offer. These activities also bring tangible effects, such as e.g. encouraging a large part of Polish society to use their financial, mainly banking, services. This conclusion seems to be significant as, according to the research results, only 67% of the polled stated that they had used banking services within the two previous years. The largest group represents people who have current accounts or have obtained credits. Compared to other EU member-countries, where banking services are used by ca. 95% of population, this figure is very low. Hence, new challenges both for cooperative banks and credit societies have arisen.
5. Bibliography
1.Banki spółdzielczewPolsce,NBP,Warszawa2006. 2.Bugajny T. (i inni), Analiza sytuacji w sektorze bankowymwedług stanu na31.12.2005r.,„BezpiecznyBank”,Nr4/2006,BankowyFunduszGwarancyjny,Warszawa.
3.GzylM.,�oproponują spółdzielczekasy, „Rzeczpospolita” zdn. 14.12.2006r.

Cooperative Banks and Credit Societies – Comparative Analysis of Regulations... 73
4.Jaworski W. L., Banki spółdzielcze na rynku niszowym, „Nowoczesny BankSpółdzielczy”,Nr10/2002.
5.KrześniakM.,BankiSpółdzielcze licząnaulgipodatkowe,„GazetaPrawna”,Nr 118 z dn. 20.6.2006 r.
6.Morawski I., Komisja nadzoru przypilnuje SKOK-i, „Rzeczpospolita” z dn.4.11.2005 r.
7.Sytuacjafinansowabankówwokresiestyczeń–wrzesień2006r.Synteza,NBP,GINB, Warszawa 2007.
Paweł NiedziółkaWarsaw School of Economics
Financial Covenants and Outside Rating as Factors Restricting Information Asymmetry on the Syndicated Loan Market
1. Introduction
The development of the market of syndicated loans, which in Poland perform the role of the most important instruments of credit risk transfer, is determined by the issue of monitoring the debtor’s financial and economic condition in a situation when there is a lack of direct business relations. The issue becomes especially important in view of dichotomic division of the syndicate members into arrangers and participating banks. The aim of this article is to define the potential of covenants and outside ratings as factors restricting information asymmetry and increasing the possibilities of exposure monitoring by participating banks.
2. Selected trends on the European market of syndicated loans
Corporate lendings are credits authorized by at least two banks. After obtaining the borrower’s mandate to lead the finance and providing guarantees for the full required amount, the bank starts syndication according to one of the below-mentioned variants1: • transfer of means for the lender via an agent – the means are provided
by all syndication participants (it concerns both syndicates with only one arranger and the so-called club deals) according to the rule of proportionate share (primary syndication),
• transfer of means which are solely provided by the arranger – in the second stage syndication banks refinance the arranger’s share (secondary syndication).
1 More on the subject of types of syndicated loans can be found in: P. Niedziółka, Syndykacja jakoMore on the subject of types of syndicated loans can be found in: P.Niedziółka, Syndykacja jakosposób redukcji ryzyka kredytowgowPolsce, „Studia i PraceKolegiumZarządzania i Finansów”,Nr 28, WSE 2002, pp. 94–108.

Financial Covenants and Outside Rating as Factors Restricting Information... 75
The syndicate credit market is highly concentrated, which is proved by data of 2002 showing that 30% of credits rated as speculative were syndicated by 3 most active banks and 50% by 7 biggest institutions2.
Figure 1. The market of syndicated credits in Poland against the European market in the years 2001–2005
1600
1400
1000
800
600
400
200
02001
Europe
Poland
Synd
icat
ed c
redi
ts in
Eur
ope,
USD
bill
ion
Synd
icat
ed c
redi
ts in
Pol
and,
USD
bill
ion
2002 2003 2004 2005Year
7.0
6.0
5.0
4.0
3.0
2.0
1.0
0.0
1200
Source: own study based on: K. Humphreys, Overview of the European Syndicated Loan Market, Mizuho �orporate Bank Ltd,October 2006;W.Grzegorczyk,Mniej wspólnych pożyczek, „Rzeczpospolita” of19.1.2005;W.Grzegorczyk,Mniejwspólnegofinansowania,„Rzeczpospolita”of17.1.2003;W.Grzegorczyk,Najwięksi ciągle potrzebują pieniędzy, „Rzeczpospolita” of 24.1.2002 and W. Grzegorczyk, Pożyczalina spłatę pożyczek, „Rzeczpospolita” of 19.1.2006 (amounts of syndicated credits granted to Polishentities were calculated as per NBP mean exchange rate of List A at the end of the calendar year).
At the same time, on the basis of available statistical data we cannot unequivocally state that average transaction size systematically rises or falls – however, in the analyzed period (from 2000 to 2005) it never fell below the level of 450 mln USD3.
In recent years on the market of syndicated credits a trend to take initiative by global investment banks, which perceive their role as analogous to the role performed on the bond and share market, has been observed. It means that the lead banks aim at maximizing profits on arrangement commissions rather than on incomes on interest.
Syndication banks aim at selling the biggest share of primary arrangement, leaving for them only the amount necessary to act as an agent (which will allow them to enjoy additional benefits on commission). The specific role of lead banks
2 B.J.Ranson, The Growing Importance of Leveraged Loans, “The RMA Journal”, May 2003, p. 18.Ranson,TheGrowingImportanceofLeveragedLoans,“TheRMAJournal”,May2003,p.18.3 Investing in loans globally, LSTA Annual Conference, October 2006, p. 5.Investing in loans globally, LSTA Annual Conference, October 2006, p. 5.

76 Paweł Niedziółka
is determined by the issue of their client – is it a borrower or a syndication bank. The research shows that in the view of a potential conflict of interests, the borrower is perceived as a client. Due to emergence of a fairly liquid syndicated loan market, the “buy & hold” rule does not apply any longer, and neither does the customary keeping of a significant part of exposure in the arranger’s balance, which in the past would mean combining the transfer and finance functions4.
The European syndicated loan market aims at increasing the share of higher-risk transactions. The value share of transactions in which the borrower did not have investment rating rose from 11% in 2000 to 20% in mid-20065. On the other hand the share of transactions allotted to financing manager buyouts as well as mergers and takeovers increased from 19% in 2004 to 31% in 2005. Also the level of financial leverage grew, which is confirmed by index increase: total indebtedness/EBITDA increased from 4.6 to 6.0 in leveraged manager buyouts between 2004 and 2006. In turn senior debt more often replaces the more expensive subordinated financing – in relation to EBITDA its level increased from 4.2 at the end of 2005 to 4.5 in the first half of 20066.
Profitability of the syndicated exposures, which are considered to be among the safest investments, continues to be seen as attractive in spite of it systematically going down. The pressure to lower the cost of financing results on the one hand from high competition among organizers and on the other, from high market liquidity, which is reinforced by demand from funds investors who purchase exposures in the form of debentures being the effect of repackaging the risk in such instruments as CLO and CDO.
At present the market is characterized by a sharp reduction in the number of syndications in which allocation occurs on the primary market, which is connected with targeting the secondary syndication offer at a very wide group of potential investors in order to cause the downward flex effect in case of oversubscription. A more and more often used market evaluation of syndication exposure is the result of an intention to change price terms of financing which takes place in the form of secondary syndication novation or in the form of clients’ waivers.
Another important phenomenon is an ever growing number of transactions paid before maturity through a subsequent syndication (on more favorable conditions)7. Systematic shortening of time in which the prospective participating
4 J.Armstrong,TheSyndicatedLoanMarket:DevelopmentsintheNorthAmerican�ontext,WorkingPaper2003-15,Bankof�anada, June2003, p. 1.
5 S. Miller, A syndicated loan primer w: Standard & Poor’s: A guide to the loan market, SeptemberS. Miller, A syndicated loan primer w: Standard & Poor’s: A guide to the loan market, SeptemberMiller, A syndicated loan primer w: Standard & Poor’s: A guide to the loan market, September 2005, p. 10 and K. Emery, S. Ou, Characteristics and Performance of Moody’s – Rated U.S. Syndicated Bank Loans, Special Comment, Moody’s Investors Service. Global Credit Research, March 2004, p. 3..
6 Investing...,Investing..., op. cit., pp. 6–7.7 Ibidem, pp. 24–25.

Financial Covenants and Outside Rating as Factors Restricting Information... 77
institutions are to verify finance arrangers’ proposals is a vital problem. At present it is 2 weeks, which increases the financial risk. Shortening the decision-taking time is the result of considerable interest in syndicated credits on the part of funds investors (hedging funds included)8, who are noted for using simplified analysis and decisiveness model. In such a case greater documentation standardization and publicizing of rating evaluations may act as an antidote.
3. Information and Moral Hazard Asymmetry on the Market of Syndicated Credits
The problem of information asymmetry in the financing process appeared together with the development of techniques of selling credit risk on the secondary market, therefore it should be connected with securitization and secondary syndication. The issue of information asymmetry and its impact were particularly noticed in 2001, when the Nobel Prize in economics was awarded for research on incomplete information to George A. Akerlof from Berkeley, Andrew Michael Spence from Stanford University and Joseph E. Stiglitz from the University of �olumbia.Information asymmetry, illustrated by Akerlof on the example of market of lemons and transferred to financial markets by Stiglitz, destroys a number of economic theories based on the market effectiveness assumption9.
Information asymmetry accompanying risk transfer may have alternative effects: • unexpected losses of investors who estimated the transferred assets risk
as lower than actual, • bank panic, if due to a single bankruptcy or in case of recession, the
investors will estimate the portfolio risk as higher than actual – bank panic comes to light especially in case of relatively liquid credit risk markets, where debenture bonds become the instruments of risk transfer10.
8 At the end of the 3At the end of the 3rd quarter of 2006 the share of hedging funds on European debt market amounted to 7% and it reached 11.9% on American market, while in 2004 the shares respectively amounted to 0.8% and 5.9% – acc. to Investing...,to Investing..., op. cit., p. 25.
9 Market of lemons in American slang means the second-hand car market, where the information asymmetry problem is clearly observed (the car seller’s knowledge about it is incomparably greater than the buyer’s). More information about the Nobel Prize in economics in 2001 can be found in anarticlebyW.Gadomski,Nobel z ekonomiiw2001: zaniepełną informację, „GazetaWyborcza”of 10.10.2001, http://gospodarka.gazeta.pl/gospodarka/1,33182,471508.html (data as of 25.12.2006).
10 Por.J.Szambelańczyk,Instytucjonalnasiećbezpieczeństwaastabilnośćsystemubankowego,w:Fi-nanse, banki i ubezpieczenia w Polsce u progu XXI wieku, Vol. II, „Bankowość”, WydawnictwoAkademiiEkonomicznejwPoznaniu,�onferencePapers,Poznań2000, p. 442.

7� Paweł Niedziółka
Information asymmetry cannot be identified with moral hazard. Moral hazard may (but does not have to) result from information asymmetry. We deal with moral hazard when natural economic behaviors, such as • risk aversion resulting in a drive to optimize methods of its measurement,
rules of acceptance and ways of risk management (lender’s attitude) and • fear of too high costs of financing and a necessity to service the debt in
a situation of financial standing worsening (borrower’s attitude),do not necessarily become modus faciendi priorities of financing institution and the borrower if each of these entities expects help in case of difficulties with debt servicing. Therefore, moral hazard affects both the financing and the financed party.
For the creditor, the solution neutralizing the incurred risk may be its transfer (with incomplete information about the asset quality or generally vague information about the portfolio) or support from the institutions responsible for financial sector stability in a given country (usually it is an entity responsible for deposit guarantee system). In turn the borrower will reckon on restructuring money flows and lender’s help as well as on improving own solvency (though more often than not this optimism is not connected with any specific improvement on a micro scale but rather with expectations of a general sector economic upturn).
Moral hazard as “temptation of trust abuse” was strikingly exposed in the case of LTCM fund whose credibility was to follow from the founders’ names, namely Myron S. Scholes and Robert S. Merton, the Nobel Prize winners, David Mullins,FEDvice-president,andJohnW.Meriwether,atraderwhointhe70-iesand 80-ies earned several billion USD for Salomon Brothers. Thanks to the market trust the founders enjoyed, LTCM repeatedly managed to borrow sums several times in excess of equity (the fund leverage level was higher than in similar institutions, reaching 96% of total balance of liabilities). Another preference was rather liberal rules for LTCM to provide forward transaction guarantees (only to the level of negative, from LTCM point of view, valuation). LTCM abused investors’ trust by insufficient diversification of their investments and suffering all consequences of the Russian crisis (losses resulting from own exposures in Russian assets and massive capital outflows from the Russian market according to the ‘flight to liquidity’ rule, which in turn resulted in the increase of Russian credit risk profit margin). Thanks to A. Greenspan’s intervention LTCM was saved by American commercial banks, which proved two other rules: ‘too important to fail’ and ‘too big to fail’11.
Moral hazard is also connected with the lead bank low inclination to monitor exposures and consequently promptly react in case of the borrower’s worsening
11W.Gadomski,Zabawawupadanie, „ManagerMagazin”, edycjapolska,Nr6 (7) June2005.

Financial Covenants and Outside Rating as Factors Restricting Information... 7�
financial standing. Usually the price of financing based on standard patterns of documentation is high from the borrower’s point of view; however the acceptance of the global investment bank’s offer is supported by such arguments as: • reputation of the lead bank, which increases the financed company
prestige, • the speed of the process, which also means a short time from loan
inception, • usually, a lack of specific information requirements or additional expertise
in order to prepare a memorandum and credit documentation.Therefore the market of Polish big investment projects financed by bank
syndicates is heading for a paradoxical model: • feeling secure that there will be no problem with selling the debt on
secondary market, the arrangers do not undertake a specific risk analysis and by keeping a considerable share of preparatory commission (sometimes also of a margin) and transferring a large part or even the whole of credit risk realize a very high ROE rate,
• final credit risk acquirers (Polish syndicated banks) have a limited access to the information about the project and cannot exert a significant influence on syndicate decisions (financing is usually dispersed).
Hyper-liquidity of the Polish banking sector causes that the issue of possible additional benefits resulting from the so-called certification effect becomes less important. In case of West European and USA markets securing relatively high amounts from financing by smaller entities, without accessing the capital market as a source of financing, is possible due to hybrid syndicated credits (i.e. arranged together by investment and commercial banks). On account of their long-lasting and favorably evaluated cooperation, commercial banks perform the function of the borrower’s authorizer capable of securing finance on the basis of relatively low rates. Then investment banks concentrate on debt distribution and agency issues. If there was no authentication, the client might have a problem with securing the needed amount and the cost of financing would be very high. The lack of authentication effect also has an impact on increased moral hazard on the part of the borrower, who does not see a connection between his own economic and financial situation (not necessarily reflected in indices determining financial covenants) and terms of financing. The above-mentioned phenomenon may result in the so-called negative selection, i.e. limited screening of potential borrowers and rejecting only those entities that are undeniably untrustworthy12.
12M.Olszak,Międzynarodowyrynek instrumentówtransferuryzykakredytowego,„Bank iKredyt”,Nr 3/2006, p. 40.

�0 Paweł Niedziółka
Even if in the foreseeable future it turned out that financing by renowned financial institutions brought losses to syndicate participants, there is little chance for the model of two-stage syndicated financing to lose its validity. The reasons for this potentially slender impact of future debt-on-sale irregularity on changing the formula of financing are as follows: • in every credit documentation there is a clause transferring full liability
concerning the project risk evaluation to the bank applying for the syndicate membership,
• as recent records show banks offering Enron, Parmalat or Delphi debts, which nota bene have not suffered significant losses due to their initial exposures, continue to enjoy market trust. Market participants’ ‘short memory’ is also proved by the LTCM example – after its collapse, one of the fund managers, John Meriwether, by securing finance from LT�Mestablished JWM Partners, a new entity whose investment profile wassimilar to LTCM.
Syndicated credit market vagueness, understood as quantity and exactness of risk transferred information, is an obstacle for supervisory authorities in the evaluation of market systemic risk and concentration risk. In its turn lack of the above data is an obstacle in the evaluation of the correlation level of worsening standings of reference debt remitter and guarantee provider (contracting party)13.
4. Financial Covenants as an Instrument of Syndicated Credit Monitoring
Financial covenants are ratios the borrower is obliged to obey. Their required levels are not fixed – they are defined for each financial period separately. Covenants perform the following functions: • in case of failure to comply with any terms they allow creditors to demand
early repayment (before subordinated debt servicing), establish additional security or increase the cost of financing14,
• act as exposure monitoring instruments providing objective parameters of description of borrower’s economic and financial condition,
• enable creditors to gain knowledge on assumptions of client’s financial projections,
• determine specific borrower’s (or his economic group’s) behaviors – e.g. in case of Debt/Share Capital ratio an increase of client’s indebtedness
13 Ibidem, p. 38.14 Guide to Syndicated Leveraged Finance, LMA, 2006, p. 7.

Financial Covenants and Outside Rating as Factors Restricting Information... �1
determines the necessity to increase capital (in order to fulfill the commitments resulting from the covenants).
In practice the following types of financial covenants are in use15: • leverage ratios (debt/capital, debt/ financial resources), • coverage ratios (debt/EBITDA, EBITDA/debt servicing, EBITDA/interest,
debt/fixed assets value), • others (minimal net value of fixed assets, LTV, liquidity ratios).
Despite syndicated credit market development, the range of financial covenants in use is subject to reduction and liberalization. It results from the fact that until recently rather restrictively applied credit terms had a positive impact on exposure quality. In 2005 competing for low default probability assets, banks liberalized credit terms. It was reflected in a decreased number of covenants and mainly concerns investment grade credits whose quality, nevertheless, is worsening. An average number of covenants for investment grade credits went down to 5 (from 6 – the level which was sustained until 2002); in relation to speculative credits the average was 6 in 2005 (it was 8 between 2002 and 2004)16.
Table 1. Number and structure of financial covenants in the years 1��6–2005
Covenant group Borrower’s rating 1��6 2000 2005
Financial
Coverage ratiosInvestment 52.9 50.4 53.7Speculative 82.6 74.1 69.8
Leverage ratiosInvestment 62.3 68.1 84.6Speculative 71.9 68.9 68.2
OtherInvestment 44.5 43.5 22.1Speculative 46.5 36.0 11.2
Non-financial
SweepsInvestment 14.7 15.0 10.2Speculative 53.9 63.1 64.3
Restrictions on divident paymentInvestment 43.5 43.1 61.1Speculative 91.6 88.1 77.6
Reuirements concerning voting majorityInvestment 95.8 96.2 97.2Speculative 90.6 94.2 70.6
Source: W. May, M. Verde, Loan Volumes Surge, Covenants shrink in 2005, Credit Market Research, FitchRatings, April 2006, p. 4.
15 W. May, M. Verde, Loan Volumes Surge, Covenants shrink In 2005, Credit Market Research, FitchRatings, April 2006, p. 4.
16 Ibidem, pp. 1–2.

�2 Paweł Niedziółka
With liberalization of terms (mainly in relation to speculative credit rating) an average financing period has been extended, which among others results from refinancing character of numerous exposures and from lower margins for exposures with longer repayment periods. Therefore in consequence of extended exposure periods, the effect of covenant liberalization must be acknowledged to be multiplied. Lowering average number of covenants relating to one exposure together with growing frequency of using, for example, ratios of debt servicing coverage to leverage proves market homogeneousness (standardization of terms and conditions of financing)17.
5. Outside Rating as an Instrument Restricting Information Asymmetry
Dissemination of rating system is a factor which might have a positive effect on syndicated credit liquidity – an example functioning in Western Europe and the United States is the system implemented by Standard & Poor’s.
Table 2. Rating system for syndicated credits implemented by Standard & Poor’s
BLR* (Bank Loan Ratings) asCCR** (Corporate Credit Rating)
equivalentRecovery Rating
Expectedrecovery rate(on principal)
CCR + 3–4 levels 1+ The strongest likelihoodof 100% principal recovery 100%
CCR + 1–2 levels 1 Strong likelihood of 100%capital recovery 100%
CCR 2 Substantial likelihoodof 100% principal recovery 80–100%
CCR 3 Meaningful likelihoodof 100% principal recovery 50–80%
CCR 4 Marginal likelihood of 100%principal recovery 25–50%
CCR 5 Minimal likelihood of 100%principal recovery 0–25%
* syndicated credit rating (the scale is identical with the generally used by S&P)** borrower’s rating (the generally used S&P scale)Source: S. Bavaria, To Our Clients in the Syndicated Loan Market, Standard & Poor’s, 18th March 2004, page 1 (the above mentioned publication also describes procedure and cost of rating, which represents the sum of the so-called relationship fee, i.e. 37,000 USD and issue fee, i.e. from 0.5 to 2.75 basis points of the principal).
17 Ibidembidem, p. 8.

Financial Covenants and Outside Rating as Factors Restricting Information... �3
Syndicated credit ratings are prepared by institutions listed below18: • LPC (Loan Pricing Corporation), • Standard and Poor’s, • Thompson Financial, • Moody’s.
High quality of rating evaluation (i.e. present and potential future debt value) is reflected in a relatively low rating volatility within one year.
Table 3. Rating volatility of syndicated credits within 1 year
Decline by2 or more positions
Decline by1 position
StableImprovementby 1 position
Improvementby 2 or more
positionsin %
2001 1.54 9.88 85.11 3.21 0.262002 1.20 13.08 82.96 2.75 0.00
Source: K. Emery, S. Ou, Characteristics and Performance of Moody’s – Rated U.S. Syndicated Bank Loans. Special Comment, Moody’s Investors Service. Global Credit Research, March 2004, p. 7.
However, it is surprising that there is a rather slender connection between changes in credit rating due to a change in securities rating; in case of a decline in securities rating, credit rating declines by ca. 75%, in case of improvement it amounts to over 95%. These results can be explained by the fact that senior syndicated debt usually represents a lower credit risk on account of its securitization and additional covenants, therefore almost each improvement in securities rating will result in an improvement of credit debt rating, which cannot be said about the decline in securities rating. An additional argument is provided by the results of a research on cases of breach of provisions of an agreement – only 7% of cases of breaching primarily concern credit, with securities following. Another research carried by Moody’s in relation to note and speculative syndicated credit issuance, covering the period from 1996 to 2003, shows that losses due to annual exposures for securities amounted to some 4.5% while for credits in the same time horizon only to 1.5% (for a 3-year period it was 16% and 5.5% respectively)19.
Even in the event of investment grade credit exposures there is no one hundred per cent certainty regarding the maximum level of potential losses. The above has been proven by such cases as Enron, WorldCom and Conseco. Investing
18 G. Yago, D. McCarthy, The U.S. Leveraged Loan Market: A Primer, Milken Institute & The LoanG. Yago, D. McCarthy, The U.S. Leveraged Loan Market: A Primer, Milken Institute & The Loan Syndications and Trading Association (LSTA), October 2004, p. 11.
19 K. Emery,K. Emery, op. cit., pp. 7–8 and 10.

�4 Paweł Niedziółka
in syndicated credits must be preceded by an analysis of the expected rate of return and risk. In order to facilitate such an analysis and at the same time arouse an interest of a wider circle of investors, in practice certain indices are used – quotation of credits with a speculative grade rating index (CSFB Leveraged Loan Index) is among them. In the years 1993–2000 the aforementioned index was the only one which did not suffer losses (except for the Treasury bonds index)20.
6. Conclusion
Recently, the syndicated credit market has been developing very dynamically, which on the one hand was caused by relatively high profitability on the secondary market (despite a downward tendency and ever increasing use of the market flex clause) and on the other a low share of default exposures. The observed structural changes indicate a growing importance of credits with speculative ratings and consequently with a higher credit risk. The risk of financing is also connected with the issue of information asymmetry, limited possibilities of influencing corporate decisions and a short time (forced by demand among others represented by funds investors) to make a credit decision, which in turn may mean analysis superficiality. For this reason special instruments favoring turnover transparence and allowing exposure monitoring have been established. As regards the above, a leading role is played by an evaluation of an independent rating institution, publicizing daily credit market evaluation and creating instruments whose purpose is to monitor syndicate engagements as well as standardization of credit documentation.
7. Bibliography
Book publications: 1.NiedziółkaP., Syndykacja jako sposób redukcji ryzykakredytowegowPolsce,„Studia i Prace Kolegium Zarządzania i Finansów”, Nr 28, SGH,Warszawa2002.
2.Szambelańczyk J., Instytucjonalna sieć bezpieczeństwa a stabilność systemubankowego, w: Finanse, banki i ubezpieczenia w Polsce u progu XXI wieku, Vol.II, „Bankowość”, Wydawnictwo Akademii Ekonomicznej w Poznaniu,Materiałykonferencyjne,Poznań2000.
20 B. J. Ranson,B. J.Ranson,op. cit., p. 17.

Financial Covenants and Outside Rating as Factors Restricting Information... �5
Press and special-event publications: 1.Armstrong J., The Syndicated Loan Market: Developments in the NorthAmerican�ontext,WorkingPaper2003-15,Bankof�anada, June2003.
2. Bavaria S., To Our Clients in the Syndicated Loan Market, Standard & Poor’s, 18th March 2004.
3. Emery K., Ou S., Characteristics and Performance of Moody’s – Rated U.S. Syndicated Bank Loans. Special Comment, Moody’s Investors Service. Global Credit Research, March 2004.
4.Gadomski W., Nobel z ekonomii w 2001: za niepełną informację, „GazetaWyborcza” of 10.10.2001.
5.GadomskiW.,Zabawawupadanie,„ManagerMagazin”,edycjapolska,Nr6(7),czerwiec 2005.
6.GrzegorczykW.,Mniejwspólnegofinansowania,„Rzeczpospolita”of17.1.2003. 7.GrzegorczykW.,Mniejwspólnychpożyczek, „Rzeczpospolita” of 19.1.2005. 8.Grzegorczyk W., Najwięksi ciągle potrzebują pieniędzy, „Rzeczpospolita” of
24.1.2002. 9.GrzegorczykW.,Pożyczalina spłatępożyczek, „Rzeczpospolita” of 19.1.2006. 10. Guide to Syndicated Leveraged Finance, LMA, 2006. 11. Humphreys K., Overview of the European Syndicated Loan Market, Mizuho
Corporate Bank Ltd, October 2006. 12. Investing in loans globally, LSTA Annual Conference, October 2006. 13. May W., Verde M., Loan Volumes Surge, Covenants shrink In 2005, Credit
Market Research, FitchRatings, April 2006. 14. Miller S., A syndicated loan primer w: Standard & Poor’s: A guide to the loan
market, September 2005.15.OlszakM.,Międzynarodowyrynekinstrumentówtransferuryzykakredytowego,„Bank iKredyt”,Nr3/2006.
16.RansonB.J.,TheGrowingImportanceofLeveragedLoans,“TheRMAJournal”,May 2003.
17. Yago G., McCarthy D., The U.S. Leveraged Loan Market: A Primer, Milken Institute & The Loan Syndications and trading Association (LSTA), October 2004.
Website: 1. www.gospodarka.gazeta.pl (data as of 25.12.2006).

Aleksandra Laskowska-RutkowskaWarsaw School of Economics
Directions of Development of Supply Chains
1. Introduction
Living at a time of New Economy carries specific consequences. Fast pace of changes, innovativeness, dictates of consumers, omnipresent e-business and a short time to react are important elements of its environment. Supply chains are not only closely related to New Economy but also act as the engine of its development. These networks of organisations, which entwine the world, represent the materialization of the idea of cooperation beyond borders. Similarly to New Economy, they are subject to constant change and development. This paper is an attempt to define the main directions of development of supply chains, their classification and analysis.
2. Primary Concept of Integrated Supply Chain
The concept of integrated supply chain was publicized in the 80ies of last century. It was understood as groups of cooperating organisations which create chains, networks or webs of companies. They aim at value optimization in the whole chain, which, due to effective management of the network, is profitable for all chain links. Even at that time there were numerous definitions of this phenomenon. Table 1 presents some of them. Integrated supply chain may be considered as a mega-process within the scope of which optimization of sub-processes is attempted. These sub-processes include flows of materials, cash and information.
The 80ies and early 90ies were quite favorable for supply chain managers. Then main focus was put on optimization of flows of materials and their cost-effectiveness; also minimization of stocks in the whole integrated supply chain, which was to be achieved through improvement of management of flows of materials, was attempted. Such an attitude was a consequence of concentrating on final unit cost (called landed cost), i.e. the cost passed on to the end buyer of the product. The product price was considered as a tester of integrated supply chain efficiency. Taking a decision to buy a product, its purchaser among other things considers the price, which results in it being one of the determinants of the company’s competitiveness. Therefore, a natural consequence of an inefficient

Directions of Development of Supply Chains �7
system of flows of materials and excessive inventories is a comparatively high price of the product and its lower attractiveness for consumers. All organizations forming the ineffective chain lose and networks better at management their stocks win. This logic to some extent is still valid today.
Table 1. Examples of definitions of integrated supply chains
Author Definition
Gopal & Cypress
Physical network that begins at a supplier’s and finishesat the end customer. It covers all aspects connectedwith product development, purchases, production,physical distribution and after-sale services as wellas deliveries carried out by outside offerors
Handfield & Nicholas
All activities connected with the flow andtransformation of goods as well as with accompanyingflows of materials, starting with raw materials throughall transition stages and ending with final recipientsof goods. It is about upstream and downstream sidesof supply chains
Battaglia & Tyndall
Strategic concept covering understanding andmanagement of a sequence of activities – from theproducer to the consumer – adding value to thedelivered goods
Vollmann, Cordon & Raabe
Practices directed at management and coordinationof the whole network of supplies, from the rawmaterials’ suppliers to final consumers. Their aim isachieving the synergy effect in the whole chain ratherthan concentrating on separate chain links
Source:ownresearchpaperbasedon:K.Rutkowski,Zintegrowanyłańcuchdostaw,inaworkentitledZintegrowany łańcuch dostaw. Doświadczenia globalne i polskie, pod red. K. Rutkowskiego, SGH,Doświadczenia globalne i polskie, pod red. K. Rutkowskiego, SGH,SGH, Warszawa 1999, p. 12; R. Handfield, E. Nichols, Introduction to supply chain management, Prentice Hall, Upper Saddle River, New Jersey 1999, p. 2; T. Vollmann, �. �ordon and H. Raabe, Supplychain management. Conference materials on “A new procurement paradigm”, IESE, Barcelona, March 30–31, 1995, p. 35.
3. Changes in Perception of Supply Chains
First glimpses of changes appeared at the end of the 90ies. For example, they were heralded by results of researches, among others conducted by A. T. Kearney advisory group1. The results of the research conducted in European countries in 1999 made the authors of the A. T. Kearney entitled “Insight to Impact” formulate a conclusion that there had been a considerable qualitative change
1 Insight to Impact. Results of the Fourth Quinquennial European Logistics Study, European LogisticsInsight to Impact. Results of the Fourth Quinquennial European Logistics Study, European Logistics Association A. T. Kearney, Brussels 1999, p. 13.

�� Aleksandra Laskowska-Rutkowska
in the perception of integrated supply chains. According to the authors, for the time being it is the market leaders that are aware of the change. In the future it will be reflected in functioning of all supply chains. The change consists in substituting traditional markers of efficiency of integrated supply chains, which are quality, time and cost of activities. Instead, the success of integrated supply chains will be decided by responsiveness, leanness and agility, i.e. how quickly the system supported by the use of available information can achieve the optimal structure of costs. However, it is possible only after supply chains achieve good results in traditional categories2.
From the perspective of the second part of the first decade of the 21st century we may safely assume that the results of the A. T. Kearney group’s research were absolutely correct. The forecasted future turned into the present, a part of which already belongs to the past.
The years of being fascinated by lean supply chains are over. In his article published in Harvard Business Review in 20043 Hau Lee wrote, “As time went by I observed a paradoxical regularity (...) in identical remaining conditions companies having more efficient and cost-effective supply chains did not get a sustainable advantage over their rivals. In effect, the performance of those supply chains, as regards building a competitive advantage, steadily deteriorated”4. Other researchers made similar observations. They even called this drive to leanness of supply chains ‘anorexia industraliosa’5. Where was the mistake underlying this seemingly attractive ‘lean’ solution? Namely, offering attractive cost solutions, leaner supply chains did it at the expense of fast reaction to changing market conditions. It was a strategic mistake – considering Bill Gates’ remark, “in the first decade of the 21st century it is speed that will count”6.
There were attempts to compromise between two key parameters of supply chains’ efficiency, cost and time. In his article of 1997 Marshall Fisher suggested dividing products into functional and innovative, and adapting to them supply chains – efficient and market-oriented correspondingly. Below is a brief characteristic of products and supply chains attributed to these products. Functional products have a two-year life cycle. The demand for them is rather stable and foreseeable. The time of supplying ordered goods to the market is rather long (6 months to 1 year). For this kind of goods Fisher suggested efficient supply chains operating
2 Also by: A. Laskowska, Konkurowanie czasem – strategiczna broń przedsiębiorstwa, Difin, WarszawaAlsoby:A.Laskowska,Konkurowanieczasem–strategicznabrońprzedsiębiorstwa,Difin, WarszawaDifin, Warszawa 2001, p. 187.
3 H. Lee, The triple – A supply chain, „Harvard Business Review”, October 2004.H.Lee,The triple –A supply chain, „HarvardBusinessReview”,October2004.4 H. Lee, Sekret najbardziej efektywnych łańcuchów dostaw, „Harvard Business Review Polska”,H. Lee, Sekret najbardziej efektywnych łańcuchów dostaw, „Harvard Business Review Polska”,hów dostaw, „Harvard Business Review Polska”,Harvard Business Review Polska”,
February 2005, p. 5.5 J. Gattorna, Living supply chains, Prentice Hall, London 2006, p. 3.J.Gattorna,Living supply chains,PrenticeHall,London2006, p. 3.6 B. Gates, Biznes szybki j�k myśl, Prószyński i S-ka, Warszawa 1999, p. 13.B.Gates,Biznes szybki j�kmyśl,Prószyński i S-ka,Warszawa1999, p. 13.

Directions of Development of Supply Chains ��
at low costs and to this end maximizing inventory turnover, minimizing their level and shortening the time of reaction only if it does not increase costs. On the other hand, innovative products have a life cycle from 3 months to one year. The demand for them is not foreseeable. The time of supplying the product to the market is from one day to two weeks. The market-oriented supply chain is used for this kind of goods and ensures speedy reaction to the unforeseeable changes in demand, concentrates on agility and speed of reaction, even if these are costly solutions7. Marshall suggested that managers choose one of these solutions combining specifity of the product with the supply chain specifity. It meant that one of the described above types of supply chains matches the profile of a firm.
A few years later such a simplification could not be taken into account. It became evident that supply chains should adapt their characteristics to customers’ needs. Since clients’ needs vary, a company needs a number of supply chains to keep them satisfied8.
The characteristic feature of the early 21st century is intensification of requirements related to supply chains. There are numerous new ideas which characterize the newly formulated expectations. Supply chains should be agile, adaptive to market conditions, of the quick response and ‘sense-and-respond’ types, customer driven, synchronizing demand and supply, demand driven and finally innovative.
Each of these ideas underlines a different aspect of the same multi-aspect reality. An analysis of the definitions of the above concepts allows identifying a part that is common to them all and at the same time pointing to a trend defining the rules which must be obeyed in a modern supply chain configuration. Three prevailing approaches have been identified; mainly logistical and technological, marketing and sociological and also time-based and operational.
4. Logistical and Technological Approach
There is a common trace in definitions of integrated, demand-driven and sense-and-respond supply chains. It is a strong logistical and technical orientation. Its characteristic feature is distinct reference to subjective issues concerning optimal logistical solutions with the aid of IT. In the background there is some emphasis on relations with customers and suppliers. Nevertheless, logistics and technology are of primary importance.
7 M. Fisher, What is the right supply chain for your product?, „Harvard Business Review”, March–AprilM.Fisher,Whatistherightsupplychainforyourproduct?,„HarvardBusinessReview”,March–April1997, p. 5.
8 How Many supply chains do you need? Matching supply chain strategies to products and customers,How Many supply chains do you need? Matching supply chain strategies to products and customers, A. T. Kearney 2004.

�0 Aleksandra Laskowska-Rutkowska
In 2005 research dedicated to five key areas of supply chain functioning, i.e. new product development, planning, supply, logistics and customer satisfaction has been conducted at IBM Business Consulting Services. Five stages of supply chain maturity have been identified in the research. The static chain has been classified as the lowest form and the demand-driven supply chain – as the most developed. Table 2 is a specification of qualities of demand-driven supply chain with the consideration of four categories, which are: launching a new product, demand and supply synchronisation, global purchasing power and the role of logistics in customer satisfaction.
Table 2. Characteristics of demand-driven supply chain
Launchinga new product
Demand and supplysynchronisation
Global purchisingpower
Logistics andcustomer satisfaction
There isa cooperation with suppliers; components are taken over from earlier projects; there exist formal, integrated with suppliers and cooperating firms processes
Changes in customers’ shopping habits automatically correct production and logistics plans; value analysis for shareholders is based on cash-flow analysis; price packages are optimized
Virtual network; complete insight into stocks, orders, forecasts and deliveries; global organization of supplies; rationalization of stock; achievement management
There are standards supporting open networks and their fast reconfiguration; there exists a variable cost structure; all non-core activities are outsourced; the effects of activities of the whole chain are monitored and exceptions are taken into account.
Source: own research paper based on: Follow the leaders. Scoring high on the supply chain maturity model, IBM Institute for Business Value 2005.
As observed in the specification, such issues as organization, processes and technology are exposed. ‘Soft’ aspects, concerning relations between cooperating firms, are treated superficially. The same concerns the issues of reaction time, which are the result of demand and supply synchronisation ‘Changes in customer’s shopping habits automatically correct production and logistics plans’. However, this has not been explicitly formulated.
Synchronized supply chain is another concept in which logistical and technological aspects are of primary importance. As Martin Christopher puts it, “the basic rule of synchronization is making all chain links act as a whole”9. On account of this, early identification of customers’ needs and planning discipline
9 M. Christopher, Logistics and supply chain management, Creating value-adding networks, PearsonM. Christopher, Logistics and supply chain management, Creating value-adding networks, Pearson Education Limited, London 2005, p. 187.

Directions of Development of Supply Chains �1
are required. It is important for ensuring continuity of activities that not just few suppliers carry out particular deliveries but that the deliveries are coordinated by one supplier – logistics services’ integrator. In this definition relations with cooperating firms are treated as a subjective means to an end. The author of this definition primarily focuses on operational aspect.
Similarly to the two above-mentioned cases the concept of sense-and-respond supply chains focuses on logistics and information technology. These chains fulfill a task of following all activities on the transactional level. It allows them to quickly identify the causes of current situation and immediately correct them. Thanks to full visibility of processes occurring in the chain and proactive exception management, they flexibly react to sudden situations. Defining a situation as ‘out of ordinary’, allows its quick detecting by the system and executing appropriate preventive measures10.
Creating such a sensitive and dynamically responding system is possible only with the help of appropriate information infrastructure. IBM Business Consulting Services distinguishes four components of sense-and-react supply chains11, which also well adapt to demand-driven and synchronized supply chains. These components are: • management dashboards – portals enabling an insight into supply chain
performance measurements and alert notifications, • event engine – a tool allowing constant data monitoring on the transactional
level of supply chain functioning, • active data warehouse – a repository of primary data concerning integrated
information about a supply chain. This information is then processed by event engine,
• product tracking – it is provided by such technologies as RFID to collect real-time data. The information is then automatically sent to the event engine.
Radio Frequency Identification is an innovative and profit promising solution. It is a relatively new initiative, combining advanced technology with deepened cooperation between supply chain links. RFID is a technology of electronic marking and identifying object with the use of radio waves12. To enable the radio identification, objects – be it individual products or whole crates or load vehicles – are provided with radio tags including information on the product in the form of the product’s electronic code. These codes are later identified by readers13.
10 K. Butner, S. Buckley, Sense-and-respond supply chains: enabling breakthrough strategy, IBMK. Butner, S. Buckley, Sense-and-respond supply chains: enabling breakthrough strategy, IBM Business Consulting Services white paper, August 2004, p. 5.
11 K. Butner, S. Buckley, Sense-and-respond supply chains...,K. Butner, S. Buckley, Sense-and-respond supply chains..., op. cit., p. 12.12 B. Srivastava, Radio frequency ID technology: The next revolution in SCM, “Business Horizons”,B. Srivastava, Radio frequency ID technology: The next revolution in SCM, “Business Horizons”,
47/6, November-December 2004, p. 60.13 Demystifying RFID in the Supply Chain; An overview of the promise and pitfalls, 2005, UnitedDemystifying RFID in the Supply Chain; An overview of the promise and pitfalls, 2005, United
Parcel Service of America, Inc., p. 1.

�2 Aleksandra Laskowska-Rutkowska
RFID creates unprecedented possibilities for supply chains integration. It allows tracking the dispatch and obtaining information on what is happening to it in real-time. In effect it provides possibilities to eliminate many mistakes connected with e.g. wrong address or theft, considerably reduce the level of stock in the chain, control movements of marked vehicles or manage the labour time.
5. Marketing and Sociological Approach
A customer-driven chain presents values which are totally different from the technological and logistical. It is focused on a customer and his needs. The so-called marketing and sociological approach is reflected in this concept. It refers to the long-existing in academic circles analysis of a network of social relations14 and to the latest marketing fad, i.e. the customer-centered approach. Intense humanistic aspect is also present in this concept. Supply chains are perceived as living organisms created by the people and for the people. Therefore understanding of principles guiding customer organisation, its culture, has become crucial. Technology, distribution centers or means of transportation are an important ‘hard’ element of this living structure. However, they are not its essence. “Let us stop thinking that supply chains consist of IT system infrastructure and technology as fifty-fifty proportion. Let us start thinking that a perfect proportion is more like 45/45/10 – human behaviour, systems technology and asset infrastructure15.
Corporate culture is becoming one of the most important behavior and agility shaping elements of supply chains. A supply chain should be adaptable to customer behaviour, which is determined by domineering corporate culture. If the customer’s corporate culture is driven by innovativeness and creativeness, he will expect a similar behavior on the part of cooperating firms. Therefore, a quickly reacting innovative supply chain is appropriate for relations with such a customer16.
A solution which actively supports the process of recognition of probable areas of value increase for the customer is the concept and systems of Customer Relationship Management (CRM). It is defined as a complex business strategy conducted by whole organisation and designed in order to optimize profits and revenues as well as customer satisfaction and attaining these goals through creating a firm involving isolated groups of customers, promoting corporate culture, increasing customer-satisfaction and integration of all processes between customers
14 B. Stokalski, Adaptive enterprise toolbox: next practices for the Knowledge – Based Economy,B. Stokalski, Adaptive enterprise toolbox: next practices for the Knowledge – Based Economy, Business – IT strategies, Vol. 8, No. 10, Cutter Consortium 2005, p. 11.
15 J.Gattorna,Living supply chains,Living supply chains, op. cit., p. 5.16 J.Gattorna,Living supply chains,Living supply chains, op. cit.

Directions of Development of Supply Chains �3
and suppliers17. CRM is a strategy which allows survival of firms willing to invest in future relations with customers. Using this strategy, firms are able to promptly react to their client’s needs, meet them and give up too costly activities. CRM is based on ‘one-to-one’ marketing, which is the opposite of mass marketing. ‘One-to-one’ marketing is expected to define and divide customers on account of their value for the company and choosing the most appropriate strategy for this particular group of customers. It is supposed to result in increasing their loyalty, maximizing profits and minimizing costs, in other words in optimization of financial results for the given relation. Using CRM in a broad context of supply chain creates unprecedented opportunities. It provides a possibility to understand the final consumer behavior and subsequent adapting of the whole supply chain reaction.
Although CRM primarily means strategy, the role of technology in this kind of management is so important that “ever so often CRM is understood as a number of integrated applications servicing all distribution channels (both traditional, such as e.g. a network of sales representatives, and modern, e.g. call centers, internet shopping, e-mails, etc.) whose one common feature includes a unified data base concerning customers, products and services. Close integration with other applications where information is stored is a very important element of such concept of CRM”18.
The Yankee group analysts’ research carried on a sample of 400 IT decision-makers in USA showed that 34% of IT budgets will go to applications integrating CRM and SCM. The leaders in sales of these applications are IBM, Oracle and Microsoft, mainly due to their investments in data base technologies19.
To answer the question about the reasons of such an interest in this issue, we may consider the following concept of division of advantages arising from CRM/SCM system integration.
Advantages related to SCM and CRM integration can be observed on the following levels: operational, information, cost-related and strategic20.
• Operational levelApplication of integrated CRM/SCM system allows quick relocation of
fluctuations in a demand chain and changes in market conditions, noticeable in
17 Critical Steps to Successful Customer Relationship Management, Gartner Group 2000, p. 2.Critical Steps to Successful Customer Relationship Management, Gartner Group 2000, p. 2.18M. Warwas, �RM – o co tu chodzi?, „Modern Marketing”, styczeń 2000, p. 34.M.Warwas,�RM–o co tu chodzi?, „ModernMarketing”, styczeń2000, p. 34.19 D. Myron, A New report recognizes the merger of CRM and SCM,D. Myron, A New report recognizes the merger of CRM and SCM, www.destinationcrm.com, February
2004.20 A. Laskowska-Rutkowska, Jak �RM może zwiększyć efektywność łańcucha dostaw, „GospodarkaA. Laskowska-Rutkowska, Jak �RM może zwiększyć efektywność łańcucha dostaw, „GospodarkaGospodarka Materiałowa&Logistyka”, styczeń2006, p. 23.

�4 Aleksandra Laskowska-Rutkowska
CRM system, to the reaction of supply chain. Such a solution allows for an efficient realization of customer expectations based on supply chain real possibilities21.
• Information levelAccording to JayMitchell, a director at�aterpillar, a buildingmachinery
producer engaged in creating CRM/SCM system, ‘Supply chain systems are islands of information oriented towards sales automation. They focus on sales forecasting supply chain and delivery dates’ management and also on redirecting calls to the right people”22. The integration of SCM and CRM systems is a bridge between islands of information. Caterpillar’s integrated system is to ensure the possibility of a customer configuring the required product on www.caterpillar and placing a customized order with a dealer. The producer, positioned on the other end of the chain, will have a possibility to look into the customer’s order and to adapt the inventory level to real needs.
• Cost-related levelThe Yankee Group specialists’ estimates show that initiatives integrating
CRM and SCM may ensure that American corporations will reduce their monthly cost of inventory keeping by some 117 to 293 billion USD. On the other hand the profits due to increased sales may reach between 83 to 166 billion USD.
• Strategic levelIntegration of CRM/SCM systems and opening a passage for information
flow between both ends of the chain will positively influence the possibilities of formulating a firm’s strategy. Knowing customer groups, frequency and value of their purchases, firms may adapt the time of order placement and the inventory level to customers’ behavior. It will result in savings on the inventory level and an increased customer satisfaction. Firms may also select a group of ‘perfect customers’ and offer them strategic partnership without the risk of misplaced investments in redesigning processes.
CRM and SCM integration creates a possibility to establish a knowledge-driven organisation which is based on both ends of the supply chain.
21 Demand chain meets the supply chain through business process integration between CRM andDemand chain meets the supply chain through business process integration between CRM and SCM applications www.pressreleasenetwork.
22 T. Weideman, CRM and SCM: Linking islands of information, Supply Chain e-Business, DecemberT. Weideman, CRM and SCM: Linking islands of information, Supply Chain e-Business, December 2001.

Directions of Development of Supply Chains �5
6. Time-based and Operational Approach
The time-based and operational approach to supply chain management relates to the time-based competitiveness strategy, which was often used by market leaders in the 90ies. The characteristic feature of this orientation is underlining its operational dimension ignoring its cultural and sociological aspect.
As early as at the beginning of the 90ies the importance of time in supply chains was appreciated. At the time, however, researchers focused on its traditional aspect. Mainly time of meeting the order and time of launching a new product were taken into account. The research conducted by The Economist Intelligence Unit and covering a group of 500 European companies showed that some 70% of the questioned considered delivery times reduction as a priority for the 90ies23. The research participants who came from the USA and Canada when asked about the most important goals of supply chains redesigning, mentioned three, i.e. more reliable delivery times, shorter delivery times and shorter times of reacting to market changes24.
At the beginning of the 21st century the static approach, meaning shortening delivery times, was substituted by a more dynamic perception of “time” reality.
Stress has been placed on chain’s ability to fast reaction to changes in demand and supply and to efficient elimination of outside disturbances (agile delivery chains). The supply chain should also adapt to structural market changes, in other words have an ability to immediately adapt to structural changes concerning, among others, main supply markets25 and restructure the whole chain as necessary. It is about its ability to quickly react on a strategic level. The Lucent Company supply chain displayed this characteristic in the second part of the 90ies. The reaction to shifting main purchasing markets from the USA to Asia was Lucent’s building factories to produce digital switches in Taiwan and China26.
Strategic ability to quick reaction is created at the level of building a supply chain.
Zara is a company into whose supply chain structure agility of reactionsis woven. Such processes as design, production, deliveries, distribution and information flows were prepared with the view of the firm’s operational and strategic ability to react fast27.
23 G. Holmes, Supply chain management. Europe’s new competitive battleground, The EconomistG. Holmes, Supply chain management. Europe’s new competitive battleground, The Economist Intelligence Unit, London 2005, p. 5.
24 Op. cit., p. 25.25 H. Lee, Sekret najbardziej efektywnych łańcuchów dostaw...,H.Lee,Sekretnajbardziej efektywnych łańcuchówdostaw...,op. cit., p. 93.26 H. Lee, The triple – A supply chain, Harvard Business Review, October 2004, p. 2, 5.H. Lee, The triple – A supply chain, Harvard Business Review, October 2004, p. 2, 5.27 Based on: K. Ferdows, M. Lewis, J. Machuca, Umiejętność szybkiego reagowania, „Harvard BusinessBasedon:K.Ferdows,M.Lewis,J.Machuca,Umiejętnośćszybkiegoreagowania,„HarvardBusinessReviewPolska”,listopad2005,pp.116–117orazP.Ghemwat,J.L.Nueno,Zara:Fastfashion,HarvardBusiness School case study, Harvard Business School Publishing, Boston, MA, April 2003, p. 2 and 9–11.
�6 Aleksandra Laskowska-Rutkowska
The speed of reaction on the design level results from direct designers’ communication with sellers and production technologists. Sellers contact designers on the phone and via PDA (personal digital assistance) palmtops informing their clients about present trends and customer expectations. Solutions concerning the designs are simultaneously consulted with production technologists who are located, just asthedesigners,inZara’sdesigningandproductioncentreinLa�orunainSpain.
Production is an important element of supply chain architecture. Production orders are divided between sub-suppliers from Europe, North Africa or Asia and own production companies. More advanced products are made by own means. Agility of production system also results from retaining 50% of production capacity atZaraproductioncentre.Thisproductioncapacity ismadeavailable incaseofincreased demand or launching new collections.
ThelogisticsystemofZara’ssupplychainoperatesaccordingtotheJust-In-Time system. Shop managers all over the world twice a week place orders on fixed days and until a fixed hour. The times are strictly obeyed. The central warehouse in La Coruna makes up the dispatch during the night. Part of the dispatch is sent in racks so that they may directly reach the shop. The delivery to shops in Europe takes 24 hours, to the USA 48 hours and to Japan 72 hours. �omplying withthe delivery schedule eliminates uncertainty related to delivery execution time.
A completely different model of fast reacting supply chain can be observed in Daimler-Benz, a company delivering smart cars. This model is based on outsourcing and close cooperation with thirteen key suppliers. The cars are assembled frommodules delivered by sub-suppliers who operate in Just-In-Time- system.Production orders are dealt with according to the market demand. Location of suppliers’ production plants, close to smart assembly lines in Hambach, ensures a short delivery time and enables communication between cooperating parties. When the assembly plant was launched in 1998, the assembly process took seven and a half hours, which was by two and a half hours better than the results achieved by branch leaders28.
7. Bibliography
1. Butner K., Buckley S., Sense-and-respond supply chains: enabling breakthrough strategy, IBM Business Consulting Services white paper, August 2004.
2. Christopher M., Logistics and supply chain management. Creating value-adding networks, FTS Prentice Hall, London 2005.
28 M. Christopher, Logistics and supply chain management. Creating value-adding networks, FTSM. Christopher, Logistics and supply chain management. Creating value-adding networks, FTS Prentice Hall, London 2005, p. 185.

Directions of Development of Supply Chains �7
3. Christopher M., Logistics and supply chain management, Creating value-adding networks, Pearson Education Limited, London 2005.
4. Critical Steps to Successful Customer Relationship Management, Gartner Group 2000.
5. Demystifying RFID in the Supply Chain; An overview of the promise and pitfalls, 2005, United Parcel Service of America, Inc.
6.FerdowsK.,LewisM.,MachucaJ.,Umiejętnośćszybkiegoreagowania,HarvardBusiness Review Polska, listopad 2005.
7.FisherM.,Whatistherightsupplychainforyourproduct?,„HarvardBusinessReview”, March–April 1997.
8. Follow the leaders. Scoring high on the supply chain maturity model, IBM Institute for Business Value 2005.
9.GatesB.,Biznes szybki j�kmyśl,Prószyński i S-ka,Warszawa1999.10.GattornaJ.,Living supply chains,PrenticeHall,London2006.11.Ghemwat P., Nueno J. L., Zara: Fast fashion, Harvard Business School case
study, Harvard Business School Publishing, Boston, MA, April 2003. 12. Handfield R., Nichols E., Introduction to supply chain management, Prentice Hall,UpperSaddleRiver,NewJersey1999.
13. Holmes G., Supply chain management. Europe’s new competitive battleground, The Economist Intelligence Unit, London 2005.
14. How Many supply chains do you need? Matching supply chain strategies to products and customers, A. T. Kearney 2004.
15. Insight to Impact. Results of the Fourth Quinquennial European Logistics Study, European Logistics Association A. T. Kearney, Brussels 1999.
16.Laskowska A., Konkurowanie czasem – strategiczna broń przedsiębiorstwa,Difin, Warszawa 2001.
17.Laskowska-Rutkowska A., Jak �RM może zwiększyć efektywność łańcuchadostaw, „GospodarkaMateriałowa&Logistyka”, styczeń2006.
18.LeeH.,Thetriple–Asupplychain,„HarvardBusinessReview”,October2004.19.LeeH.,Sekretnajbardziejefektywnychłańcuchówdostaw,„HarvardBusiness
Review Polska”, February 2005. 20. Myron D., A New report recognizes the merger of CRM and SCM, www.
destinationcrm.com, February 2004.21.RutkowskiK.,Zintegrowanyłańcuchdostaw,inaworkentitledZintegrowanyłańcuchdostaw.Doświadczenia globalne i polskie, pod red.K.Rutkowskiego,SGH, Warszawa 1999.
22. Srivastava B., Radio frequency ID technology: The next revolution in SCM, “Business Horizons”, 47/6, November-December 2004.
23. Stokalski B., Adaptive enterprise toolbox: next practices for the Knowledge – Based Economy, Business – IT strategies, Vol. 8, No. 10, Cutter Consortium 2005.

�� Aleksandra Laskowska-Rutkowska
24. Vollmann T., Cordon C. and Raabe H., Supply chain management. Conference materials on “A new procurement paradigm”, IESE, Barcelona, March 30–31, 1995.
25.WarwasM.,�RM– o co tu chodzi?, „ModernMarketing”, styczeń2000. 26. Weideman T., CRM and SCM: Linking islands of information, Supply Chain
e-Business, December 2001.

Krzysztof BorowskiWarsaw School of Economics
Applied Forms of Structured Products on the Retail Market of Structured Products
1. Introduction
The offers of structured products for individual customers made by retail banks1 face barriers resulting from the bank investment strategies. Whether or not the placement of the issue of newly structured products on the retail market is successful depends on grasping the differences between the corporate customer market and the offer earmarked for the clients of retail banking or private banking. The major difference is the way the structured product reaches the final recipient (wrapper)2. It is essential to offer a flexible product, at the same time well adjusted to the local market. The very formula of the structured product return is only a certain superstructure in the case of retail customers. The situation is the exact opposite on the market of corporate investors.
The aim of this paper is to synthetically present the ways of creating structured products by retail banks and the role of the investment bank in the process of creation of such products as well as to indicate the investment bank departments involved in the process.
2. Forms of Structured Products
The most common forms of structured products are: • structured deposits – deposits with a built-in derivative offered to
clients by banks on the basis of Banking Law3. Offering their clients a structured deposit, the retail bank purchases on the market a derivative instrument (option or swap) not the whole, wrapped product as in the case of a structured bond. Moreover, the bank does not charge any commission for opening a deposit, which usually occurs in the case of structured bonds.
1 In the paper phrase “retail bank” is interchangeably used with “deposit-credit bank” as different from investment bank. The assumption of a very clear division is made between deposit-credit and investment banking.
2 In the English language literature the final investor is called wrapper.3 Law of 29 August 1997 – Banking Law (Dz.U. of 2002 No. 72, item 665, with later amendments).

100 Krzysztof Borowski
Structured deposits, besides earning full return of the capital at maturity, usually guarantee minimum profitability, and the return calculation formula is extremely simple. Compared to bonds these instruments usually have lower participation4 in the change of the value of base asset, which is reflected in lower potential return, however they more often offer guaranteed minimum interest. Structured deposits cannot be the subject of exchange trading,
• structured bonds – issued on the basis of Bond Law5 combine two financial instruments: fixed interest bonds and options of the same expiration dates. The structure of such an instrument may be seen in the following example. Its construction combines a Polish discounted bond (in other words a zero-coupon bond) and gold call option listed on the American Stock Exchange. The combination of these two elements ensures investment portfolio diversification – on the one hand on two geographically different markets and on the other – in different categories of the financial market: capital and stock,
• other debt instruments, • structured Fund Units/Certificates – certificates, warrants or index
units, whose gains depend directly on asset basket value, e.g. stock or financial exchange indices. They may guarantee the return of all or part of the invested capital6 or not include such a guarantee at all. The guarantee mechanism being used, the changes in the certificate value reflect the changes in the value of the underlying instruments. From the theoretical perspective such certificates are options of zero price exercise. The examples of such products are certificates quoted on numerous world exchanges based on securities exchange indices. They are often quanto products7, i.e.
4 Participation at level k% means that with the change in underlying instruments price by a%, the
value of the structured product will rise by %%
% %.b
k a100
$=
5 BondLawof 29June1995 textDz.U. of 2001No. 120, item1300with later amendments.6 Hence the name of this type of fund: capital protection fund.7 Classic quanto instrument is a variation of derivative instrument in which the underlying instruments
is denominated in one currency and the instrument itself is denominated in the other. The interest on such instruments is usually fixed. The most frequent variations quanto instruments are:
• quanto futures contract – futures contracts on one of the European Exchange indexes, the contract itself being denominated in USD,
• quanto option in which the difference between the fixed price of exercise and current underlying instruments price is paid in a different currency than the currency in which the underlying instruments in denominated,
• quanto swaps in which the value of the swap is denominated in one currency, and variable interest is calculated on the basis of interest rate of another currency. Interest is paid in the currency in which it is calculated.
Following website: http://en.wikipedia.org/wiki/Quanto of 18January2007.
Applied Forms of Structured Products on the Retail Market... 101
products with no currency risk on the part of the investor, e.g. the certificate quoted on the London Stock Exchange based on the Nikkei 225 index. In Poland a lot of products of this sort are offered by Raiffeisen Centrobank. Some of them are based on the stock quotations of Polish companies,
• insurance policies called also structured policies – issued by insurance companies on the basis on the Insurance Law8. Customers’ gains result from investments carried out on various markets. The insurance company guarantees a minimum rate of return in the case of an unfavourable situation on the underlying instrument market,
• OTC Transactions – transactions on the unregulated market. Unregulated is often perceived as synonym of no barriers and restrictions in the creation of new investment instruments. Understood in a different way, they also appear in the literature as transactions on the market of shares, bonds and derivative instruments (options and swaps) that are most often not exchange-listed.
On the market of individual customers structured deposits are most common, to be followed by structured bonds and structured fund units. Recently the market share of structured policies has been on the rise.
3. The Ways to Create Structured Products on the Financial Markets
It is worth mentioning that the construction of a structured bond (possibly another debt instrument too) and that of a structured deposit are similar. From the perspective of a deposit-credit bank it consists in issuing a bond, which for each 100 zlotys paid by the investor will bring the payment of 100 zlotys at maturity of the structured instrument plus bonus calculated on the basis of the rate of investment return earned by the given underlying instrument. At the moment of the issue of a structured product a deposit-credit bank purchases the underlying instrument securing in this way ssuitable payment resulting from the terms of the bond issue. As a rule this instrument has a form of an OTC transaction – i.e. a retail bank purchases the given underlying instrument from an investment bank on the OTC market. Occasionally a deposit-credit bank will buy an underlying instrument directly on the financial market. The process is presented in Fig. 1. Investment banks very seldom decide to offer structured deposits to their customers, however, they very often offer them structured bonds issued by the same or another investment bank.
8 Insurance Law of 22 May 2003, Dz.U. of 2003 No. 124, item 1151 with later amendments.

102 Krzysztof Borowski
The creation of a structured product is, in spite of appearances, a complex process requiring the involvement of numerous areas of activity of an investment bank – see Table 1.
Table 1. Investment bank departments involved in the process of creation of a structured product
ActivityArea of activity in an investment bank and description
of activity
Concept
Financial Engineering Department creating conceptsof new products, among others the so called “content”of the product i.e. a new form of payment, making useof the new underlying instrument
Wrapping Primary Market Department (or Special). Organisationof the issue of a given form of product
SalesNetwork of branches. Selling a definite product. In the caseof sales it makes use of retail bank networks co-operating withthe investment bank in the creation of structured products
SupportInvestment bank support departments – Legal Department,Risk Calculation Department, Transaction Settlement(so called Middle Office)
After saleInvestor Relations Department. Publication of brochures,additional materials on the performance of the underlyinginstrument, updating the website
Concludingtransaction
Dealing room. Direct access to departments carryingout transactions of the bank on the financial markets
Source: author’s own material.
Figure 1. Example of construction of a structured bond or deposit
PLN 100 PLN 30
PLN 100 + bonus relatedto the rate of return ofunderlying instruments
OTCunderlyinginstrument
Investor BankInvestment
bank
Bank means a deposit-credit bank.Source: author’s own material.

Applied Forms of Structured Products on the Retail Market... 103
Another way to create structured products is to make use of the third party’s bonds by a deposit-credit bank. The issuer of bonds may be another bank or a non-financial entity. In this case the deposit-credit bank or the third party, the issuer9 of bonds (Fig. 2), allocates the means gained from the bond issue to finance its activity. These means are generally used to finance the bank credit actions of or to make certain investments by the issuer. An investment bank very often serves, in this scheme, the purpose of creation of structured products to secure the transaction for the issuer of structured bonds. This fact results in the following benefits for both parties: • investors can diversify the credit risk, • issuer’s (investment bank) credit risk is often lower than that of a deposit-
credit bank. Investment banks or renowned issuers have in most cases a higher rating,
• a retail bank does take the legal liability arising in the case of the standard construction of a structured deposit. In a lot of cases the terms of a structured deposit contract vary a little from the transactions on the OTC market carried out by a deposit-credit bank together with an investment bank,
• there are accounting benefits for a deposit-credit bank (accounting of OTC transactions according to the International Accounting Standards may prove troublesome for the bank).
Figure 2. Making use of the third party as issuer in the construction of a stru-ctured bond (deposit)
Investor
Bank
Issuer
Investment Bank
Bonds
PLN 100 + bouns related to the rate of return of underlying instruments
Bonds
PLN 100
PLN 100
100 PLN + bonus related to the rate of return of the underlying instrument
Source: author’s own material.
9 In the majority of cases the issuer is a bank too.
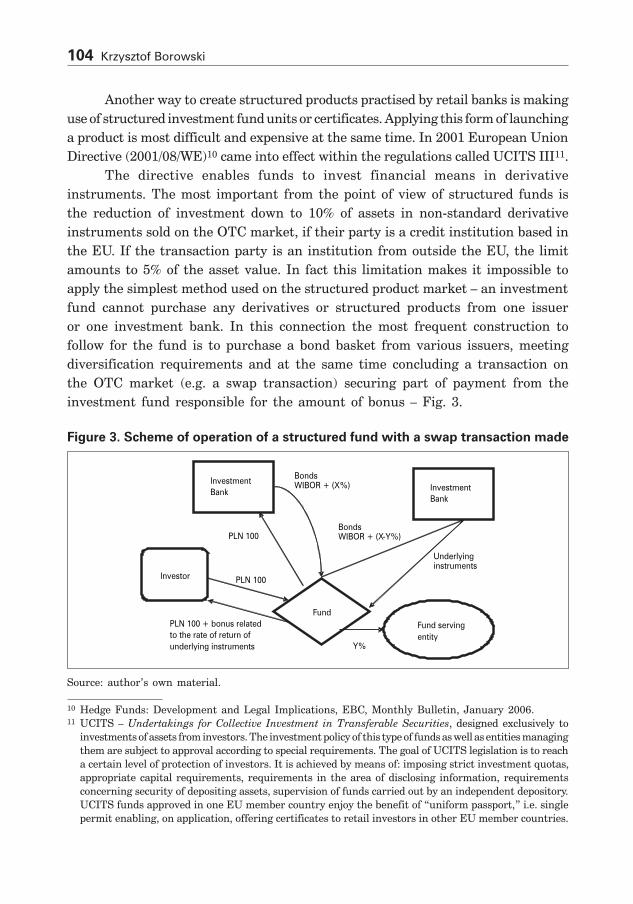
104 Krzysztof Borowski
Another way to create structured products practised by retail banks is making use of structured investment fund units or certificates. Applying this form of launching a product is most difficult and expensive at the same time. In 2001 European Union Directive (2001/08/WE)10 came into effect within the regulations called UCITS III11.
The directive enables funds to invest financial means in derivative instruments. The most important from the point of view of structured funds is the reduction of investment down to 10% of assets in non-standard derivative instruments sold on the OTC market, if their party is a credit institution based in the EU. If the transaction party is an institution from outside the EU, the limit amounts to 5% of the asset value. In fact this limitation makes it impossible to apply the simplest method used on the structured product market – an investment fund cannot purchase any derivatives or structured products from one issuer or one investment bank. In this connection the most frequent construction to follow for the fund is to purchase a bond basket from various issuers, meeting diversification requirements and at the same time concluding a transaction on the OTC market (e.g. a swap transaction) securing part of payment from the investment fund responsible for the amount of bonus – Fig. 3.
Figure 3. Scheme of operation of a structured fund with a swap transaction made
Investor
Investment Bank
Fund
Investment Bank
Underlying instruments
PLN 100
PLN 100
PLN 100 + bonus related to the rate of return of underlying instruments
BondsWIBOR + (X%)
BondsWIBOR + (X-Y%)
Fund serving entity
Y%
Source: author’s own material.
10 HedgeFunds:DevelopmentandLegal Implications,EB�,MonthlyBulletin, January2006.11 UCITS – Undertakings for Collective Investment in Transferable Securities, designed exclusively to
investments of assets from investors. The investment policy of this type of funds as well as entities managing them are subject to approval according to special requirements. The goal of UCITS legislation is to reach a certain level of protection of investors. It is achieved by means of: imposing strict investment quotas, appropriate capital requirements, requirements in the area of disclosing information, requirements concerning security of depositing assets, supervision of funds carried out by an independent depository. UCITS funds approved in one EU member country enjoy the benefit of “uniform passport,” i.e. single permit enabling, on application, offering certificates to retail investors in other EU member countries.

Applied Forms of Structured Products on the Retail Market... 105
In the great majority, structured funds are capital guaranteed funds. The protection of capital may result from the payment of nominal bond value at maturity. The task of the investment bank is to find the bond basket best adjusted with payment characteristics to the date of redemption of investment certificates by the fund. When constructing the portfolio of a structure fund the managers must consider the restrictions imposed by Directive 2001/08/WE connected with the fund investment risk.
In December 2006 the financial means managed by the Polish structured funds amounted to about PLN 1.9 bn, alternative funds – PLN 1.9 bn, real estate funds – PLN 1.1 bn and securitisation funds – PLN 470 bn12.
The structured fund market is much better developed in Hungary, where the share of means collected by structured funds in the total value of means of all funds amounts to about 10%. There is a similar situation on the Czech market. In both these countries the offer of structured funds is comprehensive – they are most often hybrid funds investing on the markets of shares, raw materials, debt instruments, real estate and currencies13.
Structured funds becoming increasingly common are those with the so called CPPI (Constant Proportion Portfolio Insurance) mechanism also referred to as Portfolio Protection Strategy. The strategy consists in managing share and debt securities so that, at the end of the settlement period, which for the fund lasts n years, the value of the certificate would not be lower than the value the certificate has at the beginning of the settlement period. In other words the assets of the fund should be managed in such a way as not to make a loss in relation to the beginning of the settlement period. The other goal is to maximise gains possible to achieve thanks to the investment strategy applied14.
The point of gravity of the CPPI strategy has been laid in appropriate balancing of the stocks share in the fund portfolio. The proportion of shares in the portfolio every day must be high enough for the possible loss in the portfolio
12 Following website: http://www.analizy.pl/analizy_online/ of 16January2007.13 Following website: http://www.analizy.pl/analizy_online/ of 16January2007.14 Let us consider the following example. An investor purchased an investment portfolio for USD 100
with the guarantee of payment of USD 90 at the of the investment period. In the case when the guaranteed sum is lower than the amount at which the portfolio was purchased, the guaranteed sum is described as the current value of the amount paid with the rate return in the investment period. If the multiplier (financial leverage multiplier indicated in the fund information materials) of this sort of investment is 5, then on the first day the manager allocates (5 * ($100–$90)) = $50 in the aggressive part of the portfolio. The other USD 50 is to be invested on the market of the so called risk free trust securities – defensive part of the portfolio. After the time determined by the regulations, there will be a change of the value of assets in aggressive and defensive parts, which will lead to the correction of shares in particular parts of the portfolio. More information on the subject may be found on website: http://en.wikipedia.org/wiki/Constant_proportion_portfolio_insurance

106 Krzysztof Borowski
in the settlement period not to be able to level off the gains worked out in the debt part of the portfolio. Thanks to this, or actually to the gains earned by the debt part of the portfolio, the value of the investment certificate should reach the value not lower than at the beginning. This is the minimum which an investor may achieve in the period of decline on the share market thanks to the application of the discussed investment strategy. During the boom an investor may achieve the gain whose size depends on dynamics of growth on the share market. Because maximum involvement of the fund on the share market may amount to X%, the gain worked out by the fund in the settlement period may be compared to the benchmark consisting of X per cent of (WIG20) shares and (100 – X) per cent of bond index (with redemption date of n years).
The funds applying the CPPI strategy: • fund PKO/CS Bezpieczna Lokata I – FIZ15. The fund investment
portfolio was divided into the debt and share part whose composition will be reflected by largest companies WIG 20 index. The share of means between both parts of the portfolio is managed actively in such a way that as to minimise the risk that at the end of three yearly periods of capital securitisation, the value of certificate will fall below 100% of their value at the beginning of the period. The first period of capital protection began after the registration of the fund and will last till autumn 2009,
• fund BPH FIZ Bezpieczna Inwestycja 4 – for which a particularly important goal is the protection of capital at the assumed level as well as maximisation of gains in market condition favourable for the fund. It is worth noting that during the settlement period the fund may change the level of capital protection, however only on the condition that it will set it at the level higher than the previous one. This solution has already been appliedbyBPHFIZSecureInvestment1and2,forwhichthemanagersguarantee respectively 15 and 5% rate of return in relation to the first evaluations of investment certificates of these funds,
• Pioneer Zabezpieczony Rynku Polskiego SFIO16 – the fund can invest up to 100% of assets among others in debt securities issued by the State Treasury. Up to 50% of the fund assets, especially in the period of good economic situation on the capital market, may be allocated in shares of large companies listed on the Warsaw Stock Exchange (within WIG 20 index) or in futures contracts for WIG 20 index. Thanks to this construction the fund tries to keep the maximum security of the investment, giving
15 Following website: http://www.pkotfi.pl/SAM/index.php?id=f_blok of 18January2007.16 Following website: http://www.pioneer.com.pl/pioneer/arts.pzrpsfio of 18January2007.

Applied Forms of Structured Products on the Retail Market... 107
at the same time the opportunity to participate in gains on the Polish stock market. The fund aims to protect the value of the participation unit at the end of the settlement period at the level of 100% of its value at the beginning of the period. This means that the fund will do its best to keep the value of the participation unit on the last day of the settlement period at the level not lower than that on the first day of this period.
3. To Sum up
Choosing the definite form of creation of a structured product is in a number of cases a decisive factor for the successful sales of structured products by retail bank to individual customers. The issue of structured deposits seems to be the simplest sales form in the network of a deposit – credit bank. On the other hand, however, it is the most risky form from the perspective of a retail bank. The bank is liable for the whole legal risk, i.e. the discrepancy between the content of the hedging instrument on the OTC market with the content of the deposit agreement. This discrepancy is usually called base risk in the literature, analogous to the difference between the price of an underlying instrument and the price of a futures contract.
Despite all the deficiencies of the form using structured funds, it appears that it is the method that is most favourable for the retail market. On the other hand the most important advantage of structured bonds is their quotation on the stock exchange, which is an additional guarantee of security for the investors and at the same time it reduces the issue costs.
The choice of the right form of the product is a prerequisite, not sufficient however to achieve success on the market of retail structured products. There is a risk of making a mistake of choosing the wrong form of product. The choice of a form results in further decisions concerning the given product. The biggest challenge for the issuers of structured products is the provision of full servicing of the sold products. It is connected with engagement of significant financial means. Complex customer handling on the retail market of structured products provides investors with access to full range of solutions proposed by the investment bank, on the other hand it does not expose the retail bank to excessive risk.
4. Bibliography
1.BanksE.,SyntheticandStructuredAssets,JohnWiley&SonsLTD.,�hichester2006.
2.Fabozzi F., Handbook of Structured Financial Products, Frank J. FabozziAssociates, New Hope 1998.

10� Krzysztof Borowski
3.KnopP.,Structuredproducts, JohnWiley&SonsLTD.,�hichester 2002. 4.Funduszehedgingowe:rozwójiimplikacjeprawne,(HedgeFunds:Developmentand Legal Implications), Biuletyn Miesięczny EB� (EB� Monthly Bulletin),January2006.
Regulations: 1. European Union Directive (2001/08/WE). 2. Law of 29 August1997 – Banking Law, Dz.U. of 2002 No. 72, item 665, with
later amendments. 3.Bond Law of 29 June 1995, Dz.U. of 2001 No. 120, item 1300 with later
amendments. 4. Insurance Law of 22 May 2003, Dz.U. of 2003 No. 124, item 1151 with later
amendments.
Websites: 1.http://www.pkotfi.pl/SAM/index.php?id=f_blokof 18January2007. 2.http://www.pioneer.com.pl/pioneer/arts.pzrpsfio of 18January2007. 3.http://en.wikipedia.org/wiki/Quanto of 18January012007. 4. http://en.wikipedia.org/wiki/Constant_proportion_portfolio_insurance of 17January2007.
5.http://www.analizy.pl/analizy_online/ of 16January2007.

Anna Miarecka, Patrycja Ptaszek-StrączyńskaWarsaw School of Economics
Working Capital Management in IT Companies. Selected Aspects
1. Introduction
Working capital management deals with working assets and the sources to finance them. The corporate working capital policy concerns two questions: setting a suitable level and structure of working assets and the selection of financing sources. The mutual relations between the structure of assets and the structure of financing sources result mainly from the specific nature of the company activity, its size and the kind of industry it works in.
The research object of the present paper is the analysis of working capital management issues in the IT industry in 1995–2005. The limited editorial framework enables only the exposition of the most essential issues concerning the undertaken subject. In particular the analysis of the structure of net working capital and financing sources of IT companies in reference to the companies quoted on the Warsaw Stock Exchange. In the research period on the Polish market, but also on the world markets high dynamics of this industry resulted from the rising needs of business entities and individual consumers for products and services offered by IT companies. The dynamics of the IT market value in Poland in 1995−2005 was at the level of 413%. Taking into consideration thestructure of the IT market, there was high dynamics of services (129%), and lower dynamics of sales of hardware (90%) and software (94%)1. High dynamics of investment in IT in the US contributed to the management efficiency growth as well as lengthening of the period of good economic situation2.
2. Goals of Corporate Working Asset Management
In the specialist literature the structure of assets is an essential factor of developing corporate capital structure. The components of fixed assets constitute bank loan collateral, and their negotiability rate determines the opportunity
1 According toTELEINFOreports in1997−2005.2 According to A. Greenspan in Computerworld TOP 200 Report. Polish Information and
Telecommunication Marketsin 1998 Iwona D. Bartczak, Koniunktura gospodarcza w Polsce.

110 Anna Miarecka, Patrycja Ptaszek-Strączyńska
of loan acquisition. Assets of high liquidity are the forms of collateral easily acceptable by banks. The research carried out in Great Britain in 1991−1997proved that companies with higher tangibility showed higher share of debt in the structure of asset financing3.
The relation between the structure of corporate assets and capital is, besides the cost of capital and the mechanism of financial leverage, an important issue as it is the criterion of selection of the appropriate capital structure4. On the basis of interdependencies of the elements of corporate assets and their financing sources, in practice the so called “golden” rules of development of capital structure have been worked out. Following them is aimed at easier maintenance of corporate financial balance and optimal determination of capital structure5. It is to be underlined that the application of the financing rules enables the managers to make the diagnosis of the situation of the company6.
The rules of development of the structure of corporate assets and capital are: • golden financing rule, according to which capital borrowed by a company
should be balanced with its own capital7, • golden balance rule, which requires adjustment of the way of financing
to the time of capital use as well as the kind of the financed asset8.If the above mentioned rules are followed, the sense of financial security
is raised and, with proper relations, the corporate financial balance is ensured. Thus, it contributes to the growth in the security and financial credibility of the economic entity. In the long term it also means the maintenance of stability and
3 Research results showed positive dependence between the long term debt rate and asset structure factorandnegative in the caseof short termdebt.See:A.A.Bevan,J.Danbolt,Dynamics in theDeterminants of Capital Structure in the UK, Working Paper 2000/9, p. 17. In turn the research carried out in the US in 2000 proved that the correlation rate was positive but insignificant statistically. See: S. Banerjee, A. Hesfmati, C. Wihlborg, The Dynamics of Capital Structure, SSE/EFI Working Paper Series in Economics and Finance No. 333, May 2000.
4 Z.Leszczyński,A.Skowronek-Mielczarek,Analizaekonomiczno-fiansowaspółki,PolskieWydawnictwoEkonomiczne, Warszawa 2004, p. 162.
5 �ompare:A.Bielawska,Złotareguła,„Finansista”,No.02/2001;T.Waśniewski,W.Skoczylas,Ocenasytuacji kapitałowo-majątkowej (układpoziomy), „Rachunkowość”,No. 6/1993, p. 206.
6 J.Stępniewski,Diagnostykaksięgowasytuacjifinansowejprzedsiębiorstwa,„ProblemyRachunkowości”,No. 4/2001.
7 Mutual relation of balancing external capital with own capital may amount to 1:1 or 2:1. See: R.Borowiecki, Zarządzanie kapitałem trwałym w przedsiębiorstwie, Akademia EkonomicznawKrakowie,WydawnictwoSecesja,Kraków1993, p. 35.
8 From a narrow (older) perspective, the golden balance rule requires that high risk fixed assets should be fully financed by own capital. A wider perspective of the rule assumes financing of fixed assetsandpartofworkingassetsbyfixedassetsofthecompany.See:A.Bielawska,Złota...,op. cit., p. 48.

Working Capital Management in IT Companies. Selected Aspects 111
financial flexibility of the company. In turn, not following the golden rules may be a factor leading to the company collapse9.
The right determination of the size of asset elements and the right determination of own and external capital play an important role in the rational use of the corporate capital resources. The degree of utilisation may be assessed on the basis of a lot of different criteria coming down to certain capital asset structure rates of various degree of detail10. The question of developing relations between the structure of assets and capital consists mainly in determining the right level of the net working capital. From the point of view of corporate strategy, net working capital management enables the maintenance of the desired corporate financial liquidity, optimisation of volume and structure of current assets from the point of view of minimisation of their maintenance costs as well as financing costs11.
The level of developing of net working capital is determined by working asset financing strategies, which may be: • conservative (cautious), • moderate (harmonious), • dynamic (aggressive).
Applying the conservative strategy, the company keeps the highest possible level of net working capital12. Financing all fixed assets and small part of working assets with fixed capital allows the company to maintain the financial balance in the long term and to reduce the financial risk. Surpluses of monetary means are characteristic of this strategy. High involvement of fixed capital has a negative impact on own capital return rate and financing cost incurred.
The moderate strategy assumes the maintenance of the level of net working capital lower than that in the conservative strategy. Within this strategy a compromise is searched between the financial risk and profit earned as a result of using cheaper sources of asset financing than long term ones – short term capital. Its positive effect is the desire to adjust the length of a loan period to the needs of financing the given element of working assets resulting from its life period13. The company applying the moderate strategy finds it possible to
9 Research carried out by G. Weinreicha in Germany in 1978 showed that the examined companies had negative net working capital 4 years before they went bankrupt. Research done in Poland concerning a group of companies listed on the Warsaw Stock Exchange confirmed these results. �ompare:A.Bielawska,Złota...,op. cit., p. 50.
10 Mainly profitability, liquidity and financing sources structure rates belong to them.11 �ompare: J. �zekaj, Z. Dresler, Zarządzanie..., op. cit., p. 118; W. Dębski, Theoretical..., op. cit.,
p. 238 and following.12 J. Ostaszewski, T. �icirko, Finase spółki akcyjnej, Difin, Warszawa 2005, p. 151.J.Ostaszewski,T.�icirko,Finase spółki akcyjnej,Difin,Warszawa2005, p. 151.13 Por. M. Sierpińska, D. Wędzki, Zarządzanie płynnością finansową w przedsiębiorstwie, WydawnictwoPor.M.Sierpińska,D.Wędzki,Zarządzaniepłynnościąfinansowąwprzedsiębiorstwie,Wydawnictwo
Naukowe PWN, Warszawa 1997, p. 108.
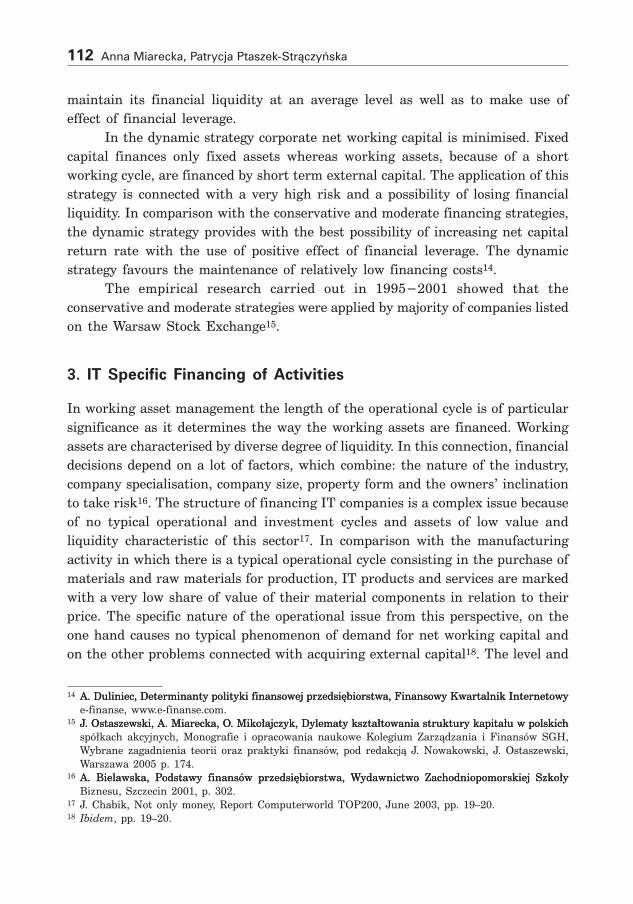
112 Anna Miarecka, Patrycja Ptaszek-Strączyńska
maintain its financial liquidity at an average level as well as to make use of effect of financial leverage.
In the dynamic strategy corporate net working capital is minimised. Fixed capital finances only fixed assets whereas working assets, because of a short working cycle, are financed by short term external capital. The application of this strategy is connected with a very high risk and a possibility of losing financial liquidity. In comparison with the conservative and moderate financing strategies, the dynamic strategy provides with the best possibility of increasing net capital return rate with the use of positive effect of financial leverage. The dynamic strategy favours the maintenance of relatively low financing costs14.
The empirical research carried out in 1995−2001 showed that theconservative and moderate strategies were applied by majority of companies listed on the Warsaw Stock Exchange15.
3. IT Specific Financing of Activities
In working asset management the length of the operational cycle is of particular significance as it determines the way the working assets are financed. Working assets are characterised by diverse degree of liquidity. In this connection, financial decisions depend on a lot of factors, which combine: the nature of the industry, company specialisation, company size, property form and the owners’ inclination to take risk16. The structure of financing IT companies is a complex issue because of no typical operational and investment cycles and assets of low value and liquidity characteristic of this sector17. In comparison with the manufacturing activity in which there is a typical operational cycle consisting in the purchase of materials and raw materials for production, IT products and services are marked with a very low share of value of their material components in relation to their price. The specific nature of the operational issue from this perspective, on the one hand causes no typical phenomenon of demand for net working capital and on the other problems connected with acquiring external capital18. The level and
14 A. Duliniec, Determinanty polityki finansowej przedsiębiorstwa, Finansowy Kwartalnik InternetowyA.Duliniec,Determinantypolitykifinansowejprzedsiębiorstwa,FinansowyKwartalnikInternetowye-finanse, www.e-finanse.com.
15 J. Ostaszewski, A. Miarecka, O. Mikołajczyk, Dylematy kształtowania struktury kapitału w polskichJ.Ostaszewski,A.Miarecka,O.Mikołajczyk,Dylematykształtowaniastrukturykapitałuwpolskichspółkach akcyjnych, Monografie i opracowania naukowe Kolegium Zarządzania i Finansów SGH,Wybrane zagadnienia teorii oraz praktyki finansów, pod redakcją J. Nowakowski, J. Ostaszewski,Warszawa 2005 p. 174.
16 A. Bielawska, Podstawy finansów przedsiębiorstwa, Wydawnictwo Zachodniopomorskiej SzkołyA. Bielawska, Podstawy finansów przedsiębiorstwa, Wydawnictwo Zachodniopomorskiej SzkołyBiznesu, Szczecin 2001, p. 302.
17 J.�habik,Not onlymoney,Report�omputerworldTOP200, June2003, pp. 19–20.18 Ibidem, pp. 19–20.

Working Capital Management in IT Companies. Selected Aspects 113
dynamics of net working capital of IT companies and service companies listed on the Warsaw Stock Exchange in 1995−2005 are presented in Table 119. On the basis of the data in Table 1 it can be observed that the level of net working capital of IT companies is positive and significantly higher than that of the whole service sector in the examined period.
Table 1. Level of net working capital (NWC) in IT and service companies listed on the Warsaw Stock Exchange in 1995−2005, in thousand zlotys (median)
Specification 1��5 1��6 1��7 1��� 1��� 2000 2001 2002 2003 2004 2005
NWCIT 6 800 1 618 10 440 14 530 17 461 4 896 10 326 4 854 6 542 13 636 16 389Services total 4 744 3 636 8 384 6 417 6 498 1 225 3 051 2 591 3 628 12 806 16 513
Dynamics of NWC changesIT – 24% 645% 139% 120% 28% 211% 47% 135% 208% 120%Services total – 77% 231% 77% 101% 19% 249% 85% 140% 353% 129%
The level of net working capital calculated from the property perspective according to the formula: fixed assets – own capital + reserves + long term liabilities.Source: own material.
Table 2. Structure of net working capital in the IT sector in 1��5–2005 (in %)
Specification 1��5 1��6 1��7 1��� 1��� 2000 2001 2002 2003 2004 2005
Own capital 66 65 61 71 66 61 62 62 64 59 60Reserves 0 0 0 0 0 0 0 0 1 2 1Long term liabilities 0 0 0 0 0 0 1 2 1 1 0
Fixed Assets –34 –34 –39 –29 –34 –39 –37 –36 –35 –37 –38NWC 100 100 100 100 100 100 100 100 100 100 100
Source: own material on the basis of balance data of the examined companies20.
The dynamics of changes of net working capital of IT companies is characterised by strong fluctuations. The reasons for this phenomenon may be found in the structure of net working capital of the examined entities, data presented in Table 2. The empirical research shows that in the structure of net working capital a significant share is taken by own capital originating from reinvested profits of the examined companies or means from stock issue. At the
19 The calculation was made on the basis of balance data of all IT companies and also service companies sector, which includes, besides IT, trade, telecommunications, media, services and others. The financial data of the examined entities were received from Notoria Serwis.
20 Fixed assets value is shown in the chart with minus.

114 Anna Miarecka, Patrycja Ptaszek-Strączyńska
same time a slight share of long term external financing can be observed, which causes that own capital was the major source of capital financing in the structure of fixed capital. In the research periodthe average share of own capital in the structure of IT companies was at the level of 66%.
The financial strategy assumed by the examined companies may be explained in three ways. First, high sales profitability of the IT companies in the examined period contributed to no interest on the part of IT companies in external capital because of financial stability security thanks to the reinvestment of high profits. The ownership policy of IT sector companies was aimed at support of investment activity rather than payment of high dividends. On the other hand stock companies on the public market favour financing investment through issue of shares which are the major source of own external financing21.
The level of own capitals of the examined entities corresponds with the business cycle of the Polish economy in the examined period measured by the GDP dynamics. However, specific lengthening of the business cycle in the IT industry is to be observed. On the one hand, in the Polish economy 1998 was a year of breakthrough, in which the Russian crisis had a significant impact on the decline in the Polish economic growth. On the other hand in the examined companies a decline did not take place – the recovery period was lengthened by ayear.Therisingshareofownfinancingcanbeseenin1995−1999,andfallingintheperiodofeconomicdecline(2000−2002),andagainrisingin2003-2005,therecovery period of the Polish economy. In the examined entities the rising share of net working capital (median) can be seen in 1995-1999, with 1999 showing the highest level in the whole examined period (compare data in Table 1).
Business cycles in the economy result in substantial changes in demand for products and services. Researches indicate that demand for services in the IT sector was rising in 1995-2000. Whereas in 2001 and 2002 for the first time in 12 years there was a significant decline in investment dynamics, which resulted from difficulties of the American economy and limited investment in telecommunications22.
The financing strategy assumed by the examined companies is determined by the structure of their assets which constitute potential bank loan collateral. In IT companies fixed assets account for a relatively low share in their asset structure. In 1995 the examined companies’ fixed assets amounted to 21% assets (median), in the following years respectively: 1996 – 24%, 1997 – 38%, 1998 – 28%, 1999 – 32%, 2000 – 33, 2001 – 32%, 2002 – 38%, 2003 – 36%, 2004 – 40% and 2005
21 J. Ickiewicz, Pozyskiwanie, koszt i struktura kapitału w przedsiębiorstwie, 2004, p. 29.J. Ickiewicz,Pozyskiwanie, koszt i strukturakapitałuwprzedsiębiorstwie, 2004, p. 29.2004, p. 29.22 ReportTELEINFO500,May2002,PawełA.Luksic, p. 47.

Working Capital Management in IT Companies. Selected Aspects 115
– 41%. Despite the noticeable rise in the share of fixed assets in total assets of the examined entities, their substantial part is intangible assets which are not to be accepted as collateral in acquisition of long term bank loans. It should be especially underlined that the structure of assets has a significant impact on the development of the structure of capital in the IT sector. Limited access to bank loans may threaten large investment financing, manifested in meeting capital requirements for firms participating in large IT tenders23. More difficult financing conditions of IT Polish firms in comparison with West European companies pose a threat for the competitive position on the EU market, where companies are financially supported by international financial institutions.
4. Evaluation of Financial Liquidity and Profitability of IT Companies in 1995−2005
The financing strategy assumed by IT companies has a significant impact on their financial liquidity. On the basis of data presented in Table 3, the current liquidity rate of the examined companies was changing amounting in 1999, 2001, 2003 and 2004 to the level of 1.8, and in 1997 and 2005 2,0 and 2,1 respectively. In the remaining years of the examined period the liquidity was in between 1.2 and 1.6. Comparing the current liquidity rates of IT companies with those in the service sector in 1995–2005, a much higher level of the former can be observed. It may indicate the phenomenon of over liquidity in the IT companies.
Table 3. Current and instantaneous liquidity rate in the service sector and IT listed on the Warsaw Stock Exchange in 1��5–2005, median
Currentliqudity
1��5 1��6 1��7 1��� 1��� 2000 2001 2002 2003 2004 2005
IT 1.5 1.2 2.0 1.6 1.8 1.3 1.8 1.5 1.8 1.8 2.1Servicestotal 1.5 1.4 1.5 1.4 1.4 1.2 1.2 1.2 1.3 1.5 1.8
Instantaneous liquidityIT 0.9 1.0 1.6 1.2 1.5 1.0 1.5 1.3 1.5 1.4 1.9Servicestotal 1.0 0.9 1.0 1.1 1.1 0.8 0.8 0.9 0.9 1.5 1.2
Source: own material.
23 A. Jadczak,Fight for theThirdPlace,ReportTOP200�omputerworld, June2003, p. 142.

116 Anna Miarecka, Patrycja Ptaszek-Strączyńska
In 1995–2005 instantaneous liquidity rate amounted to a high level of 0.9 in 1995 to 1.9 in 2005, showing slight fluctuations in the remaining years of the researched period.
In comparison with the current liquidity rate, the high instantaneous liquidity rate of the examined entities shows that in the structure of working assets, reserves amounted to a small proportion. In 1995 the share of reserves in working assets amounted to 23%, in the following years: in 1996 – 12%, 1997 – 14%, 1998 – 14%, 1999 – 16%, 2000 – 18%, 2001 – 15%, 2002 – 7%, 2003 – 11%, 2004 – 10% and 2005 – 9%.
The specialist literature indicates that the rational management of monetary means should consist in the maintenance of liquid reserve at a minimum level to ensure retaining financial liquidity. In the examined companies the level of liquid working assets is kept at a very high level, not resulting from the real need.
Instruments to assess profitability perform two major functions in the company: • they make assessment of capital management efficiency, • they express preferences of the people entrusting their capital.
The analysis of corporate profitability is a consequence of the assumed development strategy embracing24: • price policy and cost control, determining the share of profit in sales,
which means profit margin, • investment policy, which ROI depends on, • financial policy, which determines debt structure contributing to ROE
growth.Corporate profitability depends to a large extent on the achieved financial
results. In the present work, net profit plays an important role in formulating and assessment of profitability measures. The analysis of profitability was carried out on the basis of ROE rate according to the relation of net profit to own capital, ROA rate according to the relation of net profit to assets, ROIC rate according to the relation of operational profit to assets. In the examined period the profitability of the examined companies is falling but high, which is presented by the data in Table 4. Return on own assets in the research period amounted to the highest level 1995–1996 when IT was the fastest growing industry on the Warsaw Stock Exchange. There were similarly high rates of return on assets and invested capital in 1995–1996.
24M. Sierpińska,T. Jachna, Ocena przedsiębiorstwa według standardów światowych, PWN, WarszawaM.Sierpińska,T.Jachna,Ocenaprzedsiębiorstwawedługstandardówświatowych,PWN,Warszawa1997, p. 108.

Working Capital Management in IT Companies. Selected Aspects 117
Table 4. Return rates of IT companies listed on the Warsaw Stock Exchange in 1995−2005, in percentages (median)
1��5 1��6 1��7 1��� 1��� 2000 2001 2002 2003 2004 2005
ROE 43 32 13 18 16 6 4 3 6 10 10ROA 13 16 9 12 4 1 2 2 3 6 4ROIC 6 13 9 12 6 0 2 3 5 6 7
Source: own material.
When assessing the profitability of the examined companies, the impact of the economic situation is worth considering. In comparison with the return rates of economic entities published by the Central Statistical Office, in the period of bad economic situation, in particular 1999–2002, profitability was low, and in 2001-2002 it was negative25, while in the examined group of entities the return rates achieved positive values.
In comparison with the service sector, IT companies ROE in the research period was higher in 1996–2000, which is illustrated in Figure 1. After 2000 this relation was reversed, slightly in favour of the service sector, and in 2004 IT companies ROE was again higher.
Figure 1. ROE in IT and service companies sector in 1995−2005, in percenta-ges, median
50454035302520151050
1995 1996 1997 1998 1999 2000 2001 2002 2003 2004 2005
IT Services
%
Source: own material.
25 Profitability of net turnover in 2000 amounted to 0.5%, in 2001 (–0.2%) in 2002 (–0,3%), Rocznik Statystyczny Rzeczpospolitej Polskiej, 2003, p. 491.
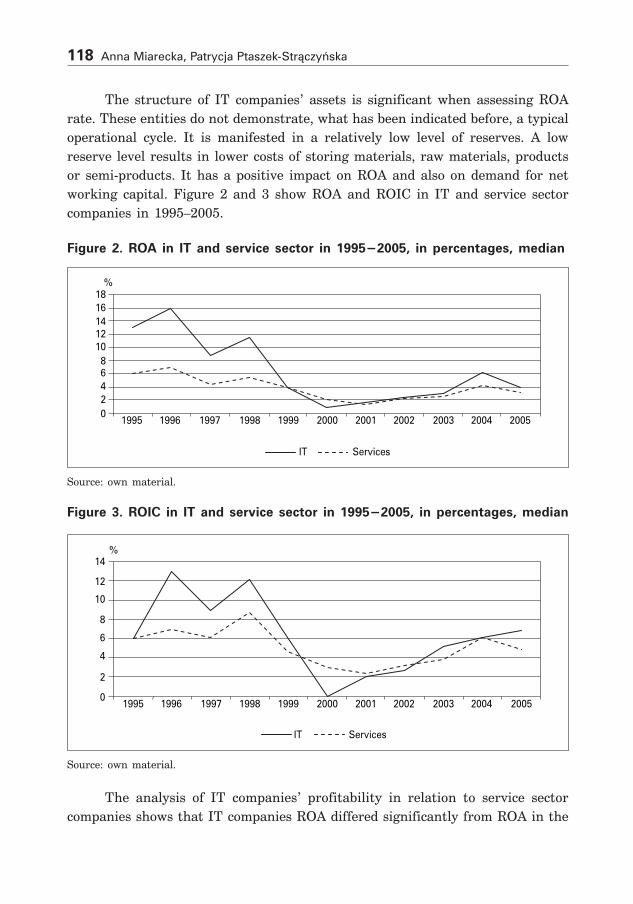
11� Anna Miarecka, Patrycja Ptaszek-Strączyńska
The structure of IT companies’ assets is significant when assessing ROA rate. These entities do not demonstrate, what has been indicated before, a typical operational cycle. It is manifested in a relatively low level of reserves. A low reserve level results in lower costs of storing materials, raw materials, products or semi-products. It has a positive impact on ROA and also on demand for net working capital. Figure 2 and 3 show ROA and ROIC in IT and service sector companies in 1995–2005.
Figure 2. ROA in IT and service sector in 1995−2005, in percentages, median
181614121086420
1995 1996 1997 1998 1999 2000 2001 2002 2003 2004 2005
IT Services
%
Source: own material.
Figure 3. ROIC in IT and service sector in 1995−2005, in percentages, median
14
12
10
8
6
4
2
01995 1996 1997 1998 1999 2000 2001 2002 2003 2004 2005
IT Services
%
Source: own material.
The analysis of IT companies’ profitability in relation to service sector companies shows that IT companies ROA differed significantly from ROA in the

Working Capital Management in IT Companies. Selected Aspects 11�
service sector in 1995–1999. In the remaining years the dynamically developing IT sector in Poland and thus a rising number of companies fiercely competing on the market resulted in a substantial decline in profit margins in the whole industry, which had an impact on the decline in ROA. In the initial phase of the development of the IT market in Poland (1995–1997) margins realised on hardware and software amounted to a few hundred percent, and in 2005 only to a few percent. The change in the structure of the IT market concerning the kind of products offered caused that the rising dynamics of services was accompanied by the rising dynamics of margins in 1995–2000. Thus, it explains the specific nature of the operational cycle of IT service sector, in which a minimum level is assumed.
5. Conclusions
The empirical research carried out among IT companies in 1995−2005 pointsout that net working capital management depends on the very nature of activity. A distinguishing element of IT companies’ working capital management is a high profitability of activity and also financial over liquidity. It results first of all from the structure of assets of the examined companies, in which a low share of reserves favours minimisation of financial costs.
In the research period a growing role of own internal financing was observed. Its source was reinvested net profit and also own financing from external sources, i.e. share issue. The assumed strategy of financing companies in this sector can be hardly adjusted to well-known models of capital structure. On the one hand, a high level of own financing means applying the hierarchy financing theory, on the other the structure of assets limits the accessibility of foreign capital acquisition. This situation may be an essential limitation of IT companies development and additionally it may not favour the efficiency of management of the capital entrusted by owners. The research carried out also points out to periodical states of over liquidity too, which should be the object of the object of particular assessment of efficiency of working capital management. A low level of debt in the structure of financing limits the effects of financial leverage. This issue is connected with another aspect of corporate capital management, i.e. the cost of capital to be the next subject to consider by the authors.

120 Anna Miarecka, Patrycja Ptaszek-Strączyńska
6. Bibliografia
1. Banerjee S., Hesfmati A., Wihlborg C., The Dynamics of Capital Structure, SSE/EFI Working Paper Series in Economics and Finance, No. 333, May 2000.
2.BevanA.A.,Danbolt J.,Dynamics in theDeterminants of�apital Structurein the UK, Working Paper 2000/9.
3.BielawskaA.,Podstawy finansówprzedsiębiorstwa,WydawnictwoZachodnio-pomorskiejSzkołyBiznesu,Szczecin2001.
4.BielawskaA.,Złota reguła, „Finansista”,Nr02/2001. 5.BorowieckiB.,Zarządzaniekapitałemtrwałymwprzedsiębiorstwie,AkademiaEkonomicznawKrakowie,Wydaw-nictwoSecesja,Kraków1993.
6.BrighamE.F.,HoustonJ.F.,Podstawyzarządzania finansami,Tom1,PWE,Warszawa 2005.
7.�habikJ.,Nie tylkopieniądze,Report�omputerworldTOP200, June2003. 8.Duliniec A., Determinanty polityki finansowej przedsiębiorstwa, Finansowy
Kwartalnik Internetowy e-finanse, www.e-finanse.com. 9.Ickiewicz J., Pozyskiwanie, koszt i struktura kapitału w przedsiębiorstwach,
SGH, Warszawa 2004.10.Jadczak A., Walka o trzecią pozycję, Report TOP200 �omputerworld, June
2003.11.Leszczyński Z., Skowronek-Mielczarek A., �orporate Economic Financial
Analysis, Wydawnictwo Ekonomiczne, Warszawa 2004.12.Miarecka A., �zynniki kształtowania struktury kapitału w spółce akcyjnej,pracadoktorska,SGH,Warszawa, styczeń2006.
13.OstaszewskiJ.,MiareckaA.,MikołajczykO.,Dylematykształtowaniastrukturykapitału w polskich spółkach akcyjnych,Monografie i opracowania naukoweKolegium Zarządzania i Finansów SGH, Wybrane zagadnienia teorii orazpraktyki finansów, pod redakcją J. Nowakowski, J. Ostaszewski, Warszawa2005.
14.SierpińskaM.,WędzkiD.,Zarządzaniepłynnościąfinansowąwprzedsiębiorstwie,Wydawnictwo Naukowe PWN, Warszawa 1997.
15.Stępniewski J., Diagnostyka księgowa sytuacji finansowej przedsiębiorstwa,„ProblemyRachunkowości”,Nr4/2001.
16.Waśniewski T., Skoczylas W., Ocena sytuacji kapitałowo-majątkowej (układpoziomy), „Rachunkowość”,Nr6/1993.
17. Report Computerworld TOP 200. Polski rynek informatyczny i telekomunikacyjny Polish Information and Telecommunications System 1998.
18. Report TELEINFO500, May 2002.

Ludmiła Słobodzian, Monika StępińskaWarsaw School of Economics
Privatization of State Enterprises in Russia – What Went Wrong and Why?
Privatization in Russia was the source of many controversies. There’s no question that following the dissolution of the Soviet Union and collapse of communism, the inefficient state sector in Russia had to be privatized. However, the way in which privatization process in Russia was conducted is a textbook example of a failed attempt to create a market economy. It allowed narrow business elite to become fabulously rich thanks to widespread theft, asset stripping and numerous other illegal activities. All of this took place while foreign advisors to Russian government pretended everything was fine, mainly because they preferred any sort of private property – even if it was acquired through illegal means – to state-owned economy. Such an attitude unfortunately contributed to criminalization of Russian economy, as insiders and oligarchs took control of majority of Russia’s most profitable industries. This resulted in creation of an economy dominated by monopolies and duopolies, which is contrary to the very idea of the free market system.
After the dissolution of Soviet Union, Russian authorities decided to privatize the economy as quickly as possible. The motivation behind the young reformers’ drive toward rapid privatization was political rather than economic. They realized that quick action was necessary in order to quell the resistance of the so-called “red directors” who managed the enterprises under communism and were afraid that privatization will mean the end of their careers. In order to secure broad support for privatization, it was decided that factory managers and employees would be given a preferential treatment.
The initial phase of privatization in Russia entailed distribution of vouchers among the population. Each citizen of Russia was to receive a privatization voucher which could then be exchanged at auctions for shares of privatized enterprises.
Russian reformers chose mass privatization for several reasons. First, the voucher scheme was going to be popular with the Russian society, because it would give everyone a stake in the economic reform. Direct sales of enterprises to new outside owners were not a realistic option – there were not enough Russians with the necessary capital and selling of firms to foreigners would have a negative effect on popularity of privatization among the Russian population. In any case, there were no guarantees that a sufficient number of foreign investors

122 Ludmiła Słobodzian, Monika Stępińska
could be found. Concentration of shares in the hands of new outside owners was to be achieved by encouraging investment funds to buy up shares of privatized enterprises1.
The idea behind the voucher privatization was based on the assumption that since under communism vast majority of national industry was state-owned and therefore each citizen owned an equal part of that wealth, vouchers giving each person an equal stake in a privatized property could be an instrument of achieving an egalitarian distribution of this property. In theory, it was a good idea. It created a possibility of emergence of a real middle class of small investors, which would form a basis for a democratic Russia. In addition, mass privatization was supposed to revive popular support for the process of economic transformation in Russia.
In practice, however, it proved to be a dismal failure. The vouchers turned out to be worth much less than anticipated. Most people either sold them immediately or placed them with mutual funds which in reality were fraudulent pyramid schemes.
There are quite a few reasons why things did not go as the authors of the program had anticipated. Initially, it was mainly a question of mismanagement and lack of competence. Young reformers wanted to proceed with the privatization program as quickly as possible and consequently made the mistake of introducing too many industrial and natural goods on the Russian market. There simply was not enough demand for all those goods. Besides, the nominal value of vouchers was very low. As a result, most people considered the vouchers almost worthless and immediately sold them on the street for equivalent of 7 USD. That meant the entire value of Russia’s industrial and natural wealth was only 5 billion USD, which is a ludicrously low figure.
As a result, the final value of these enterprises had shrunk to ridiculously low amounts. Most Russian citizens did not take advantage of voucher privatization. The only people who benefited from it were insiders and financial advisors, who gained control of major enterprises for a fraction of their market value. Most of the vouchers ended up in the hands of the enterprise directors, who had the financial means to acquire a large quantity of vouchers from their employees, thanks to the funds they had misappropriated in earlier years. Thus, the employees were expropriated, albeit voluntarily. Shares of privatized enterprises using vouchers in most cases ended up in the hands of the same factory directors who benefited from other forms of privatization. The idea that voucher privatization would lead to a broad-based people’s capitalism turned out to be ineffectual2.
1 P. Rutland, Privatisation in Russia: one step forward, two steps back?, Europe – Asia Studies, Nov.P. Rutland, Privatisation in Russia: one step forward, two steps back?, Europe – Asia Studies, Nov. 1st 1994, http://www.findarticles.com/p/articles/mi_m3955/is_n6_v46/ai_16601751
2 E. G. Dolan, When property is theft – market reform in Russia, Reason, Dec. 1998, http://www.E. G. Dolan, When property is theft – market reform in Russia, Reason, Dec. 1998, http://www.findarticles.com/p/articles/mi_m1568/is_1998_Dec/ai_53260536

Privatization of State Enterprises in Russia – What Went Wrong and Why? 123
Initially, most of state enterprise managers opposed the idea of privatization. However, their opinions gradually changed as they learned to take advantage of the system. Many managers used the privatization process to consolidate their property rights and shield themselves from market discipline. Such actions were contradictory to the whole idea of privatization and transition to a market economy3.
In order to gain the support of factory managers for privatization, Russian government resorted to bribing them with cheap shares, so that they would have an incentive to pursuit privatization. A large number of cheap shares were also allocated to employees, in line with the communist tradition of worker ownership of means of production. As a result, most of privatized enterprises became owned by their managers and employees. Because of Russian workers’ poor understanding of free market mechanisms, most of these firms soon became controlled solely by their managers. This was possible because vouchers were tradable, which allowed managers to buy vouchers that they could later exchange for shares in their own enterprises. Funds used to purchase these vouchers were often acquired by illegal means. After voucher auctions were completed, managers continued to accumulate shares by convincing or pressuring their employees to sell shares to them at low prices4.
The vast majority of Russian citizens, who were not employed by the privatized factories, either sold their vouchers on the street or invested them in the so-called voucher funds. The Russian government licensed 600 such funds without any supervision of their operations or enforcement of investors’ rights. Later it turned out that most of those voucher funds were in fact pyramid schemes, designed to cheat the investors and enrich the crooks who had established them.
In addition to unfair distribution and access to vouchers, there were numerous other negative and often criminal activities. During the course of Russia’s privatization there were tens of thousands of known instances of law violation. One of the most common practices was participation of managers as natural persons in privatization of plants managed by them. Another popular example of financial embezzlement was intentional lowering of the value of an enterprise by its management, so that later they could purchase shares of their firm at a low price5.
As a result of voucher privatization, managers of enterprises were able to take control of companies. This in turn allowed them to engage in extensive self-dealing (transactions between insiders and the company, due to which the
3 P. Rutland,Rutland, op. cit.4 B. Black, R. Kraakman, A. Tarassova, Russian Privatization and Corporate Governance: What WentB. Black, R. Kraakman, A. Tarassova, Russian Privatization and Corporate Governance: What Went Wrong?, „StanfordLawReview”,Vol. 52, July2000, pp. 1740–1741.
5 �. Szul, I etap denacjonalizacji – prywatyzacja czekowa, http://www.rosjapl.info/rosja/gospodarka/�. Szul, I etap denacjonalizacji – prywatyzacja czekowa, http://www.rosjapl.info/rosja/gospodarka/prywatyzacja_czekowa.php

124 Ludmiła Słobodzian, Monika Stępińska
insiders profit at the company’s expense). Russian government did not do anything to stop this procedure6.
Some of Russia’s best and most profitable companies were excluded from the voucher phase of privatization for political reasons. However, the Russian government was in need of raising revenue to cover budget deficit. Therefore, the main objective of the second phase of privatization was to get as much money as possible from sale of enterprises, for the state budget was continuously short of funds. Without additional proceeds from privatization, it would have been impossible to stabilize Russia’s economy7.
The second phase of privatization consisted mainly of open auctions of shares with simultaneous liquidation of vouchers. Shares of enterprises were to be sold for cash only and 51% of the proceeds were to be invested in the privatized firm. According to the government’s plan, such strategy was going to facilitate concentration of capital in the hands of large investors8.
However, it soon turned out that the program failed to come up to the expectations. Revenue from privatization was several times lower than planned and in some cases proceeds from sale of vouchers were actually higher. Another negative phenomenon was frequent corruption between state employees and investors interested in purchasing a plant. In such cases, shares of privatized enterprises were not sold at open auctions, where it would be possible to get a high price for them; instead, purchases of shares were controlled by special interest groups. This led to great losses of revenue for the state treasury. As a result, revenue from privatization was only a fraction of what it was supposed to have been. Sale of 145 000 state enterprises brought only 9.7 billion USD to the state budget9.
Another frequent practice was rejection of offers from potential buyers under the guise of failing to fulfill the required conditions. Because of widespread corruption, privatization in Russia was moving away from its objectives and, furthermore, foreign investors were being discouraged by such practices.
Because of the above mentioned difficulties, in the second half of 1995 Russian government introduced a new privatization scheme – the so-called “loans-for-shares” auctions. The objective of this program was mainly to cover budget deficit and to provide an incentive to cash privatization. However, this form of
6 B. Black, R. Kraakman, A. Tarassova,Black, R. Kraakman, A. Tarassova, op. cit., p. 1733.7 �. Szul, II etap prywatyzacji – od roku 1994, http://www.rosjapl.info/rosja/gospodarka/prywatyzacja_�.Szul,IIetapprywatyzacji–odroku1994,http://www.rosjapl.info/rosja/gospodarka/prywatyzacja_
2etap.php8 Same source,Same source, op. cit.9 A. Nesterov, Russian oligarchs were recommended pay more for privatization, „Pravda”, 19/04/2004,A.Nesterov,Russianoligarchswererecommendedpaymoreforprivatization,„Pravda”,19/04/2004,
http://english.pravda.ru/main/18/89/356/12561_oligarch.html

Privatization of State Enterprises in Russia – What Went Wrong and Why? 125
privatization was the source of great controversy and the main factor behind the emergence of a narrow class of oligarchs in Russia. Such an outcome comes as no surprise when we realize that the program’s proponents were the then banking sector elite, who thanks to the loans-for-shares scheme became true financial tycoons, controlling large parts of Russian economy’s most lucrative branches10.
The loans-for-shares scheme was a very cynical method of privatization, devised by Anatoli Chubais, who at the time was in charge of government’s privatization. He decided to sell controlling shares in the top 12 Russian export-oriented enterprises. Since the voucher phase of privatization included only 49% of those firms’ shares, the question was how to privatize the remaining 51% still owned by the state.
Chubais assembled a group of several top Russian business tycoons, who later came to be known as “oligarchs”. These men then decided among themselves as to who will place a bid for which firm and at what price. In theory, it was possible to assume that the 51% stake for sale at an opening bid in a tender was open to everyone. However, foreigners were prevented from participating, as was anyone from outside the system. All these enterprises came under control of the oligarchs, who paid anything between 3% and 10% of their market value.
Let’s take a closer look at how this scheme worked. As a result of their deal with Chubais Russian banks, controlled by a handful of business tycoons, proposed to loan funds to the government for a period of several years, with repayment secured by the government’s controlling stakes in these enterprises. The loans-for-shares scheme consisted of special type auctions at which the winning bank would be obliged to grant credit to the government, with shares of enterprises serving as collateral. Later, those shares could be purchased by the government, sold at another auction or become the property of credit provider. It was obvious that the government did not intend to repay these loans but would instead forfeit its shares to the banks that provided the loans. But this stage of privatization was conducted in a massively corrupt fashion. Major banks gained the right to manage the auctions, which let them acquire shares at incredibly low prices. All other bidders were excluded from participating, which enabled the banks to bid the government’s reservation price at an only slightly higher amount11.
The motivation behind the loans-for-shares scheme was, just like in case of voucher privatization, strictly political. Chubais needed the support of oligarchs to ensure the reelection of President Boris Yeltsin in 1996. In order to achieve that aim, he let them acquire top Russian firms for only a small portion of their
10 �.Szul,Szul, II etap prywatyzacji, op. cit.11 B. Black, R. Kraakman, A. Tarassova,Black, R. Kraakman, A. Tarassova, op. cit., p. 1744.

126 Ludmiła Słobodzian, Monika Stępińska
worth in exchange for an iron-clad promise of political and financial support for Yeltsin in the 1996 presidential campaign12.
The most controversial practice was transfer of majority of the received funds back to the banks that had won the auctions. That meant the commercial banks which had granted credit to the Russian government were being financed from the state budget. Besides, in eight of the first twelve loans-for-shares auctions, the final price was only slightly higher than the opening bid. This gave rise to a suspicion that the privatized enterprises were being transferred to banks on preferential conditions. Additionally, there were charges by critics that shares of enterprises participating in the loans-for-shares auctions were significantly undervalued. This was proved by subsequent incredible rises in value of shares of enterprises privatized this way13.
The result of this program was the sale of the largest Russian firms for incredibly low prices to a few well-connected oligarchs, who had acquired their wealth through dubious means. Despite the corrupt nature of the loans-for-shares program, Russian reformers claimed that any private owner was better than state ownership, because the new private owners would at least have incentives to increase company value. However, instead of increasing company’s value, most new owners chose an easier approach – they simply stole whatever value already existed. Instead of improving productivity and investing in newly acquired firms, a large number of new private owners resorted to skimming profits from their companies, starving them of funds (to the point where many were unable to pay their workers or their tax bills), replacing managers who resisted the skimming (or threatening/bribing them into submission); and shooting managers and local government officials who resisted too strongly.14 Such ill-gained profit could easily be stashed away in foreign banks, out of reach of any future Russian government15.
The loans-for-shares program transferred formerly state-owned assets to few well connected individuals. But taking over entire branches of Russian industry proved not to be enough for these people. Oligarch-controlled banks, which offered yearly interest rates of over 1000% turned out to be nothing more than pyramid schemes. More than 20 million Russian citizens, desperate to preserve their savings during the period of hyperinflation in the early 1990s, lost everything they had. These banks were also heavily involved in money laundering and embezzlement activities16.
12 P. Klebnikov, Rosja – kradzież stulecia, Multinational Monitor, January 2002, http://www.lewica.P. Klebnikov, Rosja – kradzież stulecia, Multinational Monitor, January 2002, http://www.lewica.pl/?dzial=teksty&id=172
13 �.Szul,Szul, II etap prywatyzacji, op. cit.14 B. Black, R. Kraakman, A. Tarassova,Black, R. Kraakman, A. Tarassova, op. cit., p. 1769.15 Same source,Same source, op. cit., p. 1736.16 S. Glinkina, A. Grigoriev, V. Yakobidze, Crime and Corruption, w: L. R. Klein, M. Pomer (eds.),S. Glinkina, A. Grigoriev, V. Yakobidze, Crime and Corruption, w: L. R. Klein, M. Pomer (eds.),
The New Russia: Transition Gone Awry, Stanford University Press, Stanford 2001, pp. 236–237.

Privatization of State Enterprises in Russia – What Went Wrong and Why? 127
All of this resulted in a great outflow of capital from Russia. Russian enterprises were stripped of assets and starved of capital as a group of criminals had transferred most of the country’s foreign currency reserves abroad. The loans-for-shares scheme turned out to be nothing less than systematic looting of state assets by oligarchs and organized crime.
Privatization and deregulation of Russia’s economy did not result in creation of effective and competitive markets but instead gave rise to harmful monopolies, oligarchs and criminals who control competing business empires and mass media. These empires were sponsored by their own banks, which in reality were no banks at all, but regular speculative funds that did not perform any of the important functions of commercial banks17.
Privatization process in Russia was accompanied by symptoms of social pathology, as well as pathology of the ruling class in directing that process and taking advantage of its results. Decisions regarding privatization in Russia were dependent on the interests of various lobbies, particularly plant managers and financial industrial groups (the so-called oligarchs)18. Another reason why the results of Russian privatization have been disappointing was the fact that it was carried out before the essential legal framework was in place. In addition, since privatization so blatantly favored the rich and the powerful, it turned Russia’s public opinion against the whole idea of private property19.
The consequence of the ill-conceived privatization process in the early 1990s is an anti-competitive marketplace, governed by monopolies and duopolies, tightly owned by elite of insiders who regularly abuse minority shareholders, the state and the rule of law20. But it did not have to be like that if only Russian authorities had not pursued privatization at all cost. Legal provisions ensuring transparency and fairness of the privatization process should have been enforced prior to any attempt to sell state-owned enterprises. However, Russian authorities had decided that any private owner was better than continued state ownership. This proved to be a crucial mistake resulting in consequences which are felt to this day.
Bibliography
1. Black B., Kraakman R., Tarassova A., Russian Privatization and Corporate Governance:WhatWentWrong?,„StanfordLawReview”,Vol.52,July2000.
17 J. K. Galbraith, Kryzys globalizacji, Dissent, Summer 1999, Vol. 46, No. 3, http://www.uni.wroc.pl/~turowski/galbraith.htm
18M. Jarosz, Plusy i minusy transformacji, p. 10, http://www.wspiz.edu.pl/resources/?rid=22992M.Jarosz,Plusy iminusy transformacji, p. 10,http://www.wspiz.edu.pl/resources/?rid=2299219 E. G. Dolan,Dolan, op. cit.20 S. Vaknin, Chubais – Russia’s Last Oligarch, http://samvak.tripod.com/brief-chubais01.htmlS. Vaknin, Chubais – Russia’s Last Oligarch, http://samvak.tripod.com/brief-chubais01.html
12� Ludmiła Słobodzian, Monika Stępińska
2. Dolan E. G., When property is theft – market reform in Russia, Reason, Dec. 1998, http://www.findarticles.com/p/articles/mi_m1568/is_1998_Dec/ai_53260536
3.Galbraith J. K., Kryzys globalizacji, Dissent, Summer 1999, Vol. 46, No. 3,http://www.uni.wroc.pl/~turowski/galbraith.htm
4. Glinkina S., Grigoriev A., Yakobidze V., Crime and Corruption, w: L. R. Klein, M. Pomer (eds.), The New Russia: Transition Gone Awry, Stanford University Press, Stanford 2001.
5.Jarosz M., Plusy i minusy transformacji, http://www.wspiz.edu.pl/resources/?rid=22992
6.KlebnikovP.,Rosja–kradzieżstulecia,MultinationalMonitor,January2002,http://www.lewica.pl/?dzial=teksty&id=172
7. Nesterov A., Russian oligarchs were recommended pay more for privatization, „Pravda”, 19/04/2004, http://english.pravda.ru/main/18/89/356/12561_oligarch.html
8. Rutland P., Privatisation in Russia: one step forward, two steps back?, Europe – Asia Studies, Nov. 1st 1994, http://www.findarticles.com/p/articles/mi_m3955/is_n6_v46/ai_16601751
9.Szul �., I etap denacjonalizacji – prywatyzacja czekowa, http://www.rosjapl.info/rosja/gospodarka/prywatyzacja_czekowa.php
10.Szul �., II etap prywatyzacji – od roku 1994, http://www.rosjapl.info/rosja/gospodarka/prywatyzacja_2etap.php
11. Vaknin S., Chubais – Russia’s Last Oligarch, http://samvak.tripod.com/brief-chubais01.html

Summary
AndrzejKaźmierczak
Inflation Goal of Monetary Policy in the neo-Keynesian Model of EconomyIn current theoretical debates on macroeconomic stabilisation policy, there is some convergence of approaches of neo-Keynesian and neoclassical schools. Both camps share the view that anti-cyclical demand corrections do not increase production in long term. The only effect of global demand stimulation is inflation growth which, in turn, slows down the economic growth. However, contrary to neo-classics, neo-Keynesians are inclined to recommend intervention policy in the case of exogenous external shocks, which reduce global demand in the economy and impede production. Irrespective of the intended economic policy, negative demand shocks bring about unnecessary decline in employment in the economy. The compensatory monetary policy to stimulate global demand can bring about production growth, due to deficiencies of the market mechanism in the contemporary monopolised economies. The deficiencies result from the rigidity of prices and wages. According to the neo-Keynesians monetary policy instruments should be the tool of the intervention policy. The implementation of inflation goal may be reconciled with the active monetary policy of the central bank.
AnnaDąbrowska,MirosławaJanoś-Kresło
Consumers – the Motor of Their Own Role on the MarketThe European Union attaches an increasing importance to the consumer’s role on the market. Consumer’s welfare is the essence of well-functioning markets and entrepreneurs should not create situations leading to violation of consumers’ interests. Nevertheless it does not absolve consumers from active participation in creating and enforcing their role on the market, among others by reinforcement of the rights which are due to them. According to the research results, the level of consumer awareness among the citizens of Lithuania, Latvia, Poland and Ukraine vary.
Joanna�ygler
Hypercompetitive Trends as a Premise to Create Co-opetitive RelationsFor a few dozensof years we have observed growing and unpredictable changes, both, of the environment and rules of the competitors’ market game which have created hypercompetition. It is stimulated along with globalisation of sectors and advances in technology, which intensifies competition not only internationally but also in home countries.Profound changes of the environment force companies to constantly redefine their competitive positions and strategies. R. A. D’Aveni indicates the necessity to change competition in four basic areas: price-quality, time and know-how, strongholds and deep-pockets strategies. In the price-cost area companies are forced to run price wars which, eventually, lead to destruction and extinction of the parties of the conflict. In

130 Summary
case of time-based strategy speed and originality of the first mover are the key to success. Stronghold strategies are based on setting up barriers to entry in particular sectors and geographical markets. Deep-pockets strategies are founded on developing co-opetitive relationships to outperform bigger and stronger rivals.In the hypercompetitive environment competitive advantages are temporary. The existing concepts related to the development of competitive advantages (e.g. E. M. Porter) are losing their relevance and there is a need to come up with new ideas and instruments.R. A. D’Aveni puts forward a concept of new 7S taking into account specific aspects of the hypercompetitive environment as a response to a decreasingly relevant McKinsey 7S. New instruments include superior stakeholder satisfaction, strategic soothsaying, speed, surprise, shifting competition rules, signalling strategic intent, and simultaneous and sequential thrusts. Their task is to disrupt the current rules of the game, take over the initiative and implement new rules.Rivalry in the hypercompetitive environment coerces corporations to meet very strict organzational requirements. More and more frequently they decide to cooperate with their rivals by establishing co-opetitive relationships.The latest survey by the EIU shows that the overwhelming majority of companies find such relationships an inevitable necessity of the development in hypercompetitive environments.
MałgorzataZaleska,ZbigniewKorzeb
The Impact of Information about Mergers and Acquisitions on Commercial Banks’ Market Evaluation in PolandThe aim of this paper is analyzing the impact of information about an intended merger or acquisition in the banking sector on reaction of shareholders of banks listed on the Warsaw Stock Exchange. The research included formation of abnormal rates of return in twenty one cases which took place in the years 1994–2006. The observed tendencies are generally consistent with the results of research carried on mature capital markets. The results prove that shareholders of acquired companies gain highest profits. In case of acquiring banks negative average cumulative abnormal returns and average ‘buy and hold’ cumulative returns have been noted. However, the market reaction to consolidation of banks belonging to the same strategic shareholder has been favorable.
AgnieszkaAlińska
Cooperative Banks and Credit Societies – Comparative Analysis of Regulations and Effects of Their ActivitiesThis publication points to the most relevant similarities and differences which can be observed in the activities of cooperative banks and credit societies (SKOKs). The analysis of the issues in question primarily dealt with legal provisions regulating the activities of Cooperative Banks and Credit Societies as well as with their impact on the scope and extent of their activities and the value of financial and economic results. In this context it seemed crucial to attempt to answer the question if differences existing
Summary 131
between cooperative banks and credit societies significantly influence the effects of activities these entities perform on the market of financial services.
PawełNiedziółka
Financial Covenants and Outside Rating as Factors Restricting Information Asymmetry on the Syndicated Loan MarketRecently, the syndicated credit market has been developing very dynamically, which on the one hand was caused by relatively high profitability on the secondary market (despite a downward tendency and ever increasing use of the market flex clause) and on the other, by a low share of default exposures. The observed structural changes indicate a growing importance of credits with speculative ratings and consequently with a higher credit risk. The development of the market of syndicated credits, which in Poland perform the function of the most important instruments of credit risk transfer, is determined by the issue of instruments monitoring debtor’s economic and financial position when there is a lack of direct relation between the debtor and crediting banks. The issue becomes especially important in the view of repeatedly identified dichotomic division of the market into arranging and crediting banks. The aim of this article is to define covenants and outside ratings’ potential as crucial (next to the Marking-To-Market evaluation) factors restricting information asymmetry and increasing possibilities of exposure monitoring by crediting banks.
Aleksandra Laskowska-Rutkowska
Directions of Development of Supply ChainsThe concept of a supply chain undergoes constant changes. Expectations concerning supply chains and direction of their development are reflected in changes in their surroundings. Three afore described trends concerning directions of their development converge and are complementary. Marketing and social approach stresses human participation in creating the value offered by a supply chain. However, the customer-driven chain must quickly react to customer needs (time-based orientation), which is possible only with the support of modern information technologies (technological orientation). In a similar way the sense-and-react supply chain, representing technological orientation, is supposed to sufficiently quickly (time-based orientation) react to changes in demand, i.e. to customers’ expectations (sociological and marketing orientation). Therefore all the orientations discussed above, aim at accomplishing the same objective, which is supplying maximum value for the final receiver. And this becomes possible thanks to the knowledge of customer’s needs, ability to react quickly and the support of modern information technologies. Nevertheless, there are different interpretations of the importance of particular methods necessary to its accomplishment. Is it possible to combine all the above discussed orientations? Yes, it seems that the presented afore postulates are met when we deal with innovative supply chain. This term is broad enough to include synchronic appearance of customer-oriented, time-based and also logistic and technological aspects. There are many indications that it is the multi-aspect and innovative solutions that will be expected from the supply chains in the years to come.

132 Summary
Krzysztof Borowski
Applied Forms of Structured Products on the Retail Market of Structured ProductsThe paper presents the most important methods of of creation of structured products by retail banks in co-operation with investment banks, issuers (third entities) and investment funds. It also describes the role of investment bank in the process of creation of such products and points to investment bank departments involved in the process.
AnnaMiarecka,PatrycjaPtaszek-Strączyńska
Working Capital Management in IT Companies. Selected AspectsWorking capital management is an essential issue in the finance management of every company. The goal of working capital management is to sustain the financial liquidity and to minimise the cost of capital though the appropriate selection and development of financing structure and optimisation of the volume of structure of current assets.The industry in which the company works is a significant management determining factor. In this connection the analysis of the subject was based on IT stock companies in 1995–2005. The authors draw special attention to the complex issues concerning financing the structure of activities of IT companies due to the lack of typical operational and investment cycles and low value and liquidity characteristic of the sector. In order to explain such a basic thesis, the analysis was made in relation to net working capital, financial liquidity and profitability evaluation of IT companies and service companies listed on the Warsaw Stock Exchange in 1995–2005.
LudmiłaSłobodzian,MonikaStępińska
Privatization of State Enterprises in Russia – What Went Wrong and Why?From the very beginning the way the privatization of Russian economy was carried out aroused huge controversies. Some maintain that it contributed to its criminalization and overtaking of the most important branches by oligarchs and representatives of economic underground. Blatant corruption when some transactions were made and a wide range of privileges that directors and other employees enjoyed when buying the shares of the companies they worked for were the most criticized aspects of the programme. The main social goal of the first privatization programme was distribution of state-owned property and it was based on the principle of social justice and creation of a large and powerful middle class on the basis of private ownership, which was considered a necessary condition for social and political stability. Taking into account the necessity of a thorough restructuring of these companies, the program which favoured giving the ownership rights to employees and prevented outside investors from taking over the companies did not seem to be the best solution.Another problem was that the new owners, still burdened with the experiences they had of the command-and-quota system, were unable to manage enterprises in the situation of emerging market economy. Besides, the Russian model of mass privatization

Summary 133
only to a small extent took into account the issues of efficiency, budget revenues and future investments; at the same time it put too much emphasis on often illusory aim to establish the class of small owners. Mass privatization neither brought about the inflow of new investments nor stimulated accumulation of capital. Neither did we witness any considerable improvement in the fields of financial stabilization, economic effectiveness or creating competitive environment