ofcom digital dividend – mobile voice and data (imt) issues digital dividend – mobile voice and...
TRANSCRIPT

Ofcom
Digital Dividend – Mobile Voice and Data (IMT) Issues
Mason Communications Ltd Canal Court
40 Craiglockhart Avenue Edinburgh EH14 1LT
Tel: +44 (0) 131 443 9933 Fax: +44 (0) 131 443 9944 e-mail: [email protected]
www.mason.biz
October 2007

OFCOM
DIGITAL DIVIDEND – MOBILE VOICE AND DATA (IMT) ISSUES
Copyright © 2007
Mason Communications Ltd has produced the information contained herein for Ofcom. The ownership, use and disclosure of this information are subject to the Terms and Conditions contained in the contract between Mason Communications Ltd and Ofcom, under which it was prepared.
C Updated with comments from Ofcom
Janette Dobson Adrian Dain Janette Dobson 1 October 2007
B Incorporated updates to International Interference
SIGNATURE
NAME Janette Dobson Adrian Dain Janette Dobson 24 August 2007
A Editorial updates only
SIGNATURE
NAME Janette Dobson Adrian Dain Louise Allcroft Janette Dobson 17 August 2007
PREPARED BY REVIEWED BY CHECKED BY APPROVED BY DATE
REV DOCUMENT REFERENCE NUMBER
9XNA004C
Page 1 of 92

0. Executive Summary
This report has been prepared by Mason Communications Ltd (Mason), as a summary of the work undertaken on a study on a number of technical issues associated with the award of spectrum in the UHF band the for the Office of Communications (Ofcom).
0.1 Background
The switchover to digital television in the UK (digital switchover, or DSO) will release spectrum for new uses (so-called digital dividend, or released spectrum). This released spectrum comprises a total of 112 MHz, made up of 14 x 8 MHz channels formerly used for analogue television transmission. In addition to the released spectrum, which will be cleared of television use, additional interleaved spectrum within the 32 channels to be used for digital terrestrial television (DTT) may also be available for other uses, subject to protection of DTT signals.
The position of the released spectrum within the UHF band is illustrated in Figure 0.1 below.
‘Lower’ cleared
spectrum
‘Upper’ cleared
spectrum
‘Lower’ interleaved spectrum
‘Upper’ interleaved spectrum
Figure 0.1: Spectrum Released from Digital Switchover [Source: Ofcom]
9XNA004C | 2

The UHF spectrum has better propagation characteristics than higher frequencies used for mobile systems, such as 2.1 GHz, enabling signals to travel further or to better penetrate buildings. This could offer significant advantage to the rollout of mobile services in rural areas, and/or to provide a greater depth of in-building coverage and is a key motivator for market interest in use of UHF spectrum for new services.
In addition to the propagation conditions, the amount of spectrum to be released from digital switchover makes this spectrum release one of the most significant releases of spectrum under preparation by Ofcom at the current time. The UHF band is well suited to support a wide range of broadcast, mobile and fixed applications. Previous preparatory studies conducted for Ofcom on the UHF spectrum award have identified a number of possible uses of released spectrum, including mobile applications, such as International Mobile Telecommunications (IMT), fixed and mobile broadband services and Programme Making and Special Events (PMSE).
Ofcom’s spectrum award policy, as set out in various documents, is to allow the market to determine the best use of spectrum, wherever possible, but recognising the impact of issues such as international constraints on usage and compatibility issues between different services operating in adjacent channels. It has been identified that interference from broadcasting services operating on the continent may affect different candidate uses of the UHF spectrum in the UK.
With this in mind, Ofcom commissioned Mason to undertake a study on various usage and compatibility issues associated with release of spectrum in the UHF band.
This report forms one of a series of reports to Ofcom that describe results of the various DDR technical studies.
The scope of work described in this report relates to use of UHF spectrum by IMT systems, and associated compatibility issues with DTT and other selected candidate uses of released spectrum. The scope of work included advice to Ofcom on the constraints imposed by protection of DTT services in accordance with international coordination of UHF spectrum, as defined by the Regional Radiocommunications Conference in 2006 (GE-06), the impact of adjacent channel interference between different candidate uses of cleared spectrum and associated implications for the determination of licence conditions.
9XNA004C | 3

0.2 Link Budget Analysis
During the study we undertook a detailed review of link budget parameters for mobile use of DDR spectrum and, given the wide bandwidth of the UHF band, looked at how certain technical parameters might vary between upper and lower released channels.
We took in to account a number of considerations in developing link budgets for the study, including commonality with GSM and other cellular radio, particularly for the upper released channels, and variation of certain parameters with frequency, such as building penetration, antenna gain (particularly in mobile handsets), fade margins and body loss.
We found that the better propagation characteristics at UHF are somewhat offset by other losses that occur at UHF frequencies – such as decreases in handset antenna gain. However, this is more that compensated for by the improved propagation. The wide bandwidth of the UHF band (spanning 470 MHz to 862 MHz) means that signal losses vary across the band – achievable handset antenna gain is lower for the spectrum at the lower end of the UHF range, compared to the upper end. Correspondingly, body loss is higher at the upper end of the range compared to the lower range. Full link budgets developed for the study and used in our analysis throughout this report are provided in Appendix C.
0.3 Impact of International Interference on IMT Networks
The framework for the international coordination of broadcasting services is the Final Acts of the Regional Radiocommunications Conference (RRC) for the planning of DTT services in parts of Regions 1 and 3. The final acts of this conference are commonly referred to as the RRC-06 or GE-06 agreement.
This agreement details transmitter parameters with respect to each country in the plan, along with associated coordination requirements. In some cases, agreed variations to the GE-06 plan are contained in separate bilateral agreements between the UK and neighbouring countries (France, Belgium, Holland and Ireland). During the study, we conducted an extensive review of the impact of the GE-06 plan on services deployed in the UK, mapping expected incoming and outgoing field strength levels based on the transmitter parameters detailed in the plan, along with associated bilateral variations as determined by Ofcom. Our approach to this was based on use of the ATDI ICS Telecom radio-planning tool, programmed with transmitter parameters as detailed in the GE-06 plan. This was used to map coverage using a Digital Terrain Model, with predictions performed based on ITU-R P.1546-2.
9XNA004C | 4

The incoming and outgoing field strength prediction maps are detailed in a companion report, Digital Dividend Study International Interference Assessment [Mason, July 2007].
Using the predicted incoming and outgoing interfering field strengths, we then assessed how the GE-06 constraints might affect deployment of IMT networks in released spectrum in the UK. Incoming interference was identified to be the main constraint for the majority of UK cleared channels. The exception to this is channels 36, 38 and 69, which do not include broadcasting assignments and allotments in the GE-06 plan due to other uses, and hence for these channels outgoing interference constraints is a greater constraint in order to protect existing services operating in bordering countries.
From the interference predictions, we determined the area of the UK affected by different levels of incoming interference for different channels in the cleared spectrum, both in terms of percentage land and percentage population affected. The figures below summarise the worst case predicted levels of incoming interference in the UK, against area, illustrated for both lower and upper cleared spectrum in the UK UHF band plan. This relates to incoming interference only, which we found to be the most restrictive constraint for most, but not all, of the cleared channels. The exceptions are channels 36, 38 and 39, which are not currently used for broadcasting services in the UK and in the continent and do not include assignments/allotments in the GE-06 plan. For these, outgoing constraints to protect existing services will dominate.
Full analysis of imported and exported interference analysis conducted by Mason is available in a separate report to Ofcom1.
Each channel in the cleared spectrum was considered, with the exception of channel 69. Channel 69 is used for PMSE in the UK and there are no bilateral agreements in place between the UK and France, Belgium, Holland and Ireland for use of this channel (and hence there is no basis for co-ordination)2.
1 International Interference Assessment, Mason Communications study for Ofcom, August 2007. 2 France and Belgium both have allotments reserved for channel 69 in the GE-06 plan, but there are no coordinated assignments.
9XNA004C | 5

UK Land Area by Incoming Interference
Lower Digital Dividend Released Spectrum
0%10%20%30%40%50%60%70%80%90%
100%1 5 9 13 17 21 25 29 33 37 41 45 49 53 57 61 65 69
Interference (dBuV/m)
Are
a
Ch 31Ch 32Ch 33Ch 34Ch 35Ch 36Ch 37Ch 38Ch 39Ch 40
Figure 0.2: Area Affected by Incoming Interference – Lower Band Cleared Channels
UK Land Area by Incoming Interference
Upper Digital Dividend Released Spectrum
0%10%20%30%40%50%60%70%80%90%
100%
1 5 9 13 17 21 25 29 33 37 41 45 49 53 57 61 65 69
Interference (dBuV/m)
Are
a
Ch 60Ch 61Ch 62Ch 63Ch 64Ch 65Ch 66CH 67Ch 68
Figure 0.3: Area Affected by Incoming Interference – Upper Band Cleared Channels
We used the results of this analysis to evaluate received interference to a mobile network, initially in the worst case (where the receive antenna boresight is aligned with the source of
9XNA004C | 6

interference), and then how interference might be mitigated through use of antenna downtilt (8 degrees) and careful selection of antennal azimuths. This was then used to determine the number of IMT cells deployed in UHF cleared channels required to meet various coverage requirements. We repeated the calculation for each cleared channel, for both indoor and outdoor voice and data services, and for different environments (rural, suburban, urban).
Results illustrate the increase in site count required to accommodate the effects of incoming DTT interference varies between channels, and between lower and upper cleared spectrum blocks. Results suggest an increase in site count of between 27% and 68% (compared to the no interference UHF case) for the channels assessed within the lower cleared spectrum, and between 4% and 54% for the channels assessed within the upper cleared spectrum. Overall, results illustrate the total site count required for each of the illustrative coverage objectives that we considered being positive compared to site requirements in higher frequency bands used for IMT services, such as 2 GHz. This supports the view of UHF spectrum being attractive for deployment of mobile services due to its propagation environment, even in the presence of incoming interference.
Results are summarised below, illustrating the site count for different channels, compared to the case of no interference. The case presented is that of a network achieving 80% population coverage3 – other coverage targets are also explored within the main report.
The results demonstrate a difference in site count between upper and lower cleared spectrum, with lower cleared spectrum requiring less sites for a given coverage target (2002 compared to 3064 for 80% population coverage in the ‘no interference’ case). This is due to differences in link budget for lower and cleared spectrum. Link budget parameters were extensively reviewed during the study and are discussed in the report.
3 80% population coverage is the target we set for the Scenario 1 that we modelled. In our model, we divided the UK geography in to different environments (urban, suburban, rural). 80% population coverage is achieved by providing coverage to 100% of urban areas in the model, 0% suburban and 0% rural. This achieves 80.7% UK population coverage, or 21.8% UK area coverage. Site count for alternative coverage is explored within the main report.
9XNA004C | 7

Site Count - Outdoor - Lower Released Spectrum
7243
2002 29
78
2551 33
62
3333
3143
2096 31
55
2002 30
51
2998
1257
9
3477 51
10
4394 57
67
5711
5386
3633 54
07
3477 52
32
5141
02000400060008000
100001200014000
2.1GHz
UHF No I
nterfe
rence
Ch 31
Ch 32
Ch 33
Ch 34
Ch 35
Ch 36
Ch 37
Ch 38
Ch 39
Ch 40
Voice outdoorData outdoor
Figure 0.4: Site count for IMT Outdoor Services – Lower Cleared Channels
Site Count - Outdoor - Upper Released Spectrum
7243
3064 45
94
4727
4373
4548
4658
4646
4388
3199 46
41
3195
1257
9
5329
7844
8075
7484
7771
7955
7939
7498
5548
7934
5541
0
2000
4000
6000
8000
10000
12000
14000
2.1GHz
UHF No I
nterfe
rence
Ch 60
Ch 61
Ch62
Ch 63
Ch 64
Ch 65
Ch 66
Ch 67
Ch 68
Ch 67 &
68
Voice outdoorData outdoor
Figure 0.5: Site count for IMT Outdoor Services – Upper Cleared Channels
9XNA004C | 8

Site Count - in-building - Lower Released Spectrum
3959
4
1096
9
1549
5
1346
8
1746
5
1726
3
1628
5
1135
1
1633
1
1096
9
1583
8
1554
4
6967
9
1911
3
2704
8
2378
9
2995
5
3021
4
2821
9
1995
0
2887
5
1911
3
2800
0
2737
7
01000020000300004000050000600007000080000
2.1GHz
UHF No I
nterfe
rence
Ch 31
Ch 32
Ch 33
Ch 34
Ch 35
Ch 36
Ch 37
Ch 38
Ch 39
Ch 40
Voice in-buildingData in-building
Figure 0.6: Site count for IMT In-Building Services – Lower Cleared Spectrum
Site Count - in-building - Upper Released Spectrum
3959
4
1683
2
2349
0
2418
3
2259
6
2330
4
2386
1
2380
9
2250
6
1739
2
2382
6
1737
6
6967
9
2908
5 4257
4
4380
4
4067
8
4216
5
4321
1
4307
6
4071
3
3026
2 4305
6
3022
8
01000020000300004000050000600007000080000
2.1GHz
UHF No I
nterfe
rence
Ch 60
Ch 61
Ch62
Ch 63
Ch 64
Ch 65
Ch 66
Ch 67
Ch 68
Ch 67 &
68
Voice in-buildingData in-building
Figure 0.7: Site count for IMT In-Building Services – Upper Cleared Spectrum
9XNA004C | 9

0.4 Compatibility between IMT Systems and Alternative Uses of UHF Cleared Spectrum
The objective of this analysis was to consider compatibility issues between IMT systems and selected alternative uses of digital dividend spectrum, when deployed in adjacent channels. This included consideration of:
• The underlying requirements of IMT and other selected candidate uses (e.g. power levels, service and coverage targets, planning levels, C/I protection requirements)
• Scope for interference between IMT and other candidate uses when deployed in adjacent channels
• Impact of adjacent channel interference on spectrum packaging and licence condition decisions.
Two main combinations of adjacent channel interference were addressed:
• Adjacent channel interference between UMTS user equipment (mobiles) and DTT
• Adjacent channel interference between UMTS base stations and DTT.
9XNA004C | 10

Eight scenarios were considered:
• The Interference Probability as a consequence of the aggregated UMTS UE interference from a UMTS network into victim DVB-T Receivers. Digital television in this scenario was assumed to be received by a fixed Yagi antenna; it is noted that some television reception in the UK is to portable indoor antennas, which was not modelled explicitly in our analysis
• The Interference Probability as a consequence of a single UMTS UE interferer transmitting into victim DVB-H Receivers
• The reduction in UMTS network downlink capacity as a consequence of a DVB-T transmitter broadcasting interference into a network of UMTS UE Receivers
• The reduction in UMTS network downlink capacity as a consequence of a network of DVB-H transmitters broadcasting interference into a network of UMTS UE Receivers
• The impact of UMTS base station interference on DTT reception, in terms of number of users affected
• The impact of UMTS base interference on DVB-H reception, in terms of areas affected by interference above tolerable levels
• The impact of DTT transmitters interfering with UMTS base station receivers located within the same geographic area, in terms of the impact on UMTS network coverage
• The impact of DVB-H transmitters interfering with UMTS base station receivers, in terms of the impact on UMTS network coverage.
Analysis was undertaken using a mixture of measured C/I protection ratios using actual equipment and measurements taken using simulated equipment (where actual equipment was not available in this band), between different candidate uses of the released spectrum. Measurement results were provided by ERA Technologies to Ofcom.
For the remainder of this section, the term ‘guard band’ refers to the frequency offset between the channel edges of the respective services4. Results are summarised as follows:
4 For example, if the DTT carrier bandwidth is 8 MHz and the UMTS carrier bandwidth is 5 MHz, a 0 MHz offset or guard band refers to a frequency separation of 6.5 MHz between centre frequencies. A 5 MHz guard band refers to 11.5 MHz separation between centre frequencies.
9XNA004C | 11

1. Interference from UMTS into DTT: Results suggest that UMTS base stations could interfere with DTT reception, but that suitable mitigation may be applied in the form of careful UMTS base station azimuth setting or other mitigation. We have calculated that UMTS base stations will interfere with some DTT receivers if there is no guard band between the DTT and the UMTS carrier, unless mitigation is applied to mitigate outgoing ACI at the UMTS base station. A smaller number of DTT receivers will still suffer interference with a 5 MHz guard band between the UMTS downlink and DTT channel. Analysis of UMTS BS to DTT ACI using the Crystal Palace area as an example suggests that the level of mitigation (+dB) required to ensure that 100% of DTT users will be interference free is 36.2dB with 0 MHz offset (no guard band) and 20.5 dB with 5 MHz guard band. We also conducted analysis based on DTT coverage around Winter Hill; in this case the mitigation required was 13.5 dB with no guard band. With a 5 MHz guard band, no mitigation was required since all receivers were calculated to be within their operating threshold. The table below illustrates how the level of mitigation varies compared with the percentage of DVB-T receivers free from degraded operation for the Winter Hill example5.
Co Channel 0MHz 5MHz 10MHz100.0% 49.9 13.5 -2.2 -8.399.5% 47.1 10.7 -5.0 -11.199.0% 40.0 3.7 -12.1 -18.295.0% 27.7 -8.7 -24.4 -30.550.0% 7.1 -29.2 -45.0 -51.1
Table 0.1: Level of Mitigation Required (dB) to Achieve % of DVB-T Receivers Free from Adverse Effects of ACI [Source: Mason]
The DTT users that are affected by ACI are those users towards the edge of the DTT transmitter coverage area; this is illustrated by Figure 0.8, showing affected users in an adjacent frequency separated by 5 MHz guard band:
5 Appendix B of the report also illustrates the level of mitigation required in a second example, based at Crystal Palace, which represents a worst case.
9XNA004C | 12

UMTS BS to Ch 30 DVB-T Crystal PalaceMitigation Reqired w ith a 5MHz Guard Band (dB)
0 to 20.6 (15)-16 to 0 (179)-18.4 to -16 (78)-21.2 to -18.4 (78)-23.6 to -21.2 (81)-25.3 to -23.6 (71)-27.5 to -25.3 (88)-29.2 to -27.5 (82)-31.1 to -29.2 (82)-33.1 to -31.1 (78)-34.7 to -33.1 (84)-36.6 to -34.7 (77)-38.6 to -36.6 (81)-41.4 to -38.6 (86)-44.5 to -41.4 (84)-66.2 to -44.5 (86)
Figure 0.8: ACI from UMTS Base Stations into Crystal Palace Channel 30 DVB-T [Source: Mason]
Results suggests that careful antenna azimuth setting or other mitigation at the UMTS base station could achieve the required isolation to avoid outgoing ACI; for example, that if it can be ensured that UMTS base stations more than 20km from DTT transmitters avoid antenna azimuths of 180 degrees from the direction of the DVB-T transmitter, this will mitigate interference into outlying DTT receivers. Where azimuths cannot be set at 180 degrees from the DVB-T transmitter then additional filtering (20dB) could be applied to the UMTS BS to prevent ACI. This will require a guard band of 5MHz or more between the interfering UMTS BS (downlink) channel and the victim DVB-T channel to allow for a filter attenuation slope. This guard band in itself will greatly reduce the occurrences of DVB-T receiver degradation, reducing the number of sites where filters are required.
Interference from UMTS mobiles to DTT is calculated at 10.77% for 0 MHz frequency offset and less than 1% for 3 MHz offset respectively, suggesting that a 3 MHz frequency offset is feasible to minimise interference from UMTS mobiles to DTT receivers. This scenario is, therefore, not considered to be a limiting case in terms of spectrum packaging and band planning.
9XNA004C | 13

2. Interference from DTT into UMTS: Considering the direction of interference being DTT to UMTS, results suggest that DTT transmitters could interfere with both UMTS uplink (base station receivers) and downlink (mobile reception). We have calculated DTT interference to UMTS downlink (mobile receivers) could result in a significant capacity loss to the UMTS cell (20% capacity loss calculated with 3 MHz frequency offset between DTT and UMTS channel edges, when the broadcast interference is at its maximum and coincident with the UMTS wanted signal at its minimum i.e. at the cell edge). Repeating the simulation at 8 MHz offset/guard band still results in a 14% capacity loss, and so still a significant impact. A viable mitigation may be a reduction in UMTS cell size (however this will require an order of magnitude increase in the number of cells deployed).
We have calculated interference from DTT to the UMTS uplink (base station receivers) to result in 44.5 dB mitigation being required with no guard band between channels to ensure 100% of UMTS base station receivers are interference free. With 5 MHz guard band the level of mitigation required falls to 33.3 dB. These results relate to an example analysis assuming the Crystal Palace DTT transmitter. Repeating the analysis for the Winter Hill transmitter gives mitigation figures of 30.8 dB with no guard band, and 19.5 dB with 5 MHz guard band.
3. Interference from UMTS into DVB-H. Statistical simulation of the probability of interference from UMTS mobiles to DVB-H receivers using SEAMCAT results in a probability of interference of less than 1%, due to the random distribution of devices that is generated by the Monte-Carlo simulation. We re-calculated this scenario using a Minimum Coupling Loss and assuming the worst case of a UMTS mobile and a DVB-H device being operated in the same room. In this case we found that the sterilisation distance calculated was 15 metres at an offset of 8 MHz, suggesting that UMTS mobiles will interfere with DVB-H receivers if located in the same building with no frequency offset/guard band.
Modelling of UMTS base station interference to DVB-H receivers using ICS Telecom suggested that base stations could also affect DVB-H reception, depending on the path between the interfering base station and the victim DVB-H receiver. Our results illustrate that when UMTS and DVB-H base stations are co-located, adjacent channel interference from UMTS base stations to DVB-H receivers is not a cause for concern, since in all but the co-channel case, a margin of safety exists preventing ACI. However, although interference to DVB-H receivers is minimised in this case, UMTS base station receivers will suffer interference from the DVB-H transmitter.
When UMTS and DVB-H base stations are not co-located and planned independently of each other, our results illustrate that with no guard band, 66.3 dB mitigation is required to achieve
9XNA004C | 14

100% free interference (37.8dB for 99.5% of devices to be interference free). With a 5 MHz guard band, the mitigation required is 50.6 dB (22.1dB for 99.5% free operation).
Table 0.2 below shows the level of mitigation (+dB) or the margin of safety (-dB) required to achieve the stated percentage of DVB-H receivers free from degraded operation due to ACI from UMTS base stations in the co-channel and in an adjacent channel separated by various guard bands.
Co Channel 0MHz 5MHz 10MHz100.0% 102.7 66.3 50.6 44.599.5% 74.2 37.8 22.1 16.099.0% 69.7 33.3 17.6 11.595.0% 52.2 15.8 0.1 -6.050.0% 26.5 -9.9 -25.6 -31.7
Table 0.2: Level of Mitigation (dB) Required to Achieve % of DVB-H Receivers Free from Adverse Effects of UMTS BS ACI [Source: Mason]
4. Interference from DVB-H into UMTS. Results suggest that DVB-H transmitters could interfere with both UMTS uplink (base station receivers) and downlink (mobile reception). In the case of DVB-H interference to the UMTS uplink (base receivers), if base stations are co-located then the isolation requirement is very high (81.1dB in the worst adjacent channel scenario with no frequency separation, or 69.5dB with 5 MHz guard band). If base stations are not co-located, results show that mitigation is still required at a percentage of UMTS base stations to overcome interference from DVB-H transmitters, if the two networks are not coordinated. The level required depends on the frequency separation between the DVB-H transmitter and the UMTS uplink (base receive) channel. In the worst adjacent channel case with no frequency offset, the isolation requirement is 51.8 dB to overcome interference.
In the case of DVB-H interfering with the UMTS downlink, results suggest around 7% capacity loss to the UMTS network in the urban scenario modelled, due to DVB-H transmitter ACI, for which the only mitigation may be a reduction in UMTS cell size. The effect of this capacity loss on cell numbers has not been calculated. However, increasing the UMTS cell density to mitigate interference to UMTS mobiles could then affect interference created from UMTS base stations to DVB-H receivers. The impact is reduced if an offset greater than 8 MHz between the DVB-H and UMTS channels exists. It is noted that results obtained in DVB-H to UMTS mobile scenario are heavily dependent on assumptions used, in particular the propagation model assumed for the determination of cell sizes of DVB-H and UMTS. Further work may be beneficial in order to review alternative assumptions more fully, particularly for DVB-H. It is also noted that our results illustrate that DVB-H network design
9XNA004C | 15

assumptions can have a significant impact on the predicted UMTS network capacity loss, suggesting that coordination between DVB-H and UMTS operators in practice may be required.
9XNA004C | 16

0.5 Compatibility between IMT FDD and TDD Technologies in Adjacent Channels
We have assessed the impact of different IMT technologies being used in adjacent channels in the UHF cleared spectrum.
Results suggest that, without the application of interference mitigation measures at base stations, co-existence between IMT FDD and TDD technologies is not feasible at frequency offsets up to 15 MHz between respective carrier frequencies. Applying mitigation at the base station suggests that interference reduces in all cases, other than a 5 MHz offset (i.e. adjacent channel operation). Beyond 5 MHz offset, mitigation techniques, such as filtering, are practical, which will reduce the interference impact other than in the co-sited case, suggesting that IMT FDD and TDD systems should not be co-located on the same mast.
Although suitable interference mitigation techniques can be applied at the base stations of FDD and TDD systems, interference still exists between mobiles since mitigation (other than power control); it is not practical in consumer mobile handsets. The results of our analysis suggest that interference will be noticeable when the distance between mobiles is small (less than 10 metres).
9XNA004C | 17

CONTENTS
0. Executive Summary ...................................................................................................................................... 2
0.1 Background ......................................................................................................................................... 2 0.2 Impact of International Interference on IMT Networks....................................................................... 4 0.3 Compatibility between IMT Systems and Alternative Uses of UHF Cleared Spectrum ................... 10 0.4 Compatibility between IMT FDD and TDD Technologies in Adjacent Channels ............................ 17
1. Introduction................................................................................................................................................. 19
1.1 Background ....................................................................................................................................... 19 1.2 Objectives and Approach to Work .................................................................................................... 22 1.3 Structure of Document....................................................................................................................... 23
2. Service and Market Issues........................................................................................................................... 25
2.1 Introduction ....................................................................................................................................... 25 2.2 Use of UHF Spectrum for Mobile/Broadband Services .................................................................... 27 2.3 Usage Scenarios................................................................................................................................. 30
3. Mobile Services in Digital Dividend Spectrum and the Impact of European Harmonisation..................... 31
3.1 Harmonised Band Plan Options for Mobile Use of Released Spectrum ........................................... 32 3.2 TG4 Band Plan Options and Applicability with UK Released Spectrum.......................................... 33 3.3 Link Budgets for Lower and Upper Cleared Spectrum ..................................................................... 35 3.4 The Findings of ECC TG4................................................................................................................. 37
4. Impact of International Interference on IMT Networks .............................................................................. 38
4.1 Introduction ....................................................................................................................................... 38 4.2 Scope ................................................................................................................................................. 39 4.3 Modelling Approach.......................................................................................................................... 39 4.4 Impact of the GE 06 Plan on Use of Released Spectrum for Services other than Broadcasting........ 40 4.5 Mitigation of Incoming Interference to and from IMT Systems........................................................ 42 4.6 Percentage of UK Land Area and Population Affected by Incoming Interference............................ 47 4.7 Impact of Interference on IMT Site count ......................................................................................... 53 4.8 Sensitivity Analysis ........................................................................................................................... 58
5. Adjacent Channel Interference Between IMT Networks and other Services in the UHF Spectrum........... 62
5.1 Introduction ....................................................................................................................................... 62 5.2 Adjacent Channel Interference Scenarios under Consideration ........................................................ 63 5.3 Discussion of Approach..................................................................................................................... 64 5.4 Approach to Seamcat Simulation ...................................................................................................... 65 5.5 Approach to ICS Telecom Simulation............................................................................................... 66 5.6 Summary of Results .......................................................................................................................... 68
6. Mobile Broadband Technologies: FDD/TDD Compatibility when Deployed in UHF Spectrum............... 74
6.1 Introduction ....................................................................................................................................... 74 6.2 FDD/TDD Co-Existence ................................................................................................................... 74 6.3 Discussion of Results ........................................................................................................................ 85
7. Conclusions and Recommendations............................................................................................................ 86
9XNA004C | 18

1. Introduction
This report summarises a subset of work undertaken by Mason Communications (Mason) on behalf of the Office of Communications (Ofcom) within a larger project concerned with technical issues associated with the spectrum released by digital switchover (DSO) in the UK.
This report concerns issues associated with use of released spectrum for two-way mobile broadband (voice and data) services, reporting on work undertaken over a three-month period from May to August 2007.
1.1 Background
Currently, spectrum in the band 470-862 MHz is used for transmission of terrestrial analogue television services in the UK. At present, UK digital television transmission operates on an interleaved basis with analogue services, however the progressive switch-off of analogue services is now underway.
Preparation for digital switchover in the UK is well advanced, and we will see the withdrawal of the final analogue services by the end of 2012.
The migration from analogue to digital technology offers at least a six-fold improvement in efficiency, hence, the planned switch-off of analogue services between 2007 and 2012 will release spectrum currently used for television transmission that might be used for other services. This released spectrum, which is generally called the ‘Digital Dividend’, will be released on a regional basis, as analogue transmission is switched off in different regions of the UK.
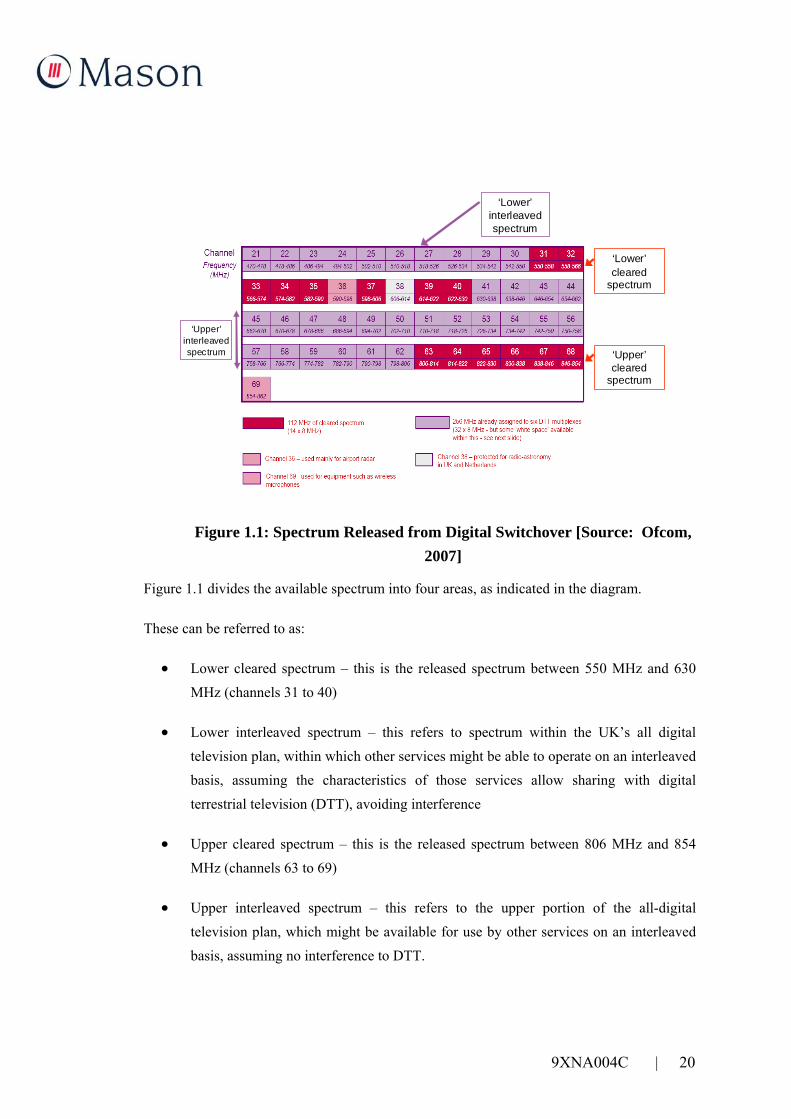
The UK’s future, all-digital TV network has been planned in UHF channels 21-30 (470-550 MHz) and 41-62 (630-806 MHz). Spectrum released from DSO in the UK will be from channels 31-40 and 63-68, which equates to 112 MHz bandwidth of cleared spectrum. Channel 36 is currently used for airport radars. Channel 38 is used by radio astronomy from UK observatories, and channel 69 is used for radio microphones for programme making and special events (PMSE), including Services Ancillary to Programme Making/Broadcasting (SAP/SAB).
The released spectrum is divided into two blocks (upper and lower) within the UHF band, and is illustrated in Figure 1.1.
9XNA004C | 19
‘Lower’ cleared
spectrum
‘Upper’ cleared
spectrum
‘Lower’ interleaved spectrum
‘Upper’ interleaved spectrum
Figure 1.1: Spectrum Released from Digital Switchover [Source: Ofcom, 2007]
Figure 1.1 divides the available spectrum into four areas, as indicated in the diagram.
These can be referred to as:
• Lower cleared spectrum – this is the released spectrum between 550 MHz and 630 MHz (channels 31 to 40)
• Lower interleaved spectrum – this refers to spectrum within the UK’s all digital television plan, within which other services might be able to operate on an interleaved basis, assuming the characteristics of those services allow sharing with digital terrestrial television (DTT), avoiding interference
• Upper cleared spectrum – this is the released spectrum between 806 MHz and 854 MHz (channels 63 to 69)
• Upper interleaved spectrum – this refers to the upper portion of the all-digital television plan, which might be available for use by other services on an interleaved basis, assuming no interference to DTT.
9XNA004C | 20

Ofcom’s initial proposals for the award of digital dividend spectrum were set out in a consultation document issued in December 20076. This consultation document was informed by the results of a previous study conducted for Ofcom by Analysys Consulting Limited, Aegis Systems Limited, Mason Communications Limited and DotEcon Limited, which considered the market demand for spectrum that the DSO process will release, and how this spectrum might be released to the market.
The previous study identified potential future uses of the spectrum to be wide ranging, including:
• Further Digital Terrestrial Television (DVB-T), including High Definition (HDTV)
• Mobile Multimedia (e.g. DVB-H or MediaFLO)
• Broadband Wireless Access (e.g. WiMAX)
• Mobile voice and data services (2G or 3G)
• PMSE (radio microphones).
Following the initial consultation, Ofcom received a large number of responses from industry. Based on responses received, it has been determined that further analysis is required in order to consider detailed spectrum planning and interference issues associated with the use of UHF released spectrum for different candidate services, such as those indicated above. Particular issues relate to use of released spectrum for mobile services, since those services will incorporate two-way transmission (i.e. uplink and downlink), which will need to be coordinated with broadcasting (i.e. downlink only) services.
With this in mind, Ofcom commissioned a series of technical studies in May 2007, concerned with issues associated with use of released spectrum from the DDR for different candidate services. The overall objective of the different studies is to undertake analysis to support determination of technical conditions for different services to co-exist in UHF released spectrum, and the implications in terms of new service deployment and planning of the released spectrum.
This report addresses one aspect of this work, which is to consider issues associated with use of UHF released spectrum for the provision of two-way mobile voice and data services.
6 See http://www.ofcom.org.uk/consult/condocs/ddr/
9XNA004C | 21

1.2 Objectives and Approach to Work
Ofcom’s proposed approach to releasing the digital dividend spectrum is to impose as few constraints as possible on how the spectrum can be used, and to give as much flexibility to the market/spectrum users to decide on the most appropriate use, consistent with users’ business plans and objectives.
Ofcom’s consultation with key UK stakeholders has suggested that there could be substantial value to the UK to be gained from use of UHF spectrum for two-way mobile services. However, such use could generate a number of interference and compatibility issues, both with digital terrestrial television (DTT) services and with other new services that might operate in adjacent channels within the released spectrum.
With this in mind, Ofcom commissioned a specific work package concerning UHF mobile voice and data/IMT issues, upon which this report is based. IMT is the name given to International Mobile Telecommunications, the ITU’s family of advanced mobile systems, incorporating 3G technologies and evolutions of those technologies. There are a number of alternative standards within the IMT family, of which UMTS (or wideband CDMA (WCDMA), as standardised by 3GPP and deployed by UK 3G operators) is one.
Whilst the analysis in this report relates to IMT networks and UMTS systems in particular, this is not intended to preclude the introduction of other advanced mobile technologies in UHF released spectrum.
The underlying objective of the overall programme of work on digital dividend spectrum is to provide evidence to assist Ofcom in its decisions on the optimum framework for releasing the available spectrum, in a way that will maximise benefits for consumers and the economy.
The scope of the mobile services work package has specifically been to:
• Define service parameters for IMT networks deployed in UHF, including equipment assumptions and target services
• Assess interference issues affecting IMT network deployment, such as international interference (incoming and outgoing), the potential for adjacent channel interference between IMT and other candidate uses of the released spectrum, and options for interference mitigation within an IMT network
9XNA004C | 22

• Assess impact of interference on IMT network planning, including indicative site numbers for different deployment scenarios, and how this might be affected by interference predicted in different parts of the UHF band
• Consider how interference constraints influence the determination of appropriate licence conditions for mobile services in UHF.
1.3 Structure of Document
The remainder of this document is structured as follows:
• Section 2 considers service and market issues associated with IMT use of UHF spectrum, including what the spectrum might be used for, and the implications of this in terms of band planning and equipment performance assumptions
• Section 3 considers the implications of international interference on IMT network planning; this is co-channel interference between the UK and neighbouring countries (France, Ireland, Belgium and Holland) consistent with ITU co-ordination requirements
• Section 4 considers adjacent-channel interference between IMT and other candidate services and technologies that might use the UHF released spectrum in the UK
• Section 5 discusses implications of the interference analysis on Ofcom’s policy towards spectrum packaging and usage rights for the UHF released spectrum
• Section 6 presents summary and conclusions from the IMT work package, and how these relate to the wider DDR technical studies.
A number of supporting annexes, listed below, provide additional detail on the issues discussed in this report:
• Appendix A provides details of our assessment of the impact of interference from digital television services in neighbouring countries on IMT network planning in the UK
• Appendix B provides details of our assessment of the adjacent band compatibility issues between IMT and other candidate uses of the digital dividend spectrum
9XNA004C | 23
• Appendix C provides a comparison of use of alternative available propagation models for our radio planning work, supporting the eventual assumptions used
• Appendix D lists link budgets for UMTS developed for this study and used throughout our analysis.
9XNA004C | 24

2. Service and Market Issues
2.1 Introduction
Responses to Ofcom’s consultation on proposals for award of the digital dividend spectrum in December 2006 make clear that two-way mobile services could provide substantial value to the UK economy, if sufficient clarity can be given on the available spectrum and the associated technical constraints.
The main reason that the digital dividend spectrum is considered to be attractive for the provision of mobile and broadband wireless services is due to the propagation conditions in the UHF band, which are favourable compared with other (higher) frequency bands available for similar services. The expected UHF signal propagation performance, compared to existing 2100 MHz 3G spectrum, is illustrated by the plots in Figure 2.1 and Figure 2.2, which illustrate a comparison of UMTS coverage predicted from three sites in the centre of London. The predictions have been performed using the ATDI ICS Telecom tool, and illustrate signal levels sufficient to provide outdoor coverage (in blue) and indoor coverage (in red).
Figure 2.1: 800 MHz UMTS Coverage [Source: Mason]
9XNA004C | 25

Figure 2.2: 2 GHz UMTS Coverage [Source: Mason]
As a result of the better signal propagation performance at UHF, digital dividend spectrum could be one of the more cost-effective means of delivering mobile telephony services in rural areas, for instance. Lower propagation losses could also result in increased network capacity being achievable for a given transmitted power per cell, which could result in a number of benefits, including increased data rate, as seen by users of that cell. The improvement in the penetration of UHF signals in buildings may also be attractive to provide a greater depth of coverage of mobile and broadband services in urban areas. Providing better in-building coverage could be particularly relevant to provision of mobile broadband services in homes and offices for instance.
Ofcom estimates that there are at least 7 million 3G subscribers in the UK, and the number has grown at a rate of around 65% in the two years to December 20067. There are currently five 3G networks operating in the UK; the population covered by each network varies. It is likely that access to lower frequency spectrum could be a key determinant of the extent and rate at which coverage will be extended in future, given the advantages gained from the use of lower frequencies, as described above. Whilst there are a number of reasons why 3G-coverage is not available in some areas of the UK, particular technical challenges that exist include providing coverage over hilly or rural terrain, whilst commercial barriers include very low population density in some areas, where the cost of installing and commissioning a base station can significantly outweigh incremental revenues gained.
7 Source: Ofcom Communications Market Report 2006
9XNA004C | 26

Responses to Ofcom’s consultation suggest that industry interest in the use of digital dividend spectrum for mobile and broadband services is particularly directed at scenarios such as:
• Extension of 3G and mobile broadband services into rural areas (areas beyond those already served by 3G networks, e.g. the last 10 – 20 % of the UK population)
• Providing new advanced mobile networks, providing new applications
• Improvements in the quality of mobile broadband services to businesses and homes; so, for example, higher data rate services, with good coverage inside buildings, could be deployed, particularly in main population areas in the UK.
2.2 Use of UHF Spectrum for Mobile/Broadband Services
Although it is recognised the use of digital dividend spectrum for mobile services could bring value to UK consumers, through improved quality of mobile broadband services, and possible delivery of new services, it is also recognised that introduction of mobile services within spectrum planned for broadcasting services introduces a number of technical issues.
Issues concerned with mobile use of released spectrum include:
• Planning for the operation of two-way services, i.e. uplink and downlink, in spectrum that is planned for broadcast (i.e. one way) service, which introduces additional possible modes of interference between up and down links
• The fact that mobile telephony could require spectrum that is paired; paired spectrum requiring two channels separated by a fixed amount (so-called duplex spacing)8, which requires careful consideration of band planning within released spectrum to make sure that plans are suitable for mobile use. It is noted that either paired or unpaired spectrum could be required for mobile broadband services, depending on the technology deployed. Ofcom’s intention is to be flexible in this respect, and so band plans need to allow for either option
8 It is noted that future technologies might not require fixed duplex spacing, and may operate with variable up/down link spacing.
9XNA004C | 27

• The importance of frequency harmonisation for mobile services. Views from industry are that frequencies for mobile applications need to be available across a large market in order to benefit from harmonised equipment design and availability of a wide range of terminals, which motivates planning of released spectrum in the UK to align with any European harmonisation measures with respect to mobile services. Section 3 of this report considers European harmonisation in more detail in relation to the work of ECC Task Group 4, who has been considering mobile use of digital dividend spectrum within the CEPT.
• The potential for interference from broadcasting services operating in neighbouring countries to mobile services in the UK (e.g. if spectrum used for mobile services in the UK is used for broadcast transmission in France, Belgium, Holland or Ireland for instance), creating cross border interference that may require specific system engineering measures to be deployed to systems to operate in the presence of incoming interference.
The purpose of this study has been to provide technical inputs required by Ofcom in the determination of policy associated with packaging and release of digital dividend spectrum. These issues fall principally into two areas; the technical impact international of obligations associated with coordination between UK use of the UHF band and that of neighbouring countries, and the impact of adjacent channel interference between different candidate uses of the cleared spectrum. This might impact required frequency separation between different candidate uses and consequential spectrum packaging and usage conditions that Ofcom might propose.
Cognisant that the various issues identified above cannot be considered in isolation of developments in other European countries on use of digital dividend spectrum, Ofcom has contributed to the ongoing work within the European Communications Committee (ECC) Task Group 4, concerned with system compatibility and other spectrum planning issues associated with use of UHF released spectrum for two-way mobile services. Ofcom has used aspects of work described in this report in contributions to the TG4 work, in order to influence decisions made by that group.
Four contributions were provided to ECC TG4 based on the work conducted within this study:
• TG4 (07) 051, UK digital dividend status and studies on two way mobile band plans (TG4, Copenhagen, May 2007 meeting)
9XNA004C | 28
• TG4 (07) 073, Comparison of TG4 band plan options (TG4, Antalya June 2007 meeting)
• TG4 (07) 077, Monte Carlo simulations of interference to DVB-T receivers from mobile uplinks (TG4, Antalya June 2007 meeting)
• TG4 (07) 083, Planning mobile networks in UHF spectrum (TG4, Antalya June 2007 meeting).
Throughout the analysis in this report, and in input papers to TG4, a consistent set of usage scenarios have been assumed. These are described in the following section.
9XNA004C | 29
2.3 Usage Scenarios
In order to assess the potential for co-channel (cross border) and adjacent channel (inter service) interference between IMT and other candidate uses of the digital dividend spectrum, it has been necessary to make a number of assumptions on the type of mobile broadband network that might be deployed in UHF spectrum.
Based on discussions with Ofcom, the following usage assumptions were agreed:
• Ofcom’s intention is not to prescribe particular technologies that will use released spectrum, but rather to leave this choice flexible for market decisions. As such, technologies using either paired or unpaired spectrum could be envisaged. For the purposes of analysis within this study, we have based modelling on two alternative IMT systems; UMTS FDD as standardised by 3GPP and mobile WiMAX (802.16e) as standardised by the IEEE and the WiMAX Forum. Results of assessment of interference between WiMAX and other services has been conducted by Aegis Systems and is reported separately; this report focuses on assessment based on UMTS FDD networks
• Mobile broadband coverage is taken to be delivery of an appropriate set of broadband data services as well as voice, and so link budget parameters have been defined to reflect a 384 kbit/s downlink data service
• Since the digital dividend released spectrum could potentially be attractive for new entrant operators to roll out new services, as well as for existing 3G or broadband operators to extend their current network coverage, three alternative coverage targets have been considered in the assessment of IMT network planning requirements:
♦ A new operator using DDR to provide good coverage to 80% or more of the population (which may require multiple UHF channels)
♦ An existing 2G/3G operator using DDR to provide deeper indoor coverage in complement to an existing network, e.g. at 1800 MHz or above
♦ An existing operator using DDR to extend coverage beyond 80-90% of population.
It is noted that the coverage targets described above are consistent with coverage targets included in various Ofcom contributions to the recent work of ECC Task Group 4, in its consideration of use of UHF released spectrum for two-way mobile services. Task Group 4 conducted the majority of its work on two-way mobile services at the same time as Mason was conducting this study for Ofcom, and so a number of contributions from Ofcom TG4 were based on the findings and results of Mason’s study, as described in this report.
9XNA004C | 30

3. Mobile Services in Digital Dividend Spectrum and the Impact of European Harmonisation
At the same time as Ofcom has been considering the best way to make available digital dividend spectrum in the UK, other European regulators have also been considering similar issues. Spectrum harmonisation across Europe has been an important factor in the success of 2G and 3G services, contributing to the variety of handsets and services available to consumers, and facilitating benefits such as roaming between UK networks and those in other countries.
Views from industry in response to Ofcom’s consultation on digital dividend released spectrum suggest that the industry places considerable importance on frequencies for mobile applications being available across a larger market, including the UK, in order to benefit from harmonisation in terms of handset and base station design and manufacture. This motivates planning of released spectrum in the UK to align with any European harmonisation measures with respect to mobile services in digital dividend spectrum.
ECC Task Group 4 (ECC TG4) is the group that has been tasked within the ECC consider technical issues associated with mobile use of digital dividend spectrum and, in particular, to consider the technical implications of two-way mobile services operating in spectrum adjacent to broadcasting networks, and the implications of this on planning of released spectrum. ECC TG4 was tasked earlier this year to consider, in part, if it would be feasible for a harmonised sub-band of frequencies to be identified within the digital dividend spectrum across Europe for mobile use on a non-mandatory, non-exclusive basis, and, if so, under what conditions.
TG4’s analysis is complicated by the fact that different countries in Europe will release digital dividend spectrum from different parts of the UHF band, depending on national digital television rollout plans, and consistent with their DTT entries in the ITU Geneva 2006 digital television plan.
Whilst the TG4 committee is still active at the time of producing this report, and a number of work items remain in progress, the majority of its work on the feasibility of identifying a harmonised sub band for mobile use of digital dividend spectrum was conducted between April and June 2007, coincident with Mason’s study of IMT issues for Ofcom. With this in mind, Ofcom were active contributors to the TG4 work during this period, and a number of
9XNA004C | 31

TG4 contributions made by Ofcom reflect aspects of Mason’s study as reported in this document9.
3.1 Harmonised Band Plan Options for Mobile Use of Released Spectrum
Ofcom’s contributions to TG4 supported a no-mandatory harmonised sub-band being identified for mobile use of released spectrum. Non-mandatory harmonisation was supported on the basis that individual countries should be free to implement ECC recommendations in a flexible manner, in order to accommodate specific national requirements. Ofcom’s contributions to TG4 supported non-mandatory harmonisation, assuming that:
• Any new services should provide adequate protection to the DTT services, consistent with our stated position on the relevant service levels
• Incorporation of two-way fixed/mobile broadband services could provide substantial value to the UK economy if sufficient clarity can be given on the available spectrum and the associated technical constraints. This is likely to lead to significant benefits for consumers and citizens
• A harmonised sub-band could be made available on a non-mandatory, non-exclusive basis for two-way fixed/mobile applications in the UK, consistent with, but not limited by, the UK cleared spectrum
• A common approach is required across multiple countries to achieve economies of scale for manufacturers, but it may not necessarily require harmonisation across the whole of the EU
• Sharing of the band between mobile and broadcasting services is feasible, subject to agreement of appropriate technical parameters, without unduly affecting the provision of committed broadcasting services
• Two-way fixed/mobile networks can operate efficiently in this band, subject to the use of appropriate design techniques, and the extent to which a minimal set of bilateral agreements can be achieved within the framework of RRC06
• Segments B (channels 31 to 44) and D (channels 58 to 69) are the most likely candidates, from the UK perspective, for non-mandatory harmonisation of two-way fixed/mobile applications, since they align with the UK’s cleared spectrum. Segment
9 Document references TG4 (07) 51, TG4 (07) 73, TG4 (07) 77 and TG4 (07) 83
9XNA004C | 32

D has the further benefit of proximity to 900 MHz and reduced interference constraints, while segment B offers more bandwidth. Both options should be investigated in further detail. The balance of usage between paired and unpaired spectrum should be kept open.
Results of work described in this report provide analysis on a number of the points listed above, specifically the feasibility of band sharing between mobile and broadcasting services. Our work has also demonstrated that a range of band plan options is feasible within the UK’s released spectrum. Example options are described in the next section.
3.2 TG4 Band Plan Options and Applicability with UK Released Spectrum
The May 2007 meeting of TG4 resulted in a number of ‘preferred’ segments for mobile use being identified within the UHF band, as summarised in Table 3.1.
Segment Lowest Channel Highest Channel
A 21 32
B 31 44
C 45 58
D 58 69
Table 3.1: TG4 Band Plans – Preferred Segments
From the UK perspective, Segments A and C are not preferred, since these largely consist of channels forming part of the UK’s digital television rollout plans, which are now well advanced. Segments B and D were, therefore, identified as preferred options from the UK’s perspective, consistent with lower and upper cleared channels being released in the UK.
Mason developed a series of illustrations of possible band plan options within Segments B and D, consistent with the UK’s released spectrum. These are shown in Figure 3.1 and Figure 3.2 below.
9XNA004C | 33

Figure 3.1: Band Plan Options for Mobile Operation – Segment B/UK Lower Released Spectrum
PMSE Proposed
Figure 3.2: Band Plan Options for Mobile Operation – Segment D/UK Upper Cleared Spectrum
It is noted that a number of the options suggested above refer to a ‘reverse duplex’ arrangement, compared to conventional mobile band pairing. In other cellular mobile spectrum used for FDD systems, such as at 900 MHz, 1800 MHz and 2100 MHz, the convention has been to located uplinks (i.e. mobile transmit/base station receive) in a FDD band plan in the lower frequency pair, and downlinks (i.e. base station transmit/mobile receive) in the upper frequency pair. The reason for this is generally due to network planning considerations, where it is beneficial for mobile uplinks, which are constrained by the transmitted power of a mobile device, to be located in the lower frequency pair, so as to
9XNA004C | 34

benefit from slightly improved propagation conditions, and thereby enable link budget balancing between paired channels.
In the case of UHF released spectrum, however, it has been noted that it may be beneficial to locate uplinks in the upper frequency pair, to maximise compatibility with DTT systems operating in nearby spectrum. The relevance of this assumption is considered later in this report, when we consider the limiting cases of adjacent channel interference, and whether up or downlink interference dominates our concern.
In the remainder of this report, we have considered interference and compatibility issues with respect to both lower and upper cleared channels, consistent with possible paired and unpaired band plans illustrated above.
3.3 Link Budgets for Lower and Upper Cleared Spectrum
One key discussion topic within the ECC TG4 meeting has been the derivation of mobile link budgets for UHF spectrum, taking account of different propagation characteristics in upper and lower channels within the band.
As noted elsewhere in this report, the UHF spectrum has generally better propagation characteristics than higher frequencies used for mobile systems, such as 2.1 GHz, enabling signals to travel further or to better penetrate buildings. This could offer significant advantage to the rollout of mobile services in rural areas, and/or to provide a greater depth of in-building coverage. However, the better propagation characteristics at UHF are somewhat offset by other losses that occur at UHF frequencies – such as decreases in handset antenna gain. However, this is more that compensated for by the improved propagation. The wide bandwidth of the UHF band (spanning 470 MHz to 862 MHz) also means that signal losses vary across the band – achievable handset antenna gain is lower for the spectrum at the lower end of the UHF range, compared to the upper end. Correspondingly, body loss is higher at the upper end of the range compared to the lower range. These, and other issues associated with the UHF link budget for mobile systems were also considered within TG4 and contributions to those discussions were made by Ofcom based on the considerations presented in this report (See Appendix C for a comparison of link budget values for lower and upper cleared spectrum as developed within this study).
Ofcom made an initial contribution on UHF link budget parameters to the May 2007 meeting of TG4. At that time, this study was in the initial stages and so parameters were preliminary, which were subsequently validated later in the study. The final link budget values used in the study differ in a number of areas compared to the May 2007 TG4 contribution.
9XNA004C | 35
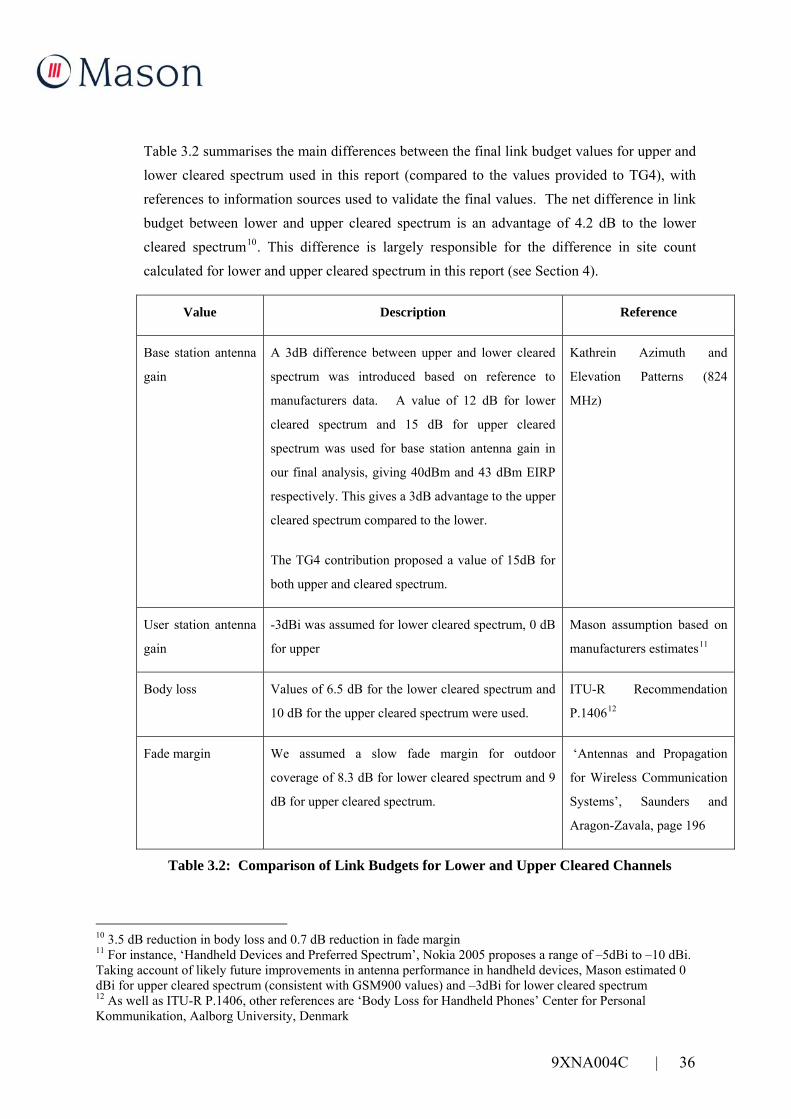
Table 3.2 summarises the main differences between the final link budget values for upper and lower cleared spectrum used in this report (compared to the values provided to TG4), with references to information sources used to validate the final values. The net difference in link budget between lower and upper cleared spectrum is an advantage of 4.2 dB to the lower cleared spectrum10. This difference is largely responsible for the difference in site count calculated for lower and upper cleared spectrum in this report (see Section 4).
Value Description Reference
Base station antenna
gain
A 3dB difference between upper and lower cleared
spectrum was introduced based on reference to
manufacturers data. A value of 12 dB for lower
cleared spectrum and 15 dB for upper cleared
spectrum was used for base station antenna gain in
our final analysis, giving 40dBm and 43 dBm EIRP
respectively. This gives a 3dB advantage to the upper
cleared spectrum compared to the lower.
The TG4 contribution proposed a value of 15dB for
both upper and cleared spectrum.
Kathrein Azimuth and
Elevation Patterns (824
MHz)
User station antenna
gain
-3dBi was assumed for lower cleared spectrum, 0 dB
for upper
Mason assumption based on
manufacturers estimates11
Body loss Values of 6.5 dB for the lower cleared spectrum and
10 dB for the upper cleared spectrum were used.
ITU-R Recommendation
P.140612
Fade margin We assumed a slow fade margin for outdoor
coverage of 8.3 dB for lower cleared spectrum and 9
dB for upper cleared spectrum.
‘Antennas and Propagation
for Wireless Communication
Systems’, Saunders and
Aragon-Zavala, page 196
Table 3.2: Comparison of Link Budgets for Lower and Upper Cleared Channels
10 3.5 dB reduction in body loss and 0.7 dB reduction in fade margin 11 For instance, ‘Handheld Devices and Preferred Spectrum’, Nokia 2005 proposes a range of –5dBi to –10 dBi. Taking account of likely future improvements in antenna performance in handheld devices, Mason estimated 0 dBi for upper cleared spectrum (consistent with GSM900 values) and –3dBi for lower cleared spectrum 12 As well as ITU-R P.1406, other references are ‘Body Loss for Handheld Phones’ Center for Personal Kommunikation, Aalborg University, Denmark
9XNA004C | 36

3.4 The Findings of ECC TG4
Following extensive discussion and analysis, a preference emerged within TG4 for spectrum at the upper end of the UHF band, from 798 MHz to 862 MHz (channels 62 to 69) to be identified as potential spectrum for mobile use, as illustrated in Figure 3.3.
UHF Band
470 MHz 862 MHz
UK use after switchover:
Digital TVClearedDigital TV Cleared
European proposal for non mandatory harmonised mobile sub-band:
Digital TVClearedPossible harmonised mobile useOther uses
470 MHz 550 MHz 630 MHz 806 MHz 862 MHz
470 MHz 798 MHz 862 MHz
UHF Band
470 MHz 862 MHz
UK use after switchover:
Digital TVClearedDigital TV Cleared
European proposal for non mandatory harmonised mobile sub-band:
Digital TVClearedPossible harmonised mobile useOther uses
470 MHz 550 MHz 630 MHz 806 MHz 862 MHz
470 MHz 798 MHz 862 MHz
Figure 3.3: TG4 Decision on a Harmonised Sub-Band for Mobile
This preference emerged for a number of reasons:
• Proximity to existing GSM 900 spectrum, offering the potential to re-use existing components and systems
• Sufficient bandwidth to accommodate a range of alternative spectrum arrangements (e.g. paired and unpaired)
• Consideration of compatibility issues with adjacent services.
Whilst TG4’s decision is likely to be non-mandatory if implemented through an ECC Decision, it is nevertheless an important milestone in the planning of mobile use of digital dividend spectrum. It also does not preclude the implementation of mobile services elsewhere in the UHF band, but it is noted that there are benefits to harmonising mobile spectrum arrangements across Europe (such as handset roaming, economies of scale), which make the TG4 decision significant.
9XNA004C | 37

4. Impact of International Interference on IMT Networks
4.1 Introduction
As described in the introduction to this report, preparation for digital switchover in the UK is well advanced, and by 2012 final analogue services will be withdrawn. This will release 112 MHz of spectrum in the UHF band for new uses, plus potential additional interleaved spectrum within the UHF channels retained for DTT services. It will be a requirement that any new services deployed either in released spectrum, or interleaved spectrum should provide adequate protection to the planned DTT services, consistent with the UK’s international obligations through the ITU.
The framework for the international coordination of broadcasting services is the Final Acts of the Regional Radiocommunications Conference (RRC) for planning of the digital terrestrial broadcasting services in parts of Regions 1 and 3, in the frequency bands 174-230 MHz and 470-862 MHz (RRC-06 or GE 06).
The GE 06 agreement details transmitter parameters with respect to each country in the plan, along with associated coordination requirements. In addition to the GE 06 agreement, Ofcom has also negotiated specific bilateral agreements applying between the UK and its neighbours (France, Belgium, Holland and Ireland) that in some cases specify agreed variations to coordination requirements for specific sites, as agreed between the two countries.
Mason has undertaken a separate work package for Ofcom as part of the DDR programme of work, the purpose of which was to complete an interference analysis for each channel in the cleared spectrum, using the GE 06 plan in combination with bilateral agreements, and provide maps of expected GE 06 outgoing and incoming interference field strength levels. The full details and results of this work package are reported in a separate document, Digital Dividend Study International Interference Assessment [Mason, July 2007].
Whilst it is anticipated that the UHF spectrum will give better signal propagation performance than higher frequency bands for mobile broadband services, the presence of incoming international interference will have some impact on the design of UHF mobile networks, namely an increasing site count or requirement for specific site engineering measures at base stations such as antenna tilt.
9XNA004C | 38

This section describes the results of a subset of work undertaken on issues associated with mobile (IMT) network planning in digital dividend spectrum, in the presence of incoming DTT interference from neighbouring countries. In this section, we analyse the impact of international interference on IMT network coverage planning and specifically the impact on site count, when compared to a UMTS network built using UHF spectrum without interference. Full results of predictions of incoming and outgoing international interference to and from the UK in accordance with the GE 06 plan are described in the report Digital Dividend Study International Interference Assessment [Mason, July 2007].
The results of the analysis presented in this section illustrate that UHF spectrum, even with interference, can still achieve site numbers that compare favourably to a 2 GHz or other higher frequency band mobile network deployment.
In this section we provide an overview of the results of our analysis; for further details of the assumptions and methodologies used, please refer to Appendix A.
4.2 Scope
The objective of our analysis presented in this section has been to advise on:
• Population coverage and site count of a UHF UMTS network to achieve alternative coverage targets (defined in Section 2)
• Impact of incoming interference on population coverage and site count, for a number of alternative candidate band plans suitable for mobile use of digital dividend spectrum
• Scope for site engineering measures to mitigate interference.
4.3 Modelling Approach
ICS Telecom 8.2.3 was first used to predict imported and exported interference as per the GE 06 assignments or allotments, adjusted to comply with international bilateral agreements between the UK and neighbouring countries.
The results of this stage of work are described in a separate Mason report to Ofcom, ‘Digital Dividend Study International Interference Assessment’.
9XNA004C | 39

ICS Telecom was then used to predict sites required in a UHF UMTS network to achieve different target coverage levels across different UK deployment areas (urban, suburban, and rural).
Office of National Statistics urban and rural areas definitions13 were used to characterise the UK geography into different morphology environments shown in the table below. These results were then combined with the ICS Telecom coverage results to determine the number of UMTS cells required to achieve UK-wide coverage, compared to alternative coverage targets as defined in Section 2.3.
MorphologyONS Morphology Class Okamura-Hata
Class Area (km 2 ) 1 Area % Population Population % Cell Efficiency 2
Village, Hamlet & Isolated Dwellings Rural 162,376 66.7% 6,243,819 10.4% 70%Town and Fringe Suburban 28,048 11.5% 5,392,763 9.0% 65%Urban > 10k populaton Urban 53,095 21.8% 48,572,918 80.7% 60%TOTAL 243,520 100% 60,209,501 100.0% -1 Excludes lakes and forest2 Cell Efficiency: allowance for cell overlap, site acquisition compromise, fragmentation of required coverage etc.
Table 4.1: UK Morphology
Link budgets for UMTS urban and rural, voice and data, services were developed (see Appendix C). The level of incoming interference arriving at different locations in the UK was then determined using the results of the international interference assessment. This was then compared with the maximum interference threshold of the base station and the resulting change translated in an effective reduced cell range, which then varied the number of cell sites predicted.
Within the radio planning exercise, Ofcom identified that the potential for mitigating interference at a UMTS base station should be investigated. Various mitigation techniques were considered, which are described in the next section.
4.4 Impact of the GE 06 Plan on Use of Released Spectrum for Services other than Broadcasting
Entries in the GE 06 plan, along with associated bilateral agreements that Ofcom has developed with regulators in neighbouring countries effectively set a range of interference thresholds (incoming and outgoing) for each channel in the band 470-862 MHz. Incoming levels refer to the level of interference that has to be accepted by services deployed in the UK and outgoing levels refer to the maximum level of interference that UK services can generate, measured at the border of neighbouring countries. Thresholds have been developed with
13 ONS, Census, Key Statistics for urban and rural areas
9XNA004C | 40

digital television transmission in mind, such that the levels of interference that the plan can tolerate are consistent with receiver protection requirements of a digital television service.
Mobile systems have different protection requirements due to their differing technical and service characteristics, and so there is a requirement to consider the impact of incoming and outgoing interference specifically on mobile networks, and in particular the constraints that might apply on network deployment to meet the agreed conditions in the GE 06 plan.
Analysis of incoming and outgoing interference, per channel in the released spectrum is presented in a separate Mason report to Ofcom.
Our analysis of the impact of incoming and outgoing interference thresholds concludes that the limiting case for UHF mobile network deployment in the UK will be accepting incoming interference from digital television transmissions in neighbouring countries, rather than in meeting the outgoing interference limits, in the majority of the UK released channels. The exception to this is channels 36, 38 and 69, which are not planned for broadcasting in the GE-06 plan due to other uses, for which there might be some constraints on outgoing interference. Our analysis suggests that a mobile network should reasonably meet outgoing interference limits as defined for broadcasting services in the GE06 plan, since they have been designed with broadcasting systems in mind, which generally operate with higher transmission powers than a mobile system.
A separate Mason report to Ofcom, ‘Digital Dividend Study International Interference Assessment’, provides maps showing incoming and outgoing interference levels for channels across the released spectrum. These maps have been plotted using ICS Telecom and illustrate interfering field strength. The interference level is predicted at 1% of time, which represents the worst levels of interference that typically occur for three to four days in any year due to anomalous weather conditions.
With these assumptions, it can be shown that a large area of the UK is affected by incoming interference, suggesting that there is a need to consider practical measures within mobile network planning to enable networks to mitigate effects of incoming interference, for the majority of cleared channels in lower and upper cleared bands. Our analysis demonstrates that incoming interference is the dominant constraint (compared to outgoing) for the majority of cleared channels. The exception is channels 36, 38 and 39, which are currently used for other services, and do not include assignments/allotments in the GE-06 plan. For these channels, it is likely that outbound interference constraints on UK networks to protect existing services in neighbouring countries will be the dominant constraint. Incoming interference is
9XNA004C | 41

not dominant for these channels since there are no GE-06 assignments as the basis for coordination.
4.5 Mitigation of Incoming Interference to and from IMT Systems
This section focuses on incoming interference from broadcasting transmitters located in neighbouring countries to IMT systems deployed in the UK, considering levels of interference that must be accepted in UK mobile networks and measures that an IMT operator might consider to mitigate the interference effect.
A number of measures can be considered to reduce the impact of interference to and from IMT systems. Some of these relate to the way that IMT systems typically work (e.g. power control) and some require specific measures to be implemented at base station sites, such as antenna separation or filtering.
ITU Working Party 8F has previously studied appropriate mitigation techniques to overcome possible interference effects that might occur in the 2.6 GHz band, and an ITU-R report was subsequently produced14. Some of the techniques discussed in the ITU-R report may be appropriate to network planning in UHF spectrum in order to mitigate incoming international interference or interference from other UK services operating in an adjacent channel.
Mobile operators typically use various techniques at base station sites to mitigate incoming interference to their network from external sources and/or to improve site-sharing possibilities with other networks/operators. Typical base station techniques include antenna separation for co-located transmitters (which might add 10-15dB isolation) and planning of antenna azimuths. Different techniques apply depending on whether interference is being generated from another system in an adjacent channel, or whether the interference is co-channel (as is the case with incoming international interference).
Possible approaches for mitigating interference to/from IMT base stations include:
• Use of adaptive antennas – Adaptive antennas are used to enhance received signals and may also be used to form beams for transmission for the purposes of improving reception and for interference cancellation. The direct benefit from the use of adaptive antennas on the co-existence with other systems, however, is due to the fact that the RF energy radiated by antenna arrays is lower than that from conventional antennas for the same EIRP and is also focused in limited, specific regions of a cell rather than
14 Report ITU-R M.2045, Mitigation Techniques to Address Co-Existence between IMT-2000 Time Division Duplex and Frequency Division Duplex Radio Interface Technologies within the frequency range 2500-2690 MHz
9XNA004C | 42

wide sectors. Consequently, adaptive antennas have negligible impact on ‘peak’ interference, but reduce the probability of interference occurring. They can also substantially reduce the system sensitivity to incoming interference, particularly in the case of the more advanced MIMO systems, which are a core feature of IMT-Advanced, and Mobile WiMAX systems. It is noted, for instance, that in mobile WiMAX systems interference cancellation will be a mandatory feature of the system certification. It is noted that use of adaptive antennas at UHF many be challenging at UHF frequencies due to the physical array size required at this lower frequency.
• Filtering – For base station interference, filtering or power amplifier linearisation techniques can be used to reduce the unwanted emissions from a base station, thus reducing the interference at the victim receiver. In a similar manner, receiver filtering may reduce the in-band interference to the victim base station. Report ITU-R M.2045 for instance suggests that filtering can create up to 15dB improvement at 5 MHz frequency offsets, with significantly better improvement at frequency offsets beyond this. Filtering is appropriate to mitigate effects of interference from adjacent channels, but does not help with co-channel effects, such as incoming digital television signals on the same channel as the mobile network is also transmitting.
• Downlink Power Control in TDD Systems – TDD downlink power control is an integral part of the 3GPP TDD standard, and of the Mobile WiMAX standard, and is used primarily to increase system capacity by reducing intra-system interference. In addition, power control also adds immunity to downlink interference, as the base station can adapt the power it transmits.
• Antenna polarisation – It is possible to achieve additional isolation between two linearly polarised BS antennas by having them orthogonally polarised to each other. As an example, using vertical polarisation on one antenna and horizontal polarisation on the other can reduce the degree of coupling between the two. The coupling effect is quantified in terms of an antenna characteristic known as cross-polar discrimination (XPD). This can add several decibels of isolation at the base station. This technique is suited to co and adjacent channel interference effects.
• Use of antenna azimuths – Where IMT macro base stations employ sectored antennas, azimuths could be coordinated to reduce antenna gain in the direction of the interferer. It has been estimated by Mason in previous studies for Ofcom on the 2.6 GHz spectrum award15 that azimuth isolation for IMT FDD/TDD base stations of up
15 www.ofcom.org.uk/consult/condocs/2ghzawards/
9XNA004C | 43

to 20dB can be achieved between two cells utilising three sectored antennas, with typical beam-width of 65 degrees.
• Use of antenna down-tilt – Increasing the tilt angle of the base station antenna can be used to reduce the impact of incoming interference, and prevent worst case interference paths where the interferer is directly aligned with the victim antenna. This method is particularly relevant to hardening against incoming international interference, which travels long distances under certain anomalous weather conditions; a phenomenon termed ‘ducting’16. Due to the propagation method, international UHF interference tends to arrive at a base station from elevations between zero and a few degrees above the horizon. An exception to this is interference in the immediate vicinity of the coast, where interference may propagate by means of a ‘sea duct’, and thus arrive at a lower elevation angle, but as a consequence will not propagate far inland.
• Increasing transmission power – It is noted that one means of overcoming degradation from incoming interference to an IMT base station is to increase the wanted transmission power. However, this may not be practical, as this will also increase the amount of internal interference within the single frequency UMTS network. Alternatively the base stations may be moved closer to the system users (cell size reduction), thus reducing propagation losses.
• IMT Carrier Planning - It is noted that some scenarios for use of the UHF band for mobile services assume that the operator already operates a network in another frequency bands (e.g. 900 MHz, 1800 MHz, 2100 MHz) and the UHF frequencies are being used to supplement existing coverage. The implementation of multi-band networks in itself provides the potential for interference mitigation through frequency planning, since it will be possible for operators to avoid using particular carriers in certain geographic areas affected by interference (or causing interference to other services). Assuming that mobile terminals support multiple frequency bands, then the terminal will use the network available in the area it is being used and so will not transmit in the UHF band if this is not supported by the network in that area.
• OFDMA – Orthogonal Frequency Division Multiple Access is the multiple access technique adopted in the mobile WiMAX standard, and is considered a key candidate technology for next generation wireless systems (e.g. 3G LTE). It works by dividing a signal into groups of carriers, with each sub-carrier being allocated to a different
16 Fading and enhancement or refraction via temperature inversion layer
9XNA004C | 44

subscriber. Adaptive user to sub carrier assignment can be achieved, which offers a number of benefits including improving the robustness of the system to multi-path fading, as well as co-channel interference, as well as improving system efficiency.
• Frequency Hopping – Frequency hopping is a technique used in spread spectrum systems to provide better resistance to interference. Frequency hopping is also used in GSM networks to combat co-channel interference by jumping from frequency to frequency across the channels available to the network.
• Use of Micro Cells - The international interference propagated by ducting is a particular problem for relatively high ‘macro’ base station antennas. Thus if the released spectrum is to be used to add extra capacity to a network then it could be used for micro sites forming a second layer within a hierarchy of macro and micro cells. Micro sites with antennas below the height of surrounding buildings could utilise channels that suffer international interference as either (a) the interference will pass over the height of the receiving antenna, (b) the surrounding buildings will diffract and absorb the interference, thus reducing the amount of interference received. In addition, micro cells tend to use fewer directional antennas with lower gain, further protecting them from the effects of international interference.
A summary of the estimated effect of different mitigation techniques in terms of dB improvement in the link budget is given in Table 4.2.
Technique Mitigation Effect
Site placement/antenna separation 12 dB
Site engineering (e.g. antenna sectoring, down tilt etc.)
15 dB
Tx/Rx filter >30dB
Antenna azimuth 5dB
Table 4.2: Summary of Mitigation Effect of Different Techniques [Source: Mason]
Of the various mitigation techniques identified, the use of antenna azimuth and down-tilts on antennas solutions used in existing mobile networks to achieve MOU compliance in border
9XNA004C | 45

areas. These techniques were, therefore, selected for further analysis of their impact on mitigating incoming UHF interference.
A summary of our analysis is provided in the next section. A more full description is provided in Appendix A.
9XNA004C | 46

4.6 Percentage of UK Land Area and Population Affected by Incoming Interference
The RRC-06 met in Geneva (Geneva from 15 May to 16 June 2006) and worked on the basis of the agenda approved by the Council. It adopted the GE06 Regional Agreement, and associated Resolutions as contained in these Final Acts of the conference. The CEPT Regional Group, and several other countries were also joint signatories to Declaration 42 covering the use of Plan entries for alternative services.
Thus, the UK and neighbouring countries have entered into binding agreements with respect to UK incoming and UK outgoing interference. As these agreements are based upon digital terrestrial broadcasting networks, the transmitter details are quite different from those encountered generally within mobile network frequency allocations.
Typical large service area DTT network transmitters are described in 4.3 below. This table details some of the parameters for GE06 Reference Network 1 from table A3.6-1 of the Final Acts.
Receiver Type: Fixed antenna
Receiver Type: Mobile Outdoor
Receiver Type: Portable Indoor
Distance between Tx (km)
70 50 40
Tx effective height (m)
150 150 150
Tx antenna pattern Non-directional Non-directional Non-directional ERP(dBW) Band IV/V
42.8 49.7 52.4
ERP(W) Band IV/V 1.90kW 93.3kW 173.8kW
Table 4.3: GE 06 RN1 Transmitter Parameters
The transmit powers and heights indicated are considerably higher than those encountered within typical mobile phone networks and may create substantial interference. Furthermore, as FDD operation requires two paired channels, the network will be subject to two different coverage patterns of incoming DTT interference. This is further compounded by the differing channel widths: DTT 8MHz, UMTS typically 5MHz, which could result in a mobile channel straddling a DTT channel boundary17.
17 It is noted that mobile systems could have channel widths ranging from 1.25 MHz to 20 MHz. WiMAX systems may use channel bandwidths from 1.25 MHz to 20 MHz. UMTS LTE is likely to use wider bandwidth channels (e.g. 10 –20 MHz).
9XNA004C | 47

Our analysis of the effect of incoming interference predicted the GE06 agreement is summarised in Figure 4.1 to Figure 4.4 below. Full results (per individual channel assessed) are provided in Appendix D.
The graphs in Figures 4.1 to 4.4 show the area of the UK affected by different levels of incoming interference for different channels, presented (a) by land and (b) by population affected. Predictions were carried out at 10 metre receive height. It is noted that specific terrain, urban clutter and reduced receiver height will reduce interference significantly, therefore, compared to these worst-case graphs.
All of the channels within the UK’s digital dividend are shown in the diagrams, including released channels 31 to 35, 37, 39-40 and 63-68 as well as channel 36 (previously used for radar) and channel 38, currently used for radio astronomy.
Channel 69 is currently used for programme making and special events (PMSE) in the UK and there are no GE06 plan entries relating to that channel.
9XNA004C | 48

UK Land Area by Incoming Interference
Lower Digital Dividend Released Spectrum
0%10%20%30%40%50%60%70%80%90%
100%
1 5 9 13 17 21 25 29 33 37 41 45 49 53 57 61 65 69
Interference (dBuV/m)
Are
a
Ch 31Ch 32Ch 33Ch 34Ch 35Ch 36Ch 37Ch 38Ch 39Ch 40
Figure 4.1: Area by Incoming International Interference – Lower Band
UK Land Area by Incoming Interference
Upper Digital Dividend Released Spectrum
0%10%20%30%40%50%60%70%80%90%
100%
1 5 9 13 17 21 25 29 33 37 41 45 49 53 57 61 65 69
Interference (dBuV/m)
Are
a
Ch 60Ch 61Ch 62Ch 63Ch 64Ch 65Ch 66CH 67Ch 68
Figure 4.2: Area by Incoming International Interference – Upper Band
9XNA004C | 49

UK Population by Incoming Interference
Digital Dividend Lower Released Spectrum
0%10%20%30%40%50%60%70%80%90%
100%1 5 9 13 17 21 25 29 33 37 41 45 49 53 57 61 65 69
Interference (dBuV/m)
Popu
latio
n
Ch 31Ch 32Ch 33Ch 34Ch 35Ch 36Ch 37Ch 38Ch 39Ch 40
Figure 4.3: Population by Incoming International Interference – Lower Band
UK Population by Incoming Interference
Digital Dividend Upper Released Spectrum
0%10%20%30%40%50%60%70%80%90%
100%
1 5 9 13 17 21 25 29 33 37 41 45 49 53 57 61 65 69
Interference (dBuV/m)
Popu
latio
n
Ch 60Ch 61Ch 62Ch 63Ch 64Ch 65Ch 66CH 67Ch 68
Figure 4.4: Population by Incoming International Interference – Upper Band
9XNA004C | 50

In order to understand the impact of interference on mobile services, interference is converted to a received signal strength measured in dBm, taking into account the channel frequency and the antenna gain of the receiver. For a typical UMTS site we have assumed three sectors each with a horizontal 3dB beam width of 65 degrees and a boresight gain of 12 and 15dBi for the lower and upper bands of released spectrum respectively. Discounting the effect of down tilt and assuming the antenna is pointed directly at the source of interference with no site shielding from buildings, we can calculate the level of received interference in dBm, as shown in Table 4.4.
Channel / FrequencyInterference FS 31 32 33 34 35 36 37 39 40 60 61 62 63 64 65 66 67 68
(dBuV/m) 554 562 570 578 586 594 602 618 626 786 794 802 810 818 826 834 842 8501 -119.1 -119.2 -119.3 -119.4 -119.6 -119.7 -119.8 -120.0 -120.1 -119.1 -119.2 -119.3 -119.4 -119.5 -119.5 -119.6 -119.7 -119.82 -118.1 -118.2 -118.3 -118.4 -118.6 -118.7 -118.8 -119.0 -119.1 -118.1 -118.2 -118.3 -118.4 -118.5 -118.5 -118.6 -118.7 -118.83 -117.1 -117.2 -117.3 -117.4 -117.6 -117.7 -117.8 -118.0 -118.1 -117.1 -117.2 -117.3 -117.4 -117.5 -117.5 -117.6 -117.7 -117.84 -116.1 -116.2 -116.3 -116.4 -116.6 -116.7 -116.8 -117.0 -117.1 -116.1 -116.2 -116.3 -116.4 -116.5 -116.5 -116.6 -116.7 -116.85 -115.1 -115.2 -115.3 -115.4 -115.6 -115.7 -115.8 -116.0 -116.1 -115.1 -115.2 -115.3 -115.4 -115.5 -115.5 -115.6 -115.7 -115.86 -114.1 -114.2 -114.3 -114.4 -114.6 -114.7 -114.8 -115.0 -115.1 -114.1 -114.2 -114.3 -114.4 -114.5 -114.5 -114.6 -114.7 -114.87 -113.1 -113.2 -113.3 -113.4 -113.6 -113.7 -113.8 -114.0 -114.1 -113.1 -113.2 -113.3 -113.4 -113.5 -113.5 -113.6 -113.7 -113.88 -112.1 -112.2 -112.3 -112.4 -112.6 -112.7 -112.8 -113.0 -113.1 -112.1 -112.2 -112.3 -112.4 -112.5 -112.5 -112.6 -112.7 -112.89 -111.1 -111.2 -111.3 -111.4 -111.6 -111.7 -111.8 -112.0 -112.1 -111.1 -111.2 -111.3 -111.4 -111.5 -111.5 -111.6 -111.7 -111.8
10 -110.1 -110.2 -110.3 -110.4 -110.6 -110.7 -110.8 -111.0 -111.1 -110.1 -110.2 -110.3 -110.4 -110.5 -110.5 -110.6 -110.7 -110.811 -109.1 -109.2 -109.3 -109.4 -109.6 -109.7 -109.8 -110.0 -110.1 -109.1 -109.2 -109.3 -109.4 -109.5 -109.5 -109.6 -109.7 -109.812 -108.1 -108.2 -108.3 -108.4 -108.6 -108.7 -108.8 -109.0 -109.1 -108.1 -108.2 -108.3 -108.4 -108.5 -108.5 -108.6 -108.7 -108.813 -107.1 -107.2 -107.3 -107.4 -107.6 -107.7 -107.8 -108.0 -108.1 -107.1 -107.2 -107.3 -107.4 -107.5 -107.5 -107.6 -107.7 -107.814 -106.1 -106.2 -106.3 -106.4 -106.6 -106.7 -106.8 -107.0 -107.1 -106.1 -106.2 -106.3 -106.4 -106.5 -106.5 -106.6 -106.7 -106.815 -105.1 -105.2 -105.3 -105.4 -105.6 -105.7 -105.8 -106.0 -106.1 -105.1 -105.2 -105.3 -105.4 -105.5 -105.5 -105.6 -105.7 -105.816 -104.1 -104.2 -104.3 -104.4 -104.6 -104.7 -104.8 -105.0 -105.1 -104.1 -104.2 -104.3 -104.4 -104.5 -104.5 -104.6 -104.7 -104.817 -103.1 -103.2 -103.3 -103.4 -103.6 -103.7 -103.8 -104.0 -104.1 -103.1 -103.2 -103.3 -103.4 -103.5 -103.5 -103.6 -103.7 -103.818 -102.1 -102.2 -102.3 -102.4 -102.6 -102.7 -102.8 -103.0 -103.1 -102.1 -102.2 -102.3 -102.4 -102.5 -102.5 -102.6 -102.7 -102.819 -101.1 -101.2 -101.3 -101.4 -101.6 -101.7 -101.8 -102.0 -102.1 -101.1 -101.2 -101.3 -101.4 -101.5 -101.5 -101.6 -101.7 -101.820 -100.1 -100.2 -100.3 -100.4 -100.6 -100.7 -100.8 -101.0 -101.1 -100.1 -100.2 -100.3 -100.4 -100.5 -100.5 -100.6 -100.7 -100.821 -99.1 -99.2 -99.3 -99.4 -99.6 -99.7 -99.8 -100.0 -100.1 -99.1 -99.2 -99.3 -99.4 -99.5 -99.5 -99.6 -99.7 -99.822 -98.1 -98.2 -98.3 -98.4 -98.6 -98.7 -98.8 -99.0 -99.1 -98.1 -98.2 -98.3 -98.4 -98.5 -98.5 -98.6 -98.7 -98.823 -97.1 -97.2 -97.3 -97.4 -97.6 -97.7 -97.8 -98.0 -98.1 -97.1 -97.2 -97.3 -97.4 -97.5 -97.5 -97.6 -97.7 -97.824 -96.1 -96.2 -96.3 -96.4 -96.6 -96.7 -96.8 -97.0 -97.1 -96.1 -96.2 -96.3 -96.4 -96.5 -96.5 -96.6 -96.7 -96.825 -95.1 -95.2 -95.3 -95.4 -95.6 -95.7 -95.8 -96.0 -96.1 -95.1 -95.2 -95.3 -95.4 -95.5 -95.5 -95.6 -95.7 -95.826 -94.1 -94.2 -94.3 -94.4 -94.6 -94.7 -94.8 -95.0 -95.1 -94.1 -94.2 -94.3 -94.4 -94.5 -94.5 -94.6 -94.7 -94.827 -93.1 -93.2 -93.3 -93.4 -93.6 -93.7 -93.8 -94.0 -94.1 -93.1 -93.2 -93.3 -93.4 -93.5 -93.5 -93.6 -93.7 -93.828 -92.1 -92.2 -92.3 -92.4 -92.6 -92.7 -92.8 -93.0 -93.1 -92.1 -92.2 -92.3 -92.4 -92.5 -92.5 -92.6 -92.7 -92.829 -91.1 -91.2 -91.3 -91.4 -91.6 -91.7 -91.8 -92.0 -92.1 -91.1 -91.2 -91.3 -91.4 -91.5 -91.5 -91.6 -91.7 -91.830 -90.1 -90.2 -90.3 -90.4 -90.6 -90.7 -90.8 -91.0 -91.1 -90.1 -90.2 -90.3 -90.4 -90.5 -90.5 -90.6 -90.7 -90.8
Table 4.4: Received Interference to a Mobile Network in Worst Case [Source: Mason]
The green area in the table above represents a typically acceptable co-channel interference threshold for a UMTS base station (below –109 dBm)18 for a given interference field strength. This level of co-channel interference is illustrative, and the actual threshold for any given network will depend on the services offered, cell loading, level of inter-cell interference and the required bit error rate (BER).
18 See ITU Working Party 8F 391-E, Table 2.1-1
9XNA004C | 51

From the above table it can be seen that interference levels exceed the threshold in the majority of digital dividend channels. As described previously, however, this relates to a worst case where the receive antenna boresight is aligned with the source of interference.
We then assessed the impact of mitigation techniques by taking in to account base station antenna down tilt (8 degrees) and careful selection of antenna azimuths (with bearings offset by 60 degrees from the direction of high levels of interference). This suggested that a network can, through careful network planning, be designed to tolerate about 27dBμV/m of interference, as highlighted in Table 4.5.
Channel / FrequencyInterference FS 31 32 33 34 35 36 37 39 40 60 61 62 63 64 65 66 67 68
(dBuV/m) 554 562 570 578 586 594 602 618 626 786 794 802 810 818 826 834 842 8501 -134.6 -134.7 -134.8 -134.9 -135.1 -135.2 -135.3 -135.5 -135.6 -134.6 -134.7 -134.8 -134.9 -135.0 -135.0 -135.1 -135.2 -135.32 -133.6 -133.7 -133.8 -133.9 -134.1 -134.2 -134.3 -134.5 -134.6 -133.6 -133.7 -133.8 -133.9 -134.0 -134.0 -134.1 -134.2 -134.33 -132.6 -132.7 -132.8 -132.9 -133.1 -133.2 -133.3 -133.5 -133.6 -132.6 -132.7 -132.8 -132.9 -133.0 -133.0 -133.1 -133.2 -133.34 -131.6 -131.7 -131.8 -131.9 -132.1 -132.2 -132.3 -132.5 -132.6 -131.6 -131.7 -131.8 -131.9 -132.0 -132.0 -132.1 -132.2 -132.35 -130.6 -130.7 -130.8 -130.9 -131.1 -131.2 -131.3 -131.5 -131.6 -130.6 -130.7 -130.8 -130.9 -131.0 -131.0 -131.1 -131.2 -131.36 -129.6 -129.7 -129.8 -129.9 -130.1 -130.2 -130.3 -130.5 -130.6 -129.6 -129.7 -129.8 -129.9 -130.0 -130.0 -130.1 -130.2 -130.37 -128.6 -128.7 -128.8 -128.9 -129.1 -129.2 -129.3 -129.5 -129.6 -128.6 -128.7 -128.8 -128.9 -129.0 -129.0 -129.1 -129.2 -129.38 -127.6 -127.7 -127.8 -127.9 -128.1 -128.2 -128.3 -128.5 -128.6 -127.6 -127.7 -127.8 -127.9 -128.0 -128.0 -128.1 -128.2 -128.39 -126.6 -126.7 -126.8 -126.9 -127.1 -127.2 -127.3 -127.5 -127.6 -126.6 -126.7 -126.8 -126.9 -127.0 -127.0 -127.1 -127.2 -127.3
10 -125.6 -125.7 -125.8 -125.9 -126.1 -126.2 -126.3 -126.5 -126.6 -125.6 -125.7 -125.8 -125.9 -126.0 -126.0 -126.1 -126.2 -126.311 -124.6 -124.7 -124.8 -124.9 -125.1 -125.2 -125.3 -125.5 -125.6 -124.6 -124.7 -124.8 -124.9 -125.0 -125.0 -125.1 -125.2 -125.312 -123.6 -123.7 -123.8 -123.9 -124.1 -124.2 -124.3 -124.5 -124.6 -123.6 -123.7 -123.8 -123.9 -124.0 -124.0 -124.1 -124.2 -124.313 -122.6 -122.7 -122.8 -122.9 -123.1 -123.2 -123.3 -123.5 -123.6 -122.6 -122.7 -122.8 -122.9 -123.0 -123.0 -123.1 -123.2 -123.314 -121.6 -121.7 -121.8 -121.9 -122.1 -122.2 -122.3 -122.5 -122.6 -121.6 -121.7 -121.8 -121.9 -122.0 -122.0 -122.1 -122.2 -122.315 -120.6 -120.7 -120.8 -120.9 -121.1 -121.2 -121.3 -121.5 -121.6 -120.6 -120.7 -120.8 -120.9 -121.0 -121.0 -121.1 -121.2 -121.316 -119.6 -119.7 -119.8 -119.9 -120.1 -120.2 -120.3 -120.5 -120.6 -119.6 -119.7 -119.8 -119.9 -120.0 -120.0 -120.1 -120.2 -120.317 -118.6 -118.7 -118.8 -118.9 -119.1 -119.2 -119.3 -119.5 -119.6 -118.6 -118.7 -118.8 -118.9 -119.0 -119.0 -119.1 -119.2 -119.318 -117.6 -117.7 -117.8 -117.9 -118.1 -118.2 -118.3 -118.5 -118.6 -117.6 -117.7 -117.8 -117.9 -118.0 -118.0 -118.1 -118.2 -118.319 -116.6 -116.7 -116.8 -116.9 -117.1 -117.2 -117.3 -117.5 -117.6 -116.6 -116.7 -116.8 -116.9 -117.0 -117.0 -117.1 -117.2 -117.320 -115.6 -115.7 -115.8 -115.9 -116.1 -116.2 -116.3 -116.5 -116.6 -115.6 -115.7 -115.8 -115.9 -116.0 -116.0 -116.1 -116.2 -116.321 -114.6 -114.7 -114.8 -114.9 -115.1 -115.2 -115.3 -115.5 -115.6 -114.6 -114.7 -114.8 -114.9 -115.0 -115.0 -115.1 -115.2 -115.322 -113.6 -113.7 -113.8 -113.9 -114.1 -114.2 -114.3 -114.5 -114.6 -113.6 -113.7 -113.8 -113.9 -114.0 -114.0 -114.1 -114.2 -114.323 -112.6 -112.7 -112.8 -112.9 -113.1 -113.2 -113.3 -113.5 -113.6 -112.6 -112.7 -112.8 -112.9 -113.0 -113.0 -113.1 -113.2 -113.324 -111.6 -111.7 -111.8 -111.9 -112.1 -112.2 -112.3 -112.5 -112.6 -111.6 -111.7 -111.8 -111.9 -112.0 -112.0 -112.1 -112.2 -112.325 -110.6 -110.7 -110.8 -110.9 -111.1 -111.2 -111.3 -111.5 -111.6 -110.6 -110.7 -110.8 -110.9 -111.0 -111.0 -111.1 -111.2 -111.326 -109.6 -109.7 -109.8 -109.9 -110.1 -110.2 -110.3 -110.5 -110.6 -109.6 -109.7 -109.8 -109.9 -110.0 -110.0 -110.1 -110.2 -110.327 -108.6 -108.7 -108.8 -108.9 -109.1 -109.2 -109.3 -109.5 -109.6 -108.6 -108.7 -108.8 -108.9 -109.0 -109.0 -109.1 -109.2 -109.328 -107.6 -107.7 -107.8 -107.9 -108.1 -108.2 -108.3 -108.5 -108.6 -107.6 -107.7 -107.8 -107.9 -108.0 -108.0 -108.1 -108.2 -108.329 -106.6 -106.7 -106.8 -106.9 -107.1 -107.2 -107.3 -107.5 -107.6 -106.6 -106.7 -106.8 -106.9 -107.0 -107.0 -107.1 -107.2 -107.330 -105.6 -105.7 -105.8 -105.9 -106.1 -106.2 -106.3 -106.5 -106.6 -105.6 -105.7 -105.8 -105.9 -106.0 -106.0 -106.1 -106.2 -106.3
Table 4.5: Power in Received Channel Taking Account of Receiver Mitigation [Source: Mason]
At interference field strengths above 27dBμV/m, additional measures are required. The standard tri-sectored site may alter, ether by:
• Offsetting affected sectors by more than 60 degrees from the source of interference
• Removing one sector completely.
These methods are illustrated in the diagram below.
9XNA004C | 52

Figure 4.5: Azimuth alterations to harden against interference ducts
Alternatively, more aggressive down tilt may be applied, ether permanently, or by means of remote electrical tilt (RET) or an adaptive antenna. Both of these result in a decrease in cell coverage, which must be traded against the interference immunity.
This is further explored in the next section.
4.7 Impact of Interference on IMT Site count
In this section, we provide a summary of our analysis of the impact of operating an IMT network in UHF spectrum in the presence of incoming DTT interference from neighbouring countries.
Three scenarios were assessed, as previously described:
• Scenario 1: A new operator using DDR spectrum to provide good coverage to 80% of the population. This was achieved in our model by characterising the UK geography as urban, suburban or rural (see Table 4.1). By setting the model to cover 100% of urban areas, 0% of suburban and 0% rural, coverage to 80.7% of the UK population was achieved, equivalent to 21.8% of UK area coverage
• Scenario 2: Using DDR spectrum to provide deeper indoor coverage. This was defined by setting the model to achieve 100% urban, 50% suburban and 50% rural coverage, resulting in 85.7% UK population coverage, or 30.9% area coverage. Thus Scenario 2 provides additional coverage to suburban and rural areas not addressed by Scenario 1, resulting in an increased site count
• Scenario 3: Using DDR spectrum to extend coverage to the last 10% of the population, as well as to urban and suburban areas. This scenario was developed to consider the case where an existing cellular operator already provides a high level of UK population coverage using other spectrum (e.g. 900 MHz, 1800 MHz or 2100
9XNA004C | 53

MHz) but uses the UHF spectrum to provide rural site in-fill. This was achieved by setting the model to provide 30% rural coverage, 70% suburban coverage and 0% urban coverage, giving 9.4% UK population coverage, or 28.1% area coverage.
Using ICS Telecom to predict site requirements, we set up the predictions to meet the defined geographic coverage targets in urban, suburban and rural environments for each scenario, in order to achieve the target population coverage:
• Scenario 1: 100% urban area coverage, 0% suburban area coverage, 0% rural area coverage, achieving 80% population coverage
• Scenario 2: 100% urban area coverage, 50% suburban area coverage, 5% rural area coverage, achieving 85% population coverage
• Scenario 3: 0% urban area coverage, 70% suburban area coverage, 30% rural area coverage, achieving 10% population coverage.
Results for Scenario 1 are presented below. The results illustrate for Scenario 1 that the percentage increase in site count due to mitigating incoming interference ranges from 25% for the channels least affected (e.g. Channel 31) to 40% for channels worst affected (e.g. channel 35). However, the total cell requirements in all cases compare favourably with similar coverage at 2100 MHz (illustrated in the first column of each graph).
We have also considered the impact of combining DDR channels to provide coverage split between two carriers that are differently affected by incoming interference. This was considered because the results of our incoming interference assessment illustrate that different channels are affected by incoming interference in different regions, depending on whether the source of incoming interference is Ireland, France, Holland or Belgium. The example we have assessed is that of coverage using a combination of channels 67 and 68, where we seek to optimise carrier selection by avoiding using channels in areas where incoming interference is worse. This is illustrated in the last column of the graphs below.
9XNA004C | 54

Site Count - Outdoor - Lower Released Spectrum
7243
2002 29
78
2551 33
62
3333
3143
2096 31
55
2002 30
51
2998
1257
9
3477 51
10
4394 57
67
5711
5386
3633 54
07
3477 52
32
5141
02000400060008000
100001200014000
2.1GHz
UHF No I
nterfe
rence
Ch 31
Ch 32
Ch 33
Ch 34
Ch 35
Ch 36
Ch 37
Ch 38
Ch 39
Ch 40
Voice outdoorData outdoor
Figure 4.6: Site count for Outdoor Services Scenario 1 – Lower Band
Site Count - Outdoor - Upper Released Spectrum
7243
3064 45
94
4727
4373
4548
4658
4646
4388
3199 46
41
3195
1257
9
5329
7844
8075
7484
7771
7955
7939
7498
5548
7934
5541
0
2000
4000
6000
8000
10000
12000
14000
2.1GHz
UHF No I
nterfe
rence
Ch 60
Ch 61
Ch62
Ch 63
Ch 64
Ch 65
Ch 66
Ch 67
Ch 68
Ch 67 &
68
Voice outdoorData outdoor
Figure 4.7: Site count for Outdoor Services Scenario 1 – Upper Band
9XNA004C | 55

Site Count - in-building - Lower Released Spectrum
3959
4
1096
9
1549
5
1346
8
1746
5
1726
3
1628
5
1135
1
1633
1
1096
9
1583
8
1554
4
6967
9
1911
3
2704
8
2378
9
2995
5
3021
4
2821
9
1995
0
2887
5
1911
3
2800
0
2737
7
01000020000300004000050000600007000080000
2.1GHz
UHF No I
nterfe
rence
Ch 31
Ch 32
Ch 33
Ch 34
Ch 35
Ch 36
Ch 37
Ch 38
Ch 39
Ch 40
Voice in-buildingData in-building
Figure 4.8: Site count for In-building Services Scenario 1 – Lower Band
Site Count - in-building - Upper Released Spectrum
3959
4
1683
2
2349
0
2418
3
2259
6
2330
4
2386
1
2380
9
2250
6
1739
2
2382
6
1737
6
6967
9
2908
5 4257
4
4380
4
4067
8
4216
5
4321
1
4307
6
4071
3
3026
2 4305
6
3022
8
01000020000300004000050000600007000080000
2.1GHz
UHF No I
nterfe
rence
Ch 60
Ch 61
Ch62
Ch 63
Ch 64
Ch 65
Ch 66
Ch 67
Ch 68
Ch 67 &
68
Voice in-buildingData in-building
Figure 4.9: Site count for In-building Services Scenario 1 – Upper Band
A comparison of the corresponding site count for Scenarios 2 and 3 is provided Appendix A.
Results of the analysis demonstrate that:
9XNA004C | 56

• In Scenarios 1 and 2, the IMT site count for lower and upper cleared channels is consistently lower than an equivalent 2100 MHz coverage, despite the need to mitigate incoming interference
• Results illustrate that the site count is higher for upper cleared spectrum than for lower cleared spectrum. This is due to a number of link budget parameters being varied for lower cleared spectrum compared to upper cleared spectrum, as described in Section 3. The difference in site count between upper and lower spectrum is further affected by incoming interference. In our model, the presence of interference requiring mitigation results in down-tilt being applied at a site (which increases the number of sites required to achieve a given coverage target). Whilst the percentage reduction in coverage (due to interference) is the same for upper and lower cleared spectrum, larger areas of the UK need greater levels of mitigation for the upper cleared spectrum compared to the lower cleared spectrum, which explains the difference in results (as illustrated by Tables A.16 and A.17 in Appendix A)
• The effect of mitigating interference is an increase in site count of between 27% and 68% (compared to the no interference UHF case) for channels within the lower cleared spectrum, and between 4% and 54% for the channels within the upper cleared spectrum, depending on which channel is being considered. The difference in the percentage increase in site count for each channel is due to the level of incoming interference to each channel, which varies on a channel by channel basis depending on whether the channel contains GE-06 assignments in France, Holland, Belgium, Ireland or a combination of those, and the characteristics of the assignment (primarily the location and proximity to the UK and the radiated power of the site)
• Levels of incoming interference are different for each channel in the lower and upper cleared spectrum, as a result of corresponding DTT use, and whether a particular channel is being used in Ireland, France, Belgium and/or Holland
• Our example illustration of coverage achieved by combining channels (67 and 68 in our analysis) shows a positive effect, highlighting a slight reduction in site requirements if both channels 67 and 68 are used to achieve coverage compared to if channel 67 alone was used to provide the same coverage. This is because the two channels are affected by incoming interference at different locations (due to the source of the incoming interference being either Ireland, France, Belgium or Holland), suggesting that operators who acquire two cleared channels may be able to use carrier planning as a mitigating factor to optimising site count in the presence of interference. We considered other channel combinations but found difficulty during
9XNA004C | 57

the study to find two channels that were suitably complementary to demonstrate a significant reduction in the combined site count compared to use of a single channel. There is no generality to the combination of channels, since different levels of incoming interference affect different channels, depending on whether the source of interference is assignments in France, Belgium, Holland or Ireland and the technical details of the assignment
• In Scenario 3, the target was to provide rural coverage and so the urban area coverage in this case is set to 0%, with cell sites predicted to cover 70% of suburban areas and 30% of rural areas respectively. In the results for some lower and upper cleared channels based on Scenario 3, the IMT site count predicted as being higher than the comparable ‘no interference’ 2100 MHz network in the presence of interference. This result initially appears counter intuitive, due to the propagation advantage of UHF frequencies, but is thought to be due to incoming interference particularly affecting coastal areas, which coincide with areas categorised as ‘rural’ in the Office of National statistics morphology data. This is particularly highlighted in Scenario 3, because urban coverage is set to 0. For scenarios where coverage is spread across different morphology classes (e.g. Scenario 2), the UHF advantage compared to 2100 MHz is clearer. Scenario 3 results also highlights an apparent anomaly in the model in that some channels in the upper cleared spectrum (e.g. channel 67) require more sites for outdoor coverage compared to the lower cleared spectrum (e.g. channel 40), but less for indoor coverage. We believe that this is a feature of the way that link budget, interference and coverage areas interact in the model, and is to do with the areas that suffer the interference and the levels of mitigation required. Scenario 3 reflects suburban and rural areas and it appears that areas classified in those categories are also areas that typically suffer higher levels of international interference (requiring greater levels of interference mitigation).
4.8 Sensitivity Analysis
Throughout the analysis in this report, we have assumed an interference limit for a UMTS base station of -109dBm (this is the same as ITU-R Working Party 8F has used in 2.6GHz and other studies).
At this level, some released channels for some area of the UK cannot be served with the range of mitigation methods described in the report (azimuth and tilt).
9XNA004C | 58

We have performed a sensitivity analysis on this figure, to illustrate the impact on the level of mitigation required for any given level of international interference, for UMTS base station interference limits ranging from -105 (i.e. BS tolerating more interference than the –109 dBm assumption) to -116dBm (tolerates less).
We have used Scenario One (urban coverage) for the analysis and measured site count for an in-building data service.
We have found that decreasing the base station interference limit has two effects:
• Increase in the level of mitigation that needs to be applied, which increases site count
• Increase in the area of the UK which suffers too much interference and which cannot be served with the range of mitigation methods described in the report.
Increasing Base Station International Interference limit has two effects:
• Decrease in the level of mitigation that needs to be applied, which decrease site count
• Decrease in the area of the UK which suffers too much interference and which cannot be served with the range of mitigation methods described.
Figures 4.10 to 4.14 illustrate this.
Base station international interference limitversus UK site count
lower released spectrum
15000
17000
19000
21000
23000
25000
27000
29000
31000
33000
-105 -106 -107 -108 -109 -110 -111 -112 -113 -114 -115 -116
Ch 31Ch 32Ch 33Ch 34Ch 35Ch 36Ch 37Ch 38Ch 39Ch 40
Figure 4.10: Impact on site count of varying UMTS interference limit – lower spectrum
9XNA004C | 59

Base station international interference limitversus UK site count
upper released spectrum
15000
20000
25000
30000
35000
40000
45000
50000
55000
-105 -106 -107 -108 -109 -110 -111 -112 -113 -114 -115 -116
Ch 60Ch 61Ch62Ch 63Ch 64Ch 65Ch 66Ch 67Ch 68
Figure 4.11: Impact on site count of varying UMTS interference limit – upper spectrum
Base station international interference limitversus UK coverage
lower released spectrum
70.0%
75.0%
80.0%
85.0%
90.0%
95.0%
100.0%
-105 -106 -107 -108 -109 -110 -111 -112 -113 -114 -115 -116
Ch 31Ch 32Ch 33Ch 34Ch 35Ch 36Ch 37Ch 38Ch 39Ch 40
Figure 4.12: Impact on coverage of varying UMTS interference limit – lower spectrum
9XNA004C | 60

Base station international interference limitversus UK coverage
upper released spectrum
70.0%
75.0%
80.0%
85.0%
90.0%
95.0%
100.0%
-105 -106 -107 -108 -109 -110 -111 -112 -113 -114 -115 -116
Ch 60Ch 61Ch62Ch 63Ch 64Ch 65Ch 66Ch 67Ch 68
Figure 4.13: Impact on coverage of varying UMTS interference limit – upper spectrum
9XNA004C | 61

5. Adjacent Channel Interference Between IMT Networks and other Services in the UHF Spectrum
5.1 Introduction
Ofcom’s stated objective for release of digital dividend spectrum is to provide as much flexibility as possible as to how released spectrum can be used, subject to international interference obligations and other compatibility constraints.
As indicated in the introduction to this report, possible uses of released spectrum have been identified through previous work to include a number of different systems, including mobile television, further digital television and mobile broadband services.
The underlying spectrum requirements of the candidate uses vary depending on service and technology characteristics. Similarly, constraints arising from adjacent channel working between different services and technologies will vary depending on the combination of technologies being considered and the interference levels that are tolerated by different systems.
The purpose of this section of the report is to describe our analysis relating to adjacent band compatibility between one candidate use of the digital dividend spectrum – namely mobile broadband networks – with other candidate uses (mobile multimedia, digital television, as well as other mobile broadband networks with different characteristics). For the purposes of our analysis, mobile broadband services have been modelled as UMTS systems, with usage scenarios as described in Section 2 of this report.
This analysis forms a sub-set of a wider programme of work commissioned by Ofcom to evaluate the scope for interference between alternative potential uses of the digital dividend spectrum.
In this section we provide an overview of the results of our analysis; for further details of the assumptions and methodologies used, please refer to Appendix B.
9XNA004C | 62

5.2 Adjacent Channel Interference Scenarios under Consideration
The objective of this analysis was to consider compatibility issues between IMT systems and selected alternative uses of digital dividend spectrum, when deployed in adjacent channels. This included consideration of:
• The underlying requirements of IMT and other selected candidate uses (e.g. power levels, service and coverage targets, planning levels, C/I protection requirements)
• Scope for interference between IMT and other candidate uses when deployed in adjacent channels
• Impact of adjacent channel interference on spectrum packaging and licence condition decisions.
Two main combinations of adjacent channel interference were addressed:
• Adjacent channel interference between UMTS user equipment (mobiles) and DTT
• Adjacent channel interference between UMTS base stations and DTT.
Eight scenarios were considered in total:
• The Interference Probability as a consequence of the aggregated UMTS UE interference from a UMTS network into victim DVB-T Receivers19
• The Interference Probability as a consequence of a single UMTS UE interferer transmitting into victim DVB-H Receivers
• The reduction in UMTS network downlink capacity as a consequence of a DVB-T transmitter broadcasting interference into a network of UMTS UE Receivers
• The reduction in UMTS network downlink capacity as a consequence of a network of DVB-H transmitters broadcasting interference into a network of UMTS UE Receivers
• The impact of UMTS base station interference on DTT reception, in terms of number of users affected
19 We assumed DTT reception to a Yagi antenna; it is noted that some television reception is to portable antennas, which has not been addressed within our analysis.
9XNA004C | 63

• The impact of UMTS base interference on DVB-H reception, in terms of areas affected by interference above tolerable levels
• The impact of DTT transmitters interfering with UMTS base station receivers located within the same geographic area, in terms of the impact on UMTS network coverage
• The impact of DVB-H transmitters interfering with UMTS base station receivers, in terms of the impact on UMTS network coverage.
Analysis of a number of other possible scenarios relating to the released spectrum (e.g. DVB-H to analogue and digital TV, WiMAX to DTT and DVB-H) is provided in separate documentation relating to other work packages within the overall DDR technical study work programme.
5.3 Discussion of Approach
The ability, or otherwise, of two systems operating in adjacent frequency channels is mainly determined by20:
• The transmitter’s performance represented by a transmitter mask and spectral emissions (Power spectral density v. frequency offset)
• The receiver’s performance represented by selectivity and blocking (e.g. Rejection v. frequency offset)
• The distance between the transmitter and receiver, and any particular propagation behaviour.
The first two of these are often convolved to provide a Net Filter Discrimination (NFD), which is a normalised function that provides an overall discrimination as a function of frequency offset21. If this is to be done, the receiver response must be characterised in respect of a swept CW signal.
Using a given interference criterion, the guard band for the two services to be compatible can be determined from the NFD, if the distance and propagation characteristics between the transmitter and receiver are known. For calculations based on fixed / known positions, and a premise of free space path loss, the avoidance of interference can be determined with some
20 Non-linear effects could occur but are not considered to be first order effects.
21 It should be noted that the NFD concept is not generally applicable to analogue systems, or to certain digital
systems with complex spectral masks.
9XNA004C | 64

certainty. If, however, it is necessary to reflect variability in the propagation channel, and other factors, such as the use of power control and the geographic density of interfering sources, the calculation must include a statistical element. In this case, the interference criterion must specify the number of instances of interference that are to be permitted, a figure that may be arbitrarily small, but not zero.
If there is control over the distance between the interfering transmitter and the victim receiver, a trade-off between guard band and ‘exclusion’ distance can be carried out; in other words, systems will be compatible if a certain separation between transmitter and interference is respected. In the event that separation cannot be guaranteed, then there is a finite probability that the distance between transmitter and receiver will be less than the required amount, in which case interference may occur. In this event, the level of interference that occurs is determined by the coupling loss under those circumstances.
When the location of the interfering transmitter with respect to the victim receiver is unknown (or random), such as applies with mobile device whose location depends on the location f the user, it becomes necessary to undertake probabilistic simulations. Simulations can be undertaken using a series of predetermined guard bands (frequency offsets). For a given guard band the results of a simulation would be a probability distribution of interference experienced by a receiver.
In our analysis for Ofcom, we have used two alternative modelling approaches – firstly CEPT’s Seamcat modelling tool has been used to undertake probabilistic simulations of some scenarios where the location of the victim and the interferer are randomly distributed, and secondly ICS Telecom has been used to evaluate the impact on transmitter coverage (cell range) in a number of scenarios.
SEAMCAT-3 is the latest upgrade of the public SEAMCAT software, which was developed within the framework of the European Conference of Postal and Telecommunications administrations (CEPT) and used for statistical modelling of interference between various radio communications systems. SEAMCAT 3 includes a number of new features including simulation of CDMA systems, modelled either as a network or an individual cell. It is published by CEPT and available for download at www.ero.dk.
5.4 Approach to Seamcat Simulation
Our approach required an initial definition of a notional transmitter spectral mask, which will occupy the adjacent bands to DTT or other victim service.
9XNA004C | 65

This allowed the response of the receiver to interference by other systems at arbitrary frequency offsets to be determined. A series of measurements of C/I protection ratios for different candidate uses of the digital dividend spectrum with respect to other candidate uses were conducted for Ofcom by ERA Technologies Limited. Measurements were conducted either using actual equipment or simulated equipment where actual equipment was not available for the UHF band. The results of these measurements, which are reported in a separate report to Ofcom, were used to define victim receiver response at different frequency offsets, which was then use to parameterise the SEAMCAT stochastic model.
A simulation is then run for each of a series of guard-bands, and the results plotted upon a curve for a given interferer average power level.
Ch N
Ch N
Ch N
Ch N
Ch N+1
Ch N+2
Ch N+3
Ch N+m
Figure 5.1: Monte Carlo Simulation
This process is then repeated for a number of increasing power levels. This will produce a family of curves.
A fuller description of the analysis, including all technical assumptions, can be found in Appendix B.
5.5 Approach to ICS Telecom Simulation
We have modelled adjacent channel interference scenarios involving UMTS base stations using ICS Telecom, in order to illustrate the areas affected by adjacent channel interference between different services, and potential impact of this on the ‘victim’ service, in terms of loss of cell range.
The scenarios assessed using ICS Telecom have been:
9XNA004C | 66

• Digital terrestrial (DTT) television transmitter interfering with an IMT base station
• IMT base station interfering with DTT reception
• Mobile television (DVB-H) transmitter interfering with an IMT base station
• IMT base station interfering with DVB-H reception.
Service assumptions and scenarios are as described in Section 2.
Using ICS Telecom, we defined the characteristics of the transmitters of the victim system (UMTS, DTT or DVB-H)22 and developed a representative network of transmitters for the victim system, in order to predict received signal strength at victim receivers without interference. Interference was then added to the prediction to give the change in received signal strength, in order to calculate the isolation requirement and/or frequency separation required.
The steps in the process were as follows:
• Two example urban areas were chosen for the analysis, which were London (area served by Crystal Palace broadcasting transmitter) and Manchester (area served by Winter Hill transmitter). Within the coverage area, a network of transmitters representing the victim service was defined
• Coverage from the defined network of transmitters was predicted to representative receivers, randomly placed within the service area (weighed for urban and suburban areas). The received signal strength arriving at each victim receiver was then determined using ICS Telecom coverage predictions
• For the scenario where DTT is the victim system, the ‘parenting’ function was used in ICS Telecom to associate receivers with the DTT transmitter (i.e. at Crystal Palace or Winter Hill), which set antenna azimuths for the victim receivers. This was undertaken so to take account of the direction of the interference arriving at the victim antenna and the effect of interference being offset from the main lobe. For the scenarios were UMTS or DVB-H receivers were the victim service, this was not considered since it was assumed that receiver antennas would be omni-directional
• Characteristics of the interfering system were then defined. For DTT, the interferer was assumed to be a single broadcasting transmitter (at either Crystal Palace or Winter Hill), with the characteristics of the transmitter based on those recorded in the GE06 plan. For UMTS and DVB-H, a network of cells was created to represent a typical network of transmitters. Originally a uniform grid was used for this (5km
22 The bandwidths assumed for each system were: UMTS (5 MHz), DVB-H (8 MHz), DTT (8 MHz).
9XNA004C | 67

hexagonal grid), which was then altered to provide cell separations more typical of the areas being considered
• The measured C/I provided by the ERA Technologies measurements for Ofcom was then introduced. For all subscribers within the victim service ICS Telecom was used to predict the signal level obtained from the wanted signal, compared to the interfering signal. The point at which the receiver’s threshold was exceeded was then determined and repeated for different frequency offsets
• In the case that UMTS is the interfering system, the level of interference predicted from the network of UMTS transmitters was obtained firstly assuming no antenna tilt, and, secondly, assuming a 4 degree down tilt, to compare the effect at the victim receiver
• The required frequency offset to avoid the receiver threshold being exceeded was then determined by mapping the number of receivers exceeding the C/I for different frequency separations.
A fuller description of the analysis including all technical assumptions can be found in Appendix B.
5.6 Summary of Results
For the individual scenarios considered, results are as follows:
• UMTS Uplink Interference to DTT. Interference analysis using CEPT’s Monte Carlo modelling tool (SEAMCAT) suggest that the probability of interference from outdoor UMTS mobiles to indoor DVB-T reception is less than 1 % assuming a 3 MHz frequency separation exists between channel edges (i.e. 9.5 MHz separation between DTT and UMTS centre frequencies assuming an 8 MHz DTT channel and 5 MHz UMTS channel). This suggests that the impact of interference is negligible at this frequency offset and beyond. Assuming no offset, i.e. no frequency separation between DTT and UMTS channel edges (equivalent to 6.5 MHz separation between carrier centre frequencies), the likelihood of interference increases to 10.77%. This is a more significant probability of interference, suggesting that operation of UMTS and DTT carriers in adjacent channels, with 0 MHz offset between channel edges, is not practical. This 10% P (int) is for the marginal case, however, overall, the interference will be significantly less. If Ofcom were to allocate spectrum in 8 MHz lots, operation of a 5 MHz UMTS carrier within an 8 MHz channel adjacent to an 8 MHz DTT carrier is practical, if the UMTS carrier is not located in the centre of the block,
9XNA004C | 68

but placed 3 MHz from the block edge. This is practical if DTT channels border UMTS channels at one block edge only.
• UMTS Uplink Interference to DVB-H. UMTS uplink to DVB-H interference was assessed using Minimum Coupling Loss to calculate the potential for interference in scenarios where the UMTS mobile and the DVB-H receiver are both used within the same building (either in the same room or in an adjacent room). Results suggest that interference will occur between the devices where UMTS and DVB-H carrier frequencies are in adjacent channels (8 MHz separation between carrier centre frequencies). Interference will occur at 8 MHz carrier frequency separations if devices are operated within 15 metres of each other within the same room, or 4 metres from each other in adjacent rooms, with 10dB penetration loss between walls. Increasing the frequency offset between carrier centre frequencies to 16 MHz reduces the interfering distance to 6.8 metres for the same room case and 2 metres for the adjacent rooms. Results suggest that operation of UMTS uplinks and DVB-H is not feasible with 8 MHz frequency separation between channels, due to the size of the estimated sterilisation distance, which may be exceeded in typical operating scenarios. The 16 MHz case reduces coupling distances to shorter ranges, which, whilst still problematic, may be less likely to occur in practice. A guard band is, therefore, required, of at least one DTT channel width (8 MHz), in order to reduce the sterilisation distance to a small coupling distance, which can be considered to be tolerable for typical scenarios.
• DTT interference to UMTS Downlink (User Equipment). This scenario was evaluated using SEAMCAT to determine the reduction in UMTS network downlink capacity due to the presence of DTT interference. Analysis suggests that the impact of interference in this scenario is significant when the frequency separation between channel edges is 3 MHz (9.5 MHz between carrier frequencies assuming 8 MHz interferer and 5 MHz victim channel). This results in a 20% reduction in capacity when the broadcast interference is at its maximum and co-incident with the UMTS wanted signal being at its minimum, i.e. at the cell edge. Increasing the frequency offset from 3 MHz to 8 MHz reduces the capacity reduction to 14%, which is still a significant figure. To further mitigate the effect of interference, an option for UMTS network planning would be to reduce the UMTS cell size. With a 50% reduction in cell size from its original size of 0.94km and a 3 MHz frequency separation, the effect
9XNA004C | 69

of interference reduces to a 7% loss in capacity. Limiting the cell radius to 0.3km, which is 30% of the original radius, causes the capacity loss to fall to 3%. This suggests that the impact of a DVB-T channel adjacent to a UMTS downlink channel can be reduced to acceptable levels of interference impact, by either an increasing the guard band, or by reducing the UMTS cell size. If spectrum packages are allocated without a guard band then a reduction in UMTS cell size will mitigate the interference effect; however, the overall net effect of this will be a significant increase in the overall site count, possibly an order of magnitude increase in cell numbers. Our recommendation is that this adjacent channel interference effect is further investigated and that means to mitigate interference are fully assessed and quantified. It is likely that modern antenna techniques such as Multiple In, Multiple Out, beam-forming and Space Division Multiple Access may make such interference negligible.
• DVB-H Interference to UMTS Downlink. The interference effect in this scenario was also considered in terms of the impact on UMTS downlink network capacity, evaluated using SEAMCAT. Results suggest a capacity loss of 7% in urban network deployments and 34% in rural deployments for a 3 MHz frequency separation, highlighting a significant impact in the rural case. This is due to the UMTS rural cell size (a five-fold increased compared to the urban case). However, reducing the cell size or increasing the frequency offset to at least 8 MHz will mitigate the interference effect, as previously discussed. Our recommendation in this case is also to undertake further investigation of the potential for mitigation and the effect on UMTS cell numbers. Again, it is likely that modern antenna techniques, such as Multiple In, Multiple Out, beam-forming and Space Division Multiple Access may make such interference negligible.
• UMTS Downlink Interference to DTT: Results suggest that UMTS base stations could interfere with DTT reception, but that suitable mitigation may be applied in the form of careful UMTS base station azimuth setting. We have calculated that UMTS base stations will interfere with some DTT receivers if there is no guard band between the DTT and the UMTS carrier, unless mitigation is applied to mitigate outgoing ACI at the UMTS base station. A smaller number of DTT receivers will still suffer interference with a 5 MHz guard band between the UMTS downlink and DTT channel. Analysis of UMTS BS to DTT ACI using the Crystal Palace area as an example suggests that the level of mitigation (+dB) required to ensure that 100% of DTT users will be interference free is 36.2dB with 0 MHz offset (no guard band) and 20.5 MHz with 5 MHz guard band. We also conducted analysis based on DTT
9XNA004C | 70

coverage around Winter Hill; in this case the mitigation required was 13.5 dB with no guard band. With a 5 MHz guard band, no mitigation was required since all receivers were calculated to be within their operating threshold. The table below illustrates how the level of mitigation varies compared with the percentage of DVB-T receivers free from degraded operation for the Crystal Palace example23.
Co Channel 0MHz 5MHz 10MHz100.0% 72.6 36.2 20.5 14.499.5% 60.7 24.3 8.6 2.599.0% 53.7 17.3 1.6 -4.595.0% 45.2 8.8 -6.9 -13.050.0% 23.0 -13.3 -29.1 -35.2
Table 5.1: Level of Mitigation Required (dB) to Achieve % of DVB-T Receivers free from Adverse Effects of ACI [Source: Mason]
The DTT users that are affected by ACI are those users towards the edge of the DTT transmitter coverage area. This is illustrated by Figure 5.4, which shows affected users in an adjacent frequency separated by 5 MHz guard band:
UMTS BS to Ch 30 DVB-T Crystal PalaceMitigation Reqired w ith a 5MHz Guard Band (dB)
0 to 20.6 (15)-16 to 0 (179)-18.4 to -16 (78)-21.2 to -18.4 (78)-23.6 to -21.2 (81)-25.3 to -23.6 (71)-27.5 to -25.3 (88)-29.2 to -27.5 (82)-31.1 to -29.2 (82)-33.1 to -31.1 (78)-34.7 to -33.1 (84)-36.6 to -34.7 (77)-38.6 to -36.6 (81)-41.4 to -38.6 (86)-44.5 to -41.4 (84)-66.2 to -44.5 (86)
Figure 5.2: ACI from UMTS Base Stations into Crystal Palace Channel 30 DVB-T [Source: Mason]
23 Appendix B of the report also illustrates the level of mitigation required in a second example, based at Winter Hill.
9XNA004C | 71

Results suggests that careful antenna azimuth setting or other mitigation at the UMTS base station could achieve the required isolation to avoid outgoing ACI; for example, that if it can be ensured that UMTS base stations more than 20km from DTT transmitters avoid antenna azimuths of 180 degrees from the direction of the DVB-T transmitter, this will mitigate interference into outlying DTT receivers. Where azimuths cannot be set at 180 degrees from the DVB-T transmitter then additional filtering (20dB) could be applied to the UMTS BS to prevent ACI. This will require a guard band of 5MHz or more is in place between the interfering UMTS BS (downlink) channel and the victim DVB-T channel to allow for a filter attenuation slope. This guard band in itself will greatly reduce the occurrences of DVB-T receiver derogation, reducing the number of sites where filters are required.
• UMTS Downlink Interference to DVB-H: Modelling of UMTS base station interference to DVB-H receivers using ICS Telecom suggested that base stations could also affect DVB-H reception, depending on the path between the interfering base station and the victim DVB-H receiver. Our results illustrate that when UMTS and DVB-H base stations are co-located, adjacent channel interference from UMTS base stations to DVB-H receivers is not a cause for concern, since in all but the co-channel case, a margin of safety exists preventing ACI. However, although interference to DVB-H receivers is minimised in this case, UMTS base station receivers will suffer interference from the DVB-H transmitter.
When UMTS and DVB-H base stations are not co-located and planned independently of each other, our results illustrate that with no guard band, 66.3 dB mitigation is required to achieve 100% free interference (37.8dB for 99.5% of devices to be interference free). With a 5 MHz guard band, the mitigation required is 50.6 dB (22.1dB for 99.5% free operation).
Table 5.2 below shows the level of mitigation (+dB) or the margin of safety (-dB) required to achieve the stated percentage of DVB-H receivers free from degraded operation due to ACI from UMTS base stations in the co-channel and in an adjacent channel separated by various guard bands.
9XNA004C | 72

Co Channel 0MHz 5MHz 10MHz100.0% 102.7 66.3 50.6 44.599.5% 74.2 37.8 22.1 16.099.0% 69.7 33.3 17.6 11.595.0% 52.2 15.8 0.1 -6.050.0% 26.5 -9.9 -25.6 -31.7
Table 5.2: Level of Mitigation Required (dB) to Achieve % of DVB-H receivers free from adverse effects of UMTS BS ACI
• DTT Interference into UMTS Uplink: We have calculated interference from DTT to the UMTS uplink (base station receivers) to result in 44.5 dB mitigation being required with no guard band between channels to ensure 100% of UMTS base station receivers are interference free. With 5 MHz guard band the level of mitigation required falls to 33.3 dB. These results relate to an example analysis assuming the Crystal Palace DTT transmitter. Repeating the analysis for the Winter Hill transmitter gives mitigation figures of 30.8 dB with no guard band, and 19.5 dB with 5 MHz guard band.
• DVB-H Interference into UMTS Uplink: In the case of DVB-H interference to the UMTS uplink (base receivers), if base stations are co-located then the isolation requirement is very high (81.1dB in the worst adjacent channel scenario with no frequency separation, or 69.5dB with 5 MHz guard band). If base stations are not co-located, results show that mitigation is still required at a percentage of UMTS base stations to overcome interference from DVB-H transmitters, if the two networks are not coordinated. The level required depends on the frequency separation between the DVB-H transmitter and the UMTS uplink (base receive) channel. In the worst adjacent channel case with no frequency offset, the isolation requirement is 51.8 dB to overcome interference.
9XNA004C | 73

6. Mobile Broadband Technologies: FDD/TDD Compatibility when Deployed in UHF Spectrum
6.1 Introduction
Ofcom’s intention is to allow maximum flexibility to the market to choose services and technologies to be deployed in UHF released spectrum, driven by individual business plans and consumer needs.
The ITU’s IMT family of technologies includes technologies using Frequency Division Duplex (FDD) and others that use Time Division Duplex (TDD). Previous studies have highlighted constraints associated with co-siting IMT FDD and TDD technologies, due to issues of adjacent channel interference24.
It is possible a mix of FDD and TDD technologies could use the DDR released spectrum, and so compatibility issues between the two need to be considered.
This section describes possible deployment constraints that might exist if FDD and TDD technologies are deployed in UHF released spectrum. Our analysis is based on previous detailed analysis of FDD/TDD co-existence in the 2500-2690 MHz band, published by Ofcom during 2006.
6.2 FDD/TDD Co-Existence
This section summarises the results of our FDD and TDD co-existence modelling. The aim of this modelling was to calculate the additional isolation required to avoid adjacent channel interference between systems operating in neighbouring spectrum blocks (considered at 5MHz, 10MHz and 15MHz offsets between the centre frequency of the interfering system and the interfered (or ‘victim’) system). The calculation was undertaken for various deployment scenarios (co-located systems, and systems with some distance isolation between them). Based on the additional isolation calculated, we then considered appropriate interference mitigation techniques that could be employed, and their effect on the potential for interference.
The approach used to assessing FDD/TDD co-existence is the same approach as used in the assessment of FDD/TDD co-existence in the 2500-2690 MHz band. This characterises adjacent channel spectral leakage by the Adjacent Channel Leakage Radio (ACLR), which is defined by:
24 2.6 GHz Study Report, Mason Communications report for Ofcom, 2006
9XNA004C | 74
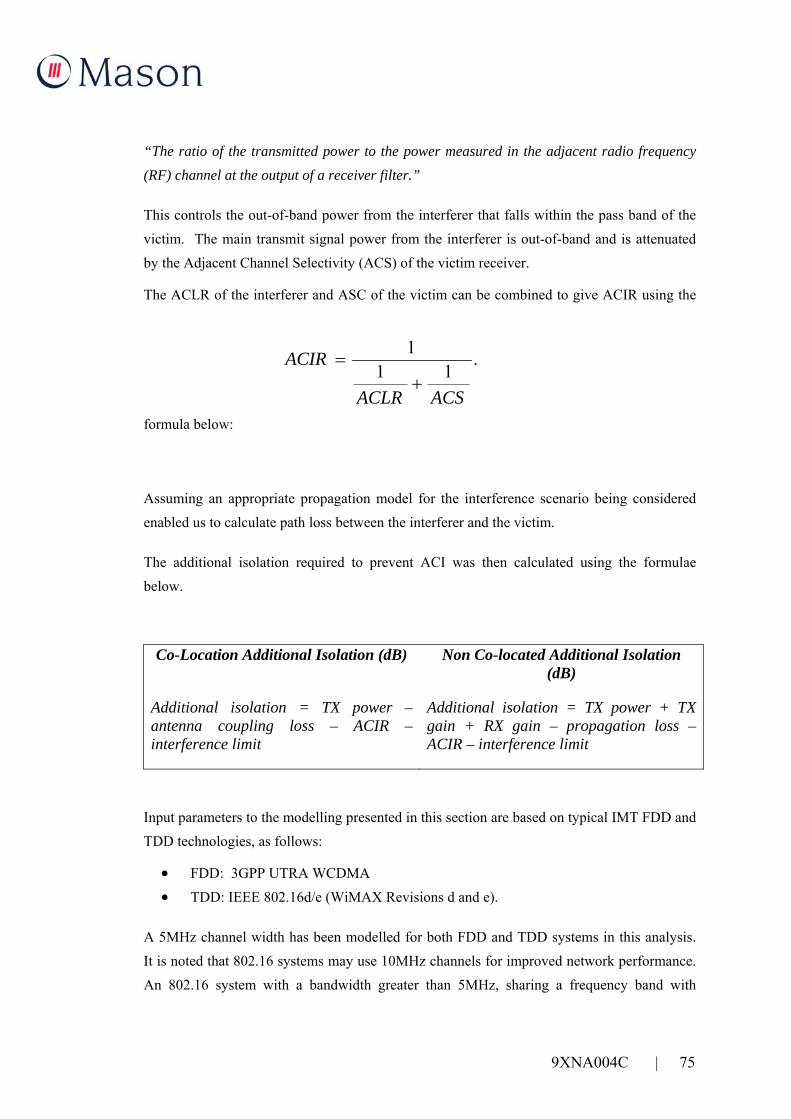
“The ratio of the transmitted power to the power measured in the adjacent radio frequency (RF) channel at the output of a receiver filter.”
This controls the out-of-band power from the interferer that falls within the pass band of the victim. The main transmit signal power from the interferer is out-of-band and is attenuated by the Adjacent Channel Selectivity (ACS) of the victim receiver.
The ACLR of the interferer and ASC of the victim can be combined to give ACIR using the
formula below:
Assuming an appropriate propagation model for the interference scenario being considered enabled us to calculate path loss between the interferer and the victim.
The additional isolation required to prevent ACI was then calculated using the formulae below.
.11
1
ACSACLR
ACIR+
=
Co-Location Additional Isolation (dB) Non Co-located Additional Isolation (dB)
Additional isolation = TX power – antenna coupling loss – ACIR – interference limit
Additional isolation = TX power + TX gain + RX gain – propagation loss – ACIR – interference limit
Input parameters to the modelling presented in this section are based on typical IMT FDD and TDD technologies, as follows:
• FDD: 3GPP UTRA WCDMA • TDD: IEEE 802.16d/e (WiMAX Revisions d and e).
A 5MHz channel width has been modelled for both FDD and TDD systems in this analysis. It is noted that 802.16 systems may use 10MHz channels for improved network performance. An 802.16 system with a bandwidth greater than 5MHz, sharing a frequency band with
9XNA004C | 75
WCDMA, would typically result in less interference to WCDMA, but more interference from WCDMA to 802.16 than is presented in our analysis.
Link budget parameters used are consistent with the UMTS link budget values specified in Appendix C.
6.2.1 Co-Existence without Mitigation
The additional isolation required to prevent ACI for the various FDD/TDD interference modes is summarised in the tables below, corresponding to 5MHz, 10MHz and 15MHz offsets respectively from the carrier frequency. Results are presented for both lower and upper cleared channels.
Where the result is negative, the value represents the margin that exists between interferer and victim. Red is used to highlight a requirement for additional isolation, and green indicates a margin for safety. (For base-to-base interference, the 10-metre separation case is shown in black, since this was not considered to be a typical separation based on typical site configuration.)
Since these results represent the interference potential without mitigation (i.e. the worst case), in the case of directional antennas, both antennas of victim and interferer are modelled as pointing directly at each other, and with no down tilt. In the case of devices with power control, the interferer is assumed to be transmitting at full power.
9XNA004C | 76

Class Interferer Victim Co-lo 1 10 50 100 500 1000FDD Macro Base Station TDD Base Station 78.0 90.8 76.8 70.8 56.8 50.8TDD Base Station FDD Macro Base Station 69.7 82.5 68.5 62.5 48.5 42.5FDD Micro Base Station TDD Base Station 26.0 71.8 43.8 31.8 3.8 -8.2TDD Base Station FDD Micro Base Station 22.7 68.5 40.5 28.5 0.5 -11.5FDD Pico Base Station TDD Base Station 0.0 52.8 24.8 12.8 -15.2 -27.2TDD Base Station FDD Pico Base Station 10.7 63.5 35.5 23.5 -4.5 -16.5TDD Base Station TDD Base Station 62.6 75.3 61.4 55.3 41.4 35.3FDD Macro Base Station TDD Fixed Sub 46.8 87.9 74.0 67.9 54.0 47.9FDD Micro Base Station TDD Fixed Sub 61.7 69.0 41.0 29.0 1.0 -11.0FDD Pico Base Station TDD Fixed Sub 16.2 50.0 22.0 10.0 -18.0 -30.0TDD Base Station TDD Fixed Sub 66.5 76.0 48.0 36.0 8.0 -4.0TDD Base Station FDD Mobile 34.6 71.8 43.9 31.8 3.9 -8.2FDD Macro Base Station TDD Mobile 42.8 77.0 49.0 37.0 9.0 -3.0FDD Micro Base Station TDD Mobile 34.8 62.0 34.0 22.0 -6.0 -18.0FDD Pico Base Station TDD Mobile 56.5 43.0 15.0 3.0 -25.0 -37.0TDD Base Station TDD Mobile 31.8 69.0 41.0 29.0 1.0 -11.0TDD Fixed Sub FDD Macro Base Station 31.1 68.3 40.3 28.3 0.3 -11.7TDD Fixed Sub FDD Micro Base Station 51.0 58.3 30.3 18.3 -9.7 -21.7TDD Fixed Sub FDD Pico Base Station 63.8 53.3 25.3 13.3 -14.7 -26.7TDD Fixed Sub TDD Base Station 31.6 68.8 40.8 28.8 0.8 -11.2TDD Mobile FDD Macro Base Station 25.8 60.0 32.0 20.0 -8.0 -20.0TDD Mobile FDD Micro Base Station 45.7 50.0 22.0 10.0 -18.0 -30.0TDD Mobile FDD Pico Base Station 58.5 45.0 17.0 5.0 -23.0 -35.0FDD Mobile TDD Base Station 24.6 61.8 33.8 21.8 -6.2 -18.2TDD Mobile TDD Base Station 23.6 60.8 32.8 20.8 -7.2 -19.2TDD Mobile FDD Mobile 54.3 47.8 15.8 3.8 -24.2 -36.2FDD Mobile TDD Mobile 57.1 50.5 18.6 6.6 -21.4 -33.4TDD Mobile TDD Mobile 56.1 49.5 17.6 5.6 -22.4 -34.4TDD Fixed Sub FDD Mobile 56.8 54.2 26.3 14.2 -13.7 -25.8TDD Fixed Sub TDD Mobile 60.8 58.2 30.3 18.2 -9.7 -21.8FDD Mobile TDD Fixed Sub 56.1 53.6 25.6 13.6 -14.4 -26.4TDD Mobile TDD Fixed Sub 55.1 52.6 24.6 12.6 -15.4 -27.4
Fixed Sub to Fixed Sub TDD Fixed Sub TDD Fixed Sub 56.1 65.5 51.5 45.5 31.5 25.5
Additional Isolation or Margin at 5MHz Offset (dB)
Base to Base
Base to Fixed Sub
Base to Mobile
Fixed Sub to Base
Mobile to Base
Mobile to Mobile
Fixed Sub to Mobile
Mobile to Fixed Sub
Interference Path
Figure 6.1: Additional Isolation or Margin at 5 MHz Offset – Lower Cleared Channels
Class Interferer Victim Co-lo 1 10 50 100 500 1000FDD Macro Base Station TDD Base Station 73.0 85.8 71.8 65.8 51.8 45.8TDD Base Station FDD Macro Base Station 57.6 70.4 56.4 50.4 36.4 30.4FDD Micro Base Station TDD Base Station 21.0 66.8 38.9 26.8 -1.1 -13.2TDD Base Station FDD Micro Base Station 10.6 56.4 28.5 16.4 -11.5 -23.6FDD Pico Base Station TDD Base Station -5.0 47.8 19.9 7.8 -20.1 -32.2TDD Base Station FDD Pico Base Station -1.4 51.4 23.5 11.4 -16.5 -28.6TDD Base Station TDD Base Station 51.5 64.2 50.2 44.2 30.2 24.2FDD Macro Base Station TDD Fixed Sub 36.1 77.3 63.3 57.3 43.3 37.3FDD Micro Base Station TDD Fixed Sub 51.0 58.3 30.3 18.3 -9.7 -21.7FDD Pico Base Station TDD Fixed Sub 5.5 39.3 11.3 -0.7 -28.7 -40.7TDD Base Station TDD Fixed Sub 48.1 57.6 29.6 17.6 -10.4 -22.4TDD Base Station FDD Mobile 24.6 61.8 33.9 21.8 -6.1 -18.2FDD Macro Base Station TDD Mobile 32.1 66.3 38.3 26.3 -1.7 -13.7FDD Micro Base Station TDD Mobile 24.1 51.3 23.3 11.3 -16.7 -28.7FDD Pico Base Station TDD Mobile 45.8 32.3 4.3 -7.7 -35.7 -47.7TDD Base Station TDD Mobile 13.4 50.6 22.6 10.6 -17.4 -29.4TDD Fixed Sub FDD Macro Base Station 17.4 54.6 26.6 14.6 -13.4 -25.4TDD Fixed Sub FDD Micro Base Station 37.3 44.6 16.6 4.6 -23.4 -35.4TDD Fixed Sub FDD Pico Base Station 50.1 39.6 11.6 -0.4 -28.4 -40.4TDD Fixed Sub TDD Base Station 17.7 54.8 26.9 14.8 -13.1 -25.2TDD Mobile FDD Macro Base Station 8.4 42.6 14.6 2.6 -25.4 -37.4TDD Mobile FDD Micro Base Station 28.3 32.6 4.6 -7.4 -35.4 -47.4TDD Mobile FDD Pico Base Station 41.1 27.6 -0.4 -12.4 -40.4 -52.4FDD Mobile TDD Base Station 14.6 51.8 23.8 11.8 -16.2 -28.2TDD Mobile TDD Base Station 5.7 42.8 14.9 2.8 -25.1 -37.2TDD Mobile FDD Mobile 41.9 35.4 3.5 -8.6 -36.5 -48.6FDD Mobile TDD Mobile 46.4 39.9 7.9 -4.1 -32.1 -44.1TDD Mobile TDD Mobile 37.9 31.4 -0.5 -12.6 -40.5 -52.6TDD Fixed Sub FDD Mobile 45.9 43.4 15.5 3.4 -24.5 -36.6TDD Fixed Sub TDD Mobile 49.9 47.4 19.5 7.4 -20.5 -32.6FDD Mobile TDD Fixed Sub 45.4 42.9 14.9 2.9 -25.1 -37.1TDD Mobile TDD Fixed Sub 36.9 34.4 6.5 -5.6 -33.5 -45.6
Fixed Sub to Fixed Sub TDD Fixed Sub TDD Fixed Sub 40.9 50.4 36.4 30.4 16.4 10.4
Fixed Sub to Mobile
Base to Fixed Sub
Mobile to Fixed Sub
Additional Isolation or Margin at 10MHz Offset (dB)
Fixed Sub to Base
Mobile to Base
Base to Mobile
Base to Base
Interference Path
Mobile to Mobile
Figure 6.2: Additional Isolation or Margin at 10 MHz Offset – Lower Cleared Channels
9XNA004C | 77

Class Interferer Victim Co-lo 1 10 50 100 500 1000FDD Macro Base Station TDD Base Station 57.8 70.5 56.5 50.5 36.5 30.5TDD Base Station FDD Macro Base Station 50.5 63.2 49.2 43.2 29.2 23.2FDD Micro Base Station TDD Base Station 5.8 51.6 23.6 11.6 -16.4 -28.4TDD Base Station FDD Micro Base Station 3.5 49.2 21.3 9.2 -18.7 -30.8FDD Pico Base Station TDD Base Station -20.2 32.6 4.6 -7.4 -35.4 -47.4TDD Base Station FDD Pico Base Station -8.5 44.2 16.3 4.2 -23.7 -35.8TDD Base Station TDD Base Station 49.0 61.8 47.8 41.8 27.8 21.8FDD Macro Base Station TDD Fixed Sub 22.1 63.3 49.3 43.3 29.3 23.3FDD Micro Base Station TDD Fixed Sub 37.0 44.3 16.4 4.3 -23.6 -35.7FDD Pico Base Station TDD Fixed Sub -8.5 25.3 -2.6 -14.7 -42.6 -54.7TDD Base Station TDD Fixed Sub 41.8 51.2 23.3 11.2 -16.7 -28.8TDD Base Station FDD Mobile 18.7 55.9 27.9 15.9 -12.1 -24.1FDD Macro Base Station TDD Mobile 18.1 52.3 24.4 12.3 -15.6 -27.7FDD Micro Base Station TDD Mobile 10.1 37.3 9.4 -2.7 -30.6 -42.7FDD Pico Base Station TDD Mobile 31.8 18.3 -9.6 -21.7 -49.6 -61.7TDD Base Station TDD Mobile 7.1 44.2 16.3 4.2 -23.7 -35.8TDD Fixed Sub FDD Macro Base Station 13.8 51.0 23.0 11.0 -17.0 -29.0TDD Fixed Sub FDD Micro Base Station 33.7 41.0 13.0 1.0 -27.0 -39.0TDD Fixed Sub FDD Pico Base Station 46.5 36.0 8.0 -4.0 -32.0 -44.0TDD Fixed Sub TDD Base Station 14.6 51.8 23.8 11.8 -16.2 -28.2TDD Mobile FDD Macro Base Station 4.8 39.0 11.0 -1.0 -29.0 -41.0TDD Mobile FDD Micro Base Station 24.7 29.0 1.0 -11.0 -39.0 -51.0TDD Mobile FDD Pico Base Station 37.5 24.0 -4.0 -16.0 -44.0 -56.0FDD Mobile TDD Base Station 0.2 37.4 9.5 -2.6 -30.5 -42.6TDD Mobile TDD Base Station 2.6 39.8 11.8 -0.2 -28.2 -40.2TDD Mobile FDD Mobile 36.5 30.0 -1.9 -14.0 -41.9 -54.0FDD Mobile TDD Mobile 32.3 25.7 -6.2 -18.2 -46.2 -58.2TDD Mobile TDD Mobile 34.5 27.9 -4.0 -16.0 -44.0 -56.0TDD Fixed Sub FDD Mobile 40.5 38.0 10.1 -2.0 -29.9 -42.0TDD Fixed Sub TDD Mobile 44.5 42.0 14.1 2.0 -25.9 -38.0FDD Mobile TDD Fixed Sub 31.3 28.8 0.8 -11.2 -39.2 -51.2TDD Mobile TDD Fixed Sub 33.5 31.0 3.0 -9.0 -37.0 -49.0
Fixed Sub to Fixed Sub TDD Fixed Sub TDD Fixed Sub 37.5 46.9 33.0 26.9 13.0 6.9
Interference Path
Base to Base
Mobile to Mobile
Fixed Sub to Mobile
Mobile to Fixed Sub
Additional Isolation or Margin at 15MHz Offset (dB)
Mobile to Base
Base to Fixed Sub
Base to Mobile
Fixed Sub to Base
Figure 6.3: Additional Isolation or Margin at 15 MHz Offset – Lower Cleared Channels
Class Interferer Victim Co-lo 1 10 50 100 500 1000FDD Macro Base Station TDD Base Station 78.0 87.5 73.5 67.5 53.5 47.5TDD Base Station FDD Macro Base Station 69.7 79.2 65.2 59.2 45.2 39.2FDD Micro Base Station TDD Base Station 26.0 66.9 39.0 26.9 -1.0 -13.1TDD Base Station FDD Micro Base Station 22.7 63.6 35.7 23.6 -4.3 -16.4FDD Pico Base Station TDD Base Station 0.0 47.9 20.0 7.9 -20.0 -32.1TDD Base Station FDD Pico Base Station 10.7 58.6 30.7 18.6 -9.3 -21.4TDD Base Station TDD Base Station 62.6 72.1 58.1 52.1 38.1 32.1FDD Macro Base Station TDD Fixed Sub 46.8 84.7 70.7 64.7 50.7 44.7FDD Micro Base Station TDD Fixed Sub 61.7 64.1 36.1 24.1 -3.9 -15.9FDD Pico Base Station TDD Fixed Sub 16.2 45.1 17.1 5.1 -22.9 -34.9TDD Base Station TDD Fixed Sub 66.5 71.1 43.1 31.1 3.1 -8.9TDD Base Station FDD Mobile 34.6 66.9 39.0 26.9 -1.0 -13.1FDD Macro Base Station TDD Mobile 42.8 72.1 44.1 32.1 4.1 -7.9FDD Micro Base Station TDD Mobile 34.8 57.1 29.1 17.1 -10.9 -22.9FDD Pico Base Station TDD Mobile 56.5 38.1 10.1 -1.9 -29.9 -41.9TDD Base Station TDD Mobile 31.8 64.1 36.1 24.1 -3.9 -15.9TDD Fixed Sub FDD Macro Base Station 31.1 63.4 35.5 23.4 -4.5 -16.6TDD Fixed Sub FDD Micro Base Station 51.0 53.4 25.5 13.4 -14.5 -26.6TDD Fixed Sub FDD Pico Base Station 63.8 48.4 20.5 8.4 -19.5 -31.6TDD Fixed Sub TDD Base Station 31.6 63.9 36.0 23.9 -4.0 -16.1TDD Mobile FDD Macro Base Station 25.8 55.1 27.2 15.1 -12.8 -24.9TDD Mobile FDD Micro Base Station 45.7 45.1 17.2 5.1 -22.8 -34.9TDD Mobile FDD Pico Base Station 58.5 40.1 12.2 0.1 -27.8 -39.9FDD Mobile TDD Base Station 24.6 56.9 28.9 16.9 -11.1 -23.1TDD Mobile TDD Base Station 23.6 55.9 27.9 15.9 -12.1 -24.1TDD Mobile FDD Mobile 54.3 44.5 11.0 -1.1 -29.0 -41.1FDD Mobile TDD Mobile 57.1 47.3 13.7 1.7 -26.3 -38.3TDD Mobile TDD Mobile 56.1 46.3 12.7 0.7 -27.3 -39.3TDD Fixed Sub FDD Mobile 56.8 49.4 21.4 9.4 -18.6 -30.6TDD Fixed Sub TDD Mobile 60.8 53.4 25.4 13.4 -14.6 -26.6FDD Mobile TDD Fixed Sub 56.1 48.7 20.7 8.7 -19.3 -31.3TDD Mobile TDD Fixed Sub 55.1 47.7 19.7 7.7 -20.3 -32.3
Fixed Sub to Fixed Sub TDD Fixed Sub TDD Fixed Sub 56.1 62.3 48.3 42.3 28.3 22.3
Additional Isolation or Margin at 5MHz Offset (dB)
Base to Base
Base to Fixed Sub
Base to Mobile
Fixed Sub to Base
Mobile to Base
Mobile to Mobile
Fixed Sub to Mobile
Mobile to Fixed Sub
Interference Path
Figure 6.4: Additional Isolation or Margin at 5 MHz Offset – Upper Cleared Channels
9XNA004C | 78

Class Interferer Victim Co-lo 1 10 50 100 500 1000FDD Macro Base Station TDD Base Station 73.0 82.5 68.6 62.5 48.6 42.5TDD Base Station FDD Macro Base Station 57.6 67.1 53.2 47.1 33.2 27.1FDD Micro Base Station TDD Base Station 21.0 62.0 34.0 22.0 -6.0 -18.0TDD Base Station FDD Micro Base Station 10.6 51.5 23.6 11.5 -16.4 -28.5FDD Pico Base Station TDD Base Station -5.0 43.0 15.0 3.0 -25.0 -37.0TDD Base Station FDD Pico Base Station -1.4 46.5 18.6 6.5 -21.4 -33.5TDD Base Station TDD Base Station 51.5 61.0 47.0 41.0 27.0 21.0FDD Macro Base Station TDD Fixed Sub 36.1 74.0 60.0 54.0 40.0 34.0FDD Micro Base Station TDD Fixed Sub 51.0 53.4 25.5 13.4 -14.5 -26.6FDD Pico Base Station TDD Fixed Sub 5.5 34.4 6.5 -5.6 -33.5 -45.6TDD Base Station TDD Fixed Sub 48.1 52.7 24.7 12.7 -15.3 -27.3TDD Base Station FDD Mobile 24.6 56.9 29.0 16.9 -11.0 -23.1FDD Macro Base Station TDD Mobile 32.1 61.4 33.5 21.4 -6.5 -18.6FDD Micro Base Station TDD Mobile 24.1 46.4 18.5 6.4 -21.5 -33.6FDD Pico Base Station TDD Mobile 45.8 27.4 -0.5 -12.6 -40.5 -52.6TDD Base Station TDD Mobile 13.4 45.7 17.7 5.7 -22.3 -34.3TDD Fixed Sub FDD Macro Base Station 17.4 49.7 21.7 9.7 -18.3 -30.3TDD Fixed Sub FDD Micro Base Station 37.3 39.7 11.7 -0.3 -28.3 -40.3TDD Fixed Sub FDD Pico Base Station 50.1 34.7 6.7 -5.3 -33.3 -45.3TDD Fixed Sub TDD Base Station 17.7 50.0 22.0 10.0 -18.0 -30.0TDD Mobile FDD Macro Base Station 8.4 37.7 9.7 -2.3 -30.3 -42.3TDD Mobile FDD Micro Base Station 28.3 27.7 -0.3 -12.3 -40.3 -52.3TDD Mobile FDD Pico Base Station 41.1 22.7 -5.3 -17.3 -45.3 -57.3FDD Mobile TDD Base Station 14.6 46.9 19.0 6.9 -21.0 -33.1TDD Mobile TDD Base Station 5.7 38.0 10.0 -2.0 -30.0 -42.0TDD Mobile FDD Mobile 41.9 32.1 -1.4 -13.5 -41.4 -53.5FDD Mobile TDD Mobile 46.4 36.6 3.1 -9.0 -36.9 -49.0TDD Mobile TDD Mobile 37.9 28.1 -5.4 -17.5 -45.4 -57.5TDD Fixed Sub FDD Mobile 45.9 38.5 10.6 -1.5 -29.4 -41.5TDD Fixed Sub TDD Mobile 49.9 42.5 14.6 2.5 -25.4 -37.5FDD Mobile TDD Fixed Sub 45.4 38.0 10.1 -2.0 -29.9 -42.0TDD Mobile TDD Fixed Sub 36.9 29.5 1.6 -10.5 -38.4 -50.5
Fixed Sub to Fixed Sub TDD Fixed Sub TDD Fixed Sub 40.9 47.1 33.2 27.1 13.2 7.1
Fixed Sub to Mobile
Base to Fixed Sub
Mobile to Fixed Sub
Additional Isolation or Margin at 10MHz Offset (dB)
Fixed Sub to Base
Mobile to Base
Base to Mobile
Base to Base
Interference Path
Mobile to Mobile
Figure 6.5: Additional Isolation or Margin at 10 MHz Offset – Upper Cleared Channels
Class Interferer Victim Co-lo 1 10 50 100 500 1000FDD Macro Base Station TDD Base Station 57.8 67.3 53.3 47.3 33.3 27.3TDD Base Station FDD Macro Base Station 50.5 60.0 46.0 40.0 26.0 20.0FDD Micro Base Station TDD Base Station 5.8 46.7 18.7 6.7 -21.3 -33.3TDD Base Station FDD Micro Base Station 3.5 44.4 16.4 4.4 -23.6 -35.6FDD Pico Base Station TDD Base Station -20.2 27.7 -0.3 -12.3 -40.3 -52.3TDD Base Station FDD Pico Base Station -8.5 39.4 11.4 -0.6 -28.6 -40.6TDD Base Station TDD Base Station 49.0 58.5 44.5 38.5 24.5 18.5FDD Macro Base Station TDD Fixed Sub 22.1 60.0 46.1 40.0 26.1 20.0FDD Micro Base Station TDD Fixed Sub 37.0 39.4 11.5 -0.6 -28.5 -40.6FDD Pico Base Station TDD Fixed Sub -8.5 20.4 -7.5 -19.6 -47.5 -59.6TDD Base Station TDD Fixed Sub 41.8 46.4 18.4 6.4 -21.6 -33.6TDD Base Station FDD Mobile 18.7 51.0 23.1 11.0 -16.9 -29.0FDD Macro Base Station TDD Mobile 18.1 47.4 19.5 7.4 -20.5 -32.6FDD Micro Base Station TDD Mobile 10.1 32.4 4.5 -7.6 -35.5 -47.6FDD Pico Base Station TDD Mobile 31.8 13.4 -14.5 -26.6 -54.5 -66.6TDD Base Station TDD Mobile 7.1 39.4 11.4 -0.6 -28.6 -40.6TDD Fixed Sub FDD Macro Base Station 13.8 46.1 18.1 6.1 -21.9 -33.9TDD Fixed Sub FDD Micro Base Station 33.7 36.1 8.1 -3.9 -31.9 -43.9TDD Fixed Sub FDD Pico Base Station 46.5 31.1 3.1 -8.9 -36.9 -48.9TDD Fixed Sub TDD Base Station 14.6 46.9 19.0 6.9 -21.0 -33.1TDD Mobile FDD Macro Base Station 4.8 34.1 6.1 -5.9 -33.9 -45.9TDD Mobile FDD Micro Base Station 24.7 24.1 -3.9 -15.9 -43.9 -55.9TDD Mobile FDD Pico Base Station 37.5 19.1 -8.9 -20.9 -48.9 -60.9FDD Mobile TDD Base Station 0.2 32.5 4.6 -7.5 -35.4 -47.5TDD Mobile TDD Base Station 2.6 34.9 7.0 -5.1 -33.0 -45.1TDD Mobile FDD Mobile 36.5 26.7 -6.8 -18.9 -46.8 -58.9FDD Mobile TDD Mobile 32.3 22.5 -11.1 -23.1 -51.1 -63.1TDD Mobile TDD Mobile 34.5 24.7 -8.9 -20.9 -48.9 -60.9TDD Fixed Sub FDD Mobile 40.5 33.1 5.2 -6.9 -34.8 -46.9TDD Fixed Sub TDD Mobile 44.5 37.1 9.2 -2.9 -30.8 -42.9FDD Mobile TDD Fixed Sub 31.3 23.9 -4.1 -16.1 -44.1 -56.1TDD Mobile TDD Fixed Sub 33.5 26.1 -1.9 -13.9 -41.9 -53.9
Fixed Sub to Fixed Sub TDD Fixed Sub TDD Fixed Sub 37.5 43.7 29.7 23.7 9.7 3.7
Interference Path
Base to Base
Mobile to Mobile
Fixed Sub to Mobile
Mobile to Fixed Sub
Additional Isolation or Margin at 15MHz Offset (dB)
Mobile to Base
Base to Fixed Sub
Base to Mobile
Fixed Sub to Base
Figure 6.6: Additional Isolation or Margin at 15 MHz Offset – Upper Cleared Channels
9XNA004C | 79

The results of the worst-case analysis demonstrate that FDD/TDD (and TDD/TDD) co-existence is not feasible at a 5MHz offset (equivalent to operation of a FDD or TDD system adjacent to another TDD system, each with 5MHz channel spacing, with no guard band). The worst-case interference mode is BS-BS, for which a separation distance of significantly greater than 1km would be required between base stations to avoid interference.
Interference between a UMTS FDD base station and a WiMAX ‘fixed subscriber station’ using the 802.16d standard is significant, with separation distances in excess of 1km required.
Interference between mobiles (FDD/TDD or TDD/TDD) is also predicted to occur in all scenarios modelled, at short range (10 metres or less between devices). The interference between mobiles reduces significantly at increasing distances, due to the low power of the devices and the power decay-distance relationship.
The results of the worst-case analysis also demonstrate that FDD/TDD and TDD/TDD co-existence is also not feasible at either 10 or 15MHz offsets, since the additional isolation figures are unacceptable. At 10MHz and 15MHz offsets, the separation distance between base stations in the BS-BS interference scenario is again in excess of 1km, with excessive interference also between mobiles, though less than the 5MHz offset case.
This suggests that operation of FDD and TDD systems in adjacent frequency blocks in the UHF cleared is not feasible without consideration of suitable interference mitigation techniques. This conclusion is consistent with FDD/TDD co-existence analysis for other frequency bands (e.g. 2.6 GHz.)
This is considered in the next section.
9XNA004C | 80

6.2.2 Co-existence with Mitigation
We considered the impact of a number of alternative mitigation techniques, based on IMT mitigation as previously studied by ITU-R Working Party 8F25. A summary of mitigation techniques considered is as follows:
♦ Site placement (for macro/micro scenarios) – typically resulting in 17dB additional isolation where macro and micro sites are rooftop and street level respectively
♦ Antenna separation (separating antennas vertically, horizontally or back to back) – typically 10-15dB additional isolation over and above the standard 30dB isolation assumed for macro-to-macro co-location
♦ Antenna polarization – providing a few dB improvement by having antennas orthogonally polarized to each other
♦ Adaptive antennas – little impact on ‘peak’ interference, but can significantly reduce the probability of interference
♦ Transmitter/receiver filtering – depending on the frequency offset, can add around 15dB improvement at 5MHz offset, 60dB at 10MHz offset (based on ITU-R Recommendation M.2045)
♦ Power amplifier linearization techniques – 18dB at 5MHz offset, 13dB at 10MHz offset
♦ TDD power control – can significantly reduce the probability of interference
♦ TDD external synchronisation – synchronisation of neighbouring TDD systems can completely remove TDD/TDD co-existence issues, as it removes the up/down link transmission clash such that transmission and reception do not occur simultaneously in adjacent channels. However, there are significant operational issues associated with synchronising networks, since it means that technologies in adjacent spectrum must be the same, or similar, and also that services are the same (to coordinate the length of uplink and downlink timeslots)
25 ITU-R M.2045
9XNA004C | 81

♦ Reduce transmission power – to achieve the same coverage with less power, more base stations may be required, alternatively, low power systems may be able to utilise channels unsuitable for ‘full’ power use.
Our analysis of the most appropriate mitigation techniques, and their impact, is summarised in Table 2 below, for 10 and 15MHz offset between FDD and TDD carriers (the 5 MHz case is not considered since at this separation, equivalent to 0 MHz offset or operation in adjacent channels, there is insufficient frequency separation for mitigation such as filtering to be feasible).
FDD Macro Base Station TDD Base Station 15 60 5 75 65TDD Base Station FDD Macro Base Station 15 60 5 80 65FDD Micro Base Station TDD Base Station 12 50 62 62TDD Base Station FDD Micro Base Station 12 50 62 62FDD Pico Base Station TDD Base Station 17 30 47 47TDD Base Station FDD Pico Base Station 17 30 47 47TDD Base Station TDD Base Station 15 50 65 50FDD Macro Base Station TDD Fixed Sub 60 5 65 65FDD Micro Base Station TDD Fixed Sub 55 5 60 60FDD Pico Base Station TDD Fixed Sub 40 5 45 45TDD Base Station TDD Fixed Sub 60 5 65 65TDD Base Station FDD Mobile 60 60 60FDD Macro Base Station TDD Mobile 60 60 60FDD Micro Base Station TDD Mobile 55 55 55FDD Pico Base Station TDD Mobile 40 40 40TDD Base Station TDD Mobile 60 60 60TDD Fixed Sub FDD Macro Base Station 60 5 65 65TDD Fixed Sub FDD Micro Base Station 55 5 60 60TDD Fixed Sub FDD Pico Base Station 40 5 45 45TDD Fixed Sub TDD Base Station 60 5 65 65TDD Mobile FDD Macro Base Station 60 60 60TDD Mobile FDD Micro Base Station 55 55 55TDD Mobile FDD Pico Base Station 40 40 40FDD Mobile TDD Base Station 60 60 60TDD Mobile TDD Base Station 60 60 60TDD Mobile FDD Mobile 0 0FDD Mobile TDD Mobile 0 0TDD Mobile TDD Mobile 0 0TDD Fixed Sub FDD Mobile 0 0TDD Fixed Sub FDD Mobile 0 0FDD Mobile TDD Fixed Sub 0 0TDD Mobile TDD Mobile 0 0
Fixed Sub to Fixed Sub TDD Fixed Sub TDD Fixed Sub 10 10 10
Mobile to Mobile
Fixed Sub to Mobile
Mobile to Fixed Sub
Base to Fixed Sub
Base to Mobile
Fixed Sub to Base
Mobile to Base
Base to Base
Antenna Azimuth Co Lo TotalSite
Placement Site Eng. Tx /Rx Filter Separate Total
Mitigation at 10MHz or 15MHz Offset (dB)
Class Interferer Victim
Interference Path
Table 2: Effect of Mitigation at 10MHz and 15MHz Offsets
Applying this mitigation, the figures below illustrate the impact on the isolation requirements previously calculated for the 10MHz and 15MHz offset cases, and for both lower and upper cleared channels.
9XNA004C | 82

Class Interferer Victim Co-lo 1 10 50 100 500 1000FDD Macro Base Station TDD Base Station -2.0 20.8 6.8 0.8 -13.2 -19.2TDD Base Station FDD Macro Base Station -22.4 5.4 -8.6 -14.6 -28.6 -34.6FDD Micro Base Station TDD Base Station -41.0 4.8 -23.1 -35.2 -63.1 -75.2TDD Base Station FDD Micro Base Station -51.4 -5.6 -33.5 -45.6 -73.5 -85.6FDD Pico Base Station TDD Base Station -52.0 0.8 -27.1 -39.2 -67.1 -79.2TDD Base Station FDD Pico Base Station -48.4 4.4 -23.5 -35.6 -63.5 -75.6TDD Base Station TDD Base Station -13.5 14.2 0.2 -5.8 -19.8 -25.8FDD Macro Base Station TDD Fixed Sub -28.9 12.3 -1.7 -7.7 -21.7 -27.7FDD Micro Base Station TDD Fixed Sub -9.0 -1.7 -29.7 -41.7 -69.7 -81.7FDD Pico Base Station TDD Fixed Sub -39.5 -5.7 -33.7 -45.7 -73.7 -85.7TDD Base Station TDD Fixed Sub -16.9 -7.4 -35.4 -47.4 -75.4 -87.4TDD Base Station FDD Mobile -35.4 1.8 -26.1 -38.2 -66.1 -78.2FDD Macro Base Station TDD Mobile -27.9 6.3 -21.7 -33.7 -61.7 -73.7FDD Micro Base Station TDD Mobile -30.9 -3.7 -31.7 -43.7 -71.7 -83.7FDD Pico Base Station TDD Mobile 5.8 -7.7 -35.7 -47.7 -75.7 -87.7TDD Base Station TDD Mobile -46.6 -9.4 -37.4 -49.4 -77.4 -89.4TDD Fixed Sub FDD Macro Base Station -47.6 -10.4 -38.4 -50.4 -78.4 -90.4TDD Fixed Sub FDD Micro Base Station -22.7 -15.4 -43.4 -55.4 -83.4 -95.4TDD Fixed Sub FDD Pico Base Station 5.1 -5.4 -33.4 -45.4 -73.4 -85.4TDD Fixed Sub TDD Base Station -47.3 -10.2 -38.1 -50.2 -78.1 -90.2TDD Mobile FDD Macro Base Station -51.6 -17.4 -45.4 -57.4 -85.4 -97.4TDD Mobile FDD Micro Base Station -26.7 -22.4 -50.4 -62.4 -90.4 -102.4TDD Mobile FDD Pico Base Station 1.1 -12.4 -40.4 -52.4 -80.4 -92.4FDD Mobile TDD Base Station -45.4 -8.2 -36.2 -48.2 -76.2 -88.2TDD Mobile TDD Base Station -54.3 -17.2 -45.1 -57.2 -85.1 -97.2TDD Mobile FDD Mobile 41.9 35.4 3.5 -8.6 -36.5 -48.6FDD Mobile TDD Mobile 46.4 39.9 7.9 -4.1 -32.1 -44.1TDD Mobile TDD Mobile 37.9 31.4 -0.5 -12.6 -40.5 -52.6TDD Fixed Sub FDD Mobile 45.9 43.4 15.5 3.4 -24.5 -36.6TDD Fixed Sub TDD Mobile 49.9 47.4 19.5 7.4 -20.5 -32.6FDD Mobile TDD Fixed Sub 45.4 42.9 14.9 2.9 -25.1 -37.1TDD Mobile TDD Fixed Sub 36.9 34.4 6.5 -5.6 -33.5 -45.6
Fixed Sub to Fixed Sub TDD Fixed Sub TDD Fixed Sub 30.9 40.4 26.4 20.4 6.4 0.4
Fixed Sub to Mobile
Base to Fixed Sub
Mobile to Fixed Sub
Additional Isolation or Margin at 10MHz Offset (dB)
Fixed Sub to Base
Mobile to Base
Base to Mobile
Base to Base
Interference Path
Mobile to Mobile
Figure 6.7: Additional Isolation or Margin with Mitigation at 10 MHz Offset – Lower Cleared Channels
Class Interferer Victim Co-lo 1 10 50 100 500 1000FDD Macro Base Station TDD Base Station -17.2 -4.5 -18.5 -24.5 -38.5 -44.5TDD Base Station FDD Macro Base Station -29.5 -16.8 -30.8 -36.8 -50.8 -56.8FDD Micro Base Station TDD Base Station -56.2 -10.4 -38.4 -50.4 -78.4 -90.4TDD Base Station FDD Micro Base Station -58.5 -12.8 -40.7 -52.8 -80.7 -92.8FDD Pico Base Station TDD Base Station -67.2 -14.4 -42.4 -54.4 -82.4 -94.4TDD Base Station FDD Pico Base Station -55.5 -2.8 -30.7 -42.8 -70.7 -82.8TDD Base Station TDD Base Station -16.0 -3.2 -17.2 -23.2 -37.2 -43.2FDD Macro Base Station TDD Fixed Sub -42.9 -1.7 -15.7 -21.7 -35.7 -41.7FDD Micro Base Station TDD Fixed Sub -23.0 -15.7 -43.6 -55.7 -83.6 -95.7FDD Pico Base Station TDD Fixed Sub -53.5 -19.7 -47.6 -59.7 -87.6 -99.7TDD Base Station TDD Fixed Sub -23.2 -13.8 -41.7 -53.8 -81.7 -93.8TDD Base Station FDD Mobile -41.3 -4.1 -32.1 -44.1 -72.1 -84.1FDD Macro Base Station TDD Mobile -41.9 -7.7 -35.6 -47.7 -75.6 -87.7FDD Micro Base Station TDD Mobile -44.9 -17.7 -45.6 -57.7 -85.6 -97.7FDD Pico Base Station TDD Mobile -8.2 -21.7 -49.6 -61.7 -89.6 -101.7TDD Base Station TDD Mobile -52.9 -15.8 -43.7 -55.8 -83.7 -95.8TDD Fixed Sub FDD Macro Base Station -51.2 -14.0 -42.0 -54.0 -82.0 -94.0TDD Fixed Sub FDD Micro Base Station -26.3 -19.0 -47.0 -59.0 -87.0 -99.0TDD Fixed Sub FDD Pico Base Station 1.5 -9.0 -37.0 -49.0 -77.0 -89.0TDD Fixed Sub TDD Base Station -50.4 -13.2 -41.2 -53.2 -81.2 -93.2TDD Mobile FDD Macro Base Station -55.2 -21.0 -49.0 -61.0 -89.0 -101.0TDD Mobile FDD Micro Base Station -30.3 -26.0 -54.0 -66.0 -94.0 -106.0TDD Mobile FDD Pico Base Station -2.5 -16.0 -44.0 -56.0 -84.0 -96.0FDD Mobile TDD Base Station -59.8 -22.6 -50.5 -62.6 -90.5 -102.6TDD Mobile TDD Base Station -57.4 -20.2 -48.2 -60.2 -88.2 -100.2TDD Mobile FDD Mobile 36.5 30.0 -1.9 -14.0 -41.9 -54.0FDD Mobile TDD Mobile 32.3 25.7 -6.2 -18.2 -46.2 -58.2TDD Mobile TDD Mobile 34.5 27.9 -4.0 -16.0 -44.0 -56.0TDD Fixed Sub FDD Mobile 40.5 38.0 10.1 -2.0 -29.9 -42.0TDD Fixed Sub TDD Mobile 44.5 42.0 14.1 2.0 -25.9 -38.0FDD Mobile TDD Fixed Sub 31.3 28.8 0.8 -11.2 -39.2 -51.2TDD Mobile TDD Fixed Sub 33.5 31.0 3.0 -9.0 -37.0 -49.0
Fixed Sub to Fixed Sub TDD Fixed Sub TDD Fixed Sub 27.5 36.9 23.0 16.9 3.0 -3.1
Interference Path
Base to Base
Mobile to Mobile
Fixed Sub to Mobile
Mobile to Fixed Sub
Additional Isolation or Margin at 15MHz Offset (dB)
Mobile to Base
Base to Fixed Sub
Base to Mobile
Fixed Sub to Base
Figure 6.8: Additional Isolation or Margin with Mitigation at 15 MHz Offset – Lower Cleared Channels
9XNA004C | 83

Class Interferer Victim Co-lo 1 10 50 100 500 1000FDD Macro Base Station TDD Base Station -2.0 17.5 3.6 -2.5 -16.4 -22.5TDD Base Station FDD Macro Base Station -22.4 2.1 -11.8 -17.9 -31.8 -37.9FDD Micro Base Station TDD Base Station -41.0 0.0 -28.0 -40.0 -68.0 -80.0TDD Base Station FDD Micro Base Station -51.4 -10.5 -38.4 -50.5 -78.4 -90.5FDD Pico Base Station TDD Base Station -52.0 -4.0 -32.0 -44.0 -72.0 -84.0TDD Base Station FDD Pico Base Station -48.4 -0.5 -28.4 -40.5 -68.4 -80.5TDD Base Station TDD Base Station -13.5 11.0 -3.0 -9.0 -23.0 -29.0FDD Macro Base Station TDD Fixed Sub -28.9 9.0 -5.0 -11.0 -25.0 -31.0FDD Micro Base Station TDD Fixed Sub -9.0 -6.6 -34.5 -46.6 -74.5 -86.6FDD Pico Base Station TDD Fixed Sub -39.5 -10.6 -38.5 -50.6 -78.5 -90.6TDD Base Station TDD Fixed Sub -16.9 -12.3 -40.3 -52.3 -80.3 -92.3TDD Base Station FDD Mobile -35.4 -3.1 -31.0 -43.1 -71.0 -83.1FDD Macro Base Station TDD Mobile -27.9 1.4 -26.5 -38.6 -66.5 -78.6FDD Micro Base Station TDD Mobile -30.9 -8.6 -36.5 -48.6 -76.5 -88.6FDD Pico Base Station TDD Mobile 5.8 -12.6 -40.5 -52.6 -80.5 -92.6TDD Base Station TDD Mobile -46.6 -14.3 -42.3 -54.3 -82.3 -94.3TDD Fixed Sub FDD Macro Base Station -47.6 -15.3 -43.3 -55.3 -83.3 -95.3TDD Fixed Sub FDD Micro Base Station -22.7 -20.3 -48.3 -60.3 -88.3 -100.3TDD Fixed Sub FDD Pico Base Station 5.1 -10.3 -38.3 -50.3 -78.3 -90.3TDD Fixed Sub TDD Base Station -47.3 -15.0 -43.0 -55.0 -83.0 -95.0TDD Mobile FDD Macro Base Station -51.6 -22.3 -50.3 -62.3 -90.3 -102.3TDD Mobile FDD Micro Base Station -26.7 -27.3 -55.3 -67.3 -95.3 -107.3TDD Mobile FDD Pico Base Station 1.1 -17.3 -45.3 -57.3 -85.3 -97.3FDD Mobile TDD Base Station -45.4 -13.1 -41.0 -53.1 -81.0 -93.1TDD Mobile TDD Base Station -54.3 -22.0 -50.0 -62.0 -90.0 -102.0TDD Mobile FDD Mobile 41.9 32.1 -1.4 -13.5 -41.4 -53.5FDD Mobile TDD Mobile 46.4 36.6 3.1 -9.0 -36.9 -49.0TDD Mobile TDD Mobile 37.9 28.1 -5.4 -17.5 -45.4 -57.5TDD Fixed Sub FDD Mobile 45.9 38.5 10.6 -1.5 -29.4 -41.5TDD Fixed Sub TDD Mobile 49.9 42.5 14.6 2.5 -25.4 -37.5FDD Mobile TDD Fixed Sub 45.4 38.0 10.1 -2.0 -29.9 -42.0TDD Mobile TDD Fixed Sub 36.9 29.5 1.6 -10.5 -38.4 -50.5
Fixed Sub to Fixed Sub TDD Fixed Sub TDD Fixed Sub 30.9 37.1 23.2 17.1 3.2 -2.9
Fixed Sub to Mobile
Base to Fixed Sub
Mobile to Fixed Sub
Additional Isolation or Margin at 10MHz Offset (dB)
Fixed Sub to Base
Mobile to Base
Base to Mobile
Base to Base
Interference Path
Mobile to Mobile
Figure 6.9: Additional Isolation or Margin with Mitigation at 10 MHz Offset – Upper Cleared Channels
Class Interferer Victim Co-lo 1 10 50 100 500 1000FDD Macro Base Station TDD Base Station -17.2 -7.7 -21.7 -27.7 -41.7 -47.7TDD Base Station FDD Macro Base Station -29.5 -20.0 -34.0 -40.0 -54.0 -60.0FDD Micro Base Station TDD Base Station -56.2 -15.3 -43.3 -55.3 -83.3 -95.3TDD Base Station FDD Micro Base Station -58.5 -17.6 -45.6 -57.6 -85.6 -97.6FDD Pico Base Station TDD Base Station -67.2 -19.3 -47.3 -59.3 -87.3 -99.3TDD Base Station FDD Pico Base Station -55.5 -7.6 -35.6 -47.6 -75.6 -87.6TDD Base Station TDD Base Station -16.0 -6.5 -20.5 -26.5 -40.5 -46.5FDD Macro Base Station TDD Fixed Sub -42.9 -5.0 -18.9 -25.0 -38.9 -45.0FDD Micro Base Station TDD Fixed Sub -23.0 -20.6 -48.5 -60.6 -88.5 -100.6FDD Pico Base Station TDD Fixed Sub -53.5 -24.6 -52.5 -64.6 -92.5 -104.6TDD Base Station TDD Fixed Sub -23.2 -18.6 -46.6 -58.6 -86.6 -98.6TDD Base Station FDD Mobile -41.3 -9.0 -36.9 -49.0 -76.9 -89.0FDD Macro Base Station TDD Mobile -41.9 -12.6 -40.5 -52.6 -80.5 -92.6FDD Micro Base Station TDD Mobile -44.9 -22.6 -50.5 -62.6 -90.5 -102.6FDD Pico Base Station TDD Mobile -8.2 -26.6 -54.5 -66.6 -94.5 -106.6TDD Base Station TDD Mobile -52.9 -20.6 -48.6 -60.6 -88.6 -100.6TDD Fixed Sub FDD Macro Base Station -51.2 -18.9 -46.9 -58.9 -86.9 -98.9TDD Fixed Sub FDD Micro Base Station -26.3 -23.9 -51.9 -63.9 -91.9 -103.9TDD Fixed Sub FDD Pico Base Station 1.5 -13.9 -41.9 -53.9 -81.9 -93.9TDD Fixed Sub TDD Base Station -50.4 -18.1 -46.0 -58.1 -86.0 -98.1TDD Mobile FDD Macro Base Station -55.2 -25.9 -53.9 -65.9 -93.9 -105.9TDD Mobile FDD Micro Base Station -30.3 -30.9 -58.9 -70.9 -98.9 -110.9TDD Mobile FDD Pico Base Station -2.5 -20.9 -48.9 -60.9 -88.9 -100.9FDD Mobile TDD Base Station -59.8 -27.5 -55.4 -67.5 -95.4 -107.5TDD Mobile TDD Base Station -57.4 -25.1 -53.0 -65.1 -93.0 -105.1TDD Mobile FDD Mobile 36.5 26.7 -6.8 -18.9 -46.8 -58.9FDD Mobile TDD Mobile 32.3 22.5 -11.1 -23.1 -51.1 -63.1TDD Mobile TDD Mobile 34.5 24.7 -8.9 -20.9 -48.9 -60.9TDD Fixed Sub FDD Mobile 40.5 33.1 5.2 -6.9 -34.8 -46.9TDD Fixed Sub TDD Mobile 44.5 37.1 9.2 -2.9 -30.8 -42.9FDD Mobile TDD Fixed Sub 31.3 23.9 -4.1 -16.1 -44.1 -56.1TDD Mobile TDD Fixed Sub 33.5 26.1 -1.9 -13.9 -41.9 -53.9
Fixed Sub to Fixed Sub TDD Fixed Sub TDD Fixed Sub 27.5 33.7 19.7 13.7 -0.3 -6.3
Interference Path
Base to Base
Mobile to Mobile
Fixed Sub to Mobile
Mobile to Fixed Sub
Additional Isolation or Margin at 15MHz Offset (dB)
Mobile to Base
Base to Fixed Sub
Base to Mobile
Fixed Sub to Base
Figure 6.10: Additional Isolation or Margin with Mitigation at 15 MHz Offset – Upper Cleared Channels
9XNA004C | 84

6.3 Discussion of Results
The results suggest the application of suitable mitigation techniques at the base station result in co-existence between FDD/TDD and TDD/TDD being feasible in UHF released spectrum at 10MHz and 15MHz offset, assuming standard cellular/mobile broadband deployments (e.g. typical macro site EIRP). Results suggest that operation at 5MHz offset, i.e. in adjacent channels, is not feasible, due to the additional isolation requirement at this offset and limitations on being able to filtering to achieve this (which requires a greater frequency offset in order to achieve the required filter roll-off).
Although interference mitigation techniques, in the form of filtering or antenna changes, can be applied at the base stations of FDD and TDD systems, interference may still occur between FDD and TDD mobiles, since mitigation (other than power control) is not practical in consumer mobile handsets. The results of our analysis suggest that interference will be noticeable when the distance between mobiles is small (less than 10 metres).
However, it is noted that a number of other factors affect the probability of mobile-to- mobile interference occurring, namely:
• The MS transmission power depends on its position within the cell and the load on the system
• If an MS is operating close to its own base station, the base station can increase power to overcome interference.
The results suggest that FDD/TDD co-existence at 5MHz offset (i.e. operation in an adjacent channel) is not feasible for macro cellular deployment. This suggests that technical usage conditions governing FDD and TDD use of the band may have to incorporate alternative spectrum masks, which can be employed depending on the nature of the systems operating in neighbouring bands (e.g. a more restrictive spectrum mask to apply in the event that FDD and TDD is being deployed in adjacent channels with no frequency offset).
9XNA004C | 85

7. Conclusions and Recommendations
Results are summarised as follows:
(a) Incoming and Outgoing International Interference Levels for Lower and Upper Cleared Channels: Results of the mapping exercise to illustrate incoming and outgoing interference per channel within the cleared spectrum, presented in a companion report, suggest that incoming interference will be the dominant factor affecting IMT deployment in UHF spectrum. Incorporating the levels of incoming interference predicted per channel in coverage prediction of the number of IMT cell sites required to achieve different coverage targets, we found that an increase in site count arises, due to the need to mitigate interference (in our analysis, the interference mitigation we have considered is the use of antenna azimuth to avoid the antenna pointing directly at the source of interference, and antenna down tilt, both of which have a corresponding impact on single cell coverage and hence total site count per network). Results illustrate the increase in site count required to accommodate the effects of incoming DTT interference varies on a channel by channel basis, and between lower and upper cleared spectrum blocks, due to the different broadcasting assignments and allotments in different channels in neighbouring countries. Other observations arising from the analysis of the impact of incoming interference on IMT networks are:
• In Scenarios 1 and 2, the IMT site count for lower and upper cleared channels is consistently lower than an equivalent 2100 MHz coverage, despite the need to mitigate incoming interference. The effect of mitigating incoming interference is an increase in site count of between 27% and 68% (compared to the no interference UHF case) for the channels assessed within the lower cleared spectrum, and between 4% and 54% for the channels assessed within the upper cleared spectrum, depending on which channel is being considered. For most channels considered, incoming interference is the dominant constraint on mobile network deployment in UHF cleared spectrum. The exception is channels 36, 38 and 39, which are currently used for other services, including radar and radio astronomy. For these channels, outbound interference constraints on UK networks to protect existing services in neighbouring countries will most likely be the most dominant constraint. Incoming interference is not dominant for these channels since there are no GE-06 assignments as the basis for coordination.
• Results illustrate that the site count is higher for upper cleared spectrum than for lower cleared spectrum. This is due to a number of link budget parameters being varied for lower cleared spectrum compared to upper cleared spectrum, as described
9XNA004C | 86

in Section 3. The difference in site count between upper and lower spectrum is further affected by incoming interference. In our model, the presence of interference requiring mitigation results in down-tilt being applied at a site (which increases the number of sites required to achieve a given coverage target). Whilst the percentage reduction in coverage (due to interference) is the same for upper and lower cleared spectrum, larger areas of the UK need greater levels of mitigation for the upper cleared spectrum compared to the lower cleared spectrum, which explains the difference in results (as illustrated by Tables A.16 and A.17 in Appendix A)
• Levels of incoming interference are different for each channel in the lower and upper cleared spectrum, as a result of corresponding DTT use, and whether a particular channel is being used in Ireland, France, Belgium and/or Holland
• Our example illustration of coverage achieved by combining channels (67 and 68 in our analysis) shows a positive effect, highlighting a slight reduction in site requirements if both channels 67 and 68 are used to achieve coverage, compared to if channel 67 alone was used to provide the same coverage. This is because the two channels are affected by incoming interference at different locations (due to the source of the incoming interference being either Ireland, France, Belgium or Holland), suggesting that operators who acquire two cleared channels may be able to use carrier planning as a mitigating factor to optimising site count in the presence of interference.
• In Scenario 3, the target was to provide rural coverage, and so the urban area coverage in this case is set to 0%, with cell sites predicted to cover 70% of suburban areas and 30% of rural areas respectively. In the results for some lower and upper cleared channels based on Scenario 3, the IMT site count predicted as being higher than the comparable ‘no interference’ 2100 MHz network in the presence of interference. This result initially appears counter intuitive, due to the propagation advantage of UHF frequencies, but is thought to be due to incoming interference particularly affecting coastal areas, which coincide with areas categorised as ‘rural’ in the Office of National statistics morphology data. This is particularly highlighted in Scenario 3 because urban coverage is set to 0. For scenarios where coverage is spread across different morphology classes (e.g. Scenario 2), the UHF advantage compared to 2100 MHz is clearer.
• Scenario 3 results also highlights an apparent anomaly in the model in that some channels in the upper cleared spectrum (e.g. channel 67) require more sites for
9XNA004C | 87

outdoor coverage compared to the lower cleared spectrum (e.g. channel 40), but less for indoor coverage. We believe that this is a feature of the way that link budget, interference and coverage areas interact in the model, and is to do with the areas that suffer the interference and the levels of mitigation required. Scenario 3 reflects suburban and rural areas and it appears that areas classified in those categories are also areas that typically suffer higher levels of international interference (requiring greater levels of interference mitigation).
• For channels with low levels of interference, neither the site count or the area coverage are sensitive to a change in the assumed interference limit for a UMTS base station of –109 dBm
• Varying the UMTS base station limit impacts site count and the area that can be covered for channels with moderate levels of incoming interference. As the base station interference limit is increased from –105 dBm, site count initially increases to a maximum of 30,000 sites for the lower band (e.g. channels 34, 37, 39) or 50,000 for the upper band (e.g. channel 62, 64)
• For the channels with the highest levels of interference, as the base station interference limit increases to –116 dBm, there is a fall in the area of the UK that can be covered effectively (since the interference mitigation measures covered in this report – azimuth and down tilt – are no longer effective), which results in the model predicting no further increase in site count beyond this.
(b) Adjacent Channel Interference Between UMTS and DTT. We assessed the potential for adjacent channel interference between UMTS and DTT in the following cases:
• UMTS base station to DTT receiver
• UMT mobile to DTT receiver
• DTT transmitter to UMTS mobile
• DTT transmitter to UMTS base station.
Results suggest that UMTS base stations could interfere with DTT reception, but that suitable mitigation may be applied in the form of careful UMTS base station azimuth setting or other mitigation. We have calculated that UMTS base stations will interfere with some DTT receivers if there is no guard band between the DTT and the UMTS carrier, unless mitigation is applied to mitigate outgoing ACI at the UMTS base station. A smaller number of DTT receivers will still suffer interference with a 5 MHz guard band between the UMTS downlink
9XNA004C | 88

and DTT channel. Analysis of UMTS BS to DTT ACI, using the Crystal Palace area as an example, suggests that the level of mitigation (+dB) required to ensure that 100% of DTT users will be interference free is 36.2dB with 0 MHz offset (no guard band) and 20.5 MHz with 5 MHz guard band. Similar analysis using the Winter Hill DTT transmitter area as an example gave results of 13.5dB mitigation with no guard band, and no additional mitigation with 5 MH guard band.
The table below illustrates how the level of mitigation varies compared with the percentage of DVB-T receivers free from degraded operation in the Crystal Palace example26.
Co Channel 0MHz 5MHz 10MHz100.0% 72.6 36.2 20.5 14.499.5% 60.7 24.3 8.6 2.599.0% 53.7 17.3 1.6 -4.595.0% 45.2 8.8 -6.9 -13.050.0% 23.0 -13.3 -29.1 -35.2
Table 7.1: Level of Mitigation Required to Achieve % of DVB-T Receivers Free from Adverse Effects of ACI [Source: Mason]
The DTT users that are affected by ACI are those users towards the edge of the DTT transmitter coverage area. This is illustrated by Figure 7.1, which shows users affected by ACI with channels separated by 5 MHz guard band.
26 Appendix B of the report also illustrates the level of mitigation required in a second example, based at Winter Hill.
9XNA004C | 89

UMTS BS to Ch 30 DVB-T Crystal PalaceMitigation Reqired w ith a 5MHz Guard Band (dB)
0 to 20.6 (15)-16 to 0 (179)-18.4 to -16 (78)-21.2 to -18.4 (78)-23.6 to -21.2 (81)-25.3 to -23.6 (71)-27.5 to -25.3 (88)-29.2 to -27.5 (82)-31.1 to -29.2 (82)-33.1 to -31.1 (78)-34.7 to -33.1 (84)-36.6 to -34.7 (77)-38.6 to -36.6 (81)-41.4 to -38.6 (86)-44.5 to -41.4 (84)-66.2 to -44.5 (86)
Figure 7.1: ACI from UMTS Base Stations into Crystal Palace Channel 30 DVB-T [Source: Mason]
Results suggest that careful antenna azimuth setting or other mitigation at the UMTS base station could achieve the required isolation to avoid outgoing ACI; for example, that if it can be ensured that UMTS base stations more than 20km from DTT transmitters avoid antenna azimuths of 180 degrees from the direction of the DVB-T transmitter, this will mitigate interference into outlying DTT receivers. Where azimuths cannot be set at 180 degrees from the DVB-T transmitter, then additional filtering (e.g. 20dB) could be applied to the UMTS BS to prevent ACI. This will require a guard band of 5MHz or more is in place between the interfering UMTS BS (downlink) channel and the victim DVB-T channel, to allow for a filter attenuation slope. This guard band in itself will greatly reduce the occurrences of DVB-T receiver derogation, reducing the number of sites where filters are requited.
Interference from UMTS mobiles to DTT is calculated at 10.77%, and less than 1% for 0 MHz and 3 MHz frequency offset assumptions respectively, suggesting that a 3 MHz frequency offset is feasible to minimise interference from UMTS mobiles to DTT receivers. This scenario is, therefore, not considered to be a limiting case in terms of spectrum packaging and band planning.
Considering the other interference direction, that of DTT to UMTS, results suggest that DTT transmitters will interfere with both UMTS uplink (base station receivers) and downlink (mobile reception). We have calculated that DTT interference to the UMTS downlink could result in a significant capacity loss to the UMTS cell (20% capacity loss calculated, with a 3 MHz guard band, when the broadcast interference is at its maximum and coincident with the
9XNA004C | 90

UMTS wanted signal at its minimum i.e. at the cell edge). Repeating the simulation with 8 MHz offset/guard band still results in a 14% capacity loss, and so still a significant impact. A viable mitigation may be a reduction in UMTS cell size (however, this will require an order of magnitude increase in the number of cells deployed).
Our calculations suggest that, with no guard band separating channels, interference from DTT to the UMTS uplink (base station receivers) to result in 44.5 dB mitigation being required with no guard band to ensure 100% of UMTS base station receivers are interference free. With 5 MHz guard band the level of mitigation required falls to 33.3 dB. These results relate to an example analysis assuming the Crystal Palace DTT transmitter. Repeating the analysis for the Winter Hill transmitter gives mitigation figures of 30.8 dB with no guard band, and 19.5 dB with 5 MHz guard band.
(c) Adjacent Channel Interference Between UMTS and DVB-H. We assessed the potential for adjacent channel interference between UMTS and DVB-H in the following cases:
• UMTS base station interfering with DVB-H receiver
• UMTS mobile interfering with DVB-H receiver
• DVB-H transmitter interfering with UMTS base station
• DVB-H transmitter interfering with UMTS mobile.
We modelled cases of UMTS base station interference to DVB-H using ICS Telecom, which suggested that base stations could also affect DVB-H reception, depending on the path between the interfering base station and the victim DVB-H receiver.
When UMTS and DVB-H base stations are co-located, adjacent channel interference from UMTS base stations to DVB-H receivers is not a cause for concern, since, in all but the co-channel case, a margin of safety existed preventing ACI. However, when transmitters are co-located, although this reduces the likelihood of interference at DVB-H receivers, UMTS base station receivers could suffer interference from the DVB-H transmitter. When UMTS and DVB-H base stations are not co-located and networks are planned independently of each other, 66.3 dB mitigation is required to ensure 100% of DVB-H receivers are interference free (or 37.8 dB for 99.5% of receivers to be interference free, with no guard band between channels. With a 5 MHz guard band the mitigation is 50.6 dB for 100% of receivers to be free from interference (or 22.1 dB for 99.5% of receivers).
9XNA004C | 91

Statistical simulation of interference from UMTS mobiles to DVB-H receivers using SEAMCAT results in a probability of interference of less than 1%, due to the random distribution of devices. For this reason we re-calculated this scenario using a Minimum Coupling Loss, and assuming the worst case of a UMTS mobile and a DVB-H device being operated in the same room. In this case we found that the sterilisation distance calculated was 15 metres at an offset of 8 MHz, suggesting that UMTS mobiles will interfere with DVB-H receivers if located in the same building with no frequency offset/guard band
Considering interference in the other direction, from DVB-H to UMTS, we have found that DVB-H transmitters could interfere with both UMTS uplink (base station receivers) and downlink (mobile reception). In the case of DVB-H interference to the UMTS uplink (base receivers), if base stations are co-located then the isolation requirement is very high (81.1 dB in the worst adjacent channel scenario with no frequency separation, or 69.5dB with 5 MHz guard band). If base stations are not co-located, results show that mitigation is still required at a percentage of UMTS base stations to overcome interference from DVB-H transmitters, if the two networks are not coordinated. The level required depends on the frequency separation between the DVB-H transmitter and the UMTS uplink (base receive) channel. In the worst adjacent channel case with no frequency offset, the isolation requirement is up to 51.8dB to overcome interference.
We also found that DVB-H transmitters could interfere with UMTS mobile reception. We have calculated an effective downlink capacity loss to the UMTS network of 7% in the urban scenario modelled, for which the only mitigation may be a reduction in UMTS cell size. However, increasing the UMTS cell density to mitigate interference to UMTS mobiles could then result in increased potential for interference from UMTS base stations to DVB-H receivers. The impact of interference from DVB-H transmitters to the UMTS downlink is reduced if an offset greater than 8 MHz between DVB-H and UMTS channels exists.
It is noted that our results suggest the interference occurring between DVB-H and UMTS networks being heavily dependent on assumptions used, in particular the propagation model assumed for the determination of cell sizes of DVB-H and UMTS. Further work may be beneficial, in order to review the impact of assumptions more fully, particularly for DVB-H network planning outside urban areas.
Our results illustrate that DVB-H network design assumptions can have a significant impact on the interference received by the UMTS network, suggesting that coordination between DVB-H and UMTS operators in practice may be required.
9XNA004C | 92

(d) Adjacent Channel Interference between IMT FDD and TDD Technologies: We have assessed the impact of different IMT technologies being used in adjacent channels in the UHF cleared spectrum.
Results suggest that, without the application of interference mitigation measures at base stations, co-existence between IMT FDD and TDD technologies is not feasible at frequency offsets up to 15 MHz between respective carrier frequencies. Applying mitigation at the base station suggests that interference reduces in all cases, other than a 5 MHz offset (i.e. adjacent channel operation). Beyond 5 MHz offset, mitigation techniques, such as filtering, are considered to be practical, and will, therefore, mitigate the interference impact other than in the co-sited case. This result supports other work on IMT FDD/TDD co-existence27, suggesting that IMT FDD and TDD systems should not be co-located on the same mast without filtering.
Although suitable interference mitigation techniques can be applied at the base stations of FDD and TDD systems, interference still exists between mobiles, since mitigation (other than power control) is not practical in consumer mobile handsets. The results of our analysis suggest that interference will be noticeable when the distance between mobiles is small (less than 10 metres).
(e) Band Plan Options for Mobile Use of UHF: The UHF spectrum has better propagation characteristics than higher frequencies used for mobile systems, such as 2.1 GHz, enabling signals to travel further or to better penetrate buildings. Our analysis of site count for mobile deployment using lower or upper released spectrum confirms that this could offer significant advantage to the rollout of mobile services in rural areas, and/or to provide a greater depth of in-building coverage. The better propagation characteristics at UHF are somewhat offset by other losses that occur at UHF frequencies – such as decreases in handset antenna gain. However, this is more that compensated for by the improved propagation. The wide bandwidth of the UHF band (spanning 470 MHz to 862 MHz) means that signal losses vary across the band – achievable handset antenna gain is lower for the spectrum at the lower end of the UHF range, compared to the upper end. Correspondingly, body loss is higher at the upper end of the range compared to the lower range.
Inputs to TG4 from Ofcom have recommended Segments B (channels 31 to 44) and D (channels 58 to 69) as the most likely candidates, from the UK perspective, for non-mandatory harmonisation of two-way fixed/mobile applications, since they align with the
27 See Ofcom 2.6 GHz spectrum award
9XNA004C | 93

UK’s cleared spectrum. Segment D further has the benefit of proximity to 900 MHz and reduced interference constraints, while segment B offers more bandwidth.
Following extensive discussion and analysis in ECC TG1, a preference has emerged within TG4 for spectrum at the upper end of the UHF band, from 798 MHz to 862 MHz (channels 62 to 69) to be identified as potential spectrum for mobile use.
This preference emerged for a number of reasons:
• Proximity to existing GSM 900 spectrum, offering the potential to re-use existing components and systems
• Sufficient bandwidth to accommodate a range of alternative spectrum arrangements (e.g. paired and unpaired)
• Consideration of compatibility issues with adjacent services.
Whilst TG4’s decision is likely to be non-mandatory if implemented through an ECC Decision, it is nevertheless an important milestone in the planning of mobile use of digital dividend spectrum. It also does not preclude the implementation of mobile services elsewhere in the UHF band, but it is noted that there are benefits to harmonising mobile spectrum arrangements across Europe (such as handset roaming, economies of scale), which makes the TG4 decision more significant.
9XNA004C | 94

Appendix A Impact of Incoming International Interference on Planning of
IMT Networks
Appendix A 9XNA004C | 1

Appendix A 9XNA004C | 2

A1. Introduction
UMTS is one of several applications that could use the spectrum released from digital switchover. This spectrum is referred to as ‘released’ spectrum in this document.
The band plan below shows two example UMTS band plans utilising released spectrum, and one other channel interleaved with DTT services (channel 62).
2 x 16MHz cleared plus 2 x 8MHz interleaved (aligned with UHF channels)
2 x 15MHz cleared plus 2 x 10MHz interleaved (not aligned with UHF channels)
65 66
Interleaved Downlink 1
Interleaved Downlink 2
798-806 806-814
63 64798-806
Interleaved Downlink 1 Downlink 2 Downlink 3
62806-814 814-822
814-822
822-830 830-838
Uplink 2 Uplink 3
838-846
Duplex (16MHz) Uplink 1
846-854 854-862822-838
67 68 69838-846 846-854 854-862
Uplink 5Uplink 1 Uplink 2 Uplink 3 Uplink 4Downlink 3 Downlink 4 Downlink 5 Duplex (14MHz)
798-803 803-808 808-813 813-818 857-862818-823 823-837 837-842 842-847 847-852 852-857
Figure A.7.1: Example UMTS band plans
The first example shows a UMTS channel plan aligned with the existing UHF 8MHz channel plan.
The second example shows five pairs of UMTS channels, plus the duplexer gap packed into eight UHF channels 62 to 69. In this option some UMTS channels will suffer the combined interference of two UHF channels.
Comparison of existing UMTS 2GHz band and example 800MHz band plans:
2GHz UMTS FDD Band
• 1920.3 - 2169.7MHz
• Duplexer gap: 130MHz
• Lower Band: Uplink
• Upper Band: Downlink
• 4.87 to 5MHz channel spacing
800MHz UMTS FDD Band
• 798 - 862MHz
• Duplexer gap: 14 to 16MHz, depending on selected band plan
• Lower Band: Downlink
• Upper Band: Uplink
• 5MHz or 8MHz channel spacing
Appendix A 9XNA004C | 3

A2. Methodology for Assessment of Interference Mitigation Techniques
A2.1 Assessments of Interference mitigation priority
We have considered interference issues relating to both the downlink (base transmit) and the uplink (base station receive) bands.
UMTS networks are particularly sensitive to international incoming interference on the uplink (base station receive path), for the following reasons:
• Base station antennas tend to be above average clutter height, which can expose them to international interference
• Base stations operate with very low signal levels, typically -120dBm, thus C/I is reduced compared to mobile receive
• Both interferer and victim are in a fixed position, so during adverse weather conditions interference may persist for several days
• Downlink (Mobile Receive) (3: Ch 67 – 69 or 5: 837-862MHz).
In the downlink path, incoming international interference is less of a concern; however, outgoing international interference will need to be considered.
The mitigation techniques described in this report are expected to resolve both incoming and outgoing interference issues. International interference to and from mobiles can be dismissed due to the low antenna height, low antenna gain and greater clutter losses.
A2.2 Assessments of interference propagation method
International interference can travel long distances under certain anomalous weather conditions; a phenomenon termed ‘Tropospheric Ducting’ via a temperature inversion layer. Due to this propagation method, international UHF interference tends to arrive at base stations from elevations between zero and a few degrees above the horizon. An exception to this mode is found in the immediate vicinity of the coastline where interference may propagate by means of a ‘sea duct’. In this case interference may arrive at a lower elevation angle, but, as a consequence, will be detracted by the terrain and building clutter, and so will not propagate far inland.
Appendix A 9XNA004C | 4

Interference signals originates from a specific direction, above local sources of diffraction and reflection
Interference refracted by atmosphere from a great distance
International Interferer
Interference signals originates from a specific direction, above local sources of diffraction and reflection
Interference refracted by atmosphere from a great distance
International Interferer
Figure A.2: Tropospheric ducting via temperature inversion layer
The international interference propagation by ducting is a particular problem for relatively high macro base station antennas. Thus if the released spectrum is to be used to add extra capacity to a network then it could be used for micro sites forming a second layer within a hierarchy of macro and micro cells without the mitigation detailed in this appendix.
Micro and pico base stations, with antennas below the height of surrounding buildings, could utilise channels that suffer international interference as either, (a) the interference will pass overhead of the receiving antenna or (b) the surrounding buildings will diffract and absorb the interference, thus reducing the amount of interference received. In addition micro cells tend to use less directive antennas with lower gain, further hardening them from international interference.
A2.3 Analysis of a typical dual band GSM/UMTS antenna
The Kathrein 65° Dualband (742 265) antenna pattern, shown below, is a typical 65-degree sector antenna, of the type frequently used in 2GHz UMTS and 900 GSM networks. This antenna can operate within part of the upper band of released UHF spectrum. A revision to this design would be required to extend its range down to 806MHz (channel 63), or down to 798MHz (channel 62), if interleaved spectrum is used. Note in the elevation pattern that the
Appendix A 9XNA004C | 5

first side lobe above the horizon is suppressed; this is to reduce reception of interference when down tilt is applied to the antenna.
Figure A.3: Kathrein (742 265) Azimuth and Elevation Antenna Patterns
(824MHz) [Source: Kathrein]
The characteristics of this dual band antenna vary from band to band, as illustrated in the table below. Note that the antenna gain decreases with frequency band. Extending this trend, we would expect a gain of approximately 15.0dBi for the band 798 to 862MHz.
Table A.1: Antenna Characteristics [Source: Kathrein]
Appendix A 9XNA004C | 6

A2.4 Mitigation Methods
A2.4.1 Mitigation 1: Careful Selection of Azimuth
UMTS BS antennas are typically deployed in a tri-sector arrangement, with each sector offset by 120 degrees. The figure below illustrates interference emanating from a bearing of 120 degrees with respect to the base station. Each illustration is explained in points a) to d) below.
Figure A.4: Azimuth mitigation
a) Worst case, an antenna is facing the source of interference (interference at Azimuth Pattern 0deg.)
b) Optimal arrangement for evenly spaced sectors (interference at Azimuth Pattern 60,300deg.)
c) Further improvement by using increased spacing between affected sectors (interference at Azimuth Pattern 90, 270deg)
d) Use only two sectors (interference at Azimuth Pattern 120, 240deg.).
Note that the area covered is the same for a) and b) above. Thus this mitigation technique has no impact on the number of sites required to cover a large contiguous area.
A2.4.2 Mitigation 2: Down tilt
The table below shows the antenna gain towards the horizon for different down tilts.
Appendix A 9XNA004C | 7

Tilt dBi at 824 MHz dBi at798 MHz0 15.5 15.3-1 15.2 15.0-2 14.8 14.6-3 14.2 14.0-4 13.3 13.1-5 12.3 12.1-6 10.9 10.7-7 9.3 9.2-8 7.4 7.3-9 5.0 4.9-10 2.1 2.1-11 -1.3 -1.3-12 -4.8 -4.7-13 -7.0 -6.9-14 -6.7 -6.6-15 -5.9 -5.8-16 -5.7 -5.6-17 -6.1 -6.0-18 -7.3 -7.2-19 -8.8 -8.7-20 -9.4 -9.3-21 -8.2 -8.1-22 -6.0 -5.9-23 -4.0 -3.9-24 -2.5 -2.5
Gain in direction of horizon
Table A.2: Horizontal Antenna Gain Versus Down Tilt
Note that the gain toward the horizon reaches minimum at -13deg. Elevation, after which the gain increases.
Thus, a tilt of -13 degrees could give protection of over 22dB toward the horizon, however, with such a severe tilt, the antenna coverage would be focused on a relatively small area under the mast. For a fixed down tilt (no remote adjustment) a tilt of 8 degrees could make a reasonable compromise between coverage and mitigation of interference, reducing interference from the horizon by 8.1dB.
A2.4.3 Mitigation 3: Remote Control of Down Tilt
The range of remote electrical tilt adjustment is typically 10 degrees. This may be augmented by mechanical tilt, giving a dynamic range from, say, -4 to -14 degrees. Thus, at maximum tilt, interference from the horizon could be reduced by 22.4dB.
Remote Electrical Tilt (RET) antennas are often used to ease the task of altering antenna tilts. They are particularly useful during the network optimisation phase. However, it is feasible to use the RET feature to adjust antenna tilt in response to adverse levels of interference associated with certain weather conditions.
Appendix A 9XNA004C | 8

Generally, the weather systems that create the anomalous propagation paths across Europe develop over a number of hours, if not days. If the rising level of interference were monitored, it would be possible to react to this interference by applying remote down tilt to antennas on the relevant bearings across affected areas of the UK. The level of down tilt applied could be proportional to the level of interference detected or anticipated.
As well as RET antennas there are still more advanced active antenna designs that could alter not only tilt, but also the entire antenna pattern in response to interference.
A2.4.4 Summary of mitigation techniques
The table below shows a summary of the mitigation techniques, each column relates to the azimuth techniques a) to d) described in the previous section. Yellow highlights the options used in the impact on site count in the next section; these highlighted options have the least impact on coverage for the level of mitigation achieved.
0 60 90 1200 0.0 7.5 15.2 23.22 0.7 8.2 15.94 2.2 9.7 17.46 4.6 12.1 19.88 8.0 15.5 23.2
10 13.2 20.7 28.412 20.0 27.5 35.214 21.9 29.4 37.1
Azimuth offseto
Reduction in Interference (dB)
Dow
ntilt
o
Table A.3: Summary of mitigation techniques
A3.1 Planning Tool Configuration
ICS Telecom 8.2.3 was used to predict UMTS coverage with the following parameters:
• Digital Terrain Model: 5m horizontal, 1m vertical resolution
• Propagation Model:
Appendix A 9XNA004C | 9

Okumura – Hata Rural for ONS28 Village, Hamlet & Isolated Dwellings
Okumura – Hata Suburban for ONS Town and Fringe
Okumura – Hata Urban for ONS Urban areas with a population over 10,000
• Transmitter height: As per UMTS link budget prepared by Mason (Appendix C)
• Antenna pattern Kathrein 65° Dualband Directional Antenna (742-265)
• BS Transmitter and EiRP, as per the UMTS link budget prepared by Mason (Appendix C)
• MS Receiver antenna height 1.5m above ground level
• Calculation distance limit 30km
• Field Strength displayed using the ‘Composite Coverage Display’.
A3.2 Division of the UK into morphology classes
The UK was dived in to morphology classes as defined by ONS. A crosscheck was made against the population in each class according to our test points and the population figures quoted by ONS.
This table also includes the coverage requirement (%) for each environment and a cell efficiency. The cell efficiency figure is used to reduce the coverage per site from a theoretical maximum to account for cell overlap, compromises made on the cell location due to the site acquisition process and fragmentation in the coverage requirement, i.e. a number of small disparate areas that could be covered by fewer sites if they where contiguous.
MorphologyONS Morphology Class Okamura-Hata
Class Area (km 2 ) 1 Area % Population Population % Cell Efficiency 2
Village, Hamlet & Isolated Dwellings Rural 162,376 66.7% 6,243,819 10.4% 70%Town and Fringe Suburban 28,048 11.5% 5,392,763 9.0% 65%Urban > 10k populaton Urban 53,095 21.8% 48,572,918 80.7% 60%TOTAL 243,520 100% 60,209,501 100.0% -1 Excludes lakes and forest2 Cell Efficiency: allowance for cell overlap, site acquisition compromise, fragmentation of required coverage etc.
Table A.4: UK by Morphology Class
A3.3 Single Site Coverage Predictions
The following tables show the results of ICS Telecom coverage predictions for a single site based on the link budget in Appendix C for each of the three morphology environments described in the previous section. The coverage for varying degrees of down tilt is shown in
28 Office of National Statistics – UK Rural and Urban Area Classification 2004
Appendix A 9XNA004C | 10

each table. This coverage is the theoretical maximum before the cell efficiency factor is applied.
Mitigation Applied (dB) Lower Band Upper Band 2.1GHz Lower Band Upper Band 2.1KHz Lower Band Upper Band 2.1KHz Lower Band
0 None 627.2 450.4 356.29 100.6 82.3 65.095 361.3 259.4 205.215 57.97.5 Azimuth Only 627.2 450.4 100.6 82.3 361.3 259.4 57.98.2 Azimuth and tilt -2 597.9 429.4 96.1 78.6 344.4 247.4 55.49.7 Azimuth and tilt -4 545.7 391.9 87.8 71.9 314.4 225.9 50.712.1 Azimuth and tilt -6 476.5 342.3 76.9 63.0 274.7 197.4 44.415.5 Azimuth and tilt -8 402.8 289.5 65.2 53.4 232.3 167.1 37.720.7 Azimuth and tilt -10 336.4 241.9 54.6 44.8 194.2 139.7 31.635.2 180 spacing and tilt -12 + 303.4 218.0 49.0 40.2 175.0 125.8 28.337.1 180 spacing and tilt -14 + 290.1 208.4 46.8 38.3 167.3 120.2 27.0
Rural Coverage AMR Voice (outdoor) AMR Voice (in-building) 384/64 kbps (outdoor) 384/Single Site Coverage (km 2 ) Macro Cell Coverage Limited 50% Loading
Table A.5: Rural Coverage of a Single Site (km2)
Mitigation Applied (dB) Lower Band Upper Band 2.1KHz Lower Band Upper Band 2.1KHz Lower Band Upper Band 2.1KHz Lower Band
0 None 14.1 12.0 10.6 5.7 5.1 4.6 10.7 9.1 8.1 4.37.5 Azimuth Only 14.1 12.0 5.7 5.1 10.7 9.1 4.38.2 Azimuth and tilt -2 13.8 11.7 5.5 5.0 10.5 8.9 4.29.7 Azimuth and tilt -4 13.2 11.2 5.3 4.8 10.0 8.5 4.012.1 Azimuth and tilt -6 12.3 10.4 4.9 4.5 9.4 7.9 3.815.5 Azimuth and tilt -8 11.3 9.6 4.6 4.1 8.6 7.3 3.520.7 Azimuth and tilt -10 10.3 8.8 4.2 3.8 7.9 6.7 3.235.2 180 spacing and tilt -12 + 9.8 8.3 3.9 3.6 7.5 6.3 3.037.1 180 spacing and tilt -14 + 9.6 8.1 3.9 3.5 7.3 6.2 2.9
Rural RadiiSingle site radius (km) Macro Cell Coverage Limited 50% Loading
AMR Voice (outdoor) AMR Voice (in-building) 384/64 kbps (outdoor) 384/
Table A.6: Rural Radii of a Single Site (km)
Mitigation Applied (dB) Lower Band Upper Band 2.1KHz Lower Band Upper Band 2.1KHz Lower Band Upper Band 2.1KHz Lower Band
0 None 118.4 78.4 47.7525 14.3 11.0 8.7175 68.2 45.2 27.53 8.47.5 Azimuth Only 118.4 78.4 14.3 11.0 68.2 45.2 8.48.2 Azimuth and tilt -2 113.1 74.9 14.0 10.6 65.2 43.2 8.19.7 Azimuth and tilt -4 103.3 68.5 12.9 9.8 59.7 39.6 7.512.1 Azimuth and tilt -6 90.4 60.0 11.4 8.6 52.3 34.7 6.615.5 Azimuth and tilt -8 76.6 50.9 9.7 7.4 44.4 29.5 5.720.7 Azimuth and tilt -10 64.2 42.7 8.2 6.2 37.2 24.8 4.835.2 180 spacing and tilt -12 + 57.6 38.3 7.3 5.5 33.3 22.1 4.237.1 180 spacing and tilt -14 + 55.0 36.5 6.9 5.2 31.8 21.1 4.0
Suburban CoverageSingle Site Coverage (km 2 ) Macro Cell Coverage Limited 50% Loading
AMR Voice (outdoor) AMR Voice (in-building) 384/64 kbps (outdoor) 384/
Table A.7: Suburban Coverage of a Single Site (km2)
Mitigation Applied (dB) Lower Band Upper Band 2.1KHz Lower Band Upper Band 2.1KHz Lower Band Upper Band 2.1KHz Lower Band
0 None 6.1 5.0 3.9 2.1 1.9 1.7 4.7 3.8 3.0 1.67.5 Azimuth Only 6.1 5.0 2.1 1.9 4.7 3.8 1.68.2 Azimuth and tilt -2 6.0 4.9 2.1 1.8 4.6 3.7 1.69.7 Azimuth and tilt -4 5.7 4.7 2.0 1.8 4.4 3.5 1.512.1 Azimuth and tilt -6 5.4 4.4 1.9 1.7 4.1 3.3 1.515.5 Azimuth and tilt -8 4.9 4.0 1.8 1.5 3.8 3.1 1.320.7 Azimuth and tilt -10 4.5 3.7 1.6 1.4 3.4 2.8 1.235.2 180 spacing and tilt -12 + 4.3 3.5 1.5 1.3 3.3 2.7 1.237.1 180 spacing and tilt -14 + 4.2 3.4 1.5 1.3 3.2 2.6 1.1
384/AMR Voice (outdoor) AMR Voice (in-building) 384/64 kbps (outdoor)Suburban RadiiSingle site radius (km) Macro Cell Coverage Limited 50% Loading
Table A.8: Suburban Radii of a Single Site (km)
Appendix A 9XNA004C | 11

Mitigation Applied (dB) Lower Band Upper Band 2.1KHz Lower Band Upper Band 2.1KHz Lower Band Upper Band 2.1KHz Lower Band
0 None 44.2 28.9 12.2175 8.1 5.3 2.24 25.4 16.6 7.04 4.67.5 Azimuth Only 44.2 28.9 8.1 5.3 25.4 16.6 4.68.2 Azimuth and tilt -2 42.6 27.9 7.9 5.2 24.6 16.2 4.59.7 Azimuth and tilt -4 39.4 25.9 7.9 4.9 22.8 15.0 4.212.1 Azimuth and tilt -6 34.8 22.9 6.7 4.4 20.3 13.4 3.715.5 Azimuth and tilt -8 29.8 19.7 5.8 3.9 17.4 11.6 3.220.7 Azimuth and tilt -10 25.3 16.7 5.0 3.4 14.8 9.9 2.735.2 180 spacing and tilt -12 + 22.2 14.6 4.3 2.8 12.9 8.5 2.537.1 180 spacing and tilt -14 + 21.0 13.8 4.0 2.6 12.2 8.0 2.3
AMR Voice (in-building) 384/64 kbps (outdoor) 384/Single Site Coverage (km 2 ) Macro Cell Coverage Limited 50% Loading
Urban Coverage AMR Voice (outdoor)
Table A.9: Urban Coverage of a Single Site (km2)
Mitigation Applied (dB) Lower Band Upper Band 2.1KHz Lower Band Upper Band 2.1KHz Lower Band Upper Band 2.1KHz Lower Band
0 None 3.8 3.0 2.0 1.6 1.3 0.8 2.8 2.3 1.5 1.27.5 Azimuth Only 3.8 3.0 1.6 1.3 2.8 2.3 1.28.2 Azimuth and tilt -2 3.7 3.0 1.6 1.3 2.8 2.3 1.29.7 Azimuth and tilt -4 3.5 2.9 1.6 1.2 2.7 2.2 1.212.1 Azimuth and tilt -6 3.3 2.7 1.5 1.2 2.5 2.1 1.115.5 Azimuth and tilt -8 3.1 2.5 1.4 1.1 2.4 1.9 1.020.7 Azimuth and tilt -10 2.8 2.3 1.3 1.0 2.2 1.8 0.935.2 180 spacing and tilt -12 + 2.7 2.2 1.2 1.0 2.0 1.6 0.937.1 180 spacing and tilt -14 + 2.6 2.1 1.1 0.9 2.0 1.6 0.9
Urban RadiiSingle site radius (km) Macro Cell Coverage Limited 50% Loading
AMR Voice (outdoor) AMR Voice (in-building) 384/64 kbps (outdoor) 384/
Table A.10: Urban Radii of a Single Site (km)
A3.4 Incoming International Interference test points
This next section builds on the analysis described in Digital Dividend Study International Interference Assessment [Mason, July 2007].
9,654 test points at the centre of each UK postal sector were assigned a morphology class, a population figure based on data supplied by the Royal Mail and the Office of National Statistics. A Voronoi cell29 was constructed around each test point and the area of the cell recorded.
29 The set of all points closer to a point c of S than to any other point of S is the interior of a convex polytope called the Voronoi cell for c.
Appendix A 9XNA004C | 12