office of air quality planning and standards update bill harnett westar spring meeting march 30,...
TRANSCRIPT

Office of Air Quality Planning and Standards Update
Bill HarnettWESTAR Spring Meeting
March 30, 2010

President Obama’s 2011 STAG Request
• 2010 - $226,580,000• 2011 Proposed Changes:– Core State Workload $70,000,000– School Monitors (eliminated) - $2,500,000– State Air Monitors $15,000,000– FY2011 Total $309,080,000
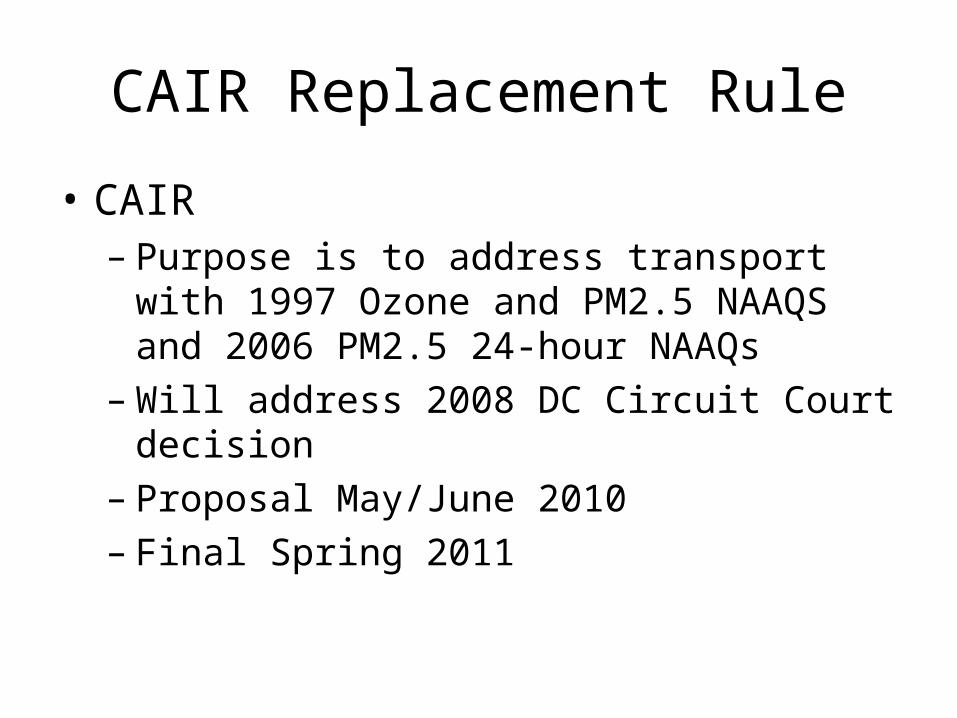
CAIR Replacement Rule
• CAIR– Purpose is to address transport with 1997 Ozone
and PM2.5 NAAQS and 2006 PM2.5 24-hour NAAQs
– Will address 2008 DC Circuit Court decision– Proposal May/June 2010– Final Spring 2011

Senator Carper’s Bill – SO2
• Trading program for 48 states plus DC• The Administrator must establish the program by
Jan. 1, 2011. Program must apply by Jan. 1, 2012• Limits on total emissions– 2012 – 2014 3.5 million tons– 2015 – 2017 2 million tons– 2018 – 2020 1.5 million tons– 2021 and after 1.5 million tons or lower if
Administrator determines

Senator Carper’s Bill – NOx• Annual trading program for 48 states plus DC in 2 zones
– Zone 1 – CAIR Region– Zone 2 – Everyone else
• The Administrator must establish the program by Jan. 1, 2011. Program must apply by Jan 1. 2012.
• Zone 1 Limits on total emissions– 2012 – 2014 1.39 million tons– 2015 – 2019 1.30 million tons– 2020 and after 1.30 million tons or lower if Administrator
determines • Zone 2 Limits on total emissions
– 2012 – 2014 510,000 tons– 2015 – 2019 320,000 tons– 2020 and after 320,000 tons or lower if Administrator determines

Senator Carper’s Bill – Mercury
• MACT minimum for Electric Utility Coal-Fired Units of 90 percent reduction
• If no final MACT by January 1, 2012, Utility Units must meet MACT emission limits no later than January 1, 2015 as determined on a case-by-case basis under Section 112(j)
• Requirement for monitoring and reporting of mercury emissions
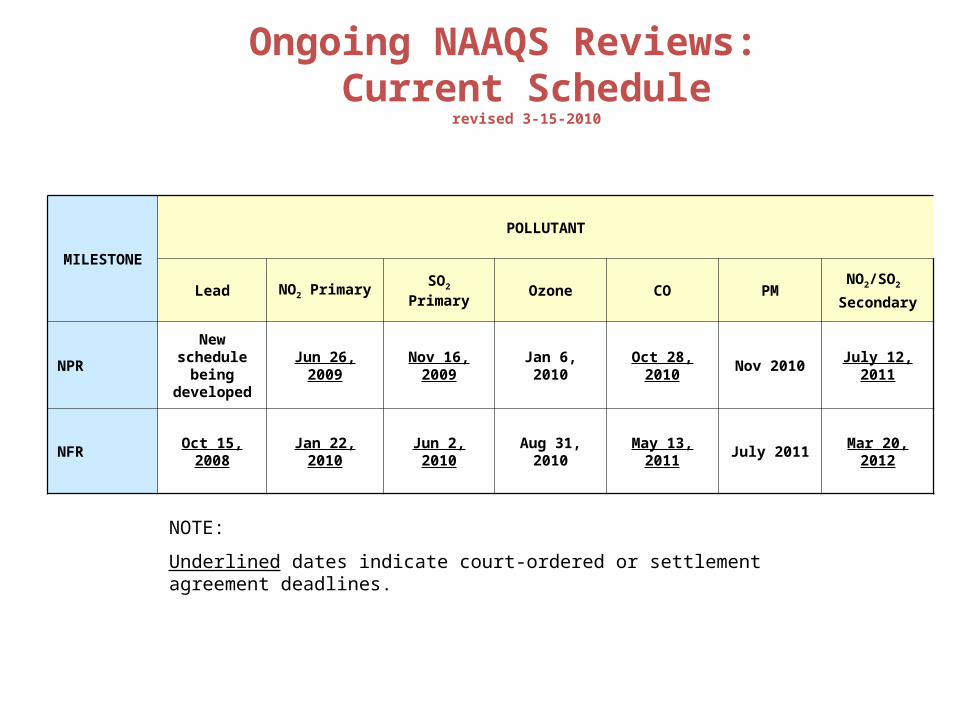
Ongoing NAAQS Reviews: Current Schedule
revised 3-15-2010
MILESTONE
POLLUTANT
Lead NO2 Primary SO2 Primary Ozone CO PMNO2/SO2
Secondary
NPR
New schedule
being developed
Jun 26, 2009 Nov 16, 2009 Jan 6, 2010 Oct 28, 2010 Nov 2010 July 12, 2011
NFR Oct 15, 2008 Jan 22, 2010 Jun 2, 2010 Aug 31, 2010 May 13, 2011 July 2011 Mar 20, 2012
NOTE:
Underlined dates indicate court-ordered or settlement agreement deadlines.
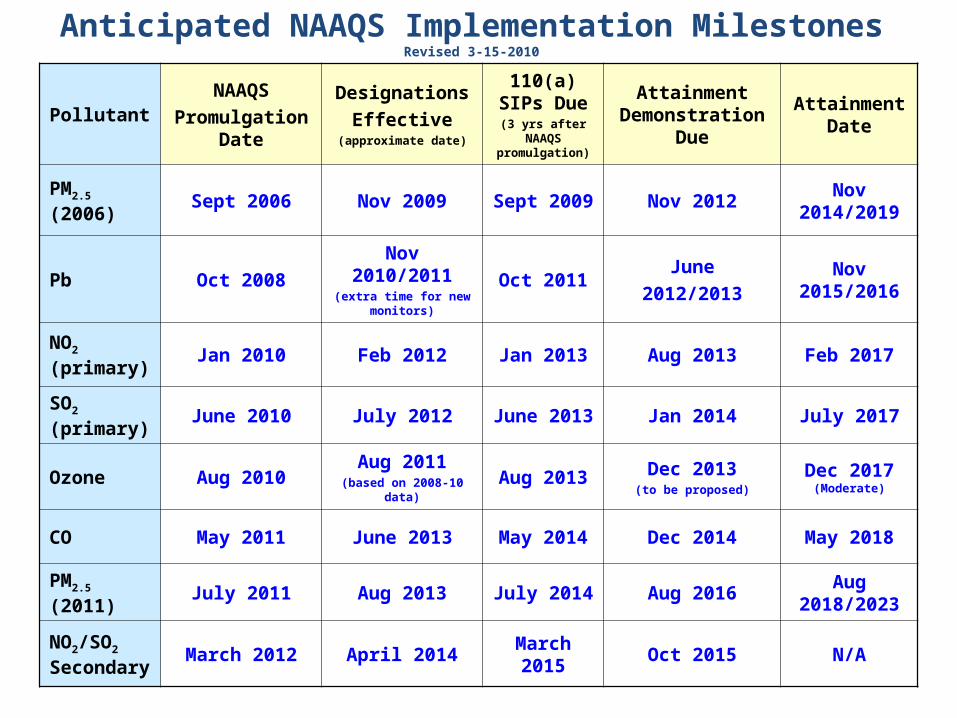
PollutantNAAQS
Promulgation Date
Designations
Effective(approximate date)
110(a) SIPs Due
(3 yrs after NAAQS
promulgation)
Attainment Demonstration
Due
Attainment Date
PM2.5 (2006) Sept 2006 Nov 2009 Sept 2009 Nov 2012Nov
2014/2019
Pb Oct 2008Nov 2010/2011
(extra time for new monitors)
Oct 2011June
2012/2013Nov
2015/2016
NO2 (primary)
Jan 2010 Feb 2012 Jan 2013 Aug 2013 Feb 2017
SO2 (primary)
June 2010 July 2012 June 2013 Jan 2014 July 2017
Ozone Aug 2010 Aug 2011(based on 2008-10 data)
Aug 2013 Dec 2013(to be proposed)
Dec 2017 (Moderate)
CO May 2011 June 2013 May 2014 Dec 2014 May 2018
PM2.5 (2011)
July 2011 Aug 2013 July 2014 Aug 2016Aug
2018/2023
NO2/SO2 Secondary
March 2012 April 2014 March 2015 Oct 2015 N/A
Anticipated NAAQS Implementation MilestonesRevised 3-15-2010
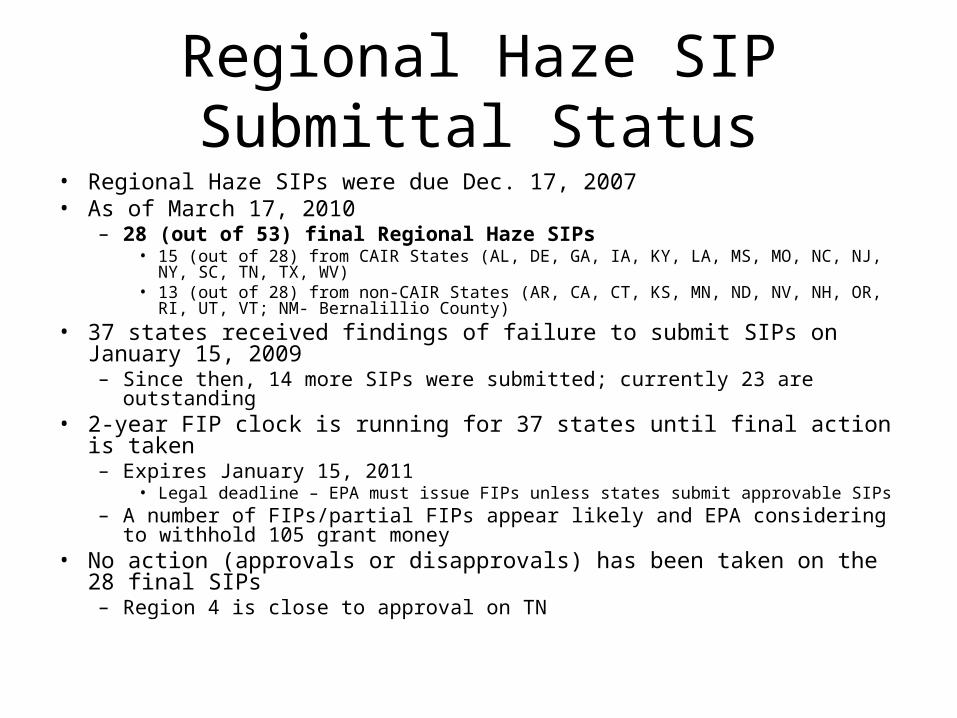
Regional Haze SIP Submittal Status• Regional Haze SIPs were due Dec. 17, 2007• As of March 17, 2010
– 28 (out of 53) final Regional Haze SIPs • 15 (out of 28) from CAIR States (AL, DE, GA, IA, KY, LA, MS, MO, NC, NJ, NY, SC, TN, TX,
WV)• 13 (out of 28) from non-CAIR States (AR, CA, CT, KS, MN, ND, NV, NH, OR, RI, UT, VT; NM-
Bernalillio County) • 37 states received findings of failure to submit SIPs on January 15, 2009
– Since then, 14 more SIPs were submitted; currently 23 are outstanding• 2-year FIP clock is running for 37 states until final action is taken
– Expires January 15, 2011• Legal deadline – EPA must issue FIPs unless states submit approvable SIPs
– A number of FIPs/partial FIPs appear likely and EPA considering to withhold 105 grant money
• No action (approvals or disapprovals) has been taken on the 28 final SIPs– Region 4 is close to approval on TN

10
• Placeholder for updated Maps

11

WildEarth Guardians Consent Decree
• EPA has been sued by WEG for failing to take action on 110(a)(2)(D)(i) SIPs or to promulgate FIPs to satisfy interstate transport requirements for 7 Western states for the 1997 PM and O3 NAAQS.
• States named in the lawsuit: New Mexico, Oklahoma, Colorado, North Dakota, California, Idaho, and Oregon – involves Regions 6, 8, 9, and 10
• DOJ/OGC and WEG have negotiated an 18-month timeframe for completing actions on the transport SIPs (visibility prong) – If any state has not submitted an administratively complete proposed SIP by
May 10, 2010, then by November 10, 2010, the Administrator shall sign a notice proposing a FIP, approval of a SIP (if one has been submitted in the interim), or partial promulgation of a FIP and partial approval of a SIP
– No later than May 10, 2011, the Administrator shall sign a notice either approving a SIP, promulgating a FIP, or approving a SIP in part with promulgation of a partial FIP

Modeling Background
• State of the science photochemical grid models simulate formation and transport of particulate matter and ozone
• Many States have used photochemical transport models to support ozone and PM2.5 SIPs
• Some photochemical models have been enhanced with source apportionment technology
• Photochemical model source apportionment tracks the formation and transport of ozone from specific emissions sources and allows the calculation of contributions to receptors
• Many States have used ozone and PM2.5 source apportionment as part of SIP planning; also being used by U.S. EPA to support the CAIR replacement transport rule

Source Apportionment Modeling
• Photochemical model source apportionment tracks the formation and transport of ozone and PM2.5 from emissions sources and allows the calculation of contributions to receptors
• The sources selected for tracking with ozone source apportionment include all NOX and VOC emissions from 17 selected States, Canada, Mexico, and boundary conditions (shown at right)
• Plan for annual 2005 and 2006 CAMx v5 source apportionment simulations with 12 km sized grid cells covering the area shown in the box at the right
• Estimate State to State contributions relevant to the upcoming 8-hr ozone NAAQS to gain a conceptual idea about the extent of ozone transport in the western U.S.
• Preliminary ozone results likely available this summer (June/July)
• Second phase if time and $$$ allow an assessment of PM2.5 State to State contribution would be done this summer

Follow-up on Ozone Modeling• Kirk Baker, EPA Modeler will be in Boulder from June 21 to
25• He is attending an ad-hoc meeting on meteorological
modeling for photochemical applications in Boulder June 24-25 if any of the States would like to attend and possibly present recent work he would encourage it.
• The first half of the week is a general meteorological modeling conference, then we do something smaller more focused on regulatory modeling.
• He also could be do a meeting June 29 in Boulder• If none of these dates work, we could set up a call in July on
what has been learned and where modeling has been done.

WESTAR Exceptional Events Letter• Response sent March 8, 2010
– We are exploring how implementation of the exceptional events rule can be improved to provide clarity and efficiency within the Agency and for all of our stakeholders.
– This includes consideration of chronic natural events in the exceptional events context, and other events for which developing technical demonstrations proves to be difficult.
– I have asked my staff to identify areas where guidance or other rule considerations would be appropriate to achieve this goal and to work over the next six months to develop solutions that will improve rule implementation.
– During this process, we want to continue our dialog with WESTAR on implementation issues, and the U.S . Environmental Protection Agency (EPA) Regional staff will continue to work with you to develop technical demonstrations to support consideration of exceptional events.

17
Detroit Multi-pollutant Pilot Project: Overview
• NRC report recommended “Air Quality Management in the United States (2004)”:– … that the United States transition from a pollutant-by-pollutant approach
to air quality management to a multi-pollutant, risk-based approach . . .
• In response, EPA is investigating the application our technical tools/methods in a multi-pollutant, risk-based approach to control strategy development.
We selected the Detroit urban area as a testbed to apply and evaluate MP tools & compare a MP-based control strategy to a SIP-based control strategy.
Goal: To get reductions at the monitors for PM2.5 & O3 to meet the current standards, AND also reduce PM2.5, O3 & HAP exposure across domain, especially in densely populated areas.

Benefit-Cost Comparison“Status Quo” “MP Risk-Based”
Total Benefits (M 2006$) $1,127 $2,385
Change in pop-weighted PM2.5 Exposure (ug/m3)
Regional 0.16 0.1666
Local 0.2703 0.7211
Change in pop-weighted O3 Exposure (ppb)
Regional 0.0005 0.0006
Local 0.0318 0.0583
Total Costs (M 2006$) $56 $66
Cost per μg/m3 PM2.5 reduced $0.50 $0.32
Cost per ppb O3 reduced $2.6 $0.58
Net Benefits (M 2006$)
Benefit-Cost Ratio
$1,071
20.1
$2,319
36.1
18

Detroit Study Summary• First assessment of a Multi-Pollutant, Risk-Based approach to developing control
strategies and comparison to a SIP-based approach.• Found that valuable first steps were:
– Develop & evaluate a “platform” for the Detroit MP analyses; and – Fully understand the AQ issues for the area through development of a Conceptual
Model – Collect local-scale information including emissions, AQ modeling, control and health
data• “MP, Risk-Based” approach met all “Criteria for Success”
– Same or greater reductions at all monitors for PM2.5 & O3, including greatest reductions at Michigan projected nonattainment monitors
– Improved air quality regionally and in urban core for O3, PM2.5, and selected air toxics– Greater benefits (~2x) for PM2.5 & O3 with “MP, Risk-Based” Control Strategy– Reduction in non-cancer risk, though no significant change in cancer risk
• Lesson learned: VOC controls could also be prioritized based on HAPS risk.– More cost effective and beneficial
19