offshore development information statement - …s3.amazonaws.com/zanran_storage/€¦ · the 2010...
TRANSCRIPT
UK ELECTRICITY TRANSMISSION
Offshore Development Information Statement
September 2010

Offshore Development Information Statement 2010
2
Disclaimer
This Statement, dated September 2010, is produced by National Grid Electricity Transmission plc
(“NGET”) acting in its role as National Electricity Transmission Operator (NETSO). It is produced
pursuant to Special Condition C4 (“Role in respect of the National Electricity Transmission System
Operator area located in offshore water”) of the licence to participate in the transmission of electricity
granted to NGET pursuant to Section 6(1) (b) of the Electricity Act 1989 (as amended by the Utilities Act
2000, the Energy Act 2004 and the Energy Act 2008).
The form of this Statement has been approved by the Authority.
The Statement and this web site (“the Site”), which must be used in accordance with the following Terms
and Conditions, are governed by the law of and subject to the jurisdiction of England and Wales and of
Scotland.
The information required to be included in this Statement is set out in Special Condition C4 of NGET’s
licence. This Statement is not intended to imply any legal obligations as regards the future development
of the National Electricity Transmission System. This Statement should not be regarded as an indicator of
the performance and prospects of National Grid or any other party.
Whilst reasonable care has been taken in the preparation of this Statement, no representation, express or
implied, is made as to the accuracy or completeness of such information. NGET and members of the
National Grid Group do not accept any liability for the accuracy of the information contained herein and in
particular neither NGET nor the Group, nor the directors nor the employees of NGET nor the Group shall
be under any liability for any error or misstatement or opinion on which the recipient of this Statement
relies or seeks to rely other than fraudulent statements or fraudulent misrepresentation.
Copyright
Any and all copyright and all other intellectual property rights contained in the Statement and in any other
Site content (including PDF documentation) belong or have been licensed to National Grid. If you modify
or adapt the Statement, the Site content or any such documentation, you acknowledge and accept full
responsibility for the accuracy of the modified or adapted Statement, Site content and/or documentation.
To the extent that you re-use the Statement, any Site content or documentation in its original form and
without making any modifications or adaptations thereto, you must reproduce, clearly and prominently, the
following copyright statement in your own documentation: © 2010 National Grid plc, all rights reserved.
The trade marks, logos and service marks displayed on the document and on the Site are owned and
registered (where applicable) by National Grid or another member of the Group. No rights or licence are
granted or may be implied by their display on the Site.
Cover Photograph: Gunfleet Sands Offshore Windfarm in the Northern Thames Estuary, Great Britain
© DONG Energy

Offshore Development Information Statement 2010
3
Foreword The 2010 Offshore Development Information Statement (Statement) has been published by National Grid
Electricity Transmission plc (NGET) acting in its role as National Electricity Transmission System Operator
(NETSO). National Grid Electricity Transmission plc is a member of the National Grid plc (National Grid)
group of companies. The Statement is produced in accordance with the obligations placed on NGET
under Special Licence Condition C4 of its electricity transmission licence. Amongst other things, this
condition requires that NGET publishes this Statement on annual basis.
The Statement provides a wide range of information relating to the possible development of both the
offshore and onshore electricity transmission systems and provides a high-level desktop analysis of the
various ways in which:
the offshore transmission network can be developed to interconnect offshore generation with the
onshore transmission network; and
the onshore transmission network can be reinforced to provide the necessary connection and transfer
capability to support the connection of offshore transmission networks.
The aim is to identify potential economic and co-ordinated options from this desktop analysis. It is
envisaged that the Statement will provide a platform for more detailed analysis and evaluation to be
performed regarding the optimisation of offshore transmission development.
The detailed evaluation and design of offshore infrastructure, including any environmental impact
assessment, remains the responsibility of the Offshore Transmission Owner (OFTO) or developer
(dependent on the approach applicable to the individual project). Therefore the actual development of the
offshore and onshore transmission systems can and may differ from that illustrated in the Statement.
The Statement includes a number of conceptual design strategies which demonstrate how different
technology and topology assumptions can impact the optimisation of offshore transmission development.
Given a better understanding of the technologies available since the publication of the 2009 Statement,
NGET has undertaken a conceptual design study into the development of an integrated offshore
transmission network. The resulting design is one that is based on the installation of high voltage multi-
user assets that interconnect the offshore platforms to form an offshore network. This conceptual design
highlights how the overall volume of assets installed offshore could be reduced, whilst network security
and operational flexibility is improved. This is based on onshore/offshore optimisation, the latest
technology and a degree of anticipatory investment offshore.
As with all designs included within this Statement, this approach represents one of many ways in which
efficient offshore connection could be facilitated. The mechanism by which it could be delivered is not
discussed in this Statement.
The inclusion of the different design strategies may facilitate the evaluation of the potential options in
terms of capital costs, planning implications, risks, environmental assessment and the supply chain for
individual offshore generation projects.

Offshore Development Information Statement 2010
4
Comments
I hope you find the 2010 Statement both interesting and informative. Given the challenges facing the
electricity industry in facilitating offshore generation and contributing to the UK’s environmental targets, I
would particularly welcome any comments you may have on both the style and content of the Statement
so we can fully consider any improvements for the 2011 Statement. An Online Survey Form has been
made for this very purpose. I look forward to receiving your views on the Statement, including
suggestions on how it may be further improved.
Nick Winser, Executive Director, Transmission
National Grid
September 2010
Offshore Development Information Statement 2010
5
Contents Executive Summary 7
1. Offshore Electricity Transmission Overview 1.1 Background 12
1.2 Offshore Generation Development 14
1.3 Offshore Electricity Transmission Regulatory Regime 15
1.4 Previous and Parallel Initiatives 20
2. Offshore Development Information Statement 2.1 Aim and Purpose 23
2.2 Statement Development 23
3. Current Offshore Generation and Development 3.1 Offshore Wind Generation: Development to Date 26
3.2 Offshore Marine Generation: Development to Date 28
3.3 Offshore Wind Development Map 29
3.4 Offshore Generation: Grid Connections 30
3.5 East Coast 32
3.6 North West 34
3.7 Thames Estuary 36
3.8 Bristol Channel 37
3.9 Scotland 38
4. Future Generation and Demand Scenarios 4.1 Overview 40
4.2 Industry Consultation and Selection Process 41
4.3 Future Scenarios 44
4.4 Future Scenario: 2020 Renewable Assessment 66
4.5 Additional Sensitivities 67
5. Offshore and Associated Onshore Connection Designs 5.1 Overview 69
5.2 Onshore/Offshore Design 70
5.3 North West – Irish Sea 74
5.4 Bristol Channel – Atlantic Array 83
5.5 South Coast – Hastings and West of Isle of Wight 89
5.6 East Anglia - Norfolk 92
5.7 East Coast – Dogger Bank and Hornsea 100
5.8 Scotland 113

Offshore Development Information Statement 2010
6
6. Main Interconnected Transmission System 6.1 Background and Assessment Methodology 118
6.2 Boundary Map 120
6.3 MITS Reinforcement Options 121
6.4 Boundary Considered 124
7. Way Forward 7.1 Feedback on 2010 Statement 134
7.2 Consultation on 2010 Statement 134
7.3 Proposed Consultation Timetable and Key Milestone Dates 135
7.4 Continuous Development of Statement 135
Glossary 136
Appendices 1. Future Scenarios Details A-1
2. Maps A-7
3. Offshore Network Design Methodology A-9
4. Review of Offshore Transmission Technologies A-26
Offshore Development Information Statement 2010
7
Executive Summary Introduction
The 2010 Offshore Development Information Statement (Statement) is the second to be published by
National Grid Electricity Transmission plc (NGET) acting in its role as National Electricity Transmission
System Operator (NETSO).
The aim of this annual Statement is to facilitate the development, in offshore waters, of an efficient co-
ordinated and economical system of electricity transmission. The Statement includes a wide range of
information relating to the possible development of the National Electricity Transmission System (NETS)
in offshore waters including applicable technology, potential offshore transmission design and onshore
transmission co-ordination. It is also supported by technical and economic analysis which sets out options
for reinforcing both the offshore and onshore transmission networks. It has not, however, looked at
project specific engineering routes or the availability of routes to shore.
Scope, Responsibility and Deliverability Considerations
When reading the Statement, it is important to consider that all future scenarios contained within and the
illustrative electricity transmission system connection works shown, have been developed purely for
analysis purposes, via a desktop study and included for illustrative purposes only. These designs are
based on a fixed point in time and may change as the offshore network evolves.
The designs should not be considered as implying actual connection dates or future connection routes for
new infrastructure and are not intended to reflect the Transmission Owners (TOs) investment decisions
regarding the development of their transmission area. The Statement does not cover sub-transmission
connections other than showing the nearest affected Grid Entry Point.
The detailed evaluation and design of offshore infrastructure, including any environmental impact
assessment, remains the responsibility of the Offshore Transmission Owner (OFTO) or developer
(dependent on the approach applicable to the individual project). All diagrams represent the shortest
route to shore given an electrically efficient onshore connection point.
The actual development of the offshore and onshore transmission systems can and may differ from that
illustrated in the Statement.
Offshore Generation: Developments
Offshore generation has a critical role to play in delivering the UK’s renewable energy targets and security
of supply needs; and in decarbonising the energy sector. Changes to the UK energy markets and
regulatory framework have been made to encourage the development of renewable energy in the UK.
The introduction of the Renewables Obligation (RO) scheme has provided a considerable incentive for the
development of renewable generation. Recent changes to the scheme’s operational timeline (extended to
2037) and the introduction of the banding system, with some technology types receiving additional
Renewable Obligation Certificates, will continue to provide financial support to the development of
renewable energy.
In addition to the market stimulus provided by the RO, offshore generation has been supported by The
Crown Estate’s leasing programme for offshore generation sites. To date there have been five offshore
wind development leasing rounds and one marine generation leasing round which represents a potential
offshore generation capacity of 55 GW (approx maximum). There have also been significant
developments in the delivery of offshore generation since the publication of the 2009 Statement. The total
amount of installed capacity from offshore generation is now in excess of 1 GW.
The first tender round for transitional offshore wind projects nears completion. The announcement of the
preferred bidders, selected to own and operate the first £700m worth of transmission links to seven of the
offshore wind farms was made in August 2010. The commencement of the first enduring tender round is
subject to the outcome of the enduring regime consultation process. In addition to the existing ‘OFTO

Offshore Development Information Statement 2010
8
0
5
10
15
20
25
30
35
40
45
50
2010 2015 2020 2025
GW
Slow Progression Gone Green Accelerated Growth Sustainable Growth
build’ approach, DECC/Ofgem are consulting on providing the option which will enable generator
developers to design and construct the transmission infrastructure which will eventually be transferred to
the appointed OFTO (‘Generator Build’ option). The consultation also outlined the implementation
challenges that have been identified in delivering the ‘Generator Build’ option and considered how the
regime can facilitate the development of a co-ordinated electricity transmission system
Future Scenarios
To assess the need for future transmission system development, it is necessary to make assumptions
regarding the future generation and demand background that the electricity transmission system will need
to accommodate. Four future generation and demand background scenarios: Slow Progression, Gone
Green, Accelerated Growth and Sustainable Growth are used to assess the range of potential
investment options. The future scenarios cover the period from 2010 to 2025 and consider the anticipated
range of potential offshore developments from nearly 17 GW of offshore generation capacity in 2025 in
the Slow Progression scenario to over 47 GW of offshore generation capacity in 2025 in Sustainable
Growth. The future scenarios, presented in this Statement, are different from the contracted position for
the future use of the NETS as presented in the Seven Year Statement (SYS).
Figure 1 details the amount of offshore generation (wind and marine) capacity for each of the four future
scenarios (inclusive of offshore generation connecting to the onshore distributed electricity network).
Figure 1 - Future Scenarios Comparison: Offshore Generation (Accumulative Capacity)
The dates (and the associated build-up rates) depicted in the future scenarios study period are for
analysis purposes only and are intended to illustrate how the electricity transmission system would need
to be developed to enable that level of generation to connect to the electricity network. The actual
transmission connection dates of the offshore generation projects are subject to the current governance
framework, planning process, supply chain, technology and financial considerations all of which will be
reflected in the connection date provided to and agreed by the developer. Furthermore the actual
development of the offshore and onshore transmission systems can and may differ from that illustrated by
the future generation and demand scenarios (and sensitivities) included within the Statement.
In addition to the four main scenarios, sensitivities on Interconnectors and Additional Regional
Capacity (ARC) have been analysed and the results included in the Statement.

Offshore Development Information Statement 2010
9
Legend: 1GW WindFarm Array
HVDC platformand cable
AC platform and cable
Offshore and Associated Onshore Connection Designs
Key factors in the design of the offshore electricity transmission network are the technologies available
and the application of the National Electricity Transmission System Security and Quality of Supply
Standard (NETS SQSS). After reviewing the existing technology available and that expected in the near
future, a set of possible standard designs for offshore electricity transmission has been formulated and
subsequently presented in the Statement.
The Statement also includes a number of conceptual desktop design strategies which demonstrate how
different technology and topology assumptions can impact the optimisation of offshore transmission
development. The different design strategies presented in the Statement are:
Radial: point-to-point connections from the offshore generation to suitable onshore Main
Interconnected Transmission System (MITS) collector substations using current generation
technology.
Radial Plus: similar to radial in the use of point to point connections for connecting the offshore
generation to the onshore MITS but utilising anticipated future transmission technology capability
within the strategy (e.g. 2 GW capacity converter stations and high capacity offshore cables) in line
with delivery forecasts for the next five years. Radial Plus also differs from the Radial Strategy in that
multiple groups of offshore generation are connected to the radial point-to-point connections as
opposed to a single group being connected radially.
Integrated: an interconnected offshore design using AC cable and HVDC interconnection between
offshore platforms and development areas, using the same advanced technology as with the Radial
Plus Strategy. Multiple offshore platforms will be interconnected, providing fewer cables and reduced
asset volumes.
Figure 2 - Strategy Design Configurations for Large Offshore Wind Farms
The 2010 Statement includes a conceptual integrated network design solution. As the transition through
the various offshore wind farm development leasing rounds e.g. Round 1, 2, 3, Scottish Territorial Waters
(STW), etc occurs, the expected growth rate, location and size of offshore wind projects has led NGET to
consider different ways in which offshore connections might be optimised. Given a better understanding
of the technologies available since the publication of the 2009 Statement, NGET has undertaken a
conceptual design study into the development of an integrated offshore transmission network.
The study has been premised on the principle that any design solution should:
maximise the potential deliverability of offshore wind;
co-ordinate onshore and offshore investment requirements to minimise environmental impacts;
Radial Plus Strategy
Radial Strategy Integrated Strategy
Offshore Development Information Statement 2010
10
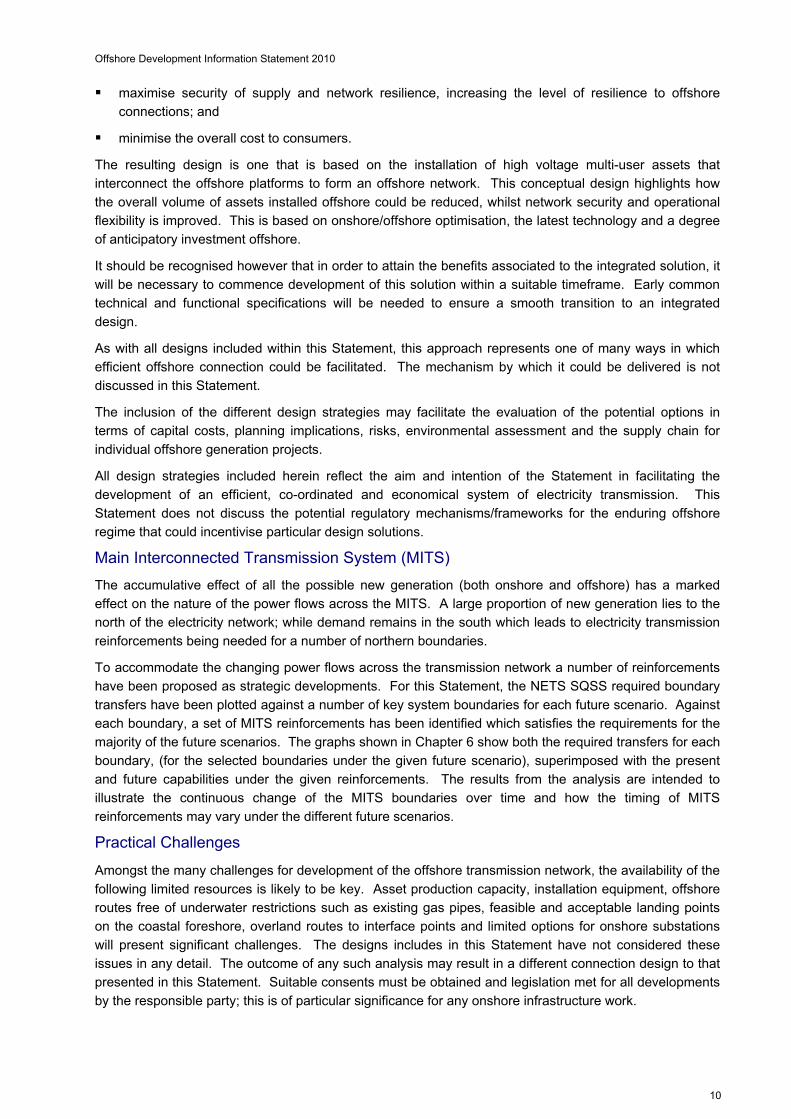
maximise security of supply and network resilience, increasing the level of resilience to offshore
connections; and
minimise the overall cost to consumers.
The resulting design is one that is based on the installation of high voltage multi-user assets that
interconnect the offshore platforms to form an offshore network. This conceptual design highlights how
the overall volume of assets installed offshore could be reduced, whilst network security and operational
flexibility is improved. This is based on onshore/offshore optimisation, the latest technology and a degree
of anticipatory investment offshore.
It should be recognised however that in order to attain the benefits associated to the integrated solution, it
will be necessary to commence development of this solution within a suitable timeframe. Early common
technical and functional specifications will be needed to ensure a smooth transition to an integrated
design.
As with all designs included within this Statement, this approach represents one of many ways in which
efficient offshore connection could be facilitated. The mechanism by which it could be delivered is not
discussed in this Statement.
The inclusion of the different design strategies may facilitate the evaluation of the potential options in
terms of capital costs, planning implications, risks, environmental assessment and the supply chain for
individual offshore generation projects.
All design strategies included herein reflect the aim and intention of the Statement in facilitating the
development of an efficient, co-ordinated and economical system of electricity transmission. This
Statement does not discuss the potential regulatory mechanisms/frameworks for the enduring offshore
regime that could incentivise particular design solutions.
Main Interconnected Transmission System (MITS)
The accumulative effect of all the possible new generation (both onshore and offshore) has a marked
effect on the nature of the power flows across the MITS. A large proportion of new generation lies to the
north of the electricity network; while demand remains in the south which leads to electricity transmission
reinforcements being needed for a number of northern boundaries.
To accommodate the changing power flows across the transmission network a number of reinforcements
have been proposed as strategic developments. For this Statement, the NETS SQSS required boundary
transfers have been plotted against a number of key system boundaries for each future scenario. Against
each boundary, a set of MITS reinforcements has been identified which satisfies the requirements for the
majority of the future scenarios. The graphs shown in Chapter 6 show both the required transfers for each
boundary, (for the selected boundaries under the given future scenario), superimposed with the present
and future capabilities under the given reinforcements. The results from the analysis are intended to
illustrate the continuous change of the MITS boundaries over time and how the timing of MITS
reinforcements may vary under the different future scenarios.
Practical Challenges
Amongst the many challenges for development of the offshore transmission network, the availability of the
following limited resources is likely to be key. Asset production capacity, installation equipment, offshore
routes free of underwater restrictions such as existing gas pipes, feasible and acceptable landing points
on the coastal foreshore, overland routes to interface points and limited options for onshore substations
will present significant challenges. The designs includes in this Statement have not considered these
issues in any detail. The outcome of any such analysis may result in a different connection design to that
presented in this Statement. Suitable consents must be obtained and legislation met for all developments
by the responsible party; this is of particular significance for any onshore infrastructure work.

Offshore Development Information Statement 2010
11
Way Forward
The Statement is the subject of an annual review process, facilitated by NGET with industry participation.
NGET will commence a formal review of the 2010 Statement, in December 2010. The review will be
conducted with the industry and will take the form of a formal consultation document (which will be
available on National Grid’s website). The review exercise will incorporate an industry workshop which is
scheduled for January 2011. The aim of the workshop will be to review the 2010 Statement (and the
associated consultation document) and to identify how the Statement may be continually developed in line
with the latest offshore developments and licence provisions.
Any proposed amendments to the structure/layout and the future scenarios which may be incorporated
within future editions of the Statement, are the subject of this annual review process with a subsequent
formal submission to the Authority (outlining the proposed amendments to structure/layout and future
scenarios).
Offshore Development Information Statement 2010
12
Chapter One Offshore Electricity Transmission Overview
1.1 Background
The UK has two key environmental targets relating to renewable energy and greenhouse gas emissions
(GHGs). The first of these targets is part of the European Union’s (EU) integrated energy/climate change
proposal that addresses the issues of energy supply and climate change and in doing so sets a target of
20% of European energy (including electricity, heat & transport) to come from renewable sources by
20201.
The UK’s contribution to this target is 15% which is lower than the European wide average due to the UK’s
low starting point (2% compared to EU average of 9%). However, the UK has the largest increase of any
country which was due to its low starting point, economic strength and its high potential for renewable
generation i.e. significant wind, wave and tidal resources.
The Renewable Energy Strategy2 (published in July 2009) identified that in order to meet this target
approximately 30% of UK’s electricity will have to come from renewable sources by 2020, with a
corresponding 12% from heat and 10% from transport.
The second target, which also follows the principles of the overall EU 20/20/20 vision (20% of energy from
renewable sources along with a 20% reduction in GHG emissions and 20% improvement in energy
efficiency by 2020) but goes even further, has been incorporated in the Climate Change Act3 and sets a
target of 80% reduction in GHGs from the 1990 levels by 2050. This equates to a 34% reduction in GHGs
emissions by 2020 as specified by the Climate Change Committee4.
This section details the changes that have happened to the UK energy markets and the electricity
regulatory framework to encourage the development of renewable energy in this country.
1.1.1 Renewables Obligation
The Renewables Obligation (RO) scheme5 obligates electricity suppliers to source an increasing
proportion of their power from renewable generation. Accredited renewable generators are issued with
Renewable Obligation Certificates (ROCs) for each megawatt hour (MWh) of eligible energy generated,
multiplied by a factor that is dependant on the type of generation technology.
The Renewables Obligation, the Renewables Obligation Scotland and the Northern Ireland Renewables
Obligation have been designed to incentivise renewable generation into the electricity generation market.
Renewable generators can sell ROCs that they have acquired to electricity suppliers. Each year, the
Office of Gas and Electricity Markets (Ofgem)6 sets the percentage of electrical energy for which suppliers
must obtain ROCs for and the buy-out price7 that suppliers must pay for any deficit (with the proceeds
recycled to suppliers based on their proportion of the total number ROCs obtained).
The RO was introduced in 20028 with an original end date of 2027. However, in light of the 2020 targets
and the need to encourage investment in renewable energy up to 2020, the operational timeline of the RO
1 http://www.energy.eu/directives/com2008_0030en01.pdf 2 http://www.decc.gov.uk/en/content/cms/what_we_do/uk_supply/energy_mix/renewable/res/res.aspx http://www.decc.gov.uk/assets/decc/What%20we%20do/UK%20energy%20supply/Energy%20mix/Renewable%20energy/Rene
wable%20Energy%20Strategy/1_20090717120647_e_@@_TheUKRenewableEnergyStrategy2009.pdf 3 http://www.opsi.gov.uk/acts/acts2008/ukpga_20080027_en_1 4 http://www.theccc.org.uk/ 5 http://www.ofgem.gov.uk/Sustainability/Environment/RenewablObl/Pages/RenewablObl.aspx 6 http://www.ofgem.gov.uk/Pages/OfgemHome.aspx 7 http://www.ofgem.gov.uk/Media/PressRel/Documents1/RO%20Buy-Out%20price%202010%2011%20FINAL%20FINAL.pdf 8 Renewable Obligation (Scotland) Order came into effect in April 2002 Renewable Obligation (Northern Ireland) Order came into effect in April 2005

Offshore Development Information Statement 2010
13
has been recently extended to 20379. A limit of 20 years support for accredited generating stations was
also introduced in parallel (subject to the 2037 end date) to avoid overcompensation.
The Department of Energy and Climate Change (DECC) are currently consulting on whether to allow
operators of large offshore wind generating stations to register for their ROCs in phases of operational
capacity to account for long construction periods. The 20 years of support would apply to up to five
phases starting from the date of full RO accreditation and then once a year for a maximum of five years10.
Historically one ROC was issued for each MWh of eligible renewable output generated. However April
2009 introduced the concept of a banding system. The banding system used onshore wind power as a
reference technology (reference band), with any technology which needed more support (post
demonstration and emerging technologies band) being granted additional ROCs and similarly more
commercially viable technologies (established bands) being granted less ROCs.
TABLE 1.1 – Renewable Obligation Certificates Allocation (England, Wales & Scotland) 11
Developmental Category for Renewable Obligation Banding
Technologies Level of Support ROCs per MWh
Most Established Landfill Gas 0.25
Established Co-firing of Biomass
Sewage Gas 0.5
Reference
Co-firing of Biomass with CHP
Co-firing of Energy Crops
Energy from Waste with CHP
Geopressure
Hydro-electric
Onshore Wind
1.0
Post Demonstration
Co-firing of Energy Crops with CHP
Dedicated Biomass
Offshore Wind
1.5
Emerging Technologies
Anaerobic Digestion
Dedicated Biomass with CHP
Dedicated Energy Crops
Dedicated Energy Crops with CHP
Gasification
Geothermal
Pyrolysis
Solar Photovoltaic
Tidal Impoundment – Tidal Barrage
Tidal Impoundment – Tidal Lagoon
Tidal Stream
Wave
2.0
Enhanced Wave & Tidal Bands (Scotland Only)12
Wave and tidal projects located in Scottish waters and not receiving Government grant support.
Tidal
3.0
Wave
5.0
9 http://www.ofgem.gov.uk/Sustainability/Environment/RenewablObl/Documents1/Annual%20Report%202008-09.pdf 10 http://www.decc.gov.uk/assets/decc/Consultations/Renewables%20Obligation/261-statutory-con-renewables-obligation.pdf 11 http://chp.defra.gov.uk/cms/roc-banding/ 12 http://www.scotland.gov.uk/Publications/2009/12/10134807/4 http://www.scotland.gov.uk/News/Releases/2008/09/19111827 http://www.scotland.gov.uk/Resource/Doc/917/0065773.pdf
Offshore Development Information Statement 2010
14
Under the banding scheme, offshore wind projects attracts 1.5 ROCs with tidal/wave projects attracting 2
ROCs for each MWh of eligible renewable output generated. To further stimulate the market, additional
ROCs were to be made available to offshore wind projects which met a number of preconditions13. It has
subsequently been announced that this additional support for offshore wind projects would be extended,
with projects which have been fully accredited between 1st April 2010 and 31st March 2014 attracting 2
ROCs for each MWh of eligible renewable output generated14.
Offshore power generation will play an important part in the meeting of the renewable energy and carbon
emission targets for 2020 and afterwards towards 2050. In addition to the market stimulus provided by
the RO, offshore generation has been supported by The Crown Estate’s leasing programmes for offshore
generation sites. The development of these programmes and the regulatory framework for offshore
generation is detailed in the following sections.
1.2 Offshore Generation Development
Great Britain has the potential to generate renewable electricity energy by utilising the vast natural
resources readily and freely available in the waters surrounding the country. This ‘green energy’ can be
captured by offshore wind farms15 and marine16 technology (tidal and wave) located in the UK’s offshore
waters17.
1.2.1 Offshore Wind Development
Offshore wind farm developers lease the seabed on which their infrastructure is to be constructed from
The Crown Estate18. To facilitate this, The Crown Estate has held a number of allocation rounds,
allocating defined areas of the seabed to potential wind farm developers19.
The Crown Estate launched the first round of offshore wind farm site allocations, in the UK’s territorial
waters, in 200020. Round 1 was intended to act as a demonstration round allowing potential developers to
gain an understanding of the technology, environmental and economic issues associated with developing
and operating an offshore wind farm. The Round 1 allocation permitted a seabed area of 10 km2 to be
developed with a maximum number of 30 turbines to generate a minimum installed capacity of 20 MW.
The Round 1 locations were put forward by potential developers based on a range of relevant factors
including water depth, wind resource and grid connection. Areas of high nature conservation value were
avoided as were areas of seabed where existing activities and uses were potentially incompatible with
offshore wind farm development. As a result, all the proposed Round 1 offshore wind farm sites are
located in water depths of less than 20 m and no further than 12 km (7.5 miles) offshore.
Following the success of Round 1, The Crown Estate conducted a second round (Round 2) in 2003 for
sites at least 8-13 km (5-8 miles) offshore. Leases were awarded to 15 projects20. The combined
generation capacity of Round 1 and Round 2 is approximately 8 GW.
In May 2010, The Crown Estate announced awards for the Round 1 and Round 2 project extensions21.
Three Round 1 and Round 2 offshore wind farm operators were selected to extend five sites, creating an
additional 1.7 GW generation capacity. In addition, two other projects were offered increased capacity
within their existing Round 1 and 2 site areas.
13 Offshore wind projects which have government consent and have placed order for wind turbines in financial year 2009/10 will
be eligible for 2 ROCs with 1.75 ROCs available in 2010/11. 14 http://www.ofgem.gov.uk/Sustainability/Environment/RenewablObl/Documents1/Annual%20Report%202008-09.pdf 15 http://www.bwea.com/offshore/how.html 16 http://www.bwea.com/marine/devices.html http://www.bwea.com/marine/devices2.html 17 http://www.thecrownestate.co.uk/marine_all_activity_map.pdf 18 http://www.thecrownestate.co.uk/ 19 http://decc.gov.uk/en/content/cms/what_we_do/uk_supply/energy_mix/renewable/policy/offshore/wind_leasing/wind_leasing.aspx 20 http://www.thecrownestate.co.uk/our_portfolio/marine/offshore_wind_energy/rounds-one-two.htm 21 http://www.thecrownestate.co.uk/our_portfolio/marine/offshore_wind_energy/r1-r2-lease-area-extensions.htm http://www.thecrownestate.co.uk/rounds_1_2_site_extension_awards.pdf
Offshore Development Information Statement 2010
15
In January 2010, The Crown Estate announced the development partners for Round 3 offshore wind
development zones22. The aim of Round 3 offshore wind energy generation was to deliver a quarter of
the UK electricity needs by 202023. Each of the development partners has been assigned to one of the
nine development zones. The combined generation capacity of Round 3 could amount to 32 GW by 2020
and is sufficient to ensure that the 25 GW that has been enabled by the Strategic Environment
Assessment (SEA)24 for offshore renewable energy can be achieved.
Exclusivity agreements have also been granted by The Crown Estate for up to 6.4 GW of generation
capacity in Scottish Territorial Waters (STW)25. The combined generation capacity for Rounds 1, 2 and 3
projects along with STW projects could amount to over 47 GW by 202026.
1.2.2 Offshore Marine Technology
The geography of the UK lends itself to the utilisation of other offshore renewable power generation
technologies, including wave and tidal generation. Wave energy is the extraction of energy that is
transferred from air to sea as the wind blows over the water’s surface. Tidal energy is the extraction of
energy that is transferred to the sea, in the form of tides, through the combination of moon/sea
gravitational pull and the rotation of the earth. There are two types of tidal energy:
Tidal Range
Tidal ranges harnesses energy from the rise and fall of the tides. Collecting high tide waters behind
barriers or barrages and extracting energy by passing it through turbines as the tide falls (e.g. the
Severn Estuary).
Tidal Stream
Tidal streams utilises the kinetic energy from tidal currents to turn underwater turbines which are
similar to those of wind turbines.
Full scale marine generation is actively being developed within the UK but with limited wave and tidal
generation capacity installed to date (all of which have been small in generation capacity and not directly
connected to the National Electricity Transmission System (NETS))27.
In March 2010, The Crown Estate announced that they had entered into Agreements for Lease for
projects with a potential generation capacity of 1,200 MW in the Pentland Firth and Orkney Waters28. The
Pentland Firth and Orkney Waters is the first area to be made available for commercial-scale development
of wave and tidal energy in Scotland (and the whole of the UK). The projects are believed to represent the
largest planned development of wave and tidal energy worldwide.
1.3 Offshore Electricity Transmission Regulatory Regime
1.3.1 Regime Overview
Ofgem, in collaboration with DECC, has established a regulatory regime29 for offshore transmission
networks to ensure that new offshore renewable generation projects are connected to the electricity grid
economically and efficiently. The offshore transmission regime was activated on 24th June 200930 (‘Go-
22 http://www.thecrownestate.co.uk/our_portfolio/marine/offshore_wind_energy/round3/r3-developers.htm http://www.thecrownestate.co.uk/round3_map.pdf 23 http://www.thecrownestate.co.uk/newscontent/92-r3-developers.htm 24 http://www.offshore-sea.org.uk/consultations/Offshore_Energy_SEA/index.php 25 http://www.thecrownestate.co.uk/our_portfolio/marine/offshore_wind_energy/scottish-offshore-
wind/scottish_offshore_consortia.htm http://www.thecrownestate.co.uk/scottish_offshore_exclusivity_agreements.pdf 26 www.thecrownestate.co.uk/uk_offshore_wind_report_2010.pdf 27 http://www.wavegen.co.uk/what_we_offer_limpet_islay.htm http://www.rwe.com/web/cms/en/309656/rwe-npower-renewables/sites/projects-in-development/marine/siadar/the-proposal/ 28 http://www.thecrownestate.co.uk/our_portfolio/marine/wave-tidal/pentland-firth-orkney-waters.htm http://www.thecrownestate.co.uk/newscontent/92-pentland-firth-developers.htm http://www.thecrownestate.co.uk/pfow_development_sites_map.pdf 29 http://www.ofgem.gov.uk/Networks/offtrans/Pages/Offshoretransmission.aspx http://www.ofgem.gov.uk/Media/FactSheets/Documents1/offshoretransmissionfs.pdf 30 http://www.ofgem.gov.uk/Networks/offtrans/pdc/cdr/cons2009/documents1/main.pdf
Offshore Development Information Statement 2010
16
Active’) at which date DECC extended the scope of NGET’s system operator role to offshore waters.
Therefore, NGET is responsible for the day-to-day management of the flow of electricity onto and over the
National Electricity Transmission System.
NGET (in its role of National Electricity Transmission System Operator (NETSO)) will have a relationship
with each of the OFTOs in accordance with the System Operator - Transmission Owner Code31 (STC). In
addition, NGET’s existing responsibility of operating and co-ordinating onshore applications for
transmission grid connections has been extended to include the processing of applications for offshore
connections. NGET offers terms of connection to and/or use of the transmission system to offshore
generators in respect of a transmission system connection point at an offshore location. The extension of
NGET’s system operator role has extended the scope of NGET’s work in respect of the development of an
efficient, co-ordinated and economical system of electricity transmission to include offshore transmission
connections.
Offshore transmission that operates at 132 kV or above will be a licensed activity32, regulated by Ofgem33
and assigned through an annual competitive tender process. Qualifying companies will bid to become the
Offshore Transmission Owner (OFTO) for a particular offshore network. The OFTOs revenue will be
predominately made up of the 20 year revenue stream determined by its bid during the tender process,
which is based on its submission of costs of financing, designing/constructing (if applicable), operating,
maintaining and decommissioning of the transmission assets. OFTOs will receive their regulated revenue
stream payments via NGET (acting in their role of NETSO). NGET will calculate and levy the charges
payable by the offshore generator for the transmission service, according to its published Use of System
Charging Methodology34.
1.3.2 Transitional Arrangements and Enduring Regime
The process to introduce this offshore transmission regime has been divided into two discrete categories:
Transitional
Transitional projects are those in which the offshore transmission assets have been or are being
constructed by the offshore generator.
These, subject to meeting the criteria of the applicable Tender Regulations, will be able to participate
in the Transitional Tender Rounds. The first transitional tender round commenced in June 200935 with
the second transitional tender round expected to commence in 201036.
Offshore transmission licences will be granted upon transfer of the transmission assets from the
developer to the OFTO.
Enduring
Based on Ofgem’s December 2009 consultation37, subsequent tenders will be completed under the
enduring regime, for projects that meet certain preconditions set by Ofgem. Enduring projects can
currently be run on the basis of securing a transmission licence, via an Ofgem run competition, to
design, build, finance, operate and maintain the transmission assets (‘OFTO Build’ option).
However, following the responses received to the December 2009 consultation, Ofgem and DECC
have engaged extensively with the stakeholder community and carefully considered the arguments
raised by respondents. As a result, a further consultation on extending the flexibility of the enduring
regime to include the option for generators to build offshore transmission assets, before transferring
them to an OFTO appointed through a competitive tender process (‘Generator Build’ option), was
31 http://www.nationalgrid.com/uk/Electricity/Codes/sotocode/ 32 http://www.opsi.gov.uk/acts/acts2004/ukpga_20040020_en_1 http://www.opsi.gov.uk/acts/acts2008/ukpga_20080032_en_1 33 Faciliated by Ofgem’s E-Serve Division: http://www.ofgem.gov.uk/E-Serve/Pages/e-serve.aspx 34 http://www.nationalgrid.com/uk/Electricity/Charges/chargingstatementsapproval 35 http://www.ofgem.gov.uk/Networks/offtrans/rott/Pages/rott.aspx 36 http://www.ofgem.gov.uk/Networks/offtrans/rttt/Pages/rttt.aspx 37 http://www.ofgem.gov.uk/Pages/MoreInformation.aspx?docid=113&refer=Networks/offtrans/pdc/cdr/cons2009 http://www.ofgem.gov.uk/Networks/offtrans/pdc/cdr/cons2009/Documents1/Consultation%20on%20the%20Enduring%20Regim
e.pdf
Offshore Development Information Statement 2010
17
issued in August 201038. The consultation also outlined the implementation challenges that have
been identified in delivering this further option and considered how the regime can facilitate the
development of a co-ordinated electricity transmission system.
Transitional Projects
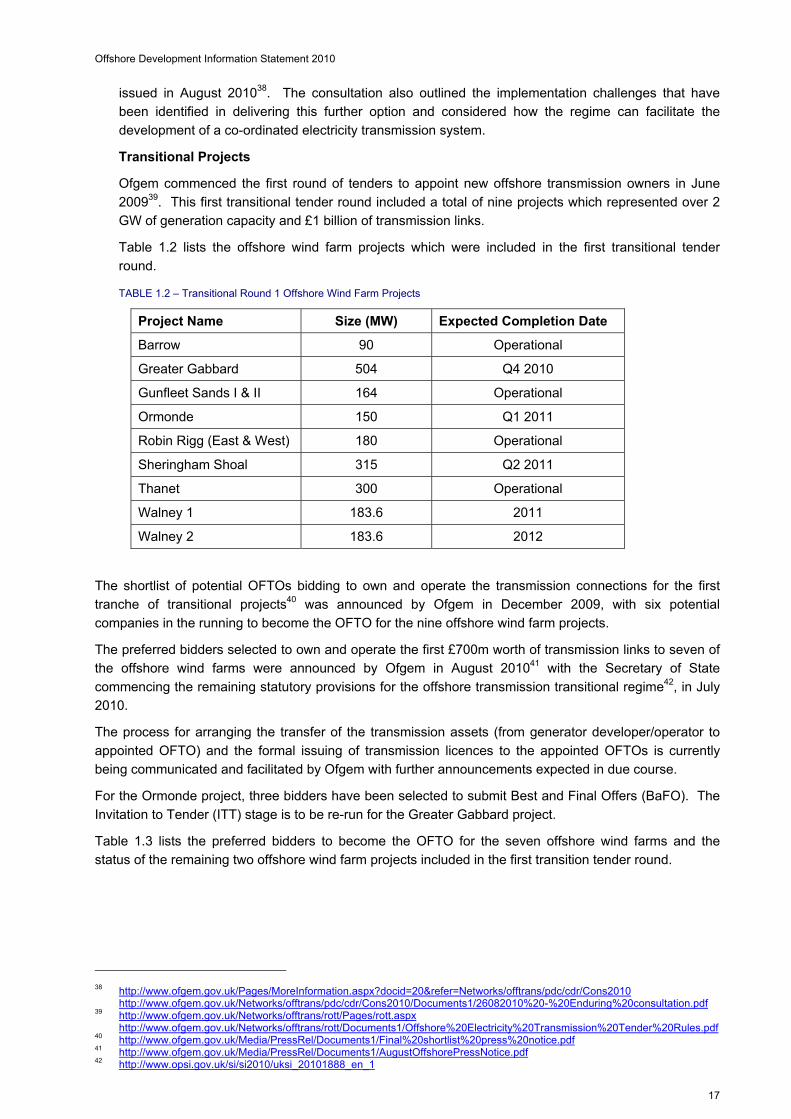
Ofgem commenced the first round of tenders to appoint new offshore transmission owners in June
200939. This first transitional tender round included a total of nine projects which represented over 2
GW of generation capacity and £1 billion of transmission links.
Table 1.2 lists the offshore wind farm projects which were included in the first transitional tender
round.
TABLE 1.2 – Transitional Round 1 Offshore Wind Farm Projects
Project Name Size (MW) Expected Completion Date
Barrow 90 Operational
Greater Gabbard 504 Q4 2010
Gunfleet Sands I & II 164 Operational
Ormonde 150 Q1 2011
Robin Rigg (East & West) 180 Operational
Sheringham Shoal 315 Q2 2011
Thanet 300 Operational
Walney 1 183.6 2011
Walney 2 183.6 2012
The shortlist of potential OFTOs bidding to own and operate the transmission connections for the first
tranche of transitional projects40 was announced by Ofgem in December 2009, with six potential
companies in the running to become the OFTO for the nine offshore wind farm projects.
The preferred bidders selected to own and operate the first £700m worth of transmission links to seven of
the offshore wind farms were announced by Ofgem in August 201041 with the Secretary of State
commencing the remaining statutory provisions for the offshore transmission transitional regime42, in July
2010.
The process for arranging the transfer of the transmission assets (from generator developer/operator to
appointed OFTO) and the formal issuing of transmission licences to the appointed OFTOs is currently
being communicated and facilitated by Ofgem with further announcements expected in due course.
For the Ormonde project, three bidders have been selected to submit Best and Final Offers (BaFO). The
Invitation to Tender (ITT) stage is to be re-run for the Greater Gabbard project.
Table 1.3 lists the preferred bidders to become the OFTO for the seven offshore wind farms and the
status of the remaining two offshore wind farm projects included in the first transition tender round.
38 http://www.ofgem.gov.uk/Pages/MoreInformation.aspx?docid=20&refer=Networks/offtrans/pdc/cdr/Cons2010 http://www.ofgem.gov.uk/Networks/offtrans/pdc/cdr/Cons2010/Documents1/26082010%20-%20Enduring%20consultation.pdf 39 http://www.ofgem.gov.uk/Networks/offtrans/rott/Pages/rott.aspx http://www.ofgem.gov.uk/Networks/offtrans/rott/Documents1/Offshore%20Electricity%20Transmission%20Tender%20Rules.pdf 40 http://www.ofgem.gov.uk/Media/PressRel/Documents1/Final%20shortlist%20press%20notice.pdf 41 http://www.ofgem.gov.uk/Media/PressRel/Documents1/AugustOffshorePressNotice.pdf 42 http://www.opsi.gov.uk/si/si2010/uksi_20101888_en_1

Offshore Development Information Statement 2010
18
TABLE 1.3 – Transitional Round 1 Offshore Wind Farm Projects: Preferred & Reserve Bidders
Project Name/Size Forecast Transfer Value
(£m)
Preferred Bidders Reserve Bidders
Barrow (90 MW)
36.5 Transmission Capital Partners
Macquarie Capital Group
Gunfleet Sands I & II (164 MW)
48.2 Transmission Capital Partners
Macquarie Capital Group
Robin Rigg (East & West) (180 MW)
57.3 Transmission Capital Partners
Macquarie Capital Group
Sheringham Shoal (315 MW)
182.2 Macquarie Capital Group
Balfour Beatty Capital
Thanet (300 MW)
163.1 Balfour Beatty Capital
Macquarie Capital Group
Walney 1 (183.6 MW)
101.8 Macquarie Capital Group
Transmission Capital Partners
Walney 2 (183.6 MW)
105 Macquarie Capital Group
Transmission Capital Partners
Ormonde (150 MW)
101.1 BaFO process to be run with Balfour Beatty Capital, Macquarie Capital Group and Transmission Capital Partners
Greater Gabbard (504 MW)
316.6 ITT to be rerun with shortlisted firms
The second transitional tender round is expected to commence in 201036. The projects that have qualified
for the second tender round have yet to be announced although the qualifying project requirements was
published by Ofgem in August 2010 43.
Enduring Projects
The commencement of the first enduring tender round is subject to the outcome of the enduring regime
consultation process. As previously noted in December 2009, Ofgem issued a consultation on the
enduring regulatory regime for offshore electricity transmission37 which focused on a limited number of
aspects of the enduring regime, within the framework put in place by DECC at ‘Go-Active’. The
consultation stressed the key principles of providing flexibility and facilitating the delivery of significant
volumes of offshore generation. It also set out minded-to positions in respect of key elements of the
enduring regime. Among other things, it reviews the different stages at which Ofgem considered it was
appropriate that a generator could request the appointment of an OFTO.
Under the enduring framework, outlined by DECC in June 2009, the OFTO would assume responsibility
for the procurement, construction, operation and maintenance of the transmission assets44. However, the
December 2009 consultation outlined a minded-to position that provided flexibility over when the
generator could request a tender (as long as it had met the tender entry conditions). The spectrum of
options ranged from the OFTO undertaking all the pre-construction activity (‘Early OFTO Appointment’) to
this being taken forward by the generator (‘Late OFTO Appointment’).
Subsequently DECC/Ofgem announced their intention to consult further on the enduring regulatory regime
for offshore electricity transmission45. In addition to the existing ‘OFTO build’ approach, DECC/Ofgem
have consulted on providing the option of enabling generator developers to design and construct the
43 http://www.ofgem.gov.uk/Networks/offtrans/rttt/Documents1/Offshore%20Electricity%20Transmission%20-
%20Second%20Round%20Tenders.pdf http://www.ofgem.gov.uk/Networks/offtrans/pdc/cdr/Cons2010/Documents1/Statement%20on%202010%20Tender%20Regs.pdf 44 http://www.ofgem.gov.uk/Networks/offtrans/pdc/cdr/cons2009/Documents1/Main.pdf 45 http://www.decc.gov.uk/assets/decc/What%20we%20do/UK%20energy%20supply/futureelectricitynetworks/254-offshore-trans-
decc-ofgem-letter.pdf
Offshore Development Information Statement 2010
19
transmission infrastructure which would then be transferred to the appointed OFTO (‘Generator Build’
option).
The consultation also outlined the implementation challenges that have been identified in delivery of this
further option and considered how the regime can facilitate the development of a co-ordinated electricity
transmission system38.
Offshore Transmission Connection Application Process
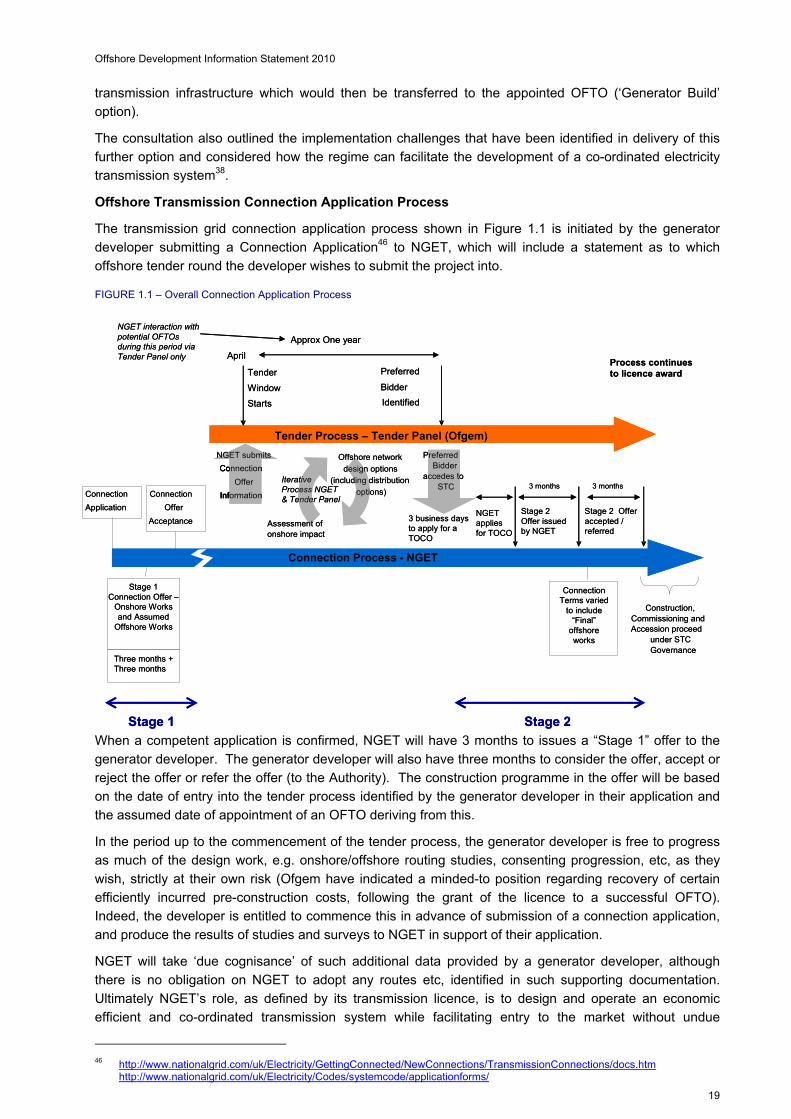
The transmission grid connection application process shown in Figure 1.1 is initiated by the generator
developer submitting a Connection Application46 to NGET, which will include a statement as to which
offshore tender round the developer wishes to submit the project into.
FIGURE 1.1 – Overall Connection Application Process
When a competent application is confirmed, NGET will have 3 months to issues a “Stage 1” offer to the
generator developer. The generator developer will also have three months to consider the offer, accept or
reject the offer or refer the offer (to the Authority). The construction programme in the offer will be based
on the date of entry into the tender process identified by the generator developer in their application and
the assumed date of appointment of an OFTO deriving from this.
In the period up to the commencement of the tender process, the generator developer is free to progress
as much of the design work, e.g. onshore/offshore routing studies, consenting progression, etc, as they
wish, strictly at their own risk (Ofgem have indicated a minded-to position regarding recovery of certain
efficiently incurred pre-construction costs, following the grant of the licence to a successful OFTO).
Indeed, the developer is entitled to commence this in advance of submission of a connection application,
and produce the results of studies and surveys to NGET in support of their application.
NGET will take ‘due cognisance’ of such additional data provided by a generator developer, although
there is no obligation on NGET to adopt any routes etc, identified in such supporting documentation.
Ultimately NGET’s role, as defined by its transmission licence, is to design and operate an economic
efficient and co-ordinated transmission system while facilitating entry to the market without undue
46 http://www.nationalgrid.com/uk/Electricity/GettingConnected/NewConnections/TransmissionConnections/docs.htm http://www.nationalgrid.com/uk/Electricity/Codes/systemcode/applicationforms/
Process continuesto licence award
Stage 1 Stage 2
Tender Process – Tender Panel (Ofgem)
Connection ProcessConnection Process - NGET
Connection
Application
Stage 1 Connection Offer –
Onshore Works and Assumed
Offshore Works
Connection
Offer
Acceptance
Tender
Window
Starts
Connection
Offer
Information
Connection
Offer
Information
Offshore network
design options (including distribution
options)
Assessment of onshore impact
Preferred
Bidder
Identified
Preferred Bidder
accedes to STC
Construction, Commissioning and Accession proceed
under STC Governance
Three months + Three months
Connection Terms varied
to include “Final”
offshore works
April
Approx One year
3 business days to apply for a TOCO
Stage 2 Offer issued by NGET
Stage 2 Offer accepted / referred
3 months 3 months
NGET submits
NGET interaction with potential OFTOs during this period via Tender Panel only
Iterative Process NGET & Tender Panel
NGET applies for TOCO

Offshore Development Information Statement 2010
20
discrimination between users or classes of users. As such, NGET will undertake desktop studies to derive
an offshore route from the Connection Site to the Onshore Transmission Interface, having due
consideration of the overall system development and issues associated with the scheme.
When Ofgem has appointed an OFTO, NGET will submit an application to the OFTO for a Construction
Offer (TOCO) in respect of the offshore works associated with the successful bid. NGET will then
incorporate the terms of these works into a “Stage 2” offer to the generator, who again will have three
months to consider and accept the offer, reject the offer or refer the offer (to the Authority).
This process is designed to enable that the works in the revised offer will be progressed, both onshore
and offshore, through to commissioning, completion and operation of the plant.
It should be noted that the process as outlined above is the subject of further consultation. Confirmation
of the transmission grid connection application and the OFTO tender processes will be clearer when the
arrangements for enduring regime has been finalised following the completion of the consultation process.
1.4 Previous and Parallel Initiatives
1.4.1 Enhanced Transmission Investment Incentives
The Transmission Access Review (TAR) Final Report published in June 200847 sets out a package of
measures that were targeted at helping to facilitate the UK’s 2020 targets, by reducing or removing grid
related access barriers to connecting new generation. These measures include steps to create the
appropriate regulatory and commercial framework and rules to enhance the speed with which new
generation (renewable and conventional) could connect to the transmission system. Two parallel activities
have followed on from the TAR Final Report:
i. 2020 Transmission System Study (“ENSG Study”) – The three electricity onshore Transmission
Owners (TOs) have undertaken system studies to look at investment scenarios that would be capable
of supporting the UK’s 2020 targets.
ii. Enhanced transmission investment incentives (“TO incentives”) – this work focused on the
development of appropriate funding arrangements, as enhancements to the arrangements under the
current transmission price control (TPCR4)48. It also considered the merits of introducing incentives to
encourage the transmission companies to anticipate future investment requirements.
Published by the Electricity Networks Strategy Group49 (ENSG) in July 2009, the ENSG study (‘Our
Electricity Transmission Network: A Vision for 2020’ report50) identified a large number of major
transmission system projects designed to support the connection of new generation. The report
highlighted reinforcements which the TOs considered were most likely to commence in the near future
and also set out areas where further reinforcements have been identified for potential future consideration.
In order to take forward their work on TO incentives, Ofgem asked the transmission companies to identify
and provide further information on those projects which the TOs considered required additional or earlier
funding during the current transmission price control period (TPCR4). The final proposals for the
Enhanced Transmission Investment Incentives were published by Ofgem in January 201051. The
proposals confirmed the funding framework which would be adopted to fund costs up to the end of
2011/12 and outlined how Ofgem would phase their decisions on funding the investment proposed by the
TOs, on which an additional expenditure of around £1 billion52 is currently planned over this period.
Ofgem assessed the initial tranche of investments and announced their intention to allow £78 million of
47 http://www.ofgem.gov.uk/Pages/MoreInformation.aspx?docid=128&refer=Networks/Trans/ElecTransPolicy/tar 48 http://www.ofgem.gov.uk/Networks/Trans/PriceControls/Pages/PriceControls.aspx 49 http://www.ensg.gov.uk/index.php?article=2 50 http://www.ensg.gov.uk/assets/ensg_transmission_pwg_full_report_final_issue_1.pdf http://www.ensg.gov.uk/assets/ensg__2030_transmission_addendum_final_issue_1.pdf 51 http://www.ofgem.gov.uk/Networks/Trans/ElecTransPolicy/TAR/Documents1/100118_TOincentives_final_proposals_FINAL.pdf http://www.ofgem.gov.uk/Networks/Trans/ElecTransPolicy/TAR/Documents1/100115_TO%20Inc%20Supp_App_FINAL.pdf 52 http://www.ofgem.gov.uk/Media/PressRel/Documents1/TO%20incentives_PRESS%20RELEASE.pdf

Offshore Development Information Statement 2010
21
pre-construction funding and £241 million of construction funding on projects planned to commence
construction before 1st April 2011:
i. Beauly-Blackhillock-Kintore, (SHETL);
ii. Beauly-Dounreay, (SHETL);
iii. Knocknagael, (SHETL);
iv. Deeside substation component of the Western HVDC link, (NGET);
v. East Anglia, (NGET) and;
vi. Preparatory work on the SPTL-NGET interconnection (SPTL).
The transmission companies have provided further information to support their case for funding for the
remaining projects due to start construction by April 2012. Ofgem will make assessments and reach a
decision regarding the funding arrangement in due course. Ofgem intends to address future funding
arrangements as part of the next transmission price control review process53.
1.4.2 Improving Grid Access
Following its consultation on the options for grid access reform54, DECC announced the Government
decision to implement a Connect and Manage (C&M) approach to transmission access55. This new
approach commenced on 11th August 2010, the date at which the necessary industry code and licence
modifications became effective.
The new arrangements continue the principle introduced under Interim Connect and Manage56 (ICM),
where generation projects are allowed to connect to the transmission system in advance of the completion
of the wider transmission reinforcement works. C&M introduces the concept of ‘Enabling Works’, which
are those transmission reinforcement works required to be completed prior to a generator connecting, the
criteria for identifying “enabling works” is set out within a new section (Section 13 – Enabling Works) of the
Connection and Use of System Code (CUSC)57. In accordance with the CUSC, offers made by the NGET
shall be on the basis of the Connect and Management Arrangements (as outlined in Section 1.4 of the
CUSC)58.
Under C&M derogations against the National Electricity Transmission System Security and Quality of
Supply Standard (NETS SQSS), required to facilitate connections ahead of the completion of the wider
onshore transmission reinforcement works, in some circumstances can be self managed by the relevant
TO.
1.4.3 National Electricity Transmission System Security & Quality of Supply Standard
The National Electricity Transmission System Security and Quality of Supply Standard (NETS SQSS)
version 2.0 was issued in June 200959. This is the first version of the NETS SQSS60 to contain criteria for
the planning and operation of offshore transmission networks.
The criteria are organised along similar lines as those used for the planning and operation of the onshore
transmission system. They are divided into sections as follows:
i. Generation Connection Criteria;
ii. Demand Connection Criteria;
53 http://www.ofgem.gov.uk/Networks/Trans/PriceControls/TPCR5/Pages/TPCR5.aspx 54 http://www.decc.gov.uk/en/content/cms/consultations/improving_grid/improving_grid.aspx 55 http://www.decc.gov.uk/assets/decc/Consultations/Improving%20Grid%20Access/251-govt-response-grid-access.pdf 56 http://www.decc.gov.uk/assets/decc/what%20we%20do/uk%20energy%20supply/energy%20mix/renewable%20energy/policy/access_review/file46774.pdf http://www.ofgem.gov.uk/Networks/Trans/ElecTransPolicy/tar/Pages/Traccrw.aspx http://www.nationalgrid.com/NR/rdonlyres/8DB67830-33A6-4137-9C68-
09B8CD41132E/35345/NationalGridGuidanceonICMv11.pdf 57 http://www.nationalgrid.com/uk/Electricity/Codes/systemcode/ http://www.nationalgrid.com/NR/rdonlyres/E88C7976-D4A8-40AB-B185-D0C51BDB66B5/42627/CUSCSection13_Connectandmanage_11August2010.pdf 58 http://www.nationalgrid.com/NR/rdonlyres/D9824517-60E6-4148-B784-
849549B994A1/42599/1ApplicabilityV18_Connectandmanage_11August2010ECchecked1.pdf 59 http://www.nationalgrid.com/NR/rdonlyres/149DEAE1-46B0-4B20-BF9C-66BDCB805955/35218/NETSSQSS_GoActive_240609.pdf 60 http://www.nationalgrid.com/uk/Electricity/Codes/gbsqsscode/

Offshore Development Information Statement 2010
22
iii. Operation of an Offshore Transmission System;
iv. Voltage limits in planning and operating an offshore transmission system.
In 2008, the NETS SQSS Review Group commenced a ‘Fundamental Review’61 of the NETS SQSS
criteria in view of the anticipated changes in generation and transmission technologies. This review has
recently consulted on a number of proposals ranging from removing regional inconsistencies to
introducing criteria to determine the appropriate level of capability for a transmission system with a large
capacity of renewable generation. Amendment Reports will be submitted to the Authority in autumn 2010
recommending changes to the NETS SQSS. The Review Group included in its consultation documents
an update to the status of those issues being reviewed for which proposals are not yet developed. Work
is ongoing in these areas and the Review Group has arranged an industry workshop in October 2010 to
discuss the priorities and timetable for the ongoing review.
The ongoing review includes the development of criteria for the Round 3 offshore wind farms. The
existing criteria has been developed based on a cost benefit analysis of projects up to 100 km offshore
and up to 1500 MW in size and are designed to be consistent with the onshore criteria. This was
adequate for Round 1 and Round 2 offshore wind farms but is not sufficient for all of the Round 3 offshore
wind farm projects. This is because the Round 3 offshore wind farms will significantly extend the design
limits considered to date, both in term of their distance from the shore and the generation capacity of the
projects. The NETS SQSS criteria will be reviewed to take into account the cost benefit analysis of the
Round 3 offshore wind farms projects. In summary, the cost benefit analysis considers, for different
network design options, the relative capital costs and cost of losses against the expected costs of energy
curtailed during planned and unplanned component outages. As a result of this assessment, the existing
criteria may be extended or additional criteria may be added to reflect the expected cost of constructing
and operating these systems.
61 http://www.nationalgrid.com/uk/Electricity/Codes/gbsqsscode/Fundamental+SQSS+Review/
Offshore Development Information Statement 2010
23
Chapter Two Offshore Development Information Statement
2.1 Aim and Purpose
The aim of this annual Statement is to facilitate the development, in offshore waters, of an efficient co-
ordinated and economical system of electricity transmission. The Statement seeks to do this by providing
a wide range of information relating to the possible development of both the offshore and onshore
electricity transmission systems and provides a high-level analysis of the various ways in which:
the offshore transmission networks can be developed to interconnect offshore generation with the
onshore transmission network; and
the onshore transmission network can be reinforced to provide the necessary connection and transfer
capability to support the connection of offshore transmission networks.
The aim is to identify the most economic and co-ordinated options from this desktop analysis. It is
envisaged that the Statement will provide a platform for more detailed analysis and evaluation to be
performed regarding the optimisation of offshore transmission development.
2.1.1 Scope, Responsibility and Deliverability Considerations
When reading the Statement, it is important to consider that the illustrative transmission system
connection works shown in this Statement have been identified purely for analysis purposes via a desktop
study and included for illustrative purposes only. These designs are based on a fixed point in time and
may change as the offshore network evolves. They should not be considered as implying actual future
connection routes for new infrastructure and do not intend to reflect the TOs investment decisions
regarding the development of their transmission area. The Statement does not cover sub-transmission
connections other than showing the nearest affected Grid Entry Point.
The detailed evaluation and design of offshore infrastructure, including any environmental impact
assessment, will be the responsibility of the OFTO or developer (dependent on the approach applicable to
the individual project). All diagrams represent the shortest route to shore given an electrically efficient
onshore connection point.
The actual development of the offshore and onshore transmission systems can and may differ from that
illustrated in the Statement. Given the purpose and illustrative nature of this Statement, it should not be
used as the basis for any financial, commercial or engineering decisions.
2.2 Statement Development
It is envisaged that the Statement will evolve from year to year in response to developments in offshore
generation and as ongoing network studies and engineering feasibility assessments progress. These
developments will be reflected in the structure and content of the Statement in the future.
2.2.1 Structure
The 2010 Statement describes the latest developments in offshore generation and the offshore electricity
transmission regime62. The Statement outlines the development and selection process for the future
scenarios, with these scenarios reflecting the differing ways in which offshore generation may develop in
forthcoming years63. The offshore transmission network designs which could potentially cater for these
future scenarios have been developed along with the corresponding onshore transmission reinforcements
needed to provide the necessary local connection capability. The process used to develop the
62 Chapter 1 (Background) and 3 (Current Offshore Generation and Development) 63 Chapter 4 (Future Generation and Demand Background Scenarios)
Offshore Development Information Statement 2010
24
transmission system designs, details of the illustrative designs, including an overview of the technology
utilised (current and future), and a comparison of the different options is also provided in the Statement64.
The implications of offshore generation on the Main Interconnected Transmission System (MITS) have
also been assessed and presented in the Statement along with an evaluation of the consequential
onshore transmission reinforcements which will facilitate the transfer of offshore transmission generation
(as depicted by the future scenarios) onto the MITS65.
2.2.2 Design Strategies
The Statement includes a number of conceptual desktop design strategies which demonstrate how
different technology and topology assumptions can impact the optimisation of offshore transmission
development. The different design strategies presented in the Statement are:
Radial: point-to-point connections from the offshore generation to suitable onshore MITS collector
substations using current generation technology.
Radial Plus: similar to radial in the use of point to point connections for connecting the offshore
generation to the onshore MITS but utilising anticipated future transmission technology capability
within the strategy (e.g. 2 GW capacity converter stations and high capacity offshore cables) in line
with delivery forecasts for the next five years. Radial Plus also differs from the Radial Strategy in that
multiple groups of offshore generation are connected to the radial point-to-point connections as
opposed to a single group being connected radially.
Integrated: an interconnected offshore design using AC cable and HVDC interconnection between
offshore platforms and development areas, using the same advanced technology as with the Radial
Plus Strategy. Multiple offshore platforms will be interconnected, providing fewer cables and reduced
asset volumes.
The 2010 Statement includes a conceptual integrated network design solution. As the transition through
the various offshore wind farm development leasing rounds e.g. Round 1, 2, 3, STW, etc occurs, the
expected growth rate, location and size of offshore wind projects has led NGET to consider different ways
in which offshore connections might be optimised. Given a better understanding of the technologies
available since the publication of the 2009 Statement, NGET has undertaken a conceptual design study
into the development of an integrated offshore transmission network.
The study has been premised on the principle that any design solution should:
maximise the potential deliverability of offshore wind;
co-ordinate onshore and offshore investment requirements to minimise environmental impacts;
maximise security of supply and network resilience, increasing the level of resilience to offshore
connections; and
minimise the overall cost to consumers.
The resulting design is one that is based on the installation of high voltage multi-user assets that
interconnect the offshore platforms to form an offshore network. This conceptual design highlights how
the overall volume of assets installed offshore could be reduced, whilst network security and operational
flexibility is improved. This is based on onshore/offshore optimisation, the latest technology and a degree
of strategic investment offshore.
It should be recognised however that in order to attain the benefits associated to the integrated solution, it
will be necessary to commence development of this solution within a suitable timeframe. Early common
technical and functional specifications will be needed to ensure a smooth transition to an integrated
design.
64 Chapter 5 (Offshore and Local Onshore Connection Designs) and supporting Appendices 3 (Offshore Network Design
Methodology) & 4 (Review of Offshore Transmission Technologies) 65 Chapter 6 (Main Interconnected Transmission System (MITS) Considerations)

Offshore Development Information Statement 2010
25
As with all designs included within this Statement, this approach represents one of many ways in which
efficient offshore connection could be facilitated. The mechanism by which it could be delivered is not
discussed in this Statement.
The inclusion of the different design strategies may facilitate the evaluation of the potential options in
terms of capital costs, planning implications, risks, environmental assessment and the supply chain for
individual offshore generation projects. It will also facilitate an assessment of the potential for any ‘future
proofing’ of the transmission network to enable further evolution and European integration.
All design strategies included herein reflect the aim and intention of the Statement in facilitating the
development of an efficient, co-ordinated and economical system of electricity transmission. This
Statement does not discuss the potential regulatory mechanisms/frameworks for the enduring offshore
regime that could incentivise particular design solutions.
2.2.3 Continuous Development
The Statement will be the subject of an annual review facilitated by NGET with industry participants prior
to its publication. Interested parties are encouraged to provide feedback on all aspects of the 2010
Statement via an Online Survey Form. The feedback received will be incorporated into the formal review
of the 2010 Statement which will commence in December 201066.
Any proposed amendments to the structure/layout and the future scenarios included in this Statement,
which may be incorporated within future editions of the Statement, are the subject of this review process
with a subsequent formal submission to the Authority. In addition, the content of the Statement will remain
within the remit set by the special licence condition C4.
66 Chapter 7 (Way Forward)

Offshore Development Information Statement 2010
26
Chapter Three
Current Offshore Generation and Development
3.1 Offshore Wind Generation: Development to Date
According to RenewableUK’s (previously known as the BWEA) website67, as of 23rd September 2010,
there were:
13 offshore wind farms in operation representing 1,341 MW of generation capacity;
4 offshore wind farm projects under construction representing 1,153 MW of generation capacity;
7 offshore wind farm projects have been granted consent representing 2,620 MW of generation
capacity and;
5 offshore wind farm projects in planning representing 2,260 MW of generation capacity.
In total there are currently 29 offshore wind farms (representing 7,374 MW of generation capacity)
currently in operation or under development.
The Crown Estate have facilitated a series of leasing rounds under which areas of seabed have been
made available for the development of offshore wind farms via a competitive tender process.
3.1.1 Offshore Wind Farm Development: Round 1
The Crown Estate announced the first round (Round 1) of UK offshore wind farm development sites in
2000. This allocated 18 sites each within 12 nautical miles of the UK coastline68. Eleven Round 1 sites
are now complete and generating power. Of the remaining sites, one is under construction69 and another
has consent awaiting construction70. The remaining sites (Shell Flats (I-III), Scarweather Sands and
Cromer) have been withdrawn due to difficulties with consenting, resource and ground conditions
respectively. A further demonstration site at Blyth was developed prior to Round 1 and consists of two 2
MW turbines.
3.1.2 Offshore Wind Farm Development: Round 2
In 2002 the Department of Trade and Industry’s (DTI) consultation paper 'Future Offshore'71 set out the
Government’s policy direction and commitment to take a more strategic approach to offshore wind farm
development. It set out the intention to restrict further development to strategic areas and undertake a
Strategic Environmental Assessment (SEA)72. Three strategic areas were identified; the Greater Wash,
the Thames Estuary and the north west (Liverpool Bay). The DTI commissioned an SEA covering these
three areas. The SEA was completed in May 2003 and following consultation the DTI requested that The
Crown Estate make available seabed areas in these strategic regions for the purposes of further wind
farm development. Based on the conclusion of the SEA, the DTI issued guidance including a
precautionary coastal exclusion zone of between 8-13 km (5-8 miles) from the coast to reduce the visual
impact of development and avoid sensitive, shallow water feeding areas for certain species of sea bird.
The SEA set out development scenarios limiting the total development possible within these three areas
to between 4 and 7.5 GW (including the contribution from Round 1).
In July 2003 a competitive tender process began for the second round of offshore wind farm site
allocations (Round 2). The fifteen successful projects were awarded Crown Estate agreements for lease
67 http://www.bwea.com/statistics/ http://www.bwea.com/statistics/year.asp http://www.bwea.com/ukwed/offshore.asp 68 http://www.thecrownestate.co.uk/our_portfolio/marine/offshore_wind_energy/rounds-one-two.htm 69 http://www.vattenfall.co.uk/en/ormonde.htm 70 http://www.edfenergy.com/about-us/energy-generation/renewable-generation/wind-turbines.shtml 71 http://www.berr.gov.uk/files/file22791.pdf 72 http://www.offshore-sea.org.uk/consultations/Wind_R2/index.php

Offshore Development Information Statement 2010
27
amounting to 7.2 GW of generation capacity and included sites within and beyond territorial waters.
Subsequently, some Round 2 sites faced unavoidable difficulties in developing their projects and were
given the opportunity to relocate.
Of the fifteen sites allocated under Round 2, the first (Gunfleet 2 and Thanet) are either fully or partial
operational. A further three (Greater Gabbard, Sheringham Shoal and Walney 1) are now under
construction with Greater Gabbard scheduled to produce power during 201073.
3.1.3 Offshore Wind Farm Development: Round 1 & Round 2 Extensions
In May 2010, The Crown Estate announced awards for the Round 1 and Round 2 project extensions. It is
presently envisaged that construction of the Round 1 and 2 extensions will commence in 2014, subject to
consents, with completion of all projects by the end of 2016 in advance of Round 3.
In making the awards, The Crown Estate placed emphasis on the timely delivery of the additional offshore
wind capacity. Successful applications have demonstrated that the extensions can be consented,
constructed and operational within agreed timescales. The extensions will benefit from synergies with the
original projects, with in some cases the potential for the sharing of construction crews and vessels, as
well as electrical systems, construction bases, ports and onshore facilities.
3.1.4 Offshore Wind Farm Development: Scottish Territorial Waters (Round 1)
In January 2009, the Scottish Government indicated their intention of carrying out a Strategic Environment
Assessment (SEA) for offshore wind in STW. The SEA report was released for consultation in May
201074.
In February 2009 exclusivity agreements were granted by The Crown Estate to ten companies and
consortia for the development of commercial scale wind farms within STW. The agreements will enable
the companies/consortia exclusive development rights over their chosen sites, allowing the project
developers to commence with further site surveys and investigations prior to submitting consent
applications, while awaiting the outcome of the SEA. If all of these sites were to be constructed in full, they
could provide a potential installed capacity of over 6 GW of offshore wind energy.
3.1.5 Offshore Wind Farm Development: Round 3
The Round 3 development partners were announced by The Crown Estate in 2010. The aim of Round 3
offshore wind energy generation was to deliver a quarter of the UK electricity needs by 2020. Each of the
development partners was assigned to one of the nine development zones. The combined generation
capacity of Round 3 is sufficient to ensure that the 25 GW that has been enabled by the SEA for offshore
renewable energy can be achieved.
3.1.6 Offshore Wind Farm Development: Demonstration Sites
The Crown Estate is also facilitating the ongoing development of wind turbine technology by awarding
offshore wind demonstration sites to four companies75. The demonstration projects will play a key part in
addressing both technical and cost challenges to facilitate construction further from shore and in
increasing water depths.
An agreement for lease has been awarded to two sites in England and Wales: Gunfleet Sands extension
(which will enable testing for up to two next generation offshore wind turbines) and Blyth Offshore Wind
Demonstration site (National Renewable Energy Centre Ltd (NaREC76)) for a 100 MW grid connected site
to test and demonstrate up to 20 next generation offshore wind turbines and associated infrastructure.
Exclusively agreements have been awarded for two sites in Scotland: Methil Offshore Wind Farm (to
demonstrate 2B-Energy’s two offshore wind turbines77) and European Offshore Wind Deployment
73 http://www.bwea.com/ukwed/offshore.asp 74 http://www.scotland.gov.uk/Publications/2010/05/14155353/0 75 http://www.thecrownestate.co.uk/newscontent/92-offshore-wind-demonstration-sites.htm 76 http://www.narec.co.uk/media/news/n/narec_offshore_wind_demonstration_site_awarded_the_crown_estate_lease/ 77 http://2-benergy.com/index.htm

Offshore Development Information Statement 2010
28
Centre78 (to test and demonstrate up to 11 next generation offshore wind turbines and other technology in
Aberdeen Bay).
3.2 Offshore Marine Generation: Development to Date
Full scale marine generation is currently being actively developed in UK offshore waters but as yet there is
limited wave and tidal generational capacity installed (all of which have been small in generation capacity
and not directly installed to the transmission system)79.
The marine energy testing facilities at the European Marine Energy Centre80 (EMEC) in Orkney (marine
testing of full scale wave and tidal devices), the National Renewable Energy Centre81 (NaREC) in the
north east of England (onshore testing of device components) and the Wave Hub82 in Cornwall (testing
and demonstration of commercial full scale wave energy devices) have and will continue to enable
developers to successfully tank test scale model prototype devices prior to deploying the first full scale
devices at sea. Furthermore, additional funding has recently been made available to specific projects to
encourage the development of wave and tidal technology within the UK83.
In March 2010, The Crown Estate announced that they had entered into agreements for lease for projects
with a potential generation capacity of 1,200 MW in the Pentland Firth and Orkney Waters84. The Crown
Estate subsequently announced that they will be inviting expressions of interest for a project in the Inner
Sound (which lies between the Scottish mainland and the Isle of Storma)85. The tidal project has been
assigned a maximum generation capacity of 200 MW. In June 2010, The Crown Estate announced that it
had invited four companies to tender for the tidal energy project at the Inner Sound location. In event of a
successful bidder emerging from the process, The Crown Estate is currently planning to award an
agreement for lease in Q4 2010.
The Scottish Government launched the Saltire Prize86 in 2008 which is intended to stimulate development
of wave and tidal energy. A prize of £10 million will be awarded to the team that can demonstrate in
Scottish waters, a commercially viable wave or tidal stream energy technology that achieves the greatest
volume of electrical output over the set minimum hurdle of 100 GWh over a continuous two year period
using only the power of the sea.
In March 2010, the Scottish Government published the Further Scottish Leasing Round (Saltire Prize
Projects) document87 which identified potential further offshore areas88 being made available for wave and
tidal energy projects. Following a discussion on the proposed areas, the Scottish Government and The
Crown Estate intend to finalise areas for lease, which will be announced in a further Scottish leasing round
for wave and tidal energy projects later in 201089.
78 http://www.aberdeenrenewables.com/ 79 http://www.bwea.com/pdf/publications/RenewableUK_Wave_tidal_report_%202010.pdf 80 http://www.emec.org.uk/ 81 http://www.narec.co.uk/ 82 http://www.southwestrda.org.uk/working_for_the_region/key_sw_projects/cornwall__the_isles_of_scilly/wave_hub.aspx 83 http://www.innovateuk.org/_assets/pdf/press-releases/press%20release%20wave%20and%20tidal%2023july10%20final.pdf http://nds.coi.gov.uk/content/detail.aspx?NewsAreaId=2&ReleaseID=414752&SubjectId=2 84 http://www.thecrownestate.co.uk/our_portfolio/marine/wave-tidal/pentland-firth-orkney-waters.htm http://www.thecrownestate.co.uk/newscontent/92-pentland-firth-developers.htm http://www.thecrownestate.co.uk/pfow_development_sites_map.pdf 85 http://www.thecrownestate.co.uk/pfow_development_sites_map_inner_sound.pdf 86 http://www.scotland.gov.uk/Topics/Business-Industry/Energy/Action/leading/saltire-prize 87 http://www.scotland.gov.uk/Publications/2010/03/23084106/1 88 http://www.thecrownestate.co.uk/further_scottish_leasing_round_map.pdf 89 http://www.thecrownestate.co.uk/our_portfolio/marine/wave-tidal/further-scottish-leasing.htm

Offshore Development Information Statement 2010
29
3.3 Offshore Wind Development Map
FIGURE 3.1 – Offshore Wind Development Map (also available in Appendix 2)
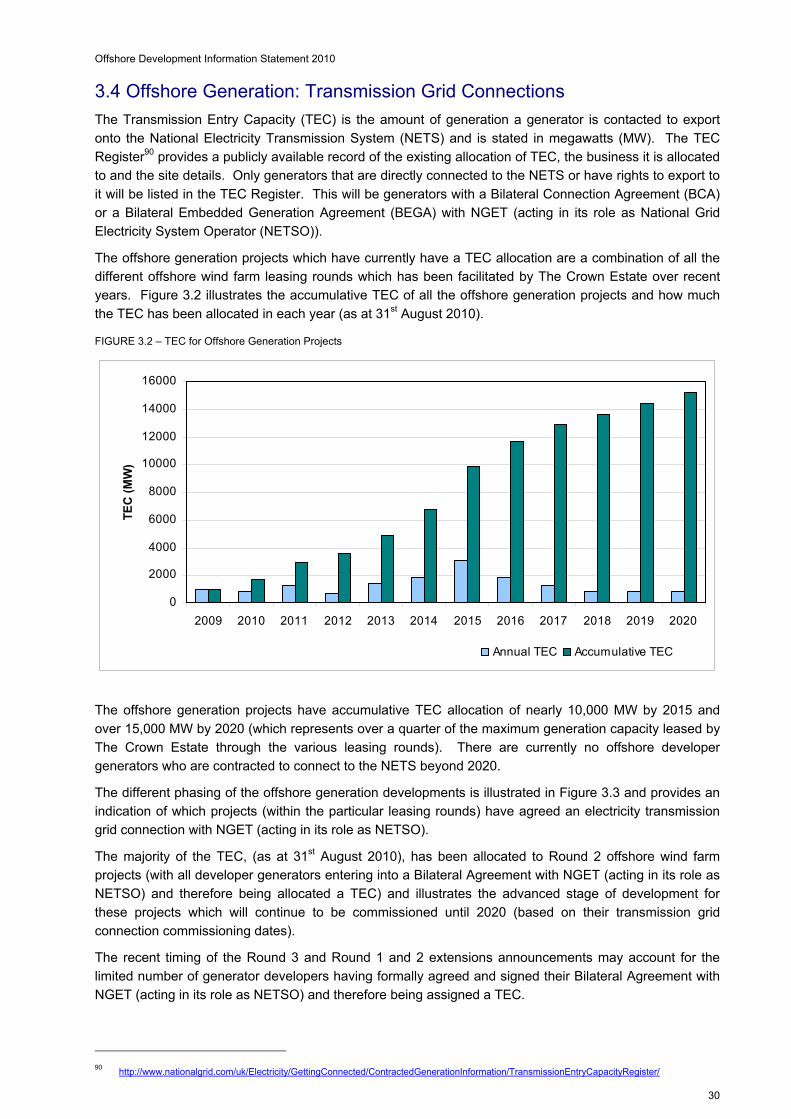
Offshore Development Information Statement 2010
30
0
2000
4000
6000
8000
10000
12000
14000
16000
2009 2010 2011 2012 2013 2014 2015 2016 2017 2018 2019 2020
TE
C (
MW
)
Annual TEC Accumulative TEC
3.4 Offshore Generation: Transmission Grid Connections
The Transmission Entry Capacity (TEC) is the amount of generation a generator is contacted to export
onto the National Electricity Transmission System (NETS) and is stated in megawatts (MW). The TEC
Register90 provides a publicly available record of the existing allocation of TEC, the business it is allocated
to and the site details. Only generators that are directly connected to the NETS or have rights to export to
it will be listed in the TEC Register. This will be generators with a Bilateral Connection Agreement (BCA)
or a Bilateral Embedded Generation Agreement (BEGA) with NGET (acting in its role as National Grid
Electricity System Operator (NETSO)).
The offshore generation projects which have currently have a TEC allocation are a combination of all the
different offshore wind farm leasing rounds which has been facilitated by The Crown Estate over recent
years. Figure 3.2 illustrates the accumulative TEC of all the offshore generation projects and how much
the TEC has been allocated in each year (as at 31st August 2010).
FIGURE 3.2 – TEC for Offshore Generation Projects
The offshore generation projects have accumulative TEC allocation of nearly 10,000 MW by 2015 and
over 15,000 MW by 2020 (which represents over a quarter of the maximum generation capacity leased by
The Crown Estate through the various leasing rounds). There are currently no offshore developer
generators who are contracted to connect to the NETS beyond 2020.
The different phasing of the offshore generation developments is illustrated in Figure 3.3 and provides an
indication of which projects (within the particular leasing rounds) have agreed an electricity transmission
grid connection with NGET (acting in its role as NETSO).
The majority of the TEC, (as at 31st August 2010), has been allocated to Round 2 offshore wind farm
projects (with all developer generators entering into a Bilateral Agreement with NGET (acting in its role as
NETSO) and therefore being allocated a TEC) and illustrates the advanced stage of development for
these projects which will continue to be commissioned until 2020 (based on their transmission grid
connection commissioning dates).
The recent timing of the Round 3 and Round 1 and 2 extensions announcements may account for the
limited number of generator developers having formally agreed and signed their Bilateral Agreement with
NGET (acting in its role as NETSO) and therefore being assigned a TEC.
90 http://www.nationalgrid.com/uk/Electricity/GettingConnected/ContractedGenerationInformation/TransmissionEntryCapacityRegister/

Offshore Development Information Statement 2010
31
FIGURE 3.3 –TEC for Offshore Generation Project by Allocation Round
To date, there are no formal transmission grid connections in place for any of the marine generation
projects in Pentland Firth and Orkney Waters area (as announced by The Crown Estate); again this may
be due to the timing of the official announcement regarding these developments.
Figures 3.2 and 3.3 do not included any offshore projects which are not directly connected to the NETS or
do not have rights to export to it. Given their connection arrangements, the following Round 1 sites do not
have a TEC and are therefore categorised as embedded generation within the NETS: Blyth91, Burbo
Bank92, Kentish Flats93, Lynn and Inner Dowsing94, North Hoyle95, Rhyl Flats96, Scroby Sands97 and
Teesside. These nine projects represent nearly 680 MW of generation capacity.
The following sections summarise the offshore generation projects (which currently have a Bilateral
Agreement with NGET (acting in its role as NETSO)) that have been allocated a TEC (as of 31st August
2010). Therefore not all announced offshore generation sites will be included in the following sections.
The sections will not cover sub-transmission connections other than showing the nearest affected Grid
Entry Point.
91 http://www.eon-uk.com/generation/blyth.aspx 92 http://www.dongenergy.com/Burbo/Pages/index.aspx 93 http://www.kentishflats.co.uk/ 94 http://www.centricaenergy.com/index.asp?pageid=282&area=lynn 95 http://www.rwe.com/web/cms/en/311612/rwe-npower-renewables/sites/projects-in-operation/wind/north-hoyle-offshore-wind-
farm/summary/ 96 http://www.rwe.com/web/cms/en/310584/rwe-npower-renewables/sites/projects-in-operation/wind/rhyl-flats/summary/ 97 http://www.eon-uk.com/generation/scrobysands.aspx
0
500
1000
1500
2000
2500
3000
3500
2009 2010 2011 2012 2013 2014 2015 2016 2017 2018 2019 2020
TE
C (
MW
)
Round 1 Round 2 Round 1 & 2 Extensions Round 3 STW

Offshore Development Information Statement 2010
32
Westermost Rough 175MW
Humber Gateway 220MW
Triton Knoll 1200MW
Sheringham Shoal 315MW
Race Bank 500MW
Lincs 250MW
Docking Shoal 500MW
Dudgeon 1320MW
Lynn & Inner Dowsing
194.4 MW
Round 2 Projects
Round 1 Projects
400kV Circuit275kV Circuit
Westermost Rough 175MW
Humber Gateway 220MW
Triton Knoll 1200MW
Sheringham Shoal 315MW
Race Bank 500MW
Lincs 250MW
Docking Shoal 500MW
Dudgeon 1320MW
Lynn & Inner Dowsing
194.4 MW
Round 2 Projects
Round 1 Projects
400kV Circuit275kV Circuit
Round 2 Projects
Round 1 Projects
400kV Circuit275kV Circuit
3.5 East Coast
The east coast region will encompass several Round 1, Round 2 and Round 3 offshore wind farm sites
with embedded and NETS connection. The TEC associated with each site in this region is shown in the
figure below with additional information regarding the project status provided in the following sections
(3.5.1 and 3.5.2).
FIGURE 3.4 – East Coast
3.5.1 Round 2 Sites
Docking Shoal – Centrica (DSW) Ltd98
Docking Shoal in the Greater Wash region is located approximately 14 km (9 miles) off Wells-next-the-
Sea on the north Norfolk coast and approximately 19.5 km (12 miles) off Skegness on the Lincolnshire
coast. It was granted the agreement for lease of the seabed by The Crown Estate in 2004. It is currently
in the process of obtaining consent and is contracted to be commissioned in October 2011. The project is
allocated 500 MW of capacity at the Docking Shoal Offshore Connection Point from which it is expected to
connect to its Onshore Transmission Interface at Walpole.
Dudgeon – Dudgeon Offshore Wind Limited99
Dudgeon in the Greater Wash region is located on relatively flat, uniform seabed between the Cromer
Knoll and Inner Cromer Knoll sandbanks, over 32 km (19.9 miles) north of the town of Cromer in north
Norfolk. It is currently in the process of obtaining consent. The implementation will be split into two
phases is contracted to be commissioned October 2015 and October 2016. The project is allocated 1320
MW of capacity to an Onshore Transmission Interface at Little Dunham.
98 http://www.centricaenergy.com/index.asp?pageid=21&area=docking 99 http://www.warwickenergy.com/dudgeon.htm

Offshore Development Information Statement 2010
33
Humber Gateway - E.ON Climate & Renewables UK Humber Wind Limited100
Humber Gateway is located in the Greater Wash region, 8 km (5 miles) off the Holderness coast, East
Riding of Yorkshire. It was granted the agreement for lease of seabed from The Crown Estate in 2003. A
scoping report was produced in 2004 and more detailed surveys and consultation were carried out in
2005/06. Planning applications were submitted in 2009 and are yet to be approved. The project is
presently contracted to be commissioned in April 2013. The project is allocated 220 MW of capacity at the
Humber Gateway Offshore Connection Point to its Onshore Transmission Interface near Hedon.
Lincs – Centrica (Lincs) Limited101
Lincs is located in the Greater Wash region approximately 8 km (5 miles) from Skegness and immediately
to the east of the Lynn and Inner Dowsing offshore wind farms. It was granted the agreement for lease of
the seabed from The Crown Estate in 2003. An application for consent was submitted in 2007 and was
approved in 2008. It is currently under construction and is contracted to be commissioned in July 2011.
The project has been allocated 250 MW of capacity at the Lincs Offshore Connection Point from which it
is expected to connect to its Onshore Transmission Interface at Walpole.
Race Bank – Centrica (RBW) Ltd102
Race Bank is located in the Greater Wash region approximately 27 km (16.8 miles) from Blakeney Point
on the north Norfolk coast (outside the UK’s territorial waters). It was granted the lease of the seabed
from The Crown Estate in 2004. It is currently in the process of obtaining consent and is contracted to be
commissioned in June 2013. The project is allocated 500 MW of capacity at the Race Bank Offshore
Connection Point from which it is expected to connect to its Onshore Transmission Interface at Walpole.
Sheringham Shoal - Scira Offshore Energy Ltd103
Sheringham Shoal is located in the Greater Wash region between 17 km (10.5 miles) and 23 km (14.3
miles) off the coast of north Norfolk. The project is now in its construction phase and will be operational
by the end of 2011. The project is allocated 315 MW of capacity at the Sheringham Shoal Offshore
Connection Point from which it is expected to connect to its Onshore Transmission Interface at Norwich
Main.
Triton Knoll – Triton Knoll Offshore Windfarm Limited104
Triton Knoll in the Greater Wash region is located 33 km (20.5 miles) off the coast of Lincolnshire. The
project is currently in the scoping and design stage. Implementation will be split into three phases and is
contracted to be commissioned between 2018 and 2020. The project is allocated 1200 MW of capacity at
the Triton Knoll Offshore Connection Point from which it is expected to connect to its Onshore
Transmission Interface in east Lincolnshire.
Westermost Rough - Westermost Rough Limited105
Westermost Rough is located in the Greater Wash region, 8 km (5 miles) from the Yorkshire coast. It was
granted the agreement for lease of the seabed from The Crown Estate in 2007. It is currently in the
process of obtaining consent and is contracted to be commissioned in April 2014. The project is allocated
175 MW of capacity at the Westermost Rough Offshore Connection Point from which it is expected to
connect to its Onshore Transmission Interface near Hedon.
100 http://www.eon-uk.com/generation/humbergateway.aspx 101 http://www.centricaenergy.com/index.asp?pageid=21&area=lincs 102 http://www.centricaenergy.com/index.asp?pageid=21&area=racebank 103 http://www.scira.co.uk/ 104 http://www.rwe.com/web/cms/en/306902/rwe-npower-renewables/sites/projects-in-development/wind/triton-knoll-offshore-wind-
farm/the-proposal/ 105 http://www.dongenergy.com/WestermostRough/Pages/index.aspx
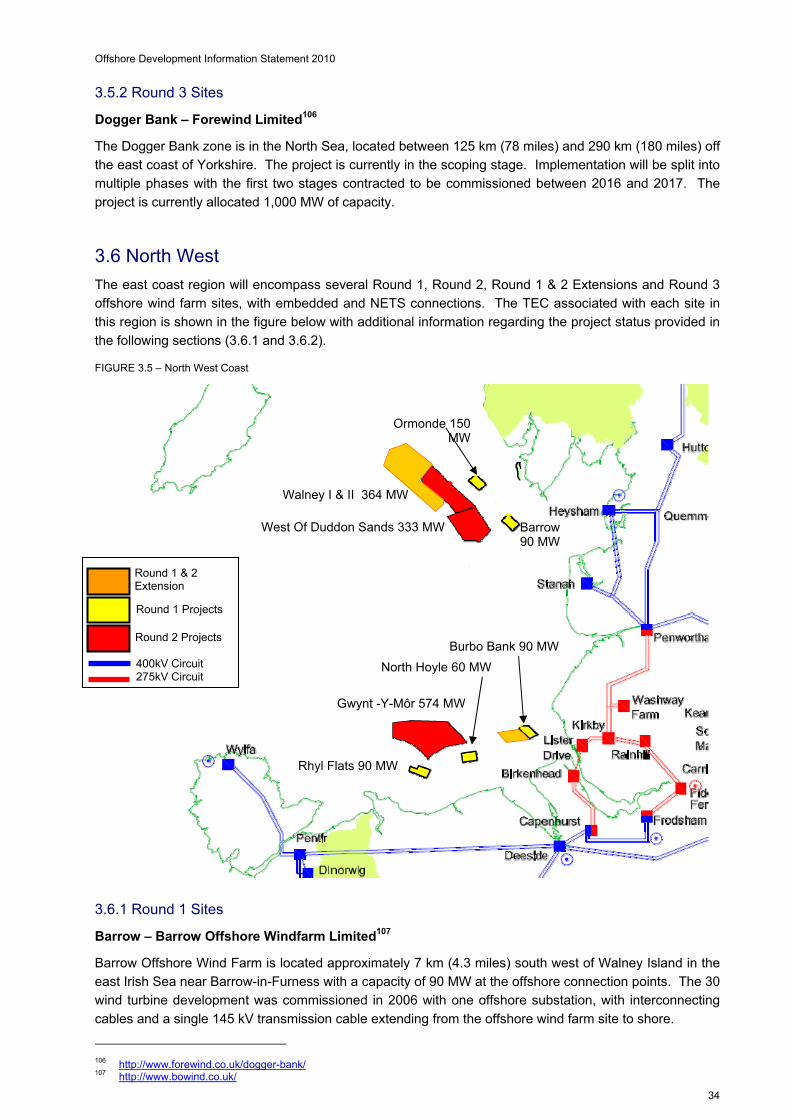
Offshore Development Information Statement 2010
34
Ormonde 150 MW
Barrow 90 MW
Walney I & II 364 MW
West Of Duddon Sands 333 MW
Gwynt -Y-Môr 574 MW
Burbo Bank 90 MW
North Hoyle 60 MW
Rhyl Flats 90 MW
Round 2 Projects
Round 1 Projects
400kV Circuit 275kV Circuit
Round 1 & 2 Extension
3.5.2 Round 3 Sites
Dogger Bank – Forewind Limited106
The Dogger Bank zone is in the North Sea, located between 125 km (78 miles) and 290 km (180 miles) off
the east coast of Yorkshire. The project is currently in the scoping stage. Implementation will be split into
multiple phases with the first two stages contracted to be commissioned between 2016 and 2017. The
project is currently allocated 1,000 MW of capacity.
3.6 North West
The east coast region will encompass several Round 1, Round 2, Round 1 & 2 Extensions and Round 3
offshore wind farm sites, with embedded and NETS connections. The TEC associated with each site in
this region is shown in the figure below with additional information regarding the project status provided in
the following sections (3.6.1 and 3.6.2).
FIGURE 3.5 – North West Coast
3.6.1 Round 1 Sites
Barrow – Barrow Offshore Windfarm Limited107
Barrow Offshore Wind Farm is located approximately 7 km (4.3 miles) south west of Walney Island in the
east Irish Sea near Barrow-in-Furness with a capacity of 90 MW at the offshore connection points. The 30
wind turbine development was commissioned in 2006 with one offshore substation, with interconnecting
cables and a single 145 kV transmission cable extending from the offshore wind farm site to shore.
106 http://www.forewind.co.uk/dogger-bank/ 107 http://www.bowind.co.uk/

Offshore Development Information Statement 2010
35
Ormonde – Ormonde Energy Limited108
The Ormonde offshore wind farm is currently being built in the Irish Sea, 10 km (6.2 miles) off Barrow-In-
Furness. The project is now in the construction phase with onshore works having commenced in autumn
2009. The development work is due for completion during 2011 and first power is expected later that year.
The project is allocated 150 MW of capacity at the Ormonde Offshore Connection Point from which it is
expected to connect to its Onshore Transmission Interface at Heysham.
Robin Rigg (East and West) – E.ON UK Renewable Limited109
The Robin Rigg Offshore Wind Farms (East and West) are located in the Solway Firth with a combined
capacity at the offshore connection points of 180 MW. The site was commissioned in 2009 and is located
near the ports of Workington and Maryport, with the Offshore Connection Points approximately 12 km (7.5
miles) from the shoreline.
3.6.2 Round 2 Sites
Gwynt Y Môr – Gwynt Y Môr Offshore Windfarm Limited110
The Gwynt y Môr site is located 13 km (8 miles) off the north Wales coast at the nearest point to shore, 16
km (10 miles) from Llandudno and 18 km (11 miles) from the Wirral. DECC granted consent for the
offshore works in December 2008. In 2009, permissions for onshore substation works and the (approx)
11 km cable route were granted by Denbighshire County Council and Conwy County Borough Council.
Offshore foundations installation works are planned to commence by the end of 2011. The wind turbine
installation will commence in Q2 2013 and the wind farm is expected to be operational in 2014. The
project is allocated 574 MW at the Gwynt Y Môr Offshore Connection Point from which it is expected to
connect to its Onshore Transmission Interface at St Asaph.
Walney I & II – Walney (UK) Offshore Windfarms Limited 111
Walney in the north west region is located 20 km (12.4 miles) offshore from Barrow-In-Furness, consists
of two phases. Phase I has an allocated capacity of 182 MW at the Walney 1 Offshore Connection Point
with its Onshore Transmission Interface at Heysham. Walney I is due to commission in 2011. Phase II
with 182 MW of capacity has an Offshore Connection Point at Walney 2 and its Onshore Transmission
Interface at Stanah and is due to commission in 2012.
West of Duddon Sands – ScottishPower Renewables (UK) Limited112
West of Duddon Sands is located 14 km (8.7 miles) southwest of the Barrow-In-Furness coastline. The
project currently has its consents approved and is contracted to be commissioned in October 2013. The
project is allocated 333 MW of capacity at the West Duddon Sands Offshore Connection Point from which
it is expected to connect to its Onshore Transmission Interface at Heysham.
108 http://www.vattenfall.co.uk/en/ormonde.htm 109 http://www.eon-uk.com/generation/robinrigg.aspx 110 http://www.rwe.com/web/cms/en/306614/rwe-npower-renewables/sites/projects-in-development/wind/gwynt-y-mr-offshore-wind-
farm/summary/ 111 http://www.dongenergy.com/Walney/Pages/index.aspx 112 http://www.scottishpowerrenewables.com/pages/west_of_duddon_sands.asp
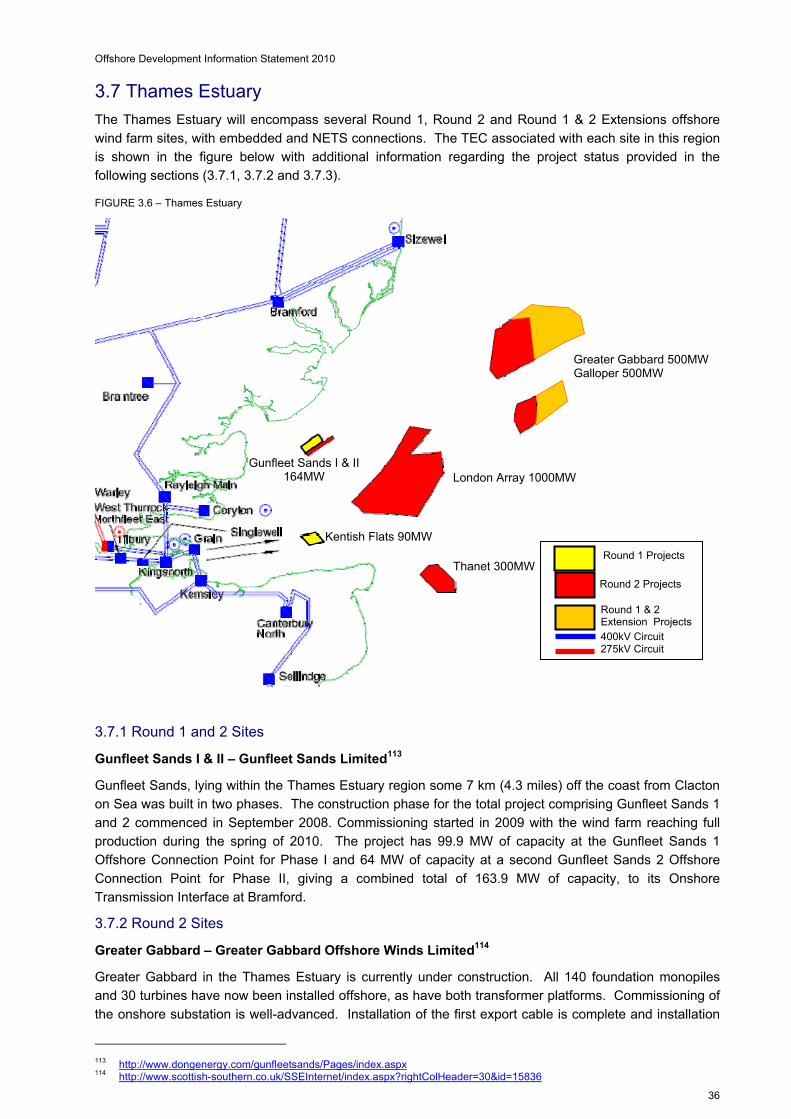
Offshore Development Information Statement 2010
36
3.7 Thames Estuary
The Thames Estuary will encompass several Round 1, Round 2 and Round 1 & 2 Extensions offshore
wind farm sites, with embedded and NETS connections. The TEC associated with each site in this region
is shown in the figure below with additional information regarding the project status provided in the
following sections (3.7.1, 3.7.2 and 3.7.3).
FIGURE 3.6 – Thames Estuary
3.7.1 Round 1 and 2 Sites
Gunfleet Sands I & II – Gunfleet Sands Limited113
Gunfleet Sands, lying within the Thames Estuary region some 7 km (4.3 miles) off the coast from Clacton
on Sea was built in two phases. The construction phase for the total project comprising Gunfleet Sands 1
and 2 commenced in September 2008. Commissioning started in 2009 with the wind farm reaching full
production during the spring of 2010. The project has 99.9 MW of capacity at the Gunfleet Sands 1
Offshore Connection Point for Phase I and 64 MW of capacity at a second Gunfleet Sands 2 Offshore
Connection Point for Phase II, giving a combined total of 163.9 MW of capacity, to its Onshore
Transmission Interface at Bramford.
3.7.2 Round 2 Sites
Greater Gabbard – Greater Gabbard Offshore Winds Limited114
Greater Gabbard in the Thames Estuary is currently under construction. All 140 foundation monopiles
and 30 turbines have now been installed offshore, as have both transformer platforms. Commissioning of
the onshore substation is well-advanced. Installation of the first export cable is complete and installation
113 http://www.dongenergy.com/gunfleetsands/Pages/index.aspx 114 http://www.scottish-southern.co.uk/SSEInternet/index.aspx?rightColHeader=30&id=15836
London Array 1000MW
Thanet 300MW
Gunfleet Sands I & II 164MW
Greater Gabbard 500MW Galloper 500MW
Kentish Flats 90MW
400kV Circuit
Round 2 Projects
Round 1 Projects
275kV Circuit
Round 1 & 2 Extension Projects

Offshore Development Information Statement 2010
37
400kV Circuit
275kV Circuit
Round 3 Projects
of the inter-array cables is well under way. The first turbines are expected to be commissioned in late
summer and early autumn of 2010 and the first export of electricity expected in Q4 of 2010. The entire
wind farm remains scheduled to be completed in 2012. The project has a capacity allocation of 500 MW
at the Greater Gabbard Offshore Connection Point, from which it is expected to connect to its Onshore
Transmission Interface at Leiston near Sizewell.
London Array – London Array Limited115
London Array in the Thames Estuary consists of two phases. Phase I is contracted for commission in
2012 with a capacity of 486 MW. The additional capacity of 514 MW, for Phase II, is contracted for
commission in April 2014, bringing the scheme’s total allocated capacity to 1,000 MW. Connection from
the London Array Offshore Point is expected to its Onshore Transmission Interface at Cleve Hill.
Thanet – Thanet Offshore Wind Ltd116
The Thanet project is located approximately 12 km (7.5 miles) off Foreness Point, the most eastern part of
Kent. The development work is due for completion during 2010. The project has 300 MW of capacity at
the Thanet Offshore Connection Point from which it is expected to connect to its Onshore Transmission
Interface at Canterbury North.
3.7.3 Round 1 & 2 Extension Sites
Galloper Wind Farm – Airtricity Developments (UK) Ltd117
The Galloper Wind Farm in the Thames Estuary is an extension to the existing Greater Gabbard project.
A planning application is expected to be submitted during 2010 with a decision expected in 2012. The
project is contracted to be commissioned in October 2015. The project has been allocated 500 MW of
capacity at its Offshore Connection Point from which it is expected to connect to its Onshore Transmission
Interface at Leiston near Sizewell.
3.8 Bristol Channel
The Bristol Channel has one Round 3 site. The TEC associated with this site is shown in the figure below
with additional information regarding the project status provided in the following section.
FIGURE 3.7 – Bristol Channel
115 http://www.londonarray.com/ 116 http://www.vattenfall.co.uk/en/thanet-offshore-wind-farm.htm 117
http://www.sse.com/SSEInternet/index.aspx?rightColHeader=30&id=22148&TierSlicer1_TSMenuTargetID=324&TierSlicer1_TSMenuTargetType=4&TierSlicer1_TSMenuID=6
Atlantic Array 1515 MW

Offshore Development Information Statement 2010
38
3.8.1 Round 3 Sites
Atlantic Array - Channel Energy Limited118
Atlantic Array offshore wind farm will be located within the Bristol Channel Zone, between south Wales
and north Devon. The project is currently in the scoping stage. Implementation will be split into multiple
phases and is contracted to be commissioned between 2014 and 2017. The project is currently allocated
1515 MW of capacity.
3.9 Scotland
Scotland will encompass several Scottish Territorial Waters project sites, Round 3 offshore wind farm
sites plus several marine generation sites. The TEC associated with each site in this region is shown in
the figure below with additional information regarding the project status provided in the following sections
(3.9.1 and 3.9.2).
FIGURE 3.8 – Scotland
3.9.1 Scottish Territorial Waters
Beatrice – SSE Generation Limited119
The Beatrice offshore wind farm will be located approximately 13.5 km (8.4 miles) off the Caithness coast,
in the Outer Moray Firth, to the north of the two existing Beatrice demonstrator turbines. The project is
currently under development with the scoping report submitted in March 2010. Implementation will be
split into multiple phases and is contracted to be commissioned between 2014 and 2016. The project is
currently allocated 1,000 MW of capacity at its Beatrice Offshore Connection Point from which it is
expected to connect to its Onshore Transmission Interface at Blackhillock.
118 http://www.rwe.com/web/cms/en/354740/rwe-npower-renewables/sites/projects-in-development/wind/atlantic-array-offshore-
wind-farm/the-proposal/ 119 http://www.scottish-southern.co.uk/SSEInternet/index.aspx?rightColHeader=30&id=17204
Round 3 Projects
400kV Circuit 275kV Circuit
Scottish Territorial Waters Projects
Beatrice 1000 MW
Moray Firth 1500 MW
Neart na Gaoithe 450 MW
Firth of Forth 1075 MW

Offshore Development Information Statement 2010
39
Neart na Gaoithe - Neart Na Gaoithe Offshore Wind Farm Limited120
The proposed Neart na Gaoithe offshore wind farm will be located some 15 km (9.3 miles) off the Fife
coast and covers an area of approximately 100 km2. The project is currently under development. The
project is contracted to be commissioned in December 2014. The project has been allocated 450 MW of
capacity at its Offshore Connection Point and is expected to connect to its Onshore Transmission
Interface at Crystal Rigg II.
3.9.2 Round 3 Sites
Firth of Forth – Seagreen Wind Energy Ltd121
Firth of Forth offshore wind farm will be located approximated 25 km (15.5 miles) from Fife, off the east
cost of Scotland. Phase 1 of the project is currently in the scoping stage and is contracted to be
commissioned in June 2015. The current project capacity allocation is 1,075 MW.
Moray Firth - Moray Offshore Renewables Limited122
Moray Firth offshore wind farm will be located on the Smith Bank in the Moray Firth approximately 22 km
(13.8 miles) off the north east coast of Scotland. The project is currently in the scoping stage.
Implementation will be split into multiple phases and is contracted to be commissioned between 2016 and
2020. The project is currently allocated 1500 MW of capacity.
120 http://www.neartnagaoithe.com/ http://www.mainstreamrp.com/pages/Scotland.html 121 http://www.seagreenwindenergy.com/ 122 http://www.morayoffshorerenewables.com/

Offshore Development Information Statement 2010
40
Chapter Four Future Generation and Demand Background Scenarios
4.1 Overview
To assess the need for future transmission system development, it is necessary to make assumptions
regarding the future generation and demand background that the electricity transmission system will need
to accommodate. This chapter describes the four future generation and demand background scenarios:
Slow Progression, Gone Green, Accelerated Growth and Sustainable Growth which have been
developed and selected to assess the range of potential investment options.
The future scenarios cover the period from 2010 to 2025 and consider the anticipated range of potential
offshore developments from nearly 17 GW of offshore generation capacity in 2025 in the Slow
Progression scenario to over 47 GW of offshore generation capacity in 2025 in Sustainable Growth.
Each scenario illustrates the potential future development of the electricity network and will be evaluated
with a view to facilitating the development, in offshore waters, of an efficient, co-ordinated and economical
system of electricity transmission. The future scenarios also enable an assessment of the specific
challenges which arise from that particular generation and demand background e.g. meeting the
renewable energy targets, supply chain issues, etc.
All the future scenarios have been developed by utilising information received from the Transporting
Britain’s Energy (TBE)123 and the Offshore Development Information Statement Future Scenario
consultations, customer enquires, journals, press releases and other sources e.g. external consultants.
The future scenarios incorporate and reflect a number of factors including an assessment of the current
supply chain, capital costs, a forecast of carbon prices and current subsidies available to certain types of
power generation (which given the relative economics of power generation are an important contributor to
the development of generation in offshore waters).
The future scenarios utilised in the Statement do not represent the contracted position of users of the
NETS (as presented in Seven Year Statement124) nor the investment planning programme(s) of the
Transmission Owner(s). Given the uncertainties in predicting how the electricity network will be
developed in the future, the future scenarios represents a range of credible generation and demand
backgrounds against which the potential future development of the electricity network may be assessed
and evaluated.
4.1.1 Sensitivity Analysis
In addition to the four main scenarios, sensitivities on Interconnectors and Additional Regional
Capacity (ARC) have been analysed and the results included in the Statement.
The interconnectivity sensitivity considers the potential increase in interconnector capacity over the study
period and how this may impact the development of the National Electricity Transmission System (NETS)
in offshore waters.
The ARC sensitivity is based on the offshore development announcements by The Crown Estate, DECC
and the Scottish Government regarding seabed allocations for wind and marine generation. This equates
to approximately 55 GW of offshore generation capacity (excluding projects which have been officially
cancelled by developers).
The ARC enables an examination of the potential local investment that may be required in the different
geographic regions, if all the offshore generation capacity in that area connects to the electricity network.
Identifying the different levels of potential capacity that could be developed in each of the regions enables
123 http://www.nationalgrid.com/uk/Gas/OperationalInfo/TBE/ 124 http://www.nationalgrid.com/uk/Electricity/SYS/

Offshore Development Information Statement 2010
41
NGET to assess a number of different investment options that may not be covered directly by the four
future scenarios. This should also assist developers in identifying the maximum capabilities and
requirements in different geographic regions.
4.1.2 Future Scenarios Scope
The future scenarios and sensitivities represent a range of credible generation and demand backgrounds
which have been submitted to the Authority, following consultation with the industry. The future scenarios
and sensitivities make no assumptions regarding any future announcement by The Crown Estate and/or
DECC/Scottish Government regarding future leasing allocation rounds for wind and marine generation.
Subsequent editions of the Statement will review any (additional) future leasing allocations.
It is noted, however, that the Scottish Government has issued a consultation identifying a further 25
potential zones which may result in further leasing rounds being announced and facilitated by The Crown
Estate in due course125.
In addition no assumptions have been made regarding the longer term (i.e. 2050) development of the
generation in offshore waters in terms of potential additional capacity and the associated generation
technology advancement which would have to be made to facilitate the associated level of offshore
generation capacity126.
4.1.3 Future Scenarios Deliverability
The (yearly) dates (and the associated build-up rates) depicted in the future scenarios study period are for
analytical purposes only and are intended to illustrate how the electricity transmission system would need
to be developed to enable that level of generation to connect to the electricity network.
The actual delivery of the build-up rates as illustrated by some of the future scenarios may be difficult
given the time available and the challenges it could pose to all aspects of the connection process e.g.
financing of the projects, ability of the supply chain to fulfil the orders, obtaining the necessary planning
consent and the necessary grid development.
The actual transmission connection dates of the offshore generation projects are subject to the current
governance framework, planning process, supply chain, technology and financial considerations all of
which will be reflected in the connection date provided to and agreed by the developer.
Furthermore the actual development of the offshore and onshore transmission systems can and may differ
from that illustrated by the future generation and demand scenarios (and sensitivities) included within the
Statement.
4.2 Industry Consultation and Selection Process
The future scenarios and sensitivities which are being utilised to assess the need for future transmission
system development were developed and selected based on comments received from industry
participants following an extensive consultation period. The consultation paper127 was issued on 22nd
March 2010 (for a period of 8 weeks) and outlined a number of potential future scenarios for inclusion in
the Statement. The consultation document invited views on:
the preferred number of future scenarios to be included in the Statement;
which future scenarios should be included in the Statement;
alternative/additional future scenarios which should form part of the Statement;
which sensitivities (if any) should be included in the Statement; and
125 http://www.scotland.gov.uk/Publications/2010/05/14155137/0 126 http://www.offshorevaluation.org/downloads/offshore_vaulation_full.pdf http://www.scottishrenewables.com/admin/Application/DocumentEditor/MultimediaGallery/d5decf25-0664-45ce-bf95-
9a2f9614b85b-1.pdf http://www.bwea.com/pdf/offshore/offshore-wind_building-an-industry.pdf 127 http://www.nationalgrid.com/NR/rdonlyres/B46EC9EF-2DD1-41DD-A650-93CAD1F246DA/43231/Future_Scenario_Consultation.pdf

Offshore Development Information Statement 2010
42
if sufficient information had been provided and what (if any) additional information should be included.
The consultation period closed on 14th May 2010 by which date 11 responses had been received from
industry participants (1 from Onshore Transmission Owner, 1 from energy trade body and 9 from
developers/generators).
Based on the responses received, NGET submitted its future scenario selection to the Authority (1st June
2010). The Authority confirmed (28th June 2010) that they did not intend to direct any changes to the
future scenarios submitted by NGET.
4.2.1 Future Scenario Consultation Responses
The responses received from the consultation process can be summarised as follows.
Number of Future Scenarios
There was agreement that between three to five scenarios would be an appropriate number for inclusion
in the Statement. It was noted that the inclusion of an odd number of scenarios could potentially result in
users of the Statement focusing on the ‘central scenario’ which may undermine the purpose of a scenario-
based approach.
Future Scenarios Selection
There was agreement that there should be a set of credible scenarios which provided a range of different
outcomes. There was support for the inclusion of low, medium and high case scenarios as this, in the
view of the respondents, would best illustrate the potential development of the electricity network in
offshore waters.
The inclusion of a low case scenario which does not meet the UK’s European Union 2020 renewable
targets still provided a divergence of views from industry participants. The majority of respondents
acknowledged the benefit of including a low case scenario within the Statement as it could be utilised as a
base case against which the other scenarios could be compared and assessed against. However,
concern still remains that the inclusion of such a scenario would send out the wrong message to the
industry as it assumes that the true potential of electricity generation in offshore waters is not achievable.
There were also mixed views as to what constituted a credible high case scenario within the study period.
Respondents queried whether the Offshore Announcements scenario (46 GW of offshore generation
capacity by 2020) was a credible scenario due to concerns on deployment costs and financial constraints.
Alternatively it was viewed that the Offshore Announcements scenarios should be included as it was a key
indicator of the amount of offshore wind generation there could be by 2020.
Some respondents indicated that the Gone Green scenario (19 GW of offshore generation capacity by
2020) should constitute the high case within the Statement whilst other respondents queried the benefit of
including a scenario which was based on a NGET assessment of the amount of offshore wind which
would be necessary for the UK to meet its 2020 renewable energy targets.
There was agreement that the data which formed part of the proposed Grid Connection scenario (i.e. the
contracted position for the future use of NETS) would be best used as background information (rather
than an actual scenario) and could be utilised as a measure of how things were progressing.
In addition, there was an acknowledgement of the benefit of having/agreeing a standard set of scenarios
across the industry which could be utilised when assessing the various issues associated with the
electricity grid e.g. infrastructure planning, security standards etc.
Based on comments received, the Grid Connections Scenario (as published in the Future Scenario
consultation document) was not selected for inclusion in the 2010 Statement, as the data which forms the
basis would not reflect the potential growth in offshore generation over the study period. The basis of this
scenario will be included in the Statement (please refer to Chapter 3) as it will inform an assessment of
what developers have actually proposed in terms of electricity network development.
Offshore Development Information Statement 2010
43
In addition, the Offshore Announcement Scenario (as published in the Future Scenario consultation
document) was also not selected for inclusion in the 2010 Statement, as this scenario will form the basis
of the Additional Regional Capability (ARC) sensitivity (please refer to section 4.5).
The SEA Plus (SEA +) future scenario which formed part of the 2009 Statement has not been selected for
inclusion in the 2010 Statement as key principles of this scenario are incorporated within the Accelerated
Growth scenario.
Alternative/Additional Future Scenarios
There were a total of six additional/alternative future scenarios put forward by respondents:
Amendments to the Offshore Announcement Scenario
- A proposed increase in the amount of generation located in the north of Scotland (by 2020).
- A proposed extension to the scenario timeline (through to 2030/2035) to allow for the realistic delivery of
the Round 3 projects.
Merger of Slow Progression & Grid Connection Future Scenarios
Replace Slow Progression with (Ofgem’s) Project Discovery’s Slow Growth Scenario
Inclusion of an additional future scenario which mimics (Ofgem’s) Project Discovery’s Green Transition
Scenario.
Inclusion of a new central scenario
- 14 GW of offshore generation by 2020, increasing to 24 GW by 2025 (broadly in line with the Renewable
Energy Strategy).
Inclusion of an alternative/additional future scenario
- 24 GW of offshore generation by 2020, increasing to 47 GW by 2025.
Sensitivities
Given the potential for significant offshore generation capacity, the benefit of incorporating sensitivities on
a number of factors within the Statement was highlighted by respondents. The suggestions provided by
respondents focused on the delivery of projects e.g. supply chain, availability of resources, attrition rate
and electricity distribution (i.e. the potential of generation being exported to other countries through
interconnectors). It was also recognised that there was continued benefit in analysing the network
development required, in different geographical regions, if all anticipated capacity in that area connected
to the electricity network.
Additional Information
The majority of respondents felt that sufficient information had been provided in the consultation document
however it was proposed that additional detail on the assumptions made regarding the generation and
demand background which supported each scenario e.g. supply chain, demand side management, build-
up rates would be beneficial.
In addition information regarding the location of the onshore generation which supported each scenario
was also requested. Given the focus of the Statement (i.e. potential development of the NETS in offshore
waters), the probability of the electricity network being developed as depicted by the future scenarios and
the commercial sensitivities/assumptions regarding the data utilised in the scenarios, providing this
additional level of data may misinform users regarding the exact generation background which will be in
operation at a future date. Therefore this information is not included in the Statement.

Offshore Development Information Statement 2010
44
4.2.2 Future Scenario Selection: Representation of Industry Views
Future Scenario Selection: Representation of Industry Views
Number of Future Scenarios
- between 3 and 5.
Preferred Future Scenario Selection
- the inclusion of a Low (Slow Progression), Medium (Gone Green) and High Case (Accelerated
Growth & Sustainable Growth);
- no centralised scenario;
- the inclusion of a scenario (Sustainable Growth) which is based on the submission by
RenewableUK (which had support from a number of respondents to the Future Scenario
consultation).
Inclusion of Sensitivities Analysis
- Interconnectors and Regional Development (Additional Regional Capacity).
Utilisation of a Standard Set of Scenarios
- The Slow Progress, Gone Green and Accelerated Growth scenarios have been used by the
onshore Transmission Owners in preparing their most recent submission to Ofgem regarding the
Enhanced Transmission Investment Incentives.
Alternative Future Scenarios
Alternative future scenarios were proposed for inclusion in the Statement (as part of the consultation
exercise). A number of these future scenarios were not selected due to the following reasons:
- insufficient divergences between the alternative scenarios proposed and those presented in the
Future Scenario Consultation Document;
- the inclusion of the suggested future scenarios would not illustrate the potential of the offshore
electricity network;
- the suggested future scenario would represent an unlikely generation background e.g. combining
Slow Progression and Grid Connection scenarios.
4.3 Future Scenarios
4.3.1 Demand and Generation Backgrounds
Different investment requirements will be driven not just by the timing, volume and location of offshore
developments but also by onshore generation patterns. Each view therefore has an onshore generation
background that is consistent with the inherent underlying premise of that particular scenario.
Additional data for the generation (onshore and offshore) and demand backgrounds, which support each
of the future scenarios, is provided in Appendix 1. For each future scenario, the generation background
will illustrate the type and amount of generation which will be required to meet the annual peak demand
for that particular year within the study period.
The data included in each of the future scenarios will reflect the latest information available to NGET as at
the data freeze date i.e. March 2010 (subsequently adjusted for the development and inclusion of the
Sustainable Growth scenario). The utilisation of a data freeze date may result in minor differences
between what the future scenarios depict and what is actually (physically) available (in term of generation
capacity of a particular generation type) for the first year of the study period.
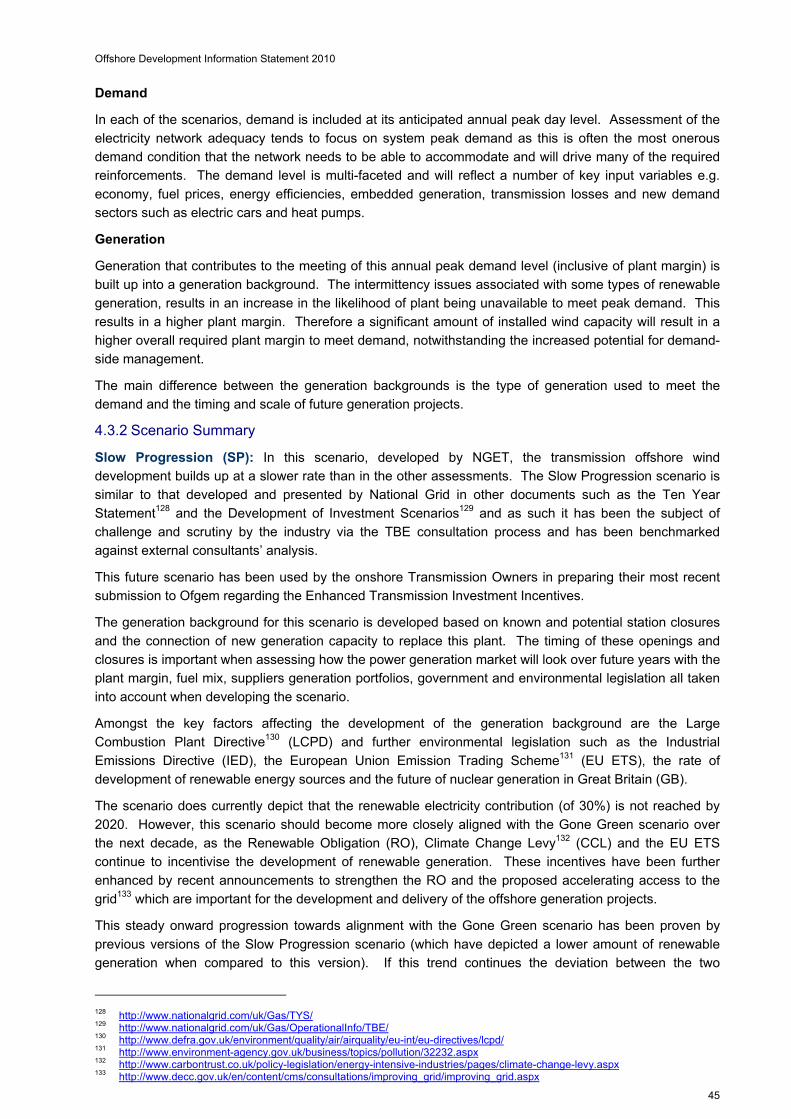
Offshore Development Information Statement 2010
45
Demand
In each of the scenarios, demand is included at its anticipated annual peak day level. Assessment of the
electricity network adequacy tends to focus on system peak demand as this is often the most onerous
demand condition that the network needs to be able to accommodate and will drive many of the required
reinforcements. The demand level is multi-faceted and will reflect a number of key input variables e.g.
economy, fuel prices, energy efficiencies, embedded generation, transmission losses and new demand
sectors such as electric cars and heat pumps.
Generation
Generation that contributes to the meeting of this annual peak demand level (inclusive of plant margin) is
built up into a generation background. The intermittency issues associated with some types of renewable
generation, results in an increase in the likelihood of plant being unavailable to meet peak demand. This
results in a higher plant margin. Therefore a significant amount of installed wind capacity will result in a
higher overall required plant margin to meet demand, notwithstanding the increased potential for demand-
side management.
The main difference between the generation backgrounds is the type of generation used to meet the
demand and the timing and scale of future generation projects.
4.3.2 Scenario Summary
Slow Progression (SP): In this scenario, developed by NGET, the transmission offshore wind
development builds up at a slower rate than in the other assessments. The Slow Progression scenario is
similar to that developed and presented by National Grid in other documents such as the Ten Year
Statement128 and the Development of Investment Scenarios129 and as such it has been the subject of
challenge and scrutiny by the industry via the TBE consultation process and has been benchmarked
against external consultants’ analysis.
This future scenario has been used by the onshore Transmission Owners in preparing their most recent
submission to Ofgem regarding the Enhanced Transmission Investment Incentives.
The generation background for this scenario is developed based on known and potential station closures
and the connection of new generation capacity to replace this plant. The timing of these openings and
closures is important when assessing how the power generation market will look over future years with the
plant margin, fuel mix, suppliers generation portfolios, government and environmental legislation all taken
into account when developing the scenario.
Amongst the key factors affecting the development of the generation background are the Large
Combustion Plant Directive130 (LCPD) and further environmental legislation such as the Industrial
Emissions Directive (IED), the European Union Emission Trading Scheme131 (EU ETS), the rate of
development of renewable energy sources and the future of nuclear generation in Great Britain (GB).
The scenario does currently depict that the renewable electricity contribution (of 30%) is not reached by
2020. However, this scenario should become more closely aligned with the Gone Green scenario over
the next decade, as the Renewable Obligation (RO), Climate Change Levy132 (CCL) and the EU ETS
continue to incentivise the development of renewable generation. These incentives have been further
enhanced by recent announcements to strengthen the RO and the proposed accelerating access to the
grid133 which are important for the development and delivery of the offshore generation projects.
This steady onward progression towards alignment with the Gone Green scenario has been proven by
previous versions of the Slow Progression scenario (which have depicted a lower amount of renewable
generation when compared to this version). If this trend continues the deviation between the two
128 http://www.nationalgrid.com/uk/Gas/TYS/ 129 http://www.nationalgrid.com/uk/Gas/OperationalInfo/TBE/ 130 http://www.defra.gov.uk/environment/quality/air/airquality/eu-int/eu-directives/lcpd/ 131 http://www.environment-agency.gov.uk/business/topics/pollution/32232.aspx 132 http://www.carbontrust.co.uk/policy-legislation/energy-intensive-industries/pages/climate-change-levy.aspx 133 http://www.decc.gov.uk/en/content/cms/consultations/improving_grid/improving_grid.aspx
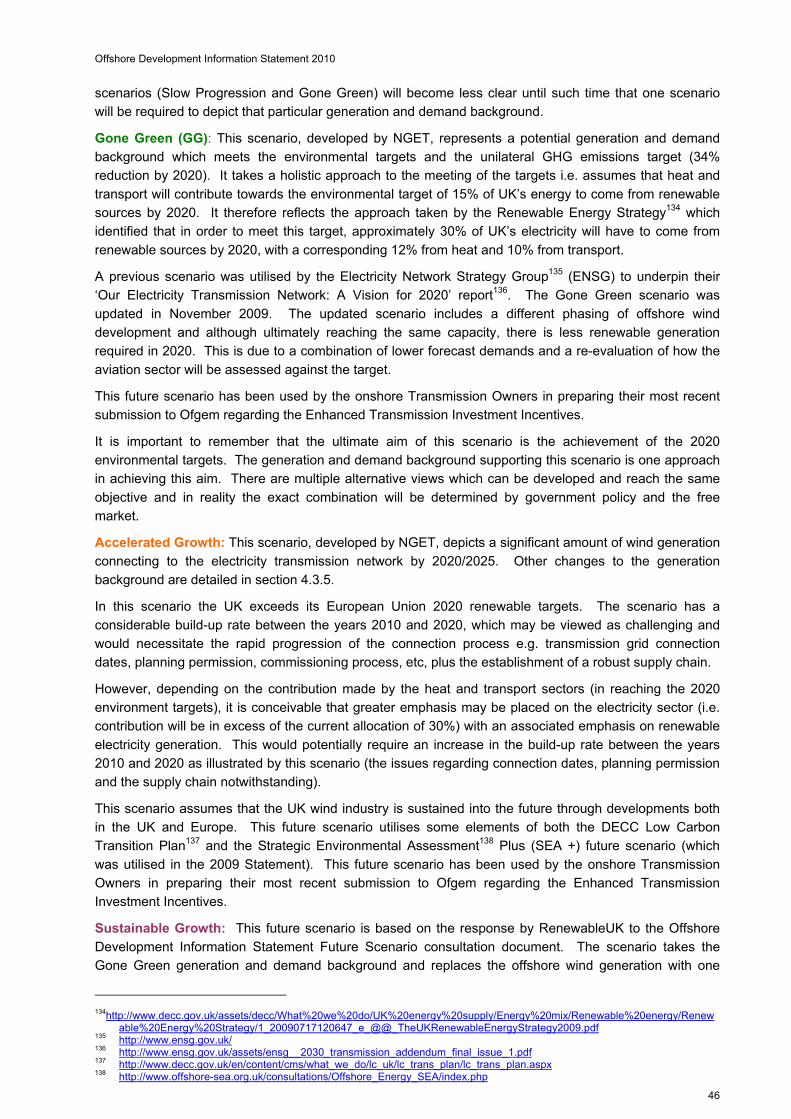
Offshore Development Information Statement 2010
46
scenarios (Slow Progression and Gone Green) will become less clear until such time that one scenario
will be required to depict that particular generation and demand background.
Gone Green (GG): This scenario, developed by NGET, represents a potential generation and demand
background which meets the environmental targets and the unilateral GHG emissions target (34%
reduction by 2020). It takes a holistic approach to the meeting of the targets i.e. assumes that heat and
transport will contribute towards the environmental target of 15% of UK’s energy to come from renewable
sources by 2020. It therefore reflects the approach taken by the Renewable Energy Strategy134 which
identified that in order to meet this target, approximately 30% of UK’s electricity will have to come from
renewable sources by 2020, with a corresponding 12% from heat and 10% from transport.
A previous scenario was utilised by the Electricity Network Strategy Group135 (ENSG) to underpin their
‘Our Electricity Transmission Network: A Vision for 2020’ report136. The Gone Green scenario was
updated in November 2009. The updated scenario includes a different phasing of offshore wind
development and although ultimately reaching the same capacity, there is less renewable generation
required in 2020. This is due to a combination of lower forecast demands and a re-evaluation of how the
aviation sector will be assessed against the target.
This future scenario has been used by the onshore Transmission Owners in preparing their most recent
submission to Ofgem regarding the Enhanced Transmission Investment Incentives.
It is important to remember that the ultimate aim of this scenario is the achievement of the 2020
environmental targets. The generation and demand background supporting this scenario is one approach
in achieving this aim. There are multiple alternative views which can be developed and reach the same
objective and in reality the exact combination will be determined by government policy and the free
market.
Accelerated Growth: This scenario, developed by NGET, depicts a significant amount of wind generation
connecting to the electricity transmission network by 2020/2025. Other changes to the generation
background are detailed in section 4.3.5.
In this scenario the UK exceeds its European Union 2020 renewable targets. The scenario has a
considerable build-up rate between the years 2010 and 2020, which may be viewed as challenging and
would necessitate the rapid progression of the connection process e.g. transmission grid connection
dates, planning permission, commissioning process, etc, plus the establishment of a robust supply chain.
However, depending on the contribution made by the heat and transport sectors (in reaching the 2020
environment targets), it is conceivable that greater emphasis may be placed on the electricity sector (i.e.
contribution will be in excess of the current allocation of 30%) with an associated emphasis on renewable
electricity generation. This would potentially require an increase in the build-up rate between the years
2010 and 2020 as illustrated by this scenario (the issues regarding connection dates, planning permission
and the supply chain notwithstanding).
This scenario assumes that the UK wind industry is sustained into the future through developments both
in the UK and Europe. This future scenario utilises some elements of both the DECC Low Carbon
Transition Plan137 and the Strategic Environmental Assessment138 Plus (SEA +) future scenario (which
was utilised in the 2009 Statement). This future scenario has been used by the onshore Transmission
Owners in preparing their most recent submission to Ofgem regarding the Enhanced Transmission
Investment Incentives.
Sustainable Growth: This future scenario is based on the response by RenewableUK to the Offshore
Development Information Statement Future Scenario consultation document. The scenario takes the
Gone Green generation and demand background and replaces the offshore wind generation with one
134http://www.decc.gov.uk/assets/decc/What%20we%20do/UK%20energy%20supply/Energy%20mix/Renewable%20energy/Renew
able%20Energy%20Strategy/1_20090717120647_e_@@_TheUKRenewableEnergyStrategy2009.pdf 135 http://www.ensg.gov.uk/ 136 http://www.ensg.gov.uk/assets/ensg__2030_transmission_addendum_final_issue_1.pdf 137 http://www.decc.gov.uk/en/content/cms/what_we_do/lc_uk/lc_trans_plan/lc_trans_plan.aspx 138 http://www.offshore-sea.org.uk/consultations/Offshore_Energy_SEA/index.php
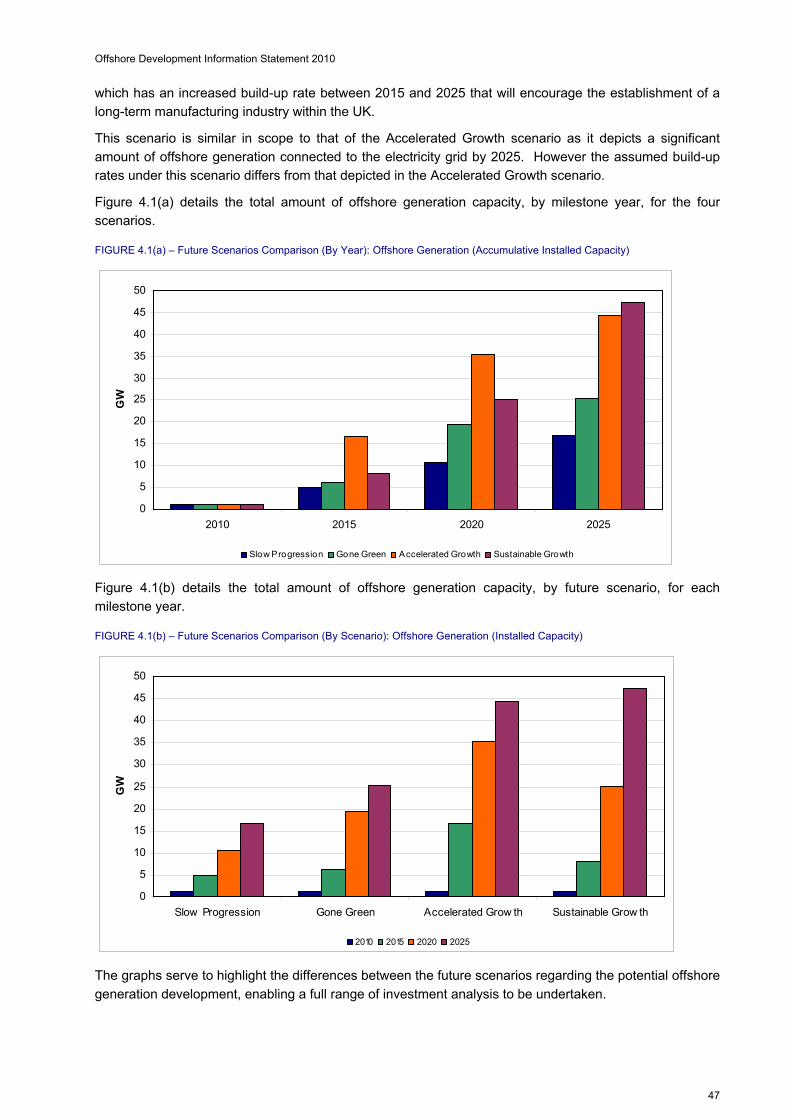
Offshore Development Information Statement 2010
47
which has an increased build-up rate between 2015 and 2025 that will encourage the establishment of a
long-term manufacturing industry within the UK.
This scenario is similar in scope to that of the Accelerated Growth scenario as it depicts a significant
amount of offshore generation connected to the electricity grid by 2025. However the assumed build-up
rates under this scenario differs from that depicted in the Accelerated Growth scenario.
Figure 4.1(a) details the total amount of offshore generation capacity, by milestone year, for the four
scenarios.
FIGURE 4.1(a) – Future Scenarios Comparison (By Year): Offshore Generation (Accumulative Installed Capacity)
0
5
10
15
20
25
30
35
40
45
50
2010 2015 2020 2025
GW
Slow Progression Gone Green Accelerated Growth Sustainable Growth
Figure 4.1(b) details the total amount of offshore generation capacity, by future scenario, for each
milestone year.
FIGURE 4.1(b) – Future Scenarios Comparison (By Scenario): Offshore Generation (Installed Capacity)
0
5
10
15
20
25
30
35
40
45
50
Slow Progression Gone Green Accelerated Grow th Sustainable Grow th
GW
2010 2015 2020 2025
The graphs serve to highlight the differences between the future scenarios regarding the potential offshore
generation development, enabling a full range of investment analysis to be undertaken.
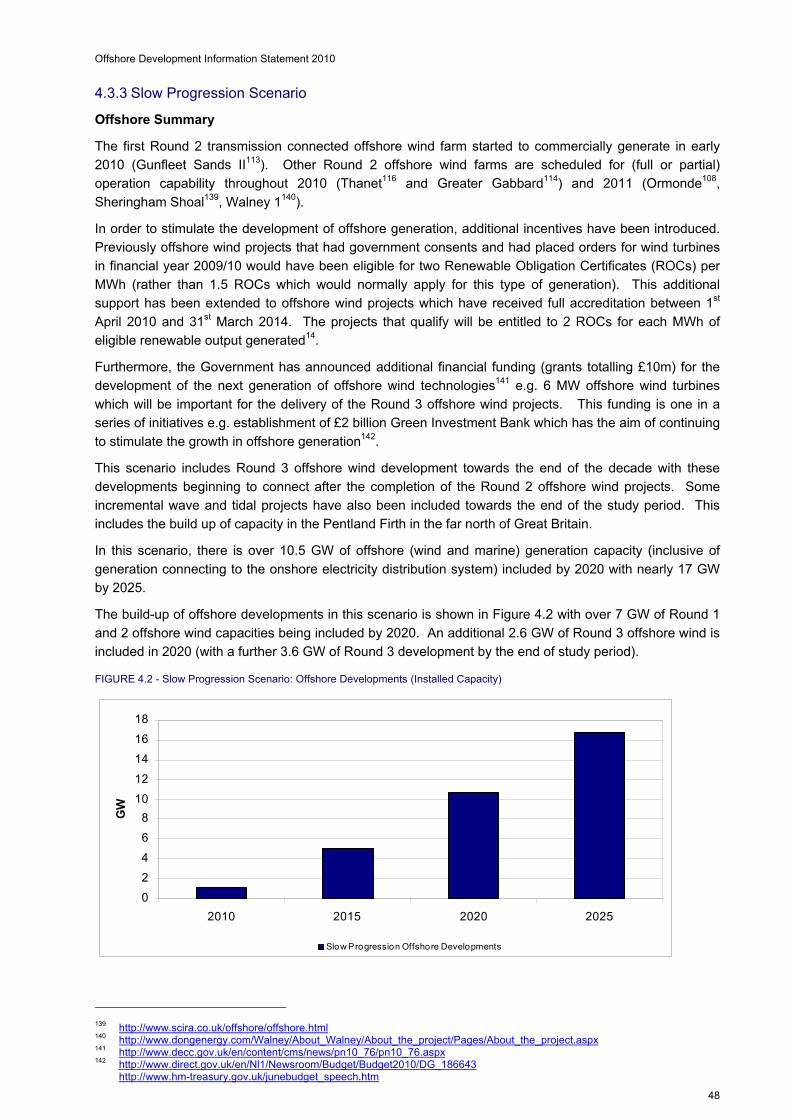
Offshore Development Information Statement 2010
48
4.3.3 Slow Progression Scenario
Offshore Summary
The first Round 2 transmission connected offshore wind farm started to commercially generate in early
2010 (Gunfleet Sands II113). Other Round 2 offshore wind farms are scheduled for (full or partial)
operation capability throughout 2010 (Thanet116 and Greater Gabbard114) and 2011 (Ormonde108,
Sheringham Shoal139, Walney 1140).
In order to stimulate the development of offshore generation, additional incentives have been introduced.
Previously offshore wind projects that had government consents and had placed orders for wind turbines
in financial year 2009/10 would have been eligible for two Renewable Obligation Certificates (ROCs) per
MWh (rather than 1.5 ROCs which would normally apply for this type of generation). This additional
support has been extended to offshore wind projects which have received full accreditation between 1st
April 2010 and 31st March 2014. The projects that qualify will be entitled to 2 ROCs for each MWh of
eligible renewable output generated14.
Furthermore, the Government has announced additional financial funding (grants totalling £10m) for the
development of the next generation of offshore wind technologies141 e.g. 6 MW offshore wind turbines
which will be important for the delivery of the Round 3 offshore wind projects. This funding is one in a
series of initiatives e.g. establishment of £2 billion Green Investment Bank which has the aim of continuing
to stimulate the growth in offshore generation142.
This scenario includes Round 3 offshore wind development towards the end of the decade with these
developments beginning to connect after the completion of the Round 2 offshore wind projects. Some
incremental wave and tidal projects have also been included towards the end of the study period. This
includes the build up of capacity in the Pentland Firth in the far north of Great Britain.
In this scenario, there is over 10.5 GW of offshore (wind and marine) generation capacity (inclusive of
generation connecting to the onshore electricity distribution system) included by 2020 with nearly 17 GW
by 2025.
The build-up of offshore developments in this scenario is shown in Figure 4.2 with over 7 GW of Round 1
and 2 offshore wind capacities being included by 2020. An additional 2.6 GW of Round 3 offshore wind is
included in 2020 (with a further 3.6 GW of Round 3 development by the end of study period).
FIGURE 4.2 - Slow Progression Scenario: Offshore Developments (Installed Capacity)
0
2
4
6
8
10
12
14
16
18
2010 2015 2020 2025
GW
Slow Progression Offshore Developments
139 http://www.scira.co.uk/offshore/offshore.html 140 http://www.dongenergy.com/Walney/About_Walney/About_the_project/Pages/About_the_project.aspx 141 http://www.decc.gov.uk/en/content/cms/news/pn10_76/pn10_76.aspx 142 http://www.direct.gov.uk/en/Nl1/Newsroom/Budget/Budget2010/DG_186643 http://www.hm-treasury.gov.uk/junebudget_speech.htm

Offshore Development Information Statement 2010
49
The accumulative build-up of offshore transmission wind capacity for this scenario is shown in Figure 4.3
in which there is nearly 10 GW of wind generation capacity being included by 2020 (with a further 4.9 GW
connecting by 2025).
FIGURE 4.3 - Slow Progression Scenario: Offshore Transmission Wind (Accumulative Installed Capacity)
0
2
4
6
8
10
12
14
16
2010 2011 2012 2013 2014 2015 2016 2017 2018 2019 2020 2021 2022 2023 2024 2025
GW
Slow Progression Offshore Transmission Wind (Accumulative Capacity)
The annual offshore transmission wind capacity for this scenario is shown in Figure 4.4. The yearly rates
range between 300 MW in 2017 (towards the end of the Round 2 connections but prior to the
commencement of the Round 3 connections) to nearly 1800 MW (Round 3 connections) in 2020.
FIGURE 4.4 - Slow Progression Scenario: Offshore Transmission Wind (Yearly Installed Capacity)
0
200
400
600
800
1000
1200
1400
1600
1800
2000
2010 2011 2012 2013 2014 2015 2016 2017 2018 2019 2020 2021 2022 2023 2024 2025
MW
Slow Progression: Offshore Wind Transmission (Yearly Capacity)
This build-up rate assumes a steady increase in the current supply chain capability with an average yearly
build-up rate of 900 MW (approximately 180 turbines connected each year, based on the utilisation of 5
MW turbines). The expansion and sustained development of the supply chain may be limited when
compared to the opportunity represented by the other scenarios.
The accumulative build-up of offshore transmission renewable capacity for this scenario is shown in
Figure 4.5. There is nearly 10 GW of wind and marine transmission generation capacity being included by
2020 (with a further 4.9 GW of wind and 1 GW of marine connecting by 2025).
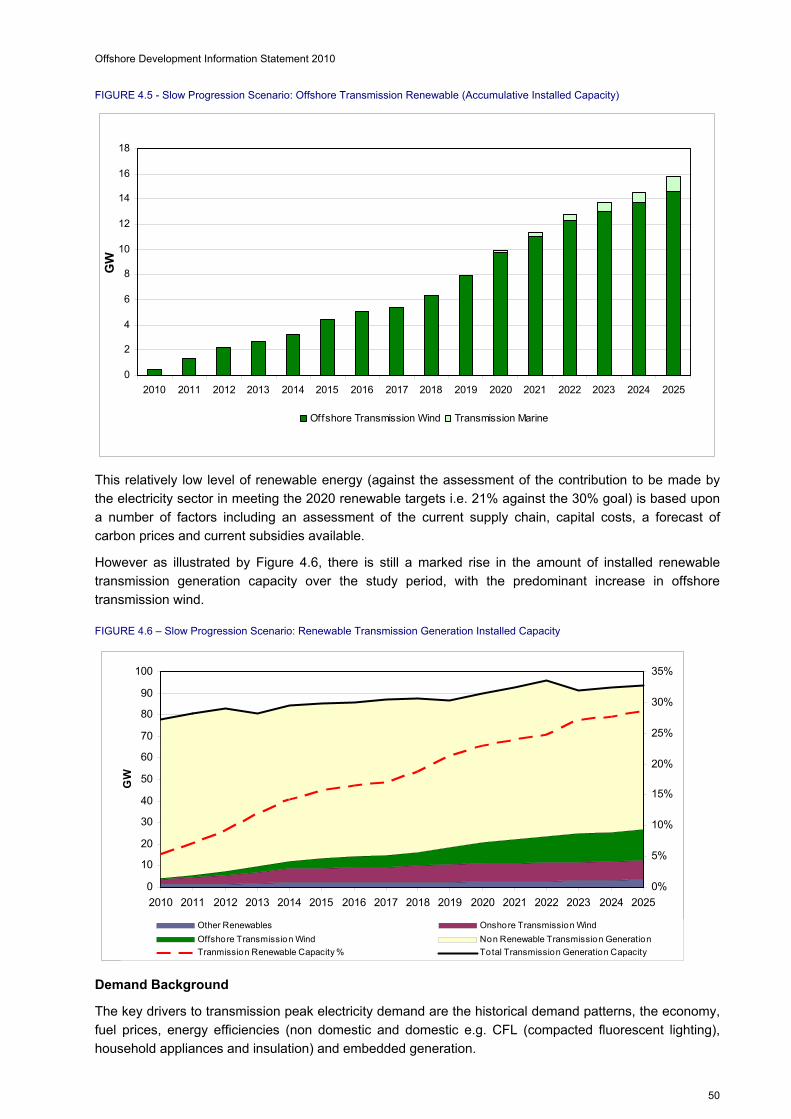
Offshore Development Information Statement 2010
50
FIGURE 4.5 - Slow Progression Scenario: Offshore Transmission Renewable (Accumulative Installed Capacity)
0
2
4
6
8
10
12
14
16
18
2010 2011 2012 2013 2014 2015 2016 2017 2018 2019 2020 2021 2022 2023 2024 2025
GW
Offshore Transmission Wind Transmission Marine
This relatively low level of renewable energy (against the assessment of the contribution to be made by
the electricity sector in meeting the 2020 renewable targets i.e. 21% against the 30% goal) is based upon
a number of factors including an assessment of the current supply chain, capital costs, a forecast of
carbon prices and current subsidies available.
However as illustrated by Figure 4.6, there is still a marked rise in the amount of installed renewable
transmission generation capacity over the study period, with the predominant increase in offshore
transmission wind.
FIGURE 4.6 – Slow Progression Scenario: Renewable Transmission Generation Installed Capacity
0
10
20
30
40
50
60
70
80
90
100
2010 2011 2012 2013 2014 2015 2016 2017 2018 2019 2020 2021 2022 2023 2024 2025
GW
0%
5%
10%
15%
20%
25%
30%
35%
Other Renewables Onshore Transmission Wind
Offshore Transmission Wind Non Renewable Transmission Generation
Tranmission Renewable Capacity % Total Transmission Generation Capacity
Demand Background
The key drivers to transmission peak electricity demand are the historical demand patterns, the economy,
fuel prices, energy efficiencies (non domestic and domestic e.g. CFL (compacted fluorescent lighting),
household appliances and insulation) and embedded generation.
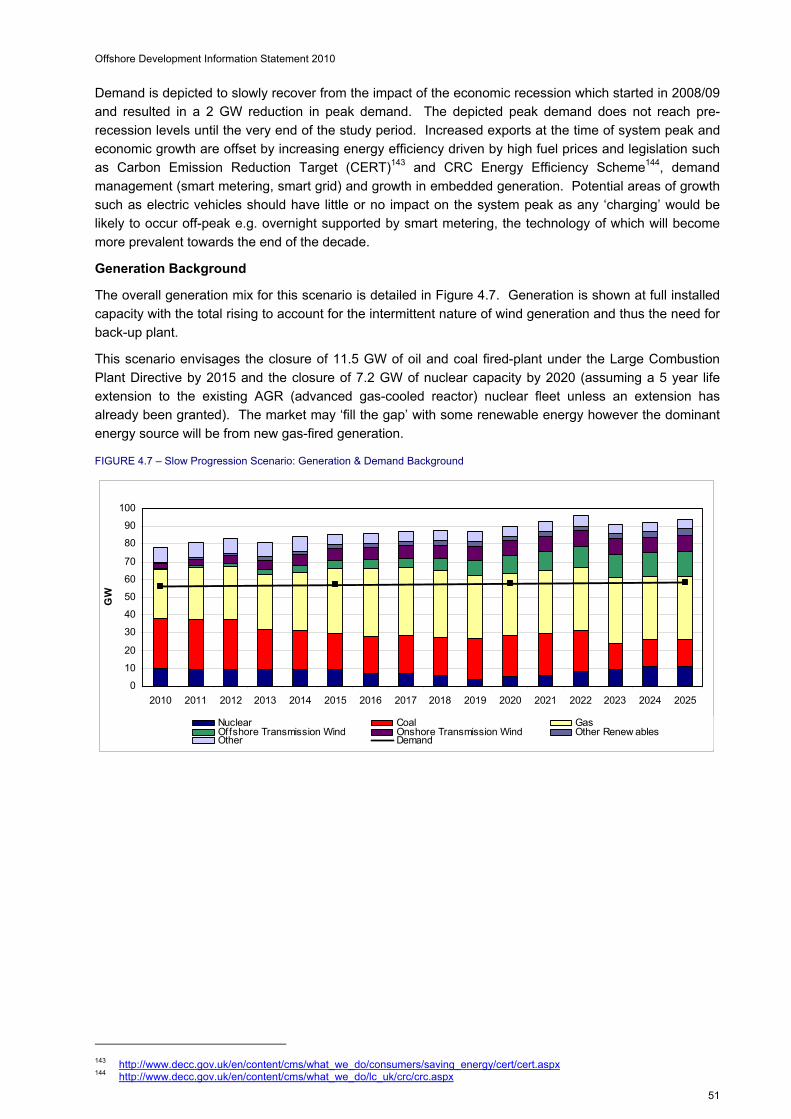
Offshore Development Information Statement 2010
51
Demand is depicted to slowly recover from the impact of the economic recession which started in 2008/09
and resulted in a 2 GW reduction in peak demand. The depicted peak demand does not reach pre-
recession levels until the very end of the study period. Increased exports at the time of system peak and
economic growth are offset by increasing energy efficiency driven by high fuel prices and legislation such
as Carbon Emission Reduction Target (CERT)143 and CRC Energy Efficiency Scheme144, demand
management (smart metering, smart grid) and growth in embedded generation. Potential areas of growth
such as electric vehicles should have little or no impact on the system peak as any ‘charging’ would be
likely to occur off-peak e.g. overnight supported by smart metering, the technology of which will become
more prevalent towards the end of the decade.
Generation Background
The overall generation mix for this scenario is detailed in Figure 4.7. Generation is shown at full installed
capacity with the total rising to account for the intermittent nature of wind generation and thus the need for
back-up plant.
This scenario envisages the closure of 11.5 GW of oil and coal fired-plant under the Large Combustion
Plant Directive by 2015 and the closure of 7.2 GW of nuclear capacity by 2020 (assuming a 5 year life
extension to the existing AGR (advanced gas-cooled reactor) nuclear fleet unless an extension has
already been granted). The market may ‘fill the gap’ with some renewable energy however the dominant
energy source will be from new gas-fired generation.
FIGURE 4.7 – Slow Progression Scenario: Generation & Demand Background
0
10
20
30
40
50
60
70
80
90
100
2010 2011 2012 2013 2014 2015 2016 2017 2018 2019 2020 2021 2022 2023 2024 2025
GW
Nuclear Coal GasOffshore Transmission Wind Onshore Transmission Wind Other Renew ablesOther Demand
143 http://www.decc.gov.uk/en/content/cms/what_we_do/consumers/saving_energy/cert/cert.aspx 144 http://www.decc.gov.uk/en/content/cms/what_we_do/lc_uk/crc/crc.aspx
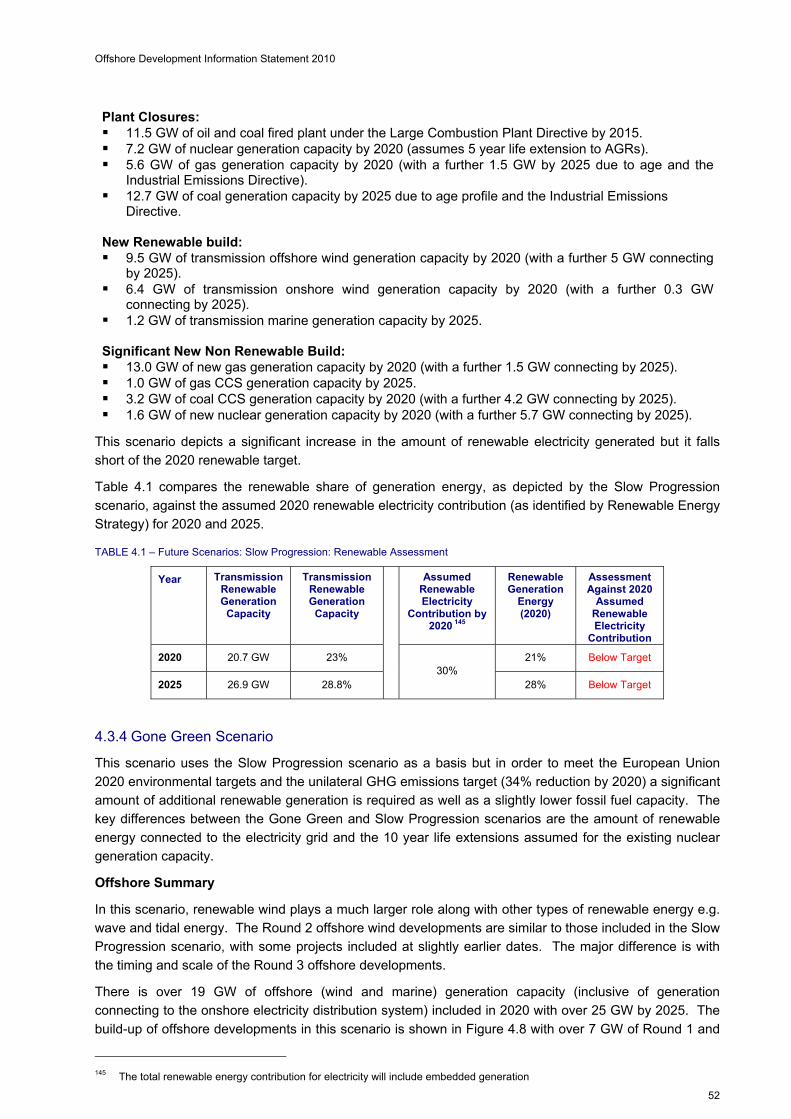
Offshore Development Information Statement 2010
52
Plant Closures: 11.5 GW of oil and coal fired plant under the Large Combustion Plant Directive by 2015. 7.2 GW of nuclear generation capacity by 2020 (assumes 5 year life extension to AGRs). 5.6 GW of gas generation capacity by 2020 (with a further 1.5 GW by 2025 due to age and the
Industrial Emissions Directive). 12.7 GW of coal generation capacity by 2025 due to age profile and the Industrial Emissions
Directive. New Renewable build: 9.5 GW of transmission offshore wind generation capacity by 2020 (with a further 5 GW connecting
by 2025). 6.4 GW of transmission onshore wind generation capacity by 2020 (with a further 0.3 GW
connecting by 2025). 1.2 GW of transmission marine generation capacity by 2025. Significant New Non Renewable Build: 13.0 GW of new gas generation capacity by 2020 (with a further 1.5 GW connecting by 2025). 1.0 GW of gas CCS generation capacity by 2025. 3.2 GW of coal CCS generation capacity by 2020 (with a further 4.2 GW connecting by 2025). 1.6 GW of new nuclear generation capacity by 2020 (with a further 5.7 GW connecting by 2025).
This scenario depicts a significant increase in the amount of renewable electricity generated but it falls
short of the 2020 renewable target.
Table 4.1 compares the renewable share of generation energy, as depicted by the Slow Progression
scenario, against the assumed 2020 renewable electricity contribution (as identified by Renewable Energy
Strategy) for 2020 and 2025.
TABLE 4.1 – Future Scenarios: Slow Progression: Renewable Assessment
Year Transmission Renewable Generation
Capacity
Transmission Renewable Generation
Capacity
Assumed Renewable Electricity
Contribution by 2020 145
Renewable Generation
Energy (2020)
Assessment Against 2020
Assumed Renewable Electricity
Contribution
2020 20.7 GW 23% 21% Below Target
2025 26.9 GW 28.8%
30% 28% Below Target
4.3.4 Gone Green Scenario
This scenario uses the Slow Progression scenario as a basis but in order to meet the European Union
2020 environmental targets and the unilateral GHG emissions target (34% reduction by 2020) a significant
amount of additional renewable generation is required as well as a slightly lower fossil fuel capacity. The
key differences between the Gone Green and Slow Progression scenarios are the amount of renewable
energy connected to the electricity grid and the 10 year life extensions assumed for the existing nuclear
generation capacity.
Offshore Summary
In this scenario, renewable wind plays a much larger role along with other types of renewable energy e.g.
wave and tidal energy. The Round 2 offshore wind developments are similar to those included in the Slow
Progression scenario, with some projects included at slightly earlier dates. The major difference is with
the timing and scale of the Round 3 offshore developments.
There is over 19 GW of offshore (wind and marine) generation capacity (inclusive of generation
connecting to the onshore electricity distribution system) included in 2020 with over 25 GW by 2025. The
build-up of offshore developments in this scenario is shown in Figure 4.8 with over 7 GW of Round 1 and
145 The total renewable energy contribution for electricity will include embedded generation

Offshore Development Information Statement 2010
53
Round 2 offshore wind capacities being included by 2020 and over 8 GW of Round 3 offshore wind
generation included in 2020. The Round 3 figure increases to nearly 12 GW by 2025. There is over 1
GW of offshore generation capacity in Scottish Territorial Waters by 2020 (rising to nearly 3 GW by 2025).
FIGURE 4.8 – Gone Green Scenario: Offshore Developments (Installed Capacity)
0
5
10
15
20
25
30
2010 2015 2020 2025
GW
Gone Green Offshore Developments
The accumulative build-up of offshore transmission wind in this scenario is shown in Figure 4.9 in which
there is over 16 GW of wind generation capacity being included by 2020 (with a further 5 GW connecting
by 2025).
FIGURE 4.9 – Gone Green Scenario: Offshore Transmission Wind (Accumulative Installed Capacity)
0
5
10
15
20
25
2010 2011 2012 2013 2014 2015 2016 2017 2018 2019 2020 2021 2022 2023 2024 2025
GW
Gone Green Offshore Transmission Wind (Accumulative Capacity)
The annual offshore transmission wind capacity for this scenario is shown in Figure 4.10. The yearly rates
range between 480 MW in 2010 to nearly 2,600 MW in 2019 (Round 3 and Scottish Territorial Waters
connections).

Offshore Development Information Statement 2010
54
FIGURE 4.10 – Gone Green Scenario: Offshore Transmission Wind (Yearly Installed Capacity)
0
500
1000
1500
2000
2500
3000
2010 2011 2012 2013 2014 2015 2016 2017 2018 2019 2020 2021 2022 2023 2024 2025
MW
Gone Green: Offshore Wind Transmission (Yearly Capacity)
This build-up rate assumes a significant increase in the current supply chain capability after 2014 with an
average yearly build-up rate of 1,300 MW (approximately 260 turbines connected each year, based on the
utilisation of 5 MW turbines). The build-up rates reduce after 2019 as the amount of installed capacity has
reached the proposed level required to meet the 2020 environmental targets.
The accumulative build-up of offshore transmission renewable capacity for this scenario is shown in
Figure 4.11. There is 16 GW of wind and 1.4 GW of marine transmission generation capacity being
included by 2020 (with a further 5 GW of wind and 0.5 GW of marine connecting by 2025).
FIGURE 4.11 - Gone Green Scenario: Offshore Transmission Renewable (Accumulative Installed Capacity)
0
2
4
6
8
10
12
14
16
18
20
22
24
26
2010 2011 2012 2013 2014 2015 2016 2017 2018 2019 2020 2021 2022 2023 2024 2025
GW
Offshore Transmission Wind Transmission Marine
This scenario represents a potential generation and demand background for 2020 which meets the UK’s
climate change targets with the emphasis on renewable electricity generation. Figure 4.12 demonstrates
the increase in the amount of installed renewable transmission generation capacity over the study period.
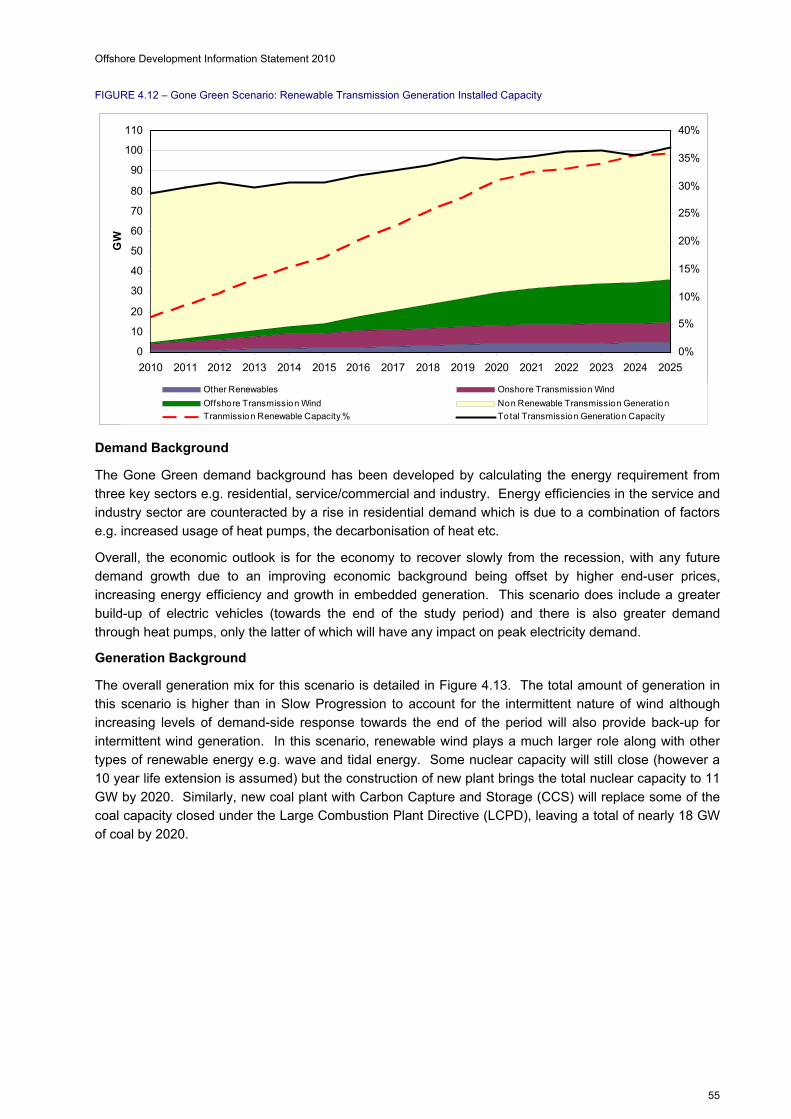
Offshore Development Information Statement 2010
55
FIGURE 4.12 – Gone Green Scenario: Renewable Transmission Generation Installed Capacity
0
10
20
30
40
50
60
70
80
90
100
110
2010 2011 2012 2013 2014 2015 2016 2017 2018 2019 2020 2021 2022 2023 2024 2025
GW
0%
5%
10%
15%
20%
25%
30%
35%
40%
Other Renewables Onshore Transmission Wind
Offshore Transmission Wind Non Renewable Transmission Generation
Tranmission Renewable Capacity % Total Transmission Generation Capacity
Demand Background
The Gone Green demand background has been developed by calculating the energy requirement from
three key sectors e.g. residential, service/commercial and industry. Energy efficiencies in the service and
industry sector are counteracted by a rise in residential demand which is due to a combination of factors
e.g. increased usage of heat pumps, the decarbonisation of heat etc.
Overall, the economic outlook is for the economy to recover slowly from the recession, with any future
demand growth due to an improving economic background being offset by higher end-user prices,
increasing energy efficiency and growth in embedded generation. This scenario does include a greater
build-up of electric vehicles (towards the end of the study period) and there is also greater demand
through heat pumps, only the latter of which will have any impact on peak electricity demand.
Generation Background
The overall generation mix for this scenario is detailed in Figure 4.13. The total amount of generation in
this scenario is higher than in Slow Progression to account for the intermittent nature of wind although
increasing levels of demand-side response towards the end of the period will also provide back-up for
intermittent wind generation. In this scenario, renewable wind plays a much larger role along with other
types of renewable energy e.g. wave and tidal energy. Some nuclear capacity will still close (however a
10 year life extension is assumed) but the construction of new plant brings the total nuclear capacity to 11
GW by 2020. Similarly, new coal plant with Carbon Capture and Storage (CCS) will replace some of the
coal capacity closed under the Large Combustion Plant Directive (LCPD), leaving a total of nearly 18 GW
of coal by 2020.
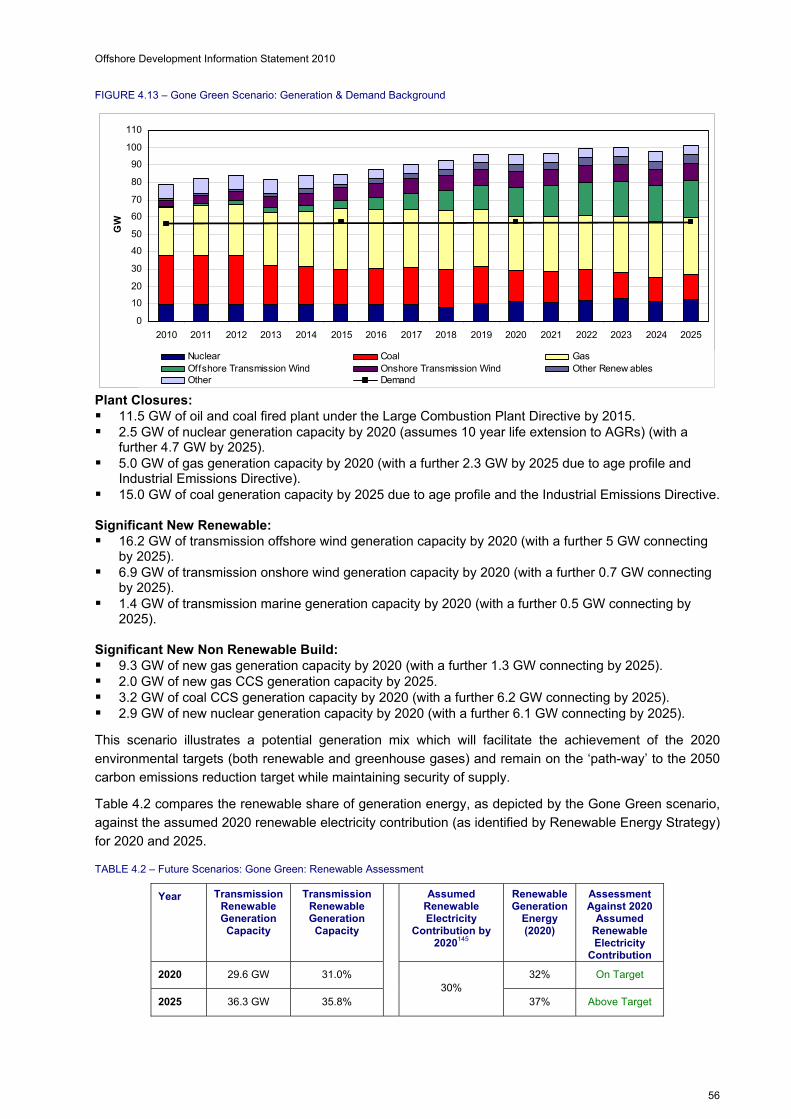
Offshore Development Information Statement 2010
56
FIGURE 4.13 – Gone Green Scenario: Generation & Demand Background
0
10
20
30
40
50
60
70
80
90
100
110
2010 2011 2012 2013 2014 2015 2016 2017 2018 2019 2020 2021 2022 2023 2024 2025
GW
Nuclear Coal GasOffshore Transmission Wind Onshore Transmission Wind Other Renew ablesOther Demand
Plant Closures: 11.5 GW of oil and coal fired plant under the Large Combustion Plant Directive by 2015. 2.5 GW of nuclear generation capacity by 2020 (assumes 10 year life extension to AGRs) (with a
further 4.7 GW by 2025). 5.0 GW of gas generation capacity by 2020 (with a further 2.3 GW by 2025 due to age profile and
Industrial Emissions Directive). 15.0 GW of coal generation capacity by 2025 due to age profile and the Industrial Emissions Directive. Significant New Renewable: 16.2 GW of transmission offshore wind generation capacity by 2020 (with a further 5 GW connecting
by 2025). 6.9 GW of transmission onshore wind generation capacity by 2020 (with a further 0.7 GW connecting
by 2025). 1.4 GW of transmission marine generation capacity by 2020 (with a further 0.5 GW connecting by
2025). Significant New Non Renewable Build: 9.3 GW of new gas generation capacity by 2020 (with a further 1.3 GW connecting by 2025). 2.0 GW of new gas CCS generation capacity by 2025. 3.2 GW of coal CCS generation capacity by 2020 (with a further 6.2 GW connecting by 2025). 2.9 GW of new nuclear generation capacity by 2020 (with a further 6.1 GW connecting by 2025).
This scenario illustrates a potential generation mix which will facilitate the achievement of the 2020
environmental targets (both renewable and greenhouse gases) and remain on the ‘path-way’ to the 2050
carbon emissions reduction target while maintaining security of supply.
Table 4.2 compares the renewable share of generation energy, as depicted by the Gone Green scenario,
against the assumed 2020 renewable electricity contribution (as identified by Renewable Energy Strategy)
for 2020 and 2025.
TABLE 4.2 – Future Scenarios: Gone Green: Renewable Assessment
Year Transmission Renewable Generation
Capacity
Transmission Renewable Generation
Capacity
Assumed Renewable Electricity
Contribution by 2020145
Renewable Generation
Energy (2020)
Assessment Against 2020
Assumed Renewable Electricity
Contribution
2020 29.6 GW 31.0% 32% On Target
2025 36.3 GW 35.8%
30% 37% Above Target
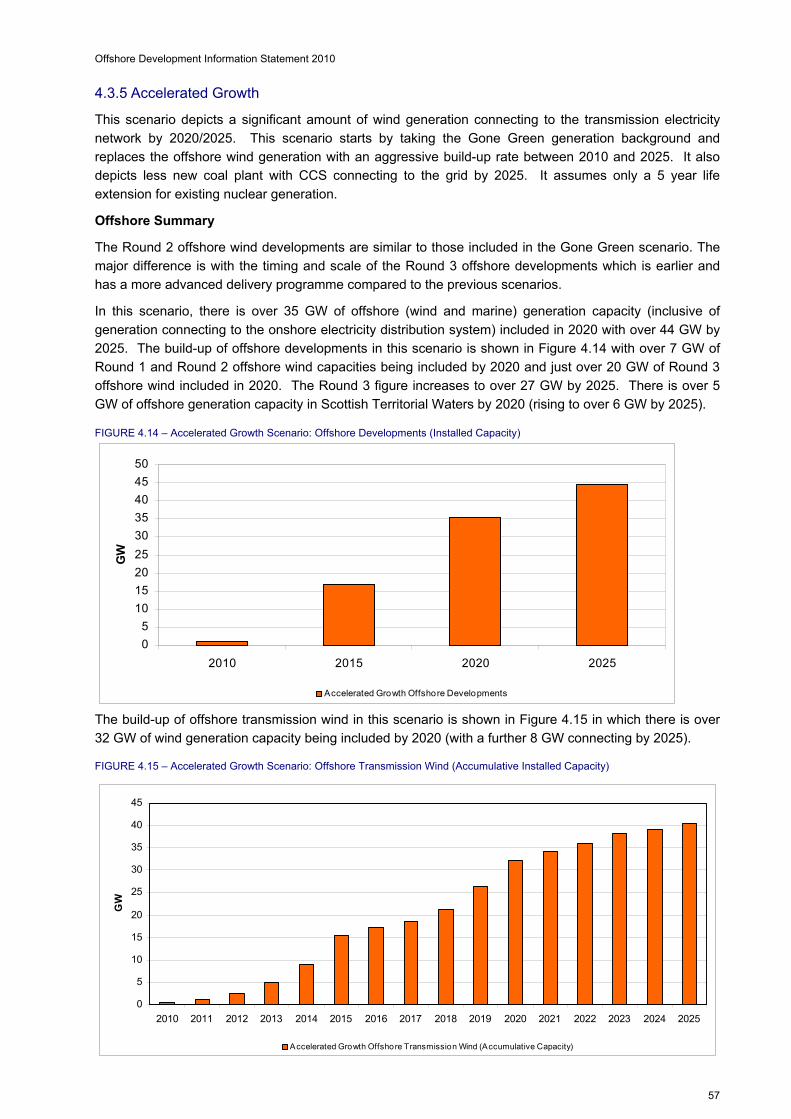
Offshore Development Information Statement 2010
57
4.3.5 Accelerated Growth
This scenario depicts a significant amount of wind generation connecting to the transmission electricity
network by 2020/2025. This scenario starts by taking the Gone Green generation background and
replaces the offshore wind generation with an aggressive build-up rate between 2010 and 2025. It also
depicts less new coal plant with CCS connecting to the grid by 2025. It assumes only a 5 year life
extension for existing nuclear generation.
Offshore Summary
The Round 2 offshore wind developments are similar to those included in the Gone Green scenario. The
major difference is with the timing and scale of the Round 3 offshore developments which is earlier and
has a more advanced delivery programme compared to the previous scenarios.
In this scenario, there is over 35 GW of offshore (wind and marine) generation capacity (inclusive of
generation connecting to the onshore electricity distribution system) included in 2020 with over 44 GW by
2025. The build-up of offshore developments in this scenario is shown in Figure 4.14 with over 7 GW of
Round 1 and Round 2 offshore wind capacities being included by 2020 and just over 20 GW of Round 3
offshore wind included in 2020. The Round 3 figure increases to over 27 GW by 2025. There is over 5
GW of offshore generation capacity in Scottish Territorial Waters by 2020 (rising to over 6 GW by 2025).
FIGURE 4.14 – Accelerated Growth Scenario: Offshore Developments (Installed Capacity)
0
5
10
15
20
25
30
35
40
45
50
2010 2015 2020 2025
GW
Accelerated Growth Offshore Developments
The build-up of offshore transmission wind in this scenario is shown in Figure 4.15 in which there is over
32 GW of wind generation capacity being included by 2020 (with a further 8 GW connecting by 2025).
FIGURE 4.15 – Accelerated Growth Scenario: Offshore Transmission Wind (Accumulative Installed Capacity)
0
5
10
15
20
25
30
35
40
45
2010 2011 2012 2013 2014 2015 2016 2017 2018 2019 2020 2021 2022 2023 2024 2025
GW
Accelerated Growth Offshore Transmission Wind (Accumulative Capacity)

Offshore Development Information Statement 2010
58
The annual offshore transmission wind capacity for this scenario is shown in Figure 4.16. The yearly rates
range between 470 MW in 2010 (prior to the development of the majority of the Round 2 connections) and
6700 MW in 2015 (first tranche of Round 3 projects).
FIGURE 4.16 – Accelerated Growth Scenario: Offshore Transmission Wind (Yearly Installed Capacity)
0
1000
2000
3000
4000
5000
6000
7000
8000
2010 2011 2012 2013 2014 2015 2016 2017 2018 2019 2020 2021 2022 2023 2024 2025
MW
Accelerated Grow th: Offshore Wind Transmission (Yearly Capacity)
This build-up rate assumes a significant increase in the current supply chain capability between 2012 and
2015 before reducing prior to a second increase commencing in 2018. The average yearly build-up rate is
2,500 MW over the study period (approximately 500 turbines connected each year, based on the
utilisation of 5 MW turbines).
The Accelerated Growth scenario depicts the rapid deployment of offshore generation capacity and would
necessitate significant investment into the supply chain. The supply chain would need to begin building
now to be ready to deliver this scenario. This scenario may also necessitate further growth of the UK
domestic and European export market to sustain the supply chain that would have to be developed in the
UK.
The accumulative build-up of offshore transmission renewable capacity for this scenario is shown in
Figure 4.17. There is 32 GW of wind and 1.4 GW of marine transmission generation capacity being
included by 2020 (with a further 8 GW of wind and 0.5 GW of marine connecting by 2025).
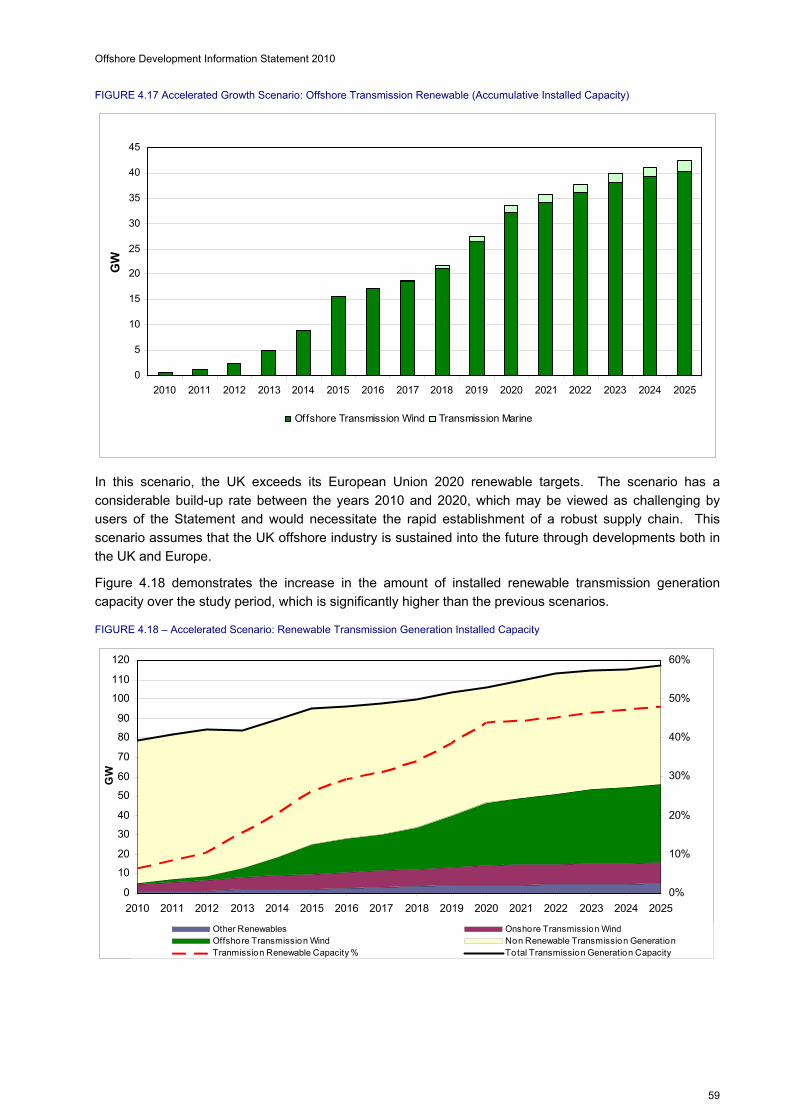
Offshore Development Information Statement 2010
59
FIGURE 4.17 Accelerated Growth Scenario: Offshore Transmission Renewable (Accumulative Installed Capacity)
0
5
10
15
20
25
30
35
40
45
2010 2011 2012 2013 2014 2015 2016 2017 2018 2019 2020 2021 2022 2023 2024 2025
GW
Offshore Transmission Wind Transmission Marine
In this scenario, the UK exceeds its European Union 2020 renewable targets. The scenario has a
considerable build-up rate between the years 2010 and 2020, which may be viewed as challenging by
users of the Statement and would necessitate the rapid establishment of a robust supply chain. This
scenario assumes that the UK offshore industry is sustained into the future through developments both in
the UK and Europe.
Figure 4.18 demonstrates the increase in the amount of installed renewable transmission generation
capacity over the study period, which is significantly higher than the previous scenarios.
FIGURE 4.18 – Accelerated Scenario: Renewable Transmission Generation Installed Capacity
0
10
20
30
40
50
60
70
80
90
100
110
120
2010 2011 2012 2013 2014 2015 2016 2017 2018 2019 2020 2021 2022 2023 2024 2025
GW
0%
10%
20%
30%
40%
50%
60%
Other Renewables Onshore Transmission WindOffshore Transmission Wind Non Renewable Transmission GenerationTranmission Renewable Capacity % Total Transmission Generation Capacity
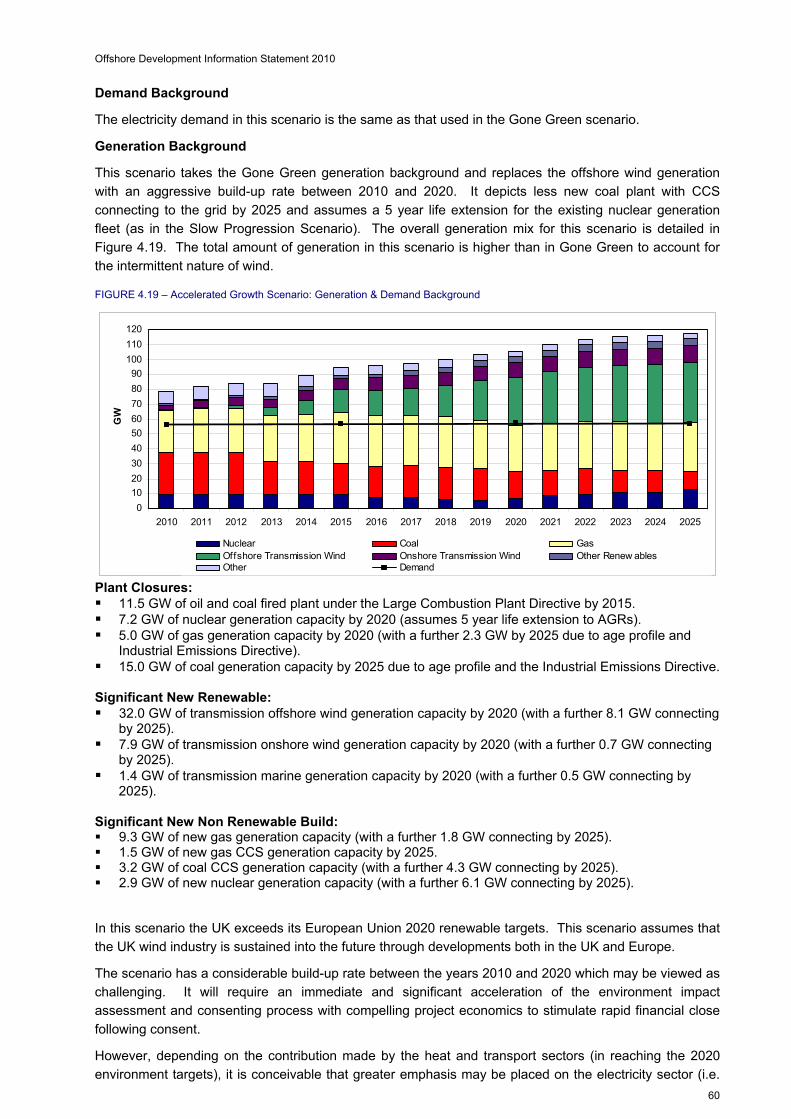
Offshore Development Information Statement 2010
60
Demand Background
The electricity demand in this scenario is the same as that used in the Gone Green scenario.
Generation Background
This scenario takes the Gone Green generation background and replaces the offshore wind generation
with an aggressive build-up rate between 2010 and 2020. It depicts less new coal plant with CCS
connecting to the grid by 2025 and assumes a 5 year life extension for the existing nuclear generation
fleet (as in the Slow Progression Scenario). The overall generation mix for this scenario is detailed in
Figure 4.19. The total amount of generation in this scenario is higher than in Gone Green to account for
the intermittent nature of wind.
FIGURE 4.19 – Accelerated Growth Scenario: Generation & Demand Background
0
10
20
30
40
50
60
70
80
90
100
110
120
2010 2011 2012 2013 2014 2015 2016 2017 2018 2019 2020 2021 2022 2023 2024 2025
GW
Nuclear Coal GasOffshore Transmission Wind Onshore Transmission Wind Other Renew ablesOther Demand
Plant Closures: 11.5 GW of oil and coal fired plant under the Large Combustion Plant Directive by 2015. 7.2 GW of nuclear generation capacity by 2020 (assumes 5 year life extension to AGRs). 5.0 GW of gas generation capacity by 2020 (with a further 2.3 GW by 2025 due to age profile and
Industrial Emissions Directive). 15.0 GW of coal generation capacity by 2025 due to age profile and the Industrial Emissions Directive. Significant New Renewable: 32.0 GW of transmission offshore wind generation capacity by 2020 (with a further 8.1 GW connecting
by 2025). 7.9 GW of transmission onshore wind generation capacity by 2020 (with a further 0.7 GW connecting
by 2025). 1.4 GW of transmission marine generation capacity by 2020 (with a further 0.5 GW connecting by
2025). Significant New Non Renewable Build: 9.3 GW of new gas generation capacity (with a further 1.8 GW connecting by 2025). 1.5 GW of new gas CCS generation capacity by 2025. 3.2 GW of coal CCS generation capacity (with a further 4.3 GW connecting by 2025). 2.9 GW of new nuclear generation capacity (with a further 6.1 GW connecting by 2025).
In this scenario the UK exceeds its European Union 2020 renewable targets. This scenario assumes that
the UK wind industry is sustained into the future through developments both in the UK and Europe.
The scenario has a considerable build-up rate between the years 2010 and 2020 which may be viewed as
challenging. It will require an immediate and significant acceleration of the environment impact
assessment and consenting process with compelling project economics to stimulate rapid financial close
following consent.
However, depending on the contribution made by the heat and transport sectors (in reaching the 2020
environment targets), it is conceivable that greater emphasis may be placed on the electricity sector (i.e.
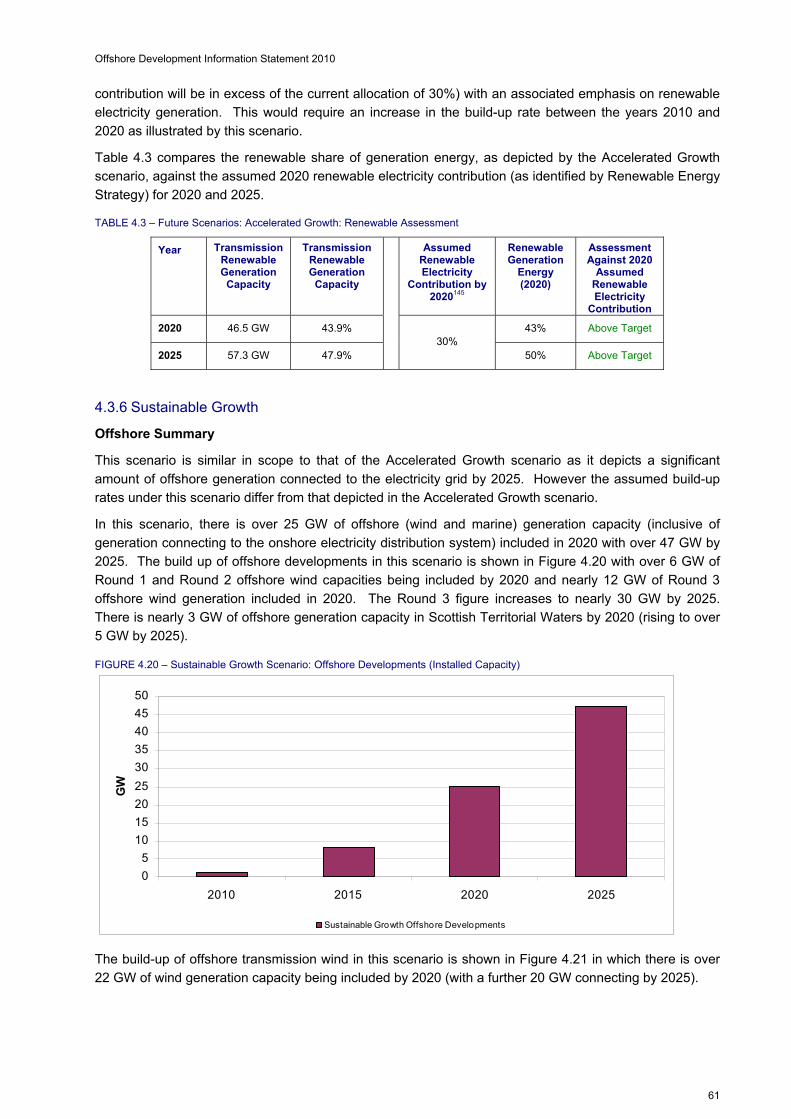
Offshore Development Information Statement 2010
61
contribution will be in excess of the current allocation of 30%) with an associated emphasis on renewable
electricity generation. This would require an increase in the build-up rate between the years 2010 and
2020 as illustrated by this scenario.
Table 4.3 compares the renewable share of generation energy, as depicted by the Accelerated Growth
scenario, against the assumed 2020 renewable electricity contribution (as identified by Renewable Energy
Strategy) for 2020 and 2025.
TABLE 4.3 – Future Scenarios: Accelerated Growth: Renewable Assessment
Year Transmission Renewable Generation
Capacity
Transmission Renewable Generation
Capacity
Assumed Renewable Electricity
Contribution by 2020145
Renewable Generation
Energy (2020)
Assessment Against 2020
Assumed Renewable Electricity
Contribution
2020 46.5 GW 43.9% 43% Above Target
2025 57.3 GW 47.9%
30% 50% Above Target
4.3.6 Sustainable Growth
Offshore Summary
This scenario is similar in scope to that of the Accelerated Growth scenario as it depicts a significant
amount of offshore generation connected to the electricity grid by 2025. However the assumed build-up
rates under this scenario differ from that depicted in the Accelerated Growth scenario.
In this scenario, there is over 25 GW of offshore (wind and marine) generation capacity (inclusive of
generation connecting to the onshore electricity distribution system) included in 2020 with over 47 GW by
2025. The build up of offshore developments in this scenario is shown in Figure 4.20 with over 6 GW of
Round 1 and Round 2 offshore wind capacities being included by 2020 and nearly 12 GW of Round 3
offshore wind generation included in 2020. The Round 3 figure increases to nearly 30 GW by 2025.
There is nearly 3 GW of offshore generation capacity in Scottish Territorial Waters by 2020 (rising to over
5 GW by 2025).
FIGURE 4.20 – Sustainable Growth Scenario: Offshore Developments (Installed Capacity)
0
5
10
15
20
25
30
35
40
45
50
2010 2015 2020 2025
GW
Sustainable Growth Offshore Developments
The build-up of offshore transmission wind in this scenario is shown in Figure 4.21 in which there is over
22 GW of wind generation capacity being included by 2020 (with a further 20 GW connecting by 2025).

Offshore Development Information Statement 2010
62
FIGURE 4.21 – Sustainable Growth Scenario: Offshore Transmission Wind (Accumulative Installed Capacity)
0
5
10
15
20
25
30
35
40
45
2010 2011 2012 2013 2014 2015 2016 2017 2018 2019 2020 2021 2022 2023 2024 2025
GW
Sustainable Growth Offshore Transmission Wind (Accumulative Capacity)
The annual offshore transmission wind capacity for this scenario is shown in Figure 4.22. The yearly rates
range between 480 MW in 2010 (prior to the development of the majority of the Round 2 connections) and
4,000 MW from 2021 onwards (for the completion of Round 3 projects).
FIGURE 4.22 – Sustainable Growth Scenario: Offshore Transmission Wind (Installed Capacity)
0
500
1000
1500
2000
2500
3000
3500
4000
4500
2010 2011 2012 2013 2014 2015 2016 2017 2018 2019 2020 2021 2022 2023 2024 2025
MW
Sustainable Grow th: Offshore Wind Transmission (Annual Capacity Rates)
This build-up rate assumes a substantial and sustained increase in the current supply chain capability
after 2014 with an average yearly build-up rate of 2,650 MW over the study period (approximately 530
turbines connected each year, based on the utilisation of 5 MW turbines). The slower growth rate than
that depicted in the Accelerated Growth scenario may make the ramping up of the supply chain capacity
more achievable. In addition, the longer and more sustained period of production may provide confidence
to the development of a long-term market which will be of consideration to manufacturers and other supply
chain companies considering setting-up or expanding in the UK.
The accumulative build-up of offshore transmission renewable capacity for this scenario is shown in
Figure 4.23. There is 22 GW of wind and nearly 1.2 GW of marine transmission generation capacity being
included by 2020 (with a further 20 GW of wind and 0.75 GW of marine connecting by 2025).

Offshore Development Information Statement 2010
63
FIGURE 4.23 - Sustainable Growth Scenario: Offshore Transmission Renewable (Accumulative Installed Capacity)
0
5
10
15
20
25
30
35
40
45
50
2010 2011 2012 2013 2014 2015 2016 2017 2018 2019 2020 2021 2022 2023 2024 2025
GW
Offshore Transmission Wind Transmission Marine
In this scenario, the UK exceeds its European Union 2020 renewable targets. This scenario will inform
users regarding what grid development will be required in order to facilitate a significant amount of
offshore generation.
Figure 4.24 demonstrates the increase in the amount of installed renewable transmission generation
capacity over the study period, which is slightly higher than that depicted in the Accelerated Growth
Scenario.
FIGURE 4.24 – Sustainable Growth Scenario: Renewable Transmission Generation Installed Capacity
0
10
20
30
40
50
60
70
80
90
100
110
120
130
2010 2011 2012 2013 2014 2015 2016 2017 2018 2019 2020 2021 2022 2023 2024 2025
GW
0%
5%
10%
15%
20%
25%
30%
35%
40%
45%
50%
Other Renewables Onshore Transmission Wind
Offshore Transmission Wind Non Renewable Transmission Generation
Tranmission Renewable Capacity % Total Transmission Generation Capacity
Demand Background
The electricity demand in this scenario is the same as that used in the Gone Green scenario.

Offshore Development Information Statement 2010
64
Generation Background
The onshore generation in this scenario is the same as that used in the Gone Green scenario. The
overall generation mix in this scenario is detailed in Figure 4.25 below.
FIGURE 4.25 – Sustainable Growth Scenario: Generation & Demand Background
0102030405060708090
100110120130
2010 2011 2012 2013 2014 2015 2016 2017 2018 2019 2020 2021 2022 2023 2024 2025
GW
Nuclear Coal GasOffshore Transmission Wind Onshore Transmission Wind Other Renew ablesOther Demand
Plant Closures: 11.5 GW of oil and coal fired plant under the Large Combustion Plant Directive by 2015. 2.5 GW of nuclear generation capacity by 2020 (assumes 10 year life extension to AGRs) (with a
further 4.7 GW by 2025). 5.0 GW of gas generation capacity by 2020 (with a further 2.3 GW by 2025 due to age profile and
Industrial Emissions Directive). 15.0 GW of coal generation capacity by 2025 due to age profile and the Industrial Emissions Directive. Significant New Renewable: 22.2 GW of transmission offshore wind generation capacity by 2020 (with a further 22.0 GW
connecting by 2025). 6.9 GW of transmission onshore wind generation capacity by 2020 (with a further 0.7 GW connecting
by 2025). 1.2 GW of transmission marine generation capacity by 2020 (with a further 0.75 GW connecting by
202). Significant New Non Renewable Build: 9.3 GW of new gas generation capacity by 2020 (with a further 1.8 GW connecting by 2025). 2.0 GW of new gas CCS generation capacity by 2025. 3.2 GW of Coal CCS generation capacity by 2020 (with a further 4.3 GW connecting by 2025). 2.9 GW of new nuclear generation capacity by 2020 (with a further 6.1 GW connecting by 2025).
In this scenario, the UK exceeds its European Union 2020 renewable targets. The scenario takes the
Gone Green generation and demand background and replaces the offshore wind generation with
increased build-up rates between 2015 and 2025 which will encourage the establishment of a long-term
manufacturing industry within the UK.
Table 4.4 compares the renewable share of generation energy, as depicted by the Sustainable Growth
scenario, against the assumed 2020 renewable electricity contribution (as identified by Renewable Energy
Strategy) for 2020 and 2025.
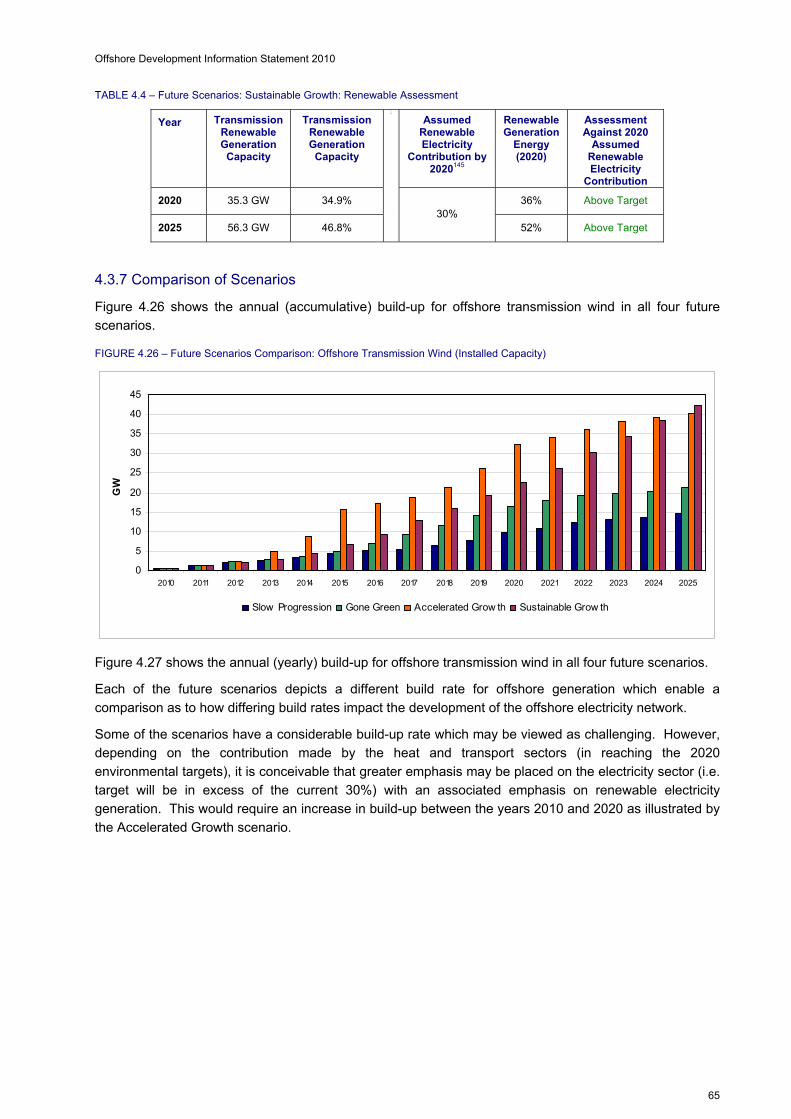
Offshore Development Information Statement 2010
65
TABLE 4.4 – Future Scenarios: Sustainable Growth: Renewable Assessment
Year Transmission Renewable Generation
Capacity
Transmission Renewable Generation
Capacity
Assumed Renewable Electricity
Contribution by 2020145
Renewable Generation
Energy (2020)
Assessment Against 2020
Assumed Renewable Electricity
Contribution
2020 35.3 GW 34.9% 36% Above Target
2025 56.3 GW 46.8%
52%
30% 52% Above Target
4.3.7 Comparison of Scenarios
Figure 4.26 shows the annual (accumulative) build-up for offshore transmission wind in all four future
scenarios.
FIGURE 4.26 – Future Scenarios Comparison: Offshore Transmission Wind (Installed Capacity)
0
5
10
15
20
25
30
35
40
45
2010 2011 2012 2013 2014 2015 2016 2017 2018 2019 2020 2021 2022 2023 2024 2025
GW
Slow Progression Gone Green Accelerated Grow th Sustainable Grow th
Figure 4.27 shows the annual (yearly) build-up for offshore transmission wind in all four future scenarios.
Each of the future scenarios depicts a different build rate for offshore generation which enable a
comparison as to how differing build rates impact the development of the offshore electricity network.
Some of the scenarios have a considerable build-up rate which may be viewed as challenging. However,
depending on the contribution made by the heat and transport sectors (in reaching the 2020
environmental targets), it is conceivable that greater emphasis may be placed on the electricity sector (i.e.
target will be in excess of the current 30%) with an associated emphasis on renewable electricity
generation. This would require an increase in build-up between the years 2010 and 2020 as illustrated by
the Accelerated Growth scenario.
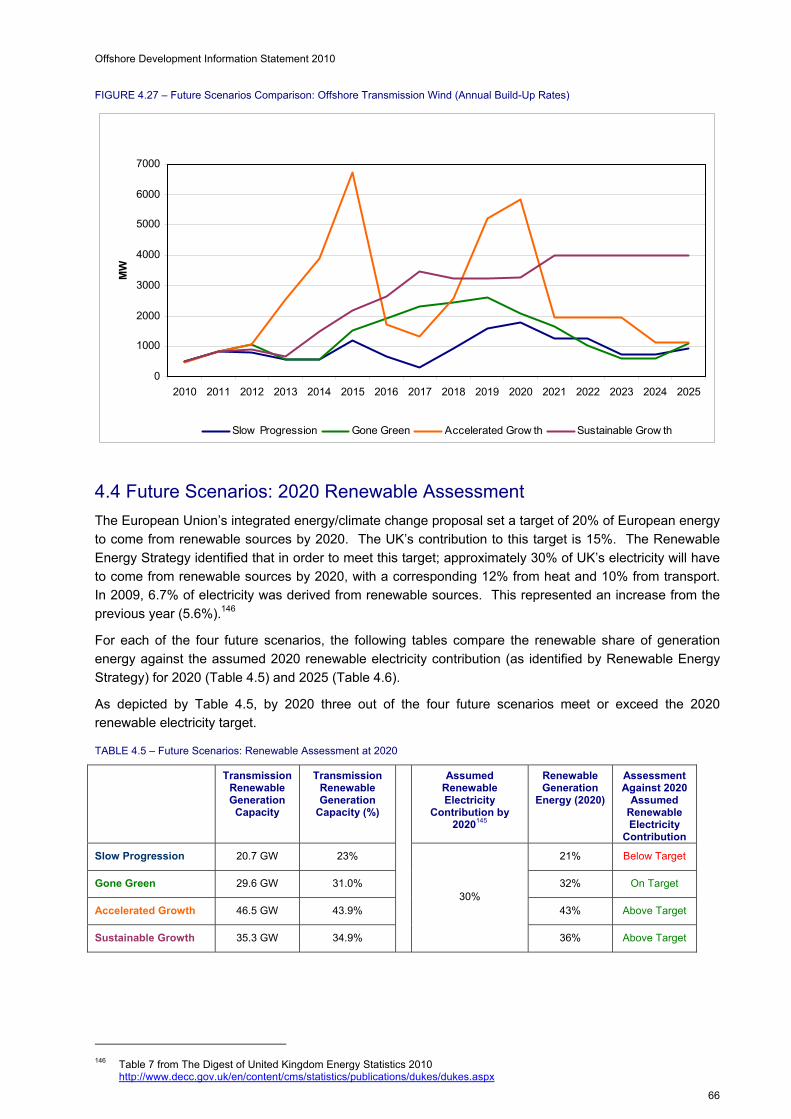
Offshore Development Information Statement 2010
66
FIGURE 4.27 – Future Scenarios Comparison: Offshore Transmission Wind (Annual Build-Up Rates)
0
1000
2000
3000
4000
5000
6000
7000
2010 2011 2012 2013 2014 2015 2016 2017 2018 2019 2020 2021 2022 2023 2024 2025
MW
Slow Progression Gone Green Accelerated Grow th Sustainable Grow th
4.4 Future Scenarios: 2020 Renewable Assessment
The European Union’s integrated energy/climate change proposal set a target of 20% of European energy
to come from renewable sources by 2020. The UK’s contribution to this target is 15%. The Renewable
Energy Strategy identified that in order to meet this target; approximately 30% of UK’s electricity will have
to come from renewable sources by 2020, with a corresponding 12% from heat and 10% from transport.
In 2009, 6.7% of electricity was derived from renewable sources. This represented an increase from the
previous year (5.6%).146
For each of the four future scenarios, the following tables compare the renewable share of generation
energy against the assumed 2020 renewable electricity contribution (as identified by Renewable Energy
Strategy) for 2020 (Table 4.5) and 2025 (Table 4.6).
As depicted by Table 4.5, by 2020 three out of the four future scenarios meet or exceed the 2020
renewable electricity target.
TABLE 4.5 – Future Scenarios: Renewable Assessment at 2020
Transmission Renewable Generation
Capacity
Transmission Renewable Generation
Capacity (%)
Assumed Renewable Electricity
Contribution by 2020145
Renewable Generation
Energy (2020)
Assessment Against 2020
Assumed Renewable Electricity
Contribution
Slow Progression 20.7 GW 23% 21% Below Target
Gone Green 29.6 GW 31.0% 32% On Target
Accelerated Growth 46.5 GW 43.9% 43% Above Target
Sustainable Growth 35.3 GW 34.9%
30%
36% Above Target
146 Table 7 from The Digest of United Kingdom Energy Statistics 2010 http://www.decc.gov.uk/en/content/cms/statistics/publications/dukes/dukes.aspx

Offshore Development Information Statement 2010
67
Table 4.6 illustrates that by 2025, there continues to be an increase in amount of renewable generation
energy produced in each of the future scenarios with Slow Progression nearly reaching the 2020
renewable electricity contribution target.
TABLE 4.6 – Future Scenarios: Renewable Assessment at 2025
Transmission Renewable Generation
Capacity
% Transmission Renewable Generation
Capacity
Assumed Renewable Electricity
Contribution by 2020145
Renewable Generation
Energy (2020)
Assessment Against 2020
Assumed Renewable Electricity
Contribution
Slow Progression 26.9 GW 28.8% 28% Below Target
Gone Green 36.3 GW 35.8% 37% Above Target
Accelerated Growth 57.3 GW 47.9% 50% Above Target
Sustainable Growth 56.3 GW 46.8%
30%
52% Above Target
4.5 Additional Sensitivities
4.5.1 Additional Regional Capacity Sensitivity
This sensitivity has been developed using the offshore development announcements by The Crown
Estate, DECC and the Scottish Government regarding seabed allocations for wind and marine
generation. This equates to approximately 55 GW of offshore generation capacity with all the projects
included at their total potential generation capacity e.g. Dogger Bank will be analysed at its full potential
capacity of 12,800MW.
The sensitivity will exclude projects which have been officially cancelled by the developer e.g. offshore
wind farm Round 1 Projects: Cromer, Scarweather Sands, Shell Flats. The ARC sensitivity makes no
assumptions regarding any future announcement by The Crown Estate and/or DECC/Scottish
Government regarding future leasing allocation rounds for wind and marine generation. It is noted that
the Scottish Government has issued a consultation identifying a further 25 potential zones which may
result in further leasing rounds being announced and facilitated by The Crown Estate in due course125.
The ARC will enable an examination of the potential local investment that may be required in the different
geographic regions, if all the offshore generation capacity in that area connected to the electricity
network. Identifying the different levels of potential capacity that could be developed in each of the
regions enables NGET to assess a number of different scenarios and investment options that may not be
covered directly by the four future scenarios detailed in this document. This should also assist
developers in identifying the maximum capabilities and requirements in different geographic regions.
Unlike the four main future scenarios, the ARC does not have a corresponding generation and demand
background. In addition, no assumptions have been made regarding the associated connection dates,
planning permission, supply chain and technology requirements etc which may impact the completion
and connection of the installed generation capacity identified and analysed.
Chapter 5 contains the illustrative offshore network designs and local onshore transmission
reinforcements that are adequate to cater for the ARC of offshore generation in the geographic regions.
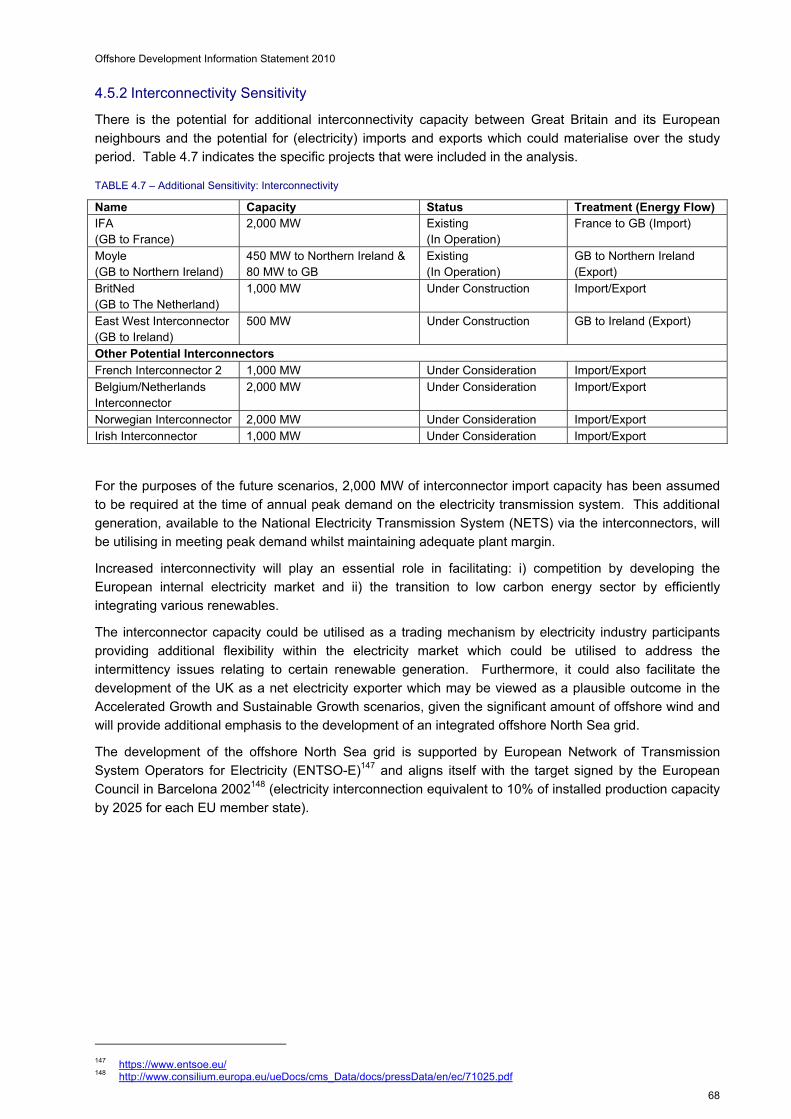
Offshore Development Information Statement 2010
68
4.5.2 Interconnectivity Sensitivity
There is the potential for additional interconnectivity capacity between Great Britain and its European
neighbours and the potential for (electricity) imports and exports which could materialise over the study
period. Table 4.7 indicates the specific projects that were included in the analysis.
TABLE 4.7 – Additional Sensitivity: Interconnectivity
Name Capacity Status Treatment (Energy Flow) IFA (GB to France)
2,000 MW Existing (In Operation)
France to GB (Import)
Moyle (GB to Northern Ireland)
450 MW to Northern Ireland & 80 MW to GB
Existing (In Operation)
GB to Northern Ireland (Export)
BritNed (GB to The Netherland)
1,000 MW Under Construction Import/Export
East West Interconnector (GB to Ireland)
500 MW Under Construction GB to Ireland (Export)
Other Potential Interconnectors French Interconnector 2 1,000 MW Under Consideration Import/Export Belgium/Netherlands Interconnector
2,000 MW Under Consideration Import/Export
Norwegian Interconnector 2,000 MW Under Consideration Import/Export Irish Interconnector 1,000 MW Under Consideration Import/Export
For the purposes of the future scenarios, 2,000 MW of interconnector import capacity has been assumed
to be required at the time of annual peak demand on the electricity transmission system. This additional
generation, available to the National Electricity Transmission System (NETS) via the interconnectors, will
be utilising in meeting peak demand whilst maintaining adequate plant margin.
Increased interconnectivity will play an essential role in facilitating: i) competition by developing the
European internal electricity market and ii) the transition to low carbon energy sector by efficiently
integrating various renewables.
The interconnector capacity could be utilised as a trading mechanism by electricity industry participants
providing additional flexibility within the electricity market which could be utilised to address the
intermittency issues relating to certain renewable generation. Furthermore, it could also facilitate the
development of the UK as a net electricity exporter which may be viewed as a plausible outcome in the
Accelerated Growth and Sustainable Growth scenarios, given the significant amount of offshore wind and
will provide additional emphasis to the development of an integrated offshore North Sea grid.
The development of the offshore North Sea grid is supported by European Network of Transmission
System Operators for Electricity (ENTSO-E)147 and aligns itself with the target signed by the European
Council in Barcelona 2002148 (electricity interconnection equivalent to 10% of installed production capacity
by 2025 for each EU member state).
147 https://www.entsoe.eu/ 148 http://www.consilium.europa.eu/ueDocs/cms_Data/docs/pressData/en/ec/71025.pdf

Offshore Development Information Statement 2010
69
Chapter Five 5 Offshore and Associated Onshore Connection Design
5.1 Overview
Chapter 1 has given a brief insight on how legislation, government incentives and connection processes
work together in simulating the connection of offshore generators. This chapter presents options for the
connection of offshore generation to the Main Interconnected Transmission System (MITS) giving due
consideration to the information presented in the previous chapters, particularly the various future
scenarios described in Chapter 4.
This chapter will provide an insight into the potential offshore transmission infrastructure required to
securely and reliably connect offshore generators to the MITS together with the necessary onshore
reinforcements required to maintain network security and quality of supply compliance. The chapter does
not cover sub-transmission connections other than showing the nearest affected Grid Entry Point.
As already established in previous chapters, the offshore regime includes Rounds 1, 2, 3 and Scottish
Territorial Waters projects. Many of the early projects in Round 1 and 2 are already well developed in
terms of design, with many of the sites under construction or in operation and therefore fall outside the
scope of this chapter. There are a number of potential connection options for each project and this greatly
influences the onshore network design, with a range of viable options discussed in this document.
The contracted background of all generation connection agreements with NGET can be found in the
Transmission Entry Capacity Register (TEC)149.
5.1.1 Figures and Illustrative Diagrams
The indicative system connection works shown in this document have been identified, via a desktop study
process, purely for analysis and have been included for illustrative purposes only. They should not be
considered as implying actual future connection routes for new infrastructure. Detailed studies and
consultations are required to establish the most appropriate type and location of system connection.
5.1.2 Planning Act 2008
The Planning Act 2008150 was granted Royal Assent on 26 November 2008 and established a new
decision-making body, the Infrastructure Planning Commission (IPC)151 and a new consenting process for
nationally significant infrastructure projects (NSIPs) in England and Wales.
The new Government has confirmed its commitment to an efficient and democratically accountable
process for major infrastructure projects. It aims to bring forward legislation in 2011 to replace the IPC,
whilst retaining its expertise and processes within a new Major Infrastructure Planning Unit (MIPU) within
the Planning Inspectorate152. The MIPU will consider and make recommendations on NSIP proposals,
with the relevant Secretaries of State responsible for deciding whether consent should be granted.
The new requirements apply to major energy generation, energy infrastructure in the form of overhead
lines and pipelines over certain thresholds, as well as railways, ports, major roads, airports and water and
waste infrastructure. National policy will be set out by Ministers in a series of National Policy Statements
(NPS’s). The Act also imposes requirements on project promoters to consult affected parties and local
communities prior to submitting an application and promoters are encouraged to do so early when
developing proposals so as to allow projects to be shaped and influenced by consultation feedback.
149 http://www.nationalgrid.com/uk/Electricity/GettingConnected/ContractedGenerationInformation/TransmissionEntryCapacityRegister/ 150 http://www.legislation.gov.uk/ukpga/2008/29/contents 151 http://infrastructure.independent.gov.uk/ 152 http://www.planning-inspectorate.gov.uk/pins/news_notices/whats_new/infrastructure_ministerial_statement.pdf

Offshore Development Information Statement 2010
70
The Act sets out mandatory pre-application procedures which includes notification, consultation and
publicity requirements. NGET is committed to meeting and if appropriate exceeding the requirements of
the Planning Act 2008 and will engage and consult affected parties in the development of its projects,
demonstrating how local communities’ and other stakeholders’ views have been taken into consideration.
Our commitments in this regard are described in more detail in our Stakeholder Community & Amenity
Policy153 which also outlines how we seek to meet our statutory responsibilities under Schedule 9 of the
Electricity Act 1989154: to have regard to the preservation of amenity in the local area.
5.1.3 Technology
For more detailed explanations of offshore network design methodology and offshore transmission
technologies please refer to appendix 3 and 4 respectively.
The ongoing development of high voltage equipment technologies, such as subsea cables and converter
stations, means that energy transfer capability is continuously improving. For example, it is now feasible to
develop an offshore converter station with a capacity in the region of 1000 MW. Within the next few years
it is anticipated that the technology will have progressed to the extent that 2000 MW capacity is
achievable.
As part of this Statement, the relevant offshore transmission technologies have been further reviewed
from the previous statement and the indicative offshore transmission network designs updated. The
findings of the technology review are included in Appendix 4. This includes data on the background
capabilities, cost and dependencies, etc of various offshore transmission technologies.
In principle, there are no anticipated technical barriers to deploying the proposed connection designs.
Although voltage/power ratings are in excess of those presently installed, these are achievable through
incremental development rather than requiring an innovation step change. Detail on potential connection
design types is included within Appendix 3.
5.2 Onshore/Offshore Design
This section considers the offshore and associated onshore connection works required to provide licence
compliant connection to the MITS. The indicative offshore and onshore designs have been developed
with sufficient capability to accept the full generation capacity whilst ensuring compliance with the National
Electricity Transmission System Security and Quality of Supply Standard (NETS SQSS). Wider onshore
transmission system requirements are discussed in Chapter 6.
As an expansion of the previous statement, three different development strategies have been prepared to
demonstrate how different technology and topology assumptions can have an impact upon the optimum
offshore transmission network. The three different design strategies presented are:
Radial Strategy – Point-to-point connections from the offshore generation to suitable onshore MITS
collector substations using current transmission technology.
Radial Plus Strategy – Similar to radial in the use of point to point connections for connecting the
offshore generation to the onshore MITS but utilising anticipated future transmission technology capability
within the strategy (e.g. 2 GW capacity converter stations and high capacity offshore cables) in line with
delivery forecasts for the next five years. Radial Plus also differs from the Radial Strategy in that multiple
groups of offshore generation are connected to the radial point-to-point connections as opposed to a
single group being connected radially.
Integrated Strategy – An interconnected offshore design using AC cable and HVDC interconnection
between offshore platforms and development areas, using the same advanced technology as with the
Radial Plus Strategy. Multiple offshore platforms will be interconnected, providing fewer cables and
reduced asset volumes. The first HVDC cables laid would be of 2 GW size in preparation for the
153 http://www.nationalgrid.com/NR/rdonlyres/21448661-909B-428D-86F0-2C4B9554C30E/39991/SCADocument6_2_Final_24_2_13.pdf 154 http://www.nationalgrid.com/uk/LandandDevelopment/SC/Responsibilities/

Offshore Development Information Statement 2010
71
Radial
Radial Plus
Integrated
Stage 1 Stage 2 Stage 3 Stage 4
Legend: 1GW Wind Farm Array
HVDC platform and cable
AC platform and cable
subsequent stages saving on laying multiple cables of different sizes. More efficient coordination between
onshore and offshore networks is also made possible.
Figure 5.1 shows how the different design strategies affect the design of an example 4 GW offshore wind
farm development. The staging shows how each strategy may develop as each gigawatt of the project
connects.
It can be seen from the integrated strategy that from the second stage, there is interconnection between
the offshore platforms so for the loss of any single cable there is still a path back to shore. While there
may not be sufficient transmission capacity to accommodate the full generation output following an
outage, there should be enough to cover the majority given the reduced load factors of wind generation.
FIGURE 5.1 – Design Strategies Configurations
In addition to local offshore interconnection, the larger offshore generation areas within reasonable
distance from each other may offer interconnection opportunities and share onshore collector substation
capacity.
Where areas are interconnected, there will be power flow interaction and with the use of HVDC
technology, there may be the opportunity to control and manage those power flows. With the management
of an integrated offshore transmission system, the power injections into the onshore transmission system
may also be controlled and possibly alleviate the need for some onshore reinforcements.
In order to illustrate the possible offshore connection options, the country has been split into a number of
regions so each region can be shown in more detail. The developments along the east coast are very
interactive and it should be noted that the transmission works extend from one region to the next.
Figure 5.2a and 5.2b show how the regions have been assigned and show an overview geographical map
for the Radial and Integrated strategies.

Offshore Development Information Statement 2010
72
FIGURE 5.2a - Radial Strategy Overview
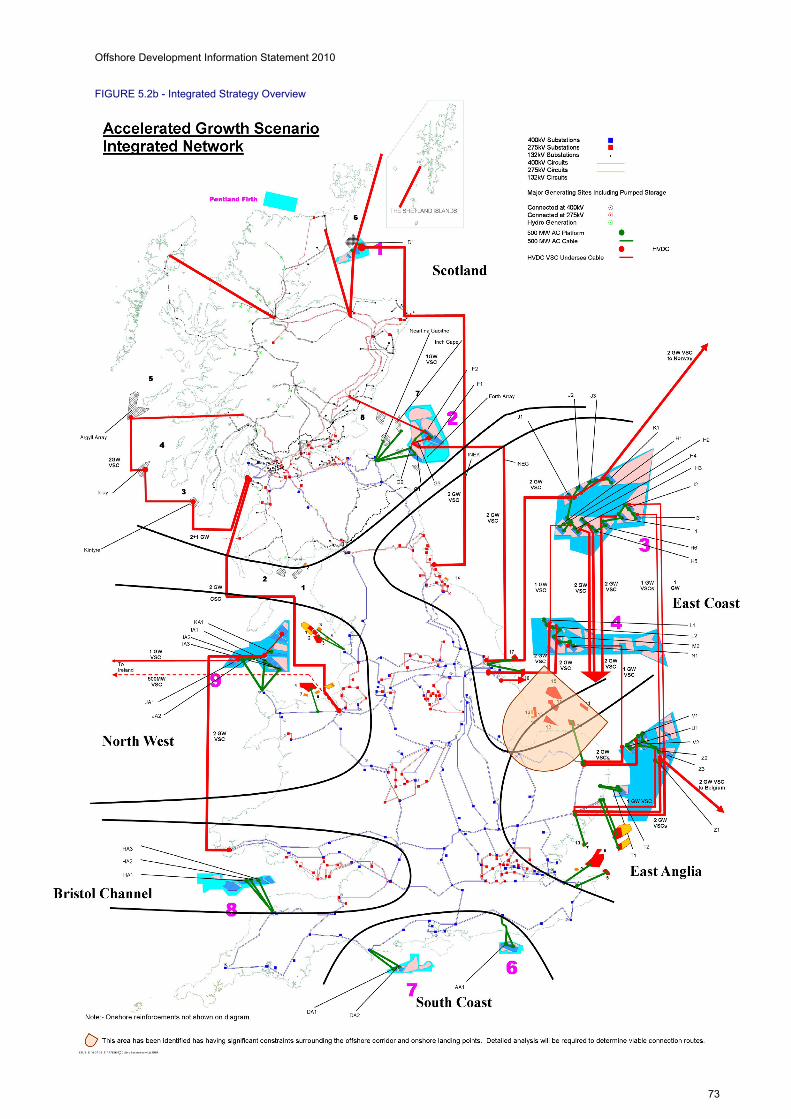
Offshore Development Information Statement 2010
73
FIGURE 5.2b - Integrated Strategy Overview
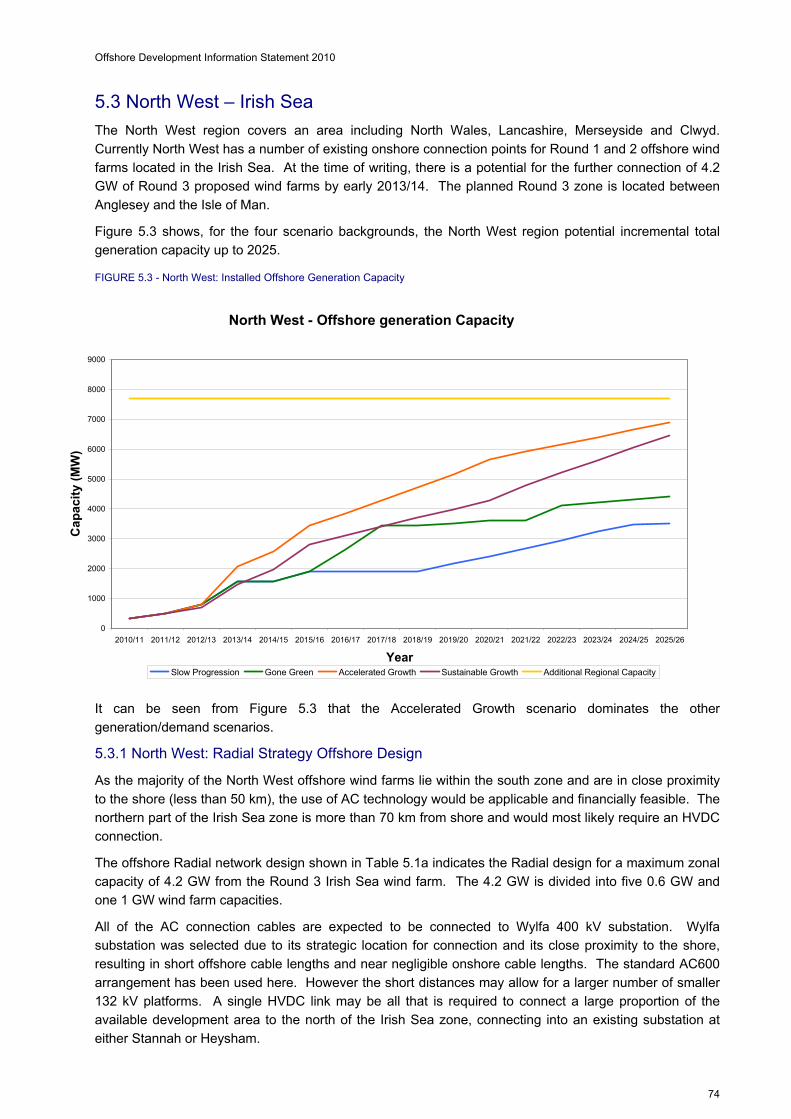
Offshore Development Information Statement 2010
74
5.3 North West – Irish Sea
The North West region covers an area including North Wales, Lancashire, Merseyside and Clwyd.
Currently North West has a number of existing onshore connection points for Round 1 and 2 offshore wind
farms located in the Irish Sea. At the time of writing, there is a potential for the further connection of 4.2
GW of Round 3 proposed wind farms by early 2013/14. The planned Round 3 zone is located between
Anglesey and the Isle of Man.
Figure 5.3 shows, for the four scenario backgrounds, the North West region potential incremental total
generation capacity up to 2025.
FIGURE 5.3 - North West: Installed Offshore Generation Capacity
It can be seen from Figure 5.3 that the Accelerated Growth scenario dominates the other
generation/demand scenarios.
5.3.1 North West: Radial Strategy Offshore Design
As the majority of the North West offshore wind farms lie within the south zone and are in close proximity
to the shore (less than 50 km), the use of AC technology would be applicable and financially feasible. The
northern part of the Irish Sea zone is more than 70 km from shore and would most likely require an HVDC
connection.
The offshore Radial network design shown in Table 5.1a indicates the Radial design for a maximum zonal
capacity of 4.2 GW from the Round 3 Irish Sea wind farm. The 4.2 GW is divided into five 0.6 GW and
one 1 GW wind farm capacities.
All of the AC connection cables are expected to be connected to Wylfa 400 kV substation. Wylfa
substation was selected due to its strategic location for connection and its close proximity to the shore,
resulting in short offshore cable lengths and near negligible onshore cable lengths. The standard AC600
arrangement has been used here. However the short distances may allow for a larger number of smaller
132 kV platforms. A single HVDC link may be all that is required to connect a large proportion of the
available development area to the north of the Irish Sea zone, connecting into an existing substation at
either Stannah or Heysham.
North West - Offshore generation Capacity
0
1000
2000
3000
4000
5000
6000
7000
8000
9000
2010/11 2011/12 2012/13 2013/14 2014/15 2015/16 2016/17 2017/18 2018/19 2019/20 2020/21 2021/22 2022/23 2023/24 2024/25 2025/26
Year
Cap
acit
y (M
W)
Slow Progression Gone Green Accelerated Growth Sustainable Growth Additional Regional Capacity
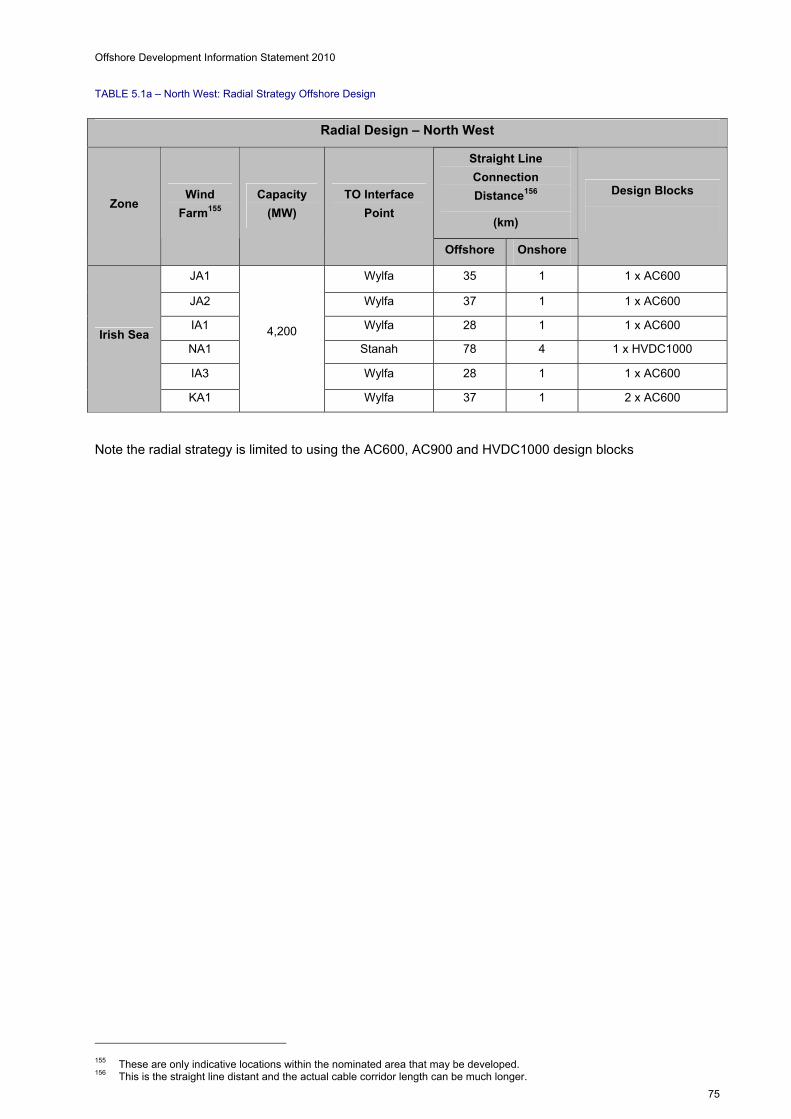
Offshore Development Information Statement 2010
75
TABLE 5.1a – North West: Radial Strategy Offshore Design
Note the radial strategy is limited to using the AC600, AC900 and HVDC1000 design blocks
155 These are only indicative locations within the nominated area that may be developed. 156 This is the straight line distant and the actual cable corridor length can be much longer.
Radial Design – North West
Straight Line
Connection
Distance156
(km)
Zone Wind
Farm155
Capacity
(MW)
TO Interface
Point
Offshore Onshore
Design Blocks
JA1 Wylfa 35 1 1 x AC600
JA2 Wylfa 37 1 1 x AC600
IA1 Wylfa 28 1 1 x AC600
NA1 Stanah 78 4 1 x HVDC1000
IA3 Wylfa 28 1 1 x AC600
Irish Sea
KA1
4,200
Wylfa 37 1 2 x AC600
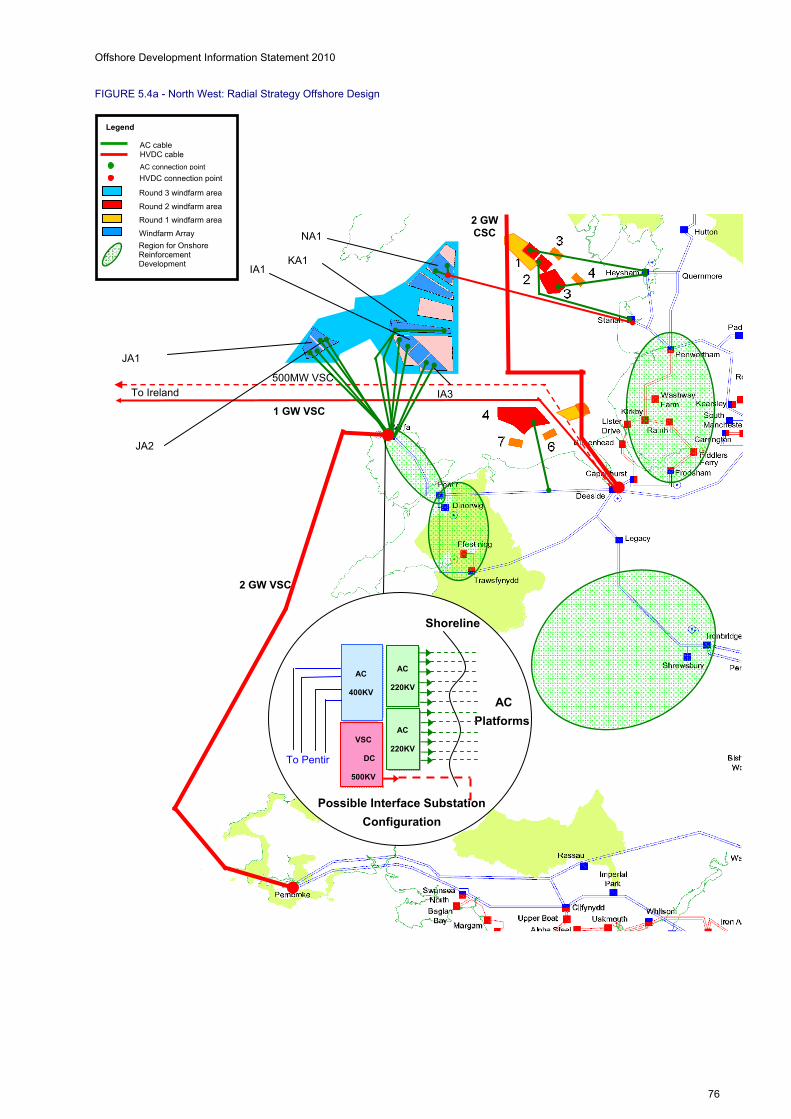
Offshore Development Information Statement 2010
76
FIGURE 5.4a - North West: Radial Strategy Offshore Design
KA1
NA1
IA1
2 GW VSC
2 GW CSC
AC
400KV
AC
220KV
Shoreline
AC
Platforms
Possible Interface Substation
Configuration
To Pentir
AC
220KVVSC
��DC
500KV
To Ireland
JA2
IA3
JA1
1 GW VSC
500MW VSC
Legend
AC cable HVDC cable
AC connection point
HVDC connection point
Round 3 windfarm area
Round 2 windfarm area
Round 1 windfarm area
Windfarm Array
Region for Onshore Reinforcement Development

Offshore Development Information Statement 2010
77
5.3.2 North West: Radial Plus Strategy Offshore Design
The Radial Plus strategy offers some advantage over the Radial strategy by using fewer high capacity AC
cables thereby reducing the overall expected capital expenditure. The Radial Plus design does however
require an additional offshore platform and puts more capacity at risk from the loss of any one cable.
Table 5.1b shows the Radial Plus design which is very similar to that of the Radial Strategy. In this design
Wylfa also acts as the onshore connection point for the whole 4.2 GW of capacity to be transferred
onshore. From Wylfa, significant reinforcement including an HVDC interconnection to South Wales will be
required to accommodate the full generation capacity that could connect.
TABLE 5.1b – North West: Radial Plus Strategy Offshore Design
Note the Radial Plus and Integrated strategies assume the future availability of larger capacity cables and
HVDC converters allowing the use of AC500 and HVDC2000 design blocks.
157 These are only indicative locations within the nominated area that may be developed. 158 This is the straight line distant and the actual cable corridor length can be much longer.
Radial Plus Design - North West
Straight Line
Connection
Distance158
(km)
Zone Wind
Farm157
Capacity
(MW)
TO Interface
Point
Offshore Onshore
Design Blocks
JA1 Wylfa 35 1 1 x AC500
JA2 Wylfa 37 1 1 x AC500
IA1 Wylfa 28 1 1 x AC500
NA1 Stanah 78 4 1 x HVDC1000
IA3 Wylfa 28 1 1 x AC500
Irish Sea
KA1
4,200
Wylfa 37 1 2 x AC600

Offshore Development Information Statement 2010
78
FIGURE 5.4b - North West: Radial Plus Offshore Design
To Ireland
JA2
KA1
NA1
IA3
JA1
IA1
2 GW VSC
2 GW CSC
1 GW VSC
500MW VSC
AC
400KV
AC
220KV
Shoreline
AC
Platforms
Possible Interface Substation
Configuration
To Pentir
AC
220KVVSC
HVDC
500KV
Legend
AC cable HVDC cable
AC connection point
HVDC connection point
Round 3 windfarm area
Round 2 windfarm area
Round 1 windfarm area
Windfarm Array
Region for Onshore Reinforcement Development
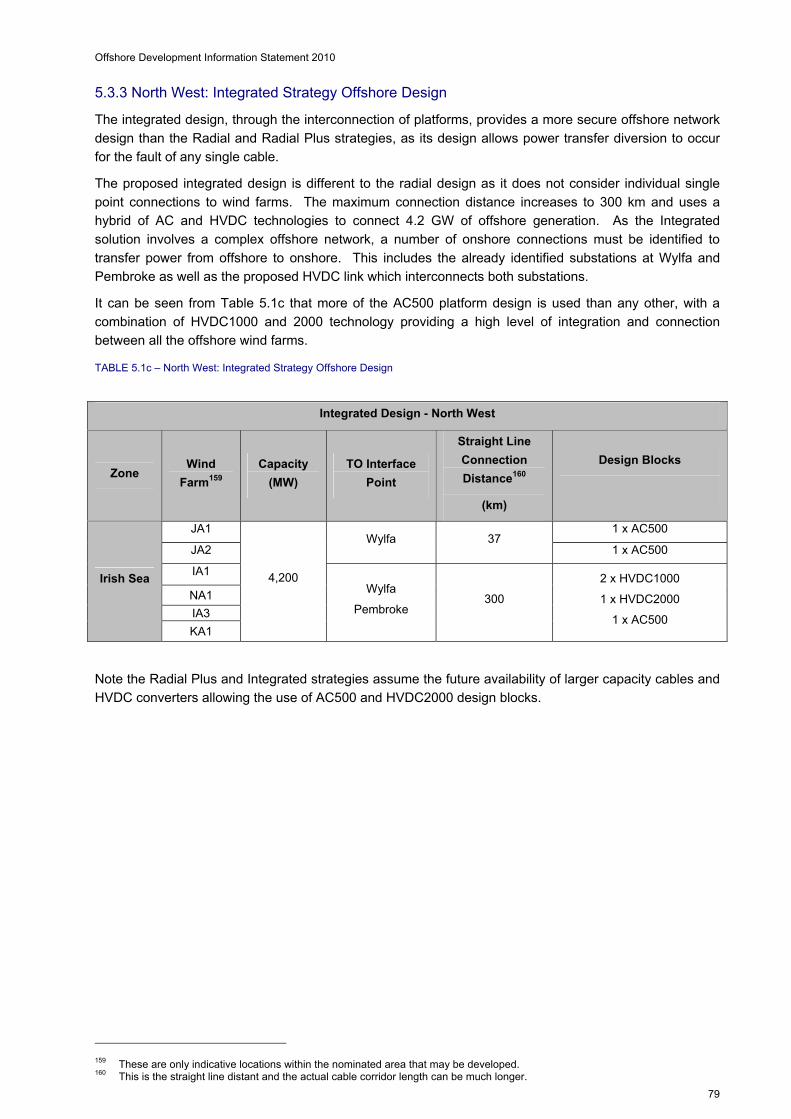
Offshore Development Information Statement 2010
79
5.3.3 North West: Integrated Strategy Offshore Design
The integrated design, through the interconnection of platforms, provides a more secure offshore network
design than the Radial and Radial Plus strategies, as its design allows power transfer diversion to occur
for the fault of any single cable.
The proposed integrated design is different to the radial design as it does not consider individual single
point connections to wind farms. The maximum connection distance increases to 300 km and uses a
hybrid of AC and HVDC technologies to connect 4.2 GW of offshore generation. As the Integrated
solution involves a complex offshore network, a number of onshore connections must be identified to
transfer power from offshore to onshore. This includes the already identified substations at Wylfa and
Pembroke as well as the proposed HVDC link which interconnects both substations.
It can be seen from Table 5.1c that more of the AC500 platform design is used than any other, with a
combination of HVDC1000 and 2000 technology providing a high level of integration and connection
between all the offshore wind farms.
TABLE 5.1c – North West: Integrated Strategy Offshore Design
Note the Radial Plus and Integrated strategies assume the future availability of larger capacity cables and
HVDC converters allowing the use of AC500 and HVDC2000 design blocks.
159 These are only indicative locations within the nominated area that may be developed. 160 This is the straight line distant and the actual cable corridor length can be much longer.
Integrated Design - North West
Zone Wind
Farm159
Capacity
(MW)
TO Interface
Point
Straight Line
Connection
Distance160
(km)
Design Blocks
JA1 1 x AC500
JA2 Wylfa 37
1 x AC500
IA1
NA1
IA3
Irish Sea
KA1
4,200 Wylfa
Pembroke 300
2 x HVDC1000
1 x HVDC2000
1 x AC500
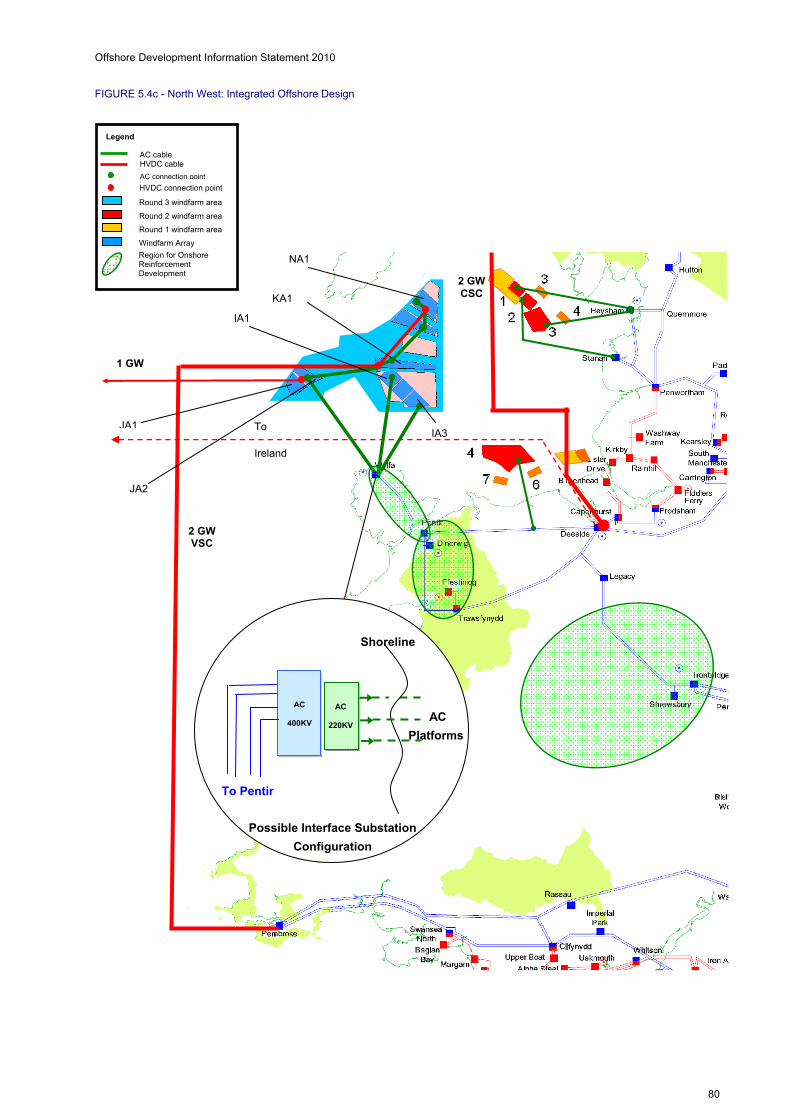
Offshore Development Information Statement 2010
80
FIGURE 5.4c - North West: Integrated Offshore Design
To
Ireland
1 GW
JA2
KA1
IA3 JA1
IA1
2 GW CSC
AC
400KV
AC
220KV
Shoreline
AC
Platforms
Possible Interface Substation
Configuration
To Pentir
2 GW VSC
NA1
Legend
AC cable HVDC cable
AC connection point
HVDC connection point
Round 3 windfarm area
Round 2 windfarm area
Round 1 windfarm area
Windfarm Array
Region for Onshore Reinforcement Development

Offshore Development Information Statement 2010
81
5.3.4 North West: Onshore Transmission Design
The 2010 primary network found in the North West currently consists of a number of 400 kV circuits:
double circuit from Deeside to Wylfa via Pentir and a single circuit from Pentir to Trawsfynydd with a Tee
point to Legacy. The majority of the loading of these circuits is principally due to the nuclear power station
at Wylfa and the pumped storage stations at Dinorwig and Ffestiniog. It is expected that an additional 3.6
GW of power could flow through these circuits due to the replacement of the nuclear generator at Wylfa.
Due to the large increase in power export from north Wales, reinforcements will be required which could in
part consist of a second double circuit from Wylfa to Pentir along with an additional new circuit from Pentir
to Trawsfynydd. These two reinforcements will help cater for the new nuclear generator at Wylfa as well
as the offshore wind farms.
Deeside has also been considered as a possible connection site for further offshore generation. However
existing planned developments at Deeside already include HVDC links to Ireland and the Scottish West
Coast which may limit the site of any further development.
All the strategies call for the use of a 2 GW HVDC link from the North West region to Pembroke. The
integrated strategy suggests that the HVDC link be directly fed from the Irish Sea Round 3 offshore wind
farm to Pembroke. The Radial and Radial Plus strategies suggest a 2 GW HVDC link from Wylfa to
Pembroke as a solution. The major difference between the Radial and Integrated strategies is that the
radial strategy would need additional HVDC converters on Anglesey to receive the power from the wind
farm and then resend much of it out again to Pembroke. Having the HVDC link terminating offshore within
the wind farm would allow some of the power to bypass Anglesey and the North Wales transmission
system, significantly reducing volume of assets and increasing resilience of offshore wind generation
points.
Table 5.1d shows the reinforcements likely to develop up to 2030, enabling the network to cater for the
onshore and offshore generation in North West.
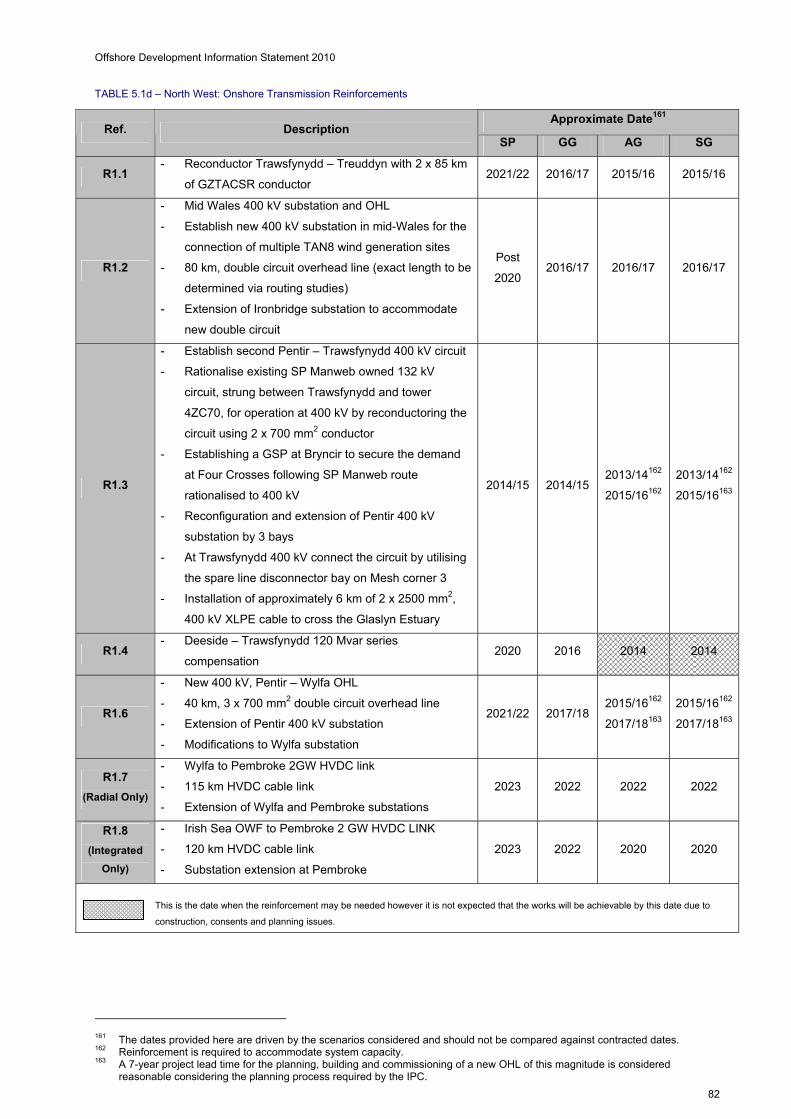
Offshore Development Information Statement 2010
82
TABLE 5.1d – North West: Onshore Transmission Reinforcements
Approximate Date161 Ref. Description
SP GG AG SG
R1.1 - Reconductor Trawsfynydd – Treuddyn with 2 x 85 km
of GZTACSR conductor 2021/22 2016/17 2015/16 2015/16
R1.2
- Mid Wales 400 kV substation and OHL
- Establish new 400 kV substation in mid-Wales for the
connection of multiple TAN8 wind generation sites
- 80 km, double circuit overhead line (exact length to be
determined via routing studies)
- Extension of Ironbridge substation to accommodate
new double circuit
Post
2020 2016/17 2016/17 2016/17
R1.3
- Establish second Pentir – Trawsfynydd 400 kV circuit
- Rationalise existing SP Manweb owned 132 kV
circuit, strung between Trawsfynydd and tower
4ZC70, for operation at 400 kV by reconductoring the
circuit using 2 x 700 mm2 conductor
- Establishing a GSP at Bryncir to secure the demand
at Four Crosses following SP Manweb route
rationalised to 400 kV
- Reconfiguration and extension of Pentir 400 kV
substation by 3 bays
- At Trawsfynydd 400 kV connect the circuit by utilising
the spare line disconnector bay on Mesh corner 3
- Installation of approximately 6 km of 2 x 2500 mm2,
400 kV XLPE cable to cross the Glaslyn Estuary
2014/15 2014/15 2013/14162
2015/16162
2013/14162
2015/16163
R1.4 - Deeside – Trawsfynydd 120 Mvar series
compensation 2020 2016 2014 2014
R1.6
- New 400 kV, Pentir – Wylfa OHL
- 40 km, 3 x 700 mm2 double circuit overhead line
- Extension of Pentir 400 kV substation
- Modifications to Wylfa substation
2021/22 2017/18 2015/16162
2017/18163
2015/16162
2017/18163
R1.7
(Radial Only)
- Wylfa to Pembroke 2GW HVDC link
- 115 km HVDC cable link
- Extension of Wylfa and Pembroke substations
2023
2022
2022
2022
R1.8
(Integrated
Only)
- Irish Sea OWF to Pembroke 2 GW HVDC LINK
- 120 km HVDC cable link
- Substation extension at Pembroke
2023 2022 2020 2020
This is the date when the reinforcement may be needed however it is not expected that the works will be achievable by this date due to
construction, consents and planning issues.
161 The dates provided here are driven by the scenarios considered and should not be compared against contracted dates. 162 Reinforcement is required to accommodate system capacity. 163 A 7-year project lead time for the planning, building and commissioning of a new OHL of this magnitude is considered
reasonable considering the planning process required by the IPC.
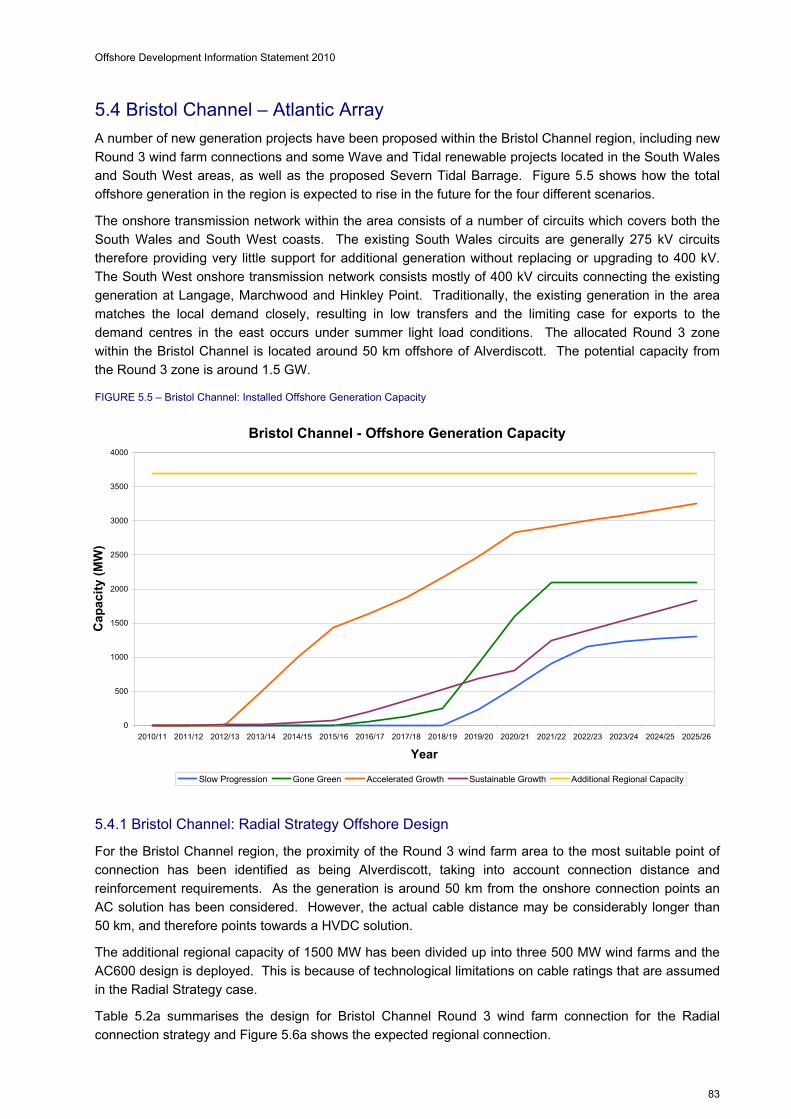
Offshore Development Information Statement 2010
83
Bristol Channel - Offshore Generation Capacity
0
500
1000
1500
2000
2500
3000
3500
4000
2010/11 2011/12 2012/13 2013/14 2014/15 2015/16 2016/17 2017/18 2018/19 2019/20 2020/21 2021/22 2022/23 2023/24 2024/25 2025/26
Year
Cap
acit
y (M
W)
Slow Progression Gone Green Accelerated Growth Sustainable Growth Additional Regional Capacity
5.4 Bristol Channel – Atlantic Array
A number of new generation projects have been proposed within the Bristol Channel region, including new
Round 3 wind farm connections and some Wave and Tidal renewable projects located in the South Wales
and South West areas, as well as the proposed Severn Tidal Barrage. Figure 5.5 shows how the total
offshore generation in the region is expected to rise in the future for the four different scenarios.
The onshore transmission network within the area consists of a number of circuits which covers both the
South Wales and South West coasts. The existing South Wales circuits are generally 275 kV circuits
therefore providing very little support for additional generation without replacing or upgrading to 400 kV.
The South West onshore transmission network consists mostly of 400 kV circuits connecting the existing
generation at Langage, Marchwood and Hinkley Point. Traditionally, the existing generation in the area
matches the local demand closely, resulting in low transfers and the limiting case for exports to the
demand centres in the east occurs under summer light load conditions. The allocated Round 3 zone
within the Bristol Channel is located around 50 km offshore of Alverdiscott. The potential capacity from
the Round 3 zone is around 1.5 GW.
FIGURE 5.5 – Bristol Channel: Installed Offshore Generation Capacity
5.4.1 Bristol Channel: Radial Strategy Offshore Design
For the Bristol Channel region, the proximity of the Round 3 wind farm area to the most suitable point of
connection has been identified as being Alverdiscott, taking into account connection distance and
reinforcement requirements. As the generation is around 50 km from the onshore connection points an
AC solution has been considered. However, the actual cable distance may be considerably longer than
50 km, and therefore points towards a HVDC solution.
The additional regional capacity of 1500 MW has been divided up into three 500 MW wind farms and the
AC600 design is deployed. This is because of technological limitations on cable ratings that are assumed
in the Radial Strategy case.
Table 5.2a summarises the design for Bristol Channel Round 3 wind farm connection for the Radial
connection strategy and Figure 5.6a shows the expected regional connection.
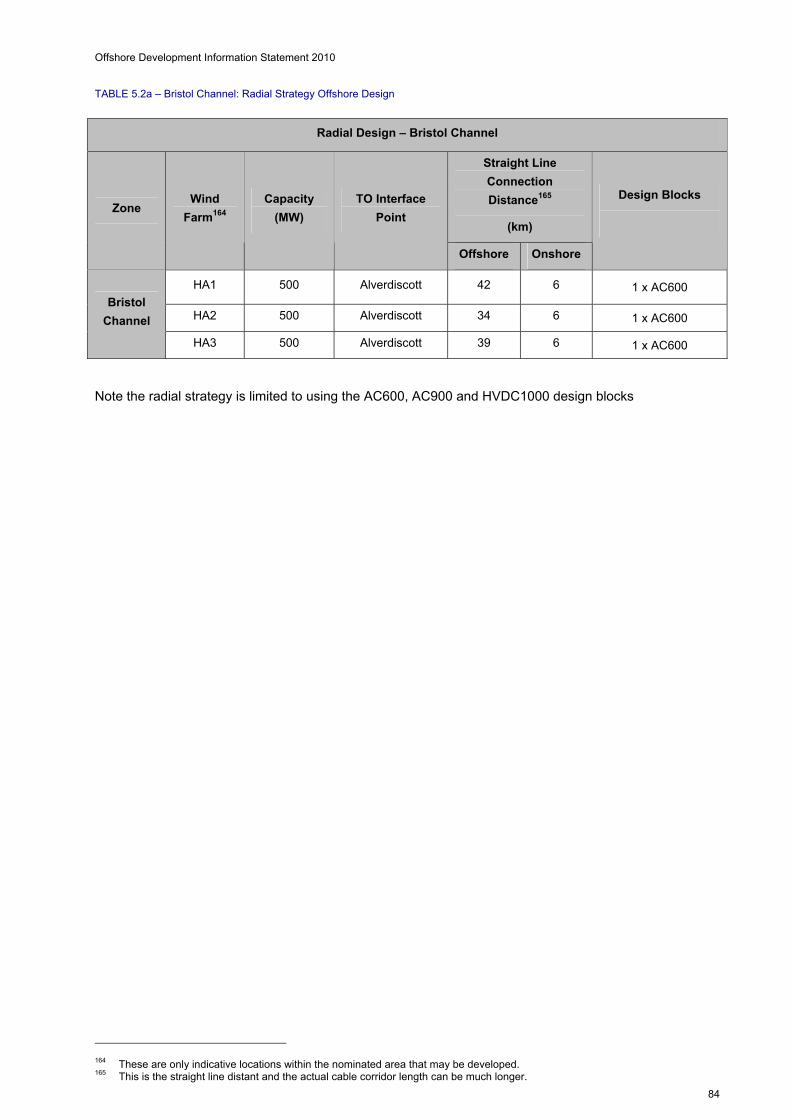
Offshore Development Information Statement 2010
84
TABLE 5.2a – Bristol Channel: Radial Strategy Offshore Design
Note the radial strategy is limited to using the AC600, AC900 and HVDC1000 design blocks
164 These are only indicative locations within the nominated area that may be developed. 165 This is the straight line distant and the actual cable corridor length can be much longer.
Radial Design – Bristol Channel
Straight Line
Connection
Distance165
(km)
Zone Wind
Farm164
Capacity
(MW)
TO Interface
Point
Offshore Onshore
Design Blocks
HA1 500 Alverdiscott 42 6 1 x AC600
HA2 500 Alverdiscott 34 6 1 x AC600 Bristol
Channel
HA3 500 Alverdiscott 39 6 1 x AC600

Offshore Development Information Statement 2010
85
HA3
HA2 HA1
AC
400KV
Possible Interface Substation
Configuration
VSC
HVDC 500kV
To Cllfynydd
To Walham
To Wylfa
AC
400KV
AC
220KV
To Taunton
To Indian Queens
AC
Platforms
Possible Interface Substation
Configuration
Legend
AC cable HVDC cable
AC connection point
HVDC connection point
Round 3 windfarm area
Round 2 windfarm area
Round 1 windfarm area
Windfarm Array
Region for Onshore Reinforcement Development
FIGURE 5.6a – Bristol Channel: Radial Strategy Offshore Design
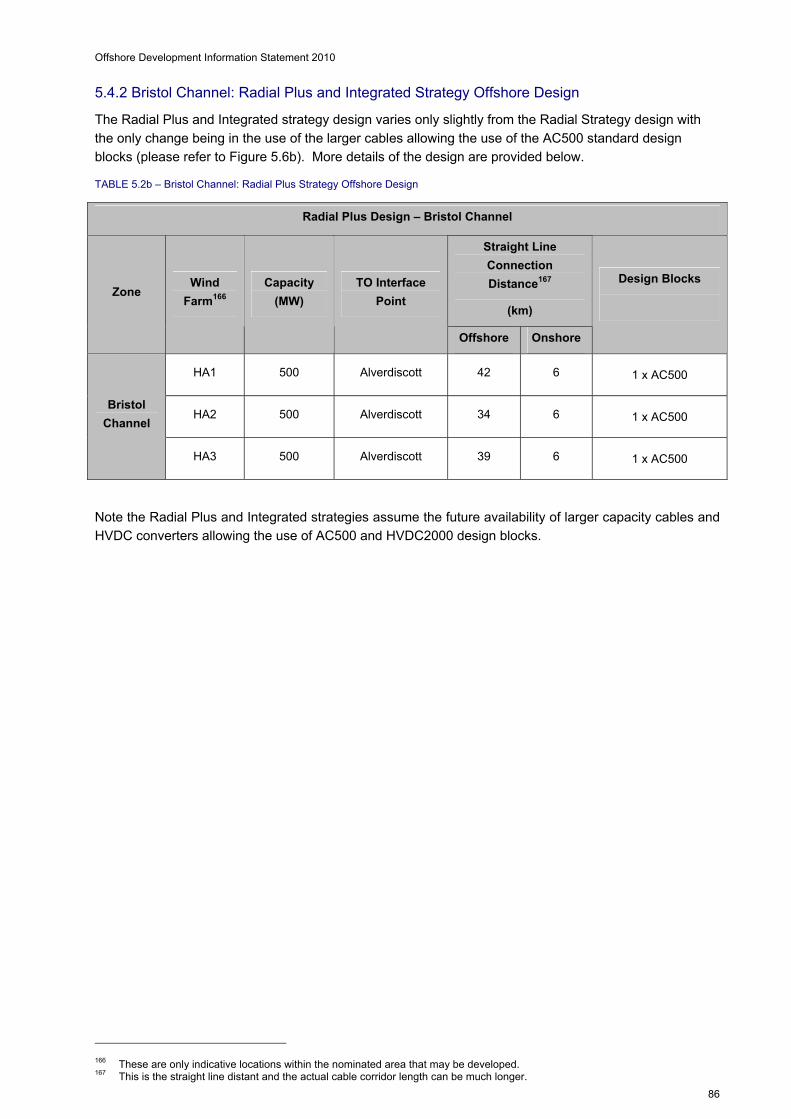
Offshore Development Information Statement 2010
86
5.4.2 Bristol Channel: Radial Plus and Integrated Strategy Offshore Design
The Radial Plus and Integrated strategy design varies only slightly from the Radial Strategy design with
the only change being in the use of the larger cables allowing the use of the AC500 standard design
blocks (please refer to Figure 5.6b). More details of the design are provided below.
TABLE 5.2b – Bristol Channel: Radial Plus Strategy Offshore Design
Note the Radial Plus and Integrated strategies assume the future availability of larger capacity cables and
HVDC converters allowing the use of AC500 and HVDC2000 design blocks.
166 These are only indicative locations within the nominated area that may be developed. 167 This is the straight line distant and the actual cable corridor length can be much longer.
Radial Plus Design – Bristol Channel
Straight Line
Connection
Distance167
(km)
Zone Wind
Farm166
Capacity
(MW)
TO Interface
Point
Offshore Onshore
Design Blocks
HA1 500 Alverdiscott 42 6
1 x AC500
HA2 500 Alverdiscott 34 6
1 x AC500
Bristol
Channel
HA3 500 Alverdiscott 39 6
1 x AC500
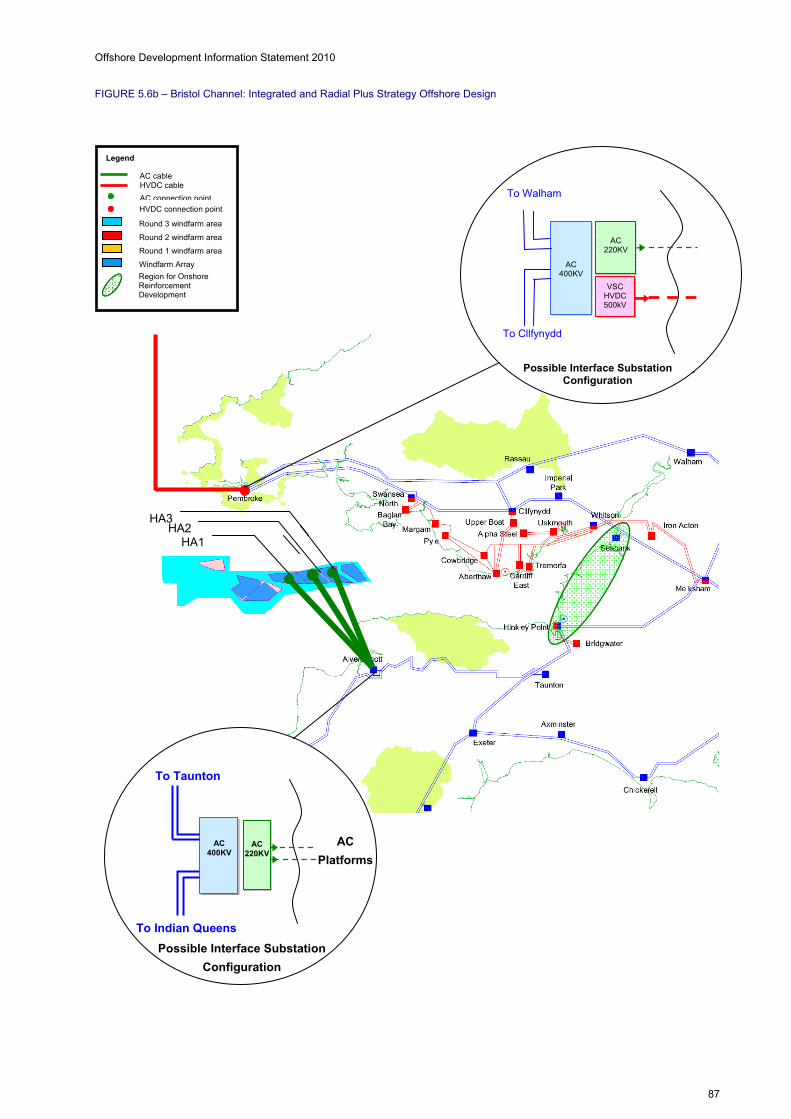
Offshore Development Information Statement 2010
87
FIGURE 5.6b – Bristol Channel: Integrated and Radial Plus Strategy Offshore Design
HA3 HA2
AC 400KV
Possible Interface Substation Configuration
VSC HVDC 500kV
To Cllfynydd
To Walham
AC 220KV
AC 400KV
AC 220KV
To Taunton
To Indian Queens
AC
Platforms
Possible Interface Substation
Configuration
Legend
AC cable HVDC cable
AC connection pointHVDC connection point
Round 3 windfarm area
Round 2 windfarm area
Round 1 windfarm area
Windfarm Array
Region for Onshore Reinforcement Development
HA1
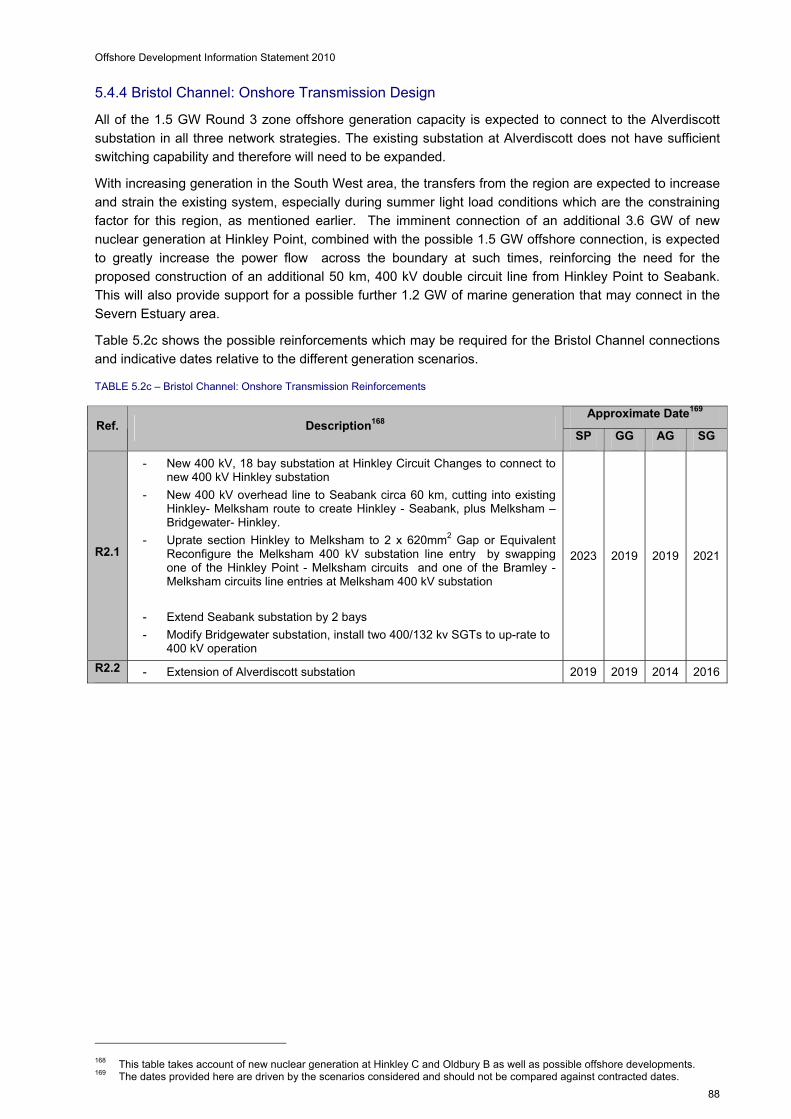
Offshore Development Information Statement 2010
88
5.4.4 Bristol Channel: Onshore Transmission Design
All of the 1.5 GW Round 3 zone offshore generation capacity is expected to connect to the Alverdiscott
substation in all three network strategies. The existing substation at Alverdiscott does not have sufficient
switching capability and therefore will need to be expanded.
With increasing generation in the South West area, the transfers from the region are expected to increase
and strain the existing system, especially during summer light load conditions which are the constraining
factor for this region, as mentioned earlier. The imminent connection of an additional 3.6 GW of new
nuclear generation at Hinkley Point, combined with the possible 1.5 GW offshore connection, is expected
to greatly increase the power flow across the boundary at such times, reinforcing the need for the
proposed construction of an additional 50 km, 400 kV double circuit line from Hinkley Point to Seabank.
This will also provide support for a possible further 1.2 GW of marine generation that may connect in the
Severn Estuary area.
Table 5.2c shows the possible reinforcements which may be required for the Bristol Channel connections
and indicative dates relative to the different generation scenarios.
TABLE 5.2c – Bristol Channel: Onshore Transmission Reinforcements
168 This table takes account of new nuclear generation at Hinkley C and Oldbury B as well as possible offshore developments. 169 The dates provided here are driven by the scenarios considered and should not be compared against contracted dates.
Approximate Date169 Ref. Description168
SP GG AG SG
R2.1
- New 400 kV, 18 bay substation at Hinkley Circuit Changes to connect to new 400 kV Hinkley substation
- New 400 kV overhead line to Seabank circa 60 km, cutting into existing Hinkley- Melksham route to create Hinkley - Seabank, plus Melksham – Bridgewater- Hinkley.
- Uprate section Hinkley to Melksham to 2 x 620mm2 Gap or Equivalent Reconfigure the Melksham 400 kV substation line entry by swapping one of the Hinkley Point - Melksham circuits and one of the Bramley - Melksham circuits line entries at Melksham 400 kV substation
- Extend Seabank substation by 2 bays
- Modify Bridgewater substation, install two 400/132 kv SGTs to up-rate to 400 kV operation
2023 2019 2019 2021
R2.2 - Extension of Alverdiscott substation 2019 2019 2014 2016

Offshore Development Information Statement 2010
89
5.5 South Coast – Hastings and West of Isle of Wight
The major large onshore power stations on the South Coast are Marchwood, Fawley and Dungeness.
These onshore generators tend to balance the local demand such that power flows into and out of the
region are limited. It is important to note that the Interconnector to France, located at Sellindge, can
cause additional demand or provide additional generation support in this region. The existing onshore
electricity transmission system in this region is characterised by a double circuit running from Mannington
substation in the west through Bolney, Ninfield, Dungeness substations to Kemsley substation in the east,
where it splits into further routes.
Figure 5.7 shows the possible increase in offshore generation capacity connecting to the South Coast
region, for the different future scenarios. The potential level of generation connecting to the region is a
maximum of 1.5 GW in the ARC scenario and around 1.3 GW in the Accelerated Growth scenario. The
offshore generation expected in the area is from two Round 3 connections at Hastings offshore wind farm
and West Isle of Wight Offshore wind farm. The limited level of expected generation means that
connection to the existing onshore electricity transmission system in this region is predicted to be less
problematic than elsewhere. Moreover, in this region, the Radial, Radial Plus and Integrated strategies
are similar hence the discussion only expands on the Radial strategy.
FIGURE 5.7 – South Channel: Installed Offshore Generation Capacity
5.5.1 South Coast: Offshore Design
Hasting Offshore Transmission Design
The Round 3 Hastings offshore wind farm is located directly south of Bolney and has a potential
generation capacity of up to 600 MW. Due to its location and the small number of potential connection
substations in the area, the most practical solution would be to connect Hastings to the existing substation
at Bolney. The total onshore and offshore route length is expected to be 36 km. The most cost effective
solution would therefore be a Radial Strategy point to point AC solution. The maximum zonal capacity is
600 MW in the ARC background and around 530 MW in the Accelerated Growth background. This power
could be transmitted to the shore using two 220 kV 3-core submarine cables. The AC600 standard
arrangement could be used for transferring 600 MW of power.
South Coast - Offshore Generation Capacity
0
200
400
600
800
1000
1200
1400
1600
2010/11 2011/12 2012/13 2013/14 2014/15 2015/16 2016/17 2017/18 2018/19 2019/20 2020/21 2021/22 2022/23 2023/24 2024/25 2025/26
Year
Cap
acit
y (M
W)
Slow Progression Gone Green Accelerated Growth Sustainable Growth Additional Regional Capacity

Offshore Development Information Statement 2010
90
An alternative location for the onshore connection was also considered at Ninfield substation but was
discarded on the basis that it is further away from the source of wind generation compared with Bolney,
leading to an increase in transmission asset costs. Table 5.3a shows a general overview and
requirements for the connection of Hastings offshore wind farm.
TABLE 5.3a – Hasting Zone: Possible Offshore Transmission Design
West of Isle of Wight Offshore Transmission Design
Another possible Round 3 offshore wind farm in the South Coast area is the West of Isle of Wight offshore
wind farm. The capacity of the wind farm is expected to be 900 MW and it will be located about 40 km
south of the proposed onshore connection at Chickerell substation. Alternative connection points were
considered, namely the existing onshore substation at Mannington and a new substation between
Chickerell and Mannington on an existing overhead line route.
These alternative connection locations were found to be less attractive, both financially and
environmentally, due to longer cable route lengths coupled with extra costs associated with a new
substation as well as possible disturbances to the coastline between Weymouth and Bournemouth. The
existing robust onshore transmission infrastructure may accommodate the new infeed without further
reinforcements, beyond additional substation bays at the point of connection.
A total connection length of 40 km (36 km offshore and 4 km onshore cables) is anticipated such that a
Radial Strategy point to point AC solution would be the more cost effective technology.
The AC900 standard arrangement could be used, with three 220 kV 3-core submarine cables to transfer
the maximum expected zone capacity of 900 MW to shore. Table 5.3b shows a general overview and
requirements for the connection of West Isle of Wight offshore wind farm.
TABLE 5.3b – West of Isle of Wight: Possible Offshore Transmission Design
170 These are only indicative locations within the nominated area that may be developed. 171 This is the straight line distant and the actual cable corridor length can be much longer. 172 These are only indicative locations within the nominated area that may be developed. 173 This is the straight line distant and the actual cable corridor length can be much longer.
Hastings Possible Design
Straight Line
Connection
Distance171 (km) Zone Wind
Farm170 Capacity (MW) TO Interface Point
Offshore Onshore
Design Blocks
Hastings AA1 600 Bolney 15 21 1 x AC600
West of Isle of Wight Possible Design
Straight Line
Connection
Distances173 (km) Zone Wind
Farm172
Capacity
(MW)
TO Interface
Point
Offshore Onshore
Design
Blocks
West Isle of
Wight DA1 & DA2 900 Chickerell 36 4 1 x AC900
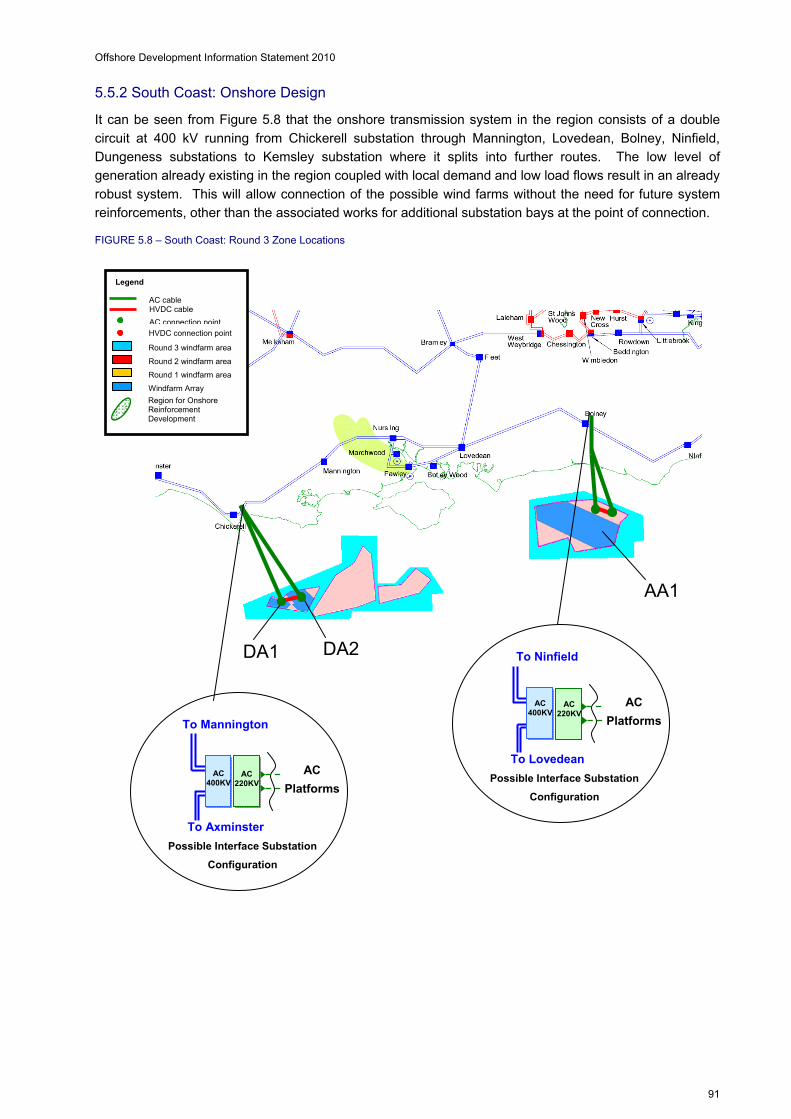
Offshore Development Information Statement 2010
91
To Mannington
To Axminster
AC
Platforms
Possible Interface Substation
Configuration
AC
400KV
To Ninfield
To Lovedean
AC
Platforms
Possible Interface Substation
Configuration
AC 400KV
Legend
AC cable HVDC cable
AC connection pointHVDC connection point
Round 3 windfarm area
Round 2 windfarm area
Round 1 windfarm area
Windfarm Array
Region for Onshore Reinforcement Development
DA1 DA2
AA1
AC
220KV
AC
220KV
5.5.2 South Coast: Onshore Design
It can be seen from Figure 5.8 that the onshore transmission system in the region consists of a double
circuit at 400 kV running from Chickerell substation through Mannington, Lovedean, Bolney, Ninfield,
Dungeness substations to Kemsley substation where it splits into further routes. The low level of
generation already existing in the region coupled with local demand and low load flows result in an already
robust system. This will allow connection of the possible wind farms without the need for future system
reinforcements, other than the associated works for additional substation bays at the point of connection.
FIGURE 5.8 – South Coast: Round 3 Zone Locations

Offshore Development Information Statement 2010
92
5.6 East Anglia – Norfolk
The East Anglia region encompasses several Round 1 and Round 2 wind farms including Greater
Gabbard, London Array and Thanet. These are located around Norfolk, in the Thames Estuary area and
in The Wash.
The Wash is a heavily protected area of the UK coastline and any proposals for connections in this area
would need to undergo full consultation with the Government, its statutory advisors and local and national
environmental bodies. There are many designated features within the Wash estuary including its status
as a Special Area of Conservation (SAC), a Special Protection Area (SPA), a Ramsar site, and National
Nature Reserve (NNR) and a Site of Special Scientific Interest (SSSI).
The area has been identified has having significant environmental and engineering constraints
surrounding the offshore corridor and onshore landing points. The studies conducted in this analysis have
not considered these aspects in any depth. This remains the responsibility of the Offshore Transmission
Owner (OFTO) or developer.
To the east of Norfolk and Suffolk lies the Round 3 Norfolk development area with a potential wind farm
capacity of 7.2 GW. Figure 5.9 shows the possible increase of wind generation capacity in the East
Anglia region for the five different scenarios.
FIGURE 5.9 – East Anglia: Installed Offshore Generation Capacity
5.6.1 East Anglia: Radial Strategy Offshore Design
As stated earlier, the Round 3 Norfolk development area has a potential generation capacity of up to 7.2
GW. In the Radial Strategy case, AC600 and HVDC1000 designs are used, to indicate a slight
advancement in future technology capability, yet meeting the proposed generation levels at the minimum
cost. Multiple connection points and a number of offshore and onshore circuit route lengths (ranging
between 28 km to 172 km in total) have been considered, which has led to a design that includes both
HVDC and AC solutions. The six 1 GW wind farms, connected to Norwich Main and Bramford
substations, each have a minimum combined onshore and offshore route length of over 87 km, hence a
HVDC solution, comprising two offshore AC600 platforms linked to the shore by a single 1 GW HVDC link,
East Anglia - Offshore Generation Capacity
0
2000
4000
6000
8000
10000
12000
2010/11 2011/12 2012/13 2013/14 2014/15 2015/16 2016/17 2017/18 2018/19 2019/20 2020/21 2021/22 2022/23 2023/24 2024/25 2025/26
Year
Cap
acit
y (M
W)
Slow Progression Gone Green Accelerated Growth Sustainable Growth Additional Regional Capacity

Offshore Development Information Statement 2010
93
is considered most appropriate. This avoids the cost and complexity of having to provide intermediate AC
platform substations along the cable route. An AC design was considered the best solution for the two
600MW wind farms, connected to a new substation at Lowestoft, due to much shorter route lengths.
Table 5.4a shows the capacity split, route lengths and standard design blocks considered for the Round 3
Norfolk wind farm development in the Radial Network strategy while illustrating the connection in the area.
TABLE 5.4a – East Anglia: Radial Strategy Offshore Design
Note the radial strategy is limited to using the AC600, AC900 and HVDC1000 design blocks.
174 These are only indicative locations within the nominated area that may be developed. 175 This is the straight line distant and the actual cable corridor length can be much longer.
Radial Design – East Anglia
Straight Line
Connection
Distance175
(km)
Zone Wind
Farm174
Capacity
(MW)
TO Interface
Point
Offshore Onshore
Design Blocks
V1 1000 Norwich Main 67 39
1 x HVDC1000
V2 1000 Norwich Main 62 39
1 x HVDC1000
U1 1000 Norwich Main 48 39
1 x HVDC1000
T1 600 Lowestoft 26 2
1 x AC600
T2 600 Lowestoft 28 2
1 x AC600
Z1 1000 Bramford 128 27
1 x HVDC1000
Z2 1000 Bramford 142 27
1 x HVDC1000
Norfolk
Z3 1000 Bramford 145 27 1 x HVDC1000
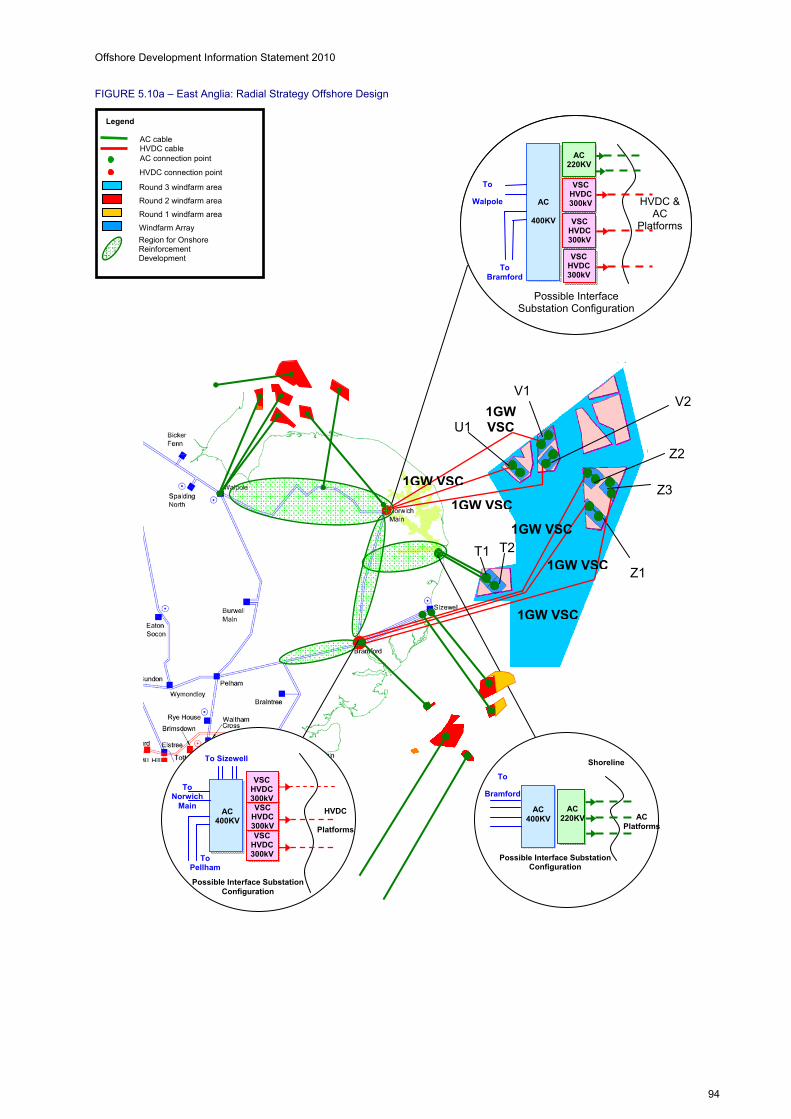
Offshore Development Information Statement 2010
94
FIGURE 5.10a – East Anglia: Radial Strategy Offshore Design
Z2
Z3
AC400KV
AC 220KV
Shoreline
AC Platforms
Possible Interface Substation Configuration
To
Bramford
AC 400KV
HVDC
Platforms
Possible Interface Substation Configuration
To Pellham
To Norwich
Main
To Sizewell
VSC HVDC300kV VSC
HVDC300kV VSC
HVDC300kV
T2T1
V2
AC
HVDC
OFTO
Possible Interface Substation
To Bramford
To
VSC
AC
VSC
VSC
AC AC
400KV
HVDC & AC
Platforms
Possible Interface Substation Configuration
To Bramford
To
Walpole
AC 220KV
VSC HVDC 300kV
VSC HVDC 300kV
VSC HVDC 300kV
V1
U1
Z1
1GW VSC
1GW VSC
1GW VSC
1GW VSC
1GW VSC
1GW VSC
Legend
AC cable HVDC cable AC connection point
HVDC connection point
Round 3 windfarm area
Round 2 windfarm area
Round 1 windfarm area
Windfarm Array
Region for Onshore Reinforcement Development

Offshore Development Information Statement 2010
95
5.6.2 East Anglia: Radial Plus Strategy Offshore Design
The Radial Plus network strategy shows few changes from the Radial Strategy, the main difference being
in the use of AC500 design blocks. This design, developed for the Radial Plus and Integrated strategies
and reliant on technological advances in the near future, uses one large cable instead of the two small
cables used in the AC600 design. In addition, this enables HVDC2000 design blocks to be used,
combining two HVDC1000 design blocks used in the Radial Network Strategy. Table 5.4b and Figure
5.10b shows more details on the possible designs under the Radial Plus strategy.
As can be seen from the Table 5.4b, 2 GW of the 3 GW offshore East Anglia capacity connected to
Norwich Main substation is now delivered using a HVDC2000 link and the remaining 1GW uses a
HVDC1000 link. A similar design is proposed for the 3 GW capacity connected to Bramford. Connection
of the 1.2 GW wind generation at Lowestoft is the same as that in the Radial Strategy.
TABLE 5.4b – East Anglia: Radial Plus Strategy Offshore Design
Note the Radial Plus and Integrated strategies assume the future availability of larger capacity cables and
HVDC converters allowing the use of AC500 and HVDC2000 design blocks.
176 These are only indicative locations within the nominated area that may be developed. 177 This is the straight line distant and the actual cable corridor length can be much longer.
Radial Plus Design - East Anglia
Straight Line
Connection
Distance177
(km)
Zone Wind
Farm176
Capacity
(MW)
TO Interface
Point
Offshore Onshore
Design Blocks
V1 1000 Norwich Main 67 39
U1 1000 Norwich Main 48 39
1 x HVDC2000
V2 1000 Norwich Main 62 39
1 x HVDC1000
T1 600 Lowestoft 26 2
1 x AC600
T2 600 Lowestoft 28 2
1 x AC600
Z1 1000 Bramford 128 27
1 x HVDC1000
Z2 1000 Bramford 142 27
Norfolk
Z3 1000 Bramford 145 27
1 x HVDC2000
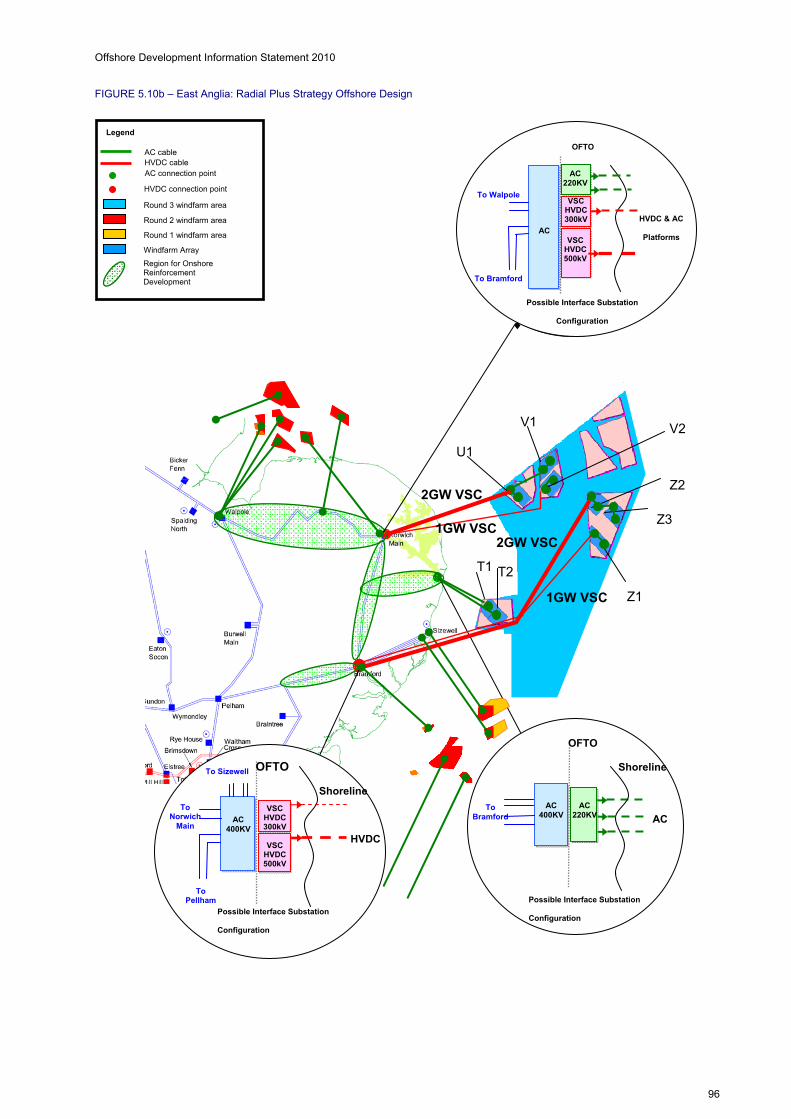
Offshore Development Information Statement 2010
96
FIGURE 5.10b – East Anglia: Radial Plus Strategy Offshore Design
Z2
Z3
AC
To Bramford
To
AC
VSC
VSC
AC
AC
HVDC & AC
Platforms
OFTO
Possible Interface Substation
Configuration
To Bramford
To Walpole
AC 400KV
HVDC
OFTO
VSC HVDC 300kV
VSC HVDC 500kV
VSC HVDC 300kV
VSC HVDC 500kV
To Sizewell
Shoreline
To Pellham
To Norwich
Main
AC 400KV
AC
220KV
Shoreline
AC
OFTO
Possible Interface Substation
Configuration
To Bramford
Possible Interface Substation
Configuration
AC 220KV
T1 T2
Z1 1GW VSC
U1
V1 V2
1GW VSC 2GW VSC
2GW VSC
Legend
AC cable HVDC cable AC connection point
HVDC connection point
Round 3 windfarm area
Round 2 windfarm area
Round 1 windfarm area
Windfarm Array
Region for Onshore Reinforcement Development
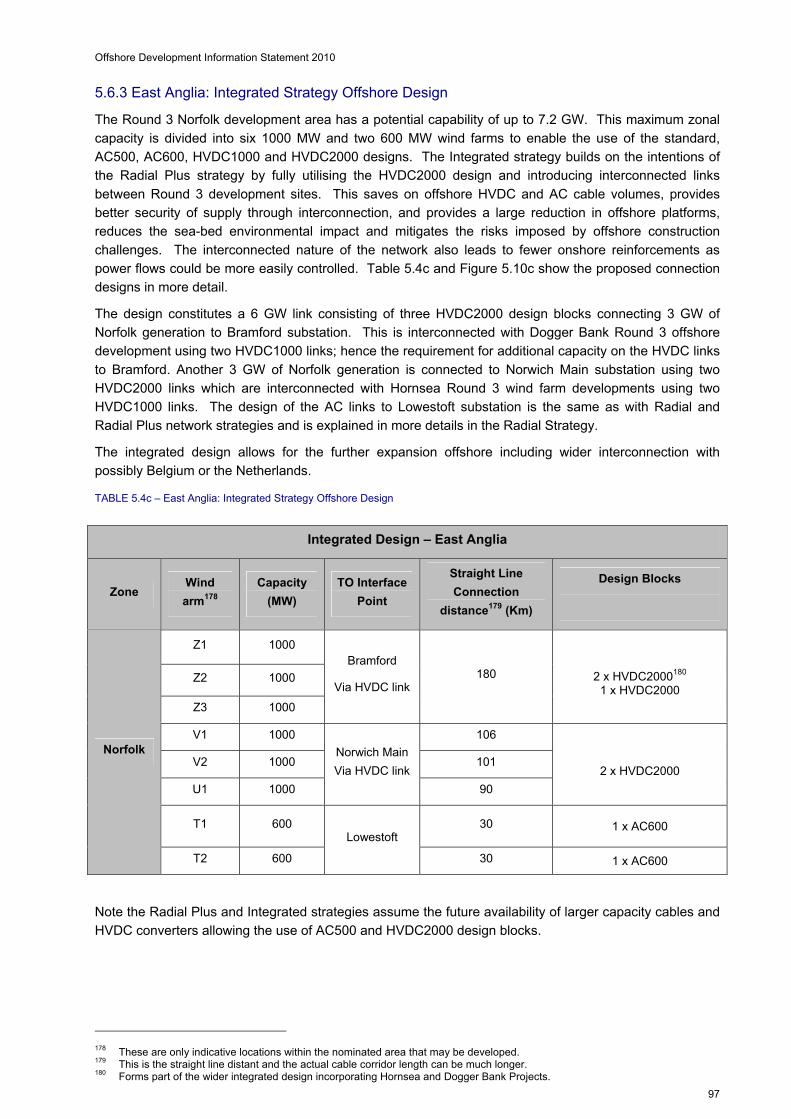
Offshore Development Information Statement 2010
97
5.6.3 East Anglia: Integrated Strategy Offshore Design
The Round 3 Norfolk development area has a potential capability of up to 7.2 GW. This maximum zonal
capacity is divided into six 1000 MW and two 600 MW wind farms to enable the use of the standard,
AC500, AC600, HVDC1000 and HVDC2000 designs. The Integrated strategy builds on the intentions of
the Radial Plus strategy by fully utilising the HVDC2000 design and introducing interconnected links
between Round 3 development sites. This saves on offshore HVDC and AC cable volumes, provides
better security of supply through interconnection, and provides a large reduction in offshore platforms,
reduces the sea-bed environmental impact and mitigates the risks imposed by offshore construction
challenges. The interconnected nature of the network also leads to fewer onshore reinforcements as
power flows could be more easily controlled. Table 5.4c and Figure 5.10c show the proposed connection
designs in more detail.
The design constitutes a 6 GW link consisting of three HVDC2000 design blocks connecting 3 GW of
Norfolk generation to Bramford substation. This is interconnected with Dogger Bank Round 3 offshore
development using two HVDC1000 links; hence the requirement for additional capacity on the HVDC links
to Bramford. Another 3 GW of Norfolk generation is connected to Norwich Main substation using two
HVDC2000 links which are interconnected with Hornsea Round 3 wind farm developments using two
HVDC1000 links. The design of the AC links to Lowestoft substation is the same as with Radial and
Radial Plus network strategies and is explained in more details in the Radial Strategy.
The integrated design allows for the further expansion offshore including wider interconnection with
possibly Belgium or the Netherlands.
TABLE 5.4c – East Anglia: Integrated Strategy Offshore Design
Note the Radial Plus and Integrated strategies assume the future availability of larger capacity cables and
HVDC converters allowing the use of AC500 and HVDC2000 design blocks.
178 These are only indicative locations within the nominated area that may be developed. 179 This is the straight line distant and the actual cable corridor length can be much longer. 180 Forms part of the wider integrated design incorporating Hornsea and Dogger Bank Projects.
Integrated Design – East Anglia
Zone Wind
arm178
Capacity
(MW)
TO Interface
Point
Straight Line
Connection
distance179 (Km)
Design Blocks
Z1 1000
Z2 1000
Z3 1000
Bramford
Via HVDC link 180
2 x HVDC2000180
1 x HVDC2000
V1 1000 106
V2 1000 101
U1 1000
Norwich Main
Via HVDC link
90
2 x HVDC2000
T1 600 30
1 x AC600
Norfolk
T2 600
Lowestoft
30 1 x AC600

Offshore Development Information Statement 2010
98
FIGURE 5.10c – East Anglia: Integrated Strategy Offshore Design
2x2GW VSC
2GW VSC to Europe
1GW VSC
2x2GW
SC
2GW VSC
1GW VSC
2x1GW VSC
2x2GW VSC
T1 T2
Z1
Z2
Z3
U1
V1
V2
AC 400KV
HVDC Platforms
OFTO
Possible Interface Substation Configuration
To Pellham
To Norwich
Main
To Sizewell
VSC HVDC 500kV
VSC HVDC 500kV
VSC HVDC 300kV
AC 400KV
AC 220KV
Shoreline
AC Platforms
OFTO
Possible Interface Substation Configuration
To Bramford
AC 400KV
HVDC & AC Platforms
OFTO
Possible Interface Substation Configuration
To Bramford
To Walpole
VSC HVDC 500kV
AC 220KV
VSC HVDC 500kV
VSC HVDC 500kV
Legend
AC cable HVDC cable AC connection point
HVDC connection point
Round 3 windfarm area
Round 2 windfarm area
Round 1 windfarm area
Windfarm Array
Region for Onshore Reinforcement Development
This area has been identified has having significant environmental and engineering constraints surrounding the offshore corridor and onshore landing points. Detailed analysis will be required to determine viable connection routes.
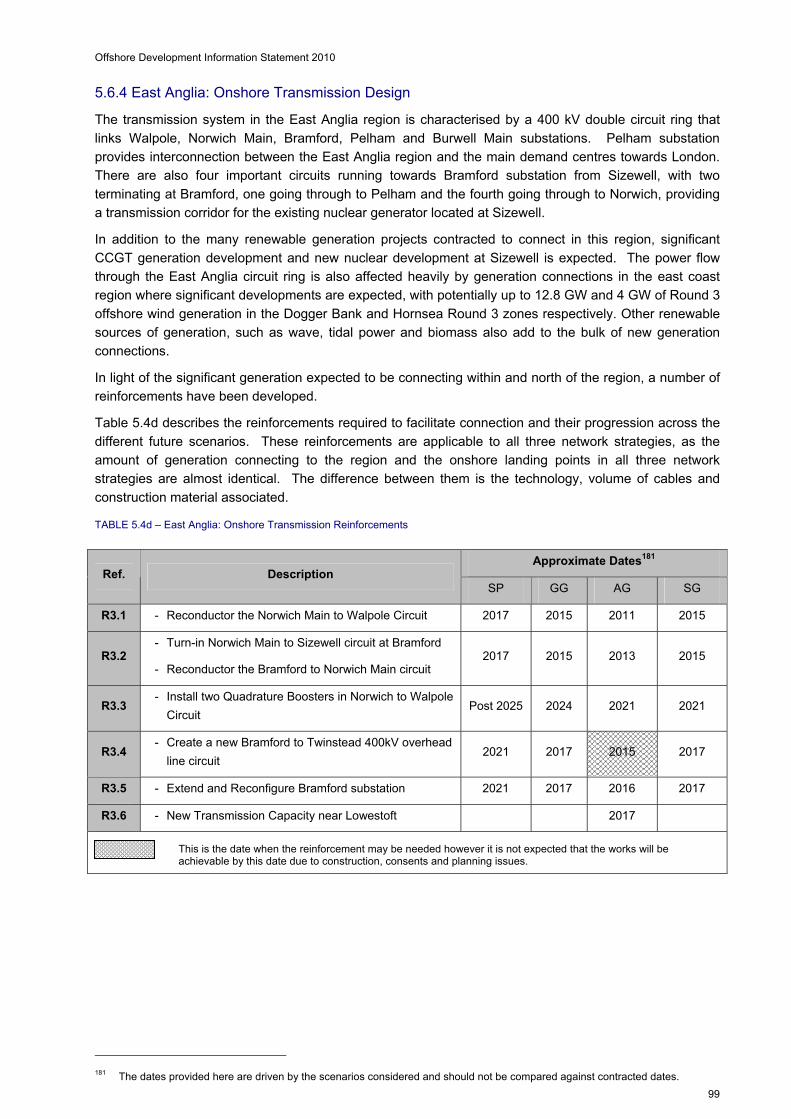
Offshore Development Information Statement 2010
99
5.6.4 East Anglia: Onshore Transmission Design
The transmission system in the East Anglia region is characterised by a 400 kV double circuit ring that
links Walpole, Norwich Main, Bramford, Pelham and Burwell Main substations. Pelham substation
provides interconnection between the East Anglia region and the main demand centres towards London.
There are also four important circuits running towards Bramford substation from Sizewell, with two
terminating at Bramford, one going through to Pelham and the fourth going through to Norwich, providing
a transmission corridor for the existing nuclear generator located at Sizewell.
In addition to the many renewable generation projects contracted to connect in this region, significant
CCGT generation development and new nuclear development at Sizewell is expected. The power flow
through the East Anglia circuit ring is also affected heavily by generation connections in the east coast
region where significant developments are expected, with potentially up to 12.8 GW and 4 GW of Round 3
offshore wind generation in the Dogger Bank and Hornsea Round 3 zones respectively. Other renewable
sources of generation, such as wave, tidal power and biomass also add to the bulk of new generation
connections.
In light of the significant generation expected to be connecting within and north of the region, a number of
reinforcements have been developed.
Table 5.4d describes the reinforcements required to facilitate connection and their progression across the
different future scenarios. These reinforcements are applicable to all three network strategies, as the
amount of generation connecting to the region and the onshore landing points in all three network
strategies are almost identical. The difference between them is the technology, volume of cables and
construction material associated.
TABLE 5.4d – East Anglia: Onshore Transmission Reinforcements
181 The dates provided here are driven by the scenarios considered and should not be compared against contracted dates.
Approximate Dates181 Ref. Description
SP GG AG SG
R3.1 - Reconductor the Norwich Main to Walpole Circuit 2017 2015 2011 2015
R3.2 - Turn-in Norwich Main to Sizewell circuit at Bramford
- Reconductor the Bramford to Norwich Main circuit 2017 2015 2013 2015
R3.3 - Install two Quadrature Boosters in Norwich to Walpole
Circuit Post 2025 2024 2021 2021
R3.4 - Create a new Bramford to Twinstead 400kV overhead
line circuit 2021 2017 2015 2017
R3.5 - Extend and Reconfigure Bramford substation 2021 2017 2016 2017
R3.6 - New Transmission Capacity near Lowestoft 2017
This is the date when the reinforcement may be needed however it is not expected that the works will be achievable by this date due to construction, consents and planning issues.

Offshore Development Information Statement 2010
100
5.7 East Coast – Dogger Bank and Hornsea
There are significant developments planned in this region with the Round 3 offshore zones of Dogger
Bank and Hornsea having the potential to connect up to 17 GW of wind capacity to the east coast of
England, in addition to the Round 1 and 2 generation projects.
Figure 5.11 shows the total offshore generation capacity that may wish to connect to the coastlines of
East Riding, Humberside and Lincolnshire. With the large areas of possible offshore wind generation
made available there is noticeable variation apparent between the scenarios. The Gone Green and Slow
Progression follow a similar pattern of generation build-up, whereas the other scenarios, Accelerated
Growth and Sustainable Growth, exhibit much greater generation capacity and faster growth, particularly
in the later part of the study period. Hence, the level of investment decisions would be equally varied,
particularly when considering offshore transmission connection strategies.
Existing transmission substations closest to the east coast are located along the north and south banks of
the Humber Estuary and south of The Wash. These substations are already heavily utilised providing
connections to thermal generation. To accommodate the new offshore generation significant
reinforcement will be required including the establishment of multiple new substations and new circuit
routes.
FIGURE 5.11– East Coast: Installed Offshore Generation
East Riding of Yorkshire
The Humber area is close to the Round 3 zones of Dogger Bank and Hornsea making it a convenient part
of the system for the offshore connections to minimise the offshore cable distances. The north side of the
Humber Estuary has CCGT generation at Saltend connected to Creyke Beck by means of a 275 kV
network. The 275 kV network connecting Saltend offers negligible redundant capacity for additional
connections.
The primary transmission circuit north of East Riding is located some distance from the coast before
splitting off at Thornton towards the Humber estuary. However, the estuary is a barrier to new
transmission routes heading south. Therefore, for offshore generation to connect to the coast north of the
estuary the new circuits require either to be brought further inland or to cross the estuary through a tunnel.
East Coast - Offshore Generation Capacity
0
2000
4000
6000
8000
10000
12000
14000
16000
18000
20000
22000
2010/11 2011/12 2012/13 2013/14 2014/15 2015/16 2016/17 2017/18 2018/19 2019/20 2020/21 2021/22 2022/23 2023/24 2024/25 2025/26
Year
Cap
acit
y (M
W)
Slow Progression Gone Green Accelerated Growth Sustainable Growth Additional Regional Capacity
Offshore Development Information Statement 2010
101
Humberside
There is a cluster of large CCGT generators located south of the Humber Estuary, with Killingholme,
South Humber Bank, Immingham and Keadby power stations connected in a double circuit 400kV ring.
The local transmission system has been developed to accommodate the existing generation and provides
very little spare transmission capability.
New generation capacity may be released if any of the existing generators close but these power stations
are relatively new and there is no immediate indication of them closing. Therefore additional substations
and circuits may be required to provide the capacity to accommodate any additional generation
connecting to this region.
Lincolnshire
The transmission system in this area is characterised by a double circuit that predominantly carries north-
south transfers with intake from the power stations around the Humber area linking to the circuits
supplying the south and West Midlands load centres. Walpole is a significant substation situated directly
in the main transmission route south to London in addition to accommodating heavy GSP demand, a new
CCGT generator and new connections for Round 2 projects. Future expansion beyond what is already
planned is not feasible with the existing substation limits due to circuit loading and the lack of adjacent
land.
The Wash
The Wash is a heavily protected area of the UK coastline and any proposals for connections in this area
would need to undergo full consultation with the Government, its statutory advisors and local and national
environmental bodies. There are many designated features within the Wash estuary including its status
as a Special Area of Conservation (SAC), a Special Protection Area (SPA), a Ramsar site, and National
Nature Reserve (NNR) and a Site of Special Scientific Interest (SSSI).
The area has been identified has having significant environmental and engineering constraints
surrounding the offshore corridor and onshore landing points. The studies conducted in this analysis have
not considered these aspects in any depth. This remains the responsibility of the Offshore Transmission
Owner (OFTO) or developer.
5.7.1 East Coast: Radial Strategy Offshore Design
The Dogger Bank wind farm generation project is located off the east coast of Yorkshire. This is the
largest zone (Zone 3) in Round 3, with four sub-zones with the capacity to accommodate several wind
farm arrays with the potential to generate up to 13 GW. The capacity of both the Hornsea and Dogger
Bank offshore wind farms and their distance from the possible onshore connection points dictate that a
conventional HVAC solution will be impractical and uneconomic and hence an HVDC solution has been
applied in each case.
Table 5.5a and Table 5.5b show the feasible Offshore Transmission units for Dogger Bank and Hornsea
respectively. Note the indicative offshore cable routes are designed to avoid areas allocated for mineral
extraction, other offshore wind farms, and concentrations of oil and gas pipelines, however some pipeline
and cable crossings are inevitable, and for some routes numerous.
The power from the offshore converter is routed through two HVDC cables (forming a bipole) to an
onshore converter located in a compound adjacent to the NGET connection substation where it is
converted back from HVDC to AC for input to the onshore transmission network.

Offshore Development Information Statement 2010
102
TABLE 5.5a – East Coast Dogger Bank Zone: Possible Offshore Transmission Design
Note the radial strategy is limited to using the AC600, AC900 and HVDC1000 design blocks.
182 These are only indicative locations within the nominated area that may be developed. 183 This is the straight line distance and the actual cable corridor length can be much longer.
Radial Design – Dogger Bank
HVDC Straight Line
Connection
Distances183 (km) Zone Wind
Farm182
Capacity
(MW)
TO Interface
Point
Offshore Onshore
Design Blocks
H1 1000 Creyke Beck
East 152 14
1 x HVDC1000
H2 1000 Creyke Beck
East 168 14
1 x HVDC1000
H3 1000 Killingholme
South 209 4
1 x HVDC1000
H4 1000 Creyke Beck
East 179 14
1 x HVDC1000
H5 1000 Killingholme
South 222 4
1 x HVDC1000
H6 1000 Killingholme
South 236 4
1 x HVDC1000
I1 1000 Grimsby South 240 16
1 x HVDC1000
I2 1000 Grimsby South 257 16
1 x HVDC1000
I3 800
East
Lincolnshire
North
265 9 1 x HVDC1000
J1 1000 Hornsey 187 2
1 x HVDC1000
J2 1000 Hornsey 202 2
1 x HVDC1000
J3 1000 Hornsey 219 2
1 x HVDC1000
Dogger
Bank
K1 1000 Creyke Beck
East 239 27
1 x HVDC1000

Offshore Development Information Statement 2010
103
TABLE 5.5b – East Coast Hornsea Bank Zone: Possible Offshore Transmission Design
Note the radial strategy is limited to using the AC600, AC900 and HVDC1000 design blocks.
184 These are only indicative locations within the nominated area that may be developed 185 This is the straight line distance and the actual cable corridor length can be much longer
Radial Design – Hornsea
HVDC Straight Line
Connection
Distances185 (km) Zone Wind
Farm184
Capacity
(MW)
TO Interface
Point
Offshore Onshore
Design Blocks
L1 1000 Grimsby South 85 16
1 x HVDC1000
L2 1000 East Lincolnshire
North 111 9
1 x HVDC1000
M1 1000 East Lincolnshire
South 82 8
1 x HVDC1000
Hornsea
M2 1000 East Lincolnshire
South 95 8
1 x HVDC1000
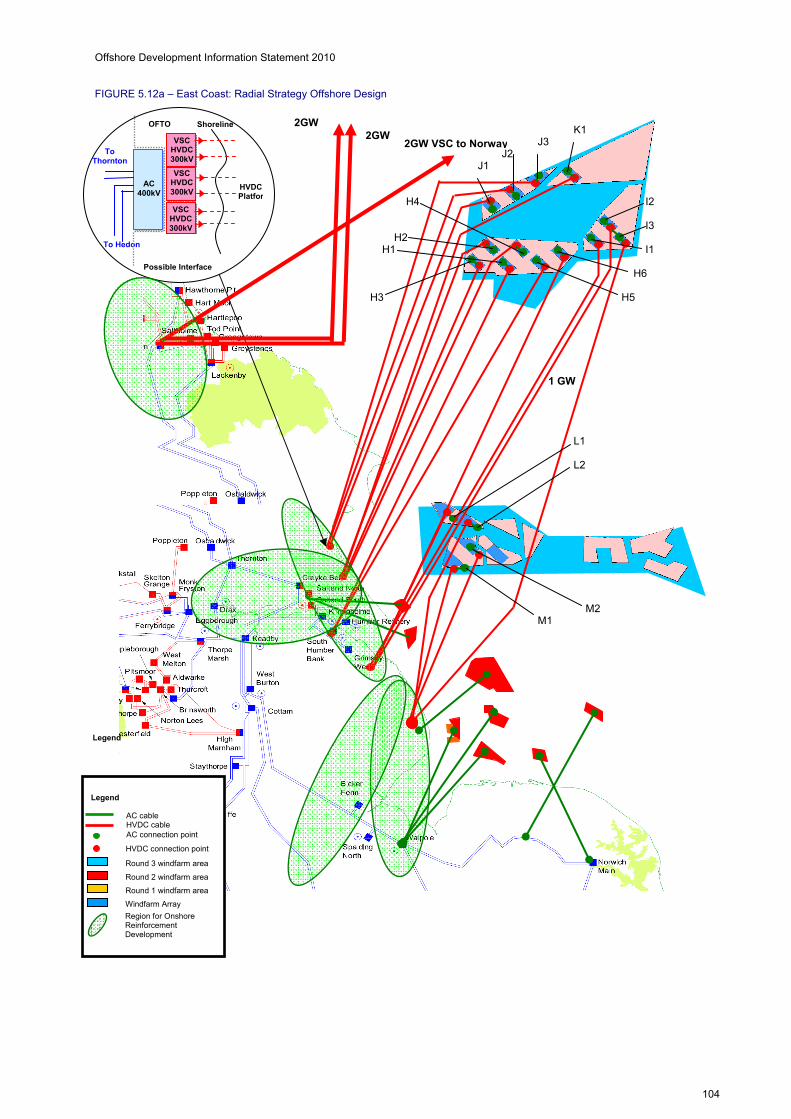
Offshore Development Information Statement 2010
104
1 GW
2GW VSC to Norway
AC 400kV
Shoreline
HVDC Platfor
OFTO
To Hedon
To Thornton
VSC HVDC 300kV
VSC HVDC 300kV
Possible Interface
VSC HVDC 300kV
2GW
J3J2
K1
I2
I3
I1
J1
H6
H5
H4
H2 H1
H3
L1
L2
M2 M1
Legend
Legend
AC cable HVDC cable AC connection point
HVDC connection point
Round 3 windfarm area
Round 2 windfarm area
Round 1 windfarm area
Windfarm Array
Region for Onshore Reinforcement Development
FIGURE 5.12a – East Coast: Radial Strategy Offshore Design
2GW
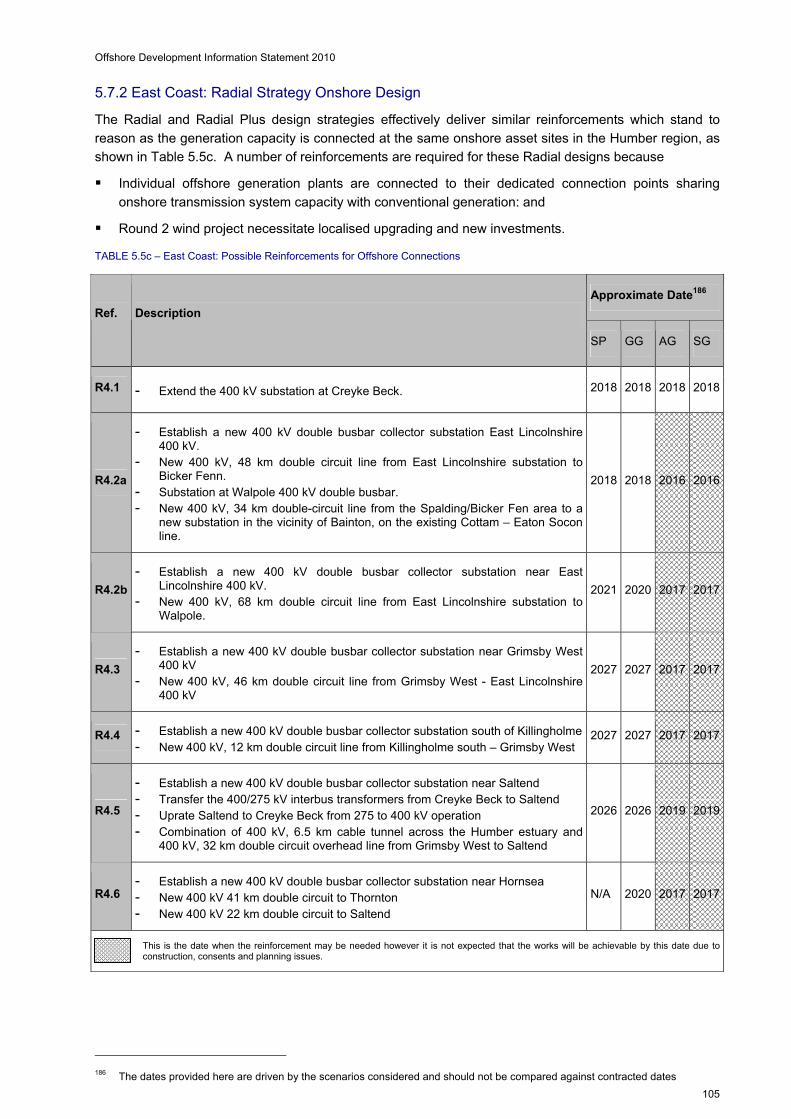
Offshore Development Information Statement 2010
105
5.7.2 East Coast: Radial Strategy Onshore Design
The Radial and Radial Plus design strategies effectively deliver similar reinforcements which stand to
reason as the generation capacity is connected at the same onshore asset sites in the Humber region, as
shown in Table 5.5c. A number of reinforcements are required for these Radial designs because
Individual offshore generation plants are connected to their dedicated connection points sharing
onshore transmission system capacity with conventional generation: and
Round 2 wind project necessitate localised upgrading and new investments.
TABLE 5.5c – East Coast: Possible Reinforcements for Offshore Connections
186 The dates provided here are driven by the scenarios considered and should not be compared against contracted dates
Approximate Date186
Ref. Description
SP GG AG SG
R4.1 - Extend the 400 kV substation at Creyke Beck. 2018 2018 2018 2018
R4.2a
- Establish a new 400 kV double busbar collector substation East Lincolnshire 400 kV.
- New 400 kV, 48 km double circuit line from East Lincolnshire substation to Bicker Fenn.
- Substation at Walpole 400 kV double busbar. - New 400 kV, 34 km double-circuit line from the Spalding/Bicker Fen area to a
new substation in the vicinity of Bainton, on the existing Cottam – Eaton Socon line.
2018 2018 2016 2016
R4.2b
- Establish a new 400 kV double busbar collector substation near East Lincolnshire 400 kV.
- New 400 kV, 68 km double circuit line from East Lincolnshire substation to Walpole.
2021 2020 2017 2017
R4.3
- Establish a new 400 kV double busbar collector substation near Grimsby West 400 kV
- New 400 kV, 46 km double circuit line from Grimsby West - East Lincolnshire 400 kV
2027 2027 2017 2017
R4.4 - Establish a new 400 kV double busbar collector substation south of Killingholme - New 400 kV, 12 km double circuit line from Killingholme south – Grimsby West
2027 2027 2017 2017
R4.5
- Establish a new 400 kV double busbar collector substation near Saltend - Transfer the 400/275 kV interbus transformers from Creyke Beck to Saltend - Uprate Saltend to Creyke Beck from 275 to 400 kV operation - Combination of 400 kV, 6.5 km cable tunnel across the Humber estuary and
400 kV, 32 km double circuit overhead line from Grimsby West to Saltend
2026 2026 2019 2019
R4.6 - Establish a new 400 kV double busbar collector substation near Hornsea - New 400 kV 41 km double circuit to Thornton - New 400 kV 22 km double circuit to Saltend
N/A 2020 2017 2017
This is the date when the reinforcement may be needed however it is not expected that the works will be achievable by this date due to construction, consents and planning issues.

Offshore Development Information Statement 2010
106
5.7.3 East Coast: Radial Strategy Design Approach
The radial configuration effectively connects the individual offshore AC/DC converters from each wind
farm array to onshore converters via 1GW HVDC cables. In the case of Dogger Bank there are 13 radial
connections considered at five onshore locations. A single dedicated HVDC cable link from each offshore
converter is connected at one of five onshore substations: Creyke Beck, Grimsby West, South Humber
Bank and two new connection points.
The shared volume of radial link cables entering the Humberside coastline will inevitably be beyond the
present physical capacity of the current asset landing points, requiring additional land as well as increased
network capability at various constrained circuit locations.
In light of Round 1 and 2 wind farms already connecting in this region, further multiple cables landing in
The Wash would be problematic. There would also be difficulties in obtaining offshore routes and
easements to the substations.
5.7.4 East Coast: Radial Plus Strategy Offshore Design
The Radial Plus follows a similar network configuration as the Radial design but uses advanced cable and
substation technology. The concept of the Radial Plus Strategy is to form several groups of wind farm
arrays, within a zone, with each group interlinked to a common point (an converter platform) providing a
combined transmission capacity of 2 GW, this being the medium term limit of HVDC converters and
cables. The individual group of wind farms arrays are then connected to their dedicated asset landing
point onshore. Table 5.6a and Table 5.6b show the Radial Plus Strategy for the east coast: Dogger Bank
and Hornsea respectively.
TABLE 5.6a – East Coast Dogger Bank Zone: Radial Plus Strategy Offshore Design
Note the Radial Plus and Integrated strategies assume the future availability of larger capacity cables and
HVDC converters allowing the use of AC500 and HVDC2000 design blocks.
187 These are only indicative locations within the nominated are that may be developed. 188 This is the straight line distance. The actual cable corridor length can be longer.
Radial Plus Design – Dogger Bank
HVDC Straight Line Connection
Distances188 (km) Zone Wind
Farm187 Capacity
(MW) TO Interface
Point
Offshore Onshore
Design Blocks
H1 1000
H2 1000 Creyke Beck
East 152 14
1 x HVDC2000
H3 1000
H4 1000 Killingholme
South 209 4
1 x HVDC2000
H5 1000
H6 1000 Killingholme
South 236 4
1 x HVDC2000
I1 1000
I2 1000 Grimsby South 239 16
1 x HVDC2000
I3 800 East
Lincolnshire North
265 9
1 x HVDC1000
J1 1000
J2 1000 Hornsey 193 2
1 x HVDC2000
J3 1000
Dogger Bank
K1 1000 Hornsey 238 2
1 x HVDC2000

Offshore Development Information Statement 2010
107
TABLE 5.6b – East Coast Hornsea Zone: Radial Plus Strategy Offshore Design
Note the Radial Plus and Integrated strategies assume the future availability of larger capacity cables and
HVDC converters allowing the use of AC500 and HVDC2000 design blocks.
The east coast Radial Plus strategy onshore proposed reinforcements are mostly the same as for the
Radial strategy as shown in Table 5.5c.
5.7.5 East Coast: Radial Plus Strategy Design Approach
The application of Radial Plus strategy to the Dogger Bank zone would require six 2 GW rated cables and
a single 1 GW of the existing technology cable to export power from this zone. Although this configuration
effectively halves the cables needed compared to the Radial design, it would not reduce the onshore
reinforcement required.
It would also fall short of fully capitalising on the benefits of advanced cable and substation technology.
Similarly, Hornsea wind farm using a combination of 1 GW and 2 GW links would require a substantial
amount of onshore reinforcement. This is because the characteristics of a radial design still exist with the
power landing at specific existing or new connection points on the 400 kV transmission system with no
alternative route to share the capacity. Any subsequent changes to these landing points would require
consideration of the impact on offshore infrastructure in addition to onshore MITS alterations and therefore
may hinder further offshore power generation development.
189 These are only indicative locations within the nominated are that may be developed. 190 This is the straight line distance. The actual cable corridor length can be longer.
Radial Plus Design - Hornsea
HVDC Straight Line Connection
Distances190 (km) Zone Wind
Farm189 Capacity
(MW) TO Interface
Point
Offshore Onshore
Design Blocks
L1 1000
L2 1000 Grimsby South 110 16
1 x HVDC2000
M1 1000 Hornsea
M2 1000
East Lincolnshire
North 95 8
1 x HVDC2000

Offshore Development Information Statement 2010
108
2 GW
1 GW
2 GW VSC to Norway
To Thornton
Legend
AC cable HVDC cable AC connection point
HVDC connection point
Round 3 windfarm area
Round 2 windfarm area
Round 1 windfarm area
Windfarm Array
Region for Onshore Reinforcement Development
AC 400kV
Shoreline
HVDC Platforms
OFTO
To Hedon
Possible Interface Substation
Configuration
VSC HVDC 500 kV
VSC HVDC 500 kV
2 GW 2 GW
H1
H2
H3
H4
H6
K1
I2
I1
I3
H5
L2
L1
J2 J3
J1
M2
M1
FIGURE 5.12b – East Coast: Radial Plus Strategy Offshore Design

Offshore Development Information Statement 2010
109
5.7.6 East Coast: Integrated Strategy Design Approach
The anticipated advancement in electricity transmission technology, such as the more flexible (VSC) 2GW
HVDC converters and larger offshore AC cables has made it possible to consider the Radial Plus strategy.
However, technologies used by the Radial Plus strategy can be further considered for interlinking the
neighbouring offshore wind farm arrays to form an offshore transmission circuit. The close proximity of
the wind farm array blocks in Zone 3 make them ideal for interconnecting their substations together via AC
cable, hence providing the ability to aggregate the local power generated before exporting it onshore
and/or linking to neighbouring zones. This offers great flexibility in transmission options.
The Hornsea offshore wind farm in Zone 4 is relatively close to the Yorkshire coast, which has a number
of sub-zones each capable of accommodating blocks of wind farm arrays. The configuration of the wind
farm arrays enables the interconnection of the wind farm AC cables to form a local grid network.
Furthermore, this network can be extended to link with other wind farm arrays within the neighbouring
Dogger Bank and Norfolk zones. Table 5.7a and Table 5.7b and show the Integrated Strategy for the east
coast: Dogger Bank and Hornsea respectively.
TABLE 5.7a – East Coast Dogger Bank Zone: Integrated Offshore Design
Note the Radial Plus and Integrated strategies assume the future availability of larger capacity cables and
HVDC converters allowing the use of AC500 and HVDC2000 design blocks.
TABLE 5.7b – East Coast Hornsea Zone: Integrated Offshore Design
Note the Radial Plus and Integrated strategies assume the future availability of larger capacity cables and
HVDC converters allowing the use of AC500 and HVDC2000 design blocks.
191 These are only indicative locations within the nominated area that may be developed. 192 This is the straight line distance. The actual cable corridor length can be longer. 193 These are only indicative locations within the nominated area that may be developed. 194 This is the straight line distance. The actual cable corridor length can be longer.
Integrated Design – Dogger Bank
Zone Wind
Farm191 Capacity
(MW) TO Interface
Point
HVDC Straight Line Connection
Distance192 (km)
Design Blocks
H1 1000 H2 1000 H3 1000 H4 1000 H5 1000 H6 1000 I1 1000 I2 1000 I3 800 J1 1000 J2 1000 J3 1000
Dogger Bank
K1 1000
South Humber via Z4
Hornsea; Walpole;
Killingholme South;
Saltend; Bramford Via Z5 Norfolk;
Norway
~250
1 x HVDC2000 1 x HVDC1000 2 x HVDC2000 1 x HVDC2000 1 x HVDC2000 2 x HVDC1000
Integrated Strategy – Hornsea
Zone Wind
Farm193 Capacity
(MW) TO Interface
Point
HVDC Straight Line Connection
Distance194 (km)
Design Blocks
L1 1000 L2 1000 M1 1000 Hornsea
M2 1000
South Humber Bank;
Killingholme South;
Norwich Main via Z5 Norfolk
~200
1 x HVDC1000
1 x HVDC1000
1 x HVDC2000
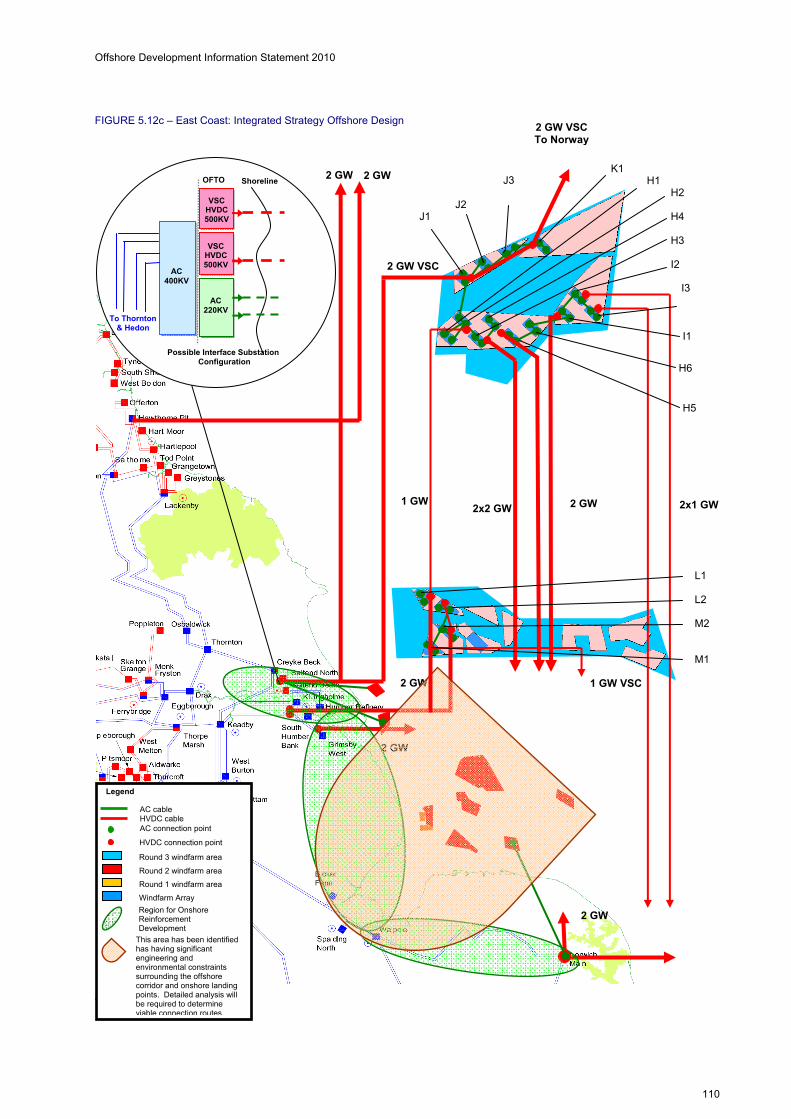
Offshore Development Information Statement 2010
110
FIGURE 5.12c – East Coast: Integrated Strategy Offshore Design
89
2 GW VSC
1 GW 2x2 GW 2 GW 2x1 GW
2 GW
2 GW
2 GW
1 GW VSC
AC 400KV
AC 220KV
Shoreline OFTO
Possible Interface Substation Configuration
VSC HVDC 500KV
VSC HVDC 500KV
To Thornton & Hedon
2 GW 2 GW
Legend
AC cable HVDC cable AC connection point
HVDC connection point
Round 3 windfarm area
Round 2 windfarm area
Round 1 windfarm area
Windfarm Array
Region for Onshore Reinforcement Development
This area has been identified has having significant engineering and environmental constraints surrounding the offshore corridor and onshore landing points. Detailed analysis will be required to determine viable connection routes.
J1
K1
J2 H2
H1
H4
H3
I2
I1
H6
H5
L2
L1
M2
M1
2 GW VSC To Norway
J3
I3

Offshore Development Information Statement 2010
111
5.7.7 East Coast: Integrated Strategy Onshore Design
The onshore transmission system on the east coast of England spans from the predominantly 275 kV
system around Teesside, down two 400 kV double circuits through Yorkshire to the Humber area where
there is a concentration of mostly gas-fired generation. A significant amount of CCGT generation has
been built around the Humber area due to ready access to the gas transmission system and the sharing
of steam services with local heavy industry.
Transmission south from Keadby continues down through four 400 kV double circuits towards the major
load centre of London. Before reaching London the most easterly of these four double circuits branches
out into a further two 400 kV double circuits forming a ring around East Anglia.
In order to accommodate the scenario of connecting the maximum identified offshore capacity, the
reinforcements shown in Table 5.8 have been identified. The reinforcement options, including substation
locations and circuit routes, have only been developed by high level design and are therefore for indicative
purposes only. The full development of each project will be subject to detailed survey and design,
consenting, environmental assessment and funding. Note that there are fewer reinforcement projects
compared with those required by Radial and Radial Plus strategies. This is predominantly due to the
ability of an offshore integrated network to distribute the aggregated generation capacity across the
strategic landing points.
TABLE 5.8 – East Coast: Possible Onshore Reinforcements for Integrated Offshore Design
195 The dates provided here are driven by the scenarios considered and should not be compared against contracted dates.
Approximate Date195 Ref. Description
SP GG AG SG
R4.1 - Extend the 400 kV substation at Creyke Beck 2018 2018 2018 2018
R4.3
- Establish a new 400 kV double busbar collector substation near Grimsby West 400 kV
- New 400 kV, 110 km double circuit line from Grimsby West to Walpole 400 kV
2027 2027 2017 2017
R4.4
- Establish a new 400 kV double busbar collector substation south of Killingholme
- New 400 kV, 12 km double circuit line from Killingholme south – Grimsby West
2027 2027 2017 2017
R4.5
- Establish a new 400 kV double busbar collector substation near Saltend
- Transfer the 400/275 kV interbus transformers from Creyke Beck to Saltend
- Up-rate Saltend to Creyke Beck from 275 to 400 kV operation
- Combination of 400 kV, 6.5 km cable tunnel across the Humber estuary and 400 kV, 32 km double circuit overhead line from Grimsby West to Saltend
2026 2026 2019 2019
This is the date when the reinforcement may be needed however it is not expected that the works will be achievable by this date due to construction, consents and planning issues.
Offshore Development Information Statement 2010
112
5.7.8 East Coast: Integrated Strategy Design Approach
Hornsea and Dogger Bank zones are in excess of 150 km from shore, making HVDC cables the only
practical and economical connection option. Current thinking on offshore technology suggests that 2 GW
is the medium term limit of HVDC converters and cables. This thinking is beyond last years statement
assumptions of a 1 GW limit and while it would mean larger assets, less would be required.
This in turn would reduce construction activity to fewer seabed locations and thus assist the build and
delivery process. Naturally, reduction in offshore substation assets would reduce the associated AC
cables linking the platforms, as well as HVDC cables running across the seabed between offshore and
onshore assets.
The potential connection of 13 GW of generation at Dogger Bank to the mainland could be achieved by a
combination of direct onshore connections as well as linking to the neighbouring zones. In this context,
the most northerly arrays at Dogger Bank could be integrated in such a way that there are two routes of 2
GW exporting cables; one being an interconnection with Norway and the other for direct connection to
Creyke Beck 400 kV substation via a HVDC converter station. This would necessitate the extension of
Creyke Beck substation and the reinforcement of its circuits going south
Offshore interconnection of the Dogger Bank zone to the Norfolk zone, which is in-turn interconnected to
the Bramford Zone and then onto the onshore network realises significant capacity benefits while reducing
the total number of assets required to deliver the wind generation projects compared to the radial and
radial plus strategies.
This configuration helps to spread the generation supply across the MITS as well as directing the power
flow near the point-of-use, avoiding potential major onshore double circuit reinforcements.
The potential 4 GW of generation from the Hornsea zone also employs the integrated strategy in that it
uses two directly connected 2 GW sea-to-shore cables, with the remaining generation linked with other
arrays within the neighbouring zones. This combination of direct and integrated network reaps the
benefits of transmission flexibility, minimising onshore reinforcement and environmental impact.
A co-ordinated strategy for integration of the onshore-offshore transmission network makes an effective
use of the technologies and networking of the offshore zones, and in doing so has the potential of
achieving an economic and efficient solution for transmitting offshore generation. This is evident from the
reduced amount of onshore AC overhead line reinforcements, less land required for associated works
compared to the Radial and to some extent the Radial Plus strategies.
There are added benefits in having larger platforms, substations and higher rated cables in the form of
reduced maintenance due to fewer assets to maintain and the scope for standardisation. This strategy
enables greater offshore network integration flexibility whilst minimising environmental disturbance and
potentially stimulating the market for technological evolution.

Offshore Development Information Statement 2010
113
5.8 Scotland
Scottish generation forms a large proportion of the total national electricity transmission system generation
capacity, and with its natural resources it potentially contains a large proportion of the national electricity
transmission system renewable generation base. Demand in Scotland is relatively low compared to its
installed generation and forecasts indicate much more renewable generation to connect, both on and
offshore. At times, this generation, excess gives rise to large power exports from Scotland into England
which will increase as more generation is installed. Figure 5.13 shows the offshore generation capacity
expected to connect to Scotland for each of the relevant scenarios.
Some of the major developments expected include the Moray Firth and Firth of Forth Round 3 wind
zones, Scottish Territorial Waters projects and the Pentland Firth and Orkney strategic marine power
development area. These projects and their potential connections are shown in Figure 5.14a. Also
shown, as shaded lozenges, are the areas for reinforcement onshore in order to provide adequate
transmission capability. All of the developments are subject to the appropriate agreements and
permissions being established.
Figure 5.13 shows the offshore generation scenarios of Gone Green, Slow Progress, Accelerated Growth
and Sustainable Growth for the Scotland region. From all the future scenarios it can be seen that the
generation is forecast to increase into the future.
FIGURE 5.13 – Scotland: Installed Offshore Generation
The strong likelihood of significant offshore and onshore renewable generation development in Scotland
means that an extensive upgrade of the onshore transmission system (including offshore cable links) is
likely to be required to facilitate the increased transmission of power into England. With the possibility of
significant onshore transmission upgrades, the offshore transmission network could be interfaced with the
onshore network at several different locations. Suggested locations have been shown in Figure 5.14a but
it is quite possible that these will change in response to connection applications, OFTO appointments and
more detailed surveys and analysis.
Scotland - Offshore Generation Capacity
0
2000
4000
6000
8000
10000
12000
14000
2010/11 2011/12 2012/13 2013/14 2014/15 2015/16 2016/17 2017/18 2018/19 2019/20 2020/21 2021/22 2022/23 2023/24 2024/25 2025/26
Year
Cap
acit
y (M
W)
Slow Progression Gone Green Accelerated Growth Sustainable Growth Additional Regional Capacity

Offshore Development Information Statement 2010
114
FIGURE 5.14a – Scotland: Reinforcement Areas and Offshore Development Areas
HVDC Links to
E&W
R3 Z2 Firth Of Forth
AC 400KV
CSC HVDC 500KV
VSC HVDC 300KV
AC 220KV
Shoreline
AC Platforms
HVDCPlatform
Possible Interface Substation Configuration
To Torness
To Eccles
Legend
AC cable offshore HVDC cable offshore
AC connection point
HVDC connection point
Round 3 windfarm area
Round 2 windfarm area
Round 1 windfarm area
Windfarm Array
Region for Onshore Reinforcement Development
AC 275kV
Shoreline
HVDCPlatform
HVDCPlatform
Possible Interface Substation Configuration
To Dounreay
To Beaully
VSCHVDC 300KV
AC400kV
VSCHVDC 300KV
VSCHVDC300KV
HVDCPlatform
2VSC HVDC 300KV
HVDCPlatform
R3 Z1 Moray Firth
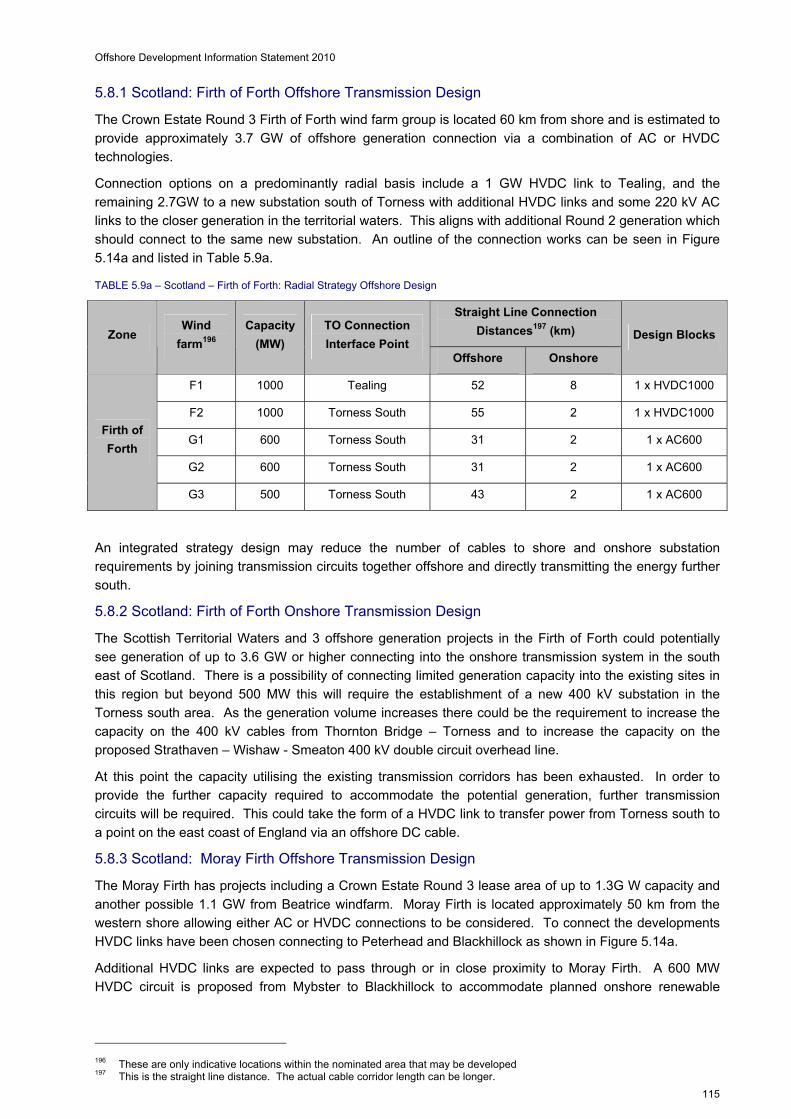
Offshore Development Information Statement 2010
115
5.8.1 Scotland: Firth of Forth Offshore Transmission Design
The Crown Estate Round 3 Firth of Forth wind farm group is located 60 km from shore and is estimated to
provide approximately 3.7 GW of offshore generation connection via a combination of AC or HVDC
technologies.
Connection options on a predominantly radial basis include a 1 GW HVDC link to Tealing, and the
remaining 2.7GW to a new substation south of Torness with additional HVDC links and some 220 kV AC
links to the closer generation in the territorial waters. This aligns with additional Round 2 generation which
should connect to the same new substation. An outline of the connection works can be seen in Figure
5.14a and listed in Table 5.9a.
TABLE 5.9a – Scotland – Firth of Forth: Radial Strategy Offshore Design
Straight Line Connection
Distances197 (km) Zone Wind
farm196
Capacity
(MW)
TO Connection
Interface Point Offshore Onshore
Design Blocks
F1 1000 Tealing 52 8 1 x HVDC1000
F2 1000 Torness South 55 2 1 x HVDC1000
G1 600 Torness South 31 2 1 x AC600
G2 600 Torness South 31 2 1 x AC600
Firth of
Forth
G3 500 Torness South 43 2 1 x AC600
An integrated strategy design may reduce the number of cables to shore and onshore substation
requirements by joining transmission circuits together offshore and directly transmitting the energy further
south.
5.8.2 Scotland: Firth of Forth Onshore Transmission Design
The Scottish Territorial Waters and 3 offshore generation projects in the Firth of Forth could potentially
see generation of up to 3.6 GW or higher connecting into the onshore transmission system in the south
east of Scotland. There is a possibility of connecting limited generation capacity into the existing sites in
this region but beyond 500 MW this will require the establishment of a new 400 kV substation in the
Torness south area. As the generation volume increases there could be the requirement to increase the
capacity on the 400 kV cables from Thornton Bridge – Torness and to increase the capacity on the
proposed Strathaven – Wishaw - Smeaton 400 kV double circuit overhead line.
At this point the capacity utilising the existing transmission corridors has been exhausted. In order to
provide the further capacity required to accommodate the potential generation, further transmission
circuits will be required. This could take the form of a HVDC link to transfer power from Torness south to
a point on the east coast of England via an offshore DC cable.
5.8.3 Scotland: Moray Firth Offshore Transmission Design
The Moray Firth has projects including a Crown Estate Round 3 lease area of up to 1.3G W capacity and
another possible 1.1 GW from Beatrice windfarm. Moray Firth is located approximately 50 km from the
western shore allowing either AC or HVDC connections to be considered. To connect the developments
HVDC links have been chosen connecting to Peterhead and Blackhillock as shown in Figure 5.14a.
Additional HVDC links are expected to pass through or in close proximity to Moray Firth. A 600 MW
HVDC circuit is proposed from Mybster to Blackhillock to accommodate planned onshore renewable
196 These are only indicative locations within the nominated area that may be developed 197 This is the straight line distance. The actual cable corridor length can be longer.

Offshore Development Information Statement 2010
116
developments and relieve Caithness. To connect the planned Viking windfarm on Shetland a 600 MW
HVDC link is proposed, again connecting to Blackhillock.
TABLE 5.9b – Scotland – Moray Firth: Radial Strategy Offshore Design
With the support of a European capital grant of €74.1m under the European Energy Programme for
Recovery (EEPR) SHETL is progressing development work on the establishment of the first HVDC
offshore hub and deployment of multi-terminal VSC HVDC technology to facilitate an integrated solution to
the above, as illustrated in Figure 5.14b. This approach will reduce the number of circuits to shore,
reduce the overall cost and provide greater flexibility to accommodate different permutations and timings
of the generation projects.
5.8.4 Scotland: West Coast Offshore Transmission Design
Considerable additional offshore generation capacity is expected to develop off the Scottish West Coast
and a number of projects in the Scottish Territorial Waters have already been identified (such as the Argyll
Array, Islay and Kintyre). These pose some challenges to connect as they require navigation around or
across many Western Islands and rough terrain before reaching any significant onshore transmission
infrastructure.
The Argyll Array (potentially 1500 MW just south of Tiree) could be connected with a single HVDC link to
Dalmally 275 kV substation. Some onshore reinforcements would also be required to support the
Dalmally connection.
5.8.5 Caithness and Northern Isles Transmission Design
The Pentland Firth, Orkney and Shetland offer further potential for renewable generation development, not
only for wind but also wave and tidal generation. While there is significant potential and interest along the
North coast it is unclear at the moment how much of the resource will be exploited and when.
The onshore transmission in the far north of Scotland limits how much new generation capacity could be
accommodated without major reinforcement. AC subsea cables and larger HVDC links options are being
considered to connect new generation in this area. Subject to the predicted growth in wind and marine
generation materialising in this area, it is likely that the longer term network solution will involve the use of
further HVDC links that integrate into the current reinforcement strategies that are described above in
5.8.3.
5.8.6 The Western Isles
The design solution for the Western Isles is a single 450 MW HVDC link from Gravir on Lewis to Beauly
on the Scottish mainland. It is being driven by proposed wind farms on the Isle of Lewis. Pre-construction
development and consents for the HVDC link are substantially complete. There is substantial marine
resource and further wind resource on and around the Western Isles. The proposed 450 MW link includes
an option to double up on the 76 km onshore cable section between Dundollell and Beauly on the Scottish
mainland at the time of construction. This would avoid the repeat environmental impact of extended
undergrounding at a later date whilst still providing scope for accommodating further renewable
generation in the future.
198 These are only indicative locations within the nominated area that may be developed. 199 This is the straight line distance. The actual cable corridor length can be longer.
Straight Line
Connection
Distances199 (km) Zone Wind
farm198 Capacity (MW) TO Interface Point
Offshore Onshore
Design
Blocks
C1 300 Peterhead 130 15 1 x HVDC1000 Moray Firth
D1 1000 Blackhillock 101 28 1 x HVDC1000
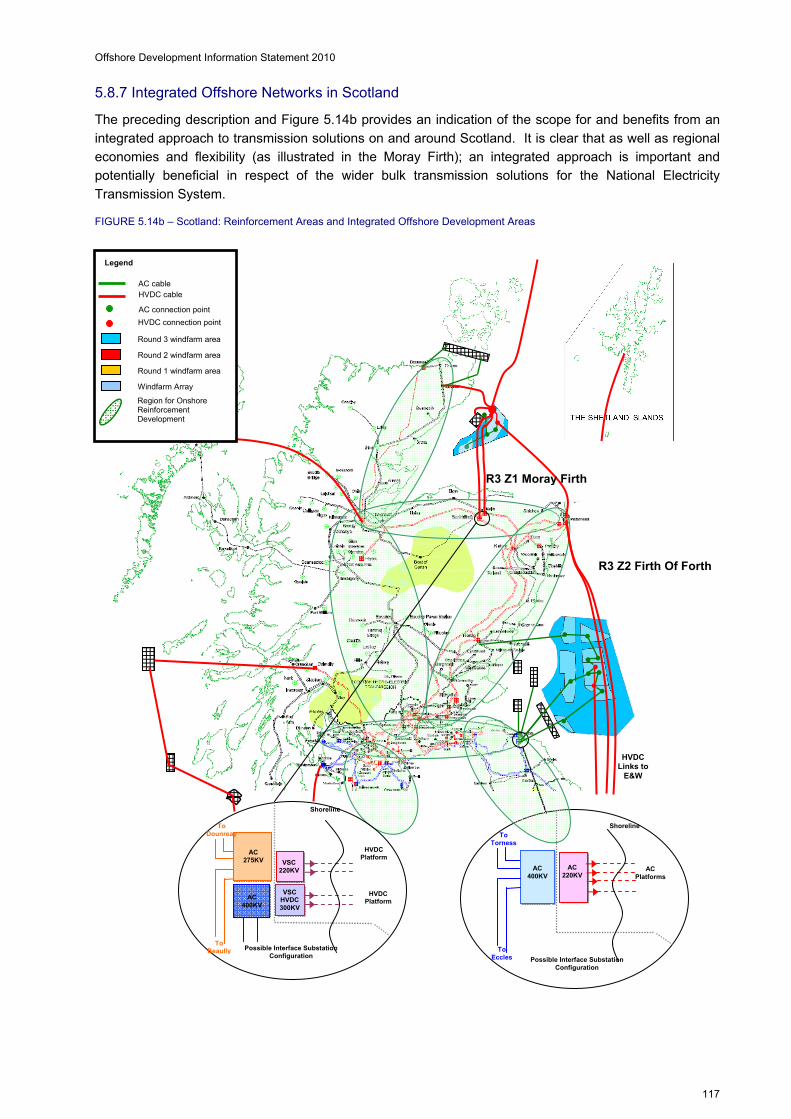
Offshore Development Information Statement 2010
117
5.8.7 Integrated Offshore Networks in Scotland
The preceding description and Figure 5.14b provides an indication of the scope for and benefits from an
integrated approach to transmission solutions on and around Scotland. It is clear that as well as regional
economies and flexibility (as illustrated in the Moray Firth); an integrated approach is important and
potentially beneficial in respect of the wider bulk transmission solutions for the National Electricity
Transmission System.
FIGURE 5.14b – Scotland: Reinforcement Areas and Integrated Offshore Development Areas
HVDC Links to
E&W
AC400KV
AC 220KV
Shoreline
AC Platforms
Possible Interface Substation Configuration
To Torness
To Eccles
Legend
AC cable HVDC cable
AC connection point
HVDC connection point
Round 3 windfarm area
Round 2 windfarm area
Round 1 windfarm area
Windfarm Array
Region for Onshore Reinforcement Development
R3 Z2 Firth Of Forth
AC 275KV
VSC HVDC 300KV
VSC 220KV
Shoreline
HVDCPlatform
Possible Interface Substation Configuration
To Dounreay
To Beaully
HVDCPlatform
AC 400KV
R3 Z1 Moray Firth
Offshore Development Information Statement 2010
118
Chapter Six
Main Interconnected Transmission System Considerations
6.1 Background and Assessment Methodology
The Main Interconnected Transmission System (MITS) needs to evolve as the distribution and level of
generation and demand changes across Scotland, England and Wales.
In order to quantify and analyse power flow capability entering or leaving a geographical region of interest
at a given time, the term ‘boundary capability’ is often used. The boundaries are pre-defined borders
which split the country into two adjacent regions. The boundaries are typically set so they cross critical
transmission routes and are used as an important tool to study and discuss MITS capability. The
advantage of using such a concept rather than a repetitive individual line analysis is the added information
it provides about boundary constraints. Once the boundary constraints have been identified, appropriate
reinforcement will aid in strengthening the network around the constraint region and thus reduce the
constraint.
The areas either side of a boundary are considered to be either importing or exporting depending on the
balance of generation and demand within the area. The greater the imbalance in the enclosed area the
greater the boundary transfer across the transmission circuits. For the National Electricity Transmission
System (NETS), the most onerous conditions are typically at winter peak when demand is highest and
most generation is operating. This is the condition that most assessments study and the boundary
analysis presented here reflects this condition.
In essence the ‘boundary capability’ must satisfy all the standards set out in the NETS SQSS and meet
values of required transfer and voltage compliance under fault conditions, (N-1, N-D and N-2). The NETS
SQSS defines a process by which the required transfer capability of each MITS boundary can be
determined, based upon the balance of generation and demand on each side of the boundary this is the
‘planned transfer’ capability of the MITS boundary. The required transfer capability can then be compared
with the planned transfer capability of the MITS boundary to assess whether it requires reinforcement.
The boundary capability and the future required transfer graphs shown in this chapter have all been
calculated against the requirements of the NETS SQSS200.
Within the planned transfer calculation a ranking list of generation, based upon the future scenario (as
described in Chapter 4), is used to identity the likeliest generation to be in operation during peak
transmission system demand. From that, each generator’s MW output can be calculated. All the different
future scenario generation ranking orders assume that as wind generation increases, the level of non-wind
generation at the bottom of the ranking order falls out of merit, (i.e. new wind generation tends to displace
existing conventional generation). As generation increases in one region, this will displace generation in
other regions, keeping the total demand and generation in balance. The inverse is true for plant closures.
These changes alter the planned transfers across a boundary as follows:
Unchanged if new generation displaces existing generation on the same side of the boundary;
Increased if new generation is added on the side of the boundary with a generation surplus, and
displaces generation on the side of the boundary with a generation deficit;
Decreased if new generation is added on the side of the boundary with a generation deficit, and
displaces generation on the side of the boundary with a generation surplus.
This chapter shows the effect of the future scenarios on selected key boundaries. Graphs are presented
for key boundaries showing the required transfers, boundary capabilities and reinforcement requirements.
200 http://www.nationalgrid.com/uk/Electricity/Codes/gbsqsscode/DocLibrary/ http://www.nationalgrid.com/NR/rdonlyres/149DEAE1-46B0-4B20-BF9C-66BDCB805955/35218/NETSSQSS_GoActive_240609.pdf

Offshore Development Information Statement 2010
119
It should be noted that the suitability of the existing NETS SQSS used for determining the required
boundary transfer capability is presently under review, as a result of the expected increase in intermittent
renewable generation and a corresponding increase in overall generation variability. If the NETS SQSS is
found to be sub-optimal, the standard may be revised, altering the boundary capabilities deemed
necessary. Any changes to the NETS SQSS arising from the current reviewers are not expected to alter
the requirements of boundary capability by more than a few hundred MW.
The analysis undertaken for this chapter is based on the Radial strategic design. The integrated design
strategy will produce different MITS boundary transfers as the offshore generation connects to different
points, additional transmission routes are available offshore and with the use of HVDC technology, the
power transfer is controllable. The latter would be achievable by extending and linking the MITS with the
offshore integrated network resulting in an improved network design. There is scope for the conceptual
integrated offshore network to be considered as part of the onshore MITS, as this will alleviate some of
the constraints normally associated with bulk power transfers on the main onshore transmission system.
The NETS SQSS will need to be extended to cover interconnected offshore networks as the current
provisions for the MITS do not extend to cover such a network.

Offshore Development Information Statement 2010
120
6.2 Boundary Map
FIGURE 6.1 - MITS Boundary Map (also available in Appendix 2)
Offshore Development Information Statement 2010
121
6.3 MITS Reinforcement Options
The analysis of onshore MITS reinforcements is dominated by the requirements of the NETS SQSS. For
a given background of generation and demand and for each MITS boundary on the transmission system,
the NETS SQSS principally gives a 'rule-of-thumb', in the form of the required boundary capability. This is
the amount of MW that can be securely transferred across the boundary at time of peak, without infringing
either circuit ratings or voltage and stability limits.
Where the network is such that an actual boundary transmission capability is less than the NETS SQSS
requirement, then new transmission works to reinforce that boundary are required. If a suitable
reinforcement can not be delivered by the year required, then that system boundary would be non-
compliant with the NETS SQSS under that scenario and a derogation may be required until suitable
boundary capability can be provided. It is the responsibility of each TO to propose and deliver the most
economic and efficient reinforcements without hindering the connection of any customer. Where
reinforcement may only be needed for a short period it may be more efficient to not undertake the work
and temporarily restrict the network power flows. This can avoid infrastructure investment but the cost
and risk of constraining the MITS needs to be considered.
Following DECC's implementation of the 'Connect and Manage'201 regime in August 2010, the position on
derogations is a little more complex than previously:
Where the underlying cause of the derogation is not linked to any new generation, connecting under
the 'Connect and Manage' regime, then NGET (acting in its role as NETSO) and the relevant TO have
to seek endorsement of a derogation from Ofgem in the previous way, (this case will become the
exception, going forwards).
Where the underlying cause of the derogation is the connection of new generation under the 'Connect
and Manage' regime, such that the timescales (often four years) of the new generation are in advance
of the ability of the TO to deliver wider system reinforcements in time, then the TO self-derogates the
non-compliance with the NETS SQSS. Such a self-derogation has to be accompanied by reports to
Ofgem, which (at minimum) state:
- the nature of the derogation;
- the expected consequences, (which are likely to include costs of additional constraints, and may
include benefits of new generation connected);
- the long-term solution, which is normally a transmission reinforcement; and
- the duration of the derogation – i.e. when the reinforcement is expected to remove the derogation.
For this Statement the NETS SQSS boundary power flow required transfer has been plotted for each
boundary and scenario. Against each boundary a set of MITS reinforcements has been identified which
satisfies the requirements for the majority of the future scenarios. The reinforcements may not cover the
extremes of all of the requirements for all the scenarios as to do this would give rise to a high risk of over
investment.
Many of the identified reinforcements for the MITS boundaries in this chapter have also been identified in
the report: ENSG 'Our Electricity Transmission Network: A Vision for 2020'. Please note that the ENSG
report also contained several reinforcements required to address local issues. These reinforcements have
been considered in Chapter 5.
Table 6.1 below shows the table of reinforcements developed following the analysing of the MITS network
and which are used in the following boundary discussion. Each reinforcement identified in the table has
an associated year that it would be required against each future scenario and boundary. The time when
the reinforcement could actually be physically delivered may be much later than the requirement date
shown in the table. This can be due to many factors, particularly when the reinforcement project is large
201 http://www.decc.gov.uk/en/content/cms/consultations/improving_grid/improving_grid.aspx http://www.ensg.gov.uk/assets/ensg_transmission_pwg_full_report_final_issue_1.pdf

Offshore Development Information Statement 2010
122
as each project can represent significant work in terms of planning, surveying, obtaining consents, funding
and construction. Where there is an expected difference between the requirement date and soonest
possible delivery date the date has been highlighted.
Table 6.1 - Table of Reinforcement on the Onshore MITS
Year Required For Each Scenario
Ref. Description Boundary SP GG AG SG
WS1
Reconductor Harker – Hutton – Quernmore:
- 2 x 116 km of GZTACSR conductor.
B7 2014 2011 2011 2011
WS2
Series and Shunt Compensation:
- Harker - Hutton circuits.
- Harker - Stella circuits.
- Stella - Spennymoor circuits.
B6 2010 2010 2010 2010
B6 2013 2011 2011 2011
B7 2015 2014 2014 2014
B11 N/A N/A 2019 2017
B16 N/A N/A 2018 2015
WS3
West Coast HVDC Link:
- HVDC cable connection from Deeside to Hunderston, ~400 km, submarine and land sections.
- HVDC converter ~2 GW capacity installation at Deeside and Hunterston.
- Deeside: New 400 kV 21 bay GIS substation together with line entry and generator connection rationalisation.
- Substation extension at Hunterston. B32 2015 2014 2014 2014
B6 N/A 2018 2018 2018
B7 N/A 2020 2019 2020
B11 N/A N/A 2020 2024
WS4
East Coast HVDC Link:
- Extend Norton 400 kV GIS by one bay for new Hawthorn Pit circuit.
- Up-rate existing Hawthorn Pit to Norton 275 kV circuit to 400kV operation, transfer into 400 kV substations.
- Hawthorn Pit: establish new 400 kV substation (9 bay) plus one additional 400/275kV supergrid transformer connected to existing Hawthorn Pit 275 kV. Modify line entries.
- HVDC cable connection from Hawthorn Pit to Peterhead, ~360 km, submarine and land sections.
- HVDC converter ~2 GW capacity installation at Hawthorn Pit and Peterhead.
- Reconductoring from 275 to 400 kV from Rothienorman to Peterhead, and a new 400 kV substations at Rothienorman and Peterhead.
B32 N/A 2020 2018 2016
B6 N/A N/A 2020 2023 WS5
Torness to Lackenby HVDC Link:
- 2 GW HVDC link from Torness to Lackenby. B7 N/A N/A 2023 N/A
WS6 Penwortham Quad boosters:
- Quad boosters at Penwortham. B32 N/A 2020 2018 2016
R1.7
Wylfa to Pembroke 2 GW HVDC link:
- 115 km HVDC cable link.
- Extension of Pentir and Pembroke Substations.
B8
N/A
N/A
2020
2022
LN1
Up-rate Hackney - Tottenham - Waltham Cross circuit to 400 kV:
- New 400 kV substation at Waltham Cross and associated circuit changes.
- Up-rate and reconductor Hackney – Tottenham - Waltham Cross circuit to 400 kV.
- Modify Tottenham substation.
- Install two 400/132 kV super grid transformers (SGTs) at Brimsdown substation.
B14 2015 2015 2015 2015
This is the date when the reinforcement may be needed however it is not expected that the works will be achievable by this date due to construction, consents and planning issues.

Offshore Development Information Statement 2010
123
MITS reinforcements may increase the transfer capability across only a single boundary, or may benefit
multiple boundaries, (depending on the nature of the reinforcement and the surrounding network). An
example of this is the west coast HVDC link which provides approximately 2 GW of additional capability
across the Anglo Scottish region B6 and B7. The boundaries that benefit from each reinforcement are
indicated in Table 6.1.
The distribution of generation, demand and transmission infrastructure across a boundary will eventually
dictate the reinforcement requirement and time when it may be needed. The timing may be set by
whichever boundary requires the reinforcement first or when the total cost of constraints on all affected
boundaries exceeds the threshold needed for the reinforcement to be cost-effective.
The graphs shown in this chapter show both the required transfers for each boundary, (for the selected
boundaries under the given future scenario), superimposed with the present and future capabilities under
the given reinforcements. The reinforcements are shown on the graph as step changes, indicating the
possible benefit and capability of each reinforcement which could be achieved if the reinforcements are
implemented. The positioning of the step reinforcement step changes on the graphs reflects dates that
may be practically achieved and may not fully cover the boundary requirements.
In essence the results displayed are intended to illustrate the continuous change of the MITS boundaries
over time and how the timing of MITS reinforcements may vary under the different future scenarios. It is
important to state that the results are qualitative and not quantitative as it gives a general prediction of the
trend throughout the study period. In reality, each boundary transfer can be effected in numerous ways
and fluctuate over short and long timescales due to different patterns of generation and demand.
Some of the projects proposed to address local network congestion do also provide a benefit to the wider
system boundaries. Please review Chapter 5 for the details of such projects.

Offshore Development Information Statement 2010
124
6.4 Boundaries Considered
For the purpose of analysing the capability of the MITS and determine the need for onshore transmission
reinforcement, it is useful to divide up the system and consider power transfers across certain critical
boundaries. Nine of these critical boundaries which are directly impacted by offshore generation
connections have been selected in this case. These are described and explained in each sub-section of
this chapter, accompanied with a detailed explanation of the trends associated with the backgrounds and
capabilities. It should be noted that this selection was also based on the size of boundaries, with the nine
selected boundaries being wider system boundaries rather than local system boundaries (i.e. the
generation within the boundary is greater than 1,500 MW).
The analysis was conducted assuming the Radial offshore design. This is because the Radial design
requires the same MITS reinforcements as the Radial Plus design but much more reinforcements
compared to the integrated design strategy and hence represents the most onerous conditions from an
onshore reinforcement perspective. Moreover, developers are currently planning their work with respect
to the Radial offshore design.
Seven boundaries were selected from the north; three in the Anglo Scottish region, (B6, B7 and B32), two
in the Midlands regions, (B8 and B9), one in the north east and Yorkshire (B11) and one in north east,
Trent and Yorkshire (B16). In addition to these two southern boundaries were selected, one being south
west, (B12), and London (B14). It can be seen that chosen boundaries offer a wide representation of the
capability across different regions of Great Britain.
The lines shown on the later graphs are assigned a particular colour to indicate the required transfer for
each future scenario. Refer to Table 6.1 for step changes in capability which arises from the proposed
reinforcements, identified by a WS prefix in the individual boundary reinforcement figures. The Slow
Progression (SP) future scenario is assigned a blue colour, while the Gone Green (GG) future scenario
is assigned a green colour, Accelerated Growth (AG) is represented as an orange line and Sustainable
Growth (SG) is represented as a plum coloured line. A solid black line represents the capability of the
boundary against the Gone Green scenario before and after reinforcement is applied. The improvement
due to a particular reinforcement is shown as a step in the capability and the recommended reinforcement
is identified on the graph using its reference number as specified in Table 6.1 above. In some cases
where the Accelerated Growth scenario requirement is much higher than the Gone Green scenario,
reinforcements have been identified for the Accelerated Growth scenario and these are shown as black
dotted lines.
Although the discussion in this chapter frequently uses the expression that certain reinforcements ‘are
required’ in certain years, this should be understood as: for a given future scenario the reinforcement
implemented will achieve compliance for that given year within the study period. Discrepancies may occur
between the future scenarios, due to differences in generation and demand which would result in the
reinforcement to be applied in a different year within the study period.
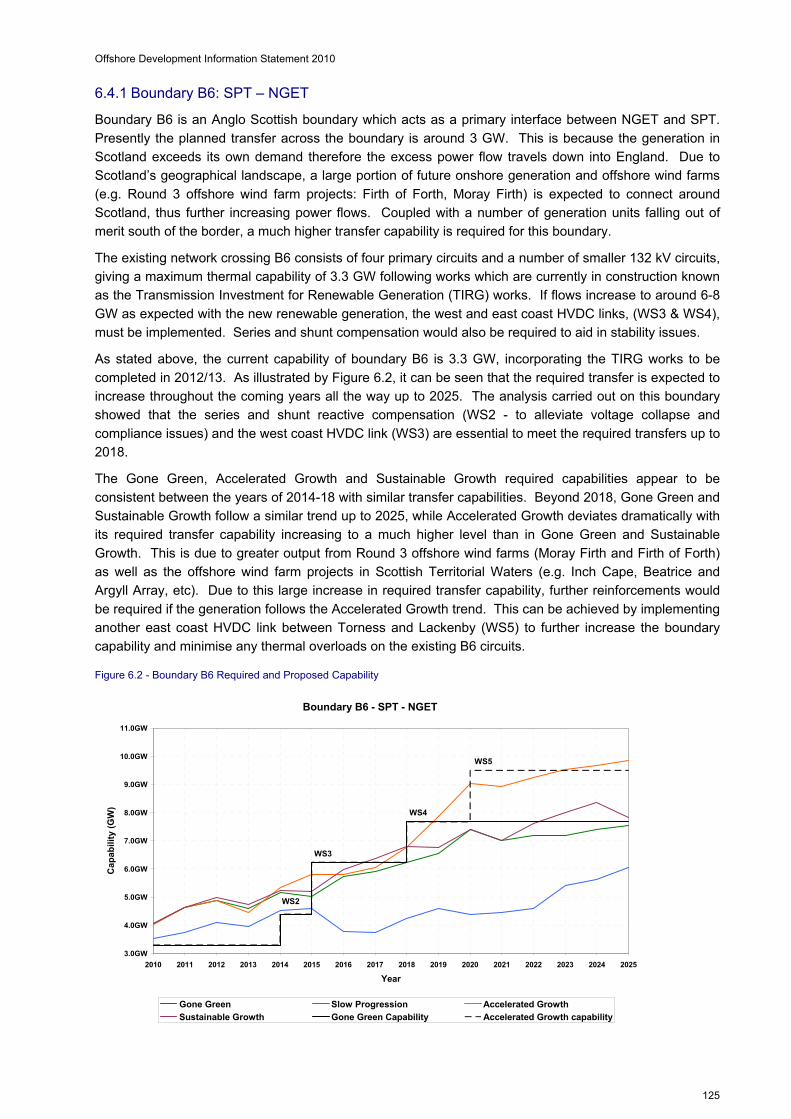
Offshore Development Information Statement 2010
125
6.4.1 Boundary B6: SPT – NGET
Boundary B6 is an Anglo Scottish boundary which acts as a primary interface between NGET and SPT.
Presently the planned transfer across the boundary is around 3 GW. This is because the generation in
Scotland exceeds its own demand therefore the excess power flow travels down into England. Due to
Scotland’s geographical landscape, a large portion of future onshore generation and offshore wind farms
(e.g. Round 3 offshore wind farm projects: Firth of Forth, Moray Firth) is expected to connect around
Scotland, thus further increasing power flows. Coupled with a number of generation units falling out of
merit south of the border, a much higher transfer capability is required for this boundary.
The existing network crossing B6 consists of four primary circuits and a number of smaller 132 kV circuits,
giving a maximum thermal capability of 3.3 GW following works which are currently in construction known
as the Transmission Investment for Renewable Generation (TIRG) works. If flows increase to around 6-8
GW as expected with the new renewable generation, the west and east coast HVDC links, (WS3 & WS4),
must be implemented. Series and shunt compensation would also be required to aid in stability issues.
As stated above, the current capability of boundary B6 is 3.3 GW, incorporating the TIRG works to be
completed in 2012/13. As illustrated by Figure 6.2, it can be seen that the required transfer is expected to
increase throughout the coming years all the way up to 2025. The analysis carried out on this boundary
showed that the series and shunt reactive compensation (WS2 - to alleviate voltage collapse and
compliance issues) and the west coast HVDC link (WS3) are essential to meet the required transfers up to
2018.
The Gone Green, Accelerated Growth and Sustainable Growth required capabilities appear to be
consistent between the years of 2014-18 with similar transfer capabilities. Beyond 2018, Gone Green and
Sustainable Growth follow a similar trend up to 2025, while Accelerated Growth deviates dramatically with
its required transfer capability increasing to a much higher level than in Gone Green and Sustainable
Growth. This is due to greater output from Round 3 offshore wind farms (Moray Firth and Firth of Forth)
as well as the offshore wind farm projects in Scottish Territorial Waters (e.g. Inch Cape, Beatrice and
Argyll Array, etc). Due to this large increase in required transfer capability, further reinforcements would
be required if the generation follows the Accelerated Growth trend. This can be achieved by implementing
another east coast HVDC link between Torness and Lackenby (WS5) to further increase the boundary
capability and minimise any thermal overloads on the existing B6 circuits.
Figure 6.2 - Boundary B6 Required and Proposed Capability
Boundary B6 - SPT - NGET
3.0GW
4.0GW
5.0GW
6.0GW
7.0GW
8.0GW
9.0GW
10.0GW
11.0GW
2010 2011 2012 2013 2014 2015 2016 2017 2018 2019 2020 2021 2022 2023 2024 2025
Year
Cap
abili
ty (
GW
)
Gone Green Slow Progression Accelerated Growth
Sustainable Growth Gone Green Capability Accelerated Growth capability
WS2
WS3
WS4
WS5

Offshore Development Information Statement 2010
126
6.4.2 Boundary B7: SPT – NGET Upper North
Boundary B7 is another boundary found within the Anglo Scottish region and is located south of B6. B7 is
characterised by six primary circuits all rated at 400 kV.
As illustrated by Figure 6.3, it can be seen that the trend traces are broadly similar to B6 (Figure 6.2) thus
the reinforcements required for boundary B6 are also valid for B7. The two most essential reinforcements
applied to this boundary are (i) the re-conductoring of Harker-Hutton from 1.37 GVA to 3.1 GVA per circuit
(WS1) which will improve the thermal and voltage limits of the boundary and (ii) the west coast HVDC link
(WS3) between Hunterston and Deeside which increases the capability of B7 significantly by providing an
additional 2 GW across the boundary. These two identified reinforcements are sufficient to provide a
boundary capability higher than the required transfer up to 2018-2019.
The Gone Green, Accelerated Growth and Sustainable Growth future scenarios require a higher capability
in 2020, due to a higher planned and required transfer, (a consequence of a large proportion of potential
LCPD closures in England and Wales, as well as a ‘net’ increase in generation from Scotland). In order to
achieve the desired required transfer, both HVDC links (east & west) must be installed, providing a
capability of 8.4 GW. The east coast HVDC link (WS4) provides approximately 1.3 GW of additional B7
capability. This particular reinforcement helps the power flow to be redistributed in the northern region of
B7 thus alleviating any voltage compliance issues associated with this boundary, as in accordance to
NETS SQSS standards. If Accelerated Growth is considered, then the Torness to Lackenby HVDC link
(WS5) would be necessary.
Figure 6.3 - Boundary B7 Required and Proposed Capability
Boundary B7 - NGET Upper North
3.0GW
4.0GW
5.0GW
6.0GW
7.0GW
8.0GW
9.0GW
10.0GW
11.0GW
2010 2011 2012 2013 2014 2015 2016 2017 2018 2019 2020 2021 2022 2023 2024 2025
Year
Ca
pa
bil
ity
(G
W)
Gone Green Slow Progression Accelerated Growth
Sustainable Growth Gone Green capability Accelerated Growth capability
WS1
WS3
WS4
WS5

Offshore Development Information Statement 2010
127
6.4.3 Boundary B11: NGET North East & Yorkshire
Boundary B11 is referred to as the north east and Yorkshire boundary as it begins roughly at the same
location as B7 cutting across the Harker-Hutton 400 kV circuits but then travels south to include the
Manchester and Leeds areas. The boundary then cuts east to encompass the north east coast including
Killingholme and Grimsby.
This boundary is of great importance as it is characterised by the “bulk” flow travelling from of the north to
the south of England. It is also a key region of great interest as a large portion of Round 1 and 2 offshore
wind farms lie to the north of the boundary, along with the Round 3 offshore wind farms (Dogger Bank and
Hornsea). The circuits across this boundary must be capable of catering for any increased load flows that
may result from growth in generation north of the boundary.
From Figure 6.4, it can be seen that the dominant backgrounds are Accelerated Growth and Sustainable
Growth due to the higher volumes of northern generation. The existing capability of the boundary is in the
region of 10 GW which is sufficient to handle the level of flows crossing the boundary for all the
backgrounds up to 2017. By 2017, the first signs of generation increase are shown in Sustainable Growth
where the existing capability is insufficient to meet the required transfer. As Accelerated Growth and
Sustainable Growth follow an upward trend, both east and west coast HVDC links (WS3 and WS4) will
provide the additional capacity to meet all the future scenarios, with sufficient capacity left for future
growth in generation north of the boundary.
Figure 6.4 - Boundary B11 Required and Proposed Capability
Boundary B11 - NGET North East & Yorkshire
6.0GW
7.0GW
8.0GW
9.0GW
10.0GW
11.0GW
12.0GW
13.0GW
14.0GW
2010 2011 2012 2013 2014 2015 2016 2017 2018 2019 2020 2021 2022 2023 2024 2025
Year
Ca
pa
bil
ity
(G
W)
Gone Green Slow Progression Accelerated Growth
Sustainable Growth Gone Green Capability Accelerated Growth capability
WS3
WS4
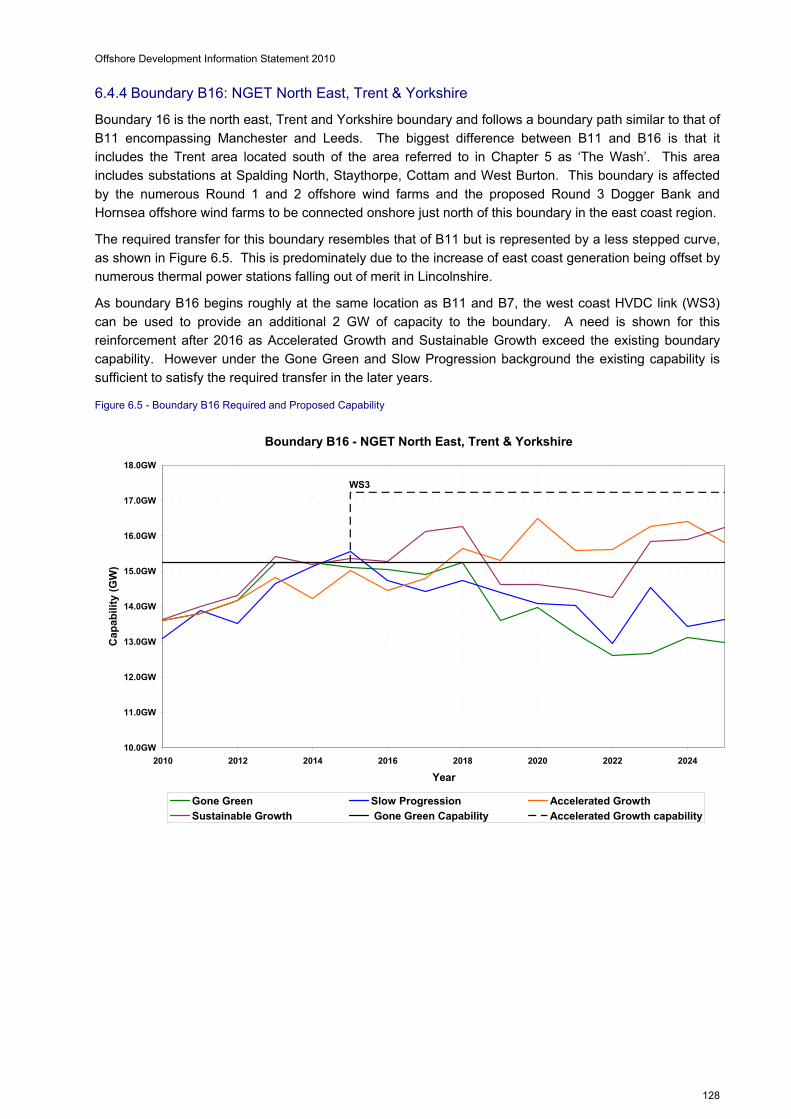
Offshore Development Information Statement 2010
128
6.4.4 Boundary B16: NGET North East, Trent & Yorkshire
Boundary 16 is the north east, Trent and Yorkshire boundary and follows a boundary path similar to that of
B11 encompassing Manchester and Leeds. The biggest difference between B11 and B16 is that it
includes the Trent area located south of the area referred to in Chapter 5 as ‘The Wash’. This area
includes substations at Spalding North, Staythorpe, Cottam and West Burton. This boundary is affected
by the numerous Round 1 and 2 offshore wind farms and the proposed Round 3 Dogger Bank and
Hornsea offshore wind farms to be connected onshore just north of this boundary in the east coast region.
The required transfer for this boundary resembles that of B11 but is represented by a less stepped curve,
as shown in Figure 6.5. This is predominately due to the increase of east coast generation being offset by
numerous thermal power stations falling out of merit in Lincolnshire.
As boundary B16 begins roughly at the same location as B11 and B7, the west coast HVDC link (WS3)
can be used to provide an additional 2 GW of capacity to the boundary. A need is shown for this
reinforcement after 2016 as Accelerated Growth and Sustainable Growth exceed the existing boundary
capability. However under the Gone Green and Slow Progression background the existing capability is
sufficient to satisfy the required transfer in the later years.
Figure 6.5 - Boundary B16 Required and Proposed Capability
Boundary B16 - NGET North East, Trent & Yorkshire
10.0GW
11.0GW
12.0GW
13.0GW
14.0GW
15.0GW
16.0GW
17.0GW
18.0GW
2010 2012 2014 2016 2018 2020 2022 2024
Year
Cap
abil
ity
(GW
)
Gone Green Slow Progression Accelerated Growth
Sustainable Growth Gone Green Capability Accelerated Growth capability
WS3
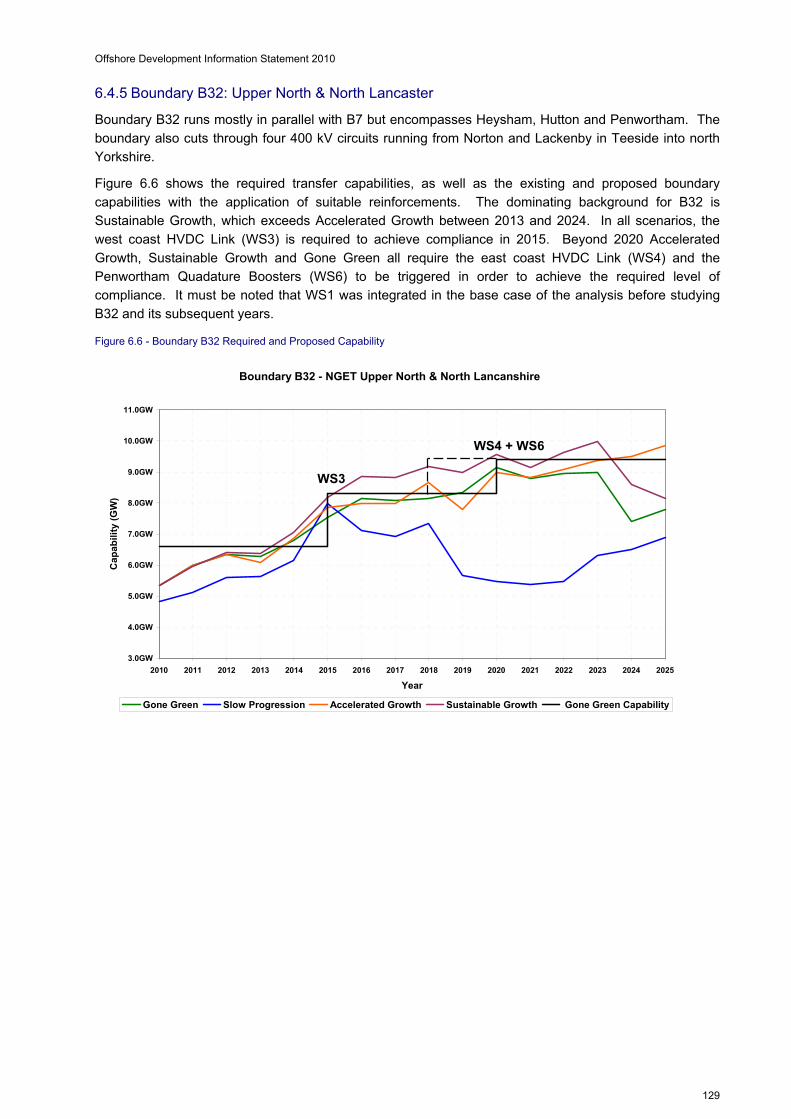
Offshore Development Information Statement 2010
129
6.4.5 Boundary B32: Upper North & North Lancaster
Boundary B32 runs mostly in parallel with B7 but encompasses Heysham, Hutton and Penwortham. The
boundary also cuts through four 400 kV circuits running from Norton and Lackenby in Teeside into north
Yorkshire.
Figure 6.6 shows the required transfer capabilities, as well as the existing and proposed boundary
capabilities with the application of suitable reinforcements. The dominating background for B32 is
Sustainable Growth, which exceeds Accelerated Growth between 2013 and 2024. In all scenarios, the
west coast HVDC Link (WS3) is required to achieve compliance in 2015. Beyond 2020 Accelerated
Growth, Sustainable Growth and Gone Green all require the east coast HVDC Link (WS4) and the
Penwortham Quadature Boosters (WS6) to be triggered in order to achieve the required level of
compliance. It must be noted that WS1 was integrated in the base case of the analysis before studying
B32 and its subsequent years.
Figure 6.6 - Boundary B32 Required and Proposed Capability
Boundary B32 - NGET Upper North & North Lancanshire
3.0GW
4.0GW
5.0GW
6.0GW
7.0GW
8.0GW
9.0GW
10.0GW
11.0GW
2010 2011 2012 2013 2014 2015 2016 2017 2018 2019 2020 2021 2022 2023 2024 2025
Year
Cap
ab
ilit
y (G
W)
Gone Green Slow Progression Accelerated Growth Sustainable Growth Gone Green Capability
WS3
WS4 + WS6

Offshore Development Information Statement 2010
130
6.4.6 Boundary B8: NGET North to Midlands
Boundary B8 crosses approximately through the centre of the MITS network, separating the north from
the Midlands and the south. Several Round 1 and 2 offshore wind farms, the Irish Sea and much of the
Dogger Bank and Hornsea Round 3 offshore wind farms are expected to connect to the onshore network
just north of B8.
The required transfers across Boundary B8 tend to vary between 8-10 GW throughout 2010-2020 before
a steep increase in required transfer in 2020 in the Accelerated Growth and Sustainable Growth
scenarios. The rate of increase in required transfers of these two scenarios then levels off as the closure
of older thermal and CCGT plant in the region counterbalances much of the new renewable generation
connections.
The increase in transfers seen from 2019 can be attributed to a forecast closure of thermal plant in the
south of the country and further increases in northern renewable generation. The addition of a HVDC link
(R1.7) from Wylfa to Pembroke will provide the additional boundary capacity to satisfy the additional
transfers beyond 2020.
Figure 6.7 - Boundary B8 Required and Proposed Capability
Boundary B8 - NGET North to Midlands
4.0GW
5.0GW
6.0GW
7.0GW
8.0GW
9.0GW
10.0GW
11.0GW
12.0GW
13.0GW
14.0GW
2010 2011 2012 2013 2014 2015 2016 2017 2018 2019 2020 2021 2022 2023 2024 2025
Year
Cap
abil
ity
(G
W)
Gone Green Slow Progression Accelerated Growth
Sustainable Growth Gone Green Capability Accelerated Growth capability
R1.7
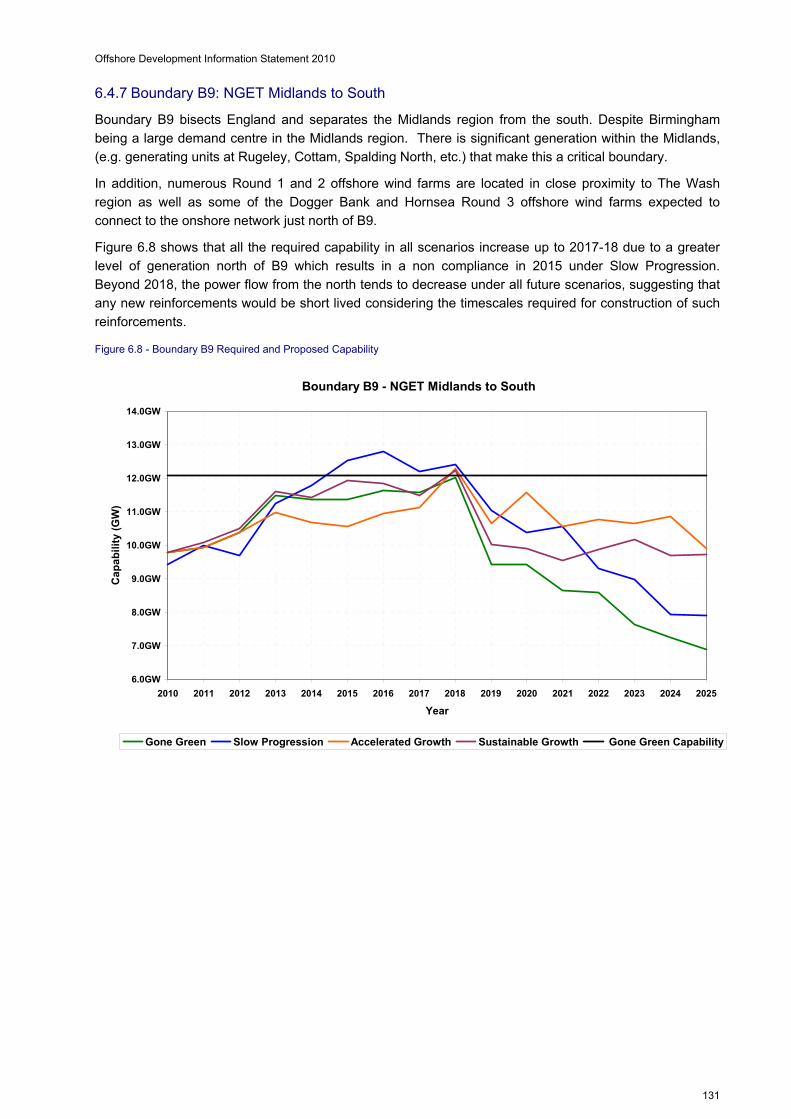
Offshore Development Information Statement 2010
131
6.4.7 Boundary B9: NGET Midlands to South
Boundary B9 bisects England and separates the Midlands region from the south. Despite Birmingham
being a large demand centre in the Midlands region. There is significant generation within the Midlands,
(e.g. generating units at Rugeley, Cottam, Spalding North, etc.) that make this a critical boundary.
In addition, numerous Round 1 and 2 offshore wind farms are located in close proximity to The Wash
region as well as some of the Dogger Bank and Hornsea Round 3 offshore wind farms expected to
connect to the onshore network just north of B9.
Figure 6.8 shows that all the required capability in all scenarios increase up to 2017-18 due to a greater
level of generation north of B9 which results in a non compliance in 2015 under Slow Progression.
Beyond 2018, the power flow from the north tends to decrease under all future scenarios, suggesting that
any new reinforcements would be short lived considering the timescales required for construction of such
reinforcements.
Figure 6.8 - Boundary B9 Required and Proposed Capability
Boundary B9 - NGET Midlands to South
6.0GW
7.0GW
8.0GW
9.0GW
10.0GW
11.0GW
12.0GW
13.0GW
14.0GW
2010 2011 2012 2013 2014 2015 2016 2017 2018 2019 2020 2021 2022 2023 2024 2025
Year
Ca
pa
bil
ity
(G
W)
Gone Green Slow Progression Accelerated Growth Sustainable Growth Gone Green Capability
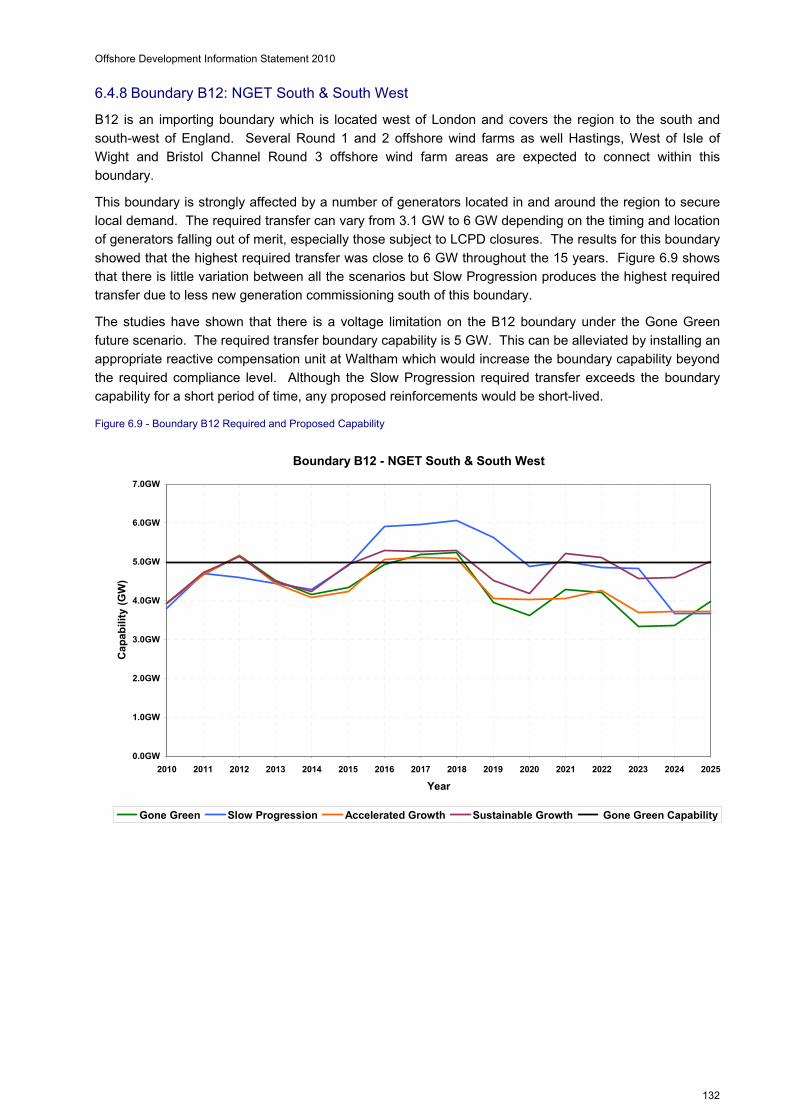
Offshore Development Information Statement 2010
132
6.4.8 Boundary B12: NGET South & South West
B12 is an importing boundary which is located west of London and covers the region to the south and
south-west of England. Several Round 1 and 2 offshore wind farms as well Hastings, West of Isle of
Wight and Bristol Channel Round 3 offshore wind farm areas are expected to connect within this
boundary.
This boundary is strongly affected by a number of generators located in and around the region to secure
local demand. The required transfer can vary from 3.1 GW to 6 GW depending on the timing and location
of generators falling out of merit, especially those subject to LCPD closures. The results for this boundary
showed that the highest required transfer was close to 6 GW throughout the 15 years. Figure 6.9 shows
that there is little variation between all the scenarios but Slow Progression produces the highest required
transfer due to less new generation commissioning south of this boundary.
The studies have shown that there is a voltage limitation on the B12 boundary under the Gone Green
future scenario. The required transfer boundary capability is 5 GW. This can be alleviated by installing an
appropriate reactive compensation unit at Waltham which would increase the boundary capability beyond
the required compliance level. Although the Slow Progression required transfer exceeds the boundary
capability for a short period of time, any proposed reinforcements would be short-lived.
Figure 6.9 - Boundary B12 Required and Proposed Capability
Boundary B12 - NGET South & South West
0.0GW
1.0GW
2.0GW
3.0GW
4.0GW
5.0GW
6.0GW
7.0GW
2010 2011 2012 2013 2014 2015 2016 2017 2018 2019 2020 2021 2022 2023 2024 2025
Year
Ca
pa
bil
ity
(G
W)
Gone Green Slow Progression Accelerated Growth Sustainable Growth Gone Green Capability
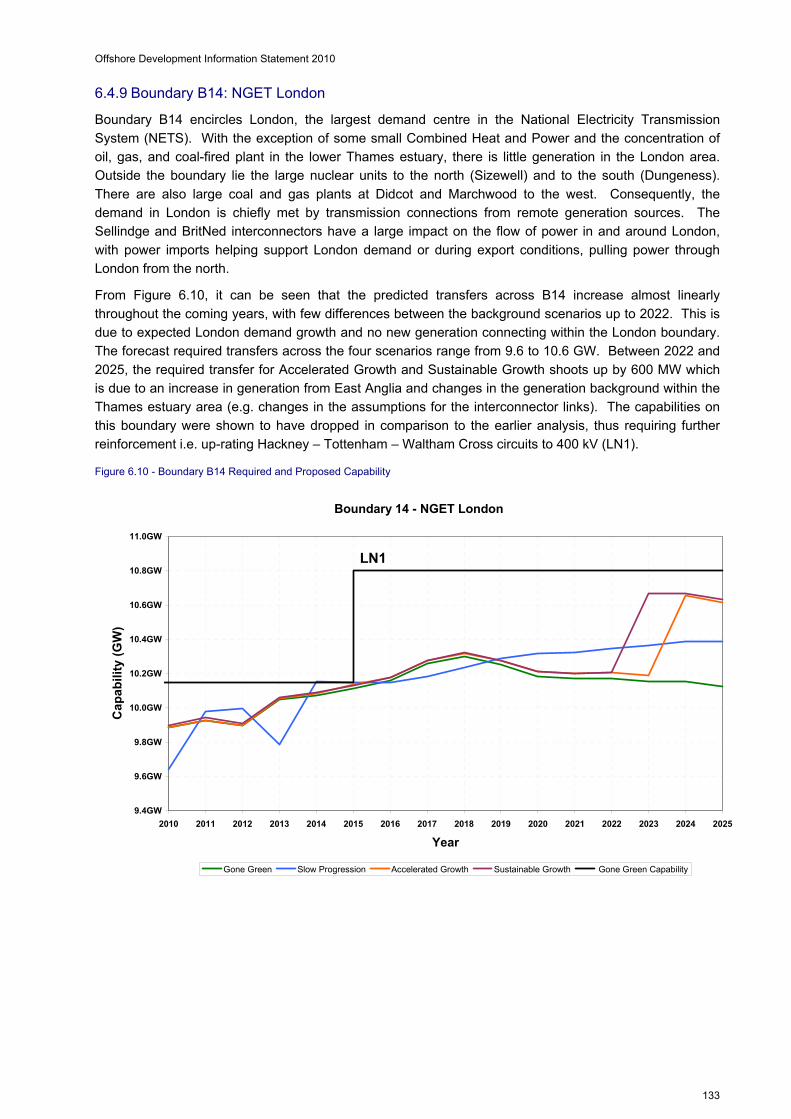
Offshore Development Information Statement 2010
133
6.4.9 Boundary B14: NGET London
Boundary B14 encircles London, the largest demand centre in the National Electricity Transmission
System (NETS). With the exception of some small Combined Heat and Power and the concentration of
oil, gas, and coal-fired plant in the lower Thames estuary, there is little generation in the London area.
Outside the boundary lie the large nuclear units to the north (Sizewell) and to the south (Dungeness).
There are also large coal and gas plants at Didcot and Marchwood to the west. Consequently, the
demand in London is chiefly met by transmission connections from remote generation sources. The
Sellindge and BritNed interconnectors have a large impact on the flow of power in and around London,
with power imports helping support London demand or during export conditions, pulling power through
London from the north.
From Figure 6.10, it can be seen that the predicted transfers across B14 increase almost linearly
throughout the coming years, with few differences between the background scenarios up to 2022. This is
due to expected London demand growth and no new generation connecting within the London boundary.
The forecast required transfers across the four scenarios range from 9.6 to 10.6 GW. Between 2022 and
2025, the required transfer for Accelerated Growth and Sustainable Growth shoots up by 600 MW which
is due to an increase in generation from East Anglia and changes in the generation background within the
Thames estuary area (e.g. changes in the assumptions for the interconnector links). The capabilities on
this boundary were shown to have dropped in comparison to the earlier analysis, thus requiring further
reinforcement i.e. up-rating Hackney – Tottenham – Waltham Cross circuits to 400 kV (LN1).
Figure 6.10 - Boundary B14 Required and Proposed Capability
Boundary 14 - NGET London
9.4GW
9.6GW
9.8GW
10.0GW
10.2GW
10.4GW
10.6GW
10.8GW
11.0GW
2010 2011 2012 2013 2014 2015 2016 2017 2018 2019 2020 2021 2022 2023 2024 2025
Year
Cap
abil
ity
(GW
)
Gone Green Slow Progression Accelerated Growth Sustainable Growth Gone Green Capability
LN1

Offshore Development Information Statement 2010
134
Chapter Seven
Way Forward The Statement will be published on an annual basis by NGET. It is intended that this Statement will be
used as the basis for future editions of the Statement subject to industry consultation. Industry feedback
is therefore sought to inform the development of subsequent Statements to ensure that this Statement
fulfils its objective of facilitating the development, in offshore waters, of an efficient, co-ordinated and
economical system of electricity transmission.
7.1 Feedback on the 2010 Statement
Interested parties are encouraged to provide feedback on all aspects of the 2010 Statement via the Online
Survey Form. Given the timeline for the development of the 2011 Statement, (as outlined in section 7.3),
it would be appreciated if responses can be provided as soon as possible such that the replies can be
used to develop and articulate the formal consultation exercise which will be published in December 2010.
Should you have any questions on the Offshore Development Information Statement, please do not
hesitate to contact us: [email protected].
7.2 Consultation on 2010 Statement
The Statement will be the subject of an annual review process, facilitated by NGET with industry
participants. Any proposed amendments to the structure/layout and the future scenarios which may be
incorporated within future editions of the Statement, are the subject of this annual review process with a
subsequent formal submission to the Authority (outlining the proposed amendments to structure/layout
and future scenarios).
In December 2010, NGET will commence a formal review of the 2010 Statement. The review will seek to:
assess whether the form of the Statement and the future scenarios presented in the Statement
facilitate the development, in offshore waters, of an efficient, co-ordinated and economical system of
electricity transmission; and
identify any areas for potential further development which could be incorporated within future editions
of the Statement (dependant on availability of information, commercial sensitivities etc).
The review will be conducted with the industry and will take the form of a formal consultation document
(which will be available on National Grid’s website202).
NGET welcomes the involvement of the industry in the continuous development of the Statement and
therefore will be arranging an industry workshop for January 2011. The aim of the workshop will be to
review the 2010 Statement (and the associated consultation document) and to identify how the Statement
may be continually developed in line with the latest offshore developments and licence provisions.
Further details regarding the timing and location of the industry workshop will be made public in due
course. However if you have any suggestions on the format, agenda of the workshop please contact us:
202 http://www.nationalgrid.com/uk/Electricity/ODIS/

Offshore Development Information Statement 2010
135
7.3 Proposed Consultation Timetable and Key Milestone Dates
The proposed timetable for the publication of the 2011 Statement is as follows:
Publication of 2010 Statement – by 30th September 2010;
Feedback on 2010 Statement via the Online Survey Form;
Publication of the ‘Annual Statement Review’ Consultation – December 2010;
Statement Workshop – January 2011;
Submission, (to the Authority), of proposed changes to the form of Statement – by 1st March 2011 (if
required);
Submission, (to the Authority), of proposed changes to the Future Scenarios included in the
Statement – by 1st June 2011 (if required);
Publication of 2011 Statement – by 30th September 2011.
7.4 Continuous Statement Development
The Statement will continue to evolve as advised by feedback received from the industry and reflect the
latest developments in the offshore electricity regime and offshore electricity generation. However the
content of the Statement will remain within the remit set by the special licence condition C4.
It is intended that the annual review process will facilitate the continuous development of the Statement
and encourage activity participation from interested parties with the view to enhancing future versions of
the Statement in accordance with the licence provisions.

Offshore Development Information Statement 2010
136
Glossary Simplified definitions of many of the terms used in this statement are provided below to assist a diverse
range of readers to understand this Statement. Please be aware that many of these terms are officially
and precisely defined in various industry codes, standards, and licence conditions.
Air Insulated Substations/Switchgear (AIS)
Traditionally, substations at transmission voltages use atmospheric air as the principal insulating medium.
The substation components energised at transmission voltages (such as circuit breakers, disconnectors,
instrument transformers and the conductors that interconnect them) are supported on porcelain insulating
columns and spaced with sufficient clearances that the surrounding air will provide adequate insulation.
Array
The electrical network, typically energised at 33 kV or 11 kV, used to collect the power generated by
multiple generators and deliver it to a central substation where the power is aggregated and its voltage is
stepped up for export to the electricity grid.
Authority
The Gas and Electricity Markets Authority established by section 1 of Utilities Act 2000. The Authority’s
principal objective is to protect the interests of existing and future consumers in relation to gas conveyed
through pipes and electricity conveyed by distribution or transmission systems.
Boundary
A border which divides the National Electricity Transmission System into two adjacent regions.
Boundaries are used when assessing and discussing the future requirements and capabilities of the
transmission system. Boundaries are defined such that they highlight the most constrained areas of the
network where reinforcement is thought most likely.
Boundary Transfer Capability
The maximum pre-fault power that the transmission system can carry from the region on one side of a
boundary to the region on the other side of a boundary while ensuring acceptable transmission system
operating conditions will exist following one of a range of different faults.
Busbar
The common connection point of two or more transmission circuits.
Constraints
Limitations applied to the operation of the power system, to prevent it from operating in a state in which,
following a fault, unacceptable operating conditions could be experienced. Constraint costs are incurred
when it is necessary to alter the power output of generators in order to alleviate the constraint.
Current Source Converter (CSC)
A type of HVDC converter which uses electronic switches that can be controlled on, and naturally
commutate off at the end of each cycle. Please refer to the corresponding technology sheet in Appendix 4
which describes the merits of CSC converters.
Gas Insulated Substations/Switchgear (GIS)
Substations in which the components that are energised at transmission voltages are enclosed in a metal
vessel containing pressurised sulphur hexafluoride (SF6) gas. The improved insulation properties of SF6
over atmospheric air means that a GIS substation can be arranged more compactly then an equivalent
AIS substation.

Offshore Development Information Statement 2010
137
Grid Supply Point (GSP)
A point of supply from the national electricity transmission system to a distribution network or transmission
connected load. Typically only large industrial loads are directly connected to the transmission system.
High Voltage Alternating Current (HVAC or AC)
Electric power transmission in which the voltage varies in a sinusoidal fashion, resulting in a current flow
that periodically reverses direction. HVAC is presently the most common form of electricity transmission
and distribution as it allows the voltage level to be raised or lowered using a transformer.
High Voltage Direct Current (HVDC)
Electric power transmission in which the voltage is held at a constant magnitude. HVDC is commonly
used for point to point long-distance and/or subsea connections. HVDC offers various advantages over
HVAC transmission but requires the use of costly power electronic converters at each end to change the
voltage level and convert it to/from AC.
Infeed Loss Risk
The maximum amount of power injection into the electricity transmission system that can be lost for
different types of power system contingencies, as defined by the NETS SQSS. The normal infeed loss
risk, relating to relatively common contingencies, is presently 1000 MW. The infrequent infeed loss risk,
relating to relatively uncommon/multiple contingencies, is presently 1320 MW. The power system is
designed in such a way that it is not possible to loose generation infeed greater than these thresholds. As
such, the infeed loss risk defines the maximum capacity of radial offshore transmission connections.
Operationally, adequate frequency response is maintained to ensure that the power system can withstand
the sudden loss of generation up to the infeed loss risk. There is an active proposal which, should it be
approved by the Authority, will increase the infrequent loss risk from 1320 to 1800 MW.
Main Interconnected Transmission System (MITS)
The 400 kV and 275 kV elements of the transmission system, including in Scotland, the 132 kV elements
operated in parallel with 400 kV or 275 kV elements, excluding radial connections to generators,
transformer connections to lower voltage systems and interconnectors to other power systems.
National Electricity Transmission System Security and Quality of Supply Standard (NETS SQSS)
The National Electricity Transmission System Security and Quality of Supply Standards (NETS SQSS)
sets out a co-ordinated set of criteria and methodologies that Transmission Licensees (both onshore and
offshore) shall use in the planning and operation of the National Electricity Transmission System. The
criterion presented in the NETS SQSS represents the minimum requirements for the planning and
operation of the National Electricity Transmission System.
Offshore Grid Entry Point (Offshore GEP)
The point at which an offshore generator connects to the offshore transmission system, defined as the AC
connection onto the low voltage busbar on the OFTO platform substation.
Onshore Interface Point
The point at which an offshore transmission system is directly connected to the onshore transmission
system.
Static VAR Compensators (SVC) and Static Compensators (STATCOM)
Both are devices which are capable of producing variable inductive and capacitive reactive power and can
be used to regulate the network voltage on the network and control the power factor at grid entry and
interface points.

Offshore Development Information Statement 2010
138
System Operator - Transmission Owner Code (STC)
The System Operator–Transmission Owner Code (STC) defines the high-level relationship between the
National Electricity Transmission System Operator and the transmission network owners.
Transformer
An electro-magnetic device that can be used to change the voltage level in an AC network.
The Department of Energy and Climate Change (DECC)
The Department of Energy and Climate Change is the Government department responsible for all aspects
of UK energy policy (previously with BERR, which is now the Department for Business, Innovation and
Skills) and climate change mitigation policy (previously with the Department for Environment, Food and
Rural Affairs (DEFRA)).
The Crown Estate
The Crown Estate is the owner of the seabed (out to the 12 nautical miles limit) around the coast line of
UK. They also own around half of the foreshore, the area between mean high and mean low water
(spring tides in Scotland) and approximately half of the beds of estuaries and tidal rivers in the United
Kingdom. The Crown Estate also has the right to exploit natural energy resources, excluding fossil fuels
on the UK continental shelf within the Renewable Energy Zone.
Units
Measures of Power – the rate at which energy is being generated, consumed, or transferred:
Gigawatt (GW) = 1,000,000,000 Watts
Megawatt (MW) = 1,000,000 Watts
1 Watt = 1 Joule/second
Measures of Energy – the amount of energy generated, consumed, or transferred. In electricity, energy is
commonly expressed as a multiple of the energy that would be realised if a particular power level were
maintained for an hour:
Gigawatthour (GWh) = 1,000,000,000 Watts X 3600 seconds
Megawatthour (MWh) = 1,000,000 Watts X 3600 seconds
Measures of Voltage – the electrical potential at which electrical conductors are energised:
Kilovolts (kV) = 1,000 Volts
1 Volt = 1 Joule/coulomb of charge
Voltage Source Converters (VSC)
A type of HVDC converter which uses electronic switches which can be controlled on and off.