ohio child welfare functional job analysis research ... · • implementation of the statewide...
TRANSCRIPT

Ohio Child Welfare Functional Job Analysis Research
Caseload Complexity Survey – Preliminary Report August 2013
Public Children Services Association of Ohio 510 East Mound Street, Suite 200
Columbus, OH 43215 614-224-5802
www.pcsao.org

Contents
Introduction ............................................................................................................ 1
Functional Job Analysis Oversight Committee ....................................................... 2
Summary Data......................................................................................................... 4
Participation ............................................................................................................ 6 Chart 1a. Caseworkers who started the survey by county – map ............................... 6 Chart 1b. Caseworkers who started the survey by county – CPOE size ....................... 7 Chart 2. Differential Response subcategory ................................................................. 8 Chart 3. Highest degree received ................................................................................. 8 Chart 4. Years of experience in children and family services ....................................... 9
Ranking of Case Characteristics by Level of Complexity ......................................... 9 Chart 5. Ranking of child characteristics .................................................................... 10 Chart 6. Ranking of family characteristics .................................................................. 10 Chart 7. Ranking of additional family characteristics ................................................. 11 Chart 8. Ranking of case status .................................................................................. 11 Chart 9. Ranking of placement needs ........................................................................ 12 Chart 10. Ranking of foster care certification factors ................................................ 12 Chart 11. Ranking of independent living factors ........................................................ 13 Chart 12. Ranking of adoption factors ....................................................................... 13
Caseload Size and Distribution ............................................................................. 14 Chart 13. Number of cases currently assigned per worker ........................................ 14
Estimates of Hours Logged on Different Levels of Cases ...................................... 15 Table 1. Estimated hours for intake/investigation and ongoing cases ...................... 15 Chart 14 a. Estimated intake hours for low-need cases ............................................. 15 Chart 14b. Estimated Intake hours for moderate-need cases ................................... 16 Chart 14c. Estimated intake hours for high-need cases ............................................. 16 Chart 15a. Estimated ongoing hours for low-need cases........................................... 17 Chart 15b. Estimated ongoing hours for moderate-need cases ................................ 17 Chart 15c. Estimated ongoing hours for high-need cases .......................................... 18 Table 2. Estimated hours for other areas ................................................................... 18
Estimates of Hours Logged in Indirect Case Activity ............................................ 18 Chart 16a. Hours spent waiting in court (not with families) per month .................... 19 Chart 16b. Hour spent on case-related travel per month .......................................... 19 Chart 16c. Hours spent in SACWIS per month ........................................................... 20 Chart 16d. Hours spent on other documentation/paperwork per month................. 20
Workload and Efficiency Impacts ......................................................................... 21 Chart 17. Agency factors that save time on casework ............................................... 21
Conclusion ............................................................................................................. 21
Appendix: PCSAO Caseload Complexity Survey ................................................. 22ff.
Caseload Complexity Survey – Preliminary Report
Public Children Services Association of Ohio 1
Introduction Established in 1980, Public Children Services Association of Ohio (PCSAO) is a membership-driven association serving Ohio's 88 County Public Children Services Agencies through the support of program excellence and sound public policy for safe children, stable families, and supportive communities. We do this through member dialogue, active sharing of information, building partnerships, research, training and technical assistance, project leadership, and advocacy at the state and federal level. In 1988, PCSAO conducted its first Functional Job Analysis to determine the number of child protection cases for which a direct services caseworker could be expected to be responsible while still delivering quality and timely services. In 1992 and again in 1997, the study was updated. The 1997 “County Child Protection Workload Analysis” can be found at http://www.pcsao.org/workload%20analysis.pdf. This research established an average caseload size of 12 for new investigations and 13 for ongoing cases. As of January 2010, according to the PCSAO Factbook, 10th Edition, caseload size in Ohio’s 88 counties ranged from a low of 2 to a high of 32 for new investigations and a low of 4 to a high of 25 for ongoing cases. Clearly, the 1997 numbers are outdated; new research must take into account (among many other changes):
• Implementation of the Statewide Automated Child Welfare Information System (SACWIS);
• Implementation of the Comprehensive Assessment and Planning Model – Interim Solution (CAPMIS);
• Evolution of caseworker roles and expectations; • Elimination of many clerical positions in child welfare agencies; • More stringent rules and standards; • Changes in the economy and state budget reductions; and • Innovations in child welfare practice, including alternative/differential response.
An internal effort led by the Association and volunteer members (the Functional Job Analysis Oversight Committee, or “Oversight Committee”) began a process of updating the research in 2012. A multi-pronged approach – including literature review, a survey, a three-month time study, data analysis, and focus groups – is underway. The Oversight Committee anticipates that the project will not culminate in a single caseload recommendation for intake and ongoing cases, as in the past, but rather a tool (referred to currently as a calculator) that will assist each county agency in identifying a customized average caseload size based on its unique circumstances. Because different types of cases can take more or less time, the tool is expected to help counties triage their cases into high-need, moderate-need, and low-need categories, based on specific case characteristics, and plan for caseworker time accordingly. The tool is also expected to help inform agency managers as they seek solutions to inadequate staffing levels – not only by adding staff, which may not be financially feasible, but by adjusting staffing across units, examining caseload pressures, revisiting noncasework-related staff commitments, and more. In April 2013 the Oversight Committee administered a survey on caseload complexity. The purpose of the survey was to assess what case-related factors caseworkers believe contribute

Caseload Complexity Survey – Preliminary Report
Public Children Services Association of Ohio 2
to greater or lesser complexity, and how long caseworkers estimate they spend on cases of low, moderate, and high need or complexity, as well as related tasks. Practitioners on the Oversight Committee developed a list of case characteristics, child characteristics, family characteristics, and more. The survey is being followed up by a three-month time study (August through October 2013) to measure actual time spent on direct case-related activities. Time is being captured by caseworkers in more than a dozen county agencies, covering almost 40 percent of the state’s child population and representative of the state in terms of size and structure. Caseworkers are capturing time using SACWIS. An important criterion for inclusion of the case/child/family characteristics in the survey was that they could be anchored in the SACWIS/CAPMIS assessment tools (i.e., the family and safety assessments) so that caseworkers’ perceptions of case complexity could then be validated through the time study. The April survey was administered online (via Survey Monkey), was promoted through multiple media, and remained open for two weeks (April 16 through May 1). During that time, 818 caseworkers from 58 counties started the survey, and 602 caseworkers completed the survey. The results included in this report should be considered preliminary, as PCSAO, county agency staff, and others continue to analyze the significant amount of data returned by the survey. In particular, we are taking a closer look at the qualitative/text responses to the open-ended questions, and no summary or analysis of those responses is presented here. Throughout this report, “n” indicates the number of respondents to the given question. In addition to the median, the Oversight Committee chose to present a range that encompasses the “middle 50” – referred to as the interquartile range from the 25th percentile to the 75th percentile – so as to eliminate likely outliers; thus, the use of “Middle-50 range,” sometimes abbreviated “mid-50 range,” throughout. A copy of the original survey is appended to the report.
Functional Job Analysis Oversight Committee PCSAO is grateful to members of the Oversight Committee for lending their valuable time and outstanding expertise to this important project. We also acknowledge Cuyahoga County Division of Children and Family Services and Franklin County Children Services for their generous financial support of this project. Athens County Children Services Sheila A. Shafer, MA, LSW, Deputy Director of Programs Champaign County Department of Job and Family Services Stacy Cox, MSW, Administrator – Social Services Cuyahoga County Division of Children and Family Services Patricia L. Rideout, Administrator Tamara Chapman-Wagner, Deputy Director
Caseload Complexity Survey – Preliminary Report
Public Children Services Association of Ohio 3
David S. Dombrosky, Deputy Director – Administrative Services Trista Piccola, Performance Management Administrator Tracey Brichacek, Senior Social Services Supervisor Franklin County Children Services Jessica Foster, PhD, Management Analyst Lara LaRoche, MSW, LISW-S, Intake Director Don Peasley, Director of Evaluation Tina Rutherford, MSW, LISW-S, Deputy Director Institute for Human Services/Ohio Child Welfare Training Program Kyle Hoffman, Program Evaluation Manager Ohio Department of Job and Family Services/Office of Families and Children Roger Ward, Data Project Manager, Court Improvement Project Public Children Services Association of Ohio Crystal Ward Allen, MSW, Executive Director Scott Britton, Assistant Director Mark Watson, Intern, MSW Candidate, The Ohio State University

Caseload Complexity Survey – Preliminary Report
Public Children Services Association of Ohio 4
Summary Data Participation (See Charts 1a, 1b, and 2-4) Respondents Caseworkers who started the survey 816 Caseworkers who completed the survey 602 Number of counties represented 58 Differential Response Traditional response caseload 59.2% Alternative response caseload 13.2% Blended caseload 27.6% Highest Degree Received Bachelor’s Degree 41.3% Bachelor’s Degree with Social Work 28.6% Master’s Degree 15.2% Master’s Degree with Social Work 15% Years of Experience in Children and Family Services Less than 1 year 8.7% 1-2 years 13.2% 3-5 years 12.6% More than 5 years 65.4% Ranking of Case Characteristics and Agency Factors (See Charts 5-12 and 17) Top 3 of 8 Most Complex Child Characteristics with Rating Average Children with multiple disabilities/special needs 5.28 Juvenile delinquents/unruly and delinquent 4.99 Four or more children in the case 4.95 Top 3 of 6 Most Complex Family Characteristics with Rating Average Mental illness 4.24 Substance abuse 4.12 Sex abuse 4.01 Top 3 of 5 Most Complex Additional Family Characteristics with Rating Average Low cognitive ability of caretaker 3.96 Poor parenting skills 3.75 Fatherhood/family search and engagement 2.65 Most Complex Case Status with Rating Average Court-ordered custody/paid placement 3.12 Court-ordered in-home protective services 2.60 Court-ordered kinship protective services 2.42 Voluntary 1.71 Top 3 of 10 Most Complex Placement Needs with Rating Average Multiple moves 6.04 Adoption cases with sibling groups 5.48 Siblings in different homes 5.43

Caseload Complexity Survey – Preliminary Report
Public Children Services Association of Ohio 5
Top 2 of 4 Most Complex Foster Care Certification Factors with Rating Average Follow-through on required verifications 2.85 Families who accept more challenging children 2.57 Top 3 of 6 Most Complex Independent Living Factors with Rating Average Severe behavioral/mental health issues 4.84 Juvenile delinquency involvement 3.72 Children placed far away 3.40 Top 3 of 6 Most Complex Adoption Factors with Rating Average Severe behavioral/mental health issues 4.71 Multiple number of disrupted placement changes 4.46 Medically fragile children 3.31 Top 3 Agency Factors That Save Time on Casework with Rating Average Availability of community resources 4.26 Key programmatic support 4.08 Availability of technology 3.95 Caseload Size and Distribution (See Chart 13) Median=13; Middle-50 Range: 10-16 Estimates of Hours Logged on Different Levels of Cases (See Charts 14a-14c, 15a-15c, and Tables 1-2) Estimates are per case for intake/investigations (which typically must be completed within 30, 45, or 60 days) and per month for ongoing, foster certification, IL, and adoption cases. Hours estimated:
Intake/investigation cases Hours per month
estimated: Ongoing cases
Median Mid-50 Range Median Mid-50 Range
Low-need/low complexity 8 hrs 4 – 10 hrs 6 hrs 3 – 12 hrs Moderate-need/moderately complex
14 hrs 8 – 20 hrs 10 hrs 6 – 25 hrs
High-need/highly complex 20 hrs 12 – 40 hrs 20 hrs 10 – 40 hrs
Hours per month
estimated: Foster care certification cases
Hours per month estimated: Independent
living cases
Hours per month estimated: Adoption
cases
Median Mid-50 Range Median Mid-50 Range Median Mid-50 Range
Low-need/low complexity 5.5 hrs 3 – 11.5 hrs 4 hrs 2 – 7.5 hrs 5 hrs 3 – 15 hrs Moderate-need/moderately complex
10 hrs 3.25 – 20 hrs 7 hrs 3 – 12 hrs 10 hrs 5 – 20 hrs
High-need/highly complex 10 hrs 4 – 20 hrs 10 hrs 5 – 22.5 hrs 20 hrs 8 – 30 hrs
Estimates of Hours Logged in Indirect Case Activity per Month across All Cases (See Charts 16a-16d) Median Mid-50 Range
Waiting in court 5 hrs 2 – 10 hrs Case-related travel 20 hrs 12 – 35 hrs SACWIS data entry 40 hrs 20 – 70 hrs Other documentation/paperwork 20 hrs 10 – 40 hrs

Caseload Complexity Survey – Preliminary Report
Public Children Services Association of Ohio 6
Participation Participation in the survey was purely voluntary. The survey was publicized via PCSAO’s Weekly Update e-newsletter as well as via emails to agency executives and metro agency senior managers. As shown in Chart 1 below, 816 caseworkers from 58 counties started the survey. Charts 1a and 1b. Caseworkers starting the survey, by county of employment (n=816) Chart 1a. Caseworkers who started the survey by county – map
Caseload Complexity Survey – Preliminary Report
Public Children Services Association of Ohio 7
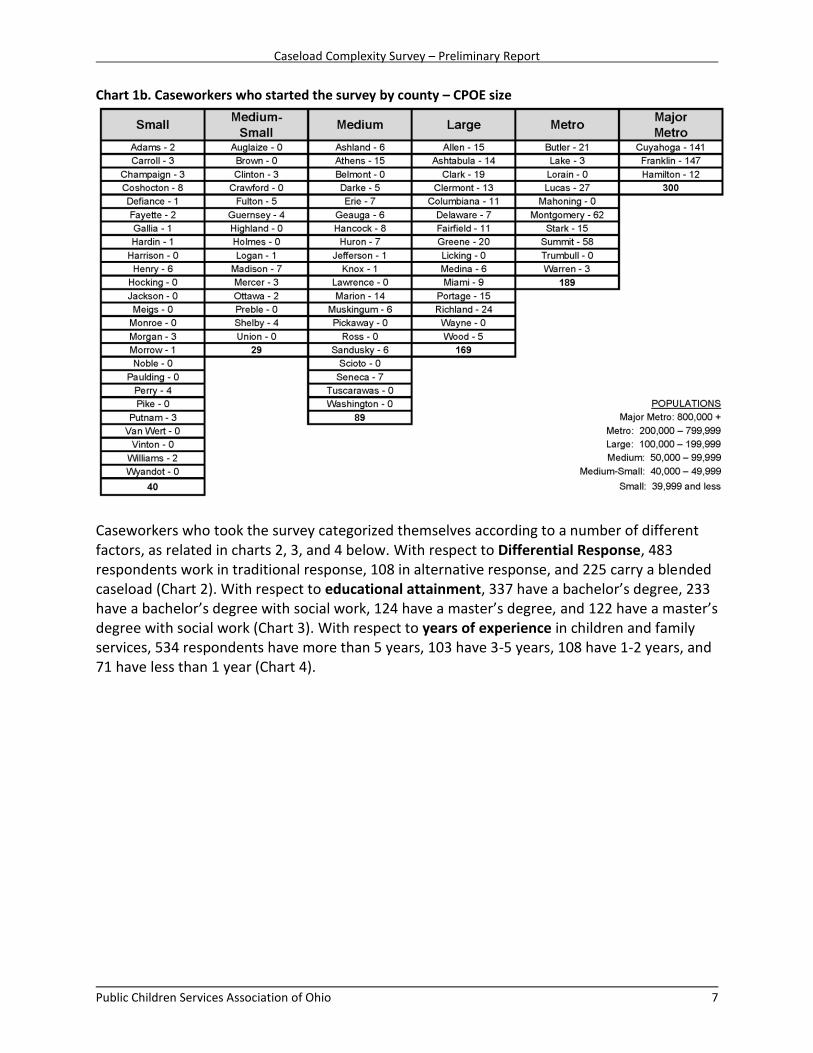
Chart 1b. Caseworkers who started the survey by county – CPOE size
Caseworkers who took the survey categorized themselves according to a number of different factors, as related in charts 2, 3, and 4 below. With respect to Differential Response, 483 respondents work in traditional response, 108 in alternative response, and 225 carry a blended caseload (Chart 2). With respect to educational attainment, 337 have a bachelor’s degree, 233 have a bachelor’s degree with social work, 124 have a master’s degree, and 122 have a master’s degree with social work (Chart 3). With respect to years of experience in children and family services, 534 respondents have more than 5 years, 103 have 3-5 years, 108 have 1-2 years, and 71 have less than 1 year (Chart 4).

Caseload Complexity Survey – Preliminary Report
Public Children Services Association of Ohio 8
Chart 2. Differential Response subcategory (n=816)
Chart 3. Highest degree received (n=816)

Caseload Complexity Survey – Preliminary Report
Public Children Services Association of Ohio 9
Chart 4. Years of experience in children and family services (n=816)
Ranking of Case Characteristics by Level of Complexity Survey respondents were asked to rank case characteristics according to the type of cases they handle. Intake and ongoing workers were asked to rank a set of child characteristics (Chart 5), two sets of family characteristics (Charts 6 and 7), case status (Chart 8), and a set of placement needs (Chart 9). Workers who handle foster care certification, independent living, and adoptions were asked to rank a set of case characteristics particular to those areas (Charts 10, 11, and 12). As a result, the number (“n”) of respondents drops from 816 in the charts above, to 582 in the intake/ongoing charts (Charts 5-9), to even lower numbers for the remaining categories. This is not surprising given that respondents self-selected into the appropriate category/categories of cases they handle. These charts reflect raw survey data, with the tallest/longest bar on the far left representing the characteristic or factor ranked most complex, on average, by respondents, and continuing to the right in descending order of complexity. PCSAO is continuing to analyze this data to determine how these factors should be weighed as we develop proxies for high-needs/highly complex, moderate-needs/moderately complex, and low-need/low complex cases.

Caseload Complexity Survey – Preliminary Report
Public Children Services Association of Ohio 10
Chart 5. Ranking of child characteristics (n=582)
Chart 6. Ranking of family characteristics (n=582)

Caseload Complexity Survey – Preliminary Report
Public Children Services Association of Ohio 11
Chart 7. Ranking of additional family characteristics (n=582)
Chart 8. Ranking of case status (n=582)

Caseload Complexity Survey – Preliminary Report
Public Children Services Association of Ohio 12
Chart 9. Ranking of placement needs (n=582)
Chart 10. Ranking of foster care certification factors (n=48)

Caseload Complexity Survey – Preliminary Report
Public Children Services Association of Ohio 13
Chart 11. Ranking of independent living factors (n=165)
Chart 12. Ranking of adoption factors (n=77)

Caseload Complexity Survey – Preliminary Report
Public Children Services Association of Ohio 14
Caseload Size and Distribution Caseworkers were asked to provide the number of cases currently assigned to them and to categorize those cases according to low-need/low complexity, moderate-need/moderately complex, and high-need/highly complex – using their understanding of those terms based on how they ranked the various case characteristics presented throughout the survey. In this and the following section, the Oversight Committee found that taking the median, rather than the average (mean), to be more useful because the median helps to negate the influence of outliers. Likewise, we found that looking at the “middle 50” of responses – those between the 25th and 75th percentile – to be helpful in identifying a realistic range. The histograms provided in Charts 13 through 15 below display the results (measured against the left y axis), with the median highlighted in green and the “middle 50” reflected as a range; this is also known as the interquartile range. A red line (measured against the right y axis) shows the cumulative percentiles. The median number of cases assigned to caseworkers at the time of the survey was 13, but ranged from 10 to 16. Caseloads broke almost evenly across complexity levels (4 low, 5 moderate, and 4 high). Chart 13. Number of cases currently assigned per worker (n=611) Median=13; Middle-50 Range: 10-16
0.00%
20.00%
40.00%
60.00%
80.00%
100.00%
120.00%
0
20
40
60
80
100
120
140
160
Less 10 11 12 13 14 15 16 More
Fre
qu
en
cy
Number of Cases
Frequency
Cumulative %

Caseload Complexity Survey – Preliminary Report
Public Children Services Association of Ohio 15
Estimates of Hours Logged on Different Levels of Cases Caseworkers in five different areas (intake/investigations, ongoing, foster care certifications, independent living, and adoptions) were asked to estimate the number of hours they spend on a typical low-need, moderate-need, and high-need case, including all time and effort put into the case, such as case-related travel, data entry, and court time, but not including non-case-related time such as training, lunch, breaks, and time off. For intake/investigations only, they were asked to estimate the total time spent on the case throughout the life of the case (typically 30, 45, or 60 days depending on traditional or alternative response). In the other four areas, they were asked to estimate the number of hours spent per month. Charts 14 and 15 are summarized below in Table 1. Table 1. Estimated hours for intake/investigation and ongoing cases Estimates are per case for intake/investigations (which typically must be completed within 30, 45, or 60 days) and per month for ongoing, foster certification, IL, and adoption cases. Hours estimated:
Intake/investigation cases Hours per month
estimated: Ongoing cases
Median Mid-50 Range Median Mid-50 Range
Low-need/low complexity 8 hrs 4 – 10 hrs 6 hrs 3 – 12 hrs Moderate-need/moderately complex
14 hrs 8 – 20 hrs 10 hrs 6 – 25 hrs
High-need/highly complex 20 hrs 12 – 40 hrs 20 hrs 10 – 40 hrs
Charts 14a, 14b, and 14c. Estimated hours for intake/investigation cases (n=316) Chart 14a. Estimated intake/investigation hours for low-need/low-complexity cases Median=8 hours; Middle-50 Range: 4-10 hours
0.00%
20.00%
40.00%
60.00%
80.00%
0
20
40
60
80
Less 4 5 6 7 8 9 10 More
Fre
qu
en
cy
Estimated Hours
Frequency
Cumulative %

Caseload Complexity Survey – Preliminary Report
Public Children Services Association of Ohio 16
Chart 14b. Estimated intake/investigation hours for moderate-need/moderately complex cases Median=14 hours; Middle-50 Range: 8-20 hours
Chart 14c. Estimated intake/investigation hours for high-need/highly complex cases Median=20 hours; Middle-50 Range: 12-40 hours
0.00%
20.00%
40.00%
60.00%
80.00%
100.00%
120.00%
0
10
20
30
40
50
60
70
80
90Fr
eq
ue
ncy
Estimated Hours
Frequency
Cumulative %
0.00%
20.00%
40.00%
60.00%
80.00%
100.00%
120.00%
0
10
20
30
40
50
60
70
80
Fre
qu
en
cy
Estimated Hours
Frequency
Cumulative %

Caseload Complexity Survey – Preliminary Report
Public Children Services Association of Ohio 17
Charts 15a, 15b, and 15c. Estimated hours for ongoing cases (n=390) Chart 15a. Estimated ongoing hours for low-need/low-complexity cases Median=6 hours; Middle-50 Range: 3-12 hours
Chart 15b. Estimated ongoing hours for moderate-need/moderately complex cases Median=10 hours; Middle-50 Range: 6-25 hours
0.00%
20.00%
40.00%
60.00%
80.00%
100.00%
120.00%
0
20
40
60
80
100
120
Less 3 4 5 6 7 8 9
10
11
12
Mo
re
Fre
qu
en
cy
Estimated Hours
Frequency
Cumulative %
0.00%
20.00%
40.00%
60.00%
80.00%
100.00%
120.00%
0
20
40
60
80
100
120
Fre
qu
en
cy
Estimated Hours
Frequency
Cumulative %
Caseload Complexity Survey – Preliminary Report
Public Children Services Association of Ohio 18
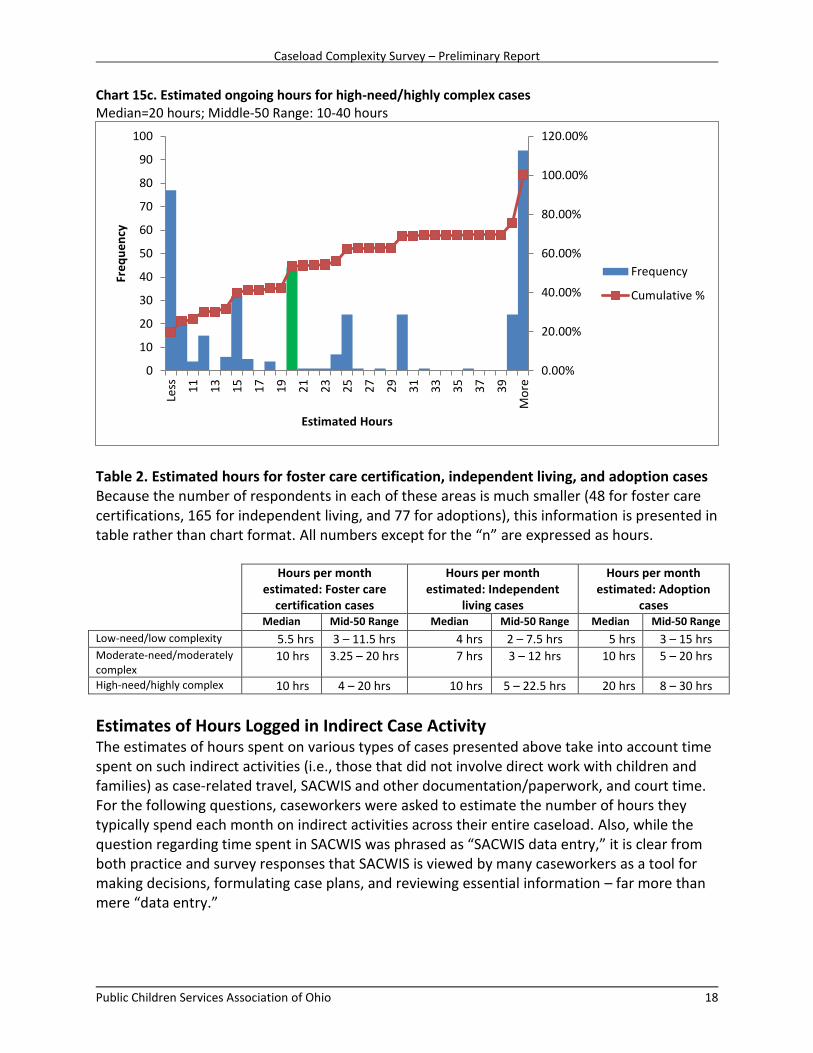
Chart 15c. Estimated ongoing hours for high-need/highly complex cases Median=20 hours; Middle-50 Range: 10-40 hours
Table 2. Estimated hours for foster care certification, independent living, and adoption cases Because the number of respondents in each of these areas is much smaller (48 for foster care certifications, 165 for independent living, and 77 for adoptions), this information is presented in table rather than chart format. All numbers except for the “n” are expressed as hours. Hours per month
estimated: Foster care certification cases
Hours per month estimated: Independent
living cases
Hours per month estimated: Adoption
cases
Median Mid-50 Range Median Mid-50 Range Median Mid-50 Range
Low-need/low complexity 5.5 hrs 3 – 11.5 hrs 4 hrs 2 – 7.5 hrs 5 hrs 3 – 15 hrs Moderate-need/moderately complex
10 hrs 3.25 – 20 hrs 7 hrs 3 – 12 hrs 10 hrs 5 – 20 hrs
High-need/highly complex 10 hrs 4 – 20 hrs 10 hrs 5 – 22.5 hrs 20 hrs 8 – 30 hrs
Estimates of Hours Logged in Indirect Case Activity The estimates of hours spent on various types of cases presented above take into account time spent on such indirect activities (i.e., those that did not involve direct work with children and families) as case-related travel, SACWIS and other documentation/paperwork, and court time. For the following questions, caseworkers were asked to estimate the number of hours they typically spend each month on indirect activities across their entire caseload. Also, while the question regarding time spent in SACWIS was phrased as “SACWIS data entry,” it is clear from both practice and survey responses that SACWIS is viewed by many caseworkers as a tool for making decisions, formulating case plans, and reviewing essential information – far more than mere “data entry.”
0.00%
20.00%
40.00%
60.00%
80.00%
100.00%
120.00%
0
10
20
30
40
50
60
70
80
90
100
Less 11
13
15
17
19
21
23
25
27
29
31
33
35
37
39
Mo
re
Fre
qu
en
cy
Estimated Hours
Frequency
Cumulative %

Caseload Complexity Survey – Preliminary Report
Public Children Services Association of Ohio 19
Charts 16a, 16b, 16c, and 16d. Estimated time spent on indirect casework each month across all cases (n=611) Chart 16a. Hours spent waiting in court (not with families) per month across caseload Median= 5 hours; Middle-50 Range: 2-10 hours
Chart 16b. Hours spent on case-related travel per month across caseload Median=20 hours; Middle-50 Range: 12-35 hours
0.00%
20.00%
40.00%
60.00%
80.00%
100.00%
120.00%
0
20
40
60
80
100
120
140
160
Fre
qu
en
cy
Estimated Hours
Frequency
Cumulative %
0.00%
20.00%
40.00%
60.00%
80.00%
100.00%
120.00%
0
20
40
60
80
100
120
140
160
Fre
qu
en
cy
Estimated Hours
Frequency
Cumulative %

Caseload Complexity Survey – Preliminary Report
Public Children Services Association of Ohio 20
Chart 16c. Hours spent in SACWIS per month across caseload Median=40 hours; Middle-50 Range: 20-70 hours
Chart 16d. Hours spent on other documentation/paperwork per month across caseload Median=20 hours; Middle-50 Range: 10-40 hours
0.00%
20.00%
40.00%
60.00%
80.00%
100.00%
120.00%
0
20
40
60
80
100
120
140
160Fr
eq
ue
ncy
Estimated Hours
Frequency
Cumulative %
0.00%
20.00%
40.00%
60.00%
80.00%
100.00%
120.00%
0
20
40
60
80
100
120
Less
9-1
0
11
-12
13
-14
15
-16
17
-18
19
-20
21
-22
23
-24
25
-26
27
-28
29
-30
31
-32
33
-34
35
-36
37
-38
39
-40
Mo
re
Fre
qu
en
cy
Estimated Hours
Frequency
Cumulative %

Caseload Complexity Survey – Preliminary Report
Public Children Services Association of Ohio 21
Workload and Efficiency Impacts Caseworkers were asked to rank a variety of agency factors as to how much or how little they save time on casework. Chart 17. Agency factors that save time on casework (n=604)
Conclusion The Oversight Committee believes that it is too early to draw hard-and-fast conclusions from the data presented here. For one thing, analysis of the data continues, particularly with respect to the open-ended questions. There was closer agreement among respondents on the range of time required to service low-need cases, regardless of the type of case (intake, ongoing, foster certifications, IL, adoptions). This is shown by the relatively narrow “spread” in charts 14a and 15a and the much larger “spread” for the moderate- and high-needs cases (charts 14b, 14c, 15b, and 15c); Table 2 shows similar results under low vs. moderate and high. With respect to case characteristics, readers can certainly infer from Chart 7, for example, that working with a caretaker with low cognitive ability is viewed as more complex than conducting family search and engagement activities to seek out paternal relatives, or from Chart 9 that cases in which children have had multiple moves are viewed as more complex than placing sibling groups. The Oversight Committee awaits the results of the time study to see if these rankings are borne out, and to better understand the relationship among the various groupings of characteristics.
Caseload Complexity Survey – Preliminary Report
Public Children Services Association of Ohio 22
Appendix PCSAO Caseload Complexity Survey

PCSAO Caseload Complexity SurveyPCSAO Caseload Complexity SurveyPCSAO Caseload Complexity SurveyPCSAO Caseload Complexity Survey
This survey is to be completed only by public agency case workers. If you are not a case worker assigned, at least part-time, to child protection cases, do not complete this survey. The results of this survey will help PCSAO better understand issues around workload and make recommendations for caseload size. The survey should take about 15 minutes to complete, but because of the importance of the topic, we encourage you to take as much time as needed. Thank you for your assistance.
1. County
2. Differential Response subcategory
3. What is the highest degree you have received?
4. How many years of experience do you have in children and family services?
This survey includes questions for intake/assessment/investigation workers, ongoing workers, and specialized workers. Your answer to these questions will direct you to the appropriate section of the survey.
Introduction
Identifying Information
Specialization
Traditional response
Alternative response
Blended caseload
Bachelor's Degree with Social Work
Master's Degree with Social Work
Bachelor's Degree
Master's Degree
Other (please specify)
Less than 1 year
1-2 years
3-5 years
More than 5 years
Other (please specify)
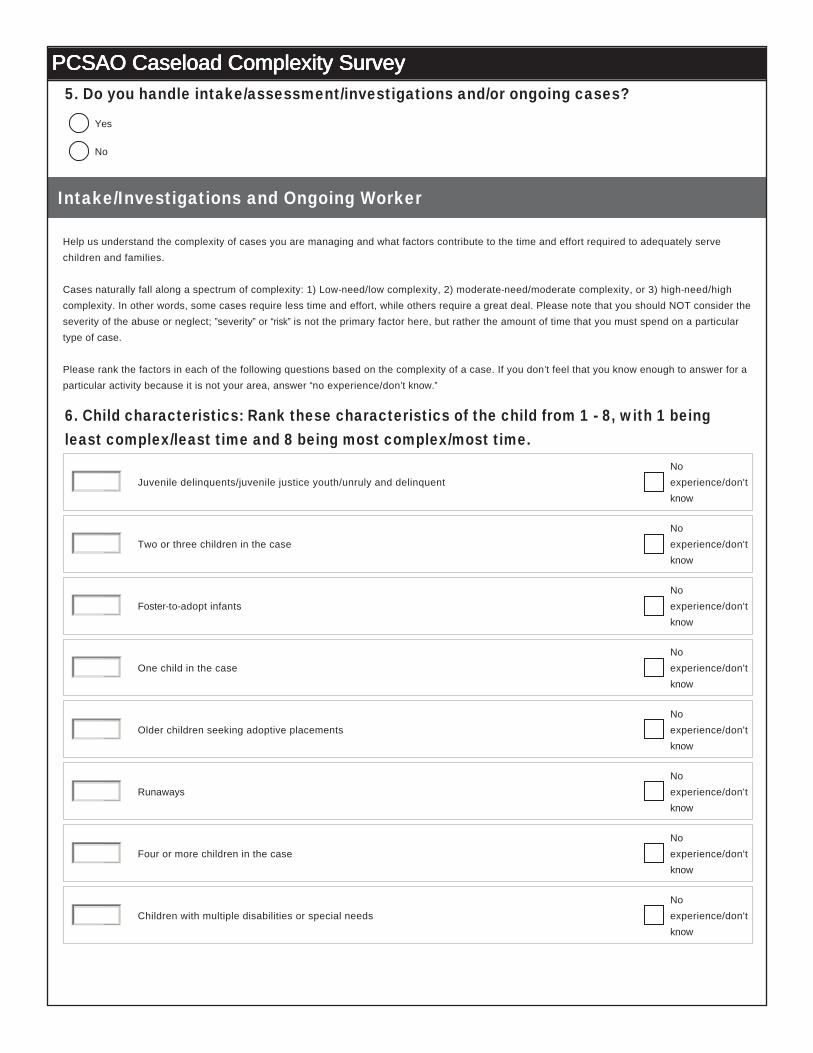
PCSAO Caseload Complexity SurveyPCSAO Caseload Complexity SurveyPCSAO Caseload Complexity SurveyPCSAO Caseload Complexity Survey5. Do you handle intake/assessment/investigations and/or ongoing cases?
Help us understand the complexity of cases you are managing and what factors contribute to the time and effort required to adequately serve children and families. Cases naturally fall along a spectrum of complexity: 1) Low-need/low complexity, 2) moderate-need/moderate complexity, or 3) high-need/high complexity. In other words, some cases require less time and effort, while others require a great deal. Please note that you should NOT consider the severity of the abuse or neglect; ”severity” or “risk” is not the primary factor here, but rather the amount of time that you must spend on a particular type of case. Please rank the factors in each of the following questions based on the complexity of a case. If you don’t feel that you know enough to answer for a particular activity because it is not your area, answer “no experience/don’t know.”
6. Child characteristics: Rank these characteristics of the child from 1 - 8, with 1 being least complex/least time and 8 being most complex/most time.
Intake/Investigations and Ongoing Worker
Juvenile delinquents/juvenile justice youth/unruly and delinquent No experience/don't know
Two or three children in the case No experience/don't know
Foster-to-adopt infants No experience/don't know
One child in the case No experience/don't know
Older children seeking adoptive placements No experience/don't know
Runaways No experience/don't know
Four or more children in the case No experience/don't know
Children with multiple disabilities or special needs No experience/don't know
Yes
No

PCSAO Caseload Complexity SurveyPCSAO Caseload Complexity SurveyPCSAO Caseload Complexity SurveyPCSAO Caseload Complexity Survey7. What other child characteristics impact complexity level, and how so?
8. Family characteristics: Rank these characteristics of the family from 1 - 6, with 1 being least complex/least time and 6 being most complex/most time.
9. Additional family characteristics: Rank these characteristics of the family from 1 - 5, with 1 being least complex/least time and 5 being most complex/most time.
Poverty No experience/don't know
Mental illness No experience/don't know
Substance abuse No experience/don't know
Sex abuse No experience/don't know
Intimate partner violence No experience/don't know
Homelessness No experience/don't know
Older caretaker No experience/don't know
Extended/paternal family member involvement No experience/don't know
Poor parenting skills No experience/don't know
Fatherhood/family search and engagement No experience/don't know
Low cognitive ability of caretaker No experience/don't know

PCSAO Caseload Complexity SurveyPCSAO Caseload Complexity SurveyPCSAO Caseload Complexity SurveyPCSAO Caseload Complexity Survey10. What other family characteristics impact complexity level, and how so?
11. Case status: Rank the following case characteristics from 1 - 4, with 1 being least complex/least time and 4 being most complex/most time.
12. What other case characteristics impact complexity level, and how so?
Court-ordered custody/paid placement No experience/don't know
Court-ordered kinship protective services No experience/don't know
Court-ordered in-home protective services No experience/don't know
Voluntary No experience/don't know

PCSAO Caseload Complexity SurveyPCSAO Caseload Complexity SurveyPCSAO Caseload Complexity SurveyPCSAO Caseload Complexity Survey13. Placement needs: Rank the following on a scale of 1 - 10, with 1 being least complex/least time and 10 being most complex/most time.
14. What other placement issues impact complexity level, and how so?
Out-of-county placement/ICPC No experience/don't know
Group/residential placement No experience/don't know
Foster care licensing/certification No experience/don't know
Treatment foster care No experience/don't know
Adoption cases with sibling groups No experience/don't know
Multiple moves No experience/don't know
Adoption approval No experience/don't know
Siblings in different homes No experience/don't know
Basic foster care No experience/don't know
Kinship/grandparent placement No experience/don't know

PCSAO Caseload Complexity SurveyPCSAO Caseload Complexity SurveyPCSAO Caseload Complexity SurveyPCSAO Caseload Complexity Survey15. If you handle investigations: Estimate the number of HOURS you spend on a TYPICAL investigation throughout the entire case in each of the following categories. Remember, this is time spent on a typical low-need vs. moderate-need vs. high-need case. Be sure to count case-related travel, data entry, court time, and all other effort put into the case. Do not count training, lunch/breaks, vacation, etc. Make your best guess (rather than entering 0 or nothing).
16. If you handle ongoing cases: Estimate the number of HOURS you spend on a TYPICAL case EACH MONTH in each of the following categories. Remember, this is time spent on a typical low-need vs. moderate-need vs. high-need case. Be sure to count case-related travel, data entry, court time, and all other effort put into the case. Do not count training, lunch/breaks, vacation, etc. Make your best guess (rather than entering 0 or nothing).
17. Do you handle foster care certification?
Help us understand the complexity of cases you are managing and what factors contribute to the time and effort required to adequately serve children and families. Cases naturally fall along a spectrum of complexity: 1) Low-need/low complexity, 2) moderate-need/moderate complexity, or 3) high-need/high complexity. In other words, some cases require less time and effort, while others require a great deal. Please note that you should NOT consider the severity of the abuse or neglect; ”severity” or “risk” is not the primary factor here, but rather the amount of time that you must spend on a particular type of case. Please rank the factors in this section based on the complexity of a case. If you don’t feel that you know enough to answer for a particular activity because it is not your area, answer “no experience/don’t know.”
Low-need/low complexity
Moderate-need/moderate complexity
High-need/high complexity
Low-need/low complexity
Moderate-need/moderate complexity
High-need/high complexity
Specialization
Foster Care Worker
Yes
No
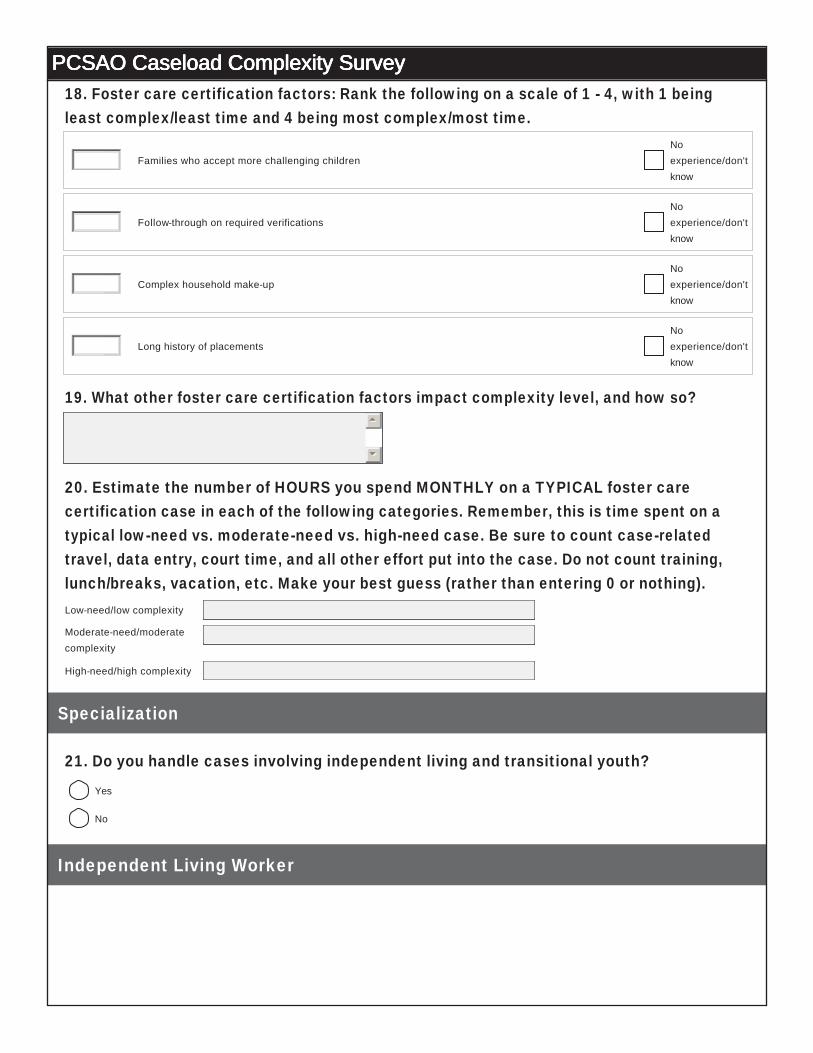
PCSAO Caseload Complexity SurveyPCSAO Caseload Complexity SurveyPCSAO Caseload Complexity SurveyPCSAO Caseload Complexity Survey18. Foster care certification factors: Rank the following on a scale of 1 - 4, with 1 being least complex/least time and 4 being most complex/most time.
19. What other foster care certification factors impact complexity level, and how so?
20. Estimate the number of HOURS you spend MONTHLY on a TYPICAL foster care certification case in each of the following categories. Remember, this is time spent on a typical low-need vs. moderate-need vs. high-need case. Be sure to count case-related travel, data entry, court time, and all other effort put into the case. Do not count training, lunch/breaks, vacation, etc. Make your best guess (rather than entering 0 or nothing).
21. Do you handle cases involving independent living and transitional youth?
Families who accept more challenging children No experience/don't know
Follow-through on required verifications No experience/don't know
Complex household make-up No experience/don't know
Long history of placements No experience/don't know
Low-need/low complexity
Moderate-need/moderate complexity
High-need/high complexity
Specialization
Independent Living Worker
Yes
No
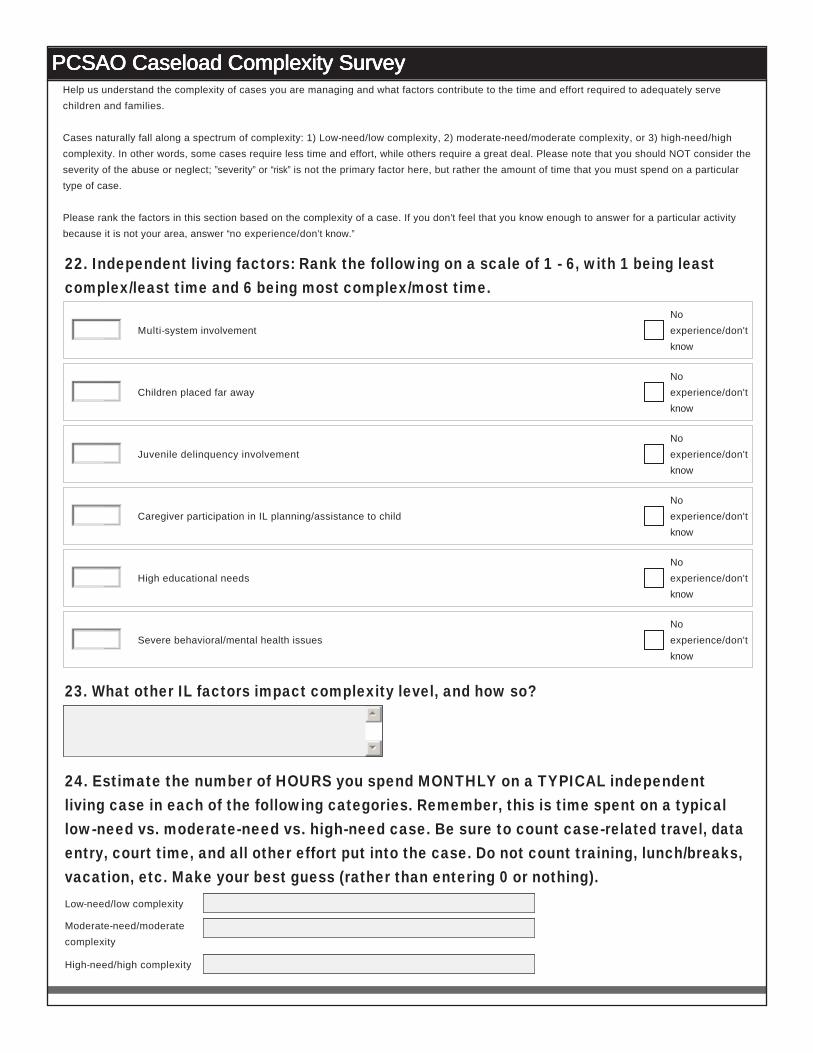
PCSAO Caseload Complexity SurveyPCSAO Caseload Complexity SurveyPCSAO Caseload Complexity SurveyPCSAO Caseload Complexity SurveyHelp us understand the complexity of cases you are managing and what factors contribute to the time and effort required to adequately serve children and families. Cases naturally fall along a spectrum of complexity: 1) Low-need/low complexity, 2) moderate-need/moderate complexity, or 3) high-need/high complexity. In other words, some cases require less time and effort, while others require a great deal. Please note that you should NOT consider the severity of the abuse or neglect; ”severity” or “risk” is not the primary factor here, but rather the amount of time that you must spend on a particular type of case. Please rank the factors in this section based on the complexity of a case. If you don’t feel that you know enough to answer for a particular activity because it is not your area, answer “no experience/don’t know.”
22. Independent living factors: Rank the following on a scale of 1 - 6, with 1 being least complex/least time and 6 being most complex/most time.
23. What other IL factors impact complexity level, and how so?
24. Estimate the number of HOURS you spend MONTHLY on a TYPICAL independent living case in each of the following categories. Remember, this is time spent on a typical low-need vs. moderate-need vs. high-need case. Be sure to count case-related travel, data entry, court time, and all other effort put into the case. Do not count training, lunch/breaks, vacation, etc. Make your best guess (rather than entering 0 or nothing).
Multi-system involvement No experience/don't know
Children placed far away No experience/don't know
Juvenile delinquency involvement No experience/don't know
Caregiver participation in IL planning/assistance to child No experience/don't know
High educational needs No experience/don't know
Severe behavioral/mental health issues No experience/don't know
Low-need/low complexity
Moderate-need/moderate complexity
High-need/high complexity

PCSAO Caseload Complexity SurveyPCSAO Caseload Complexity SurveyPCSAO Caseload Complexity SurveyPCSAO Caseload Complexity Survey
25. Do you handle adoptions?
Help us understand the complexity of cases you are managing and what factors contribute to the time and effort required to adequately serve children and families. Cases naturally fall along a spectrum of complexity: 1) Low-need/low complexity, 2) moderate-need/moderate complexity, or 3) high-need/high complexity. In other words, some cases require less time and effort, while others require a great deal. Please note that you should NOT consider the severity of the abuse or neglect; ”severity” or “risk” is not the primary factor here, but rather the amount of time that you must spend on a particular type of case. Please rank the factors in this section based on the complexity of a case. If you don’t feel that you know enough to answer for a particular activity because it is not your area, answer “no experience/don’t know.”
26. Adoption factors: Rank the following on a scale of 1 - 6, with 1 being least complex/least time and 6 being most complex/most time.
27. What other adoption factors impact complexity level, and how so?
Specialization
Adoption Worker
Severe behavioral/mental health issues No experience/don't know
Multiple number of disrupted placement changes No experience/don't know
Multi-system involvement No experience/don't know
Sibling groups (especially if not placed together) No experience/don't know
Severe educational needs No experience/don't know
Medically fragile children No experience/don't know
Yes
No

PCSAO Caseload Complexity SurveyPCSAO Caseload Complexity SurveyPCSAO Caseload Complexity SurveyPCSAO Caseload Complexity Survey28. Estimate the number of HOURS you spend MONTHLY on a TYPICAL adoption case in each of the following categories. Remember, this is time spent on a typical low-need vs. moderate-need vs. high-need case. Be sure to count case-related travel, data entry, court time, and all other effort put into the case. Do not count training, lunch/breaks, vacation, etc. Make your best guess (rather than entering 0 or nothing).
In this section, help us understand your caseload and how much time you spend on cases and activities. Use only whole positive numbers.
29. Number of cases you are assigned right now:
30. Based on your own sense of what constitutes case complexity, categorize your current caseload using the three categories below. Of the cases you are currently assigned, indicate the number that fall into these categories (these should add to the total number of cases indicated above). Example: If you indicated above that you are carrying 12 cases, you might enter 3 under low, 7 under moderate, and 2 under high.
31. Next, please estimate the amount of time (AVERAGE number of HOURS) you spend in a TYPICAL MONTH on only the following tasks.
32. Please share any comments or explanations of the answers you provided in this section.
Low-need/low complexity
Moderate-need/moderate complexity
High-need/high complexity
Time Estimate
Please enter a whole number
Low-need/low complexity
Moderate-need/moderate complexity
High-need/high complexity
Time in court (not spent on family)
Case-related travel
SACWIS data entry
Other documentation/paperwork
Case Management
PCSAO Caseload Complexity SurveyPCSAO Caseload Complexity SurveyPCSAO Caseload Complexity SurveyPCSAO Caseload Complexity Survey
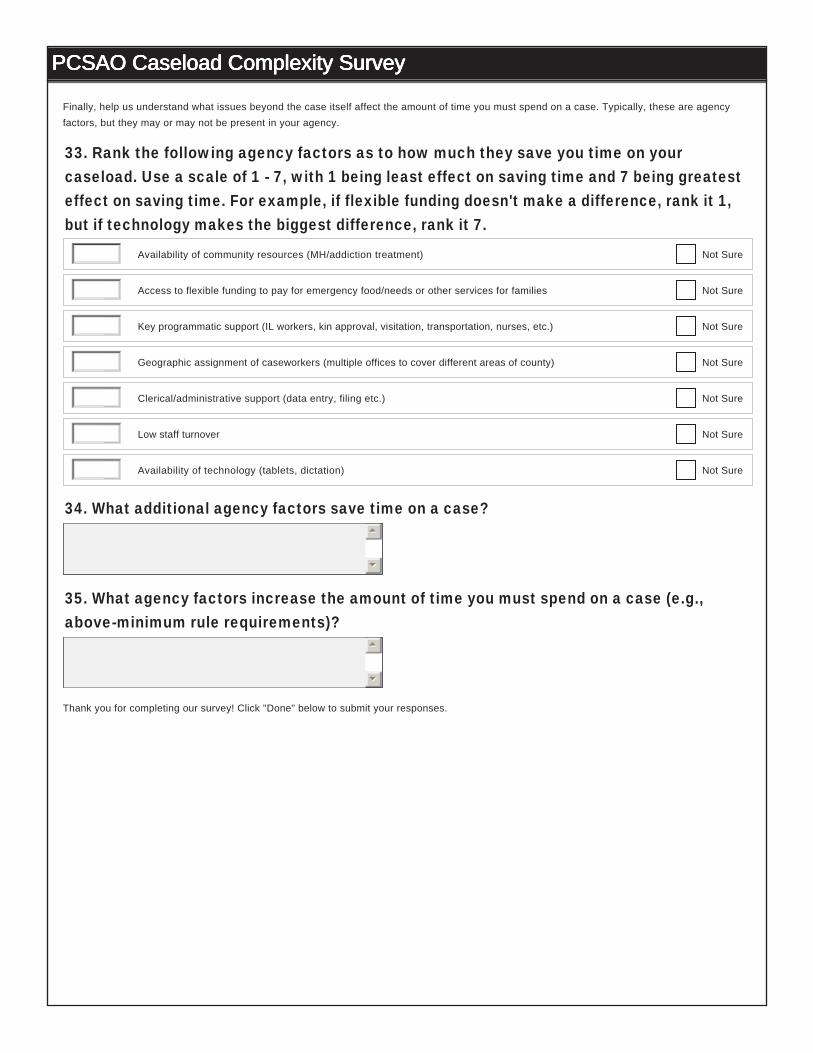
Finally, help us understand what issues beyond the case itself affect the amount of time you must spend on a case. Typically, these are agency factors, but they may or may not be present in your agency.
33. Rank the following agency factors as to how much they save you time on your caseload. Use a scale of 1 - 7, with 1 being least effect on saving time and 7 being greatest effect on saving time. For example, if flexible funding doesn't make a difference, rank it 1, but if technology makes the biggest difference, rank it 7.
34. What additional agency factors save time on a case?
35. What agency factors increase the amount of time you must spend on a case (e.g., above-minimum rule requirements)?
Thank you for completing our survey! Click "Done" below to submit your responses.
Availability of community resources (MH/addiction treatment) Not Sure
Access to flexible funding to pay for emergency food/needs or other services for families Not Sure
Key programmatic support (IL workers, kin approval, visitation, transportation, nurses, etc.) Not Sure
Geographic assignment of caseworkers (multiple offices to cover different areas of county) Not Sure
Clerical/administrative support (data entry, filing etc.) Not Sure
Low staff turnover Not Sure
Availability of technology (tablets, dictation) Not Sure