oic member countries economic … (latin america) in the west to indonesia (asia) ... the oic...
TRANSCRIPT

Statistical Economic and Social Researchand Training Centre for Islamic Countries
(SESRIC)
Statistical Economic and Social Researchand Training Centre for Islamic Countries
(SESRIC)
Organization of the Islamic ConferenceOrganization of the Islamic Conference
ECONOMIC PERFORMANCE
AND HUMAN DEVELOPMENT
ECONOMIC PERFORMANCE
AND HUMAN DEVELOPMENT 2000-20072000-2007
OIC MEMBER COUNTRIES

OIC Member Countries: Economic
Performance and Human Development
2000-2007
Statistical, Economic and Social Research and Training Centre
for Islamic Countries (SESRIC)

Statistical, Economic and Social Research and Training Centre
for Islamic Countries (SESRTCIC)
Attar Sokak No. 4, 06700 GOP, Ankara, TURKEY
Tel: (90-312) 468 6172 (4 lines) Fax: (90-312) 468 5726
E-mail: [email protected] Web: www.sesric.org

OIC Member Countries: Economic Performance and Human Development 2000-2007
Content
INTRODUCTION -------------------------------------------------------------------------------------------------------- 1
ECONOMIC PERFORMANCE ---------------------------------------------------------------------------- 2
1. Gross Domestic Product (GDP) and Population ----------------------------------------------- 3 2. Foreign Trade and Current Account balance --------------------------------------------------- 5 3. Intra-OIC Trade ---------------------------------------------------------------------------------------- 8 4. Foreign Direct Investment (FDI) ------------------------------------------------------------------- 8 5. External Debt ------------------------------------------------------------------------------------------ 10 6. Inflation ------------------------------------------------------------------------------------------------- 11
HUMAN DEVELOPMENT PERFORMANCE ------------------------------------------------------- 13
1. Human Development Index (HDI) --------------------------------------------------------------- 13 2. Human Poverty Index (HPI) ------------------------------------------------------------------------ 14 3. Millennium Development Goals (MDGs) ------------------------------------------------------ 16
STATISTICAL ANNEX -------------------------------------------------------------------------------------- 27
Table 1: GDP at Current Prices, Million USD -------------------------------------------------------- 28 Table 2: GDP Per Capita at Current Prices, USD --------------------------------------------------- 29 Table 3: Real GDP Growth Rate, Percent ----------------------------------------------------------- 30 Table 4: Total Merchandise Exports (F.O.B.), Million USD ------------------------------------- 31 Table 5: Total Merchandise Imports (C.I.F.), Million USD --------------------------------------- 32 Table 6: Trade Balance, Million USD ------------------------------------------------------------------ 33 Table 7: Current Account Balance, Million USD --------------------------------------------------- 34 Table 8: Intra-OIC Exports, % of Total Exports ----------------------------------------------------- 35 Table 9: Intra-OIC Imports, % of Total Imports ---------------------------------------------------- 36 Table 10: Intra-OIC Trade, % of Total Trade -------------------------------------------------------- 37 Table 11: Foreign Direct Investment, Net Inflows, Million USD ------------------------------- 38 Table 12: Total External Debt, % of GDP ------------------------------------------------------------- 39 Table 13: Inflation, Annual Percentage Change in Consumer Prices ------------------------- 40 Table 14: Human Development Index (HDI) -------------------------------------------------------- 41 Table 15: Human Poverty Index (HPI) ---------------------------------------------------------------- 42 Table 16: Average Progress Comparison between the periods 2000-2004 and
20005-Most Recent Year for the World, Developing Regions and OIC ---------- 43

1
OIC Member Countries: Economic Performance and Human Development, 2000-2007
INTRODUCTION The 57 OIC member countries are dispersed over a large geographical region in four continents, extending from Albania (Europe) in the north to Mozambique (Africa) in the south, and from Guyana (Latin America) in the west to Indonesia (Asia) in the east. As such, the OIC countries as a group account for one sixth of the world land area and more than one fifth of its population. They constitute a substantial part of the developing countries and, as a group, are well-endowed with a high economic potential in different fields and sectors such as energy and mining (mainly oil and gas), agriculture and arable land, human resources, and a vast strategic trading region. However, the OIC countries do not make up a homogeneous economic group but, rather, a mixed set-up reflecting a high level of heterogeneity and divergence in economic development levels, structure and performance. Given this state of affairs, the present concise report attempts to demonstrate the trends of economic and human development in the OIC member countries since 2000. It highlights and investigates the trends in major economic indicators of the group of the OIC countries such as the average growth in Gross Domestic Product (GDP) and Population, foreign trade performance in terms of merchandise exports and imports, the levels of intra-OIC trade, foreign direct investment (FDI) inflows into these countries, and the levels of external debt and inflation. On the other hand, the performance of the OIC countries in terms of human development during the period under consideration is examined through highlighting and investigating the trends in the progress achieved in terms of the UNDP’s Human Development Index (HDI), Human Poverty Index (HPI) and the UN Millennium Development Goals (MDGs). For all the above-mentioned indicators, the report compares the average performance of the OIC countries as a group with the world average and the average of the developing countries. It also compares the average performance of the OIC group in the period starting in 2005 (2005-2007) with that of the period before 2005 (2000-2004). For some indicators, the share of OIC countries in world total has been shown during the period under consideration. The report also highlights the top OIC performing countries. The statistical data used in the preparation of this report is attached as a statistical annex.

2
ECONOMIC PERFORMANCE With more than 22 percent of the world total population, the 57 OIC member countries accounted for only 6.6% of the world total output (GDP) and 9.8% of world total merchandise exports, in terms of current US Dollars. Although the average growth rates of both real GDP and per capita GDP recorded by the group of the OIC member countries during the last five-year period were higher than those of both the developed countries and the world averages, they were still comparatively lower than those maintained by the group of developing countries. The mixed nature of the group of the OIC countries reflects high levels of heterogeneity and divergence in the economic structure and performance of these countries. Out of the world’s 50 least-developed countries, 22 are OIC member countries, almost all of which depend for their growth and development on the exports of a few non-oil primary commodities, mostly agricultural commodities. On the other hand, 17 OIC countries are classified as fuel-exporting countries, for which the prospects of growth and the development of their economies are dependant mainly on producing and exporting of only oil and/or gas. In such a set-up, the gap between the rich and the poor OIC countries is substantial. In this context, 26 OIC member countries are currently classified by the World Bank as Low-income countries and 25 are Middle-income countries (18 lower middle-income and 7 upper middle-income). In contrast, only 6 OIC member countries are classified as high-income countries. Therefore, the total output (income) and trade of the group of the OIC countries are still heavily concentrated in a few of them; only 10 countries accounted for 74 percent of the total income (GDP) of the OIC countries and 76 percent of their total merchandise exports, both in terms of current US Dollars. The picture becomes worse when the external debt situation of the OIC countries is considered, where, by the end of 2006, the total external debt of these countries amounted to $752.6 billion. In this context, and according to the recent World Bank classification by their level of indebtedness in 2008, 22 OIC member countries are considered as Heavily Indebted Poor Countries (HIPCs), potentially eligible to receive debt relief. Against this background, the rest of this section examines the trends in the major economic indicators of the OIC countries as a group during the period 2000-2007 and compares them to their counterparts in the developing countries and the world economy as a whole.

3
1. Gross Domestic Product (GDP) and Population At the very beginning of the 21st century, 1,310 billion people of OIC member countries constituted 21.40 percent of the total world’s population and produced a mere 4.8 percent of the world total GDP. In less than a decade, at the end of 2007, the population of OIC reached to a world share of 22.5 percent with 1.47 billion people. With nearly 1.5 billion in 2007, the total output (GDP) of OIC countries amounted to 3,608 billion in current US dollars, corresponding to 6.6 % of the world total GDP (Figure 1).
Figure 1: GDP of the OIC and Share in the World Output
0
5
10
15
20
25
30
0.0
0.5
1.0
1.5
2.0
2.5
3.0
3.5
4.0
2000 2001 2002 2003 2004 2005 2006 2007
Pe
rce
nt
Trill
ion
USD
GDP of the OIC OIC Share in GDP of Developing C. (RHS)
OIC Share in World GDP (RHS)
Source: SESRIC, BASEIND Database; UNSD, National Accounts Main Aggregates Database.
The average per capita GDP of OIC countries in current prices amounted to USD 2,100 for the period 2005-2007. This reflects an approximate 55 percent increase compared to the preceding three-year (2002-2004) average of $1,353. However, the average per capita GDP of OIC countries could not reach the average level of the developing countries, and lagged far behind that of world in both periods (Figure 2).
0
5
10
15
20
25
30
0.0
0.5
1.0
1.5
2.0
2.5
3.0
3.5
4.0
2000 2001 2002 2003 2004 2005 2006 2007
Pe
rce
nt
Trill
ion
USD
GDP of the OIC OIC Share in GDP of Developing C. (RHS)
OIC Share in World GDP (RHS)

4
Figure 2: GDP Per Capita
0
1,000
2,000
3,000
4,000
5,000
6,000
7,000
8,000
9,000
2000 2001 2002 2003 2004 2005 2006 2007
Cu
rre
nt
USD
OIC Countries Developing Countries World
Source: SESRIC, BASEIND Database; UNSD, National Accounts Main Aggregates Database.
At the individual country level, Qatar, United Arab Emirates, Kuwait, Brunei, and Bahrain recorded the highest GDP per capita in the period 2005-2007, the same as the preceding period. In contrast, Guinea Bissau, Niger, Afghanistan, Mozambique, and Gambia recorded the lowest per capita GDP in the period 2002-2004. In the following period of 2005-2007, the first three countries were again in this list yet, this time, with Somalia and Sierra Leone (Figure 3).
Figure 3: OIC Countries with the Highest and Lowest GDP Per Capita
Qatar
UAEKuwait
Brunei
Bahrain
0
10
20
30
40
50
60
70
Tho
usa
nd
USD
Highest GDP Per Capita
2002-2004 Average
Guinea-Bissau
NigerSomalia
Sierra Leone Afghanistan
0
50
100
150
200
250
300
350
USD
Lowest GDP Per Capita
2005-2007 Average
Source: SESRIC, BASEIND Database; UNSD, National Accounts Main Aggregates Database.
In 2005, OIC member countries were influenced by the slowdown in the global economic activity, like other countries in the world. The downward trend is highly apparent for the real GDP growth rates after 2004, falling below the average growth of developing countries yet still remaining far above the world average. Although the developing countries and the world economy captured the growth momentum back in 2006, the OIC countries could not benefit
0
1,000
2,000
3,000
4,000
5,000
6,000
7,000
8,000
9,000
2000 2001 2002 2003 2004 2005 2006 2007
Cu
rre
nt
USD
OIC Countries Developing Countries World

5
enough from the expansion in the world economic activity and recorded a rate of 6.06 percent in 2006 and even a more deteriorated rate, 5.84 percent, in 2007.
On the other hand, when the growth rates of real GDP and population were examined together, the picture was not so devastating in terms of real per capita GDP. Although the growth rate of OIC population was still much higher than those of the world and developing countries, it had a decreasing trend. As long as this downward trend in population is accompanied by an increase in real GDP, the figures of real GDP per capita growth improved. In 2000, OIC grew by 1.99 and 4.87 percent in population and real GDP, respectively. Coming to the year 2007, the population growth was regressed to a level of 1.87 percent while the real GDP increased by 5.84 (Figure 4). Hence, the real GDP per capita of OIC increased to $ 1481 in 2007 according to year 1990 prices from $ 1167 in 2000. In this regard, it is observed that OIC countries as a group recorded the highest growth rate of 4.9 percent in real GDP per capita in 2004. Although this rate was higher than that of the world average of 2.77 percent, it was still lower than the performance of the developing countries (6.12 percent) in that year. Moreover, the decreasing trend in growth of real GDP led to a performance below the developing countries for the period 2005-2007 in terms of growth in per capita GDP.
Figure 4: Real GDP Growth vs. Population Growth
0
1
2
3
4
5
6
7
8
2000 2001 2002 2003 2004 2005 2006 2007
Pe
rce
nt
OIC Countries Developing C. World
OIC Countries Developing C. World
P o p u l a t i o n G r o w t h
G D P G r o w t h
Source: SESRIC, BASEIND Database; UNSD, National Accounts Main Aggregates Database.
2. Foreign Trade and Current Account Balance
During the period 2000-2007, total merchandise exports of the OIC member countries increased significantly to reach $1356 billion in 2007 compared to $539 billion in 2000. Similar patterns are also observed in the case of import performance as total merchandise imports of the OIC countries increased more than three-fold to reach $1207 billion in 2007. Most of these increases were recorded in the period 2004-2007 as a result of the recovery from the global
0
1
2
3
4
5
6
7
8
2000 2001 2002 2003 2004 2005 2006 2007
Pe
rce
nt
OIC Countries Developing C. World
OIC Countries Developing C. World
P o p u l a t i o n G r o w t h
G D P G r o w t h

6
economic slowdown in the early 2000s. Accordingly, market share of the OIC in global trade increased gradually during the last four years to reach 9.1% in 2007, compared to steady state of 7% during 2000-2003. Similarly, the decreasing share of the OIC in total trade of developing countries was reversed in 2004 such that it reached 21 % and remained almost stable till 2007.
Figure 5: OIC Merchandise Exports & Imports and World Market Shares
5
7
9
11
13
15
17
19
21
23
0
200
400
600
800
1,000
1,200
1,400
2000 2001 2002 2003 2004 2005 2006 2007
Pe
rce
nt
Bil
lio
n U
SD
Exports Imports
Share in Global Trade (RHS) Share in Total Trade of Developing C. (RHS)
Source: SESRIC, BASEIND Database; IMF, Direction of Trade Statistics Database.
The major five exporting OIC member countries during the period under consideration were Saudi Arabia, Malaysia, UAE, Indonesia, and Turkey. On average, in the period 2005-2007, Saudi Arabia was the leading country in exports with more than USD 180 billion, followed by Malaysia, UAE, Indonesia, and Turkey. Although these countries were again the top exporters in the preceding period, the ranking was somewhat different.
Figure 6: Top Exporters
0
20
40
60
80
100
120
140
160
180
200
Saudi Arabia Malaysia United Arab Emirates
Indonesia Turkey
Billi
on U
SD
2002-2004 Average 2005-2007 Average
Source: SESRIC, BASEIND Database; IMF, Direction of Trade Statistics Database.
5
7
9
11
13
15
17
19
21
23
0
200
400
600
800
1,000
1,200
1,400
2000 2001 2002 2003 2004 2005 2006 2007
Pe
rce
nt
Bil
lio
n U
SD
Exports Imports
Share in Global Trade (RHS) Share in Total Trade of Developing C. (RHS)

7
Following the negative global growth of exports in 2001, the OIC member countries as a group recorded a remarkable recovery in 2002-2004. Their average growth rate of exports surpassed that of the world and the developing countries in 2003-2006. After peaking in 2004, the average growth rate of OIC exports followed a decreasing trend, falling below the world average and the average of the developing countries in 2007.
Figure 7: Growth of Exports
-10
-5
0
5
10
15
20
25
30
35
2000 2001 2002 2003 2004 2005 2006 2007
Pe
rce
nt
World Developing Countries OIC
Source: SESRIC, BASEIND Database; IMF, Direction of Trade Statistics Database.
The OIC countries as a group recorded trade balance surplus during the period under consideration. Although the trade balance surplus of the group of the OIC countries increased significantly in the period 2005-2007, it remained below the level recorded by the developing countries. Similar trends were also observed in the case of the current account balance.
Figure 8: Trade Balance and Current Account Balance
0
100
200
300
400
500
600
700
2000 2001 2002 2003 2004 2005 2006 2007
Bill
ion
USD
Trade Balance - OIC
Trade Balance - Developing C.
Current Account Balance - OIC
Current Account Balance - Developing C.
Source: SESRIC, BASEIND Database; IMF, World Economic Outlook, Oct.08.
-10
-5
0
5
10
15
20
25
30
35
2000 2001 2002 2003 2004 2005 2006 2007
Pe
rce
nt
World Developing Countries OIC
0
100
200
300
400
500
600
700
2000 2001 2002 2003 2004 2005 2006 2007
Bill
ion
USD
Trade Balance - OIC
Trade Balance - Developing C.
Current Account Balance - OIC
Current Account Balance - Developing C.

8
3. Intra-OIC Trade Trade among the OIC member countries increased both in volume and as percentage of their total trade, especially after 2004 and with an upward trend up to 2007. Intra-OIC exports reached almost USD 200 billion in 2007 compared to only USD 75 billion in 2003. Intra-OIC imports also increased significantly in this period to reach USD 216 billion in 2007.
Figure 9: Intra-OIC Trade
10
12
14
16
18
20
0
50
100
150
200
250
2000 2001 2002 2003 2004 2005 2006 2007
Pe
rce
nt
Bill
ion
USD
Intra-OIC Exports Intra-OIC Imports
Intra-OIC Exports / Total OIC Exports (RHS) Intra-OIC Imports / Total OIC Imports (RHS)
Intra-OIC Trade / Total OIC Trade (RHS) Source: SESRIC, BASEIND Database; IMF, Direction of Trade Statistics Database.
In 2007, intra-OIC exports accounted for 14.6 percent of the total OIC exports compared to 10.2 percent in 2000. On the other hand, intra-OIC imports accounted for 17.9 percent of the total OIC imports in 2007 compared to 13.8 percent in 2000. Overall, total intra-OIC trade exceeded 15 percent of the total trade volume of the OIC in 2005 and reached to 16.1 percent in 2007. 4. Foreign Direct Investment (FDI) During 2000-2007, the OIC member countries as a group recorded a steadily increasing Foreign Direct Investment (FDI) net inflows, where these inflows increased from USD 12 billion in 2000 to USD 141 billion in 2007 (almost 12 times). With these amounts, the OIC countries as a group captured 7.7 percent of the global FDI inflows and 28.3 percent of the total FDI inflows in the developing countries in 2007 while these figures were only 0.8 percent and 4.6 percent, respectively, in 2000.
10
12
14
16
18
20
0
50
100
150
200
250
2000 2001 2002 2003 2004 2005 2006 2007
Pe
rce
nt
Bill
ion
USD
Intra-OIC Exports Intra-OIC Imports
Intra-OIC Exports / Total OIC Exports (RHS) Intra-OIC Imports / Total OIC Imports (RHS)
Intra-OIC Trade / Total OIC Trade (RHS)

9
Figure 10: Foreign Direct Investment, Net Inflow
0
5
10
15
20
25
30
35
0
20
40
60
80
100
120
140
160
2000 2001 2002 2003 2004 2005 2006 2007
Pe
rce
nt
Bill
ion
USD
OIC OIC, % of World (RHS) OIC, % of Developing C. (RHS)
Source: UNCTAD, FDISTAT.
While at the individual country level some OIC member countries, such as Saudi Arabia, Turkey, United Arab Emirates (UAE), Egypt and Nigeria, have managed to attract significant amount of FDI during this period, many others have not been able to attract sufficient FDI inflows due to a mixed set of political and economic factors.
Figure 11: Top Performers in terms of Growth in FDI
-5
0
5
10
15
20
25
2000 2001 2002 2003 2004 2005 2006 2007
Bill
ion
USD
Saudi Arabia Turkey UAE Egypt Nigeria
Source: UNCTAD, FDISTAT.
-5
0
5
10
15
20
25
2000 2001 2002 2003 2004 2005 2006 2007
Bill
ion
USD
Saudi Arabia Turkey UAE Egypt Nigeria
0
5
10
15
20
25
30
35
0
20
40
60
80
100
120
140
160
2000 2001 2002 2003 2004 2005 2006 2007
Pe
rce
nt
Bill
ion
USD
OIC OIC, % of World (RHS) OIC, % of Developing C. (RHS)

10
5. External Debt
During the period 2000-2006, external debt as % of GDP in the OIC member countries has shown down ward trend decreasing on average from 51% in 2000 to 31% in 2006. Yet, despite this progress, on average, the OIC member countries remained highly indebted compare to the group of all developing countries.
Figure 12: Total External Debt as Percentage of GDP
20
25
30
35
40
45
50
55
2000 2001 2002 2003 2004 2005 2006
Pe
rce
nt
OIC Developing Countries
Source: SESRIC, BASEIND Database; World Bank, World Development Indicators Online.
At the Individual country level, Iran, Azerbaijan, Oman, Albania, and Egypt were the top five countries to record the lowest External Debt/GDP ratio among the OIC member countries in the period 2000-2004. In the following two-year period of 2005-2006, Iran and Azerbaijan remained in this list while the others were replaced by Algeria, Turkmenistan, and Nigeria. Although some other member countries, such as Mali, Syria, and Benin, managed to achieve a significant decline, their indebtedness ratio remained relatively higher, and many other member countries remained mired in debt trap, twenty two of which are classified as Highly Indebted Poor Countries (HIPCs) by the World Bank.
Figure 13: OIC Countries with the Lowest External Debt/GDP
Iran
Azerbaijan OmanAlbania
Egypt
0
5
10
15
20
25
30
35
Pe
rce
nt
2000-2004 Average
IranAlgeria Turkmenistan
AzerbaijanNigeria
0
2
4
6
8
10
12
14
Pe
rce
nt
2005-2006 Average
Source: SESRIC, BASEIND Database; World Bank, World Development Indicators Online.
20
25
30
35
40
45
50
55
2000 2001 2002 2003 2004 2005 2006
Pe
rce
nt
OIC Developing Countries

11
6. Inflation Despite showing some initial decline, average inflation rate of the group of the OIC member countries remained higher than that of the world and the developing countries. During 2001-2004, the average inflation rate of the OIC member countries declined significantly from the peak level of 12% in 2001 to approximately 6.6 % in 2004. Yet, it started increasing moderately up to 2007. However, triggered by food and fuel price hike, inflation rebounded to double digits at the end of 2008.
Figure 14: Inflation Rate, Annual Percentage Change in Consumer Prices
0
2
4
6
8
10
12
14
2000 2001 2002 2003 2004 2005 2006 2007 2008* 2009*
Pe
rce
nt
OIC countries Developing Countries World
Source: SESRIC, BASEIND Database; IMF, World Economic Outlook, Oct.08. * Estimates.
Amid the current global financial crisis, commodity markets are also exhibiting downward trend. Hence, as projected in the figure, there are high expectations that the average inflation rate of the OIC countries is more likely to decrease in 2009.
Figure 15: OIC Countries with the Lowest Inflation Rates
Libya
ChadBrunei
Darussalam
Oman Guinea-Bissau
-4.0
-3.5
-3.0
-2.5
-2.0
-1.5
-1.0
-0.5
0.0
0.5
Pe
rce
nt
2002-2004 Average
Brunei Darussalam
Gabon
Morocco
Chad Saudi Arabia
0.0
0.5
1.0
1.5
2.0
2.5
Pe
rce
nt
2005-2007 Average
Source: SESRIC, BASEIND Database; IMF, World Economic Outlook, Oct.08.
0
2
4
6
8
10
12
14
2000 2001 2002 2003 2004 2005 2006 2007 2008* 2009*
Pe
rce
nt
OIC countries Developing Countries World

12
At the Individual country level, Libya, Chad, Brunei, Oman, and Guinea Bissau were the top five countries to record the lowest inflation rates among the OIC member countries in the period 2002-2004. In the following three-year period of 2005-2007, Brunei and Chad remained in this list while the others were replaced by Gabon, Morocco, and Saudi Arabia.
13
HUMAN DEVELOPMENT PERFORMANCE The social and human aspects of the development process have gained special importance in recent decades on the grounds that people should be encouraged to participate actively in that process with greater access to better social services, mainly education and health. Through more investment in people, social and human development leads to a more efficient and productive resource allocation and, thus, acts as a growth generating mechanism. In fact, social and human development contributes directly to the well-being of people through raising their living standards and eradicating poverty in the society. Many developing countries, including the OIC members, have paid special attention to the social and human development process over the last two decades. However, the development experience of the OIC countries has shown that although so far some of them have made remarkable progress in social and human development, including poverty alleviation, many others have met with serious setbacks. As an attempt to examine the social and human development performance of the OIC countries
since 2000, this part of the report highlights the trends in the progress achieved by these
countries in terms of the UNDP’s Human Development Index (HDI) and Human Poverty Index
(HPI) as well as the progress towards the achievement of the UN Millennium Development
Goals (MDGs).
1. Human Development Index (HDI) The Human Development Index (HDI) of the UNDP is an attempt to quantify the social and human dimensions of the development process. It is a composite index of life expectancy at birth as a proxy for longevity, adult literacy rate and gross enrolment ratio as a proxy for knowledge, and real GDP per capita as a proxy for income. Based on the value of the HDI, the UNDP classifies the countries by their level of human development into three different groups: High Human Development (HHD) with HDI values (0.800-1.000), Medium Human Development (MHD) with HDI values (0.500-0.799) and Low Human Development (LHD) with HDI values (0.00-0.499). The performance of the OIC countries in terms of the UNDP HDI in the period 2000-2005 can be seen in Table 14 in the Statistical Annex, which lists the OIC countries according to their human development level categories in this period, namely the OIC high human development countries (OIC-HHDCs), the OIC middle human development countries (OIC-MHDCs), and the OIC low human development countries (OIC-LHDCs). Except in few cases, it is observed that, overall, the human development level of the OIC countries did not change during the period 2000-2005, where most of them remained in the same category of human development since 2000, with the majority of them are classified as Medium Human Development (MHD) countries. As shown in Table 14 in the Statistical Annex

14
and Figure 16, only 9 out of the 21 OIC low human development countries (OIC-LHDCs) in 2000 have succeeded to move to the medium human development level by 2005.
Figure 16: OIC Countries Moved from LHD to MHD Level during 2000-2005
0.40
0.45
0.50
0.55
0.60
Pakistan Sudan Togo Yemen Bangladesh Djibouti Uganda Mauritania Gambia
HD
I V
alu
es
2000 (LHD) 2005 (MHD)
Source: UNDP, Human Development Report, various issues.
During the same period, the number of the OIC countries in the High Human Development (HHD) category has been doubled; increasing from only 5 countries in 2000 to 10 countries in 2005. As shown in Figure 17, the 5 OIC countries which have succeeded to move from the MHD level to the HHD level were Libya, Oman, Saudi Arabia, Malaysia and Albania.
Figure 17: OIC Countries Moved from MHD to HHD Level during 2000-2005
0.70
0.72
0.74
0.76
0.78
0.80
0.82
0.84
Libya Oman Saudi Arabia Malaysia Albania
HD
I V
alu
es
2000 (MHD) 2005 (HHD)
Source: UNDP, Human Development Report, various issues.
2. Human Poverty Index (HPI) The overall picture of human development in the OIC countries shows that, in general, the problem of poverty in many of these countries emanates from the fact that large segments of

15
their populations still have insignificant access to the basic social needs and do not possess sufficient material resources to improve their income. As is the case everywhere else, poverty in the OIC countries is a complex and multi-dimensional phenomenon resulting from the complex socio-economic structure of each individual country. In general, poverty is associated with poor economies, poor human resources, poor social services and poor economic and social policies. Hence, the status, determinants and policy measures required to eradicate it would, by definition, vary from one country to another. In this context, the Human Poverty Index (HPI) of the UNDP is an attempt to quantify the social and human dimension of poverty. It is a composite index calculated based on three essential aspects of human deprivation: longevity measured by the probability at birth of not surviving to the age of 40; knowledge measured by adult literacy rate; and a decent standard of living measured by the percentage of population not using improved water sources and percentage of underweight children under the age of five. According to the HPI of the UNDP for the OIC countries in the period 2000-2005, the data in Table 15 in the Statistical Annex and Figure 18 indicate that an average of 30.4% (347.6 million) of the total population in 34 OIC countries were suffering human poverty in 2000. In 2004, this percentage reached to 30.5% (381.5 million) of the total population in 40 OIC countries.
Figure 18: People Suffering Human Poverty in OIC Countries
29
29
30
30
31
31
330
340
350
360
370
380
390
2000 2001 2002 2003 2004 2005
Pe
rce
nt
Mill
ion
Million % of Total Population (RHS)
Source: UNDP, Human Development Report, various issues.
However, it is observed that the performance of the OIC countries in poverty alleviation has been slightly improved in 2005, where an average of 29.2% (372.9 million) of the total population in 41 OIC countries was suffering human poverty. However, despite this slight progress in 2005, it is observed that in 7 OIC countries more than 50% of the total population were still suffering human poverty in the same year (see Table 15 in the Statistical Annex).
29
29
30
30
31
31
330
340
350
360
370
380
390
2000 2001 2002 2003 2004 2005
Pe
rce
nt
Mill
ion
Million % of Total Population (RHS)

16
3. Millennium Development Goals (MDGs)1
Since poverty is one of the world’s greatest challenges and a major obstacle to economic and human development, the international community has considered reduction of poverty and improved access to basic health and education services as major goals for development.
In this respect, the international community agreed at the World Summit for Social Development in 1995 on the need for time-bound goals and quantitative targets for reducing poverty, and put a special emphasis on elaborating definitions, indicators and measurements of poverty.
Afterwards, the Millennium Development Goals (MDG) were set at the Millennium Summit in 2000. The main targets were to halve the proportion of people suffering from hunger, achieve universal primary education, reduce infant and child mortality rates by two thirds, and halve the proportion of people without access to improved water sources by 2015.
This section summarises the progress of the OIC Member Countries, for which the relevant data are available, towards the achievement of the eight MDGs in terms of some selected indicators under each goal in the period 2000-2006.
Goal 1: Eradicate Extreme Poverty and Hunger
1.1. Growth rate of GDP per person employed or labour productivity
As demonstrated in Figure 19, on average, the OIC countries have shown increasing labour productivity starting with year 2005 which is slightly under the world average but over the average of the developing regions in year 2006. Also, the OIC Average between 2005 and 2006 has approximately reached the same level of the world average of the same period.
Figure 19: Labour Productivity
0.0
0.5
1.0
1.5
2.0
2.5
3.0
3.5
4.0
2000 2001 2002 2003 2004 2005 2006
Pe
rce
nt
World Developing Regions OIC
1 Data used in this section are obtained from United Nations Statistics Division, accessed on November 25, 2008,
http://mdgs.un.org/unsd/mdg/Data.aspx
0.0
0.5
1.0
1.5
2.0
2.5
3.0
3.5
4.0
2000 2001 2002 2003 2004 2005 2006
Pe
rce
nt
World Developing Regions OIC

17
1.2. Moderately and severely underweight children under age 5 Being between the averages of the World and Developing Regions as shown in Figure 20, the progress of the OIC average in 2006 has been eroded when compared to that of 2005. The situation is even expected to get worse given the worldwide escalating food prices.
Figure 20: Children under 5 Moderately or Severely Underweight (%)
14
15
16
17
18
19
20
21
22
23
24
2000 2001 2002 2003 2004 2005 2006
Pe
rce
nt
World Developing Regions OIC
Goal 2: Achieve Universal Primary Education
2.1. Total net enrolment ratio (NER) in primary education, both sexes The OIC average lies below the World and Developing Regions averages between 2000 and 2006, as presented in Figure 21. However, the OIC average has been steadily kept over 80% since 2004. It is also noteworthy to see that the OIC average has performed better than the World and Developing Regions taking the 2000-2004 average from 79.3 to 82.7 percent in the period 2005-2006, a promising jump of 3.4 points.
14
15
16
17
18
19
20
21
22
23
24
2000 2001 2002 2003 2004 2005 2006
Pe
rce
nt
World Developing Regions OIC

18
Figure 21: Total NER in Primary Education, Both Sexes
70
75
80
85
90
95
2000 2001 2002 2003 2004 2005 2006
Pe
rce
nt
World Developing Regions OIC
2.2. Literacy rate of 15-24 year-olds, women and men For the most part of 2000 and 2006 as presented in Figure 22, the OIC average was found under the averages of the World and Developing Regions, which is a clear confirmation of the results of “Total NER in primary education, both sexes”. Although lying below the World and Developing Regions average, the OIC average has made a remarkable jump from 77% in the period 2000-2004 to 83% in the period 2005-2007, equivalent to a 6.31 point increase.
Figure 22: Literacy Rate of 15-24 Year-Olds, Women and Men
55
60
65
70
75
80
85
90
95
100
2000 2001 2002 2003 2004 2005 2006 2007
Pe
rce
nt
World Developing Regions OIC
55
60
65
70
75
80
85
90
95
100
2000 2001 2002 2003 2004 2005 2006 2007
Pe
rce
nt
World Developing Regions OIC
70
75
80
85
90
95
2000 2001 2002 2003 2004 2005 2006
Pe
rce
nt
World Developing Regions OIC

19
Goal 3: Promote Gender Equality and Empower Women 3.1. Gender Parity Index (GPI2) in primary level enrolment Considering the period between 2000 and 2006 in Figure 23; the World, Developing Regions and OIC averages have shown a continuous positive trend towards the parity between the sexes in primary level enrolment. The OIC average in the period between 2005 and 2006 has made a 0.03 point jump; while, the same accomplishment has been realized between the period 2000 and 2004, taking 3 more years. It could also be observed that the OIC 2005-2006 average increased by 0.03 points from the 2000-2004 average level although still showing a disparity in favour of males.
Figure 23: GPI in Primary Level Enrolment
0.84
0.86
0.88
0.90
0.92
0.94
0.96
0.98
2000 2001 2002 2003 2004 2005 2006
World Developing Regions OIC
3.2. Gender Parity Index (GPI) in secondary level enrolment Considering the period between 2000 and 2006 in Figure 24; the World, Developing Regions and OIC averages have shown the same continuous positive trend towards the parity between the sexes in secondary level enrolment as is the case for the primary level. The OIC average in the period between 2005 and 2006 has increased by 0.06 points. It could be also observed that the OIC 2005-2006 average increased by 0.04 points from the 2000-2004 average level although still showing a disparity in favour of males; whereas, the World and Developing Regions averages are slightly under the parity level of 1.0.
2 Ratio of girls to boys (GPI) in primary and secondary education is the ratio of the number of female students
enrolled at primary and secondary levels of education to the number of male students in each level. (GPI=1: Parity between the sexes – 0<GPI<1: Disparity in favour of males – GPI>1: Disparity in favour of females.)
0.84
0.86
0.88
0.90
0.92
0.94
0.96
0.98
2000 2001 2002 2003 2004 2005 2006
World Developing Regions OIC

20
Figure 24: GPI in Secondary Level Enrolment
0.75
0.80
0.85
0.90
0.95
1.00
2000 2001 2002 2003 2004 2005 2006
World Developing Regions OIC
Goal 4: Reduce Child Mortality 4.1. Children under five mortality rate (C5MR) per 1,000 live births In short, “C5MR” gives the number of deaths in children aged under five per 1,000 live births. Due to limited availability of data, assessment has been done comparing the 2000 data to the average in the period between 2005 and 2006. Figure 25 clearly displays the OIC average performed worse than those of the World and Developing Regions; however, the OIC as a whole managed to decrease the average from 94 in 2000 to 84 in 2006, meaning 9 more saved children.
Figure 25: Children under Five Mortality Rate per 1,000 Live Births
50
60
70
80
90
100
2000 2005 2006
World Developing Regions OIC
0.75
0.80
0.85
0.90
0.95
1.00
2000 2001 2002 2003 2004 2005 2006
World Developing Regions OIC
50
60
70
80
90
100
2000 2005 2006
World Developing Regions OIC
21
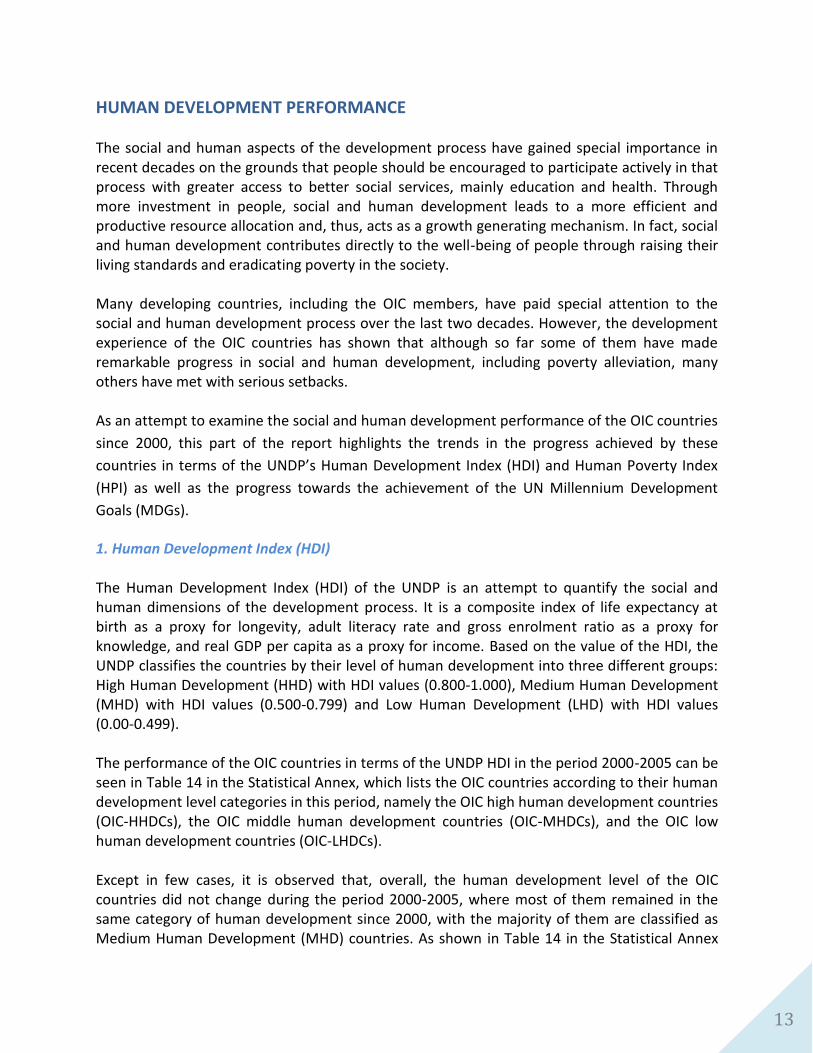
4.2. Children 1 year old immunized against measles, % “Children 1 year old immunized against measles, %” is the indicator used to monitor the coverage of children immunized against measles, the leading cause of death among vaccine-preventable diseases. Immunization coverage is measured by the percentage of children aged 12 to 23 months who have received at least one dose of the vaccine. As Figure 26 portrays, the trend of the OIC average between 2000 and 2006 has kept on rising from 75 in 2000 to 83 in 2006; although being under the averages of the World and Developing Regions. However, the OIC as a whole has managed to immunize 5.3 more children when the difference of the average between the period 2000-2004 and 2005-2006 was considered.
Figure 26: Children 1 Year Old Immunized Against Measles, %
72
74
76
78
80
82
84
86
88
2000 2001 2002 2003 2004 2005 2006
World Developing Regions OIC
Goal 5: Improve Maternal Health 5.1. Births attended by skilled health personnel, %
“Births attended by skilled health personnel, %”, the most widely available process indicator, is the proportion of women who deliver with the assistance of a skilled attendant, defined as a medically trained health care provider – doctor, nurse or midwife. Use of a skilled attendant at delivery increased for the OIC by 10 percentage points between 2004 (59%) and 2006 (69%) in contrary to the falls recorded for the World and Developing Regions average for the same period as illustrated in Figure 27. It could be also observed that a 2.5 percentage point increase for OIC from the period 2000-2004 to 2005-2006; while, the World and Developing Regions average showed fall varying by 6.3 and 2.3 percentage points, respectively for the same periods.
72
74
76
78
80
82
84
86
88
2000 2001 2002 2003 2004 2005 2006
World Developing Regions OIC

22
Figure 27: Births Attended by Skilled Health Personnel, %
50
55
60
65
70
75
80
85
90
95
100
2000 2001 2002 2003 2004 2005 2006
World Developing Regions OIC
5.2. Antenatal care coverage, at least one visit, % Figure 28 demonstrates that trends in the use of antenatal care in OIC during the period starting with 2005 show noticeable progress, a jump from 63% in 2004 to 83% in 2006. That said, the World and Developing Regions tend to decrease from their averages of 2004, even Developing Regions average has been exceeded by the OIC average. Comparing the average of the period 2000-2004 to that of 2005-2006, the considerable improvement in OIC is evident, an 8.5 percentage point jump considering together with the jumps of 5.0 and 2.9 for the World and Developing Regions, respectively.
Figure 3: Antenatal Care Coverage, At Least One Visit, %
60
65
70
75
80
85
90
95
100
2000 2001 2002 2003 2004 2005 2006
World Developing Regions OIC
50
55
60
65
70
75
80
85
90
95
100
2000 2001 2002 2003 2004 2005 2006
World Developing Regions OIC
60
65
70
75
80
85
90
95
100
2000 2001 2002 2003 2004 2005 2006
World Developing Regions OIC

23
Goal 6: Combat HIV/AIDS, Malaria and Other Diseases 6.1. Tuberculosis prevalence rate per 100,000 population
Between 2000 and 2006, both the World and Developing Regions average of Tuberculosis
prevalence rate per 100,000 population showed a falling trend (see Figure 29); while the OIC
average recorded prevalence rates between the range of 260 and 270 per 100 thousand
population in the same period. That said, the OIC average was managed to be kept stable at a
prevalence rate of 266 per 100 thousand since 2005.
Figure 29: Tuberculosis Prevalence Rate per 100,000 Population
180
190
200
210
220
230
240
250
260
270
280
2000 2001 2002 2003 2004 2005 2006
World Developing Regions OIC
6.2. Tuberculosis death rate per year per 100,000 population
The average of Tuberculosis death rate per 100,000 population as shown in Figure 30, the OIC average hasn’t changed a lot, lied within a range between 33.5 and 35 between 2000 and 2006; while the World and Developing Regions averages show continuous falls. For the period 2005 and 2006, the OIC average is over the averages of the World and Developing Regions but fixed at a death rate of 34 per 100 thousand population.
180
190
200
210
220
230
240
250
260
270
280
2000 2001 2002 2003 2004 2005 2006
World Developing Regions OIC

24
Figure 30: Tuberculosis Death Rate per 100,000 Population
24
26
28
30
32
34
36
38
40
2000 2001 2002 2003 2004 2005 2006
World Developing Regions OIC
Goal 7: Ensure Environmental Sustainability 7.1. Proportion of the population using improved drinking water sources, total The data available in Figure 31 for the “Proportion of the population using improved drinking water sources, total” shows the OIC average exceeded 75% threshold in 2006. However, when compared to the averages of the World and Developing Regions, having values approximately 80% or more, the OIC average is still below the former two.
Figure 31: Proportion of the Population Using Improved Drinking Water Sources, Total
82.3
78.0
74.4
84.4
79.8
76.4
World Developing Regions OIC
2000 2006
24
26
28
30
32
34
36
38
40
2000 2001 2002 2003 2004 2005 2006
World Developing Regions OIC

25
7.2. Proportion of the population using improved sanitation facilities, total
As displayed in Figure 32, the OIC average for accessing the improved sanitation facilities has performed stable and preserved the 57% ratio. The World average has performed well in 2006, with an increase of nearly 2% points; leaving both the OIC and Developing Regions averages behind as to the performance.
Figure 32: Proportion of the Population Using Improved Sanitation Facilities, Total
66.3
58.457.2
68.1
59.157.5
World Developing Regions OIC
2000 2006
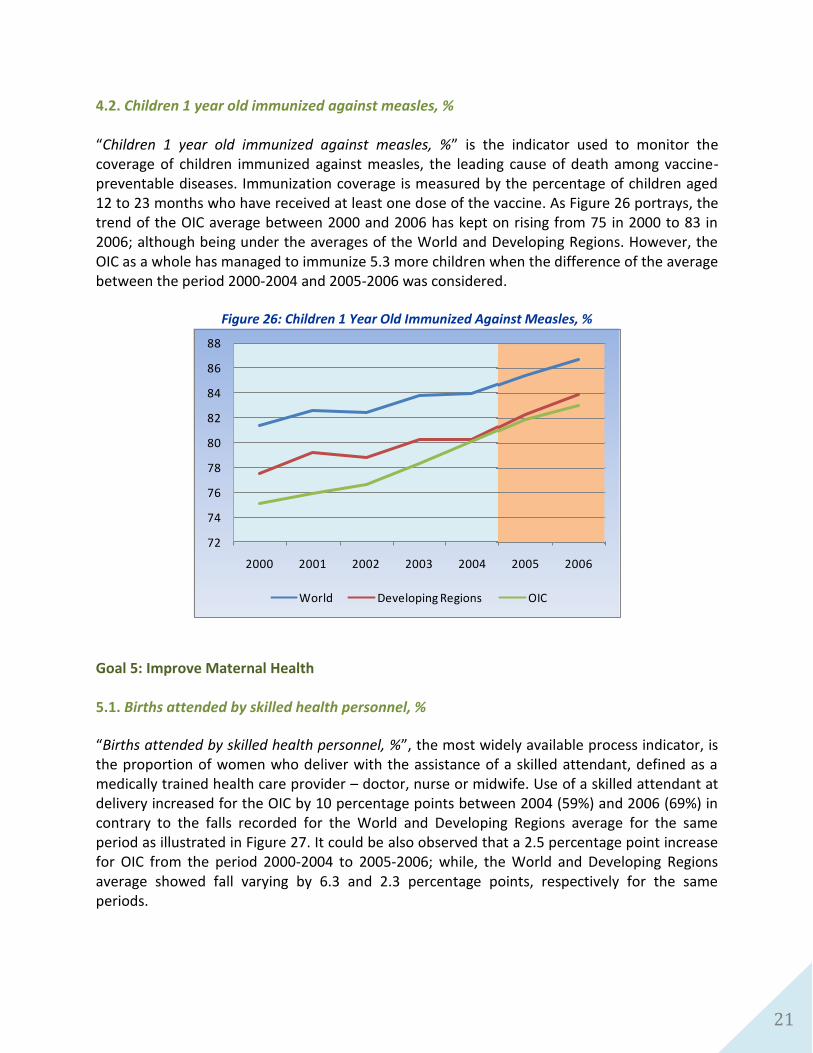
Goal 8: Develop a Global Partnership for Development 8.1. Cellular subscribers per 100 population
During the period 2000-2006, the “Cellular subscribers per 100 population” average in the OIC showed a significant progress in the form of a perfect exponential increase from 5 per 100 people in 2000 to 38 per 100 people in 2006. As illustrated in Figure 33, the OIC average started to narrow the gap between its average and that of Developing Regions starting with year 2005, showing a broader market penetration of cell phones in the OIC Member Countries.
26
Figure 33: Cellular Subscribers per 100 Population
0
10
20
30
40
50
60
2000 2001 2002 2003 2004 2005 2006
World Developing Regions OIC
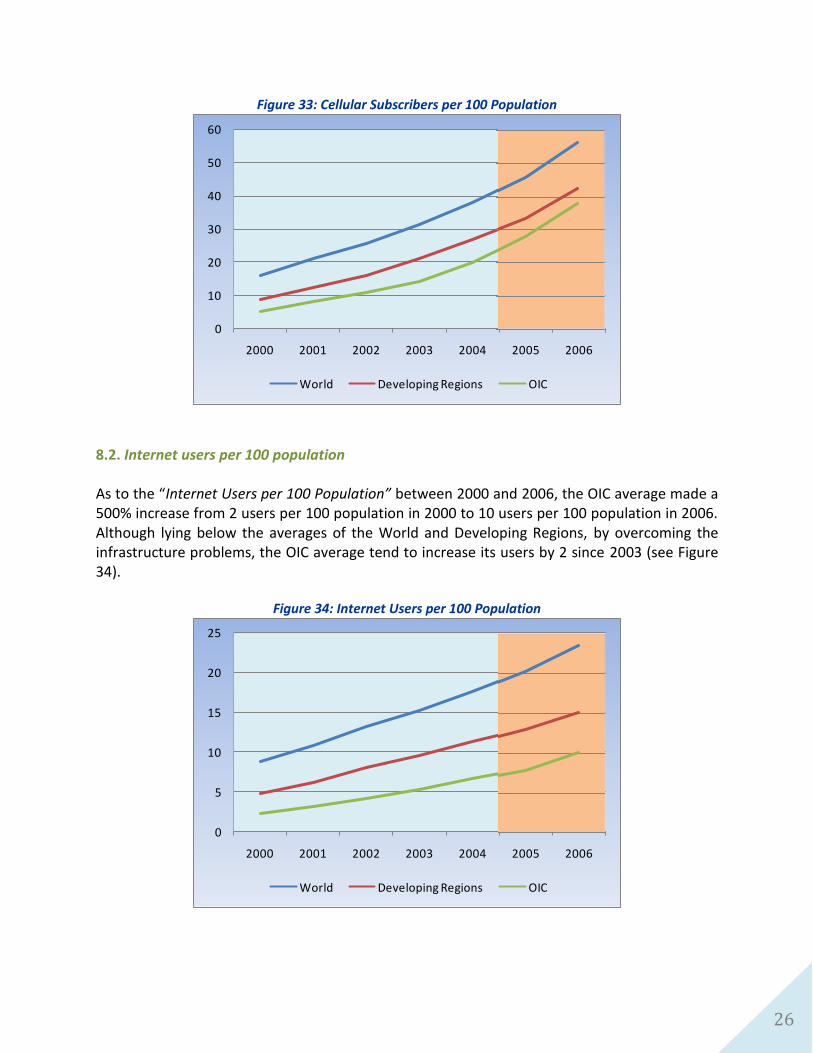
8.2. Internet users per 100 population As to the “Internet Users per 100 Population” between 2000 and 2006, the OIC average made a 500% increase from 2 users per 100 population in 2000 to 10 users per 100 population in 2006. Although lying below the averages of the World and Developing Regions, by overcoming the infrastructure problems, the OIC average tend to increase its users by 2 since 2003 (see Figure 34).
Figure 34: Internet Users per 100 Population
0
5
10
15
20
25
2000 2001 2002 2003 2004 2005 2006
World Developing Regions OIC
0
10
20
30
40
50
60
2000 2001 2002 2003 2004 2005 2006
World Developing Regions OIC
0
5
10
15
20
25
2000 2001 2002 2003 2004 2005 2006
World Developing Regions OIC

27
STATISTICAL ANNEX

28
Table 1: GDP at Current Market Prices, Million USD
2000 2001 2002 2003 2004 2005 2006 2007
Afghanistan 2,713 2,618 4,741 4,786 5,700 6,840 7,440 9,358
Albania 3,640 4,066 4,443 5,696 7,307 8,184 9,082 10,718
Algeria 54,790 55,181 56,948 68,017 85,032 102,334 116,461 132,452
Azerbaijan 5,273 5,708 6,236 7,276 8,680 13,245 20,982 31,249
Bahrain 8,028 7,971 8,491 9,747 11,235 13,460 15,828 19,664
Bangladesh 45,470 45,433 47,195 51,690 55,950 57,628 60,309 67,876
Benin 2,359 2,499 2,808 3,557 4,051 4,358 4,712 5,579
Brunei 6,001 5,601 5,843 6,557 7,872 9,531 11,561 12,388
Burkina Faso 2,617 2,792 3,290 4,271 5,108 5,614 6,015 7,136
Cameroon 9,287 9,633 10,880 13,622 15,775 16,648 17,920 20,606
Chad 1,385 1,710 1,987 2,723 4,415 5,885 6,637 7,464
Comoros 202 220 251 324 362 387 403 467
Côte d'Ivoire 10,682 10,735 11,494 13,738 15,701 16,802 18,220 20,650
Djibouti 553 573 592 628 666 709 770 835
Egypt 99,601 94,438 90,064 77,109 82,429 98,323 112,152 133,599
Gabon 5,100 4,656 4,932 6,055 7,178 8,666 9,546 11,285
Gambia 421 418 370 367 401 461 508 644
Guinea 3,112 3,035 3,209 3,621 4,014 3,257 3,285 4,233
Guinea-Bissau 215 199 204 239 270 301 304 357
Guyana 713 712 726 743 788 826 901 1,059
Indonesia 165,021 160,447 195,661 234,772 256,837 285,869 364,599 432,817
Iran 102,930 110,411 135,525 136,646 162,747 192,020 222,880 289,933
Iraq 20,969 17,682 17,437 10,621 25,491 33,961 54,831 69,709
Jordan 8,461 8,976 9,582 10,196 11,411 12,611 14,101 15,724
Kazakhstan 18,292 22,153 24,637 30,834 43,152 57,124 81,004 104,143
Kuwait 37,718 34,890 38,136 47,827 59,267 80,781 98,692 109,981
Kyrgyzstan 1,370 1,527 1,606 1,922 2,212 2,460 2,834 3,745
Lebanon 16,679 17,065 18,712 19,802 21,465 21,558 22,759 24,640
Libya 34,265 29,880 20,394 24,542 31,791 42,820 50,321 62,060
Malaysia 93,790 92,784 100,846 110,202 124,749 137,954 156,409 186,720
Maldives 624 625 641 692 776 751 907 1,055
Mali 2,655 3,018 3,189 4,222 4,982 5,486 6,123 6,840
Mauritania 1,075 1,115 1,145 1,281 1,537 1,848 2,661 2,732
Morocco 37,060 37,766 40,474 49,819 56,392 58,956 65,405 73,429
Mozambique 4,310 4,075 4,201 4,666 5,698 6,579 6,833 7,756
Niger 1,666 1,814 2,065 2,640 2,897 3,327 3,556 4,107
Nigeria 46,386 44,138 59,117 67,656 87,845 112,248 145,430 173,184
Oman 19,868 19,949 20,325 21,784 24,772 30,923 35,729 40,343
Pakistan 78,472 71,901 81,637 97,669 111,569 127,597 144,462 163,290
Palestine 4,116 3,816 3,484 3,921 4,411 4,844 4,904 5,458
Qatar 17,760 17,538 19,364 23,534 31,734 42,463 56,770 63,870
Saudi Arabia 188,442 183,012 188,551 214,573 250,339 315,583 352,577 377,318
Senegal 4,680 4,878 5,334 6,860 8,031 8,687 9,268 11,244
Sierra Leone 921 1,167 1,317 1,432 1,426 1,496 1,655 1,935
Somalia 2,070 1,974 2,056 2,100 2,213 2,316 2,532 2,532
Sudan 13,134 15,716 18,134 22,197 26,637 33,153 43,888 55,648
Suriname 775 665 937 1,094 1,283 1,543 1,820 2,044
Syria 19,651 21,174 21,659 20,724 24,473 28,102 32,770 37,525
Tajikistan 861 1,081 1,221 1,555 2,076 2,312 2,830 3,738
Togo 1,294 1,332 1,472 1,674 1,935 2,082 2,197 2,541
Tunisia 19,444 19,969 21,048 24,968 28,256 29,029 30,962 35,010
Turkey 199,264 145,573 184,162 239,700 301,999 362,614 403,459 487,552
Turkmenistan 4,157 4,442 4,493 4,739 5,119 5,792 6,512 7,253
Uganda 5,734 5,788 6,031 6,498 7,779 9,136 10,160 12,436
United Arab Emirates 70,522 69,546 74,959 88,536 106,326 133,583 164,865 191,465
Uzbekistan 13,759 9,316 9,877 10,155 12,016 13,751 17,077 19,275
Yemen 9,636 9,854 10,693 11,778 13,874 16,808 19,082 21,658
OIC Countries 1,529,993 1,455,255 1,614,826 1,844,597 2,188,451 2,601,626 3,065,900 3,608,329
Developing Countries 6,017,265 6,088,141 6,227,833 7,028,971 8,342,052 9,909,097 11,651,622 14,155,882
World 31,897,109 31,685,709 32,997,458 37,076,887 41,713,704 45,102,992 48,786,093 54,635,982
Source: SESRIC, BASEIND Database; UNSD, National Accounts Main Aggregates Database.

29
Table 2: GDP Per Capita at Current Prices, USD 2000 2001 2002 2003 2004 2005 2006 2007
Afghanistan 131 122 213 207 237 273 285 345
Albania 1,182 1,318 1,434 1,828 2,331 2,595 2,863 3,360
Algeria 1,796 1,783 1,813 2,133 2,627 3,115 3,492 3,912
Azerbaijan 647 697 758 880 1,045 1,586 2,496 3,691
Bahrain 12,349 11,988 12,487 14,021 15,820 18,571 21,421 26,127
Bangladesh 326 320 326 350 372 376 387 428
Benin 326 335 364 447 493 513 538 618
Brunei 17,997 16,404 16,721 18,339 21,527 25,497 30,269 31,759
Burkina Faso 220 228 260 326 378 403 419 483
Cameroon 586 593 654 800 906 936 986 1,111
Chad 164 195 218 288 450 580 634 692
Comoros 289 306 340 428 466 485 493 556
Côte d'Ivoire 627 618 650 764 859 904 963 1,072
Djibouti 758 767 776 808 843 881 940 1,002
Egypt 1,497 1,394 1,305 1,097 1,152 1,350 1,512 1,770
Gabon 4,314 3,863 4,017 4,847 5,651 6,714 7,282 8,481
Gambia 304 292 250 241 255 285 305 377
Guinea 379 363 377 418 454 362 358 452
Guinea-Bissau 157 141 140 159 174 189 185 211
Guyana 970 969 986 1,007 1,067 1,117 1,219 1,435
Indonesia 780 748 900 1,065 1,151 1,265 1,593 1,869
Iran 1,557 1,654 2,011 2,009 2,370 2,766 3,172 4,072
Iraq 837 688 663 395 928 1,213 1,923 2,404
Jordan 1,763 1,825 1,896 1,958 2,125 2,275 2,461 2,654
Kazakhstan 1,223 1,486 1,650 2,055 2,856 3,756 5,289 6,753
Kuwait 16,926 14,918 15,634 18,897 22,647 29,919 35,518 38,574
Kyrgyzstan 277 305 317 376 429 473 539 704
Lebanon 4,421 4,467 4,836 5,055 5,414 5,375 5,612 6,011
Libya 6,410 5,477 3,663 4,319 5,482 7,235 8,333 10,074
Malaysia 4,030 3,903 4,157 4,457 4,952 5,378 5,990 7,027
Maldives 2,287 2,253 2,274 2,420 2,672 2,542 3,020 3,454
Mali 265 293 301 386 442 473 512 554
Mauritania 419 422 421 457 533 624 874 874
Morocco 1,272 1,280 1,356 1,649 1,845 1,906 2,089 2,316
Mozambique 237 218 220 238 284 320 326 362
Niger 150 157 173 213 226 251 259 289
Nigeria 372 345 450 502 637 794 1,005 1,169
Oman 8,271 8,221 8,316 8,858 9,994 12,334 14,031 15,546
Pakistan 544 488 544 640 718 807 898 996
Palestine 1,307 1,168 1,029 1,117 1,213 1,288 1,261 1,359
Qatar 28,797 27,014 28,185 32,378 41,521 53,333 69,121 75,978
Saudi Arabia 9,057 8,569 8,603 9,545 10,862 13,365 14,584 15,255
Senegal 453 460 490 614 700 738 768 908
Sierra Leone 204 248 267 277 265 268 288 330
Somalia 293 271 274 272 278 283 300 291
Sudan 394 461 522 626 737 898 1,164 1,443
Suriname 1,775 1,510 2,113 2,449 2,853 3,410 3,998 4,463
Syria 1,190 1,249 1,244 1,158 1,331 1,487 1,689 1,883
Tajikistan 139 173 193 243 321 353 426 555
Togo 240 239 256 283 319 334 343 386
Tunisia 2,033 2,064 2,152 2,525 2,827 2,873 3,031 3,390
Turkey 2,924 2,105 2,626 3,372 4,193 4,969 5,458 6,511
Turkmenistan 923 973 970 1,009 1,074 1,198 1,329 1,461
Uganda 232 227 229 239 278 316 340 403
United Arab Emirates 21,718 20,309 20,805 23,429 26,938 32,547 38,806 43,709
Uzbekistan 557 371 388 393 458 517 633 704
Yemen 530 526 554 593 677 797 878 967
OIC Countries 1,167 1,089 1,185 1,328 1,546 1,804 2,087 2,411
Developing Countries 1,266 1,264 1,291 1,440 1,686 1,992 2,320 2,766
World 5,209 5,109 5,254 5,831 6,481 6,924 7,401 8,191
Source: SESRIC, BASEIND Database; UNSD, National Accounts Main Aggregates Database.

30
Table 3: Real GDP Growth Rate, Percent 2000 2001 2002 2003 2004 2005 2006 2007
Afghanistan -3.5 -3.5 81.1 14.3 9.4 14.5 7.4 12.4
Albania 6.7 8.0 4.2 5.8 5.7 5.8 5.5 6.0
Algeria 2.2 2.6 4.7 6.9 5.2 5.3 2.0 4.6
Azerbaijan 11.1 9.9 10.6 11.1 10.2 26.5 34.5 25.1
Bahrain 5.4 4.3 5.2 7.3 5.6 7.9 6.5 6.6
Bangladesh 5.9 5.3 4.4 5.3 6.3 6.0 6.6 6.5
Benin 4.9 6.3 4.4 3.9 3.1 2.8 4.1 6.0
Brunei 2.9 2.7 3.9 2.9 0.5 0.4 5.2 0.4
Burkina Faso 1.9 7.1 5.4 8.0 4.6 7.1 6.1 6.7
Cameroon 4.2 4.5 4.0 4.0 3.7 2.2 3.3 3.3
Chad -0.5 11.5 8.5 14.3 33.7 8.6 2.9 0.6
Comoros 0.7 3.2 4.2 2.7 -0.3 4.2 0.6 -3.1
Côte d'Ivoire -2.7 0.0 0.0 0.0 0.0 0.0 0.0 1.6
Djibouti 0.6 1.9 2.7 3.1 3.1 3.1 4.7 4.8
Egypt 3.5 3.2 4.1 4.1 4.5 6.8 7.1 7.0
Gabon -1.5 1.8 -0.3 2.5 1.1 3.0 1.2 5.6
Gambia 5.5 5.6 -3.3 7.0 5.0 5.1 4.5 4.8
Guinea 2.9 3.8 4.2 1.2 2.7 3.3 2.2 1.5
Guinea-Bissau 7.7 0.0 -7.2 0.8 2.0 3.6 4.2 3.7
Guyana -1.4 2.2 1.1 -1.1 3.4 -2.2 4.7 5.4
Indonesia 4.9 3.6 4.5 4.8 5.0 5.7 5.5 6.3
Iran 2.8 3.2 7.8 7.0 4.4 4.5 5.2 5.8
Iraq 1.4 2.3 -6.9 -33.1 23.0 3.3 39.6 2.8
Jordan 4.2 5.3 5.8 4.2 8.6 7.1 6.3 5.8
Kazakhstan 9.8 13.5 9.8 9.3 9.6 9.7 10.6 8.7
Kuwait 4.7 0.2 3.0 16.5 10.5 10.0 6.3 4.6
Kyrgyzstan 5.4 5.3 0.0 7.1 7.0 -0.1 3.0 8.3
Lebanon 0.0 3.6 -1.3 3.0 5.0 1.0 0.0 4.0
Libya 2.3 6.1 1.1 7.1 5.4 5.6 5.6 7.9
Malaysia 8.9 0.5 5.4 5.8 6.8 5.3 5.8 6.3
Maldives 4.5 3.4 6.1 9.2 11.3 -5.1 23.6 7.8
Mali -3.3 11.9 4.3 7.6 2.3 6.1 5.3 2.5
Mauritania 1.9 2.9 1.0 5.7 5.2 6.6 11.4 0.9
Morocco 1.0 6.3 3.2 5.5 4.2 1.7 8.0 2.2
Mozambique 1.5 12.3 9.2 6.5 7.9 8.4 8.0 7.0
Niger -2.6 7.4 5.3 7.7 -0.8 7.4 5.1 3.1
Nigeria 5.3 8.2 21.2 10.3 10.6 5.4 6.2 5.0
Oman 5.5 7.5 2.6 2.0 5.4 6.0 7.2 5.9
Pakistan 2.0 3.2 4.8 7.4 7.7 6.9 6.4 6.0
Palestine -5.6 -6.4 -3.7 8.5 2.0 6.0 -8.8 0.0
Qatar 9.1 3.3 7.1 3.5 20.8 6.1 10.3 14.2
Saudi Arabia 4.9 0.5 0.1 7.7 5.3 5.5 3.3 3.5
Senegal 3.2 4.6 0.7 6.7 5.9 5.6 2.3 5.0
Sierra Leone 3.6 18.3 18.8 10.8 9.6 7.4 7.7 6.5
Somalia 3.4 3.6 3.4 2.2 2.8 2.3 2.6 2.7
Sudan 8.4 6.4 6.7 6.1 17.8 8.7 9.4 10.5
Suriname 4.0 5.9 2.6 7.0 7.5 5.8 6.0 5.5
Syria 0.6 5.1 5.9 1.1 6.7 4.5 5.1 3.9
Tajikistan 8.2 9.6 10.8 11.1 10.3 6.7 5.5 7.8
Togo -1.0 -2.9 -0.2 5.7 2.3 1.2 2.0 2.9
Tunisia 4.7 4.9 1.8 5.6 6.0 4.0 5.5 6.3
Turkey 7.4 -7.5 7.9 5.8 8.9 7.4 6.1 5.1
Turkmenistan 5.5 4.3 -0.6 3.3 5.0 9.6 9.0 8.5
Uganda 4.4 6.3 4.7 6.4 5.0 5.5 6.8 6.5
United Arab Emirates 12.3 3.5 2.6 11.9 9.7 8.2 9.4 7.7
Uzbekistan 4.0 4.5 4.2 4.4 7.7 7.1 7.3 7.4
Yemen 6.2 3.8 3.9 3.7 4.0 5.6 3.2 3.1
OIC Countries 4.9 2.0 5.2 6.1 6.9 6.1 6.1 5.8
Developing Countries 5.3 3.1 3.7 5.5 7.5 6.8 7.7 7.8
World 4.1 1.7 2.0 2.7 4.0 3.5 4.0 3.8
Source: SESRIC, BASEIND Database; UNSD, National Accounts Main Aggregates Database.

31
Table 4: Total Merchandise Exports (F.O.B.), Million USD 2000 2001 2002 2003 2004 2005 2006 2007
Afghanistan 142 91 87 210 185 239 275 328
Albania 260 307 339 447 604 658 696 976
Algeria 21,871 18,319 18,528 24,905 31,829 43,657 53,775 57,050
Azerbaijan 1,747 2,315 2,168 2,590 3,615 4,347 6,372 13,627
Bahrain 7,719 8,255 8,455 10,354 13,593 15,943 19,681 23,916
Bangladesh 5,590 5,736 5,443 6,229 7,586 8,494 11,608 12,639
Benin 196 591 242 271 290 300 343 415
Brunei 3,162 3,336 3,440 4,422 4,510 5,633 6,816 7,361
Burkina Faso 171 174 173 248 375 373 418 470
Cameroon 1,832 1,749 1,801 2,240 3,465 3,624 4,684 4,932
Chad 86 75 63 91 1,111 1,840 2,281 2,340
Comoros 16 38 28 33 35 24 32 30
Cote d'Ivoire 3,850 3,887 4,963 5,493 6,545 7,251 8,134 8,318
Djibouti 152 236 202 247 252 274 340 423
Egypt 6,354 4,140 7,049 8,499 12,187 15,593 20,684 23,440
Gabon 3,793 3,502 3,061 3,674 4,499 5,104 4,667 6,266
Gambia 46 27 31 18 38 28 34 46
Guinea 617 543 828 629 560 1,328 1,363 1,766
Guinea-Bissau 112 125 95 71 110 109 133 164
Guyana 596 575 544 578 648 641 683 809
Indonesia 62,118 56,318 57,154 61,013 71,550 85,623 100,797 114,098
Iran 26,998 24,337 22,176 31,782 40,998 55,403 70,580 81,706
Iraq 14,916 11,065 9,134 8,141 16,119 17,657 23,863 28,112
Jordan 1,284 2,292 2,769 3,081 3,530 4,301 5,204 5,534
Kazakhstan 9,878 9,085 9,670 12,927 20,095 23,508 30,078 37,568
Kuwait 18,754 16,155 15,526 18,746 25,520 35,191 41,768 47,099
Kyrgyzstan 504 476 486 582 727 634 796 877
Lebanon 714 1,024 1,018 1,194 1,927 2,183 2,547 3,329
Libya 12,717 11,337 9,883 13,761 19,361 29,013 39,609 43,674
Malaysia 98,154 88,201 93,387 104,968 126,509 140,977 160,664 176,207
Maldives 76 77 91 113 123 99 167 172
Mali 234 156 162 215 328 257 378 235
Mauritania 529 548 543 594 803 943 1,400 1,687
Morocco 7,418 7,233 7,838 8,764 9,911 10,643 13,275 15,839
Mozambique 364 704 682 1,044 1,504 1,745 2,381 2,721
Niger 196 162 169 200 222 298 428 435
Nigeria 27,042 18,045 18,340 24,062 33,307 43,531 52,871 58,924
Oman 10,667 10,681 11,127 10,362 12,726 17,419 23,677 24,387
Pakistan 8,876 9,211 9,880 11,928 13,284 16,046 16,980 19,388
Palestine .. .. .. .. .. .. .. ..
Qatar 11,593 10,869 10,977 13,380 18,546 18,001 25,090 30,916
Saudi Arabia 74,746 68,832 66,140 86,547 112,687 156,967 189,578 199,610
Senegal 693 784 949 1,159 1,276 1,443 1,364 1,716
Sierra Leone 126 56 106 141 184 196 209 266
Somalia 117 77 113 150 190 251 301 380
Sudan 1,619 1,700 1,942 2,609 3,774 4,822 5,704 8,754
Suriname 498 498 475 584 880 924 1,187 1,410
Syria 4,759 6,205 6,796 6,053 23,586 10,220 12,099 14,540
Tajikistan 770 653 737 797 915 909 1,399 992
Togo 192 220 249 416 408 364 569 700
Tunisia 5,996 6,609 6,798 8,027 9,679 10,488 11,786 14,834
Turkey 27,769 31,323 36,045 47,233 62,989 73,451 85,492 107,113
Turkmenistan 2,505 2,555 2,816 3,449 4,063 5,699 6,230 7,727
Uganda 402 452 466 533 574 671 688 849
United Arab Emirates 40,806 39,879 39,136 50,096 66,788 93,173 111,873 126,136
Uzbekistan 2,181 2,079 1,568 1,975 2,697 3,468 4,948 6,046
Yemen 4,076 3,370 3,271 3,724 4,076 5,606 6,440 7,162
OIC Countries 538,598 497,286 506,157 611,599 803,893 987,584 1,195,438 1,356,458
Developing Countries 2,342,090 2,209,630 2,378,710 2,856,110 3,640,500 4,403,050 5,272,040 6,219,420
World 6,385,770 6,139,540 6,432,980 7,516,020 9,131,810 10,367,000 11,930,600 13,818,100
Source: SESRIC, BASEIND Database; IMF, Direction of Trade Statistics.

32
Table 5: Total Merchandise Imports (C.I.F.), Million USD 2000 2001 2002 2003 2004 2005 2006 2007
Afghanistan 621 566 1,034 1,608 1,973 3,007 3,816 4,825
Albania 1,084 1,324 1,500 1,846 2,315 2,622 2,917 3,730
Algeria 9,027 9,750 11,809 15,375 20,849 23,535 25,017 32,443
Azerbaijan 1,172 1,434 1,666 2,626 3,516 4,210 5,266 7,870
Bahrain 3,541 3,686 4,062 4,839 5,862 7,098 8,664 10,406
Bangladesh 9,001 9,012 7,848 9,835 11,590 13,851 16,096 18,476
Benin 563 622 721 886 897 893 3,474 4,869
Brunei 1,427 1,315 1,630 1,341 1,640 1,668 1,987 3,934
Burkina Faso 498 508 650 863 1,024 1,096 1,258 1,578
Cameroon 1,490 1,851 1,805 1,788 2,248 2,534 2,904 3,605
Chad 139 366 462 351 412 488 529 727
Comoros 70 83 96 124 111 114 142 161
Cote d'Ivoire 2,734 2,794 2,595 3,585 4,706 5,873 5,814 6,413
Djibouti 614 720 669 864 896 1,206 1,546 1,919
Egypt 22,040 12,720 19,888 21,351 27,936 33,181 39,880 49,981
Gabon 1,395 1,447 1,143 1,357 1,610 1,698 1,946 2,732
Gambia 334 399 412 506 577 638 708 853
Guinea 533 499 877 694 1,140 1,879 2,246 2,891
Guinea-Bissau 106 108 102 159 136 213 201 244
Guyana 651 709 563 584 610 721 942 1,032
Indonesia 33,515 30,962 31,289 32,549 46,524 57,700 61,065 74,473
Iran 14,347 17,690 22,324 30,646 38,546 43,587 46,679 55,917
Iraq 3,414 5,619 6,067 4,453 10,241 12,912 13,541 15,868
Jordan 4,597 4,871 5,076 5,743 8,164 10,497 11,548 13,531
Kazakhstan 5,048 6,478 6,584 8,409 12,780 20,156 27,078 36,339
Kuwait 7,358 7,724 8,799 11,406 12,834 15,285 16,546 20,940
Kyrgyzstan 555 465 587 712 943 1,112 1,711 5,657
Lebanon 6,228 6,377 6,313 7,705 9,380 9,631 10,945 12,955
Libya 4,016 4,423 5,515 6,103 8,164 8,749 10,212 13,043
Malaysia 82,204 73,358 79,513 82,735 104,304 113,609 130,477 146,982
Maldives 389 393 391 471 645 745 929 1,144
Mali 1,286 1,391 1,381 1,525 1,887 2,067 2,355 2,841
Mauritania 651 711 882 1,001 1,123 1,368 1,467 1,820
Morocco 11,531 11,471 11,833 14,197 17,807 20,336 25,110 32,248
Mozambique 1,046 1,063 1,270 1,740 2,035 2,467 2,914 3,758
Niger 774 325 396 495 588 838 1,011 1,116
Nigeria 5,824 7,928 8,733 14,852 20,472 24,497 29,283 38,014
Oman 5,039 5,797 6,005 6,572 7,691 9,644 11,529 15,659
Pakistan 10,722 10,166 11,238 13,048 17,756 25,410 33,774 39,486
Palestine .. .. .. .. .. .. .. ..
Qatar 3,252 3,758 4,051 4,897 6,052 9,093 12,688 21,696
Saudi Arabia 30,609 31,181 32,290 36,916 44,745 59,509 70,334 91,341
Senegal 1,463 1,727 1,958 2,359 2,854 3,215 3,423 4,981
Sierra Leone 316 420 496 602 523 609 564 691
Somalia 329 338 388 422 547 626 793 972
Sudan 1,453 1,864 2,168 2,714 4,086 6,689 8,072 8,739
Suriname 480 666 594 680 751 916 962 1,236
Syria 5,403 6,414 7,154 8,598 26,331 15,743 18,793 23,195
Tajikistan 671 694 721 908 1,191 1,330 1,725 2,521
Togo 324 355 397 563 557 590 2,628 4,112
Tunisia 8,601 9,570 9,528 10,951 12,724 13,173 16,413 19,866
Turkey 54,503 41,399 51,554 69,339 97,340 116,562 139,480 169,986
Turkmenistan 1,788 2,210 2,128 2,511 2,729 2,703 2,781 3,514
Uganda 958 1,006 1,074 1,375 1,494 1,702 2,133 2,832
United Arab Emirates 25,464 29,608 30,353 38,827 74,752 99,672 114,692 145,383
Uzbekistan 2,072 2,293 2,076 2,485 3,156 3,552 4,292 5,884
Yemen 2,323 2,466 2,777 4,404 3,984 4,800 7,011 9,230
OIC Countries 395,593 383,088 423,432 503,494 695,748 827,619 970,309 1,206,660
Developing Countries 2,193,030 2,133,430 2,273,580 2,696,070 3,477,620 4,078,990 4,835,250 5,957,560
World 6,593,110 6,381,270 6,628,810 7,748,270 9,486,550 10,754,300 12,335,300 14,369,600
Source: SESRIC, BASEIND Database; IMF, Direction of Trade Statistics.

33
Table 6: Trade Balance, Million USD 2000 2001 2002 2003 2004 2005 2006 2007
Afghanistan -479 -475 -947 -1,398 -1,788 -2,768 -3,541 -4,497
Albania -824 -1,016 -1,161 -1,399 -1,711 -1,963 -2,220 -2,754
Algeria 12,844 8,570 6,719 9,530 10,980 20,122 28,758 24,608
Azerbaijan 575 881 502 -36 100 138 1,106 5,756
Bahrain 4,177 4,569 4,393 5,515 7,731 8,846 11,017 13,510
Bangladesh -3,411 -3,276 -2,405 -3,606 -4,004 -5,357 -4,487 -5,837
Benin -367 -31 -479 -615 -607 -593 -3,131 -4,454
Brunei 1,734 2,022 1,810 3,081 2,871 3,965 4,830 3,427
Burkina Faso -327 -335 -477 -615 -649 -723 -840 -1,107
Cameroon 342 -102 -5 452 1,216 1,090 1,780 1,327
Chad -54 -291 -400 -260 699 1,352 1,752 1,613
Comoros -54 -45 -67 -91 -77 -90 -111 -130
Cote d'Ivoire 1,116 1,093 2,368 1,908 1,839 1,378 2,319 1,905
Djibouti -463 -483 -467 -617 -644 -932 -1,205 -1,496
Egypt -15,686 -8,580 -12,840 -12,852 -15,749 -17,588 -19,196 -26,541
Gabon 2,397 2,055 1,918 2,317 2,889 3,407 2,720 3,534
Gambia -288 -371 -381 -487 -539 -610 -675 -806
Guinea 85 44 -49 -65 -581 -551 -882 -1,126
Guinea-Bissau 6 16 -6 -88 -26 -104 -69 -80
Guyana -55 -134 -19 -6 39 -81 -259 -223
Indonesia 28,604 25,356 25,866 28,464 25,026 27,923 39,732 39,625
Iran 12,651 6,647 -148 1,137 2,451 11,816 23,901 25,789
Iraq 11,502 5,446 3,067 3,687 5,879 4,745 10,322 12,245
Jordan -3,313 -2,580 -2,307 -2,662 -4,633 -6,197 -6,344 -7,997
Kazakhstan 4,830 2,607 3,086 4,518 7,316 3,352 3,000 1,229
Kuwait 11,396 8,432 6,727 7,341 12,686 19,906 25,222 26,158
Kyrgyzstan -51 11 -102 -130 -216 -478 -914 -4,780
Lebanon -5,513 -5,353 -5,295 -6,511 -7,453 -7,447 -8,398 -9,626
Libya 8,701 6,914 4,368 7,658 11,196 20,264 29,397 30,631
Malaysia 15,950 14,843 13,874 22,234 22,205 27,368 30,187 29,225
Maldives -313 -316 -300 -358 -522 -646 -762 -972
Mali -1,051 -1,235 -1,218 -1,311 -1,559 -1,810 -1,977 -2,606
Mauritania -122 -163 -339 -407 -320 -425 -67 -133
Morocco -4,113 -4,238 -3,994 -5,432 -7,896 -9,693 -11,835 -16,410
Mozambique -682 -360 -588 -696 -531 -721 -533 -1,037
Niger -578 -163 -227 -295 -365 -540 -582 -681
Nigeria 21,217 10,116 9,607 9,210 12,835 19,034 23,587 20,910
Oman 5,627 4,884 5,121 3,790 5,035 7,776 12,148 8,728
Pakistan -1,845 -954 -1,358 -1,120 -4,472 -9,364 -16,794 -20,098
Palestine .. .. .. .. .. .. .. ..
Qatar 8,341 7,111 6,926 8,483 12,494 8,908 12,402 9,220
Saudi Arabia 44,138 37,651 33,850 49,631 67,942 97,458 119,244 108,269
Senegal -770 -944 -1,009 -1,200 -1,578 -1,772 -2,059 -3,265
Sierra Leone -190 -364 -390 -461 -339 -413 -355 -425
Somalia -211 -261 -275 -271 -357 -376 -491 -592
Sudan 166 -164 -227 -105 -312 -1,867 -2,368 15
Suriname 19 -168 -119 -96 130 8 225 173
Syria -644 -209 -357 -2,545 -2,746 -5,523 -6,694 -8,655
Tajikistan 99 -41 16 -110 -276 -421 -326 -1,530
Togo -131 -134 -148 -148 -149 -225 -2,059 -3,412
Tunisia -2,605 -2,961 -2,729 -2,924 -3,045 -2,685 -4,627 -5,032
Turkey -26,734 -10,076 -15,510 -22,107 -34,351 -43,111 -53,988 -62,873
Turkmenistan 717 345 688 938 1,333 2,996 3,449 4,213
Uganda -557 -555 -608 -842 -920 -1,031 -1,445 -1,983
United Arab Emirates 15,342 10,271 8,783 11,269 -7,964 -6,500 -2,819 -19,247
Uzbekistan 109 -214 -508 -510 -459 -84 656 162
Yemen 1,753 905 494 -680 92 806 -571 -2,068
OIC Countries 143,006 114,197 82,725 108,104 108,145 159,965 225,129 149,797
Developing Countries 149,060 76,200 105,130 160,040 162,880 324,060 436,790 261,860
World -207,340 -241,730 -195,830 -232,250 -354,740 -387,300 -404,700 -551,500
Source: SESRIC, BASEIND Database; IMF, Direction of Trade Statistics.

34
Table 7: Current Account Balance, Million USD 2000 2001 2002 2003 2004 2005 2006 2007
Afghanistan .. .. -150 -696 -265 -182 -379 81
Albania -134 -149 -318 -296 -292 -498 -508 -994
Algeria 9,142 7,060 4,359 8,808 11,116 21,183 28,950 30,600
Azerbaijan -187 -52 -768 -2,021 -2,589 167 3,708 9,019
Bahrain 846 226 -55 197 474 1,483 2,188 2,906
Bangladesh -678 -431 167 176 -190 8 762 780
Benin -183 -159 -238 -298 -292 -241 -270 -372
Brunei 2,998 2,710 2,409 3,129 3,827 5,032 6,449 5,990
Burkina Faso -320 -315 -328 -379 -532 -635 -554 -560
Cameroon -143 -338 -557 -242 -604 -565 108 -383
Chad -214 -535 -1,871 -1,310 -738 182 -668 116
Comoros 4 7 -4 -10 -17 -28 -24 -31
Cote d'Ivoire -293 -60 771 295 241 39 480 -146
Djibouti -50 -17 -10 21 -9 -23 -113 -211
Egypt -1,163 -33 614 1,943 3,418 2,910 868 1,862
Gabon 1,004 518 339 575 802 1,986 1,790 1,719
Gambia -13 -11 -10 -18 -25 -70 -58 -80
Guinea -200 -81 -79 -6 -71 -17 15 -83
Guinea-Bissau -12 -44 -22 -7 5 -15 -43 -8
Guyana -100 -104 -86 -64 -73 -121 -177 -195
Indonesia 7,988 6,901 7,822 8,111 1,565 277 10,835 11,010
Iran 12,500 5,985 3,585 816 1,441 16,637 20,535 28,776
Iraq .. .. .. .. .. .. .. ..
Jordan 60 5 545 1,245 89 -2,199 -1,599 -2,778
Kazakhstan 546 -1,194 -1,024 -273 335 -1,056 -1,915 -7,184
Kuwait 14,670 8,326 4,264 9,420 18,165 37,637 51,570 48,039
Kyrgyzstan -59 -24 -64 33 109 69 -87 -6
Lebanon -2,896 -3,323 -2,647 -2,614 -3,332 -2,926 -1,264 -3,129
Libya 11,392 4,186 661 5,264 7,410 17,444 25,232 23,786
Malaysia 8,487 7,286 8,025 13,207 15,080 19,994 25,178 29,181
Maldives -51 -59 -36 -32 -126 -269 -369 -476
Mali -268 -314 -104 -275 -415 -449 -231 -502
Mauritania -98 -131 35 -175 -517 -877 -36 -321
Morocco -478 1,611 1,477 1,591 965 1,064 1,412 -99
Mozambique -677 -719 -791 -721 -507 -749 -660 -768
Niger -111 -93 -138 -219 -227 -308 -307 -321
Nigeria 5,407 2,156 -7,652 -4,044 4,329 8,015 13,994 3,466
Oman 3,089 1,945 1,365 820 582 4,697 4,328 3,222
Pakistan -215 325 2,833 4,061 1,811 -1,534 -5,015 -6,878
Palestine .. .. .. .. .. .. .. ..
Qatar 4,128 4,792 4,248 5,946 7,100 14,100 16,139 21,374
Saudi Arabia 14,336 9,366 11,889 28,085 52,097 90,596 99,632 95,762
Senegal -306 -212 -301 -421 -487 -675 -871 -1,161
Sierra Leone -56 -51 -19 -48 -62 -86 -50 -63
Somalia .. .. .. .. .. .. .. ..
Sudan -1,041 -1,702 -1,543 -1,396 -1,409 -3,035 -5,540 -5,812
Suriname -34 -116 -60 -137 -31 -78 39 71
Syria 1,040 1,199 1,639 221 -465 -604 -1,025 -561
Tajikistan -16 -52 -43 -20 -82 -62 -79 -414
Togo -117 -124 -80 -70 -57 -112 -133 -160
Tunisia -821 -1,021 -747 -735 -547 -334 -622 -925
Turkey -9,910 3,760 -626 -7,515 -14,431 -22,136 -31,893 -37,684
Turkmenistan 412 115 583 304 82 875 3,351 4,037
Uganda -417 -217 -287 -362 -220 -413 -350 -331
United Arab Emirates 12,144 6,544 3,756 7,586 9,801 24,291 37,114 39,113
Uzbekistan 245 -113 117 881 1,215 1,949 2,933 4,267
Yemen 1,337 671 443 176 225 633 206 -1,328
OIC Countries 90,514 63,900 41,288 78,507 113,672 230,971 302,976 291,213
Developing Countries 86,462 41,169 76,911 144,493 215,141 445,854 617,033 634,160
World -178,376 -159,682 -136,253 -64,765 9,026 53,655 162,985 265,326
Source: SESRIC, BASEIND Database; IMF, World Economic Outlook Database, Oct.08.

35
Table 8: Intra-OIC Exports, % of Total Exports 2000 2001 2002 2003 2004 2005 2006 2007
Afghanistan 31.3 36.5 42.1 23.1 39.2 33.4 35.9 37.7
Albania 0.7 1.1 1.1 1.0 2.0 1.8 2.1 2.7
Algeria 7.8 9.8 8.7 7.0 6.0 6.0 5.7 6.3
Azerbaijan 10.0 7.1 8.4 8.9 19.4 20.8 16.2 8.9
Bahrain 10.2 9.2 11.0 10.7 11.7 12.9 12.2 12.7
Bangladesh 4.3 3.8 4.3 3.8 3.4 3.9 3.9 4.3
Benin 27.6 9.2 43.6 35.3 31.1 37.7 33.2 36.8
Brunei 1.3 1.5 1.2 6.3 6.3 19.6 22.5 24.3
Burkina Faso 16.7 14.0 14.6 16.3 20.9 13.6 15.0 18.1
Cameroon 4.9 6.0 8.4 9.4 9.3 9.4 8.1 9.2
Chad 10.0 8.7 7.3 7.5 0.4 0.3 0.3 0.7
Comoros 1.6 1.8 0.3 0.7 5.5 6.2 8.5 43.0
Cote d'Ivoire 24.1 22.2 27.5 20.5 25.0 25.6 24.4 30.5
Djibouti 76.6 57.8 68.5 71.1 71.7 73.3 73.2 73.6
Egypt 15.6 18.5 16.3 19.0 24.1 25.8 24.1 27.3
Gabon 1.3 1.4 2.0 1.9 2.0 2.0 4.6 8.8
Gambia 5.6 6.4 13.8 12.2 11.4 19.6 9.8 5.6
Guinea 7.1 14.3 4.2 10.7 1.2 4.0 6.3 6.1
Guinea-Bissau 1.6 2.4 4.5 20.1 15.0 19.3 20.0 20.9
Guyana 0.7 0.7 0.7 0.9 1.2 1.3 1.6 1.5
Indonesia 8.3 9.0 9.6 9.4 9.6 9.7 9.9 11.2
Iran 8.2 9.1 9.7 9.4 9.9 11.8 13.3 13.3
Iraq 7.4 9.4 11.4 5.8 7.1 6.0 4.7 5.5
Jordan 53.4 52.0 48.4 43.8 45.2 45.8 44.1 47.3
Kazakhstan 6.9 11.5 14.5 11.0 9.5 10.2 10.4 10.7
Kuwait 13.5 12.8 13.1 12.2 14.0 14.3 14.2 15.7
Kyrgyzstan 31.6 25.6 36.6 44.9 46.2 58.2 42.4 54.7
Lebanon 52.8 48.1 55.7 55.3 67.1 70.6 73.8 70.6
Libya 9.5 10.9 11.6 11.7 11.3 10.1 9.5 5.8
Malaysia 5.0 5.7 6.1 6.9 7.3 7.2 7.4 8.7
Maldives 0.3 2.0 1.0 5.2 1.4 0.7 6.6 9.1
Mali 9.1 11.7 10.6 15.0 20.9 16.3 11.2 23.2
Mauritania 19.8 20.5 13.2 14.3 15.5 15.4 11.4 12.2
Morocco 6.4 7.0 6.8 6.4 6.7 7.9 8.5 8.6
Mozambique 1.1 0.5 0.2 0.7 1.2 1.0 1.7 1.7
Niger 46.5 43.6 38.9 36.3 27.6 23.9 20.5 26.0
Nigeria 7.3 6.7 10.5 7.2 8.8 8.0 5.5 6.9
Oman 16.9 20.8 21.1 22.5 18.5 18.0 17.2 17.6
Pakistan 19.8 21.7 23.6 26.1 24.5 26.9 29.7 33.2
Palestine .. .. .. .. .. .. .. ..
Qatar 7.1 5.3 9.8 6.0 7.3 9.6 9.2 8.6
Saudi Arabia 12.6 13.4 14.2 13.9 15.5 15.5 16.0 17.0
Senegal 25.6 28.0 30.2 37.2 38.0 41.1 44.3 43.8
Sierra Leone 3.6 3.8 1.7 1.9 1.3 2.6 2.8 2.5
Somalia 79.6 82.5 59.2 69.8 70.9 69.1 70.6 71.6
Sudan 13.4 10.9 15.1 33.4 13.7 9.8 10.0 5.5
Suriname 1.6 2.0 1.8 8.8 7.6 9.0 8.7 9.4
Syria 27.4 32.5 32.5 29.3 42.8 61.8 62.8 67.9
Tajikistan 24.1 32.4 33.3 41.4 28.4 31.2 46.3 69.4
Togo 29.3 39.9 42.3 47.7 51.0 52.3 41.0 41.6
Tunisia 10.0 11.1 12.2 10.4 9.1 12.3 12.0 12.5
Turkey 12.9 13.4 13.1 15.3 16.2 17.8 17.6 18.9
Turkmenistan 22.9 21.6 22.8 27.6 31.5 29.0 33.4 31.2
Uganda 3.2 5.8 3.7 6.0 9.9 12.1 13.5 11.7
United Arab Emirates 15.8 17.0 19.8 17.8 17.4 17.2 17.6 18.5
Uzbekistan 22.5 20.9 29.8 26.9 32.8 31.8 27.7 29.9
Yemen 7.1 12.6 18.6 16.1 9.3 10.9 11.6 13.6
OIC Total 10.2 11.3 12.5 12.2 13.4 13.6 13.6 14.6
Source: SESRIC, BASEIND Database; IMF, Direction of Trade Statistics.

36
Table 9: Intra-OIC Imports, % of Total Imports 2000 2001 2002 2003 2004 2005 2006 2007
Afghanistan 44.5 41.6 36.1 42.6 43.6 53.8 53.2 53.2
Albania 6.1 7.0 7.4 8.3 7.9 8.7 9.2 9.8
Algeria 7.4 8.4 9.6 9.3 9.1 9.2 10.4 10.2
Azerbaijan 26.2 33.0 30.9 27.6 25.3 22.0 20.7 25.6
Bahrain 39.0 40.6 39.3 40.1 42.0 45.9 47.0 47.7
Bangladesh 10.7 10.1 11.1 13.6 16.9 21.2 21.3 20.4
Benin 23.5 23.4 24.1 21.3 23.4 25.2 13.3 14.3
Brunei 21.1 25.0 19.9 22.9 24.0 26.6 22.0 12.9
Burkina Faso 35.4 38.3 37.2 33.0 34.1 39.5 43.0 42.5
Cameroon 28.6 22.9 19.5 19.8 19.1 21.3 24.0 23.9
Chad 20.4 9.2 14.6 24.8 29.2 28.1 31.9 29.0
Comoros 13.7 11.6 11.0 9.6 17.6 22.5 22.2 25.1
Cote d'Ivoire 31.0 24.1 22.6 20.9 26.1 31.4 34.7 37.8
Djibouti 26.2 24.7 27.1 27.0 32.6 33.5 32.8 35.5
Egypt 10.2 13.2 13.2 13.2 13.8 15.4 15.1 14.8
Gabon 4.4 4.8 7.3 8.3 9.1 10.3 10.2 10.3
Gambia 21.8 18.1 23.9 23.8 29.3 33.0 33.2 36.0
Guinea 25.4 24.4 14.9 15.8 21.1 13.5 11.6 11.2
Guinea-Bissau 14.1 16.5 24.6 38.5 32.2 27.2 26.3 29.0
Guyana 1.5 1.7 2.3 3.1 3.0 3.7 3.8 3.2
Indonesia 14.0 15.3 15.4 16.0 15.8 16.2 18.5 22.3
Iran 16.9 17.3 17.8 19.7 19.7 22.0 25.0 25.9
Iraq 14.3 19.1 20.4 40.7 53.6 57.2 58.2 59.1
Jordan 28.4 29.1 30.9 33.3 36.8 38.9 40.5 38.5
Kazakhstan 7.0 6.4 7.1 6.2 6.6 5.7 6.0 6.2
Kuwait 23.9 22.2 20.4 17.8 19.7 20.1 22.3 20.2
Kyrgyzstan 36.4 40.9 37.8 35.8 33.0 27.8 19.8 9.9
Lebanon 17.0 17.7 18.8 17.5 22.7 25.5 27.6 29.8
Libya 16.8 14.2 15.1 16.4 15.7 17.6 18.8 19.2
Malaysia 5.0 5.7 5.2 6.0 6.7 7.4 8.4 8.4
Maldives 24.7 21.6 16.8 18.7 26.2 28.8 29.4 31.8
Mali 24.6 25.2 24.2 20.2 23.9 26.3 27.7 28.6
Mauritania 15.3 16.5 14.4 13.4 14.1 12.8 15.0 15.6
Morocco 17.9 16.5 16.8 12.4 13.9 17.4 18.2 17.3
Mozambique 2.8 5.1 2.0 4.0 3.3 4.0 5.0 5.9
Niger 78.0 43.6 39.3 37.0 29.7 29.3 29.2 32.8
Nigeria 5.1 8.8 5.3 6.6 9.5 8.5 7.3 7.2
Oman 38.8 38.5 38.1 33.0 32.1 33.3 33.7 30.2
Pakistan 46.2 43.4 43.2 40.4 39.6 38.2 35.5 37.6
Palestine .. .. .. .. .. .. .. ..
Qatar 21.1 17.8 21.9 20.5 22.7 21.6 25.5 18.6
Saudi Arabia 10.6 11.3 12.7 12.2 13.1 12.9 13.6 13.3
Senegal 21.3 17.8 17.1 21.9 22.0 22.4 14.3 13.0
Sierra Leone 7.0 9.8 10.1 12.1 18.2 20.3 22.1 24.6
Somalia 44.0 47.2 43.0 47.6 48.4 53.3 51.1 52.3
Sudan 25.1 23.4 24.0 34.7 32.2 33.5 28.7 27.8
Suriname 6.2 1.0 1.3 1.4 1.8 1.6 1.8 1.7
Syria 14.3 14.9 14.3 16.5 32.9 46.3 47.9 47.0
Tajikistan 57.1 52.8 46.9 50.0 45.7 44.7 42.0 38.9
Togo 22.3 19.4 22.5 20.4 24.2 19.7 12.2 10.0
Tunisia 10.6 9.7 9.2 9.9 10.1 11.1 11.1 11.7
Turkey 11.6 13.4 11.8 11.8 10.9 12.4 13.7 12.7
Turkmenistan 33.5 26.4 28.8 29.0 33.1 42.9 41.2 39.6
Uganda 10.2 10.7 11.7 12.7 11.1 12.3 12.6 11.5
United Arab Emirates 13.4 15.0 13.3 14.9 13.2 13.1 13.7 14.1
Uzbekistan 22.5 19.3 17.0 16.8 15.9 15.5 15.5 15.2
Yemen 45.1 45.2 49.9 42.1 44.4 47.6 44.7 41.9
OIC Total 13.8 14.7 14.4 14.9 16.1 17.2 18.0 17.9
Source: SESRIC, BASEIND Database; IMF, Direction of Trade Statistics.

37
Table 10: Intra-OIC Trade, % of Total Trade 2000 2001 2002 2003 2004 2005 2006 2007
Afghanistan 42.1 40.9 36.5 40.4 43.2 52.3 52.0 52.2
Albania 5.1 5.9 6.3 6.9 6.7 7.3 7.8 8.3
Algeria 7.7 9.3 9.1 7.9 7.2 7.1 7.2 7.7
Azerbaijan 16.5 17.0 18.2 18.3 22.3 21.4 18.2 15.0
Bahrain 19.3 18.9 20.2 20.1 20.9 23.0 22.8 23.3
Bangladesh 8.2 7.7 8.3 9.8 11.6 14.6 14.0 13.8
Benin 24.6 16.4 29.0 24.5 25.3 28.3 15.1 16.1
Brunei 7.5 8.1 7.2 10.1 11.0 21.2 22.4 20.4
Burkina Faso 30.6 32.1 32.4 29.3 30.6 32.9 36.0 36.9
Cameroon 15.5 14.7 13.9 14.0 13.1 14.3 14.2 15.4
Chad 16.4 9.1 13.8 21.2 8.1 6.1 6.3 7.4
Comoros 11.5 8.5 8.5 7.7 14.8 19.7 19.7 28.0
Cote d'Ivoire 27.0 23.0 25.8 20.7 25.5 28.2 28.7 33.7
Djibouti 36.2 32.9 36.7 36.8 41.2 40.9 40.1 42.3
Egypt 11.4 14.5 14.0 14.9 16.9 18.7 18.1 18.8
Gabon 2.2 2.4 3.5 3.6 3.9 4.1 6.3 9.3
Gambia 19.8 17.4 23.2 23.4 28.2 32.4 32.1 34.5
Guinea 15.6 19.1 9.7 13.4 14.6 9.6 9.6 9.3
Guinea-Bissau 7.7 8.9 14.9 32.8 24.5 24.5 23.8 25.8
Guyana 1.1 1.2 1.5 2.0 2.1 2.5 2.9 2.5
Indonesia 10.3 11.2 11.6 11.7 12.1 12.4 13.1 15.6
Iran 11.2 12.6 13.7 14.4 14.7 16.3 18.0 18.4
Iraq 8.7 12.6 15.0 18.1 25.2 27.6 24.1 24.8
Jordan 33.8 36.4 37.0 37.0 39.3 40.9 41.6 41.1
Kazakhstan 7.0 9.4 11.5 9.1 8.4 8.1 8.4 8.5
Kuwait 16.4 15.9 15.8 14.3 15.9 16.1 16.5 17.1
Kyrgyzstan 34.1 33.2 37.2 39.9 38.7 38.8 27.0 15.9
Lebanon 20.7 21.9 23.9 22.6 30.3 33.9 36.4 38.1
Libya 11.2 11.8 12.9 13.2 12.6 11.8 11.4 8.9
Malaysia 5.0 5.7 5.7 6.5 7.0 7.3 7.9 8.6
Maldives 20.7 18.4 13.9 16.1 22.2 25.5 25.9 28.8
Mali 22.2 23.9 22.8 19.6 23.5 25.2 25.4 28.2
Mauritania 17.3 18.2 13.9 13.7 14.7 13.9 13.3 14.0
Morocco 13.4 12.8 12.8 10.1 11.3 14.2 14.8 14.4
Mozambique 2.4 3.3 1.4 2.7 2.4 2.8 3.5 4.1
Niger 71.7 43.6 39.2 36.8 29.1 27.9 26.6 30.9
Nigeria 6.9 7.3 8.8 7.0 9.0 8.2 6.1 7.0
Oman 23.9 27.1 27.1 26.5 23.6 23.5 22.6 22.5
Pakistan 34.3 33.1 34.1 33.6 33.2 33.8 33.5 36.2
Palestine .. .. .. .. .. .. .. ..
Qatar 10.2 8.5 13.1 9.9 11.1 13.6 14.7 12.7
Saudi Arabia 12.0 12.7 13.7 13.4 14.8 14.8 15.4 15.9
Senegal 22.7 21.0 21.4 26.9 26.9 28.2 22.9 20.9
Sierra Leone 6.0 9.1 8.6 10.2 13.8 16.0 16.9 18.4
Somalia 53.4 53.7 46.7 53.5 54.2 57.8 56.5 57.7
Sudan 18.9 17.4 19.8 34.1 23.3 23.5 21.0 16.7
Suriname 3.8 1.4 1.5 4.8 4.9 5.3 5.6 5.8
Syria 20.4 23.6 23.2 21.8 37.6 52.4 53.7 55.1
Tajikistan 39.5 42.9 40.0 46.0 38.2 39.2 44.0 47.5
Togo 24.9 27.2 30.1 32.0 35.5 32.2 17.3 14.6
Tunisia 10.4 10.3 10.4 10.1 9.7 11.6 11.5 12.0
Turkey 12.0 13.4 12.3 13.2 13.0 14.5 15.2 15.1
Turkmenistan 27.3 23.8 25.4 28.2 32.1 33.5 35.8 33.8
Uganda 8.1 9.2 9.2 10.8 10.8 12.2 12.8 11.6
United Arab Emirates 14.9 16.1 16.9 16.6 15.1 15.1 15.7 16.1
Uzbekistan 22.5 20.0 22.5 21.3 23.7 23.6 22.0 22.6
Yemen 20.9 26.4 33.0 30.2 26.6 27.8 28.9 29.5
OIC Total 11.7 12.8 13.4 13.5 14.7 15.2 15.6 16.1
Source: SESRIC, BASEIND Database; IMF, Direction of Trade Statistics.

38
Table 11: Foreign Direct Investment, Net Inflows, Million USD 2000 2001 2002 2003 2004 2005 2006 2007
Afghanistan 0.2 0.7 50.0 57.8 186.9 273.2 241.6 288.4
Albania 143.0 207.3 135.0 178.0 337.5 262.4 325.3 655.8
Algeria 438.0 1,196.0 1,065.0 633.8 881.9 1,081.3 1,795.4 1,664.6
Azerbaijan 30.0 220.0 1,393.0 3,227.0 3,535.0 1,679.0 -601.0 -4,817.0
Bahrain 363.6 80.4 217.0 516.7 865.3 1,048.7 2,914.9 1,756.0
Bangladesh 578.7 354.5 328.3 350.2 460.4 845.3 792.5 666.4
Benin 59.7 43.9 13.5 44.7 63.8 53.0 53.2 48.0
Brunei 549.2 526.4 1,035.3 3,374.9 334.3 288.5 433.5 183.9
Burkina Faso 23.1 6.3 15.0 29.1 14.3 34.2 33.6 600.0
Cameroon 158.8 73.3 601.7 383.0 319.3 224.7 309.0 284.3
Chad 114.8 459.9 924.1 712.7 495.4 612.9 700.0 602.8
Comoros 0.1 1.1 0.4 0.8 0.7 0.6 0.6 0.8
Cote d'Ivoire 234.7 272.7 212.6 165.4 283.0 311.9 318.9 426.9
Djibouti 3.3 3.4 3.5 14.2 38.5 59.0 163.6 195.4
Egypt 1,235.4 509.9 646.9 237.4 2,157.4 5,375.6 10,042.8 11,578.1
Gabon -42.6 -89.1 37.0 206.1 193.7 59.7 267.8 269.3
Gambia 43.5 35.5 42.8 14.9 49.1 44.7 71.2 63.7
Guinea 9.9 1.7 30.0 82.8 97.9 105.0 108.0 111.0
Guinea-Bissau 0.7 0.4 3.5 4.0 1.7 8.7 17.7 7.0
Guyana 67.1 56.0 43.6 26.1 30.0 76.8 102.4 152.4
Indonesia -4,495.0 -2,926.0 232.0 -507.0 1,896.0 8,337.0 4,914.0 6,928.0
Iran 29.2 58.5 107.8 399.6 306.3 917.9 317.1 754.5
Iraq -3.1 -6.5 -1.6 0.0 300.0 515.3 383.0 447.9
Jordan 814.8 179.8 121.6 443.2 816.4 1,774.0 3,219.3 1,835.4
Kazakhstan 1,282.5 2,835.0 2,590.2 2,092.0 4,157.2 1,971.2 6,223.6 10,259.4
Kuwait 16.3 -175.0 3.6 -68.0 23.8 234.0 122.0 123.0
Kyrgyzstan -2.4 5.0 4.7 45.5 175.5 42.6 182.0 207.9
Lebanon 964.1 1,451.2 1,336.0 2,977.0 1,993.1 2,791.5 2,739.4 2,844.6
Libya 141.0 -113.0 145.0 143.0 357.0 1,038.0 2,013.0 2,541.0
Malaysia 3,787.6 553.9 3,203.4 2,473.2 4,624.2 3,967.2 6,047.5 8,403.1
Maldives 13.0 11.7 12.4 13.5 14.7 9.5 13.9 15.0
Mali 82.4 121.7 243.8 132.3 101.0 223.8 83.4 360.0
Mauritania 40.1 76.7 67.4 101.9 391.6 814.1 154.6 152.9
Morocco 422.2 2,807.7 481.3 2,314.5 894.8 1,653.4 2,450.3 2,577.1
Mozambique 139.2 255.4 347.3 336.7 244.7 107.9 153.7 427.4
Niger 8.4 22.9 2.4 11.5 19.7 30.3 50.5 27.0
Nigeria 1,309.7 1,277.4 2,040.2 2,171.4 2,127.1 4,978.3 13,956.5 12,453.7
Oman 83.2 5.2 122.2 494.1 228.9 1,687.9 1,622.9 2,377.1
Pakistan 309.0 383.0 823.0 534.0 1,118.0 2,201.0 4,273.0 5,333.0
Palestine 62.0 19.2 9.4 18.0 48.9 46.5 18.6 20.9
Qatar 251.6 295.5 623.9 624.9 1,199.0 1,298.2 159.0 1,138.0
Saudi Arabia 183.0 504.0 453.0 778.5 1,942.0 12,097.0 18,293.0 24,318.4
Senegal 62.9 31.9 78.1 52.5 77.0 44.6 220.3 78.0
Sierra Leone 38.9 9.8 10.4 8.6 61.2 83.2 58.6 81.0
Somalia 0.3 0.0 0.1 -0.9 -4.8 24.0 96.0 141.0
Sudan 392.2 574.0 713.2 1,349.2 1,511.1 2,304.6 3,541.4 2,436.3
Suriname -148.0 -26.8 145.5 200.7 286.2 398.5 322.7 315.7
Syria 270.0 110.0 115.0 180.0 275.0 500.0 600.0 885.0
Tajikistan 23.5 9.5 36.1 13.6 272.0 54.5 338.6 400.6
Togo 41.5 63.6 53.4 33.7 59.4 77.0 77.3 69.0
Tunisia 778.8 486.4 821.3 583.9 638.9 782.4 3,311.8 1,617.9
Turkey 982.0 3,352.0 1,133.0 1,751.0 2,785.0 10,031.0 19,989.0 22,029.0
Turkmenistan 131.0 170.0 276.0 226.0 353.7 418.2 730.9 804.0
Uganda 180.8 151.5 184.6 202.2 295.4 379.8 400.2 367.9
United Arab Emirates -506.3 1,183.8 1,314.3 4,256.0 10,003.5 10,899.9 12,806.0 13,253.1
Uzbekistan 74.7 82.8 65.3 70.4 187.4 87.7 194.5 262.0
Yemen 6.4 135.5 101.7 5.5 143.6 -302.1 1,121.0 464.3
OIC Countries 11,779 17,938 24,815 34,722 50,271 84,965 129,290 141,488
Developing Countries 256,624 214,391 170,966 180,114 283,618 316,407 412,972 499,720
World 1,398,183 824,445 625,168 561,056 717,695 958,697 1,411,018 1,833,324
Source: UNCTAD, FDISTAT.

39
Table 12: Total External Debt, % of GDP 2000 2001 2002 2003 2004 2005 2006
Afghanistan .. .. .. .. .. .. 18.9
Albania 28.8 26.8 25.1 26.3 20.7 22.0 25.7
Algeria 46.1 40.9 40.0 34.6 26.1 16.5 4.8
Azerbaijan 25.2 22.4 23.7 23.7 22.5 13.7 9.1
Bahrain .. .. .. .. .. .. ..
Bangladesh 33.4 32.5 35.8 36.2 35.6 31.4 33.2
Benin 70.6 70.0 65.4 51.4 47.3 43.3 17.8
Brunei .. .. .. .. .. .. ..
Burkina Faso 54.5 53.1 47.0 40.6 40.0 37.6 19.8
Cameroon 100.3 97.0 88.3 78.6 64.5 43.4 17.7
Chad 82.2 66.5 66.6 58.1 38.5 27.8 28.1
Comoros 117.2 112.2 109.3 90.3 84.7 75.1 69.9
Cote d'Ivoire 116.5 110.2 102.7 88.7 85.5 72.8 80.2
Djibouti 47.6 45.9 55.2 61.9 62.6 58.2 60.3
Egypt 29.2 28.9 32.7 35.5 39.5 33.6 27.3
Gabon 77.4 72.6 71.9 62.6 57.8 45.0 45.6
Gambia 114.8 116.8 156.0 172.8 167.6 144.9 142.0
Guinea 108.9 107.1 106.0 95.5 89.8 99.6 102.4
Guinea-Bissau 373.3 335.8 347.2 316.9 283.4 230.0 231.3
Guyana 191.5 188.1 189.9 193.1 173.4 147.2 127.9
Indonesia 87.4 83.4 67.9 58.2 54.3 45.5 35.9
Iran 7.9 6.5 7.6 10.3 12.5 11.1 9.0
Iraq .. .. .. .. .. .. ..
Jordan 86.9 83.9 84.6 81.8 70.7 61.0 56.7
Kazakhstan 68.0 67.2 73.0 73.8 76.0 75.9 91.5
Kuwait .. .. .. .. .. .. ..
Kyrgyzstan 133.4 112.6 115.3 105.5 95.5 82.4 84.5
Lebanon 58.6 72.3 91.3 94.0 103.3 103.7 105.3
Libya .. .. .. .. .. .. ..
Malaysia 46.4 51.2 50.7 46.7 41.8 37.9 33.7
Maldives 30.3 37.6 42.4 41.1 45.5 49.1 49.5
Mali 123.0 110.7 84.6 71.4 68.1 57.0 24.5
Mauritania 219.9 203.8 197.1 183.2 150.7 126.1 61.2
Morocco 55.9 50.7 45.5 37.5 30.9 28.3 28.3
Mozambique 170.8 120.2 120.4 84.5 85.5 70.5 47.8
Niger 93.2 81.6 82.3 78.4 68.1 59.5 22.4
Nigeria 68.2 64.7 51.6 51.3 43.1 19.8 5.2
Oman 33.0 30.2 23.2 18.3 15.7 13.1 13.5
Pakistan 44.4 43.9 46.3 42.9 36.3 30.3 28.3
Palestine .. .. .. .. .. .. ..
Qatar .. .. .. .. .. .. ..
Saudi Arabia .. .. .. .. .. .. ..
Senegal 76.9 75.0 76.9 63.9 49.1 44.7 21.4
Sierra Leone 193.4 160.4 153.8 161.8 161.0 138.4 100.5
Somalia .. .. .. .. .. .. ..
Sudan 132.7 123.7 115.6 103.5 89.3 67.4 52.6
Suriname .. .. .. .. .. .. ..
Syria 112.1 98.3 92.5 86.0 77.6 23.1 19.5
Tajikistan 105.5 95.9 92.2 74.1 47.9 44.7 41.0
Togo 107.6 105.0 106.5 96.8 89.1 79.3 81.4
Tunisia 58.2 64.4 73.5 73.7 71.2 61.0 59.7
Turkey 43.8 57.7 56.3 47.4 41.0 35.0 39.2
Turkmenistan 86.7 64.2 44.3 29.2 22.3 13.1 8.4
Uganda 59.0 65.7 68.2 72.7 69.7 50.7 13.3
United Arab Emirates .. .. .. .. .. .. ..
Uzbekistan 33.7 42.8 49.5 48.6 40.2 30.1 22.9
Yemen 53.8 53.8 52.8 48.8 39.6 32.0 29.2
OIC Countries 51.3 52.5 51.7 47.1 42.6 34.5 31.2
Developing Countries 36.7 36.6 36.9 35.6 31.9 26.7 24.4
Source: SESRIC, BASEIND Database; World Bank, World Development Indicators Online.

40
Table 13: Inflation, Annual Percentage Change in Consumer Prices 2000 2001 2002 2003 2004 2005 2006 2007 2008* 2009*
Afghanistan .. .. .. 24.1 13.2 12.3 5.1 13.0 24.0 9.5
Albania 0.0 3.1 5.2 2.3 2.9 2.4 2.4 2.9 4.0 3.1
Algeria 0.3 4.2 1.4 2.6 3.6 1.6 2.5 3.6 4.3 4.1
Azerbaijan 1.8 1.5 2.8 2.2 6.7 9.7 8.4 16.6 22.4 20.0
Bahrain -0.7 -1.2 -0.5 1.7 2.3 2.6 2.2 3.4 4.5 6.0
Bangladesh 2.5 1.9 3.7 5.4 6.1 7.0 7.1 9.1 10.1 10.0
Benin 4.2 4.0 2.4 1.5 0.9 5.4 3.8 1.3 8.8 6.5
Brunei 1.2 0.6 -2.3 0.3 0.9 1.1 0.2 0.3 0.8 1.0
Burkina Faso -0.3 4.7 2.3 2.0 -0.4 6.4 2.4 -0.2 9.5 5.0
Cameroon 0.8 2.8 6.3 0.6 0.3 2.0 5.1 0.9 4.1 2.1
Chad 3.8 12.4 5.2 -1.8 -5.4 7.9 7.9 -8.8 5.0 3.0
Comoros 5.9 5.6 3.6 3.7 4.5 3.0 3.4 4.5 5.9 5.6
Cote d'Ivoire -0.4 4.4 3.1 3.3 1.5 3.9 2.5 1.9 5.6 5.7
Djibouti 1.6 1.8 0.6 2.0 3.1 3.1 3.5 5.0 8.1 6.0
Egypt 2.8 2.4 2.4 3.2 8.1 8.8 4.2 11.0 11.7 16.1
Gabon 0.5 2.1 0.2 2.1 0.4 1.2 -1.4 5.0 5.1 5.7
Gambia 0.9 4.5 8.6 17.0 14.3 5.0 2.1 5.4 6.0 5.5
Guinea 6.8 5.4 3.0 11.0 17.5 31.4 34.7 22.9 17.9 9.3
Guinea-Bissau 8.6 3.3 3.3 -3.5 0.8 3.4 2.0 4.6 9.6 6.2
Guyana 6.1 2.7 5.4 6.0 4.7 6.9 6.7 12.2 8.6 6.8
Indonesia 3.8 11.5 11.8 6.8 6.1 10.5 13.1 6.2 9.8 8.8
Iran 12.8 11.3 15.7 15.6 15.3 10.4 11.9 18.4 26.0 22.0
Iraq .. .. .. .. .. .. .. .. .. ..
Jordan 0.7 1.8 1.8 1.6 3.4 3.5 6.3 5.4 15.8 7.6
Kazakhstan 13.3 8.4 5.9 6.4 6.9 7.6 8.6 10.8 17.6 9.8
Kuwait 1.6 1.4 0.8 1.0 1.3 4.1 3.1 5.5 9.0 7.5
Kyrgyzstan 18.7 6.9 2.1 3.1 4.1 4.3 5.6 10.2 24.5 12.2
Lebanon -0.4 -0.4 1.8 1.3 1.7 -0.7 5.6 4.1 11.0 6.2
Libya -2.9 -8.8 -9.9 -2.1 1.0 2.9 1.4 6.2 12.0 10.0
Malaysia 1.6 1.4 1.8 1.1 1.4 3.0 3.6 2.0 6.0 4.7
Maldives -1.2 0.7 0.9 -2.8 6.3 3.3 3.5 7.4 15.0 4.0
Mali -0.7 5.2 5.0 -1.3 -3.1 6.4 1.9 2.5 2.5 2.5
Mauritania 6.8 7.7 5.4 5.3 10.4 12.1 6.2 7.3 12.5 9.5
Morocco 1.9 0.6 2.8 1.2 1.5 1.0 3.3 2.0 3.9 3.5
Mozambique 12.7 9.1 16.8 13.5 12.6 6.4 13.2 8.2 10.1 8.4
Niger 2.9 4.0 2.7 -1.8 0.4 7.8 0.1 0.1 8.3 3.5
Nigeria 6.9 18.0 13.7 14.0 15.0 17.8 8.3 5.5 11.0 11.1
Oman -1.2 -0.8 -0.3 0.2 0.7 1.9 3.4 5.9 11.2 9.0
Pakistan 3.6 4.4 2.5 3.1 4.6 9.3 7.9 7.8 12.0 23.0
Palestine .. .. .. .. .. .. .. .. .. ..
Qatar 1.7 1.4 0.2 2.3 6.8 8.8 11.8 13.8 15.0 13.0
Saudi Arabia -1.1 -1.1 0.2 0.6 0.4 0.6 2.3 4.1 11.5 10.0
Senegal 0.7 3.0 2.3 0.0 0.5 1.7 2.1 5.9 5.4 2.8
Sierra Leone -0.9 2.6 -3.7 7.5 14.2 12.1 9.5 11.7 15.3 13.9
Somalia .. .. .. .. .. .. .. .. .. ..
Sudan 8.0 4.9 8.3 7.7 8.4 8.5 7.2 8.0 16.0 10.0
Suriname 58.6 39.8 15.5 23.0 9.1 9.9 11.3 6.4 15.5 9.5
Syria -3.9 3.4 -0.5 5.8 4.4 7.2 10.4 4.7 8.0 7.0
Tajikistan 32.9 38.6 12.2 16.4 7.2 7.3 10.0 13.2 21.6 15.5
Togo 1.9 3.9 3.1 -0.9 0.4 6.8 2.2 1.0 5.2 5.2
Tunisia 2.3 2.0 2.7 2.7 3.6 2.0 4.5 3.1 5.1 4.5
Turkey 55.0 54.2 45.1 25.3 8.6 8.2 9.6 8.8 10.5 8.4
Turkmenistan 8.0 11.6 8.8 5.6 5.9 10.7 8.2 6.3 13.0 12.0
Uganda 5.8 4.5 -2.0 5.7 5.0 8.0 6.6 6.8 7.3 7.8
United Arab Emirates 1.4 2.7 2.9 3.2 5.0 6.2 9.3 11.1 12.9 10.8
Uzbekistan 25.0 27.3 27.3 11.6 6.6 10.0 14.2 12.3 11.1 10.6
Yemen 10.9 11.9 12.2 10.8 12.5 11.8 18.2 12.5 17.2 14.4
OIC Countries 11.0 11.8 11.1 8.2 6.6 7.4 7.8 8.2 12.2 11.4
Developing Countries 8.5 7.7 6.8 6.6 5.9 5.7 5.4 6.4 9.4 7.8
World 4.5 4.2 3.5 3.7 3.6 3.7 3.6 4.0 6.2 4.6
Source: SESRIC, BASEIND Database; IMF, World Economic Outlook, Oct.08.

41
Table 14: Human Development Index (HDI)1 2000
2 2001
3 2002
4 2003
4 2004
4 2005
4
OIC-HHDCs Brunei, Bahrain,
Kuwait, UAE, Qatar Brunei, Bahrain, Qatar,
Kuwait, UAE Brunei, Bahrain,
Kuwait, Qatar, UAE Brunei, Qatar, UAE,
Bahrain, Kuwait,
Kuwait, Brunei, Bahrain, Qatar, UAE,
Oman, Malaysia
Brunei, Kuwait, Qatar, UAE, Bahrain, Libya, Oman, Saudi Arabia,
Malaysia, Albania
OIC-MHDCs
Malaysia, Libya, Saudi Arabia, Suriname, Lebanon, Oman,
Kazakhstan, Maldives, Turkey, Turkmenistan,
Azerbaijan, Albania, Uzbekistan, Tunisia,
Iran, Jordan, Kyrgyzstan, Guyana,
Algeria, Syria, Indonesia, Tajikistan,
Egypt, Gabon, Morocco, Cameroon,
Comoros
Malaysia, Libya, Saudi Arabia, Kazakhstan, Suriname, Oman,
Lebanon, Maldives, Turkmenistan,
Azerbaijan, Jordan, Tunisia, Guyana, Albania, Turkey,
Palestine, Uzbekistan, Kyrgyzstan, Iran,
Algeria, Syria, Indonesia, Tajikistan,
Gabon, Egypt, Morocco, Comoros, Sudan, Bangladesh,
Togo
Libya, Malaysia, Albania, Suriname,
Oman, Saudi Arabia, Kazakhstan, Lebanon,
Maldives, Turkmenistan, Turkey,
Jordan, Azerbaijan, Tunisia, Iran, Palestine,
Guyana, Syria, Uzbekistan, Algeria,
Kyrgyzstan, Indonesia, Tajikistan, Egypt, Gabon, Morocco,
Comoros, Bangladesh, Sudan, Cameroon
Libya, Malaysia, Oman, Albania, Saudi Arabia, Kazakhstan, Lebanon,
Suriname, Tunisia, Jordan, Turkey,
Maldives, Turkmenistan, Iran,
Azerbaijan, Palestine, Algeria, Syria, Guyana, Kyrgyzstan, Indonesia,
Uzbekistan, Egypt, Tajikistan, Gabon,
Morocco, Comoros, Pakistan, Bangladesh, Sudan, Togo, Uganda
Libya, Albania, Saudi Arabia, Lebanon,
Kazakhstan, Jordan, Tunisia, Suriname,
Turkey, Iran, Maldives, Azerbaijan, Palestine,
Algeria, Guyana, Turkmenistan, Syria,
Indonesia, Kyrgyzstan, Egypt, Uzbekistan,
Tajikistan, Morocco, Gabon, Comoros,
Pakistan, Bangladesh, Sudan, Cameroon,
Uganda
Kazakhstan, Turkey, Suriname, Jordan,
Lebanon, Tunisia, Iran, Guyana, Azerbaijan,
Maldives, Algeria, Palestine, Indonesia, Syria, Turkmenistan, Egypt, Uzbekistan, Kyrgyzstan, Gabon,
Tajikistan, Morocco, Comoros, Pakistan,
Mauritania, Bangladesh, Cameroon, Sudan,
Djibouti, Togo, Yemen, Uganda, Gambia
OIC-LHDCs
Pakistan, Sudan, Togo, Yemen, Bangladesh,
Nigeria, Djibouti, Uganda, Mauritania,
Senegal, Cote d’Ivoire, Benin, Guinea,
Gambia, Mali, Chad, Guinea-Bissau, Burkina Faso,
Mozambique, Niger, Sierra Leone
Cameroon, Pakistan, Uganda, Yemen, Gambia, Nigeria,
Djibouti, Mauritania, Senegal, Guinea,
Benin, Cote d’Ivoire, Chad, Guinea-Bissau, Mozambique, Mali, Burkina Faso, Niger,
Sierra Leone
Pakistan, Togo, Uganda, Yemen,
Nigeria, Mauritania, Djibouti, Gambia,
Senegal, Guinea, Benin, Cote d’Ivoire, Chad,
Mozambique, Guinea-Bissau, Mali, Burkina
Faso, Sierra Leone
Cameroon, Djibouti, Yemen, Mauritania,
Gambia, Guinea, Senegal, Nigeria, Benin,
Cote d’Ivoire, Mozambique, Guinea-
Bissau, Chad, Mali, Burkina Faso, Sierra
Leone, Niger
Togo, Djibouti, Yemen, Mauritania, Gambia,
Senegal, Nigeria, Guinea, Benin, Cote
d’Ivoire, Mozambique, Chad, Guinea-Bissau, Burkina Faso, Mali, Sierra Leone, Niger
Senegal, Nigeria, Guinea, Benin, Cote
d’Ivoire, Chad, Mozambique, Mali,
Niger, Guinea-Bissau, Burkina Faso, Sierra
Leone
Source: UNDP, “Human Development Report”, various issues. 1 Countries in Bold are countries that witnessed an increase in their level of development and the ones in Italic are the countries that have witnessed a decrease in their level of development with respect to the previous year. 2 Index included 173 countries 53 of which were OIC member countries. 3 Index included 175 countries 54 of which were OIC member countries. 4 Index included 177 countries 54 of which were OIC member countries.

42
Table 15: Human Poverty Index (HPI) 2000 2001 2002 2003 2004 2005
Algeria 23.4 22.6 21.9 21.3 21.5 21.5
Bahrain .. .. .. .. .. ..
Bangladesh 42.4 42.6 42.2 44.1 44.2 40.5
Benin 46.8 46.4 45.7 48.4 47.8 47.6
Brunei .. .. .. .. .. ..
Burkina Faso .. 58.6 65.5 64.2 58.3 55.8
Cameroon 30.7 35.9 36.9 36.2 35.6 31.8
Chad 50.5 50.3 49.6 58.8 57.9 56.9
Comoros 31.9 31.5 31.4 31.2 31.6 31.3
Cote d’Ivoire 42.3 45.0 45.0 41.9 41.5 40.3
Djibouti 34.3 34.3 34.3 29.5 30.0 28.5
Egypt 31.2 30.5 30.9 30.9 20.0 20.0
Gabon .. .. .. .. 27.3 20.4
Gambia 48.5 45.8 45.8 44.7 44.7 40.9
Guinea .. .. .. .. 52.0 52.3
Guinea-Bissau 49.3 47.8 48.0 48.2 48.2 44.8
Guyana 11.4 12.7 12.9 14.8 .. 14.0
Indonesia 18.8 17.9 17.8 17.8 18.5 18.2
Iran 17.0 16.4 16.4 16.4 16.4 12.9
Jordan 8.2 7.5 7.2 8.1 7.6 6.9
Kuwait .. .. .. .. .. ..
Lebanon 9.9 9.5 9.5 9.6 9.6 8.5
Libya 16.2 15.7 15.3 15.3 .. ..
Malaysia .. .. .. 8.9 8.3 8.3
Maldives 15.8 11.4 11.4 16.6 16.9 17.0
Mali 47.3 55.1 58.9 60.3 60.2 56.4
Mauritania 47.9 48.6 48.3 40.5 41.0 39.2
Morocco 35.8 35.2 34.5 34.5 33.4 33.4
Mozambique 47.9 50.3 49.8 49.1 48.9 50.6
Niger 62.5 61.8 61.4 64.4 56.4 54.7
Nigeria 34.9 34.0 35.1 38.8 40.6 37.3
Oman 32.1 31.8 31.5 21.1 .. ..
Pakistan 41.0 40.2 41.9 37.1 36.3 36.2
Palestine .. .. .. 6.5 6.5 6.6
Qatar .. .. .. 7.8 7.9 7.8
Saudi Arabia 16.9 16.3 15.8 14.9 .. ..
Senegal 45.2 44.5 44.1 44.2 44.0 42.9
Sierra Leone .. .. .. 54.9 51.9 51.7
Sudan 32.7 32.2 31.6 32.4 31.3 34.4
Suriname .. .. .. 10.9 10.3 10.2
Syria 19.3 18.8 13.7 13.8 14.4 13.6
Togo 37.9 38.5 38.0 39.5 39.2 38.1
Tunisia .. 19.9 19.2 18.3 17.9 17.9
Turkey 12.7 12.4 12.0 9.7 9.8 9.2
Uganda 40.8 36.6 36.4 36.0 36.0 34.7
United Arab Emirates .. .. .. .. 15.9 8.4
Yemen 41.8 41.0 40.3 40.3 40.6 38.0
OIC Average 30.4 30.2 30.4 30.6 30.5 29.2
Total Population (million) 1,145.3 1,189.6 1,212.5 1,245.3 1,250.9 1,275.1
Pop. Suffering. Human Poverty (million) 347.6 359.2 369.1 380.8 381.5 372.9
Source: UNDP, Human Development Report, various issues.

43
Table 16: Average Progress Comparison between the periods 2000-2004 and 20005-Most Recent Year
for the World, Developing Regions and OIC
World Average Developing Regions Average OIC Average
2000-2004 2005-MRY Difference 2000-2004 2005-MRY Difference 2000-2004 2005-MRY Difference
Goal 1
Growth rate of GDP per person employed, % 1 2.11 2.97 0.86 1.39 2.45 1.06 2.30 2.91 0.62
Children under 5 moderately or severely underweight, %
1 19.60 16.31 -3.29 20.65 19.09 -1.56 20.70 16.92 -3.78
Goal 2
Total net enrolment ratio in primary education, both sexes
1 87.73 89.28 1.54 84.22 86.23 2.00 79.26 82.71 3.45
Literacy rate of 15-24 year-olds, women and men 2 85.53 89.17 3.65 83.41 88.44 5.03 76.96 83.26 6.31
Goal 3 Gender Parity Index in primary level enrolment 1 0.95 0.96 0.01 0.94 0.95 0.01 0.90 0.93 0.03
Gender Parity Index in secondary level enrolment 1 0.97 0.98 0.01 0.95 0.97 0.02 0.85 0.89 0.04
Goal 4 Children under five mortality rate per 1,000 live births 1, 3 61.27 55.15 -6.12 79.30 72.07 -7.23 94.02 84.99 -9.03
Children 1 year old immunized against measles, % 1 82.81 86.08 3.27 79.23 83.14 3.91 77.22 82.49 5.27
Goal 5 Births attended by skilled health personnel, % 1 80.19 73.91 -6.28 70.50 68.19 -2.31 63.92 66.37 2.45
Antenatal care coverage, at least one visit, % 1 80.03 85.00 4.97 79.70 82.64 2.94 71.74 80.19 8.45
Goal 6
Tuberculosis prevalence rate per 100,000 population 1 196.41 184.18 -12.23 248.96 235.67 -13.29 265.72 265.85 0.12
Tuberculosis death rate per year per 100,000 population
1 26.80 25.22 -1.59 34.39 32.49 -1.90 34.23 34.29 0.06
Goal 7
Proportion of the population using improved drinking water sources, total
3, 4 82.27 84.39 2.12 77.98 79.77 1.79 74.38 76.45 2.06
Proportion of the population using improved sanitation facilities, total
3, 4 66.29 68.15 1.85 58.38 59.11 0.73 57.22 57.54 0.33
Goal 8 Cellular subscribers per 100 population 1 26.25 32.27 6.02 16.92 38.01 21.09 11.38 15.94 4.56
Internet users per 100 population 1 13.19 21.96 8.77 7.94 14.04 6.11 4.27 9.08 4.81
Source: United Nations Statistics Division, accessed on November 25, 2008, http://mdgs.un.org/unsd/mdg/Data.aspx MRY=Most Recent Year 1. MRY=2006
2. MRY=2007
3. 2000-2004 average includes data only from year 2000
4. 2005-MRY average includes data only from year 2006

44