oil and gas pricing mechanisms: past, current and …€¦ · · 2013-09-17oil and gas pricing...
TRANSCRIPT

Oil and Gas PricingOil and Gas PricingMechanisms: Past, Mechanisms: Past, Current and Future Current and Future
TrendsTrends
Dr. Andrey A.Konoplyanik,Dr. Andrey A.Konoplyanik,Consultant to the Board, Gazprombank, and Consultant to the Board, Gazprombank, and Professor, Russian State Oil & Gas UniversityProfessor, Russian State Oil & Gas University
Presentation at the session “Oil and Gas PricingPresentation at the session “Oil and Gas PricingMechanisms: Past, Current and Future Trends” Mechanisms: Past, Current and Future Trends”
Economic Forum, Crynica, Poland, Economic Forum, Crynica, Poland, 99--12 September 2009 12 September 2009

Report on Pricing by the Energy Charter
The Report can be downloaded free of charge from: www.encharter.org

Table of contents:Table of contents:
Oil marketOil marketGas marketGas market

Transfer deals (dominated prior to 1970-ies)
+ Markets of physical goods => of “physical” energy & of real deliveries of energy resources (non-liquid energy markets) =
+ Long-term contracts (since 1970-ies)+ Short-term contracts (since 1970-ies)+ Spot deals (since 1980-ies)+ Forward deals (with delayed deliveries of
physical goods) (since 1980-ies)
+ Financial markets => of “paper” energy & of energy-based financial instruments (liquid energy markets) =
+ Forward deals (without deliveries of physical goods) (since 1980-ies)
+ Futures (since 1990-ies)+ Options (since 1990-ies)+ … ? (since … ?)
Historical evolution of contractual structure of global oil market vs. key organizational forms of market space
+ +
Liquid market places
Term contracts
Vertical integration
A.Konoplyanik. Session on oil & gas pricing. Economic Forum, Crynica, 09-12.09.09 Slide 1

Evolution of oil market: volumes of trade vs. volumes of physical supplies
Long-term contracts
Spot deals Forward deals(2) (*)
Short-term contracts
Forward deals(1) (*)
Futures & options
Increasing liquidity, but also growing market instability =>good for traders/speculators, but is short-term & deprives project financing
Volume of trade correspondsto volume of supplies
Volume of trade exceedsvolume of supplies => OTC market (subsequent re-sales of non-unified commercial batches – “daisy chains”)
Volume of trade multiply exceeds volume of supplies =>liquid marketplaces/exchanges (multidirectional re-sales of unified supply liabilities)
Markets of physical goods (of “physical” oil)Financial markets (of “paper” oil)
?
(*) (1) within the limits of coverage by accumulated volumes of stocks, (2) beyond such limits
A.Konoplyanik. Session on oil & gas pricing. Economic Forum, Crynica, 09-12.09.09 Slide 2

Evolution of pricing systems in international oil trade
A.Konoplyanik. Session on oil & gas pricing. Economic Forum, Crynica, 09-12.09.09 Slide 3
Futures prices dominate oil market, but NOT used by oil companies as benchmarks for project financing any more => ‘oil price’ is NOT a signal for long-term oil development

Singapore
ICE (London)Brent:
Gasoline:Heating oil:
NYMEX (New York)
WTI: 700Gasoline: 10
Heating oil: 40Oil exchanges (figures show churn level)
Oil spot trade centers
TOCOM
ARA (Antwerpen-Rotterdam-Amsterdam
Mediterranean
NewYork Harbour
US Gulf of Mexico
Key international petroleum exchanges and spot trade centers
A.Konoplyanik. Session on oil & gas pricing. Economic Forum, Crynica, 09-12.09.09 Slide 4

Correlation of the scales of oil, commodities and financial & monetary markets (order of the figures)
“Physical” oil market = 1
“Paper” oil market = 3+
Commodities market = 10+
Financial & monetary markets = 100+
A.Konoplyanik. Session on oil & gas pricing. Economic Forum, Crynica, 09-12.09.09 Slide 5
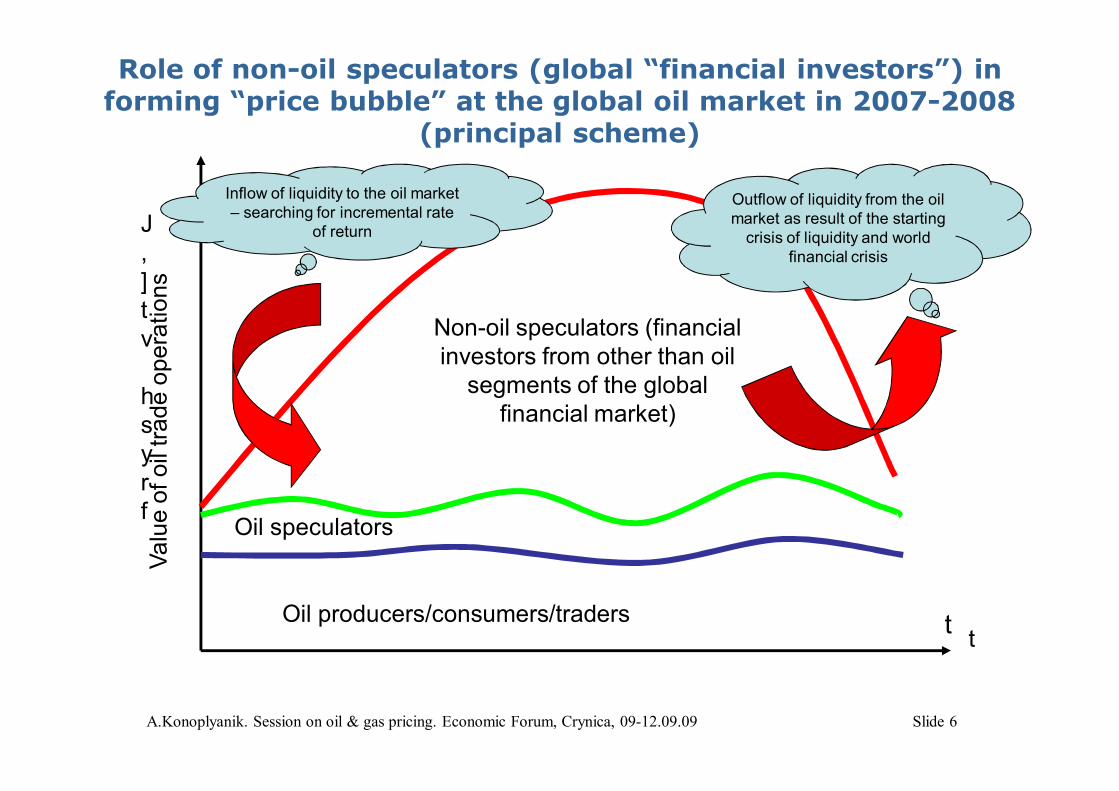
Role of non-oil speculators (global “financial investors”) in forming “price bubble” at the global oil market in 2007-2008
(principal scheme)
Oil speculators
Oil producers/consumers/traders
Non-oil speculators (financial investors from other than oil
segments of the global financial market)
tt
J,]tv
hsyrf
Valu
e of
oil
trade
ope
ratio
nsInflow of liquidity to the oil market – searching for incremental rate
of return
Outflow of liquidity from the oil market as result of the starting
crisis of liquidity and world financial crisis
A.Konoplyanik. Session on oil & gas pricing. Economic Forum, Crynica, 09-12.09.09 Slide 6

Table of contents:Table of contents:
Oil marketOil marketGas marketGas market
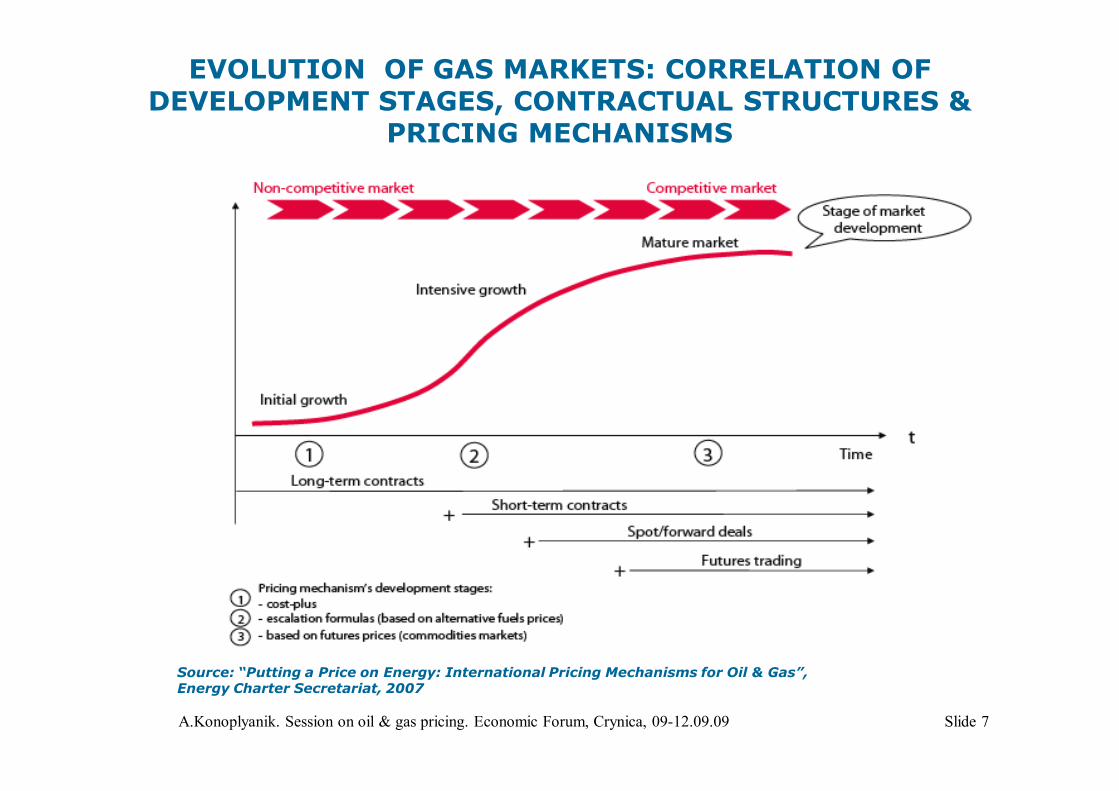
Source: “Putting a Price on Energy: International Pricing Mechanisms for Oil & Gas”, Energy Charter Secretariat, 2007
EVOLUTION OF GAS MARKETS: CORRELATION OF DEVELOPMENT STAGES, CONTRACTUAL STRUCTURES &
PRICING MECHANISMS
A.Konoplyanik. Session on oil & gas pricing. Economic Forum, Crynica, 09-12.09.09 Slide 7

Regional Specificity: Will Gas follow Oil to Become a Global Commodity?
Source: “Putting a Price on Energy: International Pricing Mechanisms for Oil & Gas”, Energy Charter Secretariat, 2007
A.Konoplyanik. Session on oil & gas pricing. Economic Forum, Crynica, 09-12.09.09 Slide 8

Source: BP (2006) (1) LNG to USA, UK and other spot LNG; arbitrage on the UK-Belgium Interconnector(2) Pipeline Canada-USA, pipelines to UK (BBL, Langeled) and new Dutch exports(3) All imports by Continental Europe (incl. accession countries) less spot LNG under (1)(4) Trade with FSU now in transition from quasi-barter deals to LTCs, 2004 figures
0
50
100
150
200
250
300
350
Spot contracts (1) LTC linked to gasprice indicators (2)
LTC based onreplacement
philosophy (3)
Transition to LTC (4)
bcm
/a
Estimated International Gas Trade (2005): Different Pricing Mechanisms for Main Regions
A.Konoplyanik. Session on oil & gas pricing. Economic Forum, Crynica, 09-12.09.09 Slide 9
5% 20-25% 55-60% 15%

LTGEC: Indexation by Producer
A.Konoplyanik. Session on oil & gas pricing. Economic Forum, Crynica, 09-12.09.09 Slide 10

LTC: Indexation by EU Region
A.Konoplyanik. Session on oil & gas pricing. Economic Forum, Crynica, 09-12.09.09 Slide 11

Gas Pool
Euro Hub GmbH
BEB virtual point (*)
CEGH: 2.5 (*)
PSV (*)
PEG balancing zones:1.5-3 (PEG Nord)(*)
NBP: 21 (***)
TTF: 3 (*)Zeebrugge: 4
Henry Hub: 100
Singapore
ICEBrent:
Gasoline:Heating oil:
NYMEXWTI: 700
Gasoline: 10Heating oil: 40
Oil exchanges
Oil spot trading centers
Trans-regional/physical gas hubs
Notional/virtual gas hubs
Figures reflect churn ratios
TOCOM
Rotterdam
Mediterranean
NewYork Harbour
US Gulf of Mexico
(*) BEB hub = Bunde (Germany) at German/Dutch border, CEGH = Central European gas hub (Baumgarten, Austria), NBP = Notional Balancing Point (UK hub), PEGs = French hubs (GdF), PSV = Punto di Scambio Virtuale (Italian hub), TTF = Title Transfer Facility (Dutch hub); (**) 2004 – 2006 average; (***) 8-14 during the 2004 – 2006 period
Comparative liquidity of marketplaces: worldwide oil vs. Continental Europe gas
A.Konoplyanik. Session on oil & gas pricing. Economic Forum, Crynica, 09-12.09.09 Slide 12

UK NBP churning factor 2003-2008
Source: Gas Matters, different issues
A.Konoplyanik. Session on oil & gas pricing. Economic Forum, Crynica, 09-12.09.09 Slide 13

UK NBP churning factor 2007-2009 – and related volumes
Source: Gas Matters, March 2009, p.29
A.Konoplyanik. Session on oil & gas pricing. Economic Forum, Crynica, 09-12.09.09 Slide 14

When and how gas-to-gas competition will play a role in European gas pricing?
European gas market is not yet ready (if would be at all) to switch to gas-to-gas competition as to key pricing instrumentThere will be no revolutionary switch to gas-to-gas competition in pricingPricing formulas within LTGEC will smoothly adapt to new stages of energy market developments by increasingly reflecting, where practical, gas-to-gas competition as one of ingredients
A.Konoplyanik. Session on oil & gas pricing. Economic Forum, Crynica, 09-12.09.09 Slide 15

Questions for DiscussionGas: What is the most probable further evolution of contract duration and pricing mechanisms within the “broader” Europe? Marginal scenarios:
spot deals and exchange quotations, vs.long-term contracts with pricing based on replacement values with expanding spectrum of the replacing fuels and other factors taken into consideration in pricing formulas,
Whether gas price in Europe will continue to be pegged to prices of basket of replacing fuels with increasing number of its ingredients but with crude oil and petroleum products preserving their leading role in pricing formulas?Oil: Whether oil prices will continue to be pegged to exchange quotations (futures) at two major oil marketplaces worldwide: WTI (New York) and Brent (London)? Whether oil & gas prices will continue to be pegged to US dollar as to universal currency of the transactions? To which currency(ies) departure from US dollar could take place?
A.Konoplyanik. Session on oil & gas pricing. Economic Forum, Crynica, 09-12.09.09 Slide 16
