oil & natural gas technology field trip and was willing to let the group onsite. eab efforts...
TRANSCRIPT
Oil & Natural Gas Technology
DOE Award No.: DE-FE0001243
Clean and Secure Energy from Domestic
Oil Shale and Oil Sands Resources
Quarterly Progress Report (April – June 2011)
Submitted by: Institute for Clean and Secure Energy
155 S. 1452 E. Room 380 Salt Lake City, Utah 84112
Prepared for:
United States Department of Energy National Energy Technology Laboratory
August 10, 2011
Office of Fossil Energy
Clean and Secure Energy from Domestic Oil Shale and Oil Sands
ResourcesDOE Award No.: DE-FE0001243
Quarterly Progress ReportApril 2011 to June 2011
Submitted by:Institute for Clean and Secure Energy
155 S. 1452 E. Room 380Salt Lake City, UT 84112
Principal Investigator: Philip J. SmithProject Period: October 1, 2010 to September 30, 2013
Prepared for:U.S. Department of Energy
National Energy Technology Laboratory

Acknowledgment: "This material is based upon work supported by the Department of Energy under Award Number DE-FE0001243." Disclaimer: "This report was prepared as an account of work sponsored by an agency of the United States Government. Neither the United States Government nor any agency thereof, nor any of their employees, makes any warranty, express or implied, or assumes any legal liability or responsibility for the accuracy, completeness, or usefulness of any information, apparatus, product, or process disclosed, or represents that its use would not infringe privately owned rights. Reference herein to any specific commercial product, process, or service by trade name, trademark, manufacturer, or otherwise does not necessarily constitute or imply its endorsement, recommendation, or favoring by the United States Government or any agency thereof. The views and opinions of authors expressed herein do not necessarily state or reflect those of the United States Government or any agency thereof."
2

EXECUTIVE SUMMARY
The Clean and Secure Energy from Domestic Oil Shale and Oil Sands Resources program is part of the research agenda of the Institute for Clean and Secure Energy (ICSE) at the University of Utah. In this quarter, the Clean and Secure Energy program sponsored the University of Utah Unconventional Fuels Conference and the Uinta Basin field trip. Attendance at the conference was the highest ever, with at least 135 registered attendees. The field trip filled up quickly and feedback was very positive; attendees valued the experience of seeing oil shale and oil sands production facilities, outcrops, mines, and research facilities available at the Bingham Energy Research Center in Vernal, Utah.
Task 3.0 researchers focused this quarter on developing an understanding of oil and gas operations in the Uinta Basin and on developing an understanding of the CLEARuff model and the AnyLogic software it is based on. Together, they developed a simplified set of processes for oil and gas development that is outlined in this report. In addition, Subtask 3.1 researchers collected relevant emissions factors, Subtask 3.3 researchers studied drilling processes in more detail, and Subtask 3.4 researchers updated and refined the CLEARuff model to make it moreunderstandable and easier to use by all team members.
Subtask 3.2 researchers performed simulations of a pilot-scale oxy-gas burner using a new reaction table the better reflected air in-leakage and water removal in the experimental flue gas recycle system. Walls were also added to the computational domain, resulting in simulations that were much more stable. The domain length is being increase to 4 m to better capture system dynamics.
Several new projects were started in Task 4.0. The Subtask 4.8 team described the recently drilled ~1000 foot thick Skyline 16 core in detail and began X-ray fluorescence analysis to delineate stratigraphic changes in elemental composition. The Subtask 4.9 team concentrated their efforts on the isolation of the kerogen and bitumen from the raw oil shale samples. This work was focused on the three 1-foot sections of the Skyline 16 core identified by all Task 4.0 researchers. They also obtained 13C NMR data was on raw shale samples and the isolated kerogens.
Other Task 4.0 projects continued on with work begun in the previous quarter. Subtask 4.1 researchers started to transition their geometry development technique to include the most up-to-date meshing and geometry software tool, namely the ICEM-CFD software package, commercially offered by ANSYS. They also developed a new solution algorithm that takes advantage of the differing time scales occurring in their rubblized bed simulations. This new algorithm allows them to obtain long-term thermal histories of the oil shale particles. The Subtask 4.2 team In this quarter, Subtask 4.2 researchers have examined statistical techniques that can be used to expose simulation parameters where the response to variations in the parameters is significant compared to random noise. With the new approach being developed, expected ranges are assigned to the parameters, and surrogate models obtained from experimental designs replace the balance equations. In Subtask 4.3, researchers are examining the effect of the variability in raw compositions of oil shale on the pyrolysis process and on product distributions. They performed thermogravimetric and CHNS (carbon, hydrogen, nitrogen and sulfur) analyses on three samples from the Syline 16 core with widely differing organic contents. Some members of the Project Team at BYU received an extracted kerogen sample that they tested for ash content. The high ash content measured (70%) led to changes in the demineralization process used in Subtask 4.9. The Subtask 4.5 team implemented an MPI version of the single component multiphase flow Lattice Boltzmann model and optimized the code. Team members also received extracted kerogen samples from the Skyline 16 oil shale core that will be used for calibration in subsequent X-ray computed tomography scans. Subtask
3

4.6 researchers modeled the stacking arrangement of the mid-continent asphaltene, starting with the previously reported single unit model, and calculated the corresponding nuclear magnetic resonance spectra. In Subtask 4.7, the research team prepared machine drawings for a pressure vessel intended to subject oil shale samples to a retorting environment with a temperature up to 1,000°F. These drawings were sent out for bid and pressure rating to third party fabricators. The design was approved and the vessel is being fabricated.
Subtask 5.1 researchers continued to collect information on resource management, including a review of settlements to lawsuits challenging the Department of Interior’s 2008 Programmatic EIS designating lands as available for application for commercial oil shale and oil sands leasing and a review of federal efforts to assist rural communities impacted by land or resource conservation. In Subtask 5.2, research was done regarding the conjunctive management of surface and groundwater resources in neighboring states and researchers began drafting text for the topical report. Subtask 5.3 has not yet been initiated.
In Task 6.0, ICSE researchers analyzed comments received from reviewers of the draft Market Assessment. Based on recurring comments as the the cost per barrel reported, the research team hired a consultant with extensive experience in the oil shale industry to review cost models, assumptions, methodologies, etc. With the help of the consultant, researchers are determining how to best address all reviewer comments. A final draft of the report will be released to reviewers in September. Additionally, Subtask 6.2 researchers completed research and analysis of the relevant Alberta and U.S./Utah fiscal systems in terms of the split of project net present value between producers and government related to taxes and royalties levied on oil sands production.
Task 7.0, the Strategic Alliance Reserve, is intended fund collaborative projects with industry that built on ICSE research of the past years to move technologies closer to deployment. The Project Team winnowed down the pool of collaborators to one, American Shale Oil (AMSO), during this quarter. AMSO has agreed to contribute money to the research effort. A work statement with timelines, milestones, deliverables, and budgets will be submitted in the next quarter.
PROGRESS, RESULTS, AND DISCUSSION
Task 1.0 - Project Management and Planning
During this quarter, there were no schedule/cost variances or other situations requiring updating/amending of the PMP.
Task 2.0 -Technology Transfer and Outreach
This task focuses on outreach and education efforts and the implementation of External Advisory Board (EAB) recommendations. During this quarter, ICSE sponsored the 2011 University of Utah Unconventional Fuels Conference. It was held on Tuesday, May 17, on the campus of the University of Utah. Attendance this year was around 135, which is slightly higher than in previous years. Conference attendees came from local and state governments, federal agencies, academia, industry, consulting businesses, non-governmental organizations, and the interested public. An agenda from the meeting is attached as in Appendix B. Directly following the conference on May 18-19, ICSE also sponsored a Uinta Basin field trip that was open to conference attendees for an additional fee. Attendance was capped at 27 due to vehicle and site constraints. The field trip itinerary is included in Appendix B. In addition to the itinerary, an unplanned stop was made at the KTIA oil sands property as the owner of the property attended
4

the field trip and was willing to let the group onsite.
EAB efforts this quarter focused on compiling updated project information to be sent to EAB members. There was some delay in gathering and revising project descriptions from all Principal Investigators. However, all materials were gathered by the conclusion of this quarter and are expected to go out to EAB members the first week of August 2011. Also this quarter, internal meetings were held regarding the make-up of the EAB. After consultation within ICSE, including Distinguished Professor David W. Pershing, the Director of the EAB, the decision was made to reduce the size of the EAB and refocus its efforts on building future industrial research and demonstration scale collaborations for ICSE. However, implementing this decision and communicating with current EAB members will not take place until next quarter. Also, Professor Pershing has asked Presidential Professor Adel F. Sarofim to join the EAB to aid with developing ICSE-industry relations. The date for the 2011 EAB meeting, which is anticipated to convene the revised EAB, has tentatively been set for early November.
Preparations have continued for the 2011 Energy Forum, which will be held on the afternoon of September 14, 2011 at the Gould Auditorium at the Marriott Library. The Energy Forum preparations this quarter have focused on confirming participants. Former Senator Bob Bennett and former Wyoming Governor Dave Freudenthal have been confirmed as panelists and Professor Lincoln Davies has been confirmed as the panel moderator. Efforts also began this quarter to confirm an industry panelist, but a specific participant has not yet been confirmed.
Task 3.0 - Clean Oil Shale and Oil Sands Utilization with CO2 Management
Subtask 3.1 (Phase I) – Macroscale CO2 Analysis (PI: Kerry Kelly, David Pershing)
Due to delays in completing Subtask 6.1, the final deliverable for this subtask will not be completed until October 2011.
Subtask 3.1 (Phase II) – Lifecycle Greenhouse Gas Analysis of Conventional Oil and Gas Development in the Uinta Basin (PI: Kerry Kelly, David Pershing)
During this quarter, the Project Team’s efforts focused on developing an understanding of oil and gas operations in the Uinta Basin, on the collecting of relevant emission factors, and on developing an understanding of the CLEARuff model and the AnyLogic software. Subtask 3.1 researchers collaborated with researchers from Subtask 3.4 since the oil and gas modules developed for that subtask will link to the life-cycle greenhouse gas modules. Together, the researchers from both subtasks developed a simplified set of processes for oil and gas development with the help of Dr. John McLennan from the University of Utah and Dustin Doucett at the Utah Division of Oil Gas and Mining (DOGM). This preliminary description is outlined below:
1. Site Prep and Set-up- 10-20 truckloads of equipment - Timing estimate is 5-10 days to prepare pad (including building access roads if
necessary) and 1-2 days to set-up rig- Each pad contains several wells (1-2 up to 20)- Water used (dust abatement, showers, drinking etc.)- Diesel fuel used for trucking
2. Drilling- Timing estimate is 4-5 days- Energy use (diesel) and water use (drilling mud)
5
- Some water loss, rest trucked off-site for treatment or injection- Well logging (before setting casing) is important part of drilling well but not a
significant use of energy/water
3. Casing- Cement trucked in (from local distribution center or somewhere else)- Energy for pumping, water equivalent to 30% - 40% of annular volume
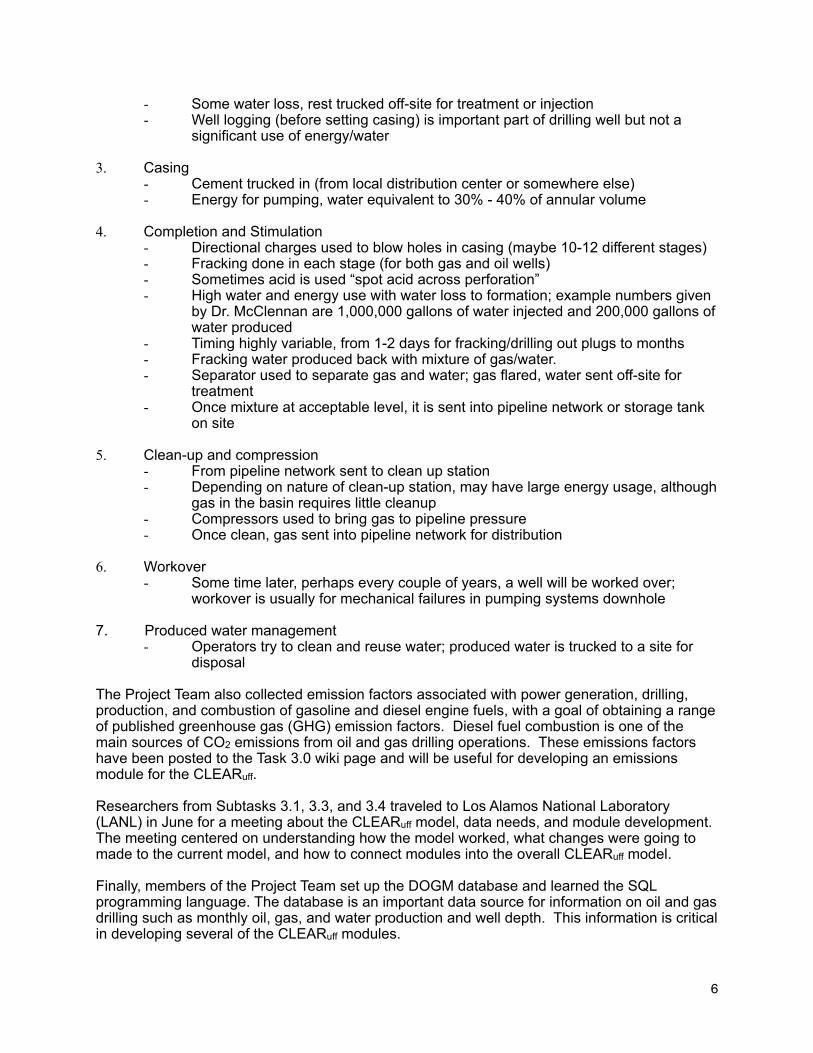
4. Completion and Stimulation- Directional charges used to blow holes in casing (maybe 10-12 different stages)- Fracking done in each stage (for both gas and oil wells)- Sometimes acid is used “spot acid across perforation”- High water and energy use with water loss to formation; example numbers given
by Dr. McClennan are 1,000,000 gallons of water injected and 200,000 gallons of water produced
- Timing highly variable, from 1-2 days for fracking/drilling out plugs to months- Fracking water produced back with mixture of gas/water.- Separator used to separate gas and water; gas flared, water sent off-site for
treatment - Once mixture at acceptable level, it is sent into pipeline network or storage tank
on site
5. Clean-up and compression- From pipeline network sent to clean up station- Depending on nature of clean-up station, may have large energy usage, although
gas in the basin requires little cleanup- Compressors used to bring gas to pipeline pressure - Once clean, gas sent into pipeline network for distribution
6. Workover- Some time later, perhaps every couple of years, a well will be worked over;
workover is usually for mechanical failures in pumping systems downhole
7. Produced water management- Operators try to clean and reuse water; produced water is trucked to a site for
disposal
The Project Team also collected emission factors associated with power generation, drilling, production, and combustion of gasoline and diesel engine fuels, with a goal of obtaining a range of published greenhouse gas (GHG) emission factors. Diesel fuel combustion is one of the main sources of CO2 emissions from oil and gas drilling operations. These emissions factors have been posted to the Task 3.0 wiki page and will be useful for developing an emissions module for the CLEARuff.
Researchers from Subtasks 3.1, 3.3, and 3.4 traveled to Los Alamos National Laboratory (LANL) in June for a meeting about the CLEARuff model, data needs, and module development. The meeting centered on understanding how the model worked, what changes were going to made to the current model, and how to connect modules into the overall CLEARuff model.
Finally, members of the Project Team set up the DOGM database and learned the SQL programming language. The database is an important data source for information on oil and gas drilling such as monthly oil, gas, and water production and well depth. This information is critical in developing several of the CLEARuff modules.
6

Subtask 3.2 - Flameless Oxy-gas Process Heaters for Efficient CO2 Capture (PI: Jennifer Spinti)
In this quarter, Subtask 3.2 researchers focused on performing some scoping simulations to better identify the parameter space to be probed in the validation/uncertainty quantification (V/UQ) analysis. These scoping runs required the development of a new oxy-gas reaction table that more accurately reflected the experimental conditions present in the oxy-gas experiments conducted by the International Flame Research Foundation or IFRF (Coraggio and Laiola, 2009). The IFRF researchers reported a large air in-leakage in the flue gas recycle line and the removal of water in condensers. The new oxy-gas reaction table accounts for both the in-leakage and the water removal. In addition, walls were added to the computational domain. Previously, simulations had been performed assuming a pressure boundary condition on the sides of the domain. The walls greatly improved the stability of the simulations. The computational domain was 2m x 2.1m x 2.1m with 0.05 m thick walls in the y and z planes. Figure 1 shows the temperature field in a slice through the middle of the domain after approximately 0.5 s of simulation time. The fuel and recycled flue gas with added oxygen enter the domain through the burner on the left. The wall boundary condition can be clearly seen. Based on the results from this scoping run and others where the wall boundary condition was slightly modified, Subtask 3.2 researchers are increasing the size of the domain in the axial (e.g. x) direction to 4 m in order to capture more of the system dynamics. In Figure 1, the oxidant and fuel streams are just starting to mixing as the flow exits the computational domain. Researchers are encouraged by the stability of the simulation and the performance of the new oxy-gas table. Work will continue in the next quarter to begin production runs of the V/UQ text matrix.
Figure 1: Slice through the middle of the temperature field from a simulation of the IFRF furnace fired with ENEL TEA-C burner. Note that walls have been added as a boundary condition in the y and z directions.
7
Subtask 3.3 - Development of Oil and Gas Production Modules for CLEARuff (PI: Terry Ring)
Subtask 3.3 researchers worked with Subtask 3.1 researchers to define the oil and gas processing steps that are being used in the Uinta Basin. Drilling processes involve the use of drilling mud and various chemicals and the production of water from the well. This produced water dilutes the drilling mud and must be removed from the drilling mud before it can be reused. Oil processing uses a vapor disengagement section before it flows to a storage tank. The vapors contain a large fraction of crude natural gas which may need to be processed further. In the storage tank, any co-produced water is separated, leaving the oil to be transported to a gathering plant. Gas processing uses a liquid knock out drum where natural gas liquids are removed. If the gas contains a large amount of carbon dioxide or hydrogen disulfide, further separation processes are necessary before it can be pipelined. Typically amine absorption is used for carbon dioxide and a Clauss unit is used for hydrogen disulfide removal.
Subtask 3.4 - V/UQ Analysis of Basin Scale CLEARuff Assessment Tool (PI: Jennifer Spinti)
The Subtask 3.4 team updated and refined the original CLEARuff model to make it moreunderstandable and easier to use. As part of this effort, a tutorial was prepared and given by Dr. Donatella Pasqualini to the University of Utah group that visited LANL in June. Team members also helped with analysis of the DOGM database (see summary in Subtask 3.1) and data/information collection for modeling the oil and gas production processes. Figure 2 shows the monthly counts of producing gas and oil wells in Uintah County for the period from 1993-2010. Because the objective of the project is to perform validation/uncertainty quantification on model outputs such as number of jobs created and increased tax revenues for a period of rapidly increasing production, the Project Team has selected the period from 2003-2010 as the target time period.
8

Apr1993
Jan1996
Jan1998
Jan2000
Jan2002
Jan2004
Jan2006
Jan2008
Jan2010
01000
2000
3000
4000
5000
Count of Producing Gas Wells in Uinta County (Monthly)
Date
Count
●●●●●●●
●●●●●●●●●●●●●●●●●●●●
●●●●●●●●●●●●●●●●●●●●
●●●●●●●●●●●●
●●●●●●●●●●●●●
●●●●●●●●●●●●
●●●●●●●●●
●●●●●●●●●●●●●
●●●●●●
●●●●●●●
●●●●●●
●●●●●●●●●●●●●●●●●
●●●●●●●●●●●●●●●●●●●●●●●●
●●●●●●●●
●●
●●●
●●●●●●●●●●●●
●●●●●●●●●●●●●●●●●●●●●●●
Apr1993
Jan1996
Jan1998
Jan2000
Jan2002
Jan2004
Jan2006
Jan2008
Jan2010
0200
400
600
800
1000
Count of Producing Oil Wells in Uintah County (Monthly)
Date
Count
●●
●●●●●●●●●●●●●●
●●●●●●●●●●●●●●
●●●●●●●●●●●●●●●●●●●●●●●●●●●●●●
●●●●●●●●●●●●●●●●●
●●●●●●●●●●
●●●●●●●●●●●●●
●●●●●●●●●
●●●●●●●●●●
●●●●●●●●●●●●
●●●●●●●●●●●●
●●●●●●●●●●
●●●●●●
●●●●●●
●●●●●●●●●●●●
●●
●●●●●●●●
●
●●
●
●●●●
●
●●●●●●●●●●●●●●●●
●●
Figure 2: Monthly counts of producing oil and gas wells in Uintah County, Utah.
9

Task 4.0 - Liquid Fuel Production by In-situ Thermal Processing of Oil Shale/Sands
Subtask 4.1 - Development of CFD-based Simulation Tools for In-situ Thermal Processing of Oil Shale/Sands (PI: Philip Smith)
In this quarter, Subtask 4.1 researchers shifted their rubblized oil shale geometry generation technique to use recently released, commercial geometry and meshing software tools. Researchers also finalized their numerical solution algorithm by incorporating an operator splitting procedure. By implementing this new algorithm into the simulations and using available high performance computing tools, the Project Team is now able to obtain a temperature history spanning multiple days. This step represents a significant increase in the Project Team’s ability to simulate the long-term thermal effects inside the rubblized oil shale bed geometry. The delivery of the topical report has been postponed by one month to include the latest results from simulation using the operator splitting solution algorithm. With these new results, the thermal history of oil shale inside the rubblized bed can be detailed.
In the previous quarterly reports, Subtask 4.1 researchers have detailed the geometry creation procedure necessary to approximate the rubblized pieces of oil shale inside a representative simulation domain. First, the representative rubblized geometry is created using the DEM simulation capabilities of the commercial software package Star-CCM+. The DEM results are exported into Gambit meshing software for efficient processing into the actual geometric representation of the rubblized oil shale bed. This geometry is then exported back to Star-CCM+ with the appropriate boundary conditions so that a computational fluid dynamics (CFD) simulation can be performed. This streamlined process for side-steps memory limitations which occur when the DEM simulation results are processed directly in Star-CCM+.
Unfortunately, Gambit is no longer commercially available, so the Project Team is transitioning their geometry procedure to the new ICEM-CFD geometry and meshing tool, which is commercially available and supported by ANSYS. This change ensures that the software tools and simulation techniques are up-to-date and available for use by their industrial partners. ICEM-CFD has exceptional capabilities and the Project Team is rapidly gaining understanding of the complexities of the tool. They have transitioned their oil shale particle generation process using the simplified geometry from Gambit to ICEM-CFD. A sample oil shale particle geometry creation process is shown in Figure 3.
10

Figure 3: Sample particle generated in ICEM-CFD.
However, during the transition process the Project Team has encountered additional complexities with interactions between this new tool set and Star-CCM+. They are currently resolving these interaction problems and anticipate completing the transition process in the next quarter.
Subtask 4.1 researchers have also modified their solution algorithm to include an operator splitting procedure. With this solution technique, long-term thermal effects occurring inside the rubblized oil shale bed geometry can be efficiently simulated. Now, the temperature history of oil shale particles can be obtained on the order of days and weeks instead of minutes. This algorithm is possible because of the difference in the magnitude of time scales present in the application. The fluid convective time scales are much shorter than the fluid and solid thermal time scales. Prior to the new algorithm, the maximum overall time step was limited by the time stepping requirements of the smaller, fluid convective time scales, which were on the order of a second or a fraction of a second for the CFD simulation to remain stable. However, as shown in previous quarterly reports, once the simulation achieves a statistically steady state, the effects of convective fluid currents decrease and the thermal conductive effects, present in both fluid and solid phases, dominate.
Until recently, the Project Team has employed the traditional iterative solution algorithm shown in Figure 4. The solution for both smaller and larger times scales is advanced concurrently, thus restricting the maximum allowable time step required for the simulation to remain stable. For each time step, the fluid continuity and momentum equations are solved first, followed by the solution of the fluid energy and solid energy equations. Only then is the time step advanced.
11
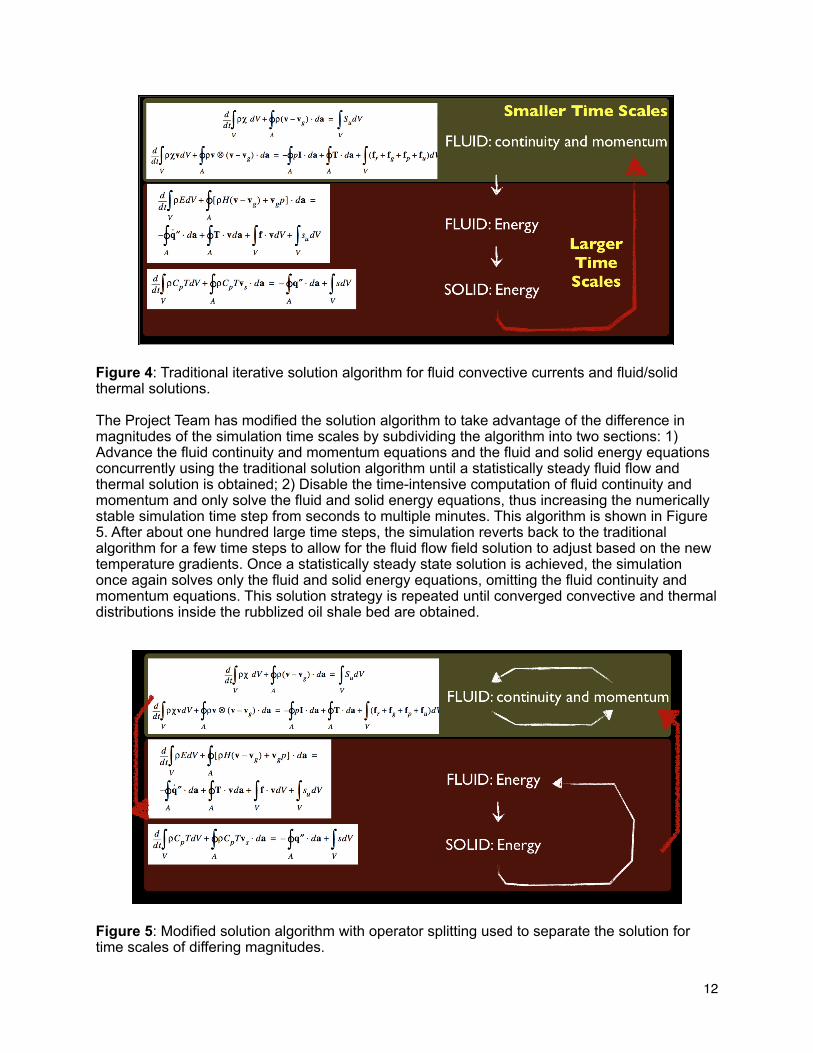
Figure 4: Traditional iterative solution algorithm for fluid convective currents and fluid/solid thermal solutions.
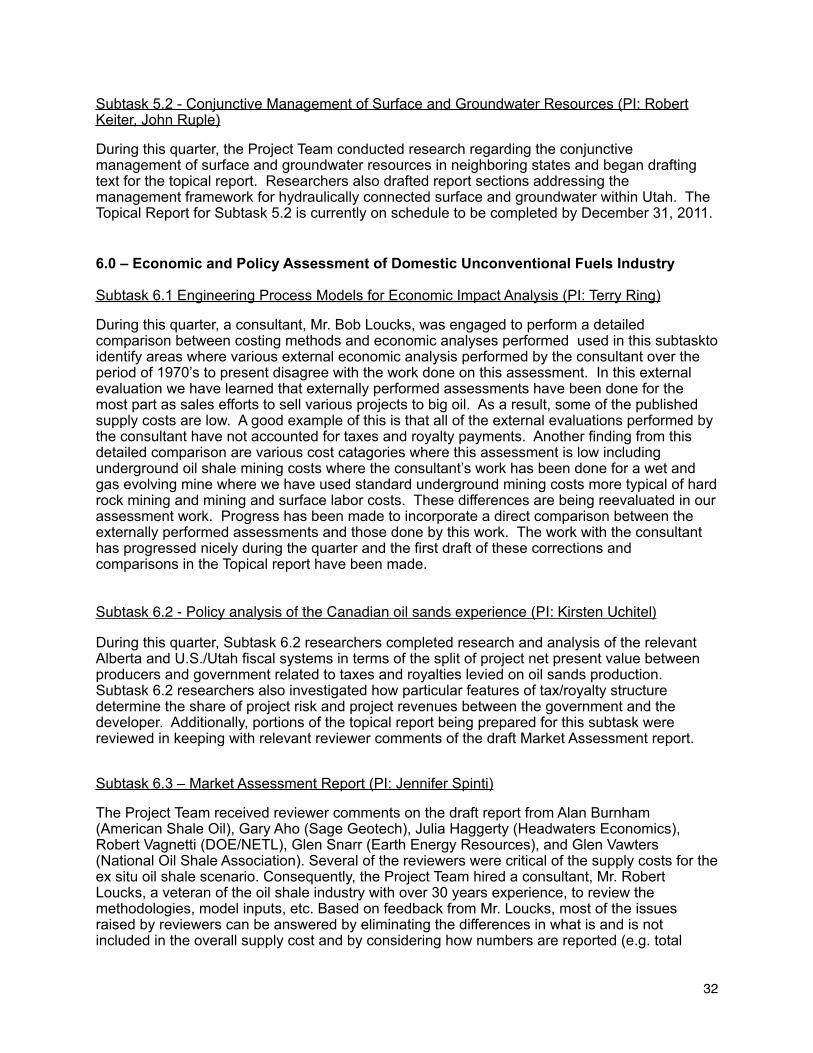
The Project Team has modified the solution algorithm to take advantage of the difference in magnitudes of the simulation time scales by subdividing the algorithm into two sections: 1) Advance the fluid continuity and momentum equations and the fluid and solid energy equations concurrently using the traditional solution algorithm until a statistically steady fluid flow and thermal solution is obtained; 2) Disable the time-intensive computation of fluid continuity and momentum and only solve the fluid and solid energy equations, thus increasing the numerically stable simulation time step from seconds to multiple minutes. This algorithm is shown in Figure 5. After about one hundred large time steps, the simulation reverts back to the traditional algorithm for a few time steps to allow for the fluid flow field solution to adjust based on the new temperature gradients. Once a statistically steady state solution is achieved, the simulation once again solves only the fluid and solid energy equations, omitting the fluid continuity and momentum equations. This solution strategy is repeated until converged convective and thermal distributions inside the rubblized oil shale bed are obtained.
Figure 5: Modified solution algorithm with operator splitting used to separate the solution for time scales of differing magnitudes.
12

Preliminary simulation results at 0.5 seconds, 83 seconds, 183 seconds, 14,998.5 seconds, and 112,500 seconds are shown in Figure 6. For the first 83 seconds, the traditional iterative solution algorithm with a time step of 0.5 seconds was used to initialize the convective and thermal fields. After 83 seconds, only the solution for the fluid and solid energy equations was advanced with a time step of 100 seconds. At a simulation time of about 14,900 seconds, the simulation time step was decreased to 0.5 seconds and all continuity, momentum, and energy equations were solved until a statistically steady state was achieved. At that point, only the energy equations were solved with a time step of 500 seconds, allowing the simulation solution to advance to 112,500 seconds (31 hours of simulation time). Even with a time step of 500 seconds, the large scales that occur within the computational domain were resolved, thus capturing the heat transfer within the fluid and between the fluid and solid particles. A significant increase in the temperature of the oil shale particles was also observed. Previously, it was not possible to advance the simulation to this point without using excessive computational resources. In the next quarter, Subtask 4.1 researchers plan to implement this algorithm for a larger computational domain which more closely resembles the actual rubblized oil shale bed.
(a) Solution time of 0.5 seconds.
(b) Solution time of 83 seconds.
13

(c) Solution time of 183 seconds.
(d) Solution time of 14,998.5 seconds.
(e) Solution time of 112,500 seconds.
Figure 6: Preliminary simulation results obtained using the newly implemented operator splitting algorithm.
14

Subtask 4.2 - Reservoir Simulation of Reactive Transport Processes (PI: Milind Deo)
Modeling in situ oil shale production processes is complex. Physical processes such as heat transfer, multiphase fluid flow through porous media, phase behavior, geomechanics, and chemical reactions occur simultaneously. Model geometry is difficult to define because of spatial changes in geological characteristics, which are uncertain and can have important implications. Time and length scales involved in computing solutions to differential equations vary significantly. For example, pore scale physics need to be resolved, but heating and production wells may be miles apart. To address this complexity, assumptions or approximations are made to simplify the problem, solution algorithms are improved, or computational power is increased. The balance between model complexity and computational cost must be understood. The complexity and accuracy of the model should be representative and meaningful, but the computational cost must not be excessive. Lastly, due to the complexity of the interrelated physical models and solution methods, results can be difficult to interpret. Results that match physical data are meaningless if the physics causing those results are not well understood.
In this quarter, Subtask 4.2 researchers have examined statistical techniques that can be used to expose simulation parameters where the response to variations in the parameters is significant compared to random noise. Typically numerical experiments are conducted with detailed physical models, which, based on the experimental results, are then reduced to more efficient approximations. These approximations are easier to interpret, but they give no information beyond the numerical experiment boundaries, and their accuracy is highly dependent on the parameters chosen to be analyzed. The number of experiments required grows exponentially with the number of parameters studied, and in complex simulations there can be hundreds of parameters. Also, if significant parameters are neglected in the analysis, results are questionable, especially with deterministic numerical experiments where the noise or experimental error can only be estimated. An example of this approach is demonstrated in a publication resulting from a previous phase of this research (Bauman and Deo, 2011).
In the case of oil shale process modeling, Subtask 4.2 researchers have found that results are sensitive to several possible factors, and these important factors can change as a process unfolds. Therefore, modeling tools developed to predict oil shale process behavior are difficult to generalize since the tools and their associated assumptions will probably be process dependent. A novel methodology for developing an efficient general thermal reservoir simulator is being contemplated to address these issues.
The approach begins with the mass and energy conservation equations shown in Equation 1 and Equation 2 respectively.
(Equation 1)
15

(Equation 2)
Traditionally, these equations would be discretized with some geometry and boundary conditions and solved simultaneously given additional physical constraints. For example, physical models solve for parameters like phase velocity and phase density. The solutions are iteratively calculated until some convergence criteria are achieved for each time step. With the new approach being developed, expected ranges are assigned to the parameters, and surrogate models of the form shown in Equation 3, obtained from experimental designs, replace the balance equations. The coefficients in the surrogate model result from regression or interpolation algorithms. The surrogate model in Equation 3 is linear for four single parameters but does capture synergistic and diminutive effects from interactions between parameters.
(Equation 3)
A set of these surrogate equations appropriate for ranges of input variables are created. The approximation accuracy is increased by increasing the number of surrogate equations as the variable ranges are reduced. Additional physical constraints are then applied to surrogate equations to reduce the set of possible solutions. The methodology can be compared to multivariate interpolation. Figure 7 and Figure 8 demonstrate this concept for a nonlinear function of two variables with one response. The multicolored surface is the exact function, and the light blue surfaces are the surrogate approximations. Figure 7 shows an approximation with one surface in the form of Equation 3, which covers the entire range for variables 1 and 2. The ranges for variables 1 and 2 are subdivided to create the four surrogate response surfaces shown in Figure 8, whcih approximates the original function more closely.
Benefits of this methodology include that the investigator can know which parameters contribute to the solution given simpler equations, specific values do not need to be assigned to uncertain or distributed parameters, and model application is not directly tied to constitutive relationships, making the methodology more generally applicable. Subtask 4.2 researchers will further develop this approach and apply it to time dependent complex thermal reservoir problems.
16

Figure 7: Approximation with a single response surface.
Figure 8: Approximation with four response surfaces.
Subtask 4.3 – Multiscale Thermal Processes (PI: Milind Deo, Eric Eddings)
The organic and inorganic compositions of oil shale vary from one geological environment to other. The objective of Subtask 4.3 researchers is to examine the effect of this variability in raw compositions on the pyrolysis process and on product distributions. In a previous phase of this project, Utah Geological Survey (UGS) and ICSE drilled a 4-inch diameter core (the Skyline 16 core) in order to provide fresh oil shale samples to all Institute researchers working on oil shale
17

projects. Subtask 4.3 researchers received three core samples that were 5 inches long and 1 inch in diameter for pyrolysis experiments. These core samples are from three different depths: (1) 461.1-461.7 feet, (2) 485.9-486.4 feet and (3) 548.2 -548.7 feet. All these cores are from the organic rich zone as seen in the well logs shown in Figure 9.
The quantification of the pyrolysis products requires the raw material characterization. Thermogravimetric analysis (TGA) provides organic and inorganic material present in the samples and weight percent moisture while CHNS (carbon, hydrogen, nitrogen and sulfur) analysis provides data for elemental balances before and after the pyrolysis process. The Project Team has collected uniformly mixed, powdered oil shale samples in the same section as the core samples and performed TGA and CHNS analyses in its laboratory. The three powdered samples have different appearances (Figure 10) that may be due to different amounts of organic matter.
All the TGA experiments were performed at a heating rate of 10ºC/min to a maximum temperature of 1000ºC in a nitrogen environment. The spent materials were combusted from 400ºC to 600ºC (10ºC/min) without opening the furnace chamber to measure the amount of coke generated during pyrolysis. Figures 11 to 13 show the individual thermograms for these three samples. The heat flow data and temperature are superimposed on the thermogram. Figure 14 shows the comparison of the TGA thermograms for the three powdered samples. Significant weight loss of the organic matter starts above 250ºC and continues until 500ºC. The results from TGA analysis of these three samples are summarized in Table 1. CHNS analysis was performed on all three samples and each measurement was repeated three times. Average values are shown in Table 2.
In the 100-foot interval over which these analyses were performed, the compositional variations were significant. Sample 1 contained 21.13 wt% organic matter (highest among the three samples) while sample 2 had only 7.2 wt% organic matter. The amount of the coke formed during pyrolysis corresponds to the amount of the organic material present in the sample (more coke in organic rich sample). There is no measurable amount of coke in the pyrolyzed sample 2, and this sample shows the highest mineral content (29 wt%) among the three samples. Similar trends are found in the elemental analyses. The weight percents C, H, N and S are greater in the organic rich samples than in the organic lean samples. The organic rich sample (sample 1) has 34 wt% C, 3.2 wt% H, 1.8 wt% N and 0.56 wt% S.
The Project Team’s next step is to pyrolyze the three cores will be performed and analyze the products (gas, liquid and spent shale).
18

Figure 9: Logs of the Skyline 16 well from which a full-size core was retrieved. Logs were provided by the UGS and Lauren Birgenheier of ICSE.
19

(3) 548.1-549.1 (2) 485.9-486.9
(1) 461.9- 462.9
Figure 10: Powdered shale samples used for analyses. Note the significant color variation in the samples.
Figure 11: TGA-DSC thermogram of sample 1 (461.2- 462.2 feet).
20

Figure Figure 12: TGA-DSC thermogram of sample 2 (485.9-486.9 feet).
Figure 13: TGA-DSC thermogram of sample 3 (548.2-549.2 feet).
21

Figure 14: Comparison of the TGA thermograms of the three samples.
Table 1. TGA weight loss data of the three samples.
Sample No Samples ID Mass, mg Organic % Mineral % Coke %1 461.2- 462.2 18.161 21.13 17.86 1.632 485.9-486.9 17.004 7.2 29.85 03 548.2-549.2 23.113 11.16 20.43 0.34
Table 2. Elemental analysis (CHNS) of the three samples.
Sample No. Sample ID C % H % N % S %
1 461.9-462.9 33.927 3.207 1.175 0.562
2 485.9-486.9 19.800 1.403 0.473 0.126
3 548.1-549.1 20.437 1.845 0.709 0.177
Additional research for Subtask 4.3 is being completed through a subcontract with Brigham Young University (BYU). BYU researchers used this quarter to prepare for the planned pyrolysis experiments by repairing the needed equipment. This repair process was complicated by the
22

delay in the start of the project, since the former student (James Hillier) graduated and left for a job before a new student could be trained. The new student has had to do a lot of studying and testing before experiments can be performed on kerogen. Hillier’s dissertation (Hillier, 2010) is being used as the model for all experimental procedures and data reduction techniques.
Repairs were made on the mass spectrometer, which had a broken turbo vacuum motor and a faulty heater. The turbo vacuum motor was fixed relatively quickly and the Project Team is currently awaiting delivery of the heater to fully repair the mass spectrometer. The kerogen retort was repaired by replacing a relay and fixing a slight programming error. BYU researchers received a kerogen sample from Subtask 4.9 (Skyline 16 core). An ASTM ash test was performed to determine the ash content of the sample. This test indicated that the sample contained 70% ash on an as received basis. The ash test was repeated, and results agreed to within 0.3%. This ash was then examined using SEM/EDAX, as shown in Figure 15. These data show high amounts of calcium, along with fluorine and oxygen. The Subtask 4.9 team made some changes to the demineralization procedure and then sent some additional kerogen samples for analysis. Two of the samples contained 29% ash, and the third contained 65% ash. Time has been scheduled on the SEM/EDAX machine to analyze the composition.
Oil shale pyrolysis experiments were initiated on the high pressure TGA in helium. Crushed and sieved 10-mg samples of oil shale are heated to 850°C at heating rates of 1K/min, 5K/min, and 10K/min. Pyrolysis experiments were performed at both 40 bar and atmospheric pressure for all three heating rates, and the results are currently being analyzed.
Subtask 4.4 - Effect of Oil Shale Processing on Water Compositions (PI: Milind Deo)
This project has been completed.
Subtask 4.5 - In Situ Pore Physics (PI: Jan Miller, Chen-Luh Lin)
Subtask 4.5 researchers have examined pore scale transport processes in the pyrolysis of oil sand and oil shale using 3D multiscale X-ray computed tomography (CT) analysis coupled with Lattice Boltzmann (LB) simulation. Future research will identify critical fundamental factors of pore geometry and structure which limit recovery of hydrocarbons from oil sands and oil shale. During this quarter, the Project Team implemented an MPI version of the single component multiphase flow He-Chen-Zhang LB model (He et al., 1999) and optimized codes, resulting in an increase in computational speed by a factor of 5. Team members also received kerogen samples extracted from the Skyline 16 oil shale core from Subtask 4.9 researchers. This sample will be used for calibration in subsequent X-ray CT scans. Finally, a CT image has been provided to Subtask 4.2 researchers for simulation of thermal stress and for failure analysis.
In the next quarter, the Project Team will analyze Skyline 16 oil shale core and compare results with results obtained from Green River oil shale samples in Phase I. Team members will also perform calibration for phase identification with results from QEM/SCAN. The directional (anisotropic) permeability Skyline 16 oil shale samples after pyrolysis at different temperatures will be determined based on pore network structure by X-ray CT analysis coupled with LB simulation.
23

Figure 15: SEM/EDAX of the ash from the first set of demineralized kerogen received from the University of Utah.
24

Subtask 4.6 - Atomistic Modeling of Oil Shale Kerogens and Oil Sand Asphaltenes (PI: Ronald Pugmire)
In this quarter, Subtask 4.6 researchers modeled the stacking arrangement of the mid-continent asphaltene, starting with the previously reported single unit model, and calculated the corresponding nuclear magnetic resonance (NMR) spectra. The calculated NMR spectra were compared with experimental results available in the literature (Siskin et al., 2006). Also, the pyrolysis modeling for these models as well as for the previously obtained kerogen model was explored using the ReaxFF program (van Duin et al., 2001).
The optimized geometries for different stacks obtained from the DFT calculations are presented in Figure 16 with the corresponding binding energies (difference between energy of stack and energy of three times the single unit) reported in Table 3. From the calculations, it is clear that all three arrangements show intermolecular binding due to long range Van der Waal interactions. Of the three stacks, the inverted stack shows the largest binding energy. A comparison of the starting and the final optimized geometry of the inverted stack shows that the asphaltene units tilt in such a way that the two aromatic planes align in a near herringbone arrangement. Subtask 4.6 researchers are continuing to explore alternate starting geometries that may be more conducive to aromatic π−π stacking.
(a) (b)
(c)
Figure 16: The (a) parallel, (b) antiparallel, and (3) inverted stack of three units of mid-continent asphaltene.
25

Table 3. Total and binding energies of stacks of mid-continent asphaltene.
Stack TotalEnergy(a.u.) B.E.(eV)
ParallelStack ‐11471.637 0.5369AnAparallelStack ‐11471.634 0.4579InvertedStack ‐11471.638 0.5520
As mentioned earlier, the experimental 13C NMR spectrum for the mid-continent asphaltene is available in the literature; therefore, this spectrum can be used to evaluate the stacking arrangements. The 13C NMR spectrum for those three arrangements is shown in Figure 17. From this figure, it is clear that the calculated NMR spectra for each of the three stacks are identical once line broadening is applied and that the simulated spectra are in good agreement with the experimental spectrum. The slight deviation of the computational result from the experiment can be attributed to the fact that the calculation was done on a stack of only three units, whereas the experimental results are on the bulk sample.
Figure 17: Comparison between experimental 13C NMR spectrum and that calculated for the three mid-continent asphaltene stacks.
Using the previously optimized geometry of the single unit and these stacks of mid-continent asphaltene, the Project Team performed a MD-NVT simulation using the ReaxFF force field and program. The resulting product distributions are shown in Figure 18. All of the pyrolysis simulations show a similar trend with an increasing number of product molecules formed as the temperature is increased. Team members also performed the MD-NVT simulation of the single unit of kerogen presented in Figure 19; the trend appears to be analogous to the results obtained in the case of asphaltenes.
At the beginning of the quarter, a member of the Project Team, Dr. Anita Orendt, traveled to Argonne National Laboratory (ANL). During her visit to the lab, she completed atomic pairwise distribution function (PDF) and small angle X-ray scattering (SAXS) measurements on a kerogen sample isolated from a section of the Skyline 16 core. Team members have installed and have started to learn the software packages necessary to analyze both the SAXS and PDF
26

data, including Igor Pro with the ANL SAXS modules (Tjioe and Heller, 2007), Crysol (Svergun et al., 1995), PDFget (Qiu et al., 2004) and PDFfit (Proffen and Billinge, 1999).
(a) (b)
(c) (d)
Figure 18: Results of NVT-MD simulation of (a) single unit, (b) parallel stack, (c) anti-parallel stack and (d) inverted stack at different temperatures.
Figure 19: Results of NVT-MD simulation of single unit of kerogen at different temperatures.
Subtask 4.6 researchers are adding these new NMR and stacking results to the paper ”Ab Initio Calculation of Asphaltenes” by Badu, Pimienta, Orendt, Facelli and Pugmire. This paper will summarize the work on the six representative asphaltene structures outlined both above and in
27

the previous two quarterly reports. The manuscript will be submitted to Energy & Fuels. Once the SAXS and PDF data analysis is complete, the results will be added to the manuscript entitled “Three-Dimensional Structure of the Siskin Green River Oil Shale Kerogen Model: A Computational Study” by Pimienta, Orendt, Pugmire, Facelli, Locke, Winans, Chapman and Chupas. This manuscript will then be submitted for publication.
Subtask 4.7 - Geomechanical Reservoir State (PI: John McLennan)
Subtask 4.7 researchers have prepared machine drawings for the pressure vessel shown in Figure 20. This is a device intended to subject oil shale samples to a retorting environment with a temperature up to 1,000°F. In-situ conditions are simulated by pressures up to 1500 psig. Presuming a hydrostatically pressurized environment, the stress and pore pressure conditions might be:
True Vertical Depth (TVD) =1500 feet TVDTotal Vertical Stress, 1,500 feet x 1.04 psi/feet = 1560 psiMinimum Horizontal Stress, 1,500 feet x 0.70 psi/feet = 1050 psiMaximum Horizontal Stress, 1,500 feet x 0.85 psi/feet = 1275 psiVirgin Formation Pressure, 1,500 feet x 0.45 psi/feet = 675 psi
The confining pressure simulates the horizontal stress environment. These stresses are estimates only and the Project Team will endeavor to find more reliable values from public domain information. In addition to the horizontal stresses, a vertical actuator in the pressure vessel simulates the vertical stresses associated with the overlying material. (on the order of the 1560 psi shown above). The actuator is designed to apply up to 10,000 psi vertical stress on a 4-inch diameter sample.
These drawings were sent out for bid and pressure rating to third party fabricators. Design has been approved and the vessel is being fabricated. Supplementary components such as end caps are being designed so that they can be fabricated as well.
Additionally, Subtask 4.7 researchers are compiling background information on oil shale mechanical and thermal properties.
28

Figure 20: Some of the machine drawings that have been approved for pressure ratings and are being fabricated.
Subtask 4.8 - Developing a Predictive Geologic Model of the Green River Oil Shale, Uinta Basin (PI: Lauren Birgenheier)
Subtask 4.8 have described the recently drilled ~1000 foot thick Skyline 16 core in detail. The sedimentary log of the core is being drafted for distribution to researchers in other tasks and subtasks. X-ray fluorescence (XRF) analysis is currently being performed on the core to delineate stratigraphic changes in elemental composition, which will be used as a proxy for mineralogic composition.
Additionally, a member of the Project Team, Dr. Laura Birgenheier, performed SAXS measurements at ANL in collaboration with Dr. Anita Orendt and Dr. Ron Pugmire from Subtasks 4.6 and 4.9 respectively. Analysis was performed on both whole rock and kerogen separated samples from the Skyline 16 core, one sample from a rich interval in the Mahogany zone and other from a lean interval in the Mahogany zone. Statistical analysis and modeling of scattering curves in order to determine pore size, shape and distribution is in progress. This work in conjunction with Subtasks 4.6 and 4.9 is beyond the original scope of work but will provide a novel understanding of porosity and permeability of oil shale at the nano to angstrom scale.
29

Subtask 4.9 - Experimental Characterization of Oil Shales and Kerogens (PI: Ronald Pugmire)
This quarter, Subtask 4.9 researchers concentrated their efforts on the isolation of the kerogen and bitumen from the raw oil shale samples, following the procedure outlined by Vandergrift et al. (1980). This work was focused on the three 1-foot sections of the Skyline 16 core identified by all Task 4 researchers. These sections are identified as GR1, GR2, GR3, and are from depths of 461.93-462.93 feet, 485.90-486.94 feet, and 548.18-549.15 feet, respectively. GR1 corresponds to the region of peak organic content of the Mahogany zone (GR1) while GR2 and GR3 are from two lower sections of comparable organic content (Mahogany and upper R-6 respectively). The Project Team now has kerogen and bitumen samples from GR1 and GR2 available for analyses and is working on GR3.Subtask 4.9 researchers obtained 13C NMR data was on raw shale samples as well as on the GR1 and GR2 kerogens (labeled GR1.8 and GR2.8). Figure 21 shows the cross polarization and magic angle spinning (CP/MAS) spectra obtained on these samples. In addition to the CP/MAS, single pulse experiments were also completed. These experiments showed that the GR2 sample contained much more inorganic carbonate that the others. The NMR data can be analyzed to obtain information such as the aromatic core ring structure and size, the nature of substitution and cross linking of these cores, and the distribution of aliphatic carbons. The data obtained on GR1 and GR2 is given in the Table 4. Finally, a member of the Project Team for Subtasks 4.6 and 4.9, Dr. Anita Orendt, traveled to ANL to conduct atomic PDF and SAXS measurements not only on the GRi kerogen sample (mentioned in Subtask 4.6) but also on the raw shales. These experimental data are being used to evaluate the 3D kerogen structure based on the Siskin model obtained in a previous phase of the project (see Subtask 4.6 for details on modeling work). The SAXS data are being analyzed for the information that they provide on the pore size distribution of these materials.
Figure 21: 13C NMR CP/MAS spectra from GR1, GR2, and GR3 raw shale and isolated kerogen samples.
30

Table 4. Structural and lattice parameters for the Green River 1 and 2 kerogens (Solum et al., 1989).
Structural ParametersStructural ParametersStructural ParametersStructural ParametersStructural ParametersStructural ParametersStructural ParametersStructural ParametersStructural ParametersStructural ParametersStructural ParametersStructural ParametersStructural ParametersStructural ParametersStructural ParametersStructural ParametersStructural ParametersStructural ParametersStructural ParametersStructural ParametersStructural ParametersCompound f ff f ff f ff f f ff f ff f ff f
Gr1.8 (CP)
0.28 0.050.05 0.02 0.030.03 0.23 0.070.07 0.16 0.04 0.080.08 0.04 0.720.72 0.63 0.090.09 0.01
Gr2.8 (CP)
0.27 0.050.05 0.02 0.030.03 0.22 0.090.09 0.13 0.04 0.070.07 0.02 0.730.73 0.63 0.100.10 0.00
Lattice ParametersLattice ParametersLattice ParametersLattice ParametersLattice ParametersLattice ParametersLattice ParametersLattice ParametersLattice ParametersLattice ParametersLattice ParametersLattice ParametersLattice ParametersLattice ParametersLattice ParametersLattice ParametersLattice ParametersLattice ParametersLattice ParametersLattice ParametersLattice ParametersCompound χχ CCC σ+1σ+1σ+1 PP B.L.B.L. S.C.S.C.S.C. M.W.M.W.M.W. MM
Gr1.8 (CP)
0.1740.174 9.29.29.2 4.84.84.8 0.250.25 1.21.2 3.63.63.6 ------ ----
Gr2.8 (CP)
0.0910.091 7.47.47.4 3.73.73.7 0.090.09 0.30.3 3.43.43.4 ------ ----
Task 5.0 - Environmental, Legal, Economic and Policy Framework
Subtask 5.1 – Models for Addressing Cross-Jurisdictional Resource Management (PI: Robert Keiter, John Ruple)
Subtask 5.1 researchers, in conjunction with the University’s Digitally Integrated Geographic Information Technologies Lab (DIGIT Lab), conducted a GIS analysis of constraints on oil shale and oil sands development within Utah. The analysis maps and quantifies barriers resulting from leasing prescriptions contained in Bureau of Land Management (BLM) Resource Management Plans as well as their effect on access to and development of oil shale and oil sands bearing federal lands. Also in conjunction with the DIGIT Lab, Subtask 5.1 researchers mapped and quantified wilderness quality lands within Utah that may impact oil shale and oil sands development. Research continued on the revised policy issued by the Department of Interior (DOI) regarding management of wilderness quality public lands, as well as the relevant legislative and legal responses to the revised policy. The Project Team also reviewed settlements to lawsuits challenging DOI’s 2008 Programmatic EIS designating lands as available for application for commercial oil shale and oil sands leasing, and to DOI’s commercial oil shale leasing rule. Subtask 5.1 researchers attended open houses on revisions to the 2008 EIS that will be required under the settlement and also met with BLM and DOI officials regarding anticipated policies and actions going forward. Additional research focused on federal efforts to assist rural communities impacted by land or resource conservation. Subtask 5.1 researchers also interviewed Uintah County commissioners regarding public land management, barriers to effective management across a landscape fragmented by multiple owners, and potential paths forward.
Work began on drafting text regarding issues associated with wilderness quality land management and its implications for unconventional fuel developers. Preliminary results indicate that challenges to development associated with wilderness quality lands are significantly overshadowed by more generalized management requirements. The Topical Report for Subtask 5.1 is currently on schedule to be completed by December 31, 2011.
31
Subtask 5.2 - Conjunctive Management of Surface and Groundwater Resources (PI: Robert Keiter, John Ruple)
During this quarter, the Project Team conducted research regarding the conjunctive management of surface and groundwater resources in neighboring states and began drafting text for the topical report. Researchers also drafted report sections addressing the management framework for hydraulically connected surface and groundwater within Utah. The Topical Report for Subtask 5.2 is currently on schedule to be completed by December 31, 2011.
6.0 – Economic and Policy Assessment of Domestic Unconventional Fuels Industry
Subtask 6.1 Engineering Process Models for Economic Impact Analysis (PI: Terry Ring)
During this quarter, a consultant, Mr. Bob Loucks, was engaged to perform a detailed comparison between costing methods and economic analyses performed used in this subtaskto identify areas where various external economic analysis performed by the consultant over the period of 1970’s to present disagree with the work done on this assessment. In this external evaluation we have learned that externally performed assessments have been done for the most part as sales efforts to sell various projects to big oil. As a result, some of the published supply costs are low. A good example of this is that all of the external evaluations performed by the consultant have not accounted for taxes and royalty payments. Another finding from this detailed comparison are various cost catagories where this assessment is low including underground oil shale mining costs where the consultant’s work has been done for a wet and gas evolving mine where we have used standard underground mining costs more typical of hard rock mining and mining and surface labor costs. These differences are being reevaluated in our assessment work. Progress has been made to incorporate a direct comparison between the externally performed assessments and those done by this work. The work with the consultant has progressed nicely during the quarter and the first draft of these corrections and comparisons in the Topical report have been made.
Subtask 6.2 - Policy analysis of the Canadian oil sands experience (PI: Kirsten Uchitel)
During this quarter, Subtask 6.2 researchers completed research and analysis of the relevant Alberta and U.S./Utah fiscal systems in terms of the split of project net present value between producers and government related to taxes and royalties levied on oil sands production. Subtask 6.2 researchers also investigated how particular features of tax/royalty structure determine the share of project risk and project revenues between the government and the developer. Additionally, portions of the topical report being prepared for this subtask were reviewed in keeping with relevant reviewer comments of the draft Market Assessment report.
Subtask 6.3 – Market Assessment Report (PI: Jennifer Spinti)
The Project Team received reviewer comments on the draft report from Alan Burnham (American Shale Oil), Gary Aho (Sage Geotech), Julia Haggerty (Headwaters Economics), Robert Vagnetti (DOE/NETL), Glen Snarr (Earth Energy Resources), and Glen Vawters (National Oil Shale Association). Several of the reviewers were critical of the supply costs for the ex situ oil shale scenario. Consequently, the Project Team hired a consultant, Mr. Robert Loucks, a veteran of the oil shale industry with over 30 years experience, to review the methodologies, model inputs, etc. Based on feedback from Mr. Loucks, most of the issues raised by reviewers can be answered by eliminating the differences in what is and is not included in the overall supply cost and by considering how numbers are reported (e.g. total
32
values of the various costs for the 20 year project divided by the total production versus net present value). The draft report is being revised to address reviewer comments and will be released for a final review during the next quarter.
7.0 – Strategic Alliance Reserve
The intent of the Strategic Alliance Reserve was to fund collaborative projects with industry that built on ICSE research of the past years to move technologies closer to deployment. In the previous quarter, the Task 7.0 Project Team identified three potential collaborators. At least two of the collaborators indicated that they would contribute a substantial amount of money to the project. During this quarter. continued discussions with these two collaborators resulted in one company withdrawing its application. The remaining applicant, American Shale Oil (AMSO), met with the Project Team several times in person and over the phone to describe company objectives and to help identify which research the company was most interested in. A work statement was drafted and is presently in the final stages of editing. In the next quarter, the work statement with timelines, milestones, deliverables, and budgets will be submitted to Mr. Robert Vagnetti, the Program Manager, for approval.
CONCLUSIONS
The Clean and Secure Energy from Domestic Oil Shale and Oil Sands Resources program began work on FY2010 milestones and deliverables in this quarter. New projects include Subtasks 3.3 and 3.4 for work related to the CLEARuff model for unconventional fuels development, Subtask 4.8 that will develop a predictive geologic model of the Green RIver oil shale, and Subtask 4.9 that involves experimental characterization of oil shale and extracted kerogen from the Skyline 16 core. One FY2010 project, Subtask 5.3 “Policy and economic issues associated with using simulation to assess environmental impacts”, has yet to be initiated.
There is still work that needs to be performed in Subtasks 3.1 (Phase I), 3.2, 6.1, 6.2, and 6.3 to complete all outstanding milestones and deliverables. Researchers, particularly graduate students, from these various subtasks will not move on to Phase II work until these milestones and deliverables are completed.
33

COST STATUS
!"
!"#$%
!#
!"#$%
!$
!"#$%
!%
!"#$%
!&
!"#$%
!'
!"#$%
&$'(%)*(+,"'#+-%$*
()*)+,-./0,+)
%1%23#1
./.012/
%1%23#1
3430.54
%1%23#1
60.5.06/.
%1%23#'
6037/0368
$#$2%4$
202420767
3512$#1
7084804.6
6789()*)+,-./0,+)
"#"2#&#
6260252
"#"2#&#
2.2058.
"#"2#&#
7470154
"#"2#&%
./50868
1421$&
5450/.5
"552&'%
1450.83
:7;,-.<-,88)*
'4&2514
48503/8
'4&2514
602660348
'4&2514
60/6103.8
'4&2514
20.270328
%4%2#$1
20/2/065/
553215#
70/240858
9:#;$%+<*:;==(>+,"'#
()*)+,-./0,+)
%#42"&$
.280657
$$"2%1"
156047.
&%32&%&
602330613
%#125$3
6012/0664
&5$2$1'
......207260582
$4323'1
204230218
6789()*)+,-./0,+)
#52%&'
230.54
"$"213&
6460772
"&"253#
767078.
"442'#5
.670377
"5"2'4"
485057.
%&2"4"
4580475
:7;,-.=8>?++)*.@7A;A
%%52'45
..30483
%'$2$&'
3620344
'552&"3
604620./7
4&''
206.208.3
31%2513
203210874
$'5
702130385
?$=)$*:(
()*)+,-./0,+)
'%2&3&
4.0515
"&$2#%3
2610/22
9'#21"3
6550885
&&2315
268013.
9#'5251$
@5306/3
%542&'4
.760716
6789()*)+,-./0,+)
5"235'
360134
9"42'#$
/60612
9$423#4
580.52
#42'#&
160811
9""423''
@7304/3
"&%2%'$
66.011.
:7;,-.B,+C,8>)
"&'2$3"
6540716
"%#2'#%
23/033.
95$2&$3
2850.51
3'2%"%
2/60/16
9$1423%5
@3/0/1/
'%&24#$
5.406.5
!"#$%&&'
(&)*+&',&-$./$0#&1"#2&345&6778&)*+&345&6797&:;<6<)&=-">$0#?"*@&)@$&)A)-+&=$-?"+@&"B$-/)=C
!3
!"#$%
!1
!"#$%
!5
!"#$%
!"4
!"#$%
!""
!"#$%
!"#
!"#$%
&$'(%)*(+,"'#+-%$*
()*)+,-./0,+)
3"#2$1&
701170824
'#32%#$
.0.880..3
"%32%&"
.05.10388
"%32%&"
.04350756
"%32%&"
.0/.20/82
#%&2%%3
508//02.3
6789()*)+,-./0,+)
"312"44
3.70583
"&'21&%
606880747
$'21'$
606710224
$'21'$
6061.08/3
$'21'$
602680352
&1254'
602430/5/
:7;,-.<-,88)*
1542%1&
.01640575
31%2#33
505880/62
"1%2$"%
504/50624
"1%2$"%
50/430..8
"1%2$"%
40857015.
$4%2$&$
4075/0681
9:#;$%+<*:;==(>+,"'#
()*)+,-./0,+)
%%52%&5
7081/0123
7081/0123
7081/0123
7081/0123
7081/0123
7081/0123
6789()*)+,-./0,+)
%1254#
4330571
4330571
4330571
4330571
4330571
4330571
:7;,-.=8>?++)*.@7A;A
%512$'"
7011/0244
7011/0244
7011/0244
7011/0244
7011/0244
7011/0244
?$=)$*:(
()*)+,-./0,+)
#'#25#'
43.0231
607260128
60.430616
604640422
6014.0817
208830528
6789()*)+,-./0,+)
"#52"51
2.70312
.880/24
.7104/3
.1.0552
5660.65
5180726
:7;,-.B,+C,8>)
$5#2"#%
37/0243
6012205.4
603840/48
20836061.
202150.//
205130/.6
!"$
!"#$%
!"%
!"#$%
!"&
!"#$%
!"'
!"#$%
!"#$%
!"#$%
&$'(%)*(+,"'#+-%$*
()*)+,-./0,+)
"%'21#%
502750817
"%'21#%
507/60/31
"%'21#%
5052/0126
"$$235%
504420565
6789()*)+,-./0,+)
$'234&
607840547
$'234&
607.7024/
$'234&
607130317
$&254'
60.650/13
:7;,-.<-,88)*
"1$2
405.60474
"1$2
401250645
"1$2
4038/043.
"'52344
1081/073.
9:#;$%+<*:;==(>+,"'#
()*)+,-./0,+)
508//02.3
508//02.3
508//02.3
508//02.3
6789()*)+,-./0,+)
602430/5/
602430/5/
602430/5/
602430/5/
:7;,-.=8>?++)*.@7A;A
4075/0681
4075/0681
4075/0681
4075/0681
?$=)$*:(
()*)+,-./0,+)
6.40/2.
23704./
..80.12
51.0244
6789()*)+,-./0,+)
740185
170.68
6680665
6.40826
:7;,-.B,+C,8>)
6/70523
741085/
55805/1
12802/1
D+E."
D+E.#
!"
!#
!$
!%
!&
!'
!""
!"#
4%F4"F"".9.4'F$4F""
"F"F"".9.$F$"F""
G,A)-C8).H)I7+;C8J.!?,+;)+.9.<
KL/M.=
3F"F45.9."#F$"F45
"F"F"4.9.$F$"F"4
%F"F"4.9.'F$4F"4
3F"F"4.9.5F$4F"4
"4F"F"4.9."#F$"F"4
4%F4"F"#.9.4'F$4F"#
43F4"F"#.9.45F$4F"#
G,A)-C8).H)I7+;C8J.!?,+;)+.9.<
KL/M.==
!"$
!"%
G,A)-C8).H)I7+;C8J.!?,+;)+.9.<
KL/M.==
!3
!1
!5
!"4
"4F4"F"#.9."#F$"F"#
4"F4"F"$.9.4$F$"F"$
4%F4"F"$.9.4'F$4F"$
43F4"F"$.9.45F$4F"$
D+E.#
D+E.$
D+E.%
!"&
!"'
43F4"F"".9.45F$4F""
"4F4"F"".9."#F$"F""
4"F"F"#.9.4$F$"F"#
34

MILESTONE STATUS
ID Title/Description
Planned Completion
Date
Actual Completion
DateMilestone
Status1.0 Project Management
2.0 Technology Transfer and Outreach
Advisory board meeting Jun-12
Hold final project review meeting in format determined jointly by DOE/NETL and ICSE
Jun-13
3.0 Clean Oil Shale & Oil Sands Utilization with CO2 Management
3.1Lifecycle greenhouse gas analysis of conventional oil & gas development in the Uinta Basin
Complete modules in CLEARuff for life-cycle CO2 emissions from conventional oil & gas development in the Uinta Basin
Jun-12
3.2 Flameless oxy-gas process heaters for efficient CO2 capturePreliminary report detailing results of skeletal validation/uncertainty quantification analysis of oxy-gas combustion system
Oct-11
3.3 Development of oil & gas production modules for CLEARuff
Develop preliminary modules in CLEARuff for conventional oil & gas development & produced water management in Uinta Basin
Oct-11
3.4 V/UQ analysis of basin scale CLEARuff assessment tool
Develop a first generation methodology for doing V/UQ analysis
Oct-11
Demonstrate full functionality (integration of all modules) of V/UQ methodology for conventional oil & gas development in Uinta Basin
Apr-12
4.0 Liquid Fuel Production by In-Situ Thermal Processing of Oil Shale/Sands
4.1Development of CFD-based simulation tool for in-situ thermal processing of oil shale/sands
35

ID Title/Description
Planned Completion
Date
Actual Completion
DateMilestone
Status
Expand modeling to include reaction chemistry & study product yield as a function of operating conditions
Feb-12
4.2 Reservoir simulation of reactive transport processes
Incorporate kinetic & composition models into both commercial & new reactive transport models
Dec-11
Complete examination of pore-level change models & their impact on production processes in both commercial & new reactive transport models
Jun-12
4.3 Multiscale thermal processes
Complete thermogravimetric analyses experiments of oil shale utilizing fresh “standard” core
Sep-11
Complete core sample pyrolysis at various pressures & analyze product bulk properties & composition
Dec-11
Collection & chemical analysis of condensable pyrolysis products from demineralized kerogen
May-12
Complete model to account for heat & mass transfer effects in predicting product yields & compositions
Jun-12
4.5 In situ pore physicsComplete pore network structures & permeability calculations of Skyline 16 core (directional/anisotropic, mineral zones) for various loading conditions, pyrolysis temperatures, & heating rates
Mar-12
4.6 Atomistic modeling of oil shale kerogens & oil sand asphaltenesComplete web-based repository of 3D models of Uinta Basin kerogens, asphaltenes, & complete systems (organic & inorganic materials)
Dec-11
4.7 Geomechanical reservoir stateComplete high-pressure, high-temperature vessel & ancillary flow system design & fabrication
Sep-11
Complete experimental matrix Feb-12 Complete thermophysical & geomechanical property data analysis & validation Apr-12
36

ID Title/Description
Planned Completion
Date
Actual Completion
DateMilestone
Status
4.8 Developing a predictive geologic model of the Green River oil shale, Uinta BasinDetailed sedimentologic & stratigraphic analysis of three cores &, if time permits, a fourth core
Dec-12
Detailed mineralogic & geochemical analysis of same cores Dec-12
4.9 Experimental characterization of oil shales & kerogens
Characterization of bitumen and kerogen samples from standard core Jan-12
Development of a structural model of kerogen & bitumen Jun-12
5.0 Environmental, legal, economic, & policy framework
5.1 Models for addressing cross-jurisdictional resource management
Identify case studies for assessment of multi-jurisdictional resource management models & evaluation of utility of models in context of oil shale & sands development
Jun-11 Completed in July 2011. Will report in Q4.
5.2 Conjunctive management of surface & groundwater resources
Complete research on conjunctive surface water & groundwater management in Utah, gaps in its regulation, & lessons that can be learned from existing conjunctive water management programs in other states
Aug-11
5.3Policy & economic issues associated with using simulation to assess environmental impacts
White paper describing existing judicial & agency approaches for estimating error in simulation methodologies used in context of environmental risk assessment and impacts analysis
Dec-12
6.0 Economic & policy assessment of domestic unconventional fuels industry
6.1 Engineering process models for economic impact analysis
Upload all models used & data collected to repository Oct-11
37

ID Title/Description
Planned Completion
Date
Actual Completion
DateMilestone
Status
7.0 Strategic Alliance Reserve
Conduct initial screening of proposed Strategic Alliance applications Mar-11 Mar-11
Complete review and selection of Strategic Alliance applications Jun-11
Implement new Strategic Alliance research tasks Sep-11
NOTEWORTHY ACCOMPLISHMENTS
The pressure vessel being built for Subtask 4.7 is an exceptional facility that will have multiple uses for fuels ranging from oil shale to coal.
Five abstracts were submitted to the 31st Oil Shale Symposium at Colorado School of Mines by ICSE researchers. Copies of four of these abstracts are included in Appendix B.
PROBLEMS OR DELAYS
The topical report for Subtask 3.1 detailing results of lifecycle GHG emissions from a refinery or upgrader using conventional & oxy-fuel flameless technologies will continue to be delayed while the Subtask 6.1 scenarios are finalized. The Subtask 6.1 milestone (to upload all models and data collected to the repository) and the deliverable (to submit a final report describing process models used and a summary of parameters analyzed) were still undergoing changes in this quarter based on feedback from the consultant. The milestone and deliverable have a new completion date set for October 2011 and the management plan has been changed to reflect this change. For Subtask 3.2, the V/UQ analysis has made substantial progress this quarter due to the full time commitment of the graduate student over the summer. The project is on target to meet the revised milestone date of October 2011 for the preliminary V/UQ report. The milestone for Subtask 5.1 was due in June 2011 but was delayed one month. A full update on the completion of this milestone will be presented in the next quarterly report. FInally, due to continued refinement of the Subtask 6.1 process models, the final draft of the Market Assessment won’t be released until September 2011 with a date for final release to the public in November 2011.
RECENT AND UPCOMING PRESENTATIONS/PUBLICATIONS
J. H. Bauman and M. D. Deo. Parameter space reduction and sensitivity analysis in complex thermal subsurface production processes, Energy Fuels, 25 (2011) 251–259.
K.P. Tiwari and M. Deo. Detailed kinetic analysis of oil shale pyrolysis TGA data. AICHE Journal, 57 (2011).
38

K. P. Tiwari and M. Deo. Compositional and kinetic analysis of oil shale pyrolysis using TGA-MS. Submitted to Fuel, April 2011.
R. Keiter and J. Ruple. One source- Evolution of the policies surrounding ground & surface water management in the West. Presented at the University of Idaho Law Review’s annual symposium, April 15, 2011.
R. Keiter and J. Ruple. Clear law and murky facts: Utah’s approach to conjunctive surface and groundwater management, Idaho Law Review, 2011.
J. Ruple. Wild lands and wilderness – Implications for Utah’s unconventional fuels industry. Presented at the 2011 University of Utah Unconventional Fuels Conference, May 17, 2011.
S. H. Lau, C. L. Lin, and J. D. Miller. 3D characterization of porous and multiphase materials with high contrast and multiscale resolutions. To be presented at 4th International Workshop on Process Tomography, Chengdu, China, September, 2011.
A. Orendt, J. C. Facelli, and R. Pugmire. Atomistic modeling of oil shale kerogens and asphaltenes. Abstract submitted to the 31st Oil Shale Symposium, Colorado School of Mines, October 17-19, 2011.
A. Orendt, R. Pugmire, J. C. Facelli, and L. Birgenheier. Structural characterization of segments of a Green River oil shale core and the kerogen isolated from these segments. Abstract submitted to the 31st Oil Shale Symposium, Colorado School of Mines, October 17-19, 2011.
A. Orendt, R. Pugmire, J. C. Facelli, and L. Birgenheier. Detailed analytical data from select segments of a Green River oil shale core. Abstract submitted to the 31st Oil Shale Symposium, Colorado School of Mines, October 17-19, 2011.
T. Q. Tran, J. D. McLennan, M. Deo, and R. Okerlund. Evaluation of transport properties of in-situ processed oil shale. Abstract submitted to the 31st Oil Shale Symposium, Colorado School of Mines, October 17-19, 2011.
M. Vanden Berg and L. Birgenheier. Not all rich zones are created equal: Geologic characterization results of Green River formation core descriptions from Utah’s Uinta Basin, including the newly drilled Skyline 16 core. Abstract submitted to the 31st Oil Shale Symposium, Colorado School of Mines, October 17-19, 2011.
I. S. O. Pimienta, Badu, A. M. Orendt, J. C. Facelli, and R. J. Pugmire, ”Ab initio calculation and molecular dynamics simulation of asphaltenes.” Submission to Energy & Fuels.
I. S. O. Pimienta, A. M. Orendt, R. J. Pugmire, J. C. Facelli , D. R. Locke, R. E. Winans, K. W. Chapman, and P. J. Chupas, “Three-dimensional structure of the Siskin Green River oil shale kerogen model: A computational study.” Publication of manuscript has been delayed pending acquisition of experimental data.
REFERENCES
Bauman, J. and Deo, M. (2011). Parameter space reduction and sensitivity analysis in complex subsurface production processes, Energy and Fuels, 25(1), 251-259.
Coraggio, G. & Laiola, M. (2009). Combustion of NG and pulverized coal in a mixture of oxygen and RFG (IFRF. Doc. No F110/y/01). Pisa, Italy: International Flame Research Foundation.
39

He, X., Chen, S., and Zhang, R. (1999). A lattice Boltzmann scheme for incompressible multiphase flow and its applications in simulation of Rayleigh-Taylor instability, J. Comput. Phys., 152, 642-663.
Hillier, J. L. (2011). Pyrolysis kinetics and chemical structure considerations of a Green River oil shale and its derivatives. Ph.D. Dissertation, Chemical Engineering Department, Brigham Young University.
Proffen, T. and Billinge, S. J. L. (1999). J. Appl. Crystallogr, 32, 572.
Qiu, X., Thompson, J. W., and Billinge, S. J. L. (2004). J. Appl. Crystallogr. 37, 678.
Siskin, M., Kelemen, S. R., Eppig, C. P., Brown, L. D., and Afeworki, M. (2006). Asphaltene molecular structure and chemical influences on the morphology of coke produced in delayed coking, Energy & Fuels, 20, 1227-1234.
Solum, M. S., Pugmire, R. J., and Grant, D. M. (1989). Carbon-13 solid-state NMR of Argonne-premium coals, Energy and Fuels, 3(2), 187–193.\
Svergun, D., Barberato, C. and Koch, M. H. J. (1995). CRYSOL � a program to evaluate X-ray solution scattering of biological macromolecules from atomic coordinates, J. Appl. Crystallogr, 28, 768-773.
Tjioe, E. and Heller, W. T. (2007). ORNL_SAS: Versatile software for calculation of small-angle X-ray and neutron scattering intensity profiles from arbitrary structures , J. Appl. Crystallogr,40, 782-785.
Van Duin, A. C. T., Dasgupta, S., Lorant, F., and Goddard, W.A. III (2001). ReaxFF: A reactive force field for hydrocarbons, J. Phys. Chem. A, 105, 9396-9409.
Vandergrift, G. F., Winans, R. E., Scott, R. G., and Horwitz, E. P. (1980). Quantitative study of the carboxylic acids in Green River oil shale bitumen. Fuel, 59(9), 627-633.
40

APPENDIX B. Conference Agenda and Field Trip Itinerary
UNCONVENTIONAL FUELS CONFERENCEUNIVERSITY OF UTAH
2011
8:30 a.m. Welcome/opening remarks – Philip J. Smith, Director, Institute for Clean and Secure Energy, Professor, Department of Chemical Engineering, University of Utah
Session 1: Utah Regulatory and Economic Landscape for Unconventional Fuels Development
8:40 a.m. “State Permitting Process for Unconventional Fuels” – John Baza, Director, Utah Division of Oil, Gas, and Mining
9:10 a.m. “Air Quality Constraints in the Uinta Basin” - Bryce Bird, Branch Manager, Utah Division of Air Quality
9:40 a.m. – “Balancing Economic Development in the Energy Sec-tor and Quality of Life” – Spencer Eccles, Executive Director, Utah Governor’s Of!ce of Economic Development
10:10 a.m. Break; display of newly drilled Skyline 16 core
Session 2: Industrial Perspectives on Unconventional Fuel Development
10:40 a.m. “Red Leaf and the Regulatory/Commercialization Pro-cess” – Laura Nelson, Vice President, Energy and Environmental Development, Red Leaf Resources
11:10 a.m. “AMSO RD&D Lease” – Alan Burnham, Chief Technol-ogy Of!cer, American Shale Oil
11:40 a.m. “Uintah Partners, LLC. Wax Crude Upgrading Facility” – Vince Memmott, Uintah Partners
12:00 p.m. Lunch; display of newly drilled Skyline 16 core
Session 2 (continued):
1:00 p.m. “Introduction to Ene!t” - Harri Mikk, Chairman of the Board, Ene!t American Oil
1:30 p.m. “Project Transition from Technology Development to Operational Deployment” – D. Glen Snarr, President and Chief Financial Of!cer, Earth Energy Resources
AGENDA
!"#$%$&$'()*+
,-./0(/01(2.,34.(.0.456THE UNIVERSITY OF UTAH
!"
41

2:00 p.m. Break; display of newly drilled Skyline 16 core
Session 3: Planning for Unconventional Fuels Development
2:20 p.m. “Federal Oil Shale Development: Status of Bureau of Land Management Oil Shale Activities” – Mitchell Leverette, Chief, Division of Solid Minerals, Washington D.C. Of!ce, Bureau of Land Management
2:50 p.m. “Wild Lands and Wilderness - Implications for Utah’s Unconventional Fuels Industry“ – John Ruple, Research Associate, Institute for Clean and Secure Energy, University of Utah
3:20 p.m. “Unconventional Fuels Development and the Environ-ment” – Robert Bayer, President, JBR Environmental Consultants
3:50 p.m. “Energy Development on Tribal Lands” – Cameron Cuch, Vice President, Government Affairs and Corporate Development, Ute Energy, LLC
Session 4: Plenary
4:15 p.m. “Climate Change Regulation via the Back Door” – Arnold W. Reitze, Jr., Professor, S. J. Quinney College of Law, University of Utah
!"#$%$&$'()*+,-./0(/01(2.,34.(.0.456THE UNIVERSITY OF UTAH!"
42

Itinerary for 2011 Uinta Basin Field Trip Wednesday, 18 May
7:30 a.m. Meet at Department of Natural Resources, 1594 W. North Temple8:00 a.m. Leave Salt Lake City12:00 p.m. Eat lunch at Bingham Energy Research Center (BERC)12:30 p.m. Board bus at BERC1:00 p.m. Tour of oil rig & fracing operation5:00 p.m. Tour of BERC6:30 p.m. Dinner at BERC8:00 p.m. Spend the night at Springhill Suites/Holiday Inn Express
Thursday, 19 May
7:30 a.m. Continental breakfast at the hotel8:00 a.m. Leave Vernal8:15 a.m. Tour of Enshale9:15 a.m. Tour of Asphalt Ridge oil sands pit11:00 a.m. Tour of Enefit's White River Mine site12:00 p.m. Lunch at White River Mine1:30 p.m. Geology stop at Evacuation Creek2:45 p.m. Geology stop at Mahogany Outcrop4:30 p.m. Arrive in Vernal8:00 p.m. Arrive in Salt Lake City
43

APPENDIX B. Abstracts of Papers Submitted to the 31st Oil Shale Symposium
1. Evaluation of Transport Properties of In-Situ Processed Oil ShaleT. Q. Tran, J. D. McLennan, M. Deo, and R. Okerlund
In-situ extraction of usable liquid or gaseous hydrocarbon products from the kerogen in oil shale requires aggressive thermal exposure. Operationally, there are geomechanics issues associated with the in-situ processing. These include expansion associated with a heating program, potential heaving of surrounding and overlying material, modification of permeability and porosity with changes in the kerogen and mechanical deformation associated with changes in the pore-filling material and phase. With the exception of several key legacy publications and ongoing proprietary measurements the thermo-mechanical response of representative oil shales is speculative. A suite of measurements on oil shale samples is planned to delineate key mechanisms (and their evolution with time and temperature) of the transport and mechanical properties of oil shale during in-situ thermal processing. A unique high pressure-high temperature triaxial vessel is being fabricated to measure representing oil shale response under realistic in-situ pressure and stress conditions when high temperature processes are applied. The apparatus will accommodate samples up to 4 inches in diameter and 8 inches long. The geologic environment is simulated by applying the axial stress (hydraulic piston, 200 ton capacity), and radial pressure (pneumatic pressure to 1500 psi). Heating to 1000°F is accomplished by electrical clam shell heaters. Increasing temperature will also transform kerogen into liquid and gaseous products which are captured and quantified outside of the pressure vessel. Force, stress and deformation are recorded. Steady state permeability measurements will be carried out to assess the evolution or degradation of transport and mechanical properties. The experiments are anticipated to show ambient nominally elastic behavior when subjected to representative in-situ stress conditions, with increased permeability, decreased load bearing capacity and accelerated deformation with temperature and kerogen alteration. It is anticipated that post-peak deformation could be compactive or dilatant to large volumetric strains. The paper summarizes key legacy data, outlines consequences of changing transport and mechanical properties and describes the design details of this extreme triaxial testing apparatus.
2. Not All Rich Zones Are Created Equal: Geologic Characterization Results Of Green River Formation Core Descriptions From Utah’s Uinta Basin, Including the Newly Drilled Skyline 16
CoreM. D. Vanden Berg and L. P. Birgenheier
An integrated sedimentologic, stratigraphic, and geochemical study of a four-core, 24-mile transect through Utah’s Eocene Green River Formation shows that Lake Uinta evolved in three phases: 1) a freshwater rising lake phase below the Mahogany zone, 2) an anoxic deep lake phase above the base of the Mahogany zone, and 3) a hypersaline lake phase within the middle and upper R-8 zone. High-resolution (~5-10 foot spacing) elemental analysis (X-ray fluorescence) was employed to help define these lake phases and provide composition data for use in oil shale extraction development as well as other scientific experiments. The individual organic-rich (R) zones found in the Uinta Basin record changes in lake environment, resulting in very distinct sequences of oil shale that differ dramatically between each organic-rich interval. For example, the R-4 and R-5 zones in Utah are characterized by regular, ~10-foot shallowing upward cycles of organic-rich mudstones transitioning to organic-lean dolomitic intervals. This alternation significantly dilutes the available kerogen in these zones, making them less ideal for mining operations, but these zones could still be economic for in-situ technologies. Despite a common naming convention, the unique cyclical characteristics of the R-4 and R-5 zones in Utah are different from the more uniform and highly organic R-4 and R-5 zones in Colorado’s Piceance Basin. Within the Uinta Basin, the upper R-6, Mahogany zone (R-7), and lower R-8
44

interval, which records Lake Uinta’s rise to its highest level followed by a slow decline, contains a more uniform sequence of organic-rich rocks more suitable for recovery via mining and surface retort.
To better characterize the stratigraphic heterogeneity of Green River oil shale deposits in the Uinta Basin, a new core was drilled in May 2010 (Skyline 16) that captured the entire Parachute Creek member (roughly 1000 feet). During recovery, special care was taken to preserve the core, allowing for a wide variety of future research experiments to be performed on “fresh,” unaltered material. Herein, we highlight stratigraphic relationships displayed in the newly slabbed Skyline 16 core.
3. Structural Characterization of Segments of a Green River Oil Shale Core and the Kerogen Isolated from these Segments
A. Orendt, R. Pugmire, J. C. Facelli, and L. Birgenheier
A number of analyses have been completed on three one foot sections of a well-defined, well-controlled, fresh oil shale core taken from the Green River Formation in the Uinta Basin in order to characterize the chemical and geological nature of both the shale and the kerogen isolated from the oil shale. The first segment was at the peak organic content of the Mahogany zone; the second was also from the Mahogany zone but at a lower organic content; the third was of a similar organic content as the second, but from the upper R-6. In addition, these same measurements were completed on the kerogen isolated from these segments.
The analytical techniques that have been used to study the chemical structure include geological characterization including a visual analysis and X-ray fluorescence (XRF), solid state 13C NMR, small and wide angle X-ray scattering (SAXS and WAXS), atomic pairwise distribution function (PDF) measurements, and mass spectrometry (MS). Each of these experimental techniques provides distinct information as to the composition and/or structure of the sample.
The XRF was used to provide the elemental analysis of the selected samples. The solid state 13C NMR data defines key structural features, including the average aromatic cluster size, the distribution of aliphatic structures, cross linking, and the aromatic substitution patterns. The SAXS and WAXS data was analysed to provide information on the pore size distribution in the whole rock shale samples as well as in the powdered shale and kerogen. The PDF provides the atom-atom correlations in the samples as a function of distance, a reflection of the long-range order and the 3D structure.
This experimental data was applied in two manners. First, the data was used to evaluate and modify an atomistic model of kerogen that is being developed. In addition, the data obtained is being analysed to study the variation in the shale and the organic matter throughout the core.
This talk will focus on the information about the structure obtained from these chemical and geological analyses.
4. Detailed Analytical Data from Select Segments of a Green River Oil Shale CoreA. Orendt, R. Pugmire, J. C. Facelli, and L. Birgenheier
A number of different analyses have been completed on three one foot sections of a well-defined, well-controlled, fresh oil shale core taken from the Green River Formation in the Uinta Basin in order to characterize the chemical and geological nature of both the shale and the kerogen isolated from the oil shale. The first segment was at the peak organic content of the Mahogany zone; the second was also from the Mahogany zone but at a lower organic content;
45

the third was of a similar organic content as the second, but from the upper R-6. In addition, these same measurements were completed on the kerogen isolated from these segments.
The analytical techniques that have been used to study the chemical structure include geological characterization including a visual analysis and X-ray fluorescence (XRF), solid state 13C NMR, small and wide angle X-ray scattering (SAXS and WAXS), atomic pairwise distribution function (PDF) measurements, and mass spectrometry (MS). Each of these experimental techniques provides distinct information as to the composition and/or structure of the sample and will provide valuable information about the similarities and differences in both the shale and the organic matter in the different segments.
This poster will present details about the core and the experimental data obtained on the chosen segments.
46

National Energy Technology Laboratory 626 Cochrans Mill Road P.O. Box 10940 Pittsburgh, PA 15236-0940 3610 Collins Ferry Road P.O. Box 880 Morgantown, WV 26507-0880 13131 Dairy Ashford, Suite 225 Sugarland, TX 77478 1450 Queen Avenue SW Albany, OR 97321-2198 2175 University Ave. South Suite 201 Fairbanks, AK 99709 Visit the NETL website at: www.netl.doe.gov Customer Service: 1-800-553-7681