olstein current financial report
DESCRIPTION
Olstein Annual ReportTRANSCRIPT

OlsteinAll Cap Value Fund
OlsteinStrategic Opportunities Fund
The Olstein Funds
S E M I - A N N U A L R E P O R T
D E C E M B E R 3 1 , 2 0 1 4
O L S T E I N A L L C A P V A L U E F U N D
2
CON T EN T S
3 Olstein All Cap Value Fund
35 Olstein StrategicOpportunities Fund
58 Combined Notes toFinancial Statements
70 Additional Information

O L S T E I N A L L C A P V A L U E F U N D
3
O L S T E I N A L L CA P VA LU E F UND
4 Letter to Shareholders
19 Expense Example
21 Schedule of Investments
28 Statement of Assetsand Liabilities
30 Statement of Operations
31 Statements of Changesin Net Assets
32 Financial Highlights
O L S T E I N A L L C A P V A L U E F U N D

4
O L S T E I N A L L CA P VA LU E F UNDLetter to Shareholders
D E A R F E L L O W S H A R E H O L D E R S :
For the year ended December 31, 2014, Class C shares of the Olstein All CapValue Fund appreciated 15.03% compared to total returns of 13.69% and12.56% for the S&P 500® Index and the Russell 3000® Index, respectively.For the six-month reporting period ended December 31, 2014, Class C sharesof the Olstein All Cap Value Fund returned 9.81% compared to total returnsof 6.12% for the S&P 500® Index and 5.25% for the Russell 3000® Index.Since the Fund’s inception date of September 21, 1995 thru December 31,2014 (19 plus years), the Fund has appreciated at an annualized rate of 11.09%compared to 8.78% and 8.86% for the S&P 500® Index and the Russell 3000®Index, respectively.
M A R K E T O U T L O O K
The calm that prevailed in U.S. equity markets for most of the past threeyears was disrupted by an increase in market volatility during the second halfof 2014, as many investors reacted negatively to the planned end of the Fed’sasset purchase program known as quantitative easing and to rapidly falling oilprices. While there are always forecasters predicting the next stock marketdownturn, we believe it is important for investors to weather market eventsand periods of short term volatility by favoring the equities of financiallystrong companies with stable or growing free cash flow, run by managementsthat have a demonstrated history of deploying that cash to the benefit ofshareholders. The Fund’s analysts and portfolio managers have approximately100 years of combined stock market research experience but have yet to iden-
O L S T E I N A L L C A P V A L U E F U N D
The performance data quoted represents past performance and does not guaranteefuture results. The Olstein All Cap Value Fund’s Class C average annual return forthe one-year, five-year, and ten-year periods ended 12/31/2014, assuming reinvest-ment of dividends and capital gain distributions and deduction of the Olstein All CapValue Fund’s maximum CDSC of 1% during the one-year period, was 14.03%,15.00%, and 5.81%, respectively. Per the Fund’s prospectus dated 10/31/14, theexpense ratio for the Olstein All Cap Value Fund Class C was 2.28%. Performanceand expense ratios for other share classes will vary due to differences in sales chargestructure and class expenses. The investment return and principal value of an invest-ment will fluctuate so that an investor’s shares, when redeemed, may be worth moreor less than their original cost. Current performance may be lower or higher than per-formance quoted. To obtain performance data current to the most recent month endplease go to our website at www.olsteinfunds.com.

5
tify any individual or company who can accurately forecast and time over allmarket moves with enough degree of regularity to profit therefrom. Ponce deLeon probably had a better chance of discovering the Fountain of Youth.
While investors, the press, market pundits, etc. may be nervous about equitymarket volatility, we believe it is more productive to identify either; (1) equi-ty securities whose real economic value based on the ability to generatefuture free cash flow is, in our opinion, unrecognized by the market as a resultof short term factors; or (2) to sell equity securities that we believe whosevalue has currently been recognized by market forces.
Our method of taking advantage of market volatility is to use the downsidevolatility to purchase securities at prices selling at a material discount to our cal-culation of intrinsic value (which is based on our estimate of a company’s abilityto generate and/or grow free cash flow) and to use the upside volatility to sellsecurities in which market forces have reduced or closed our estimated valuationdiscount. Thus, our discipline often results in the Fund buying when the marketor individual stocks are declining and selling when the opposite is true.
In the current market, we are finding viable opportunities to purchase invest-ments that we believe meet our investment objectives by focusing on threecompany specific factors: (1) a commitment to maintain a strong financialposition as evidenced by a solid balance sheet; (2) an ability to generate and/orgrow future sustainable free cash flow which in our opinion is not being proper-ly valued by the market; and (3) and a management that intelligently deployscash balances and free cash flow from operations to increase returns to share-holders. We believe that companies prioritizing these factors are in a positionto compete more advantageously in all types of economic environments and asa result offers the Fund the appropriate risk/reward tolerances. In the currentmarket (as always), we are also liquidating securities which have reached priceswhere we believe the market has recognized the underlying intrinsic value ofthe company and thus no longer possesses an investment edge. If we are unableto find ideas meeting our stringent investment criteria, we sit with cash waitingto seize upon the opportunities that eventually arise. Our cash equivalent posi-tion as of December 31, 2014 was approximately 11% of the Fund’s assets. Inconclusion, we believe the Fund’s strategy as outlined above increases the prob-ability of the Fund continuing to realize its investment objectives.
O U R S T R A T E G Y
From our perspective, Wall Street’s obsessive focus on short-term concernshas increased the opportunities to identify potential investments in whichmaterial deviations develop between a company’s stock price and our esti-mate of the company’s intrinsic value. Investors reacting to the daily noiseand news and whether or not companies beat earnings estimates, which in a
O L S T E I N A L L C A P V A L U E F U N D
6
majority of the cases have little to do with long term valuations, continue tocreate favorable opportunities for the Fund to buy companies with solid bal-ance sheets and business models that generate excess cash flow at what webelieve are bargain prices. In 2015, we will continue to remain focused onindividual companies, their operations and prospects for maintaining orgrowing sustainable free cash flow which, in our opinion, are not being prop-erly valued based on current market prices.
In addition to our focus on a company’s ability to generate sustainable freecash flow, we continually emphasize the quality of a company’s earnings. Byhighlighting the quality of a company’s earnings (defined as our assessmentof the conservatism and/or economic reality of the financial statements), weseek to accomplish two objectives: (1) to identify those companies that notonly have focused their priorities on solidifying the balance sheet during theeconomic recovery but have also laid the groundwork to achieve a substan-tial strategic advantage for the eventual acceleration of economic growth;and (2) to assess the financial risk inherent in each investment opportunitybefore considering the potential for capital appreciation.
P O R T F O L I O R E V I E W
Our current portfolio consists of companies that we believe are selling at adiscount to our calculation of intrinsic value, have a sustainable competitiveadvantage, discernible balance sheet strength, a management team thatemphasizes decisions based on cost of capital calculations and deploys freecash flow to create shareholder value. We believe companies with thesecharacteristics are poised to eliminate the valuation gaps created by therecent events as economic growth accelerates.
At December 31, 2014, the Olstein All Cap Value Fund portfolio consisted of100 holdings with an average weighted market capitalization of $56.66 billion.During the six-month reporting period, the Fund initiated positions in fifteencompanies and strategically added to positions in twenty-seven companies.Over the same time period, the Fund eliminated its holdings in twenty compa-nies and strategically decreased its holdings in another thirteen companies.Positions initiated during the last six months include: DiscoveryCommunications, Dorman Products, Dover Corp., DSW Inc., First NiagaraFinancial Group, Janus Capital Group Inc., MasterCard Inc., Owens-IllinoisInc., Packaging Corporation of America, Patterson Companies, Inc., PentairLtd, Twenty-First Century Fox, Universal Health Services Inc. and TheWendy’s Company. Positions eliminated during the past six months include:3M Company, ABB Ltd, Ann Inc., Baxter International, C R Bard Inc., CareFusion Corp., Cintas Corp., Coca-Cola Co., Dentsply International, EthanAllen Interiors, Hormel Foods, International Game Technology, McDonald’s
O L S T E I N A L L C A P V A L U E F U N D

7
Corp., Newell Rubbermaid Inc., PetSmart Inc., Sysco Corp., TRW AutomotiveHoldings Corp., URS Corp., V F Corp. and Walt Disney Company.
Our LeadersThe stocks which contributed positively to performance for the six-monthreporting period include: Lowe’s Companies Inc., Ross Stores Inc., PetSmartInc., Zoetis Inc. and Bed, Bath & Beyond, Inc. At the close of the reportingperiod, the Fund continued to maintain positions in Lowe’s, Ross Stores,Bed, Bath & Beyond and Zoetis. During the reporting period, the Fundeliminated its holding in PetSmart, which was targeted by a strategic acquir-er. On December 14, 2014, PetSmart announced that it had entered intodefinitive agreement to be acquired by private equity firm BC Partners for$83 per share in cash. The Fund sold its holdings in PetSmart as the price ofthe company’s stock approached the announced acquisition price which rep-resented a substantial premium to the Fund’s average cost for PetSmart.
Our LaggardsLaggards during the six-moth reporting period include: Smith & WessonHolding Corp., NOW Inc., National Oilwell Varco Inc., Dover Corp. andExpress Inc. As of the close of the reporting period, the Fund continued tohold each of these stocks in its portfolio.
O U R T H O U G H T S O N A C T I V E M A N A G E M E N TV E R S U S S E E K I N G T O B E A V E R A G E
With the close of each calendar year, there appear a number of articles andstories in the business press comparing the average returns of active equitymanagers to passive index funds. The articles highlight the number of man-agers that underperform (the most well-known index, the S&P 500 Index®)as opposed to emphasizing the number of managers available that have out-performed over long periods of time. Inevitably, these articles come to theconclusion that since the S&P 500 Index® has outperformed a materialmajority of active equity managers, seeking to identify outperforming activeequity managers has proven to be a pointless pursuit. In fact, the articles fur-ther conclude that index investing is the only logical choice for all investorsbecause active management will eventually lead to under-performance, andinvestors do not have the capabilities to select long-term outperformingactive managers. The above conclusion is currently accepted as investmentdogma which basically says investors should accept being average. TheNobel Prize was recently given to a professor advocating the “efficient mar-ket theory” which basically says that all relevant information is in the priceof every stock, and everybody is playing with the same information deck andunable to uncover information not yet considered and included in the stock
O L S T E I N A L L C A P V A L U E F U N D
8
price. The Nobel Prize has given additional credence to the tenet that equi-ty investors should pursue passive index investing as it is virtually impossibleto discover information not yet considered as part of the stock price andthus, it is almost impossible to outperform over long time periods. The sub-tle conclusion is that passive index investing is the only correct way to go.Passive index investing advocates believe that seeking to outperform themarket over long periods of time is akin to a dog chasing its tail. Moreimportantly, recent strong inflows into index mutual funds may be the bestevidence that investors have adopted the conventional wisdom that activeinvestment management is a futile endeavor. As equity markets havebounced back from the lows experienced in March 2009, an increasing num-ber of investors have opted to invest in passive equity funds and ETFs.According to the Investment Company Institute, from January 2009 throughNovember 2014, domestic index equity mutual funds received $178.2 billionin cumulative net new cash. In contrast, actively managed domestic equitymutual funds experienced a net outflow of $600 billion.1
We could not disagree more with the supporters of the “efficient market the-ory” and the theory of passive index type investing (accepting the averages isthe only wise option for the public), as opposed to pursuing active managerswho have practiced long-term fundamental value investment disciplineswhich have demonstrated long-term market index beating investmentreturns that are likely to continue “over time” rather than “all of the time”.
Advocating mediocrity or being average is a line of thinking that we believe isdefeatist, condescending and against the basic tenets of American business phi-losophy. We grew up believing and were taught that the opportunity to breakaway from mediocrity is available to all Americans who are willing to pursue theAmerican dream through hard work and the pursuit of superior knowledge. It isa travesty that so many Wall Street intellectuals and professors at well respecteduniversities charging high tuitions are teaching their students to be average.
Influential academics backed by the press and a material number of financialadvisors rarely question the indexing theory (or “being average theory”)resulting in the rise of passive index investing to the level of accepted“investment dogma”.
A recent article by a major publication (Wall Street Journal, November 29,2014, “Stock Indexing Racks Up Another Triumphant Year”) seeking to givefurther credence to pursuing passive index investing, concluded that the num-ber of mutual funds beating the index through the first 9 months of 2014reached a new low of 7.6% compared to 38.6% over the last 25 years. In ouropinion, the above statistics strongly negates the conclusion that indexing is____________1 Investment Company Institute, 2014 Investment Company Fact Book, page 44.
O L S T E I N A L L C A P V A L U E F U N D

9
O L S T E I N A L L C A P V A L U E F U N D
the way to go. Accepting the 38.6% number quoted above or even loweringthe percentage of market beating active investors to a more quoted 25% levelgives the public more than enough choices to easily find active managers whocan enhance their financial health. Relying on the one year 7.6% statisticquoted above rather than the 25 year statistic is misleading and misguided.Rather than point out that 2014 was an anomaly over the 26 year period, thereporter reached a biased conclusion which “cut the suit to fit the cloth”. It isour opinion that the statistics presented in the aforementioned article repre-sent valuable arrows in the quiver of pursuing successful long term averagebeating active managers. The fact that so many professionals were able to out-perform the S&P 500 Index® over the past 25 years, in our opinion, refutesthe “efficient market theory” and negates the theory that investors should sur-render to being average rather than pursue average beating active managers.
We believe granting the Nobel Prize to the “efficient market theory” professorwas misplaced. Our long history of looking behind the numbers of financialstatements has made it obvious to us that the ability to perform a forensicanalysis of financial statements, which actively pursues information about acompany’s normalized ability to generate future sustainable free cash flow thatis not being currently valued in the stock price by the investing public (becauseof short-term factors or just plain misperception), is being wrongfully devaluedor cast aside by the efficient market/passive index advocates. It is doubtful thatany of these intellectuals have ever performed a forensic analysis of a company’sfinancial statements, which might indicate that a stock’s price may not be cor-rectly valuing a company’s long-term ability to produce sustainable or growingfree cash flow. To accept a value investor’s ability to uncover information notgenerally recognized by the investing public would contradict the “efficientmarket theory”. We believe in the importance of looking behind the numbersto uncover information not generally recognized by the investing public, andwe have been able to identify such information throughout our career.However, we realize that general acceptance of this capability by the press andacademics would negate the level of acceptance of the “efficient market theory”and the related conclusion that “passive index investing” is the only rationalchoice available to the investing public. In addition, perhaps efficient marketenthusiasts and passive index investing enthusiasts might recognize the flaws intheir theory, when looking at the prices that bubble stocks (especially the onesincluded in the passive index portfolios such as World Com, Enron, etc.) even-tually reached resulting in material losses to their portfolio.
Pursuing active managers with long term records of beating the averages,whose investment discipline has a reasonable probability of continuing theirlong-term above average record is a worthwhile endeavor. For example, as ofDecember 31, 2014, an investor in our Class C share at inception of the Fund(September 1995) who reinvested all dividends and capital gains and made no

10
withdrawals earned an annualized return 11.09% (after all fees) for a period ofover 19 years, compared to 8.78% annually for the S&P 500 Index® (no feescharged) over the same time period. A $1,000,000 investment in our Class Cshares over the aforementioned 19 year plus time period would have accumu-lated to almost $7.6 million, whereas a similar $1,000,000 passive investmentin the S&P 500 Index® would have approximated $5.1 million. Is there any-body who disagrees that the difference between the two amounts is material?
On the following pages, we will outline why we believe our investment disci-pline, which actively pursues a forensic analysis of financial statements touncover information about a company’s future sustainable free cash flowwhich we believe is not currently being valued correctly by the public(because of short-term factors or just misperception), can result in materialprice discounts creating investment bargains. Consistently taking advantageof those bargains can lead to long-term above-average performance. It isimportant to note that we give almost zero probability to beating the “aver-ages all of the time” and the goal should be to achieve above-average per-formance “over time”. The press picking on individual years to citeunderperformance rather than long time period is also misguided. Lookingto win all of the time is usually an impediment to winning over time.Correctly pursued and analyzed, financial statement information is availableto all investors willing to put in the time and effort and is usually pursued indifferent ways by professional value investors who have similar long-termrecords. It has been our experience over the years that a significant majority-of stocks at any point in time are not valued on the basis of all the relevantinformation available, and in fact are usually priced on the basis of what theinvestment masses believe to be true based on information that is currentlyplaced in front of their eyes via the press, investment analysts or heavilyinfluenced by the upward and downward momentum of the daily stock price.____________The performance data quoted represents past performance and does not guaranteefuture results. The Olstein All Cap Value Fund’s Class C average annual return forthe one-year, five-year, and ten-year periods ended 12/31/2014, assuming reinvest-ment of dividends and capital gain distributions and deduction of the Olstein All CapValue Fund’s maximum CDSC of 1% during the one-year period, was 14.03%,15.00%, and 5.81%, respectively. Per the Fund’s prospectus dated 10/31/14, theexpense ratio for the Olstein All Cap Value Fund Class C was 2.28%. Performanceand expense ratios for other share classes will vary due to differences in sales chargestructure and class expenses. The investment return and principal value of an invest-ment will fluctuate so that an investor’s shares, when redeemed, may be worth moreor less than their original cost. Current performance may be lower or higher than per-formance quoted. To obtain performance data current to the most recent month endplease go to our website at www.olsteinfunds.com.
O L S T E I N A L L C A P V A L U E F U N D
11
Our active investment discipline believes that long-term above averagereturns are determined by the number and severity of your investment lossesas opposed to your biggest winners. Losses take away capital and thus leavesless ammunition to launch a comeback. Thus, we focus on downside riskbefore considering upside potential. Unfortunately, the so called wisest menin the room who believe and preach passive index investing and averagereturns (I doubt they pursue average returns) as the way to succeed as anequity investor probably do not understand or take into account that thereare real companies behind each stock. These companies have balancesheets, income statements, footnotes, returns on equity, profit margins, freecash flow, divisional analysis, accounting options, etc., etc., that can be ana-lyzed and should be analyzed.
Today’s markets are dominated by traders making “market decisions” who arepredicting where stock prices will go in the short-term on the basis of elec-tronic trading algorithms or are basing their decision on short-term invest-ment news accentuated by the analysts and press (did the company beat ormiss estimates?). On the other hand, we are making “investment decisions”based on valuing companies.
We believe that the increased focus on short term stock fluctuations, whichhave little to do with long term fundamentals, is creating an additional edgefor active managers. In fact, the current obsession with predicting short termstock moves has increased the probability that long-term value investors willhave long-term above-average market returns because eventually a stock isvalued on its long term fundamentals (or its ability to generate and/or growfree cash flow). We believe it is just as important when seeking to achievelong-term above average performance to avoid or sell companies whose stockprices are fully valued and/or over valued based on its long-term ability togenerate and/or grow sustainable free cash flow.
We believe that active management, particularly as practiced by investorsfocused on identifying undervalued securities is not only a rewarding way toachieve above-average long-term investment returns, it is also critical formitigating the downside risk inherent in equity investing. Minimizinginvestment errors are the most important determinant of long term equityreturns and the ability to outperform. From the start, investors should beaware that passive investing fully exposes the investor to all market movesincluding market declines. We, as value investors, emphasize and seek toavoid permanent loss of capital since recovering from steep portfolio declinesrequires significant subsequent investment returns to overcome the loss ofcapital. For this reason, we believe in defending against a permanent loss ofcapital before considering upside potential. We are consciously aware of dif-ferences between market prices and valuations of the underlying company by
O L S T E I N A L L C A P V A L U E F U N D

12
focusing on operating fundamentals, the structure of the balance sheet andidentifying a company’s capability to generate and/or grow sustainable futureexcess free cash flow not properly valued by the market. When undervaluedinvestments are not available, we have no problem sitting with cash untildiscount opportunities develop, rather than overpaying which could result inmaterial errors. We are very disciplined on the price we pay for any compa-ny. We seek to buy companies at discounts to our calculation of intrinsicfundamental value in an attempt to mitigate the risk of incorrectly estimat-ing future cash flow and thus the ultimate value of the company.
One of our primary criticisms of passive or index investing lies with the com-position of the index itself. Using the most popular index, the S&P 500Index®, as an example, we focus on two elements of index investing thatmany passive investors are either unaware or simply overlook. First, from ourperspective as value investors, an index exposes the passive investor to arange of companies with flawed fundamentals and questionable prospects.Second, investing in an index fund can provide significant over-exposure toover-valued companies and under-exposure to undervalued companies. Whosays indexes cannot go down continuously for many years when a majority ofthe components are materially overvalued? Perhaps being average can resultin long-term absolute losses.
Regarding the first point, any list of 500 companies is bound to include a signif-icant number of companies with flawed or declining fundamentals, structuralimpairments, flawed accounting, ineffective strategies and/or poor managementteams. Most investors remember companies such as Lehman Brothers, BearStearns, Washington Mutual, Sears, Kodak, Enron, and WorldCom were, atone time, members of the S&P 500 Index®, and each of these companies even-tually suffered material long-term declines. While they were rising relative tothe market based on bad information, bad accounting, etc., the index fundsreceiving new money were forced to buy more and more as they became biggercomponents of the averages. Passive investing exposed many investors to thepoor fundamentals, secular decline, and assorted misfortunes of these compa-nies and other such companies in the index. As active managers looking tobuy good companies at a discount to their intrinsic value, we seek to separatethose companies with serious structural, financial, or secular problems fromthose undervalued companies that are simply not yet performing to their fullpotential or whose potential is not currently recognized by the market.
Regarding the second point, an index such as the S&P 500 Index® is not astatic collection of companies. Standard & Poors periodically updates thecomponents of the S&P 500 Index® in response to acquisitions or as variouscompanies shrink and grow within the index market capitalization range. Infact, over the past five years the Index has added 79 companies and removed
O L S T E I N A L L C A P V A L U E F U N D

13
77 companies – a significant number of changes to a 500 company list. It isimportant to understand what drives constituent changes to the index andwhat the changes mean for passive investors. Companies are often added tothe S&P 500 Index® after a period of remarkable, and sometimes rapid,appreciation; conversely, companies are often removed from the Index aftersubstantial declines in value. World Com and Enron are prime examples ofthis type of decision making. Furthermore, since the S&P 500 Index® is amarket-weighted index, each company’s weight in the index is linked to itsmarket capitalization. As a company’s stock price rises increasing its marketcapitalization, it represents a larger portion of the index; conversely, as acompany’s stock price falls, its represents a smaller percent of the index.Since company-specific, fundamental factors do not always drive these pricemoves, passive investors can find their portfolio overexposed to overvaluedstocks and sectors and underexposed to those undervalued companies andsectors with greater capital appreciation potential than the companies thatdominate the index. As active investors, we don’t assess a company’s poten-tial for capital appreciation based on the momentum of its stock price.Rather, we base our assessment for capital appreciation after performing aninferential analysis of a company’s financial statements. The goal is to deter-mine a company’s normalized ability to generate and/or grow future free cashflow which determines intrinsic value. We next determine whether the cur-rent stock price discount from our calculation of intrinsic value is largeenough to compensate us for taking the risk of owning and valuing the stockbased on our ability to predict future excess free cash flow.
Another of our criticisms of passive investing is rooted in the idea thatunderpins the passive approach, that is, the efficient market theory. The effi-cient market theory postulate that markets are permeated by rationalinvestors who, armed with all publicly available information, drive the pricesof company stocks to their fair valuation. From experience, we understandthat investors are not always rational participants in the market, and marketsoften undergo extended periods of inefficiency completely divorced fromfundamental company valuations (who does not remember the internet andtechnology bubble?). More importantly, from our longer term perspective asvalue investors, we realize not all market participants (rational or otherwise)treat, analyze, and react to publicly available information in the same man-ner or from the same perspective. We find that a great deal of market reac-tion to publicly available information is emotional and more often than not,motivated by short-term performance concerns. In today’s market environ-ment, the press and analysts devote too much time and focus after company’sreport quarterly or annual results on whether or not the company beat ormissed earnings estimates, rather than examining whether or not the quarter-
O L S T E I N A L L C A P V A L U E F U N D

14
ly results provided any data, information or clues which are important to thefuture valuation of the company over the next 3-5 years. Perhaps the analystwho missed the estimate should be questioned as to why the projection wasbad as opposed to putting the company on the spot. As active managers, weseek to exploit these inefficiencies and irrational behaviors by basing our buy,sell and hold decisions on company-specific fundamentals and the companyoutlook over a three- to five-year investment horizon, rather than reacting toshort-term market sentiment.
We are active managers because we believe in the logic of our accountingbased value discipline – of buying the common stocks of good businesses atmaterial discounts to our estimate of their intrinsic value. We value compa-nies based on our estimates of their ability to generate future free cash flowand our approach requires that we not only develop a thorough understand-ing of how each company’s operations generate sustainable free cash flow(know how it works) but also requires that we answer a series of questionsabout the company’s business model, its strategy, its future prospects and itsmanagement (know what you own). We assess management decisions andtheir competence by analyzing the financial statements, footnotes, andshareholder letters as opposed to interviewing management. Our biggestconcern is the downside, and we have yet in our career to be warned by man-agement to vacate or not buy a stock because of structural problems whichthey are unable to solve. The financials tend to eliminate management bias.We develop a thorough understanding of each company through a bottom-up fundamental analysis of a company’s financial statements – focusing onthe balance sheet, income statement and cash flow statement and an ongo-ing forensic analysis of looking behind the numbers of a company’s financialstatements, regulatory filings and other disclosures. We also assess the realityof the accounting assumptions and make our own necessary adjustments toplace the financials in accordance with our view of economic reality. Inaddition to the financial statements previously mentioned, we focus on acompany’s 10K, 10Q, proxy filings, annual reports, shareholder letters, foot-notes, public announcements and other regulatory filings. While the passiveinvestor would assume that all of this publicly available information hasalready been factored into the price of a company, most investors pay littleattention to detailed analysis of financial statements which is critical whenassessing a company’s intrinsic value and determining the relevant risks ofowning the stock being assessed.
The objective of our fundamental analysis is to understand the company’sbusiness model and how a company’s operations generate free cash flow. Wealso want to determine the level of ongoing investment that is required tomaintain or grow the company’s free cash flow and ultimately how much of
O L S T E I N A L L C A P V A L U E F U N D

15
the cash generated by a company’s operations will be returned to us asinvestors. A key objective of our forensic analysis is to also determine if acompany’s accounting policies and practices reflect economic reality; toidentify and make accounting adjustments that eliminate management’sreporting bias, and to identify positive or negative factors that may affectfuture free cash flow which may not be recognized by the investing public.We believe our approach provides us with the necessary knowledge to judgethe likely long-term success of a company’s strategy, the sustainability of itsperformance and the quality of its management team. We also believe ourprocess takes on added importance after the extended market run like wehave experienced over the past five years, since it affords us greater confi-dence to understand and manage the risks associated with investing in theequity securities of the companies in our portfolio.
Although we use several valuation methods to determine a company’s intrin-sic value, they are all based on free cash flow. For us, reliable valuationsrequire a thorough understanding of a company’s accounting and reportingtechniques as well as an assessment of the company’s quality of earnings. Inorder to estimate sustainable free cash flow, Olstein’s investment team under-takes an intensive, inferential analysis of the historical and current informa-tion contained in the company’s publicly disclosed financial statements andaccompanying footnotes, shareholder reports and other required disclosures.The goal is to assess a company’s quality of earnings and to alert us to posi-tive or negative factors affecting a company’s future free cash flow that mayor may not be recognized by the financial markets. Properly assessing a com-pany’s quality of earnings is important to our valuation methodology becauseit provides us with reliable estimates about future cash flow that are criticalto projecting the future value of a company; a measure of the sensitivity ofour valuations to projected and unexpected changes in future cash flow; andan ability to detect early signs as to whether or not a company’s business poli-cies and strategic direction are capable of achieving the financial objectivesnecessary to reach our calculated values. Our requirements to purchasestocks at a discount to our assessment of intrinsic value is our attempt tominimize the losses on the stocks where we are wrong with regard to ourestimate of a company’s ability to generate sustainable future excess cashflow. Unfortunately, the ability to buy at a discount only occurs when thereis some kind of negativity surrounding a company, the industry, the stockmarket or just plain misperceptions. The negativity usually requires patiencewaiting for the cloud to lift and can result in periods of underperformance.Patience is a value investor’s best friend and thus our mantra continues to be“perform over time” not “all of the time”.
O L S T E I N A L L C A P V A L U E F U N D
16
F I N A L T H O U G H T S
We will never understand the rationale of intelligent professors, financialwriters, etc., for advising the public to buy an investment product which willpurchase stocks regardless of value and in certain cases even purchase finan-cial frauds. Under passive indexing, as a stock goes up, and becomes a biggerrelative part of the portfolio, new money buys more and more adding to theovervaluation. The lack of respect for the importance of analyzing balancesheets, income statements, cash flow statements, footnotes, proxies, or assess-ing the economic reality of the accounting principles and assumptions uti-lized in the financial statements is shocking.We believe that our approach to active management, which attempts toavoid long-term impairment of capital while providing shareholders with thepotential to realize long-term capital appreciation, serves investors betterthan a passive approach to investing. Although unfavorable conditions andmisconceptions may cause short-term periods of underperformance, webelieve that by focusing on understanding a business, and its potential togenerate sustainable free cash flow and ultimately its value, we can achievethe Fund’s investment objective of long-term capital appreciation, and at thesame time give us the best probability to outperform passive investmentproducts over long-term periods. After identifying companies that meetwell-defined investment criteria, the Fund seeks to take advantage of marketvolatility and downward price movements to buy such companies at advanta-geous prices and sell or avoid companies selling at or above intrinsic values.We believe that our form of making active investment decisions based onanalyzing financial statements to determine intrinsic values has a decidedadvantage over long-term passive investing. We realize that our conclusionsgo against the pronouncements of the academic community, the press, andintellectuals, but we would like to know when the so called investmentmajority on Wall Street will ever be right over the long run. We realize thatit can be difficult taking an unpopular position with the resultant criticism itentails. To us, that is preferable to blindly accepting a majority opinion thatwe believe is wrong. We choose to accept the criticism rather than goingalong with the Wall Street mentality that it is okay to be wrong on WallStreet as long as you are not wrong alone. We value your trust and remindyou that our money is invested alongside yours.Sincerely,
Robert A. Olstein Eric HeymanChairman and Chief Investment Officer Co-Portfolio Manager
O L S T E I N A L L C A P V A L U E F U N D

17
O L S T E I N A L L C A P V A L U E F U N D
9/21/95 $10,0009/30/95 10,010
12/31/95 10,2613/31/96 10,8826/30/96 11,4629/30/96 11,713
12/31/96 12,7603/31/97 13,3276/30/97 14,6029/30/97 17,250
12/31/97 17,2053/31/98 19,8516/30/98 18,4689/30/98 15,499
12/31/98 19,7883/31/99 20,7176/30/99 25,3659/30/99 23,675
12/31/99 26,6923/31/00 28,1706/30/00 28,8999/30/00 30,596
12/31/00 30,1423/31/01 30,2076/30/01 36,1929/30/01 28,213
12/31/01 35,3403/31/02 38,2596/30/02 33,7979/30/02 25,870
12/31/02 28,5283/31/03 26,2266/30/03 31,4489/30/03 33,797
12/31/03 38,8533/31/04 40,8706/30/04 41,2979/30/04 39,043
12/31/04 43,146
3/31/05 42,6406/30/05 42,3029/30/05 43,749
12/31/05 44,3503/31/06 46,5666/30/06 44,2419/30/06 46,836
12/31/06 50,7553/31/07 51,8636/30/07 55,5369/30/07 53,029
12/31/07 49,0123/31/08 42,4476/30/08 40,1899/30/08 38,452
12/31/08 27,5453/31/09 24,7676/30/09 30,1029/30/09 35,648
12/31/09 37,74103/31/10 40,39206/30/10 35,78809/30/10 39,69512/31/10 43,84503/31/11 45,27606/30/11 45,31009/30/11 37,49712/31/11 41,9623/31/12 48,5196/30/12 45,5559/30/12 47,159
12/31/12 48,3803/31/13 54,2756/30/13 56,7869/30/13 60,379
12/31/13 65,9953/31/14 66,8676/30/14 69,1349/30/14 69,413
12/31/14 75,913Details:The performance data quoted represents past performance and does not guaranteefuture results. The Olstein All Cap Value Fund’s Class C average annual return forthe one-year, five-year, and ten-year periods ended 12/31/2014, assuming reinvest-
The following chart illustrates the growth, on a quarterly basis, of a hypotheti-cal $10,000 investment made in the Olstein All Cap Value Fund’s Class Cshare at the Olstein All Cap Value Fund’s inception date of September 21,1995. (With dividends and capital gain distributions reinvested but no deduc-tion of taxes on reinvested distributions—see important disclosures below):
Value of Shares Owned, Value of Shares Owned,If Initial Investment If Initial Investment
Date was $10,000 Date was $10,000_____________________________ _____________________________

18
O L S T E I N A L L C A P V A L U E F U N D
ment of dividends and capital gain distributions and deduction of the Olstein All CapValue Fund’s maximum CDSC of 1% during the one-year period, was 14.03%,15.00%, and 5.81%, respectively. Per the Fund’s prospectus dated 10/31/14, theexpense ratio for the Olstein All Cap Value Fund Class C was 2.28%.Performance and expense ratios for other share classes will vary due to differences insales charge structure and class expenses. The investment return and principal valueof an investment will fluctuate so that an investor’s shares, when redeemed, may beworth more or less than their original cost. Current performance may be lower orhigher than performance quoted. To obtain performance data current to the mostrecent month end please go to our website at www.olsteinfunds.com.
A current prospectus may be obtained by calling (800) 799-2113 or visiting TheOlstein Funds’ website at www.olsteinfunds.com.
The above represents opinion, and is not intended to be a forecast of future events,a guarantee of future results, or investment advice. The references to securities arenot buy or sell recommendations, but are intended to be descriptive examples of theFund’s investment philosophy and are subject to change. Do not make investmentsbased on the securities referenced.
The Olstein Funds follow a value-oriented investment approach. However, a par-ticular value stock may not increase in price as the Investment Manager anticipatesand may actually decline in price if other investors fail to recognize the stock’s valueor if a catalyst that the Investment Manager believes will increase the price of thestock does not occur or does not affect the price of the stock in the manner or to thedegree that the Investment Manager anticipated. Also, the Investment Manager’scalculation of a stock’s private market value involves estimates of future cash flowwhich may prove to be incorrect and, therefore, could result in sales of the stock atprices lower than the Fund’s original purchase price.
The S&P 500® Index is an unmanaged index created by Standard & Poor’sCorporation that includes a representative sample of 500 leading companies inleading industries of the U.S. economy and is considered to represent the U.S.stock market performance in general. The Russell 3000® Index is an unmanagedindex that measures the performance of the 3,000 largest U.S. companies based ontotal market capitalization, and represents approximately 98% of the investableU.S. Equity market. Investors cannot actually make investments in either index.
Not FDIC insured – Not bank-guaranteed – May lose value
Distributed by Olstein Capital Management, L.P. – Member FINRA

19
O L S T E I N A L L C A P V A L U E F U N D
Olstein All Cap Value FundExpense Example as of December 31, 2014 (Unaudited)
As a shareholder of the Fund, you incur two types of costs: (1) transactioncosts, including sales charges (loads) on purchase payments or contingentdeferred sales charges on redemptions, if any; and (2) ongoing costs, includ-ing management fees, distribution fees (12b-1), and other Fund expenses.This Example is intended to help you understand your ongoing costs (in dol-lars) of investing in the Fund and to compare these costs with the ongoingcosts of investing in other mutual funds. The Example is based on an invest-ment of $1,000 invested at the beginning of the period and held for theentire period, July 1, 2014 – December 31, 2014.
Actual Expenses The following table provides information about actualaccount values and actual expenses. You will be assessed fees for outgoingwire transfers, returned checks and stop payment orders at prevailing ratescharged by U.S. Bancorp Fund Services, LLC, the Fund’s transfer agent. Ifyou request that a redemption be made by a wire transfer, currently a $15 feeis charged by the Fund’s transfer agent. IRA accounts will be charged a $15annual maintenance fee and a $25 distribution fee. The following exampleincludes, but is not limited to, management fees, distribution fees, fundaccounting, custody and transfer agent fees. However, the following exampledoes not include portfolio trading commissions and related expenses. Youmay use the information in this table, together with the amount you invest-ed, to estimate the expenses that you paid over the period. Simply divideyour account value by $1,000 (for example, an $8,600 account value dividedby $1,000 = 8.6), then multiply the result by the number in the table underthe heading entitled “Expenses Paid During Period’’ to estimate the expensesyou paid on your account during this period.
Hypothetical Example for Comparison Purposes The following table alsoprovides information about hypothetical account values and hypotheticalexpenses based on the Fund’s actual expense ratio and an assumed rate ofreturn of 5% per year before expenses, which is not the Fund’s actual return.The hypothetical account values and expenses may not be used to estimatethe actual ending account balance or expenses you paid for the period. Youmay use this information to compare the ongoing costs of investing in theFund and other funds. To do so, compare this 5% hypothetical example withthe 5% hypothetical examples that appear in the shareholder reports of theother funds.
20
O L S T E I N A L L C A P V A L U E F U N D
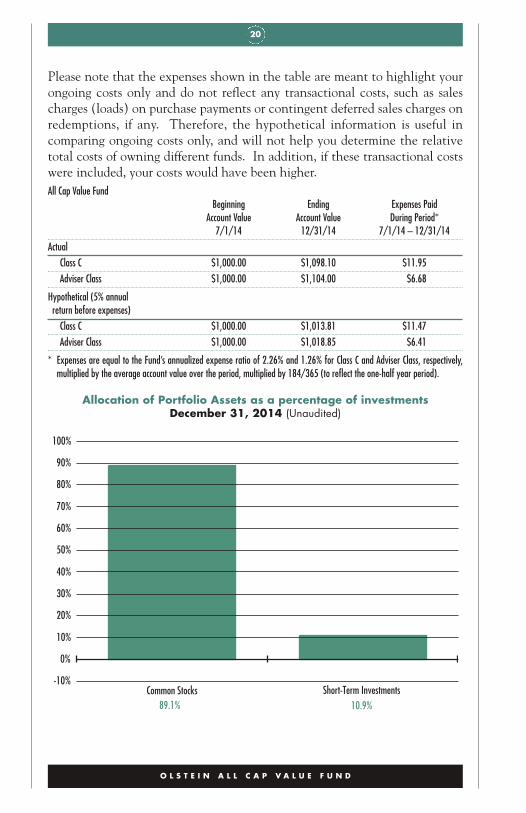
89.1% 10.9%Common Stocks Short-Term Investments
-10%
0%
10%
20%
30%
40%
50%
60%
70%
80%
90%
100%
Please note that the expenses shown in the table are meant to highlight yourongoing costs only and do not reflect any transactional costs, such as salescharges (loads) on purchase payments or contingent deferred sales charges onredemptions, if any. Therefore, the hypothetical information is useful incomparing ongoing costs only, and will not help you determine the relativetotal costs of owning different funds. In addition, if these transactional costswere included, your costs would have been higher.All Cap Value Fund
Beginning Ending Expenses PaidAccount Value Account Value During Period*
7/1/14 12/31/14 7/1/14 – 12/31/14Actual
Class C $1,000.00 $1,098.10 $11.95Adviser Class $1,000.00 $1,104.00 $6.68
Hypothetical (5% annualreturn before expenses)
Class C $1,000.00 $1,013.81 $11.47Adviser Class $1,000.00 $1,018.85 $6.41
* Expenses are equal to the Fund’s annualized expense ratio of 2.26% and 1.26% for Class C and Adviser Class, respectively,multiplied by the average account value over the period, multiplied by 184/365 (to reflect the one-half year period).
Allocation of Portfolio Assets as a percentage of investmentsDecember 31, 2014 (Unaudited)

21
The accompanying notes are an integral part of these financial statements.
O L S T E I N A L L C A P V A L U E F U N D
Olstein All Cap Value FundSchedule of Investments as of December 31, 2014 (Unaudited)
COMMON STOCKS – 88.9%AEROSPACE & DEFENSE – 2.1% Shares Value
Esterline Technologies Corporation (a) 59,000 $6,471,120
United Technologies Corporation 81,000 9,315,000
15,786,120
AIRLINES – 2.0%
Delta Air Lines, Inc. 161,000 7,919,590
Spirit Airlines, Inc. (a) 96,000 7,255,680
15,175,270
AUTO COMPONENTS – 1.8%
Delphi Automotive PLC (b) 115,000 8,362,800
Dorman Products, Inc. (a) 110,000 5,309,700
13,672,500
AUTO MANUFACTURERS – 1.2%
General Motors Company 274,000 9,565,340
BEVERAGES – 0.8%
PepsiCo, Inc. 64,000 6,051,840
BIOTECHNOLOGY – 0.3%
Charles River Laboratories International, Inc. (a) 32,000 2,036,480
BUILDING PRODUCTS – 0.8%
Masco Corporation 239,000 6,022,800
CAPITAL MARKETS – 2.3%
Janus Capital Group Inc. 490,000 7,903,700
Legg Mason, Inc. 184,000 9,820,080
17,723,780
CHEMICALS – 1.7%
E. I. du Pont de Nemours & Company 78,000 5,767,320
Sensient Technologies Corporation 126,000 7,602,840
13,370,160
COMMERCIAL BANKS – 5.1%
The Bank of New York Mellon Corporation 213,000 8,641,410

22
The accompanying notes are an integral part of these financial statements.
O L S T E I N A L L C A P V A L U E F U N D
COMMON STOCKS – 88.9% – continuedCOMMERCIAL BANKS – 5.1% – continued Shares Value
BB&T Corporation 211,000 $8,205,790
Fifth Third Bancorp 394,000 8,027,750
First Niagara Financial Group, Inc. 461,000 3,886,230
U.S. Bancorp 229,000 10,293,550
39,054,730
COMMERCIAL SERVICES & SUPPLIES – 4.3%
ABM Industries Incorporated 346,000 9,912,900
ADT Corp. 196,000 7,101,080
Avery Dennison Corporation 121,000 6,277,480
Towers Watson & Co. – Class A 84,000 9,506,280
32,797,740
COMMUNICATIONS EQUIPMENT – 1.7%
Cisco Systems, Inc. 287,000 7,982,905
QUALCOMM Incorporated 72,000 5,351,760
13,334,665
COMPUTERS & PERIPHERALS – 2.3%
Apple Inc. 69,000 7,616,220
Teradata Corporation (a) 236,000 10,308,480
17,924,700
CONSUMER FINANCE – 2.0%
American Express Company 69,000 6,419,760
Equifax Inc. 55,000 4,447,850
MasterCard, Inc. – Class A 53,000 4,566,480
15,434,090
CONTAINERS & PACKAGING – 2.8%
Owens-Illinois, Inc. (a) 160,000 4,318,400
Packaging Corporation of America 72,000 5,619,600
Rock-Tenn Company – Class A 94,000 5,732,120
Sealed Air Corporation 135,000 5,728,050
21,398,170
DIVERSIFIED FINANCIAL SERVICES – 2.9%
Franklin Resources, Inc. 201,000 11,129,370
Invesco Ltd. (b) 284,000 11,223,680
22,353,050

23
The accompanying notes are an integral part of these financial statements.
O L S T E I N A L L C A P V A L U E F U N D
COMMON STOCKS – 88.9% – continuedE-COMMERCE – 1.2% Shares Value
eBay Inc. (a) 169,000 $9,484,280
ELECTRONIC EQUIPMENT & INSTRUMENTS – 1.5%
Itron, Inc. (a) 124,000 5,243,960
TE Connectivity Ltd. (b) 105,000 6,641,250
11,885,210
ENERGY EQUIPMENT & SERVICES – 0.8%
National Oilwell Varco, Inc. 96,000 6,290,880
FOOD & DRUG RETAILERS – 0.9%
CVS Caremark Corporation 75,000 7,223,250
FOOD PRODUCTS – 0.6%
Whole Foods Market, Inc. 99,000 4,991,580
HEALTH CARE EQUIPMENT & SUPPLIES – 5.0%
Becton, Dickinson and Company 48,000 6,679,680
Intuitive Surgical, Inc. (a) 11,000 5,818,340
Medtronic, Inc. 134,000 9,674,800
Stryker Corporation 73,000 6,886,090
Zimmer Holdings, Inc. 82,000 9,300,440
38,359,350
HEALTH CARE PRODUCTS – 1.0%
Johnson & Johnson 71,000 7,424,470
HEALTH CARE PROVIDERS & SERVICES – 2.8%
Patterson Companies Inc. 122,000 5,868,200
Quest Diagnostics Inc. 59,000 3,956,540
UnitedHealth Group Incorporated 46,000 4,650,140
Universal Health Services, Inc. – Class B 62,000 6,898,120
21,373,000
HOUSEHOLD DURABLES – 1.2%
Harman International Industries, Incorporated 84,000 8,963,640
INDUSTRIAL CONGLOMERATES – 1.4%
General Electric Company 380,000 9,602,600
Teleflex Incorporated 8,000 918,560
10,521,160

24
The accompanying notes are an integral part of these financial statements.
O L S T E I N A L L C A P V A L U E F U N D
COMMON STOCKS – 88.9% – continuedINDUSTRIAL EQUIPMENT WHOLESALE – 1.1% Shares Value
WESCO International, Inc. (a) 110,000 $8,383,100
INSURANCE – 3.3%
Aon PLC (b) 86,000 8,155,380
The Chubb Corporation 51,000 5,276,970
Marsh & McLennan Companies, Inc. 108,000 6,181,920
The Travelers Companies, Inc. 56,000 5,927,600
25,541,870
MACHINERY – 5.5%
Deere & Company 42,000 3,715,740
Dover Corporation 120,000 8,606,400
Ingersoll-Rand PLC (b) 94,000 5,958,660
Parker-Hannifin Corporation 35,000 4,513,250
Pentair PLC (b) 106,000 7,040,520
Regal Beloit Corporation 108,000 8,121,600
Xylem Inc. 107,000 4,073,490
42,029,660
MEDIA – 2.9%
Comcast Corporation – Class A 184,000 10,673,840
Discovery Communications, Inc. – Class C (a) 126,000 4,248,720
Twenty-First Century Fox, Inc. – Class B 211,000 7,783,790
22,706,350
MISCELLANEOUS MANUFACTURING – 1.0%
Smith & Wesson Holding Corporation (a) 830,000 7,860,100
MULTILINE RETAIL – 3.5%
Dillard’s, Inc. – Class A 63,000 7,886,340
Kohls Corporation 160,000 9,766,400
Macy’s, Inc. 146,000 9,599,500
27,252,240
OIL & GAS – 1.6%
Exxon Mobil Corporation 63,000 5,824,350
NOW Inc. (a) 252,000 6,483,960
12,308,310

25
The accompanying notes are an integral part of these financial statements.
O L S T E I N A L L C A P V A L U E F U N D
COMMON STOCKS – 88.9% – continuedPHARMACEUTICALS – 1.8% Shares Value
Abbott Laboratories 179,000 $8,058,580
Zoetis Inc. 141,000 6,067,230
14,125,810
REAL ESTATE MANAGEMENT & DEVELOPMENT – 0.4%
Jones Lang LaSalle Incorporated 23,000 3,448,390
RESTAURANTS – 0.6%
The Wendy’s Company 480,000 4,334,400
SEMICONDUCTOR & SEMICONDUCTOR EQUIPMENT – 1.6%
Entegris, Inc. (a) 294,000 3,883,740
Intel Corporation 133,000 4,826,570
Vishay Intertechnology, Inc. 273,000 3,862,950
12,573,260
SOFTWARE – 2.1%
Microsoft Corporation 102,000 4,737,900
Oracle Corporation 251,000 11,287,470
16,025,370
SPECIALTY RETAIL – 6.6%
Bed Bath & Beyond Inc. (a) 103,000 7,845,510
Big Lots, Inc. 190,000 7,603,800
DSW Inc. – Class A 142,000 5,296,600
Express, Inc. (a) 580,000 8,520,200
Lowe’s Companies, Inc. 97,000 6,673,600
Ross Stores, Inc. 38,000 3,581,880
The TJX Companies, Inc. 56,000 3,840,480
Vitamin Shoppe, Inc. (a) 151,000 7,335,580
50,697,650
TELECOMMUNICATIONS – 3.0%
AT&T Inc. 236,000 7,927,240
Corning Incorporated 313,000 7,177,090
Verizon Communications, Inc. 168,000 7,859,040
22,963,370
TEXTILES, APPAREL & LUXURY GOODS – 2.1%
Fossil Group, Inc. (a) 59,000 6,533,660

26
The accompanying notes are an integral part of these financial statements.
O L S T E I N A L L C A P V A L U E F U N D
COMMON STOCKS – 88.9% – continuedTEXTILES, APPAREL & LUXURY GOODS – 2.1% – continued Shares Value
Ralph Lauren Corporation – Class A 31,000 $5,739,960
UniFirst Corporation 31,000 3,764,950
16,038,570
TRANSPORTATION EQUIPMENT – 1.3%
The Greenbrier Companies, Inc. 191,000 10,262,430
TOTAL COMMON STOCKS (Cost $565,474,295) 684,769,135
SHORT-TERM INVESTMENTS – 10.9%MONEY MARKET MUTUAL FUNDS (c) – 10.9%
Fidelity Institutional Money Market Portfolio – Class I, 0.07% 16,910,587 16,910,587
Invesco Short-Term Investments Trust Liquid Assets Portfolio –Institutional Shares, 0.07% 66,907,494 66,907,494
TOTAL SHORT-TERM INVESTMENTS (Cost $83,818,081) 83,818,081
TOTAL INVESTMENTS – 99.8%(Cost $649,292,376) 768,587,216
OTHER ASSETS IN EXCESS OF LIABILITIES – 0.2% 1,679,611
TOTAL NET ASSETS – 100.0% $770,266,827
(a) Non-income producing security.(b) U.S. Dollar-denominated foreign security.(c) The rate quoted is the annualized seven-day yield of the fund at period end.

27
( T H I S P A G E I N T E N T I O N A L L Y L E F T B L A N K . )
28
The accompanying notes are an integral part of these financial statements.
O L S T E I N A L L C A P V A L U E F U N D
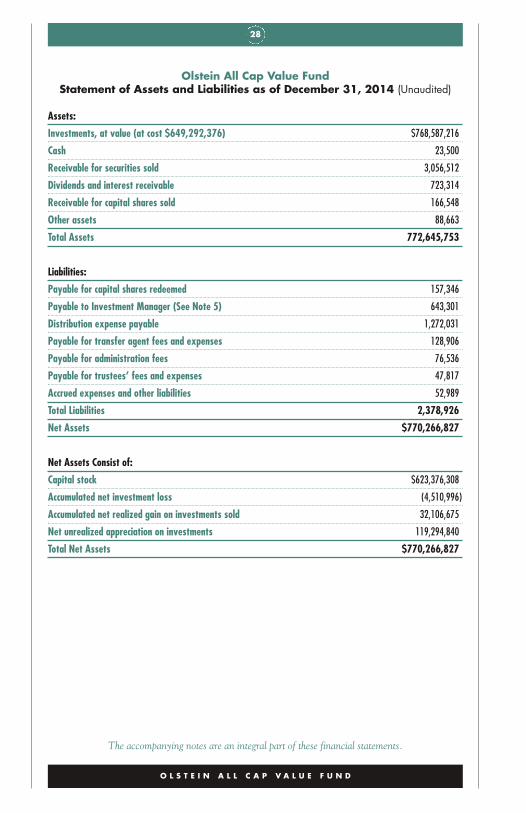
Olstein All Cap Value FundStatement of Assets and Liabilities as of December 31, 2014 (Unaudited)
Assets:
Investments, at value (at cost $649,292,376) $768,587,216
Cash 23,500
Receivable for securities sold 3,056,512
Dividends and interest receivable 723,314
Receivable for capital shares sold 166,548
Other assets 88,663
Total Assets 772,645,753
Liabilities:
Payable for capital shares redeemed 157,346
Payable to Investment Manager (See Note 5) 643,301
Distribution expense payable 1,272,031
Payable for transfer agent fees and expenses 128,906
Payable for administration fees 76,536
Payable for trustees’ fees and expenses 47,817
Accrued expenses and other liabilities 52,989
Total Liabilities 2,378,926
Net Assets $770,266,827
Net Assets Consist of:
Capital stock $623,376,308
Accumulated net investment loss (4,510,996)
Accumulated net realized gain on investments sold 32,106,675
Net unrealized appreciation on investments 119,294,840
Total Net Assets $770,266,827

29
The accompanying notes are an integral part of these financial statements.
O L S T E I N A L L C A P V A L U E F U N D
CLASS C:
Net Assets $631,515,128
Shares of beneficial interest outstanding(unlimited number of shares authorized, $0.001 par value) 29,358,312
Net asset value, offering and redemption(may be subject to contingent deferred sales charge) price per share $21.51
ADVISER CLASS:
Net Assets $138,751,699
Shares of beneficial interest outstanding(unlimited number of shares authorized, $0.001 par value) 5,562,027
Net asset value, offering and redemption price per share $24.95

30
The accompanying notes are an integral part of these financial statements.
O L S T E I N A L L C A P V A L U E F U N D
Olstein All Cap Value FundStatement of Operations
For the Six Months EndedDecember 31, 2014
(Unaudited)
Investment Income:
Dividend income $5,199,729
Interest income 14,979
Total investment income 5,214,708
Expenses:
Investment management fee (See Note 5) 3,567,654
Distribution expense – Class C (See Note 6) 3,022,785
Transfer agent fees and expenses 279,102
Administration fees 227,345
Professional fees 130,989
Trustees’ fees and expenses 92,009
Accounting costs 64,842
Federal and state registration 38,258
Custody fees 32,774
Reports to shareholders 25,736
Other 46,818
Total expenses 7,528,312
Net investment loss (2,313,604)
Realized and Unrealized Gain on Investments:
Realized gain on investments 68,220,145
Change in unrealized appreciation/depreciation on investments 1,944,070
Net realized and unrealized gain on investments 70,164,215
Net Increase in Net Assets Resulting from Operations $67,850,611

31
The accompanying notes are an integral part of these financial statements.
O L S T E I N A L L C A P V A L U E F U N D
Olstein All Cap Value FundStatements of Changes in Net Assets
For theSix Months Ended For the
December 31, 2014 Year Ended(Unaudited) June 30, 2014
Operations:
Net investment loss $(2,313,604) $(4,653,840)
Net realized gain on investments 68,220,145 113,482,390
Change in unrealized appreciation/depreciation on investments 1,944,070 18,124,411
Net increase in net assets resulting from operations 67,850,611 126,952,961
Distributions to Class C Shareholdersfrom Net Realized Gains (7,255,747) —
Distributions to Adviser Class Shareholdersfrom Net Realized Gains (1,274,358) —
Total distributions to shareholders (8,530,105) —
Net increase (decrease) in net assets resultingfrom Fund share transactions (See Note 7) 24,794,945 (33,443,833)
Total Increase in Net Assets 84,115,451 93,509,128
Net Assets:
Beginning of period 686,151,376 592,642,248
End of period $770,266,827 $686,151,376
Accumulated net investment loss $(4,510,996) $(2,197,392)

32
The accompanying notes are an integral part of these financial statements.
O L S T E I N A L L C A P V A L U E F U N D
Olstein All Cap Value FundFinancial Highlights
Class C
For theSix Months For the For the For the For the For the
Ended Year Year Year Year YearDec. 31, Ended Ended Ended Ended Ended
2014 June 30, June 30, June 30, June 30, June 30,(Unaudited) 2014 2013 2012 2011 2010
Net Asset Value –Beginning of Period $19.82 $16.28 $13.06 $12.99 $10.26 $8.63
Investment Operations:
Net investment loss(1) (0.08) (0.15) (0.10) (0.07) (0.11) (0.09)
Net realized and unrealizedgain on investments 2.02 3.69 3.32 0.14 2.84 1.72
Total from investment operations 1.94 3.54 3.22 0.07 2.73 1.63
Distributions from netrealized gain on investments (0.25) — — — — —
Net Asset Value –End of Period $21.51 $19.82 $16.28 $13.06 $12.99 $10.26
Total Return++ 9.81%* 21.74% 24.66% 0.54% 26.61% 18.89%
Ratios (to average net assets)/Supplemental Data:
Expenses 2.26%** 2.27% 2.30% 2.31% 2.29% 2.31%
Net investment loss (0.80)%** (0.84)% (0.67)% (0.59)% (0.87)% (0.82)%
Portfolio turnover rate(2) 33.07% 51.49% 44.43% 38.96% 39.28% 47.90%
Net assets at end ofperiod (000 omitted) $631,515 $587,383 $522,348 $470,528 $548,301 $488,580
++ Total returns do not reflect any deferred sales charge for Class C Shares.* Not annualized.
** Annualized.(1) Net investment loss per share represents net investment loss divided by the average shares outstanding throughout the
period.(2) Portfolio turnover is calculated on the basis of the Fund as a whole without distinguishing between the classes of shares
issued.

33
The accompanying notes are an integral part of these financial statements.
O L S T E I N A L L C A P V A L U E F U N D
Olstein All Cap Value FundFinancial Highlights
Adviser Class
For theSix Months For the For the For the For the For the
Ended Year Year Year Year YearDec. 31, Ended Ended Ended Ended Ended
2014 June 30, June 30, June 30, June 30, June 30,(Unaudited) 2014 2013 2012 2011 2010
Net Asset Value –Beginning of Period $22.83 $18.59 $14.80 $14.61 $11.45 $9.56
Investment Operations:
Net investment income (loss)(1) 0.02 0.02 0.01 0.02 (0.02) (0.01)
Net realized and unrealizedgain on investments 2.35 4.22 3.78 0.17 3.18 1.90
Total from investment operations 2.37 4.24 3.79 0.19 3.16 1.89
Distributions from net realizedgain on investments (0.25) — — — — —
Net Asset Value –End of Period $24.95 $22.83 $18.59 $14.80 $14.61 $11.45
Total Return 10.40%* 22.81% 25.61% 1.30% 27.60% 19.77%
Ratios (to average net assets)/Supplemental Data:
Expenses 1.26%** 1.34%(2) 1.55% 1.56% 1.54% 1.56%
Net investment income (loss) 0.09%** 0.09% 0.08% 0.16% (0.12)% (0.07)%
Portfolio turnover rate(3) 33.07% 51.49% 44.43% 38.96% 39.28% 47.90%
Net assets at end ofperiod (000 omitted) $138,752 $98,768 $70,294 $59,250 $65,043 $53,639
* Not annualized.** Annualized.
(1) Net investment income (loss) per share represents net investment income (loss) divided by the average shares outstandingthroughout the period.
(2) The Board voted to eliminate the 12b-1 Plan for the Adviser Class effective October 31, 2013 and the 0.25% 12b-1 feewas discontinued.
(3) Portfolio turnover is calculated on the basis of the Fund as a whole without distinguishing between the classes of sharesissued.

34
( T H I S P A G E I N T E N T I O N A L L Y L E F T B L A N K . )

OL S T E I N S T RAT EG I COP POR TUN I T I E S F UND
36 Letter to Shareholders
46 Expense Example
48 Schedule of Investments
52 Statement of Assetsand Liabilities
54 Statement of Operations
55 Statements of Changesin Net Assets
56 Financial Highlights
O L S T E I N S T R A T E G I C O P P O R T U N I T I E S F U N D
35

36
O L S T E I N S T RAT EG I COP POR TUN I T I E S F UND
Letter to Shareholders
D E A R F E L L O W S H A R E H O L D E R S :
For the year ended December 31, 2014, load-waived Class A shares of theOlstein Strategic Opportunities Fund appreciated 12.34% compared to totalreturns of 7.07% and 13.69% for the Russell 2500™ Index and the S&P500® Index, respectively. For the six-month reporting period endedDecember 31, 2014, load-waived Class A shares of the Olstein StrategicOpportunities Fund appreciated 6.77% compared to total returns of 1.06%for the Russell 2500™ Index and 6.12% for the S&P 500® Index over thesame time period.
M A R K E T O U T L O O K & S T R A T E G Y
The calm that prevailed in U.S. equity markets for most of the past threeyears was disrupted by an increase in market volatility during the second halfof 2014, as many investors reacted negatively to the planned end of the Fed’sasset purchase program known as quantitative easing, and to rapidly fallingoil prices. Yet, despite an increase in market volatility, we are continuing tofind opportunities to purchase the equity securities of what we believe to beundervalued small- to mid-sized companies meeting our stringent investmentcriteria. Although we expect the market for small- to mid-sized equities tocontinue to be somewhat volatile in the near term, we also expect strongereconomic data and improved company performance to highlight the growing
O L S T E I N S T R A T E G I C O P P O R T U N I T I E S F U N D
The performance data quoted represents past performance and does not guaranteefuture results. The Olstein Strategic Opportunities Fund Class A return as of12/31/14 for the one-year period, five-year period, and since inception (11/1/06),assuming deduction of the maximum Class A sales charge of 5.50% was 6.19%,16.87% and 8.64%, respectively. Per the Fund’s 10/31/14 prospectus, the Fund’sClass A expense ratio was 1.61%. Expense ratios for other share classes will vary.Performance for other share classes will vary due to differences in sales chargestructure and class expenses. The investment return and principal value of aninvestment will fluctuate so that an investor’s shares, when redeemed, may beworth more or less than their original cost. Current performance may be lower orhigher than performance quoted. To obtain performance data current to the mostrecent month end, please visit our website at www.olsteinfunds.com.

37
strength of the U.S. economy. As in the past, we believe a key beneficiary ofthe improved economy will be smaller companies whose revenues comemainly from the U.S. market.
With the strong market run more than five years old, many forecasters havebeen contemplating a market pullback in the near future. While there arealways forecasters predicting the next downturn, we believe it is importantfor investors to weather market events and periods of short term volatility byfavoring the equities of financially strong companies, selling at a discount toour calculations of intrinsic value based on its normalized ability to producestable or growing free cash flow and run by managements that have a demon-strated history of deploying that cash to the benefit of shareholders.
We believe the market volatility that has characterized the start of 2015 pro-vides an excellent opportunity to find viable undervalued investment oppor-tunities in small- and mid-sized companies. In our search for value, wecontinue to focus on three crucial, company-specific factors: (1) a commit-ment to maintain a strong financial position as evidenced by a solid balancesheet; (2) an ability to generate sustainable free cash flow which in our opin-ion is not yet being valued by the market, and (3) management that intelli-gently deploys cash balances and free cash flow from operations to increasereturns to shareholders.
P O R T F O L I O A N D P E R F O R M A N C E R E V I E W
At December 31, 2014, the Fund’s portfolio consisted of 49 holdings with anaverage weighted market capitalization of $3.33 billion. Throughout thereporting period ended December 31, 2014, we continued to modify theportfolio in light of the volatility in the overall market. By paying strictattention to our company valuations, we reduced or eliminated positions inwhich the discounts from our calculation of intrinsic value were no longerlarge enough to justify the size of our position. At the same time, weincreased or added new positions in what we believe to be well run, conserv-atively capitalized companies selling at a significant discount to our calcula-tion of intrinsic value.
During the reporting period, the Fund initiated positions in ten companiesand strategically added to established positions in another sixteen compa-nies. Positions initiated during the reporting period include: BlountInternational, Inc., Daktronics, Inc., DSW Inc., First Niagara FinancialGroup, Fox Factory Holding Corp., Lifetime Brands, Patterson Companies,Wabash National Corp., The Wendy’s Company, and Wesco InternationalInc. During the reporting period, the Fund eliminated its holdings in twelvecompanies and strategically reduced its holdings in another three companies.The Fund eliminated or reduced its holdings in companies that either
O L S T E I N S T R A T E G I C O P P O R T U N I T I E S F U N D

38
reached our valuation levels, or where, in our opinion, changing conditionsor new information resulted in additional risk and/or reduced appreciationpotential. We redeployed proceeds from such sales into opportunities thatwe believe offer a more favorable risk/reward profile. During the quarter, theFund eliminated its holdings in Aegion Corp., Ann Inc., Avery DennisonCorp., AVX Corp., CareFusion Corp., Charles River Laboratories, EthanAllen Interiors, International Game Technology, PetSmart, Inc., TeleflexInc., UFP Technologies and URS Corp.
As reported in our last letter to shareholders, URS Corporation andInternational Game Technology entered into merger agreements with strate-gic acquirers during the reporting period, resulting in the sale of both compa-nies from the Fund’s portfolio as the price of each company’s stock reachedour valuation. We also sold specialty retailer, Ann Inc., following a March2014 announcement of a significant private equity investor establishing amaterial position. Increased scrutiny from activist investors during thereporting period caused the company’s stock price to rise fairly rapidly to ourvaluation level. As value investors who usually have to wait patiently for acompany to improve operating results and for the market to ultimately recog-nize the value we see, these acquisitions and private equity investments notonly came as a pleasant surprise, they allowed us to reach our value in eachcompany over a much shorter holding period.
Our LeadersThe stocks which contributed positively to performance for the six-monthreporting period include: PetSmart Inc., Janus Capital Group, CareFusionCorp., Sealed Air Corp. and Patterson Companies. As of December 31, 2014,the Fund maintained positions in Janus Capital Group, Sealed Air Corp. andPatterson Companies, Inc. On December 14, 2014, PetSmart announced thatit had entered into definitive agreement to be acquired by private equity firmBC Partners for $83 per share in cash. The Fund sold its holdings in PetSmartas the price of the company’s stock approached the announced acquisitionprice representing a substantial premium to the Fund’s average cost forPetSmart. Similarly, on October 5, 2014, Becton Dickinson announced that ithad entered into a definitive agreement to acquire CareFusion for $58 pershare. The Fund sold its holdings in CareFusion as the price of the company’sstock approached the announced acquisition price representing a substantialpremium to the Fund’s average cost for the company’s stock.
Our LaggardsLaggards during the six month reporting period include: Smith & WessonHolding Corp., NOW Inc., Potbelly Corp., Aegion Inc. and Standard Motor
O L S T E I N S T R A T E G I C O P P O R T U N I T I E S F U N D

39
Products. At the close of the reporting period, the Fund continues to holdSmith & Wesson, NOW Inc., Potbelly Corp. and Standard Motor Productsin its portfolio. The Fund eliminated its position in industrial goods/infra-structure company Aegion Corp., after we lost confidence in company man-agement and its ability to effectively implement a clear, consistent strategy.We were initially attracted by the company’s prospects, approximately threeyears ago, as it transitioned from a company whose earnings were dominatedby municipal sewer servicing to being a well-rounded pipeline serviceprovider with increased exposure to energy and mining and structural andconstruction businesses. During the recent stages of this transition, however,management has continued to provide excuses for underperforming businesssegments and overall poor company performance without articulating a clearstrategy for moving forward.
R E V I E W O F A C T I V I S T H O L D I N G S
As of December 31, 2014, the Fund was invested in twelve activist situa-tions, representing approximately 28% of the Fund’s equity investments, andtwo of its top ten holdings. In general, these situations fit our definition ofan activist investment where an outside investor, usually a hedge fund, pri-vate equity investor, or Olstein Capital Management seeks to influence com-pany management to adopt strategic alternatives that we expect to unlockgreater shareholder value.
The Fund’s activist holdings as of December 31, 2014, include recreationalvehicle manufacturer, Arctic Cat, agricultural machine and equipment man-ufacturer, Blount International, department store, Dillard’s Inc., aerospaceand defense products manufacturer, Esterline Technologies Corp., specialtyapparel and accessory retailer, Express Inc., recreational vehicle suspensionproducts manufacturer, Fox Factory Holding Corp., money managementfirms, Janus Capital Group and Legg Mason Inc.; kitchenware and house-wares manufacturer, Lifetime Brands Inc., specialty eatery, Potbelly Inc., spe-cialty retailer of nutritional products, Vitamin Shoppe Inc. and fast-foodrestaurant chain, The Wendy’s Company. We continue to monitor the oper-ational progress of the companies’ as well as activist investors involved inthese situations as they work to increase shareholder value through a specificplan for improving each company’s results. While each investment is at adifferent strategic stage, we believe the actions that have been proposed orimplemented should increase shareholder value through improved future freecash flow from operations.
With each of our activist situations, one of the most important variables weconsider, especially during tough economic times, is “how long do we expectit to take for this company to improve its operations and results?” Although
O L S T E I N S T R A T E G I C O P P O R T U N I T I E S F U N D
40
we know from experience that successful turnarounds don’t happenovernight, we do expect specific improvements in operations to occur withina defined period of time (two years or less), notwithstanding the economicenvironment. Although a turnaround process may not be in full swing, if acompany has adopted what we believe is the right strategy to increase share-holder value within two years, we are willing to wait beyond two years foroperating results to start improving if we are being sufficiently rewarded forthe risk, and if our ongoing analysis of the company’s financial statementstell us the company is headed in the right direction.
O U R O U T L O O K F O R A C T I V I S T I N V E S T I N G I N 2 0 1 5
The past year proved an excellent year for the Fund, driven in great part by theFund’s activist holdings. During 2014, an extraordinary number of companiesin the Fund’s portfolio – eight companies representing approximately 20% ofthe Fund’s equity investments – were the subject of corporate actions includingactivist campaigns and takeover offers. Six of these corporate actions weretakeover offers which resulted in buyouts of portfolio companies at a significantpremium to the Fund’s average cost of each holding. Additionally, the Fund’sunique approach to value and activist investing received flattering mediarecognition in an October 14, 2014 article by Reuter’s entitled, “The MutualFund that Reads Like a Cheat Sheet for Activists.”We expect the surge in activist investing of the past two years to continueinto 2015. As the economic recovery continues to unfold in a somewhatuneven manner, we expect that equity markets should provide ample oppor-tunities to identify suitable activist situations for the Fund’s portfolio. Fourprimary reasons lie behind our expectations: (1) record amounts of liquidcash on corporate balance sheets that may represent a significant source ofuntapped value; (2) a bumpy road to more “normal” operating conditionsshould result in an increased ability to identify companies having the poten-tial to improve operating results in the not too distant future, but because ithas not yet given overt evidence of this improvement, it is not yet being val-ued according to its normalized ability to produce future free cash flow; (3)louder calls for stronger corporate governance from investors and regulatorybodies alike are likely to increase management responsiveness to sharehold-ers; and (4) a growing commitment of capital to activist strategies and funds.In fact, according to Hedge Fund Research, four prominent activist fundshad grown their assets under management by $9.4 billion during the first halfof 2014 to a total of $111 billion – gaining more during the first six monthsof 2014 than during the previous two years combined.
According to FactSet Research, corporate cash balances of non-financialcompanies in the S&P 500 Index totaled $1.37 trillion at the close of the
O L S T E I N S T R A T E G I C O P P O R T U N I T I E S F U N D

41
O L S T E I N S T R A T E G I C O P P O R T U N I T I E S F U N D
third quarter of 2014. Although this amount reflected no year-over-yeargrowth in S&P 500 corporate cash balances, it serves as a barometer of theextremely high historical cash balances that sit on many corporate balancesheets. In many cases, a high cash balance may represent an underperform-ing corporate asset that, when properly deployed, could significantly increasea company’s long-term shareholder value. In 2015, we expect these highcash balances to continue to draw the attention of activist investors seekingalternative uses for cash balances earning extremely low rates of return aswell as those activists challenging the mindset of company managementteams maintaining high cash balances from a defensive posture.
As the economy improves and markets place greater focus on company fun-damentals and operating profits, we expect to see greater emphasis on thevalue enhancement strategies we favor as an activist investor for those com-panies that temporarily lag their competitors and peers. We believe that in2015, as the recession fades into memory, activists will target those compa-nies waiting for overall economic improvement and growth to lift their for-tunes and pressure them to improve operating results. For us, a rise inoperational activism – activism that focuses on a company’s operations asopposed to financial engineering or protracted proxy battles – is a welcomedevelopment. We also expect that more companies should be receptive toadopting strategic alternatives in order to undertake much-needed turn-arounds in hopes of improving their operating results. We believe this willbe especially true for companies approached by those activists with a proventrack record of helping a company implement successful turnarounds.
From our perspective as investors who focus on small- to mid-sized compa-nies, one of the most interesting expectations for activist investing was dis-cussed in Schulte Roth & Zabel’s recent Shareholder Activism Insight report(October 2014), regarding the size of companies activist expect to target overthe next twelve to twenty-four months. The report concluded that morethan half of the U.S. activist respondents favor the $250 million to $500million market cap range while the remaining respondents are split betweenthe $500 million to $750 million range and the less than $250 million range.
Our Approach to Activist SituationsSince its launch in November 2006, the Fund has maintained a significantcommitment to activist situations with an average activist exposure of 25% oftotal equity investments since inception. The Fund’s activist exposure reacheda high of 39% of equity investments during the second quarter of 2008 and alow of 7% of equity investments during the second quarter of 2009 (as theFund committed its capital to compelling value situations created by the mar-ket lows of March 2009 in lieu of longer-term activist situations).

42
Throughout 2015, we will actively seek additional investments for the Fund’sportfolio that fit our approach to activist investing. The criteria for ouractivist investments includes: companies whose stock prices are significantlybelow our determination of private market value based on its normalized abili-ty to generate and/or grow future free cash flow; companies that may be over-capitalized; companies with strong brands or franchises but suffering the effectsof bad strategic decisions; as well as companies with non-core, underutilized,underperforming or non-productive assets. Even though a potential activistinvestment may be characterized by one of these attributes, we also look forspecific financial characteristics that, from our past experience, strongly favorpursuit of an activist agenda. These financial characteristics include:
• High cash balances and/or conservative balance sheets able to with-stand short term economic or company problems
• Reliable and steady cash flow combined with low returns on investedcapital
• Questionable past merger & acquisition activity• Unrelated businesses or divisions which may have more value as
stand-alone entities• Extremely low valuation multiples• Consistent earnings underperformance
Although a company may exhibit one or more of these characteristics andwe may develop high-conviction recommendations that the problems can besolved, it is important to note that we must first consider the company’slegal, capital and corporate governance structures before deciding if the com-pany is a suitable target for an activist agenda. Most of the activist situationswe have successfully worked through were opportunities created by manage-ment missteps and were characterized by one or more of the characteristicspreviously described.
F I N A L T H O U G H T S
As investors, we remind you that our challenge is to develop a thoroughunderstanding of how a company’s operations can generate sustainable freecash flow over a complete business cycle – (during growing, stagnant, ordeteriorating economic conditions). We believe it is also important tounderstand the role company management must play regarding the prospectsfor each of the companies in our portfolio. We spend a great deal of timeunderstanding and forecasting how management’s decisions are likely toaffect a company’s future free cash flow and ultimately the value of the busi-ness. As 2015 unfolds, we believe those companies with strong managementteams having a proven track record of creating shareholder value over timewill have a substantial strategic advantage as economic growth accelerates.
O L S T E I N S T R A T E G I C O P P O R T U N I T I E S F U N D

43
Since we launched the Olstein Strategic Opportunities Fund, we have iden-tified many small- to mid-sized companies that have successfully navigatedthe turbulent waters of recession and recovery to adapt, invest, grow, andrestructure for the future. We intend to stay the course as we continue toinvest in companies that, in our opinion, have the financial strength to rideout current market jitters while offering favorable long-term businessprospects. We appreciate your trust and remind you that our money isinvested alongside yours.
Sincerely,
Eric R. Heyman Robert A. OlsteinCo-Portfolio Manager Chairman, Chief Investment Officer
and Co-Portfolio Manager
O L S T E I N S T R A T E G I C O P P O R T U N I T I E S F U N D

44
The above represents the opinion of the Manager, and is not intended to be a fore-cast of future events, a guarantee of future results, or investment advice. The refer-ences to securities are not buy or sell recommendations, but are intended to bedescriptive examples of the Fund’s investment philosophy and are subject to change.Do not make investments based on the securities referenced. A full schedule ofFund holdings as of 12/31/14 is contained in this report, and is subject to change.This information should be preceded or accompanied by a current prospectus,which contains more complete information, including investment objectives, risks,charges and expenses of the Olstein Funds and should be read carefully beforeinvesting. A current prospectus may be obtained by calling (800) 799-2113 or vis-iting The Olstein Funds’ website at www.olsteinfunds.com.
The investment return and principal value of an investment will fluctuate so thatan investor’s shares, when redeemed, may be worth more or less than their originalcost. There is no assurance that the Fund will achieve its investment objective.
An investment in a portfolio containing small- and mid-cap companies is subject toadditional risks, as the share prices of small- and mid-cap companies are often morevolatile than those of larger companies due to several factors, including limited trad-ing volumes, products, financial resources, management inexperience and less pub-licly available information. The activist strategy invests in stocks ofunderperforming companies and any shareholder activism might not result in achange in performance or corporate governance. These stocks could also experienceless liquidity and higher share price and trading volume volatility than stocks ofother companies.
The Russell 2500® Index is an unmanaged index created by The RussellInvestment Group. The Russell 2500® Index is constructed to provide a compre-hensive and unbiased barometer for the small to mid-cap segment and is completelyreconstituted annually to ensure larger stocks do not distort the performance andcharacteristics of the true small to mid-cap opportunity set. The Russell 2500®
Index includes the smallest 2500 securities in the Russell 3000® Index. The Russell2500® Index is not an investment product available for purchase. The S&P 500®
Index is an unmanaged index created by Standard & Poor’s Corporation thatincludes a representative sample of 500 leading companies in leading industries ofthe U.S. economy and is considered to represent the U.S. stock market perform-ance in general.
Not FDIC-insured / Not bank-guaranteed / May lose value.
Distributed by Olstein Capital Management, L.P. Member FINRA.
O L S T E I N S T R A T E G I C O P P O R T U N I T I E S F U N D

45
( T H I S P A G E I N T E N T I O N A L L Y L E F T B L A N K . )

46
Olstein Strategic Opportunities FundExpense Example as of December 31, 2014 (Unaudited)
As a shareholder of the Fund, you incur two types of costs: (1) transactioncosts, including sales charges (loads) on purchase payments or contingentdeferred sales charges on redemptions, if any; and (2) ongoing costs, includ-ing management fees, distribution fees (12b-1), and other Fund expenses.This Example is intended to help you understand your ongoing costs (in dol-lars) of investing in the Fund and to compare these costs with the ongoingcosts of investing in other mutual funds. The Example is based on an invest-ment of $1,000 invested at the beginning of the period and held for theentire period, July 1, 2014 – December 31, 2014.
Actual Expenses The following table provides information about actualaccount values and actual expenses. You will be assessed fees for outgoingwire transfers, returned checks and stop payment orders at prevailing ratescharged by U.S. Bancorp Fund Services, LLC, the Fund’s transfer agent. Ifyou request that a redemption be made by a wire transfer, currently a $15 feeis charged by the Fund’s transfer agent. IRA accounts will be charged a $15annual maintenance fee and a $25 distribution fee. The following exampleincludes, but is not limited to, management fees, distribution fees, fundaccounting, custody and transfer agent fees. However, the following exampledoes not include portfolio trading commissions and related expenses. Youmay use the information in this table, together with the amount you invest-ed, to estimate the expenses that you paid over the period. Simply divideyour account value by $1,000 (for example, an $8,600 account value dividedby $1,000 = 8.6), then multiply the result by the number in the table underthe heading entitled “Expenses Paid During Period’’ to estimate the expensesyou paid on your account during this period.
Hypothetical Example for Comparison Purposes The following table alsoprovides information about hypothetical account values and hypotheticalexpenses based on the Fund’s actual expense ratio and an assumed rate ofreturn of 5% per year before expenses, which is not the Fund’s actual return.The hypothetical account values and expenses may not be used to estimatethe actual ending account balance or expenses you paid for the period. Youmay use this information to compare the ongoing costs of investing in theFund and other funds. To do so, compare this 5% hypothetical example withthe 5% hypothetical examples that appear in the shareholder reports of theother funds.
O L S T E I N S T R A T E G I C O P P O R T U N I T I E S F U N D
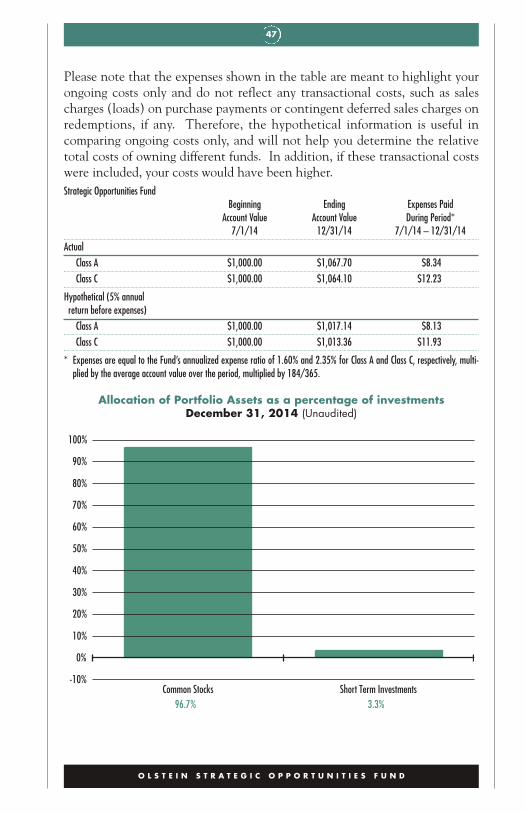
47
O L S T E I N S T R A T E G I C O P P O R T U N I T I E S F U N D
96.7% 3.3%Common Stocks Short Term Investments
-10%
0%
10%
20%
30%
40%
50%
60%
70%
80%
90%
100%
Please note that the expenses shown in the table are meant to highlight yourongoing costs only and do not reflect any transactional costs, such as salescharges (loads) on purchase payments or contingent deferred sales charges onredemptions, if any. Therefore, the hypothetical information is useful incomparing ongoing costs only, and will not help you determine the relativetotal costs of owning different funds. In addition, if these transactional costswere included, your costs would have been higher.Strategic Opportunities Fund
Beginning Ending Expenses PaidAccount Value Account Value During Period*
7/1/14 12/31/14 7/1/14 – 12/31/14Actual
Class A $1,000.00 $1,067.70 $8.34Class C $1,000.00 $1,064.10 $12.23
Hypothetical (5% annualreturn before expenses)
Class A $1,000.00 $1,017.14 $8.13Class C $1,000.00 $1,013.36 $11.93
* Expenses are equal to the Fund’s annualized expense ratio of 1.60% and 2.35% for Class A and Class C, respectively, multi-plied by the average account value over the period, multiplied by 184/365.
Allocation of Portfolio Assets as a percentage of investmentsDecember 31, 2014 (Unaudited)
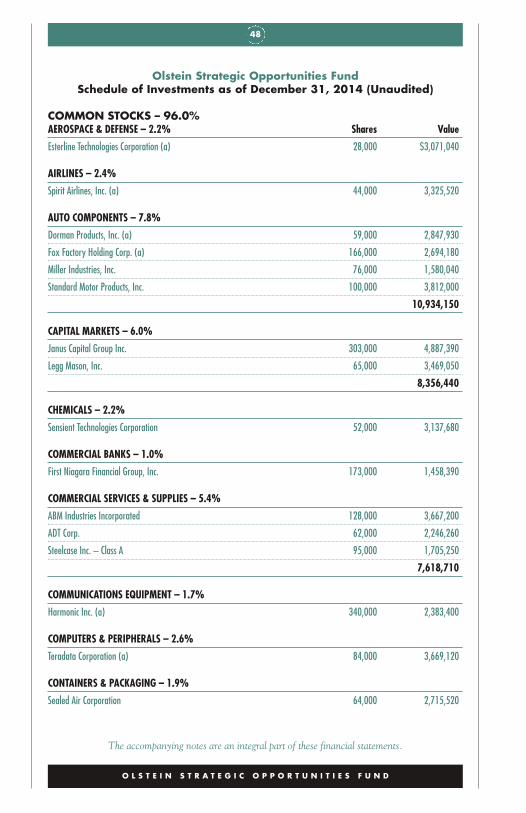
48
Olstein Strategic Opportunities FundSchedule of Investments as of December 31, 2014 (Unaudited)
COMMON STOCKS – 96.0%AEROSPACE & DEFENSE – 2.2% Shares Value
Esterline Technologies Corporation (a) 28,000 $3,071,040
AIRLINES – 2.4%
Spirit Airlines, Inc. (a) 44,000 3,325,520
AUTO COMPONENTS – 7.8%
Dorman Products, Inc. (a) 59,000 2,847,930
Fox Factory Holding Corp. (a) 166,000 2,694,180
Miller Industries, Inc. 76,000 1,580,040
Standard Motor Products, Inc. 100,000 3,812,000
10,934,150
CAPITAL MARKETS – 6.0%
Janus Capital Group Inc. 303,000 4,887,390
Legg Mason, Inc. 65,000 3,469,050
8,356,440
CHEMICALS – 2.2%
Sensient Technologies Corporation 52,000 3,137,680
COMMERCIAL BANKS – 1.0%
First Niagara Financial Group, Inc. 173,000 1,458,390
COMMERCIAL SERVICES & SUPPLIES – 5.4%
ABM Industries Incorporated 128,000 3,667,200
ADT Corp. 62,000 2,246,260
Steelcase Inc. – Class A 95,000 1,705,250
7,618,710
COMMUNICATIONS EQUIPMENT – 1.7%
Harmonic Inc. (a) 340,000 2,383,400
COMPUTERS & PERIPHERALS – 2.6%
Teradata Corporation (a) 84,000 3,669,120
CONTAINERS & PACKAGING – 1.9%
Sealed Air Corporation 64,000 2,715,520
O L S T E I N S T R A T E G I C O P P O R T U N I T I E S F U N D
The accompanying notes are an integral part of these financial statements.
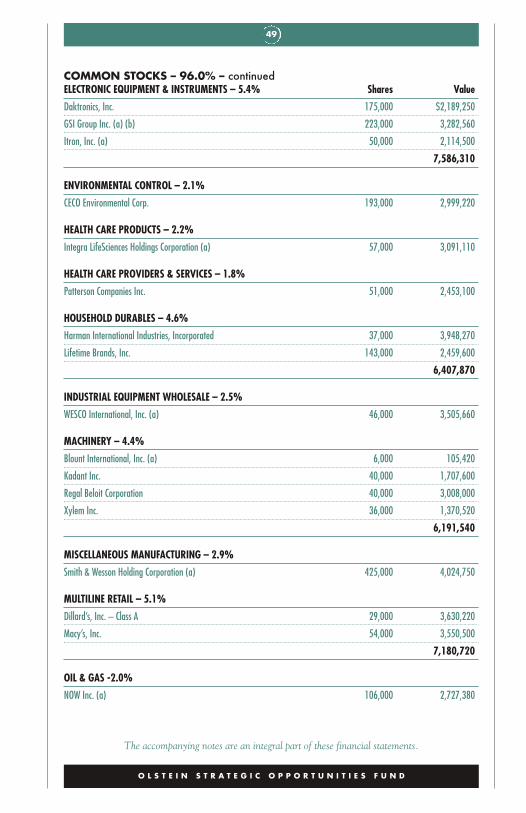
49
O L S T E I N S T R A T E G I C O P P O R T U N I T I E S F U N D
COMMON STOCKS – 96.0% – continuedELECTRONIC EQUIPMENT & INSTRUMENTS – 5.4% Shares Value
Daktronics, Inc. 175,000 $2,189,250
GSI Group Inc. (a) (b) 223,000 3,282,560
Itron, Inc. (a) 50,000 2,114,500
7,586,310
ENVIRONMENTAL CONTROL – 2.1%
CECO Environmental Corp. 193,000 2,999,220
HEALTH CARE PRODUCTS – 2.2%
Integra LifeSciences Holdings Corporation (a) 57,000 3,091,110
HEALTH CARE PROVIDERS & SERVICES – 1.8%
Patterson Companies Inc. 51,000 2,453,100
HOUSEHOLD DURABLES – 4.6%
Harman International Industries, Incorporated 37,000 3,948,270
Lifetime Brands, Inc. 143,000 2,459,600
6,407,870
INDUSTRIAL EQUIPMENT WHOLESALE – 2.5%
WESCO International, Inc. (a) 46,000 3,505,660
MACHINERY – 4.4%
Blount International, Inc. (a) 6,000 105,420
Kadant Inc. 40,000 1,707,600
Regal Beloit Corporation 40,000 3,008,000
Xylem Inc. 36,000 1,370,520
6,191,540
MISCELLANEOUS MANUFACTURING – 2.9%
Smith & Wesson Holding Corporation (a) 425,000 4,024,750
MULTILINE RETAIL – 5.1%
Dillard’s, Inc. – Class A 29,000 3,630,220
Macy’s, Inc. 54,000 3,550,500
7,180,720
OIL & GAS -2.0%
NOW Inc. (a) 106,000 2,727,380
The accompanying notes are an integral part of these financial statements.

50
COMMON STOCKS – 96.0% – continuedPHARMACEUTICALS – 1.3% Shares Value
Nutraceutical International Corporation (a) 85,000 $1,832,600
REAL ESTATE MANAGEMENT & DEVELOPMENT – 1.4%
Jones Lang LaSalle Incorporated 13,000 1,949,090
RECREATIONAL VEHICLES – 2.1%
Arctic Cat Inc. 83,000 2,946,500
RESTAURANTS – 2.9%
Potbelly Corporation (a) 165,000 2,123,550
The Wendy’s Company 210,000 1,896,300
4,019,850
SEMICONDUCTOR & SEMICONDUCTOR EQUIPMENT – 3.4%
Entegris, Inc. (a) 209,000 2,760,890
Vishay Intertechnology, Inc. 144,000 2,037,600
4,798,490
SPECIALTY RETAIL – 9.5%
Big Lots, Inc. 88,000 3,521,760
DSW Inc. – Class A 86,000 3,207,800
Express, Inc. (a) 212,000 3,114,280
Vitamin Shoppe, Inc. (a) 71,000 3,449,180
13,293,020
TEXTILES, APPAREL & LUXURY GOODS – 4.5%
Culp, Inc. 140,000 3,035,200
Rocky Brands, Inc. 91,000 1,206,660
UniFirst Corporation 17,000 2,064,650
6,306,510
TRANSPORTATION EQUIPMENT – 4.7%
The Greenbrier Companies, Inc. 83,000 4,459,590
Wabash National Corporation (a) 170,000 2,101,200
6,560,790
TOTAL COMMON STOCKS (Cost $117,940,568) 134,544,480
O L S T E I N S T R A T E G I C O P P O R T U N I T I E S F U N D
The accompanying notes are an integral part of these financial statements.
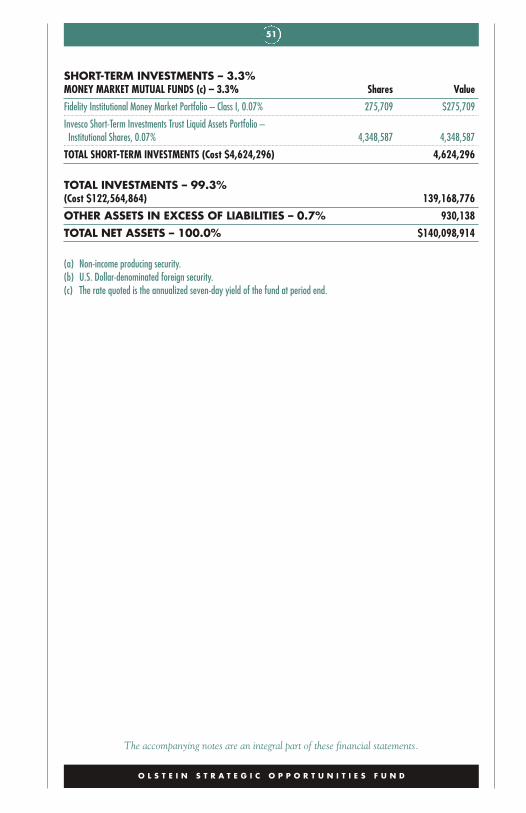
51
The accompanying notes are an integral part of these financial statements.
SHORT-TERM INVESTMENTS – 3.3%MONEY MARKET MUTUAL FUNDS (c) – 3.3% Shares Value
Fidelity Institutional Money Market Portfolio – Class I, 0.07% 275,709 $275,709
Invesco Short-Term Investments Trust Liquid Assets Portfolio –Institutional Shares, 0.07% 4,348,587 4,348,587
TOTAL SHORT-TERM INVESTMENTS (Cost $4,624,296) 4,624,296
TOTAL INVESTMENTS – 99.3%(Cost $122,564,864) 139,168,776
OTHER ASSETS IN EXCESS OF LIABILITIES – 0.7% 930,138
TOTAL NET ASSETS – 100.0% $140,098,914
(a) Non-income producing security.(b) U.S. Dollar-denominated foreign security.(c) The rate quoted is the annualized seven-day yield of the fund at period end.
O L S T E I N S T R A T E G I C O P P O R T U N I T I E S F U N D

52
The accompanying notes are an integral part of these financial statements.
Olstein Strategic Opportunities FundStatement of Assets and Liabilities as of December 31, 2014 (Unaudited)
Assets:
Investments, at value (at cost $122,564,864) $139,168,776
Receivable for securities sold 746,971
Receivable for capital shares sold 748,245
Dividends and interest receivable 79,518
Other assets 53,188
Total Assets 140,796,698
Liabilities:
Payable for securities purchased 422,104
Payable for capital shares redeemed 16,556
Payable to Investment Manager (See Note 5) 102,940
Distribution expense payable 95,740
Payable for transfer agent fees and expenses 17,769
Payable for administration fees 15,051
Payable for trustees’ fees and expenses 8,103
Accrued expenses and other liabilities 19,521
Total Liabilities 697,784
Net Assets $140,098,914
Net Assets Consist of:
Capital stock $120,105,023
Accumulated net investment loss (486,314)
Accumulated net realized gain on investments sold 3,876,293
Net unrealized appreciation on investments 16,603,912
Total Net Assets $140,098,914
O L S T E I N S T R A T E G I C O P P O R T U N I T I E S F U N D

53
The accompanying notes are an integral part of these financial statements.
CLASS A:
Net Assets $109,725,017
Shares of beneficial interest outstanding(unlimited number of shares authorized, $0.001 par value) 6,219,385
Net asset value and redemption price per share $17.64
Maximum offering price per share $18.67
CLASS C:
Net Assets $30,373,897
Shares of beneficial interest outstanding(unlimited number of shares authorized, $0.001 par value) 1,840,975
Net asset value, offering and redemption(may be subject to contingent deferred sales charge) price per share $16.50
O L S T E I N S T R A T E G I C O P P O R T U N I T I E S F U N D

54
Olstein Strategic Opportunities FundStatement of Operations
For the Six Months EndedDecember 31, 2014
(Unaudited)
Investment Income:
Dividend income $603,511
Interest income 1,150
Total investment income 604,661
Expenses:
Investment management fee (See Note 5) 616,078
Distribution expense – Class A (See Note 6) 119,018
Distribution expense – Class C (See Note 6) 140,004
Transfer agent fees and expenses 52,716
Administration fee 43,663
Professional fees 31,268
Federal and state registration 25,520
Accounting costs 16,317
Trustees’ fees and expenses 15,788
Custody fees 11,794
Reports to shareholders 5,174
Interest expense (See Note 8) 248
Other 6,250
Total expenses 1,083,838
Expense recoupment by Investment Manager (See Note 5) 7,137
Net expenses 1,090,975
Net investment loss (486,314)
Realized and Unrealized Gain on Investments:
Realized gain on investments 9,063,902
Change in unrealized appreciation/depreciation on investments (208,672)
Net realized and unrealized gain on investments 8,855,230
Net Increase in Net Assets Resulting from Operations $8,368,916
The accompanying notes are an integral part of these financial statements.
O L S T E I N S T R A T E G I C O P P O R T U N I T I E S F U N D

55
Olstein Strategic Opportunities FundStatements of Changes in Net Assets
For theSix Months Ended For the
December 31, 2014 Year Ended(Unaudited) June 30, 2014
Operations:
Net investment loss $(486,314) $(738,319)
Net realized gain on investments 9,063,902 11,998,781
Change in unrealized appreciation/depreciation on investments (208,672) 7,006,300
Net increase in net assets resulting from operations 8,368,916 18,266,762
Distributions to Class A Shareholdersfrom Net Realized Gains (10,294,773) (3,302,413)
Distributions to Class C Shareholdersfrom Net Realized Gains (3,101,269) (1,100,507)
Total distributions to shareholders (13,396,042) (4,402,920)
Net increase in net assets resultingfrom Fund share transactions (Note 7) 31,303,003 44,515,237
Total Increase in Net Assets 26,275,877 58,379,079
Net Assets:
Beginning of period 113,823,037 55,443,958
End of period $140,098,914 $113,823,037
Accumulated net investment loss $(486,314) $—
The accompanying notes are an integral part of these financial statements.
O L S T E I N S T R A T E G I C O P P O R T U N I T I E S F U N D

56
The accompanying notes are an integral part of these financial statements.
Olstein Strategic Opportunities FundFinancial Highlights
Class A
For theSix Months For the For the For the For the For the
Ended Year Year Year Year YearDec. 31, Ended Ended Ended Ended Ended
2014 June 30, June 30, June 30, June 30, June 30,(Unaudited) 2014 2013 2012 2011 2010
Net Asset Value –Beginning of Period $18.34 $15.35 $11.60 $11.79 $8.57 $7.08
Investment Operations:
Net investment loss(1) (0.06) (0.12) (0.09) (0.07) (0.10) (0.06)
Net realized and unrealizedgain (loss) on investments 1.23 4.06 3.84 (0.12) 3.32 1.55
Total from investment operations 1.17 3.94 3.75 (0.19) 3.22 1.49
Distributions from netrealized gain on investments (1.87) (0.95) — — — —
Net Asset Value –End of Period $17.64 $18.34 $15.35 $11.60 $11.79 $8.57
Total Return++ 6.77%* 26.25% 32.33% (1.61)% 37.57% 21.05%
Ratios (to average net assets)/Supplemental Data:
Ratio of expenses:
Before expense waiver and/or reimbursement 1.59%** 1.60% 1.76% 1.98% 2.06% 2.31%
After expense waiver and/or reimbursement 1.60%** 1.60% 1.60% 1.60% 1.60% 1.60%
Ratio of net investment loss:
Before expense waiver and/or reimbursement (0.61)%** (0.69)% (0.80)% (1.02)% (1.37)% (1.37)%
After expense waiver and/or reimbursement (0.62)%** (0.69)% (0.64)% (0.64)% (0.91)% (0.66)%
Portfolio turnover rate(2) 42.56% 60.25% 39.95% 47.53% 61.37% 69.78%
Net assets at end ofperiod (000 omitted) $109,725 $87,456 $42,158 $17,936 $13,604 $7,112
++ Total returns do not reflect any sales charge for Class A Shares.* Not annualized.
** Annualized.(1) Net investment loss per share represents net investment loss divided by the average shares outstanding throughout the
period.(2) Portfolio turnover is calculated on the basis of the Fund as a whole without distinguishing between the classes of shares
issued.
O L S T E I N S T R A T E G I C O P P O R T U N I T I E S F U N D

57
The accompanying notes are an integral part of these financial statements.
Olstein Strategic Opportunities FundFinancial Highlights
Class C
For theSix Months For the For the For the For the For the
Ended Year Year Year Year YearDec. 31, Ended Ended Ended Ended Ended
2014 June 30, June 30, June 30, June 30, June 30,(Unaudited) 2014 2013 2012 2011 2010
Net Asset Value –Beginning of Period $17.33 $14.66 $11.16 $11.43 $8.37 $6.96
Investment Operations:
Net investment loss(1) (0.11) (0.23) (0.18) (0.15) (0.17) (0.12)
Net realized and unrealizedgain (loss) on investments 1.15 3.85 3.68 (0.12) 3.23 1.53
Total from investment operations 1.04 3.62 3.50 (0.27) 3.06 1.41
Distributions from netrealized gain on investments (1.87) (0.95) — — — —
Net Asset Value –End of Period $16.50 $17.33 $14.66 $11.16 $11.43 $8.37
Total Return++ 6.41%* 25.28% 31.36% (2.36)% 36.56% 20.26%
Ratios (to average net assets)/Supplemental Data:
Ratio of expenses:
Before expense waiver and/or reimbursement 2.34%** 2.35% 2.51% 2.73% 2.81% 3.06%
After expense waiver and/or reimbursement 2.35%** 2.35% 2.35% 2.35% 2.35% 2.35%
Ratio of net investment loss:
Before expense waiver and/or reimbursement (1.36)%** (1.44)% (1.55)% (1.77)% (2.12)% (2.12)%
After expense waiver and/or reimbursement (1.37)%** (1.44)% (1.39)% (1.39)% (1.66)% (1.41)%
Portfolio turnover rate(2) 42.56% 60.25% 39.95% 47.53% 61.37% 69.78%
Net assets at end ofperiod (000 omitted) $30,374 $26,367 $13,286 $8,993 $9,493 $7,042
++ Total returns do not reflect any deferred sales charge for Class C Shares.* Not annualized.
** Annualized.(1) Net investment loss per share represents net investment loss divided by the average shares outstanding throughout the
period.(2) Portfolio turnover is calculated on the basis of the Fund as a whole without distinguishing between the classes of shares
issued.
O L S T E I N S T R A T E G I C O P P O R T U N I T I E S F U N D

58
The Olstein FundsNotes to Financial Statements (Unaudited)
1 Description of the Funds The Olstein Funds (the “Trust”), a Delawarestatutory trust organized on March 31, 1995, is registered under theInvestment Company Act of 1940, as amended (the “1940 Act”), as anopen-end investment management company. The Trust consists of twoseries, the Olstein All Cap Value Fund (“All Cap Value Fund”) and theOlstein Strategic Opportunities Fund (“Strategic Fund”) (collectively,the “Funds”). Each Fund is a diversified investment management compa-ny. The primary investment objective of each Fund is long-term capitalappreciation with a secondary objective of income. The All Cap ValueFund commenced investment operations on September 21, 1995, and theStrategic Fund commenced operations on November 1, 2006.
The All Cap Value Fund issued a second class of shares, Adviser Classshares, and renamed the initial class as Class C shares on September 1,1999. The Adviser Class shares were initially sold on September 21,1999, and were subject to expenses pursuant to the ShareholderServicing and Distribution Plan described in Note 6 through October 30,2013 and was eliminated thereafter. The Class C shares are subject to acontingent deferred sales charge (“CDSC”) for redemptions in accor-dance with the All Cap Value Fund’s prospectus, and expenses pursuantto the Shareholder Servicing and Distribution Plan described in Note 6.The maximum CDSC is 1.00% based on the lesser of the original pur-chase price or the value of such shares at the time of redemption for ClassC shares within one year of purchase.
The Strategic Fund offers Class A and Class C shares, which are subjectto expenses pursuant to the Shareholder Servicing and Distribution Plandescribed in Note 6. Class A shares have a maximum front-end salescharge of 5.50% that is included in the offering price of the Class Ashares. The Class C shares are subject to a CDSC for redemptions withinone year of purchase in accordance with the Strategic Fund’s prospectus.The maximum CDSC is 1.00% based on the lesser of the original pur-chase price or the value of such shares at the time of redemption.
2 Significant Accounting Policies The following is a summary of the signif-icant accounting policies of the Funds:
T H E O L S T E I N F U N D S

59
Security Valuation. The Funds’ securities, except short-term investmentswith maturities of 60 days or less at the time of purchase and securitiestraded on a national securities exchange or reported on the NASDAQNMS and Small Cap exchanges, are valued at their fair value as deter-mined by their last sale price in the principal market in which these securi-ties are normally traded. Lacking any sales, the security is valued at themean between the closing bid and ask price. Securities traded onNASDAQ are valued at the NASDAQ Official Closing Price (“NOCP”).Short-term investments with remaining maturities of 60 days or less at thetime of purchase are valued at amortized cost, which approximates fairvalue, unless the Funds’ Board of Trustees determines that this does notrepresent fair value. The value of all other securities, for which no quota-tions are readily available, is determined in good faith by, or under proce-dures approved by, the Board of Trustees (the “Board”). The Board hasadopted specific procedures for valuing portfolio securities and delegatedthe implementation of these procedures to Olstein Capital Management,L.P. (“Olstein” or the “Investment Manager”). The procedures authorizethe Investment Manager to make all necessary determinations regardingthe fair value of a portfolio security and to report such determinations tothe Board of Trustees. The Funds use independent pricing services to assistin pricing portfolio securities.
The Trust has adopted fair valuation accounting standards which estab-lish an authoritative definition of fair value and set out a hierarchy formeasuring fair value. These standards require additional disclosuresabout the various inputs and valuation techniques used to develop themeasurements of fair value and a discussion of changes in valuation tech-niques and related inputs during the period. These standards define fairvalue as the price that would be received to sell an asset or paid to trans-fer a liability in an orderly transaction between market participants at themeasurement date. The fair value hierarchy is organized into three levelsbased upon the assumptions (referred to as “inputs”) used in pricing theasset or liability. These standards state that “observable inputs” reflect theassumptions market participants would use in pricing the asset or liabilitybased on market data obtained from independent sources and “unobserv-able inputs” reflect an entity’s own assumptions about the assumptionsmarket participants would use in pricing the asset or liability. Theseinputs are summarized in the three broad levels listed below.
T H E O L S T E I N F U N D S

60
Level 1 – Quoted unadjusted prices for identical instruments in active mar-kets to which the Trust has access at the date of measurement.
Level 2 – Quoted prices for similar instruments in active markets; quotedprices for identical or similar instruments in markets that arenot active; and model-derived valuations in which all signifi-cant inputs and significant value drivers are observable inactive markets. Level 2 inputs are those in markets for whichthere are few transactions, the prices are not current, little pub-lic information exists or instances where prices vary substantial-ly over time or among brokered market makers.
Level 3 – Model derived valuations in which one or more significantinputs or significant value drivers are unobservable.Unobservable inputs are those inputs that reflect the Trust’sown assumptions that market participants would use to pricethe asset or liability based on the best available information.
The inputs or methodology used for valuing securities are not necessarilyan indication of the risk associated with investing in those securities.The following is a summary of the inputs used to value the Funds’ netassets as of December 31, 2014:
Level 1 Level 2 Level 3 Total
All Cap Value Fund
Equity
Consumer Discretionary $181,832,360 $— $— $181,832,360
Industrials 168,115,830 — — 168,115,830
Financials 119,108,060 — — 119,108,060
Information Technology 78,958,415 — — 78,958,415
Health Care 70,111,860 — — 70,111,860
Materials 34,768,330 — — 34,768,330
Energy 18,599,190 — — 18,599,190
Consumer Staples 13,275,090 — — 13,275,090
Total Equity 684,769,135 — — 684,769,135
Short-Term Investments 83,818,081 — — 83,818,081
Total Investments in Securities $768,587,216 $— $— $768,587,216
T H E O L S T E I N F U N D S
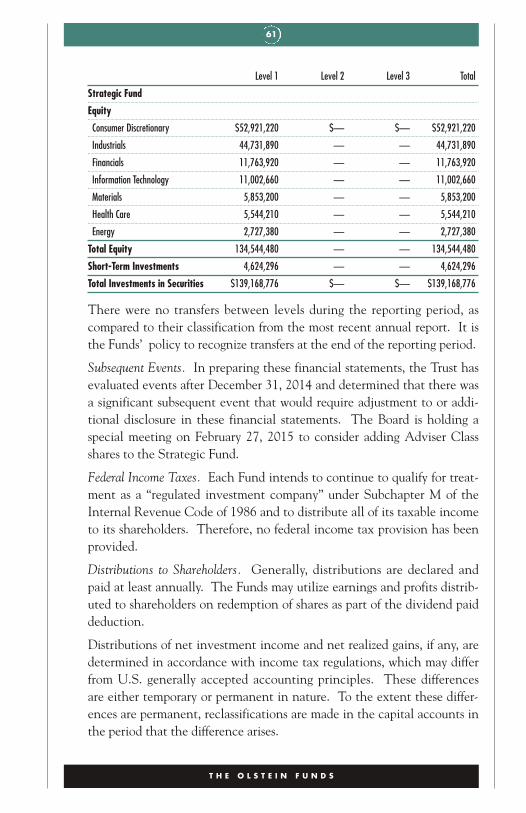
61
Level 1 Level 2 Level 3 Total
Strategic Fund
Equity
Consumer Discretionary $52,921,220 $— $— $52,921,220
Industrials 44,731,890 — — 44,731,890
Financials 11,763,920 — — 11,763,920
Information Technology 11,002,660 — — 11,002,660
Materials 5,853,200 — — 5,853,200
Health Care 5,544,210 — — 5,544,210
Energy 2,727,380 — — 2,727,380
Total Equity 134,544,480 — — 134,544,480
Short-Term Investments 4,624,296 — — 4,624,296
Total Investments in Securities $139,168,776 $— $— $139,168,776
There were no transfers between levels during the reporting period, ascompared to their classification from the most recent annual report. It isthe Funds’ policy to recognize transfers at the end of the reporting period.
Subsequent Events. In preparing these financial statements, the Trust hasevaluated events after December 31, 2014 and determined that there wasa significant subsequent event that would require adjustment to or addi-tional disclosure in these financial statements. The Board is holding aspecial meeting on February 27, 2015 to consider adding Adviser Classshares to the Strategic Fund.
Federal Income Taxes. Each Fund intends to continue to qualify for treat-ment as a “regulated investment company” under Subchapter M of theInternal Revenue Code of 1986 and to distribute all of its taxable incometo its shareholders. Therefore, no federal income tax provision has beenprovided.
Distributions to Shareholders. Generally, distributions are declared andpaid at least annually. The Funds may utilize earnings and profits distrib-uted to shareholders on redemption of shares as part of the dividend paiddeduction.
Distributions of net investment income and net realized gains, if any, aredetermined in accordance with income tax regulations, which may differfrom U.S. generally accepted accounting principles. These differencesare either temporary or permanent in nature. To the extent these differ-ences are permanent, reclassifications are made in the capital accounts inthe period that the difference arises.
T H E O L S T E I N F U N D S
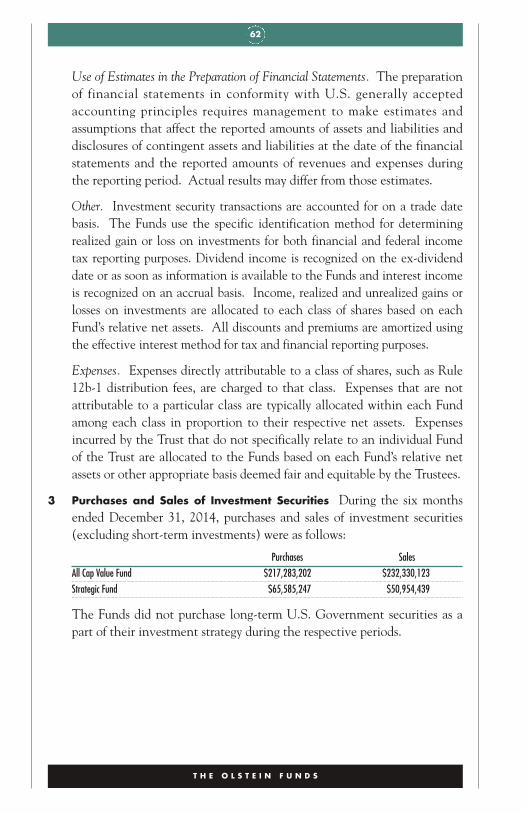
62
Use of Estimates in the Preparation of Financial Statements. The preparationof financial statements in conformity with U.S. generally acceptedaccounting principles requires management to make estimates andassumptions that affect the reported amounts of assets and liabilities anddisclosures of contingent assets and liabilities at the date of the financialstatements and the reported amounts of revenues and expenses duringthe reporting period. Actual results may differ from those estimates.
Other. Investment security transactions are accounted for on a trade datebasis. The Funds use the specific identification method for determiningrealized gain or loss on investments for both financial and federal incometax reporting purposes. Dividend income is recognized on the ex-dividenddate or as soon as information is available to the Funds and interest incomeis recognized on an accrual basis. Income, realized and unrealized gains orlosses on investments are allocated to each class of shares based on eachFund’s relative net assets. All discounts and premiums are amortized usingthe effective interest method for tax and financial reporting purposes.
Expenses. Expenses directly attributable to a class of shares, such as Rule12b-1 distribution fees, are charged to that class. Expenses that are notattributable to a particular class are typically allocated within each Fundamong each class in proportion to their respective net assets. Expensesincurred by the Trust that do not specifically relate to an individual Fundof the Trust are allocated to the Funds based on each Fund’s relative netassets or other appropriate basis deemed fair and equitable by the Trustees.
3 Purchases and Sales of Investment Securities During the six monthsended December 31, 2014, purchases and sales of investment securities(excluding short-term investments) were as follows:
Purchases SalesAll Cap Value Fund $217,283,202 $232,330,123Strategic Fund $65,585,247 $50,954,439
The Funds did not purchase long-term U.S. Government securities as apart of their investment strategy during the respective periods.
T H E O L S T E I N F U N D S

63
4 Tax Information At June 30, 2014, the components of accumulatedearnings/losses on a tax basis were as follows:
All Cap StrategicValue Fund Fund
Cost of Investments $569,590,901 $97,929,711Gross unrealized appreciation $125,561,615 $19,840,749Gross unrealized depreciation (8,210,845) (3,193,799)Net unrealized appreciation $117,350,770 $16,646,950Undistributed ordinary income — 24,066Undistributed long-term capital gain — 8,350,001Total distributable earnings — 8,374,067Other accumulated losses $ (29,780,757) $ —Total accumulated gains $87,570,013 $25,021,017
The difference between book-basis and tax-basis net unrealized apprecia-tion is attributable primarily to the tax deferral of losses on wash sales forthe Strategic Fund.
At June 30, 2014, the accumulated capital loss carryforwards were asfollows:
All Cap StrategicValue Fund Fund
Expiring in 2018 $27,583,365 $ —
To the extent the Funds realize future net capital gains, taxable distribu-tions will be reduced by any unexpired and unused capital loss carryfor-wards as permitted by the Internal Revenue Code. During the yearended June 30, 2014, the All Cap Value Fund utilized capital loss carry-forwards of $113,482,390.
On December 22, 2010, the Regulated Investment CompanyModernization Act of 2010 (the “Act”) was enacted which changed vari-ous technical rules governing the tax treatment of regulated investmentcompanies. The changes are generally effective for taxable years beginningafter the date of enactment. One of the more prominent changes addressescapital loss carryforwards. Under the Act, each Fund will be permitted tocarry forward capital losses incurred in taxable years beginning after thedate of enactment for an unlimited period. However, any losses incurredduring those future taxable years will be required to be utilized prior to thelosses incurred in pre-enactment taxable years. As a result of this orderingrule, pre-enactment capital loss carryforwards may be more likely to expireunused. Additionally, post-enactment capital loss carryforwards will retain
T H E O L S T E I N F U N D S

64
their character as either short-term or long-term capital losses rather thanbeing considered all short-term as permitted under previous law.
At June 30, 2014, the Funds deferred, on a tax basis, post-Decemberordinary late-year losses of:
All Cap Value Fund $2,197,392Strategic Fund $ —
The tax components of dividends paid by the Funds during the periodsended December 31, 2014 and June 30, 2014 were as follows:
Six Months Ended Year EndedAll Cap Value Fund December 31, 2014 June 30, 2014
Ordinary Income $— $—
Long-Term Capital Gain $8,530,105 $—
Strategic Fund
Ordinary Income $1,555,802 $981,620
Long-Term Capital Gain $11,840,240 $3,421,300
The Funds designated as long-term capital gain dividend, pursuant toInternal Revenue Code Section 852(b)(3), the amount necessary toreduce earnings and profits of the Funds related to net capital gain to zerofor the tax year ended June 30, 2014.
The Trust has adopted financial reporting rules regarding recognition andmeasurement of tax positions taken or expected to be taken on a tax return.The Trust has reviewed all open tax years and major jurisdictions and con-cluded that there is no impact on the Funds’ financial position or results ofoperations as a result of open tax years. Tax years that remain open toexamination by major tax jurisdictions include tax years ended June 30,2011 through June 30, 2014. There is no tax liability resulting from unrecog-nized tax benefits relating to uncertain income tax positions taken orexpected to be taken on tax returns as of and for the year ended June 30,2014. The Funds are also not aware of any tax positions for which it is rea-sonably possible that the total amounts of unrecognized tax benefits will sig-nificantly change in the next twelve months. If applicable, the Funds wouldrecognize interest accrued related to unrecognized tax benefits in “interestexpense” and penalties in “other expense” on the statement of operations.
5 Investment Management Fee and Other Agreements The Fundsemploy Olstein as the investment manager. Pursuant to investmentmanagement agreements with the Funds, the Investment Manager selects
T H E O L S T E I N F U N D S

65
investments and supervises the assets of the Funds in accordance with theinvestment objectives, policies and restrictions of the Funds, subject tothe supervision and direction of the Board of Trustees. For its services,the Investment Manager earns a monthly fee at the annual rate of 1.00%for the first $1 billion, 0.95% for $1 billion to $1.5 billion, 0.90% for $1.5billion to $2 billion, 0.85% for $2 billion to $2.5 billion, 0.80% for $2.5billion to $3 billion and 0.75% for over $3 billion of the All Cap ValueFund’s average daily net assets and 1.00% of the Strategic Fund’s averagedaily net assets. For the six months ended December 31, 2014, the AllCap Value Fund incurred investment management fees of $3,567,654,with $643,301 payable to the Investment Manager as of December 31,2014. For the same period, the Strategic Fund incurred management feesof $616,078, with $102,940 net payable to the Investment Manager as ofDecember 31, 2014. The Investment Manager receivables and payablesare settled monthly. The Investment Manager has agreed to contractual-ly waive or reduce all or a portion of its management fee and, if necessary,to bear certain other expenses to limit the annualized expenses of theStrategic Fund to 1.35%, exclusive of 12b-1 and shareholder servicingfees, acquired fund fees and expenses, taxes, interest and non-routineexpenses. This agreement extends until October 28, 2015 and may becontinued thereafter. The Investment Manager may seek reimbursementof its waived fees and expenses borne for a rolling three-year period fol-lowing the fiscal year such fee waivers and expense reimbursements areincurred, provided that the reimbursement by the Strategic Fund of theInvestment Manager will not cause total operating expenses to exceedthe expense cap as then may be in effect or the expense cap in place atthe time of the fee waiver. The Investment Manager recouped $7,137 inpreviously waived fees and expenses during the six months endedDecember 31, 2014.
Strategic FundReimbursed/Absorbed Expenses Subject to Recovery by Investment Manager Until:2015 $77,0682016 60,1422017 2,278Total $139,488
Certain trustees and officers of the Trust are also officers of the Trust’sInvestment Manager. Such trustees and officers are paid no fees by theTrust for serving as trustees or officers of the Trust.
T H E O L S T E I N F U N D S

66
T H E O L S T E I N F U N D S
6 Shareholder Servicing and Distribution Plans Olstein has entered intoa distribution and underwriting agreement with the Funds dated August18, 1995 (subsequently revised on July 29, 1998 to reflect the additionalclass and further amended and restated effective October 1, 2007), underwhich Olstein acts as underwriter to engage in activities designed to assistthe Funds in securing purchasers for their shares. The Funds have adopt-ed Shareholder Servicing and Distribution Plans pursuant to Rule 12b-1under the 1940 Act (the “12b-1 Plans”). Amounts paid under the 12b-1Plans may compensate Olstein or others for the activities in the promo-tion and distribution of each Fund’s shares and for shareholder servicing.The total amount that the All Cap Value Fund will pay under the 12b-1Plans for the Class C shares is 1.00%, per annum of the Fund’s averagedaily net assets of Class C shares. The Board voted to terminate the12b-1 Plan for the Adviser Class shares, effective October 31, 2013. Forthe six months ended December 31, 2014, fees incurred by the All CapValue Fund pursuant to the 12b-1 Plan were $3,022,785 for Class Cshares. The total amount that the Strategic Fund will pay under the12b-1 Plans for the Class A and Class C shares are 0.25% and 1.00%,respectively, per annum of the Fund’s average daily net assets of Class Aand Class C shares, respectively. For the six months ended December 31,2014, fees incurred by the Strategic Fund pursuant to the 12b-1 Planswere $119,018 for Class A and $140,004 for Class C shares. For the sixmonths ended December 31, 2014, Olstein retained $21,887 from salescharges on the Strategic Fund Class A shares. During the six monthsended December 31, 2014, Olstein received contingent deferred salescharges from redeeming shareholders in the amounts of $1,034 and$2,297 for the All Cap Value Fund and the Strategic Fund, respectively.
During the six months ended December 31, 2014, the All Cap ValueFund and the Strategic Fund paid no brokerage commissions to affiliatedbroker-dealers in connection with purchases and sales of investmentsecurities.

67
7 Fund Shares At December 31, 2014, there was an unlimited number ofshares of beneficial interest, $0.001 par value, authorized. The followingtable summarizes the activity in shares of each class of the Funds:
All Cap Value FundSix Months Ended Year Ended
December 31, 2014 June 30, 2014
Class C Class C
Shares Amount Shares Amount
Shares sold 440,407 $9,009,708 778,931 $14,296,594
Shares issued to shareholdersin reinvestment of distributions 325,545 6,895,036 — —
Shares redeemed (1,046,534) (21,343,269) (3,222,080) (59,082,383)
Net decrease (280,582) $(5,438,525) (2,443,149) $(44,785,789)
Shares Outstanding:
Beginning of period 29,638,894 32,082,043
End of period 29,358,312 29,638,894
Six Months Ended Year EndedDecember 31, 2014 June 30, 2014
Adviser Class Adviser Class
Shares Amount Shares Amount
Shares sold 1,422,782 $34,595,129 1,038,439 $21,738,821
Shares issued to shareholdersin reinvestment of distributions 43,321 1,063,522 — —
Shares redeemed (230,030) (5,425,181) (494,480) (10,396,865)
Net increase 1,236,073 $30,233,470 543,959 $11,341,956
Shares Outstanding:
Beginning of period 4,325,954 3,781,995
End of period 5,562,027 4,325,954
Total Net Increase (Decrease) $24,794,945 $(33,443,833)
T H E O L S T E I N F U N D S

68
Strategic FundSix Months Ended Year Ended
December 31, 2014 June 30, 2014
Class A Class A
Shares Amount Shares Amount
Shares sold 1,824,111 $32,935,873 2,631,776 $45,049,508
Shares issued to shareholdersin reinvestment of distributions 574,233 9,733,245 189,338 3,180,885
Shares redeemed (947,935) (16,670,749) (798,339) (13,742,662)
Net increase 1,450,409 $25,998,369 2,022,775 $34,487,731
Shares Outstanding:
Beginning of period 4,768,976 2,746,201
End of period 6,219,385 4,768,976
Six Months Ended Year EndedDecember 31, 2014 June 30, 2014
Class C Class C
Shares Amount Shares Amount
Shares sold 299,875 $5,105,752 687,127 $11,221,578
Shares issued to shareholdersin reinvestment of distributions 180,165 2,857,420 64,042 1,020,826
Shares redeemed (160,387) (2,658,538) (136,261) (2,214,898)
Net increase 319,653 $5,304,634 614,908 $10,027,506
Shares Outstanding:
Beginning of period 1,521,322 906,414
End of period 1,840,975 1,521,322
Total Net Increase $31,303,003 $44,515,237
8 Line of Credit The All Cap Value Fund and the Strategic Fund haveuncommitted lines of credit of $50 million and $10 million, respectively,with U.S. Bank, N.A. (the “Bank”), which mature on May 19, 2015, tobe used for liquidity purposes. To the extent that the line is utilized, itwill be collateralized by securities in the Fund’s portfolio. The interestrate on any borrowings is the Bank’s announced prime rate, which was3.25% on December 31, 2014.
During the six months ended December 31, 2014, the All Cap ValueFund did not draw upon the line of credit. During the six months endedDecember 31, 2014, the Strategic Fund had average outstanding borrow-ings of $14,902 under the line of credit and paid a weighted average
T H E O L S T E I N F U N D S

69
interest rate of 3.25%. The October 16, 2014 balance of $2,742,000 wasthe maximum borrowings during the period.
9 Indemnifications Under the Trust’s organizational documents, itsOfficers and Trustees are indemnified against certain liabilities arising outof the performance of their duties to the Funds. In addition, in the nor-mal course of business, the Funds enter into contracts that provide gener-al indemnifications to other parties. The Funds’ maximum exposureunder these arrangements is unknown as this would involve future claimsthat may be made against the Funds that have not yet occurred.However, the Funds have not had prior claims or losses pursuant to thesecontracts and expect the risk of loss to be remote.
T H E O L S T E I N F U N D S

70
T H E O L S T E I N F U N D S
T H E O L S T E I N FUNDS
Additional Information
P R O X Y V O T I N G
The Board of Trustees of the Trust, on behalf of the Funds, has delegated allproxy voting responsibilities related to the portfolio securities held by theFunds to the Investment Manager. A description of the Funds’ proxy votingpolicies and procedures is available without charge, upon request, by callingtoll-free 1-800-799-2113. A description is also included in the Funds’Statement of Additional Information, which is available on the SEC’s websiteat http://www.sec.gov.
The Investment Manager’s proxy voting record for the Funds for annual peri-ods ending June 30 each year will be available to shareholders. The proxyvoting record is available, without charge, upon request by calling, toll-free,1-800-799-2113 and on the SEC website at http://www.sec.gov.
P O R T F O L I O H O L D I N G S
The Funds include complete schedules of their portfolio holdings in the annualand semi-annual reports. The Funds are required to file complete schedules ofportfolio holdings with the SEC for the first and third fiscal quarters on FormN-Q. Once filed, the Form N-Q is available, without charge, upon request onthe SEC’s website at http://www.sec.gov. Copies of Form N-Q can also beobtained by: (i) visiting the SEC’s Public Reference Room in Washington, DC(information on the operation of the Public Reference Room may be obtainedby calling 1-800-SEC-0330); (ii) sending your request and a duplicating fee tothe SEC’s Public Reference Room, Washington, DC 20549-0102; or (iii) send-ing your request electronically to http://[email protected].
A P P R O V A L O F I N V E S T M E N T A D V I S O R YC O N T R A C T S F O R T H E O L S T E I N F U N D S
At a meeting held on September 10, 2014, the Board of Trustees of TheOlstein Funds renewed, for an additional year, the investment managementagreements under which Olstein Capital Management, L.P. (“the Adviser”)manages the Olstein All Cap Value Fund (“All Cap Fund”) and the OlsteinStrategic Opportunities Fund (“Strategic Fund”). The renewals were

71
approved by the full Board, as well as by the Trustees who are not “interestedpersons” (as such term is defined in the Investment Company Act of 1940, asamended) of The Olstein Funds and who are not parties to the investmentmanagement agreement or interested persons of any such party (“IndependentTrustees”). As part of the process of evaluating the renewal of the proposedinvestment management agreements, the Trustees considered information fur-nished throughout the year at regular Board meetings, as well as informationthat they specifically requested in connection with the proposed renewal.Such information included reports on each Fund’s investment performance,fees and expenses, portfolio composition, sales and redemptions along withrelated information about the scope and quality of services provided by theAdviser and periodic reports relating to portfolio management and compli-ance with each Fund’s investment policies and restrictions. The informationspecifically requested by the Board in connection with the proposed renewalincluded special reports based on information prepared by an independentthird party comparing each Fund’s investment performance with relevantbenchmark indices and with that of other comparable mutual funds, and com-paring each Fund’s management fee and overall expense levels with those ofother comparable mutual funds.
The Independent Trustees reviewed and discussed the materials provided bymanagement in connection with the proposed renewals of the ManagementAgreements. In considering the Management Agreements, the IndependentTrustees relied on a memorandum provided by legal counsel, which set forththe Independent Trustees’ obligations under Section 15(c) of the InvestmentCompany Act of 1940, as well as a grid which identified factors that theIndependent Trustees should evaluate in determining whether to renew theManagement Agreements. The Independent Trustees discussed their respon-sibilities in connection with the proposed renewal of the agreements for theAll Cap Fund and the Strategic Fund.
To determine whether to renew the Management Agreements, theIndependent Trustees considered the following factors: (1) the nature andquality of the services provided to the Funds by the Adviser; (2) an examina-tion of each Fund’s performance compared to its respective benchmark indicesand the performance of comparable funds; (3) periodic meetings with theAdviser’s portfolio managers to judge competence and determine theirresponsibilities; (4) the Adviser’s costs for providing the services and the prof-itability of the Funds’ business to the Adviser; (5) fees and expenses incurredby the Funds and their shareholders; (6) economies of scale in relation to the
T H E O L S T E I N F U N D S

72
fee schedule; and (7) an evaluation of soft dollar benefits and any other bene-fits to the Adviser or the Funds as a result of the relationship between theFunds and the Adviser.
In reviewing the nature and quality of services provided by the Adviser, theIndependent Trustees recognized that the Olstein investment philosophy andits “private equity market valuation” and assessment of “quality of earnings”techniques are uncommonly detailed and have a positive impact on theAdviser’s ability to select investments and to determine the appropriate timeto purchase and sell investments. The Independent Trustees recognized thatMr. Robert Olstein, the Adviser’s founder and Chief Investment Officer, is awell-known investment expert in the financial community and recognized forhis astute investment insights. However, Mr. Olstein is only one of seveninvestment professionals, including Eric Heyman, who is the co-portfoliomanager of each Fund, that devote time and resources to the Funds.Accordingly, the Independent Trustees acknowledged that the Adviserdevotes significant professional resources to the Funds. The IndependentTrustees noted, in particular, that the Adviser had not reduced investmentmanagement staff during the last bear market and found that this commit-ment to the Adviser’s long term investment process was evidence of the highquality of service provided to the Funds.
The Independent Trustees also acknowledged that the Adviser provides“important ancillary services” to the Funds, such as providing: (i) support andcompensation to key officers; (ii) vendor oversight; (iii) interaction with legalcounsel and trustees; (iv) regulatory compliance services; (v) assistance to theselling dealer group with respect to broker presentations and conference calls;(vi) marketing material preparation and distribution; (vii) compilation andmaintenance of relevant performance data; (viii) media relations; (ix) main-tenance of the Funds’ website; and (x) payment of revenue sharing and otherrelated fees. In connection with these ancillary services, the IndependentTrustees noted that the Adviser provides extensive monitoring and due dili-gence of key service providers. The Independent Trustees were satisfied withsuch services.
Because of the importance of Fund performance to shareholders, theIndependent Trustees examined with some care the Funds’ performanceagainst indices and appropriate peer groups. In particular, the IndependentTrustees examined the performance of the All Cap Fund (Class C) comparedto a Lipper, Inc. peer group. The data provided in the Funds’ Board of Trustees
T H E O L S T E I N F U N D S

73
materials through June 30, 2014 for the All Cap Fund showed that the Class Cshare performance was in the following quartiles of its Lipper, Inc. peer groupfor the most recent one-year, three-year, five-year, ten-year, and fifteen-yeartime period, respectively: 3rd, 2nd, 3rd, 4th, and 2nd. The IndependentTrustees also reviewed the performance of the All Cap Fund through June 30,2014 compared to the S&P 500® Index and the Russell 3000® Index. The AllCap Fund Class C shares outperformed the S&P 500® Index for the fifteen-year and “since inception” time periods. However, for the remaining timeperiods, the All Cap Fund Class C shares had underperformed such index.The All Cap Fund Class C shares had also outperformed the Russell 3000®
Index for the fifteen-year and “since inception” time periods. However, for theremaining time periods, the All Cap Fund Class C shares had underperformedsuch index. The results for the Adviser Class shares of the All Cap ValueFund were similar although not identical. (No results were provided for theAdviser Class shares for the 15-year time period as compared to the indices asthe class did not yet have 15 years of performance.)
The Independent Trustees also examined the All Cap Fund’s performanceagainst a peer group (Large-Cap Blend) selected by Morningstar®. Becausethe peer group selected by Morningstar® was not the same as the one selectedby Lipper, Inc. the comparative results, although similar, were not identical.As against the Morningstar® peer group, the All Cap Fund Class C shares atAugust 31, 2014 were in the 3rd quartile, 2nd quartile, 2nd quartile, 4th quar-tile, and 1st quartile of performance for the one-year, three-year, five-year,ten-year, and fifteen-year time periods, respectively.
Based on risk-adjusted investment information provided by management ofthe Funds, the excellent results since inception were not obtained at theexpense of undertaking substantial additional risk. On the contrary, the AllCap Fund has a Sharpe Ratio and a Sortino Ratio that compared favorably tothose of the indices.
Based on the foregoing factors, the Independent Trustees found that the long-term performance of the All Cap Fund was excellent but that the Fund’s per-formance in the one, three, five and ten-year time periods was aroundmedian. Nonetheless, the Independent Trustees were impressed with theAdviser’s dedication to its investment management style and practice.
The Independent Trustees also reviewed the performance through June 30,2014 of the Strategic Fund compared to a Lipper, Inc. peer group. TheStrategic Fund had performance which was in the 1st quartile of the Lipper,
T H E O L S T E I N F U N D S

74
Inc. peer group in the one-year, three-year, and five-year time periods for bothclasses of shares, except that the Class C shares were in the second quartile ofperformance for the 1-year time period. The Independent Trustees alsoreviewed such Fund’s performance through June 30, 2014 compared to theS&P 500® Index and Russell 2500® Index. The Class A shares and Class Cshares of the Strategic Fund had outperformed the S&P 500® Index for theone-year, three-year, five-year, and “since inception” time periods and theClass A shares had also outperformed the Russell 2500® Index for all timeperiods. The Class C shares had outperformed the Russell 2500® Index forthe three-year time period. The Independent Trustees also examined theStrategic Fund against a peer group (Small Cap Blend) selected byMorningstar®. Because the peer group selected by Morningstar® was not thesame as the one selected by Lipper, Inc., the comparative results, althoughsimilar, were not identical. As against the Morningstar® peer group, the ClassC shares of the Strategic Fund at August 31, 2014 was in the first quartile foreach of the one-year, three-year, and five-year time periods.
The Independent Trustees then considered the Funds’ costs. Prior to theFunds’ Board of Trustees meeting, they had reviewed a comparison of expensesand investment advisory fees which showed that the All Cap Value Fund’stotal expense ratios were both in the highest quartile of such Fund’s Lipper,Inc. category. The Trustees also noted that the All Cap Fund’s 1.00% advisoryfee was in the highest quartile of its Lipper, Inc. category. The Adviser statedthat it had no plans to limit expenses or waive any fee for the All Cap Fund.The Independent Trustees acknowledged that the expense ratios and advisoryfees were very high. However, they noted that a contributing factor to thehigh expense ratio for the Class C shares was the high 12b-1 fee which the AllCap Fund had to charge to get competitive distribution opportunities and thatthe Independent Trustees believed that such fees helped stockholders in thelong run. Apropos of this observation, the Independent Trustees noted thatthe expense ratio for the Adviser Class shares was closer to the Lipper, Inc.average expense ratio due to the absence of a 12b-1 fee for such class and wasmore comparable to the expense ratios of other funds without Class C shares.
Because the Adviser obtains economies of scale with larger amounts of assetsunder management, the Trustees examined the current break points in the feeschedule for the All Cap Fund. The Trustees expressed a hope that stock-holders would be able to benefit from such break points if the All Cap Fundcould achieve the necessary scale.
T H E O L S T E I N F U N D S

75
The Lipper, Inc. comparison of expenses and investment advisory fees for theStrategic Fund showed that the total expense ratios, after contractual feewaivers, were in the fourth (highest) quartile and the third quartile, respec-tively, of such Fund’s Lipper, Inc. category. The Independent Trustees alsonoted that the Strategic Fund’s 1.00% advisory fee was also in the highestquartile of its Lipper, Inc. category. Nonetheless, the Independent Trusteesbelieved that the fee was appropriate in light of the high quality of serviceprovided, the outstanding performance record of the Fund, the expense limi-tation policy adopted by the Adviser, etc.
The Independent Trustees reviewed the Adviser’s audited financial statementsand considered the Adviser’s profitability for the last three years. TheAdviser’s Section 15(c) materials reported the many steps taken to preserveprofitability and the Adviser’s continuing ability to provide the level of servic-es required by the Funds. The Independent Trustees expressed appreciationfor the Adviser’s actions to preserve its ability to deliver appropriate servicesin a challenging economic environment.
Several of the Independent Trustees expressed the belief that the unique serv-ices provided by the Adviser, the integrity of the Adviser, and the excellentsince inception performance of both Funds warranted an above median fee,and as a result, the Independent Trustees considered the fees and expenses ofboth Funds to be reasonable.
The Independent Trustees considered the use of “soft dollars” by the Fundsand expressed satisfaction with the activities giving rise to such “soft dollars”.The Adviser strives to ensure that each portfolio bears an appropriate alloca-tion of soft dollar trades in light of the potential benefits to each portfolioresulting from the research and execution of services received. Currently, theAdviser’s “soft dollar” activities consist of an arrangement with BloombergTradebook in which the Adviser engages in certain portfolio trades to obtainSidoti & Company, Bloomberg Professional Service Accommodation Policyand Value Line Publishing LLC research products and execution services.The Adviser also receives various proprietary research products from certainbrokers on behalf of the Funds.
The Independent Trustees also considered their separate discussion with theFunds’ Chief Compliance Officer regarding the soft dollar benefits that accrueto the Adviser from its relationships with the Funds and were satisfied withthe results of such discussions.
T H E O L S T E I N F U N D S
76
The Independent Trustees also considered the fall out or ancillary benefits tothe Adviser including the Adviser’s receipt of compensation in connectionwith its distribution and sales efforts; receipt of economic and fundamentalresearch reports through soft dollar arrangements; receipt of proprietaryresearch products and reports from broker-dealers as a benefit to best execu-tion trading relationships with broker-dealers; and participation with theTrust in a joint errors and omissions/directors and officers liability insurance.
Based on the foregoing factors, after deliberation, and after considering thelong, historical relationship between the Adviser and the Funds, theIndependent Trustees concluded that the management fees paid by the AllCap Fund and the Strategic Fund were fair and reasonable in light of thenature and the quality of the services provided by the Adviser, its costs andthe Funds’ current and reasonably anticipated asset levels and that the man-agement agreements for both Funds should be approved and renewed for anadditional year.
T H E O L S T E I N F U N D S

77
( T H I S P A G E I N T E N T I O N A L L Y L E F T B L A N K . )

78
T H E O L S T E I N F U N D S
P R I V A C Y P O L I C Y
FACTS WHAT DOES THE OLSTEIN FUNDS DOWITH YOUR PERSONAL INFORMATION?
Why? Financial companies choose how they share your personal informa-tion. Federal law gives consumers the right to limit some but not allsharing. Federal law also requires us to tell you how we collect,share, and protect your personal information. Please read this noticecarefully to understand what we do.
What? The types of personal information we collect and share depend on theproduct or service you have with us. This information can include:• Social Security number and employment information• transaction history and wire transfer instructions• account balances and checking account informationWhen you are no longer our customer, we continue to share yourinformation as described in this notice.
How? All financial companies need to share customers’ personal informa-tion to run their everyday business. In the section below, we list thereasons financial companies can share their customers’ personalinformation; the reasons The Olstein Funds chooses to share; andwhether you can limit this sharing.
Reasons we can share your Does The Olstein Can you limitpersonal information Funds share? this sharing?
For our everyday business purposes—such as to process your transactions,maintain your account(s), respond to Yes Nocourt orders and legal investigations,or report to credit bureaus
For our marketing purposes—to offer our products and services to you Yes No
For joint marketing withother financial companies No We don’t share
For our affiliates’ everydaybusiness purposes—information about your Yes No
transactions and experiences
For our affiliates’ everydaybusiness purposes— No We don’t shareinformation about your creditworthiness
For our affiliates to market to you No We don’t share
For nonaffiliates to market to you No We don’t share
Questions? Call 800-799-2113 or go to www.olsteinfunds.com

79
T H E O L S T E I N F U N D S
H O U S E H O L D I N G N O T I C E
In order to reduce expenses, we will deliver a single copy of prospectuses andfinancial reports to shareholders with the same residential address, providedthey have the same last name or we reasonably believe them to be members ofthe same family. Unless we are notified otherwise, we will continue to sendyou only one copy of these materials for as long as you remain a shareholderin The Olstein Funds. If you would like to receive individual mailings, pleasecall (800) 799-2113 and you will be sent a separate copy of these materials.
This Privacy Policy is not a part of this Semi-Annual Report.
Who we are
Who is providing The Olstein Fundsthis notice?
What we do
How does The Olstein To protect your personal information from unauthorizedFunds protect my access and use, we use security measures that comply withpersonal information? federal law. These measures include computer safeguards
and secured files and buildings.
How does The Olstein We collect your personal information, for example, when you:Funds collect my • open an account or give us your contact informationpersonal information? • make a wire transfer or seek advice about your investments
• make deposits or withdrawals from your account
Why can’t I limit Federal law gives you the right to limit only:all sharing? • sharing for affiliates’ everyday business purposes—infor-
mation about your creditworthiness• affiliates from using your information to market to you• sharing for nonaffiliates to market to youState laws and individual companies may give you addi-tional rights to limit sharing.
Definitions
Affiliates Companies related by common ownership or control.They can be financial and nonfinancial companies.• Our affiliates include Olstein Capital Management, L.P.
Nonaffiliates Companies not related by common ownership or control.They can be financial and nonfinancial companies.• The Olstein Funds does not share with nonaffiliates so they
can market to you.
Joint marketing A formal agreement between nonaffiliated financial com-panies that together market financial products or servicesto you.• The Olstein Funds doesn’t jointly market.
The Olstein Funds4 Manhattanville RoadPurchase, NY 10577
OlsteinAll Cap Value Fund
OlsteinStrategic Opportunities Fund
TrusteesRobert A. Olstein, ChairmanFred W. LangeJohn LohrD. Michael MurrayDaniel G. NelsonErik K. OlsteinLawrence K. Wein
Investment ManagerOlstein Capital Management, L.P.4 Manhattanville RoadPurchase, NY 10577
DistributorOlstein Capital Management, L.P.
Administrator, Transfer Agent,Dividend Paying Agent &Shareholder Servicing AgentU.S. Bancorp Fund Services, LLC615 East Michigan StreetP.O. Box 701Milwaukee, WI 53202
CustodianU.S. Bank, N.A.1555 North RiverCenter Drive, Suite 302Milwaukee, WI 53212
Legal CounselStradley, Ronon, Stevens & Young, LLP2005 Market Street, Suite 2600Philadelphia, PA 19103-7098
Independent Registered PublicAccounting FirmCohen Fund Audit Services1350 Euclid Avenue, Suite 800Cleveland, OH 44115
This report is submitted for the generalinformation of the shareholders of theFunds. The report is not authorized fordistribution to prospective investors in theFunds unless preceded or accompaniedby an effective Prospectus.
Toll Free Telephone800.799.2113www.olsteinfunds.com