oluciones para - tecnología total, integridad de ductos y...
TRANSCRIPT

Te dará el “peace of mind” que necesitas
Calidad garantizada acompañado con un personal altamente calificado
ISO/TS 24817, NSF/ANSI Standard 61, ASME B31.4 & ASME B31.8
Cumple con las normas: ASME PCC-2, Art 4.1, DOT 49 Parts CFR192/ 195,
Todo tipo de geometría, temperaturas, químicos y aplicación bajo agua.
Soluciones para tuberías con corrosión
AquaWrap®

de corrosión. Los sistemas AquaWrap® & GatorWrap® son lo de alta resistencia
utilizados para la rehabilitación y reparación de líneas de transporte y distribución
afectadas por corrosión o erosión.
Unas de las mayores ventajas sobre los sistemas AquaWrap® & GatorWrap® es su
versatilidad ya que pueden ser aplicados en todos los ambientes (bajo agua) y
geometrías complejas, tales como: conexiones T, codos, secciones rectas y
superficies irregulares y espacios limitados que requieren refuerzo estructural. Las
propiedades adhesivas del sistema hacen que el producto pueda ser aplicado en
casi todo tipo de sustratos.
Los sistemas AquaWrap® & GatorWrap® están diseñado para proveer la
resistencia necesaria, devolviéndole a la tubería las condiciones originales de
máxima presión de operación sin necesidad de parar la producción. El sistema
esta probados conjunta e independientemente tanto en laboratorios de Los
Estados Unidos de América.
A continuación me complace presentarles los ensayos de laboratorio y fichas
técnicas relacionadas con los sistemas AquaWrap® & GatorWrap®.
Esperamos poder servirle de inmediato apoyándolo a mitigar sus problemas de
corrosión, nosotros ofrecemos la mejor alternativa y los mayores beneficios,
¡déjennos probarlo!
Para mayor información, visítenos en la página web para localizar nuestro
TECNOLOGIA TOTAL le frece la mejor solución para sus problemas
www.tecnologiatotal.net
representante más cercano o escribanos: [email protected]

TABLA DE CONTENIDOS
1. ISO Certificate Of Registration Of Manufacturer…………………………………………………………………………1
2. Reinforced Concrete Beam Test Report. Structural Evaluation of AquaWrap Composite System
for Repair and Strengthening of Reinforced Concrete Beams By Air Logistics Corporation…………2
3. ASME PCC-2 Compliance Certification By STRESS ENGINEERING SERVICES INC……………..……………3
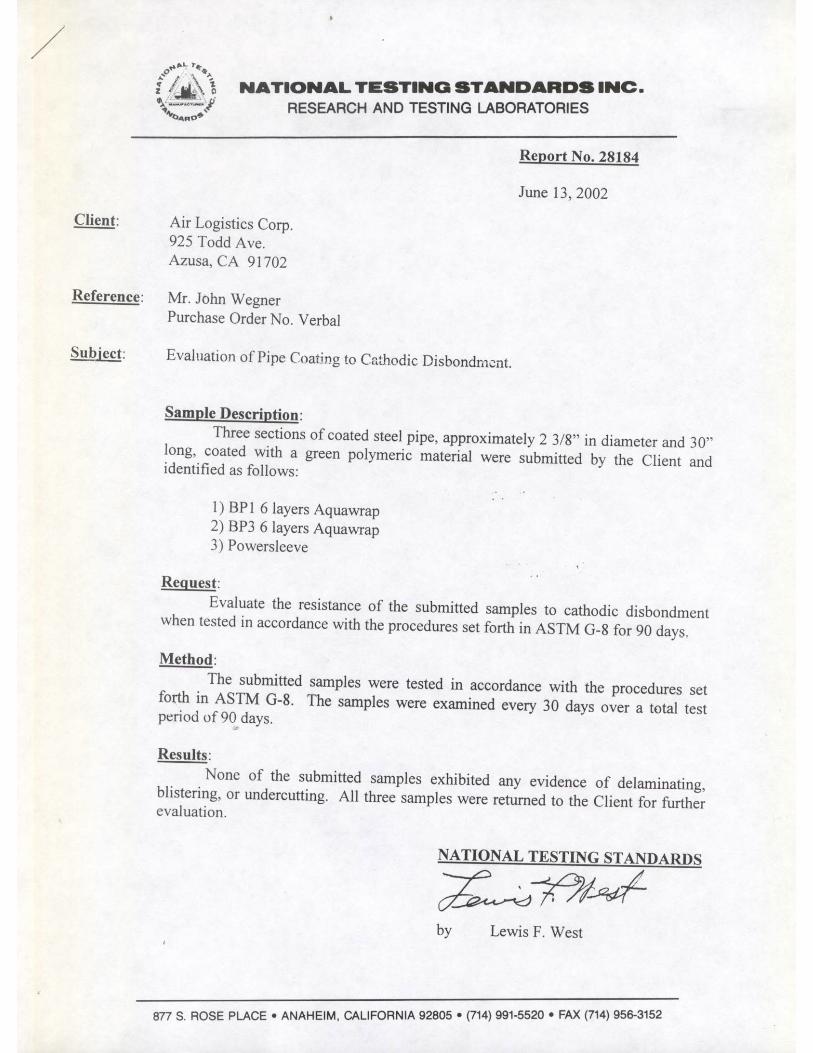
4. Cathodic Disbodment Report. Evaluation of Pipe Coating to Cathodic Disbondment By NATIONAL
TESTING STANDARDS INC. RESEARCH AND TESTING LABORATORIES………………………………………….4
5. Tensile Test Result Summary By WH Laboratories………………………………………………………………………5
6. Evaluation of the Aquawrap®System in Reparing Mechanically Damaged Pipes . Prepared by
SRESS ENGINEERING SERVICES INC for Air Logistics,Inc Azusa,CA ……………………………………………….6
7. Analysis of Aquawrap® for use in Repairing Damaged Pipelines. Environmental Exposure
Conditions Property Testing Procedures Field Testing Evaluations Prepared by Franz L. Worth.PE.
Air Logistics,Inc Azusa,CA……………………………………………………………………………………………………………7
8. Pipeline Research Council International, Inc. (PRCI) Long-term Study of Composite Repair
Systems. Pipeline Research Council International, Inc. (PRCI) Co-sponsored Long-term Composite
Repair Study. Year 0 Burst Test Progress Report (December 2008)……………………………………………..8
9. Pipeline Research Council International, Inc. (PRCI) Co-sponsored Long-term Composite Repair
Study. Year 1 Burst Test Progress Report (January 2011)……………………………………………………………9
10. Evaluation of the Aqua wrap® Composite Repair System. Prepare by Robert B. Francini and John
F. Kiefner. Kiefner and Associates, Inc………………………………………………………………………………………10
11. Multi-Station Tensile Creep Testing Facility . By Scott L. Coguill. Composite Materials Research
Group.University of Wyoming. Laramie,WY 82071. Franz L. Worth ,PE. AirLogistics Corporation.
Pasadena,CA 91107…………………………………………………………………………………………………………………..11
12. Analysis of Aquawrap® for use in Reparing Pipeslines with a Dent / Gouge Defect. Procedure and
Evaluation of Cycle Test Prepared by Franz L. Worth, PE. AirLogistics Corporation……………………12
13. Environmental Durability of Structural AquaWrap®. Environmental Exposure Conditions
Property Testing Procedures And Results for Structural AquaWrap® By Air Logistics
Corporation………………………………………………………………………………………………………………………………13
14. Technical Data Sheet AquaWrap® G03 & G-05………………………………………………………………………….14
15. Technical Data Sheet AquaWrap® Black (Carbon Fiber) ……………………………………………………………15
16. Technical Presentation………………………………………………………………………………………………………………16


March 9, 2009 PN114315CRA Mr. Franz Worth, P.E. Air Logistics Corporation 925 North Todd Avenue Azusa, CA 91702 Phone: 626-633-0294 E-mail: [email protected] SUBJECT: Review of Air Logistics Test Program Relative to ASME PCC-2 Requirements Franz, Per your request, Stress Engineering Services, Inc. (SES) has reviewed the testing documentation package that you provided and compared the completed tests to the ASME PCC-2 testing requirements. Table 1 on the attached page was prepared by one of our staff members after reviewing all of the documentation that you provided to us. This documentation included both hard copies, as well as electronic versions of the testing results obtained by numerous third party test labs. Of the sixteen (16) possible types of tests that are required by ASME PCC-2, your documentation demonstrated that all but two (2) of the listed tests were completed. These included the following:
• Test #9 – Impact performance per Appendix VI of ASME PCC-2 that is required only for composite repair systems used to repair leaking pipes.
• Test #16 – Chemical compatibility that is listed as an optional requirement (ASTM D 543, ASTM C 581, ASTM D 3681, and ISO 10952).
Therefore, of all the mandatory tests that are required for composite repair systems used to provide structural reinforcement (i.e. not the repair of leaking pipes); Air Logistics, Inc. has completed all of the required testing efforts. It should be noted that SES has made no effort to confirm the validity or accuracy of the reported test results that were provided. Additionally, no attempt has been made to compare test results to the minimum requirements relative to the specified ASME PCC-2 tests. We have appreciated the opportunity to be of service to you and appreciate the level of detail associated with the provided documentation. Please feel free to contact me if you have any questions or comments related to our review of your test program. Regards,
Dr. Chris Alexander [email protected] Direct phone: 281-897-6504 Cell phone: 281-450-6642 Attachments: ASME PCC-2 test requirement table
SENIOR PRINCIPALS President Joe R. Fowler, Ph.D., P.E.
Senior Vice President W. Thomas Asbill, P.E.
Vice Presidents Ronald D. Young, Ph.D., P.E. Clinton A. Haynes Jack E. Miller, P.E. J. Randy Long, P.E.
PRINCIPALS James W. Albert, P.E. Christopher Alexander, Ph.D. Claudio Allevato, Corp. LIII Kenneth K. Bhalla, Ph.D. Mark A. Bennett, P.E. Richard S. Boswell, P.E. Helen Chan, C.P.A. John F. Chappell, P.E. Kimberly O. Flesner, P.E. S. Allen Fox, P.E. David L. Garrett, Ph.D. Andreas T. Katsounas, P.E. Terry M. Lechinger Christopher Matice, Ph.D., P.E. Charles A. Miller, P.E. George R. Ross, Ph.D., P.E. Ramón I. San Pedro, P.E. Teri Shackelford Matthew J. Stahl, D.Eng., P.E. David A. Tekamp, P.E. Kurt D.Vandervort, Ph.D., P.E. Kenneth R. Waeber, P.E. Robert E. Wink, P.E. Bobby W. Wright, P.E.
SENIOR ASSOCIATES/ STAFF CONSULTANTS Glenn A. Aucoin, P.E. Richard C. Biel, P.E. J. Kirk Brownlee, P.E. Michael J. Effenberger, P.E. Greg Garic, P.E. Robert B. Gordon, Ph.D., P.E. Lori C. Hasselbring, Ph.D., P.E. David P. Huey, P.E. Daniel Krzywicki, P.E., CSP Kenneth R. Riggs, Ph.D., P.E.
SENIOR ASSOCIATES Rafik Boubenider, Ph.D., P.E. Roger D. Cordes, Ph.D., P.E. Donnie W. Curington Nripendu Dutta, Ph.D., P.E. Steven A. Garcia Mark E. Hamilton Brett A. Hormberg William A. Miller, P.E. John M. Moore Ronald A. Morrison, P.E. Thomas L. Power, Ph.D., P.E. Brian S. Royer, P.E. Mahmod Samman, Ph.D., P.E. Daniel A. Pitts, P.E. Lane E. Wilson Leo Vega
STAFF CONSULTANTS Ray R. Ayers, Ph.D., P.E. Clinton H. (Clint) Britt, P.E. Joe W. Frey, P.E. Michael W. Guillot, Ph.D., P.E. Steve Hoysan, Ph.D., P.E. Joe Kintz, P.E. Paul J. Kovach, P.E. Ron Scrivner Jackie E. Smith, P.E.
ASSOCIATES Lyle E. Breaux, P.E. Douglas E. Drahem Kenny T. Farrow, Ph.D. Stuart J. Harbert, Ph.D., P.E. Scot T. McNeill David F. Renzi Chad Searcy, Ph.D. Obaidullah Syed, P.E. Kevin Wang, Ph.D., P.E.
SENIOR ANALYSTS Napoleon F. Douglas, Jr. Lixin Gong, Ph.D. Yun Han, Ph.D. Won Kim, Ph.D. Dilip Maniar, Ph.D. Bo Yang, Ph.D. Hong Zhou, Ph.D.
ANALYSTS J. Julian Bedoya Jonathan Brewer Rhett L. Dotson Michael L. Ge Sachin V. Kholamkar Karen Lucio Brent Vyvial

Table 1 – Summary of Air Logistics Completed Testing Efforts Relative to ASME PCC-2 Requirements
Number Property Test Type Detail Properties Minimum Values Testing Performed? Result Test
Specification
1Tensile
StrengthM
Tensile strength, modulus, Poisson's ratio (for leaking pipes
and some design cases); strain to failure in both hoop and axial
directions
Strain to failure must be
greater than 1%yes See data sheets
ISO 527, ASTM D
3039
2In Plane shear
modulus
M for
leaking
pipes only
Modulus only None yes Avg: 0.781 Msi ASTM D 5379
3Per ply
thicknessM Thickness per ply None yes see tensile strength data sheets
None, may be
determined from the
tensile tests above
4 Hardness M Barcol or Shore hardness data None yes see tensile strength data sheetsBS EN 59, ISO 868.
ASTM D 2583
5
Coefficient of
thermal
expansion
M CTE value None yes see data sheetsISO 11359-2, ASTM E
831
6
Glass
transition
Temperature
M or use
HDT belowGlass transition temperature Tg
None except that this can
determine the maximum
operating temperature of
the composite system
yes
Type 439 Resin: 120 C
71035/73013 Resin: 87 C
Sun Glass VE Resin: 105 C
ISO 11359-2, ASTM D
831, ASTM E 1640,
ASTM E 6604
7Heat distortion
temperature
M or use Tg
AboveHeat distortion temperature HDT
None except that this can
determine the maximum
operating temperature of
the composite system
yesAquawrap: >325 F
PS Fabric with standard resin: 300 FISO 75, ASTM E 2483
8Adhesion
strengthM Shear strength of composite bond to steel 4NM/m
2 (580 psi) yes See data sheets
BS EN 1465, ASTM D
3165
9Impact
performance
Leaking
pipes onlyLow velocity impact performance
Withstand drop test per
appendix VI.no none Appendix VI
10Energy
release rate
Leaking
pipes onlyToughness parameter, energy release rate gamma None yes 56.6 J/m^2 Appendix IV
11
Long term lap
shear
performance
OMeasurement of lap shear strength after 1000 hour heat
exposure (may be wet)
30% of lap shear
strength determined per
item 8 above..
yesSee data sheets including Adhesion
Strength data sheetsAppendix II-2
12Structural
strengtheningM
Wrapped pipe with defect must withstand a short-term
pressure testWrap must not fail yes
8200 psig, pass
6900 psig, passAppendix III
13Long term
strengthO
Determine long -term (creep-rupture) strength of the wrap by
either of three methods
None, note that this test
qualifies the wrap
pursuant to table 5.
yes See data sheetsAppendix V and ASTM
D 2922
14Cathodic
disbindementO Cathodic disbindement None yes
No delaminating, blistering, or
undercuttingASTM-G 8
15Electrical
ConductivityO Dielectric Strength None yes Avg: 180 volts/mil
ISO 14692 ASTM D
149
16Chemical
CompatabilityO Chemical Compatability None informal only none
ASTM D 543 ASTM C
581 ASTM D 3681 ISO
10952
TEST REQUIREMENTS AND METHOD SUMMARY

PRCI LONG-TERM STUDY OF COMPOSITE REPAIR SYSTEMS PN113586CRA Prepared for PRCI and Composite Repair Manufacturers July 2008

PRCI LONG-TERM STUDY OF COMPOSITE REPAIR SYSTEMS
PN113586CRA
Prepared for PRCI and Composite Repair
Manufacturers
Prepared by: Chris Alexander, Ph.D.
Principal
Ron Scrivner
Staff Consultant
July 2008
Page 1 of 11
PRCI Long-term Study of Composite Repair Systems Project Summary Document prepared by Stress Engineering Services, Inc.
Prepared for the Composite Repair Manufacturers · July 14, 2008
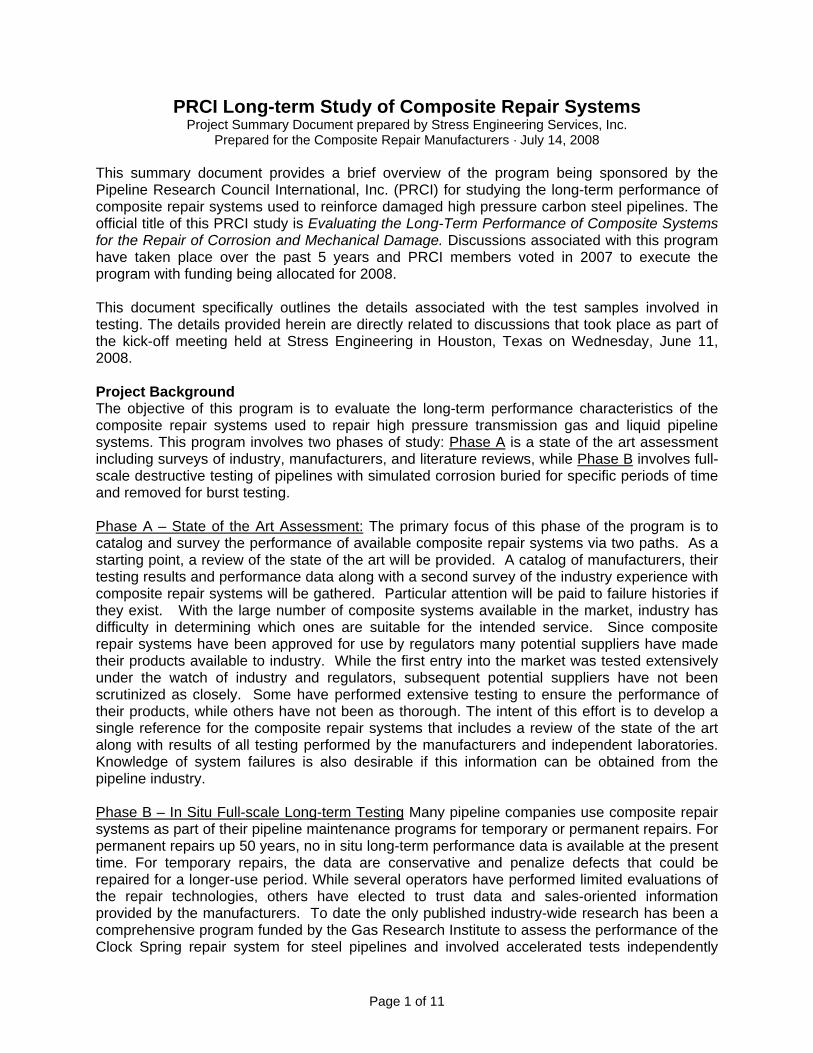
This summary document provides a brief overview of the program being sponsored by the Pipeline Research Council International, Inc. (PRCI) for studying the long-term performance of composite repair systems used to reinforce damaged high pressure carbon steel pipelines. The official title of this PRCI study is Evaluating the Long-Term Performance of Composite Systems for the Repair of Corrosion and Mechanical Damage. Discussions associated with this program have taken place over the past 5 years and PRCI members voted in 2007 to execute the program with funding being allocated for 2008. This document specifically outlines the details associated with the test samples involved in testing. The details provided herein are directly related to discussions that took place as part of the kick-off meeting held at Stress Engineering in Houston, Texas on Wednesday, June 11, 2008. Project Background The objective of this program is to evaluate the long-term performance characteristics of the composite repair systems used to repair high pressure transmission gas and liquid pipeline systems. This program involves two phases of study: Phase A is a state of the art assessment including surveys of industry, manufacturers, and literature reviews, while Phase B involves full-scale destructive testing of pipelines with simulated corrosion buried for specific periods of time and removed for burst testing. Phase A – State of the Art Assessment: The primary focus of this phase of the program is to catalog and survey the performance of available composite repair systems via two paths. As a starting point, a review of the state of the art will be provided. A catalog of manufacturers, their testing results and performance data along with a second survey of the industry experience with composite repair systems will be gathered. Particular attention will be paid to failure histories if they exist. With the large number of composite systems available in the market, industry has difficulty in determining which ones are suitable for the intended service. Since composite repair systems have been approved for use by regulators many potential suppliers have made their products available to industry. While the first entry into the market was tested extensively under the watch of industry and regulators, subsequent potential suppliers have not been scrutinized as closely. Some have performed extensive testing to ensure the performance of their products, while others have not been as thorough. The intent of this effort is to develop a single reference for the composite repair systems that includes a review of the state of the art along with results of all testing performed by the manufacturers and independent laboratories. Knowledge of system failures is also desirable if this information can be obtained from the pipeline industry. Phase B – In Situ Full-scale Long-term Testing Many pipeline companies use composite repair systems as part of their pipeline maintenance programs for temporary or permanent repairs. For permanent repairs up 50 years, no in situ long-term performance data is available at the present time. For temporary repairs, the data are conservative and penalize defects that could be repaired for a longer-use period. While several operators have performed limited evaluations of the repair technologies, others have elected to trust data and sales-oriented information provided by the manufacturers. To date the only published industry-wide research has been a comprehensive program funded by the Gas Research Institute to assess the performance of the Clock Spring repair system for steel pipelines and involved accelerated tests independently

Page 2 of 11
assessing the adhesive and composite. However, this work is over ten years old and did not incorporate long-term testing on buried repair units. Several in-service failures of composite repair systems have reportedly taken place, primarily rooted in failure of the adhesives, poor installation techniques, and development of corrosion beneath the repairs. Short and long-term performance assurance is needed to assess the longevity of the current repair systems. The primary focus of the present program is to confirm the performance of actual composite repair systems on pipes subject to in situ service conditions including cyclic internal pressure, cathodic protection, and environmental soil effects. This will be accomplished by conducting performance evaluations of the current composite repair technologies that have been employed to repair corrosion, dents, and mechanical damage. The desired solution is for industry to avoid replacing perfectly good composite repairs due to a lack of engineering data to support their longevity. This program will also provide a greater understanding about the capabilities and limitations in the short and long term use of composite materials to repair pipelines. Each manufacturer will be contacted about completing a survey on aspects associated with their particular composite repair system. Included in this survey will be questions regarding their experiences. General Description of Project Execution The following general activities will be completed as part of this study. Activities in the first year of the study will include the following activities.
• Utilize the test matrix selected by the project team including o 12.75-inch x 0.375-inch, Grade X42 pipe. o Machine corrosion areas with depths of 40%, 60%, and 75% of the pipe’s nominal
wall with a dimension of 8 inches axially and 6 inches circumferentially. o Weld end caps to sample. o Sandblast area required for installation. o Measure wall thickness in machined corroded region o Pressurize samples to induce 90% of the minimum specified yield strength in
corroded region (e.g. 556 psi generates stress of 37.8 ksi, which is 90% of 42 ksi, in the 75% corroded region).
o Install strain gages in machined corroded region.
• Have composite repairs installed by each manufacturer. Each manufacturer should provide to Stress Engineering Services, Inc. a calculation package showing how the repair thickness was determined for each of the three corroded samples.
• Install strain gage on outside surface of composite materials for selected samples.
• Perform the Year 0 (base case) burst tests.
• (OPTION) Coat outside of composite repairs (each manufacturer is responsible for doing this on their repair systems including supplies and personnel).
• Excavate region of SES Waller Test Lab where pipes are to be buried with a target depth for having 18 inches of cover on top of pipe.
• Bury pipe samples as appropriate and connect the pressure system, cathodic protection system, and the data acquisition system for monitoring strain beneath the repairs.
• Pressure cycle and blow down the test samples at the designated periods of time. Record strain gage data monthly during periods of pressure application.

Page 3 of 11
Activities in Years 1 through 3 will include the following activities.
• Pressure cycle and blow down the test samples at the designated periods of time. Record strain gage data monthly. Monthly pressure cycling will include one blow-down pressure to psi and 75 cycles from 36% to 72% SMYS.
• Remove pipe samples and perform burst tests at the ends of Year 1, 2, and 3.
• For those companies participating in the three year study, a total of 12 samples will be fabricated with three samples for each repair being pressurized to failure at 0, 1, 2, and 3 years.
The buried pipes will be monitored over a three-year period. The samples will be cycled once per month (e.g. 75 cycles at 50% MAOP) and blown down and then re-pressurized (e.g. 1 cycle at 100% MAOP) once every month. This combination of pressure cycles is considered to be an aggressive representation of actual pressure conditions for a gas pipeline system over a 50 year period. At the end of each subsequent year (1, 2, and 3) one set of three (3) samples will be removed from the buried soil environment, documented, and then burst tested. For those manufacturers who opt for the 10-year study, additional samples will be fabricated for burst testing at 5, 7.5, and 10 years. For this extended period of testing an additional nine (9) samples will be required for each repair system. The pipe geometry and grade used in this study will be 12.75-inch x 0.375-inch, Grade X42 pipe with a rectangular corrosion patch that measures 8 inches (longitudinally) by 6-inches (circumferentially). The depths of corrosion to be studied include 40, 60, and 75% of the pipe’s nominal wall thickness. The geometry for the machined corrosion region is shown in Figure 1. Strain gages will be installed at specific locations that include the corrosion region beneath the repair, on the base pipe, and on top of the composite material. Figure 2 shows the layout for these samples. Each sample will be 8 feet in length and include welded end caps with 1-inch NPT pressure port fittings. Once the samples are fabricated, those samples that are designated for burial will be shipped to the test site. Figure 3 shows the general layout for the buried test samples. As noted, each group of test samples includes a set of three. This figure is drawn as if three manufacturers will participate for a three year period, while another three manufacturers have elected to participate for the 10-year testing period (a total of six participants are illustrated in this figure). Activities in Years 3 through 10 will include the following activities.
• This phase of work is a continuation of efforts completed as part of the 3 year study.
• Pressure cycle and blow down the test samples at the designated periods of time. Record strain gage data monthly.
• Remove pipe samples and perform burst tests at the ends of Year 5, 7.5, and 10.
• For those companies participating in the ten year study, a total of 21 samples will be fabricated with three samples for each repair being pressurized to failure at 0, 1, 2, 3, 5, 7.5, and 10 years.
Program Specifics This section of the package is provided to give specific details on what will be expected from each manufacturer and what each manufacturer can expect during their interactions with SES. Of particular note is the schedule. The current schedule is based on the assumed availability of each manufacturer and currently-scheduled SES staff. It is important that each manufacturer

Page 4 of 11
review their allotted time on the schedule and make the necessary arrangement including personnel and supplies for completing all of their repairs (i.e. 12 samples for the 3-year study and 21 samples for the 10-year study participants). Each manufacturer will only be given one week for making their respective repairs. General schedule • June/July/August
Purchase pipe materials Machine simulated corrosion in pipe samples Sandblast pipes Install strain gage
• September/October/November Make repairs (coordinated scheduling) Perform round of Year 0 burst tests (3 per manufacturer) Prepare buried pipe test site and facility Bury pipe samples (all pipes will be buried at the same time) Connect all required instrumentation, CP systems, and pressure equipment
Listed below are the specifics weeks during which manufacturers will be invited to SES facilities to make repairs. Each manufacturer is expected to provide enough materials and personnel to complete all repairs in a one week period. The numbers shown in parentheses correspond to the number of samples that will be required from each respective manufacturer (12 for the 3-year study and 21 for the 10-year study). Additionally, if a manufacturer would like to have their repair system coated prior to burial, they will be responsible for doing this including providing materials and personnel for doing so. Fabrication Weeks Week of July 14 Inspect pipe and cut pipe (1,440 feet of pipe purchased) Week of July 21 Start machining work Week of July 28 Start welding end caps and continue machining Week of August 4 Continue welding end caps and machining (33 complete) Week of August 11 Continue welding end caps and machining Week of August 18 Continue welding end caps and machining (66 complete) Week of August 25 Continue welding end caps and machining Week of September 1 Continue welding end caps and machining (99 complete) Week of September 8 Continue welding end caps and machining Week of September 15 Continue welding end caps and machining (132 complete) Week of September 22 Continue welding end caps and machining Week of September 29 Continue welding end caps and machining (165 complete) Installation Weeks Week of September 8 Clock Spring (12) Armor Plate (21) Week of September 22 Air Logistics (12) Citadel (21) Week of October 6 Pipe Wrap (12) EMS (21) Week of October 13 Wrap Master (12) T.D. Williamson (21) Week of October 20 Walker Technical Resources (12) 3X Engineering (21)

Page 5 of 11
Burst Test Weeks (30 total samples for 10 manufacturers) Week of October 13 Burst testing Week of October 20 Burst testing (continued) Week of October 27 Burst testing (continued) Week of November 3 Burst testing (continued) Sample Burial Installation Weeks Week of October 6 Installation work (site preparation work and other activities) Week of October 13 Installation work (continued) Week of October 20 Installation work (continued) Week of October 27 Installation work (continued) Week of November 3 Installation work (continued) Testing Kick-off Weeks Week of November 10 Pressurize samples and check for leaks and that strain gages are
reading properly Week of November 17 Bury samples, check CP system, and make sure pressure is
maintained Test Sample Preparation Provide below is a list of specific details associated with each test sample. • Fabrication of test samples
Years of participation: • Three (3) year study participants: Four (4) test periods: 0, 1, 2, and 3 years • Ten (10) year study participants: Seven (7) test periods: 0, 1, 2, 3, 5, 7.5, and
10 years Three (3) duplicate samples of each repair system
• 12 samples per manufacturer for 3-year study participants • 21 samples per manufacturer for 10-year study participants
Machine corrosion to specified depths of 40, 60, and 75 percent of the 0.375-inch nominal pipe wall
• Sandblast samples 1 • Measure wall thickness in machined corroded region • Install strain gages • Pressurize samples to induce minimum specified yield (42 ksi) in corroded region • Repair samples using composite systems • Install remaining strain gages as appropriate Year 0 Burst Tests • Connect data acquisition (DAQ) system to strain gages and pressure transducer • Pressurize sample to failure and record data at one scan per second • Record failure pressures and plot strain as a function of internal pressure for each
sample (tabulate maximum strain recorded in repaired region at design pressure and ultimate pressure)
1 After sandblasting, samples will be shipped to SES’s air-conditioned test facility and placed inside for installing strain gages. Every
effort will be made to permit repairs to be made inside the test lab. This has been SES’s typical mode of operation as long as the repair systems do not contain Volatile Organic Compounds (VOCs). Additionally, some of you have requested that sandblasting be performed within a short period of time (e.g. 24 hours) before the repairs are made; however this is not possible with the current schedule and scope of work that includes strain gage installation.

Page 6 of 11
Long-term Burial Study • Prepare test area by excavating test site • Connect samples to pressure system, pressure relief valves, CP system, and strain
gages to data acquisition system • Pressure samples to MAOP • Bury test samples and monitor/pressure cycles monthly (record with DAQ system)
Monthly blow down to 0 psi 75 pressure cycles at 50% MAOP (cycle from 36% to 72% SMYS) once per month
• Maintain pressure in samples at 36% SMYS continuously for all periods except when monthly pressure cycling is being conducted
• Remove samples for testing and burst at specified periods of time (e.g. 1, 2, 3, 5, 7.5, and 10 years)
• Review burst failures and report results Note that a pressure level of 35% SMYS will be maintained continuously in the pipe samples except during the monthly pressure cycling periods. Closing Comments The next several months at Stress Engineering are going to involve a significant amount of work that includes (or has included) purchasing pipe, coordinating machining and fabricating work, sandblasting, pressurizing samples to induce local yielding, installing strain gages, and coordinating with manufacturers time for repair activities. In anticipation of upcoming events, we request that each manufacturer do the following: 1. Prepare a written design package that details the methods used to determine the required
thickness for each corrosion repair depth (i.e. 40, 60, and 75% of the nominal pipe wall thickness). This should be submitted to SES prior to your scheduled installation repair time.
2. Determine and gather the required amount of material for making repairs on all of your test samples (9 samples for the 3-year participants and 21 samples for the 10-year participants).
3. Make sure you have enough staff available in Houston to make all repairs in one week. There will be no exceptions as we have limited space and resources for making these repairs.
4. You are welcome to join us for the times during which we will be pressurizing your test samples to failure. As the time approaches, we will issue a schedule detailing when these burst tests will be made. Based on projected schedule estimations, these will be done between the weeks of October 13 and November 3.
Page 7 of 11
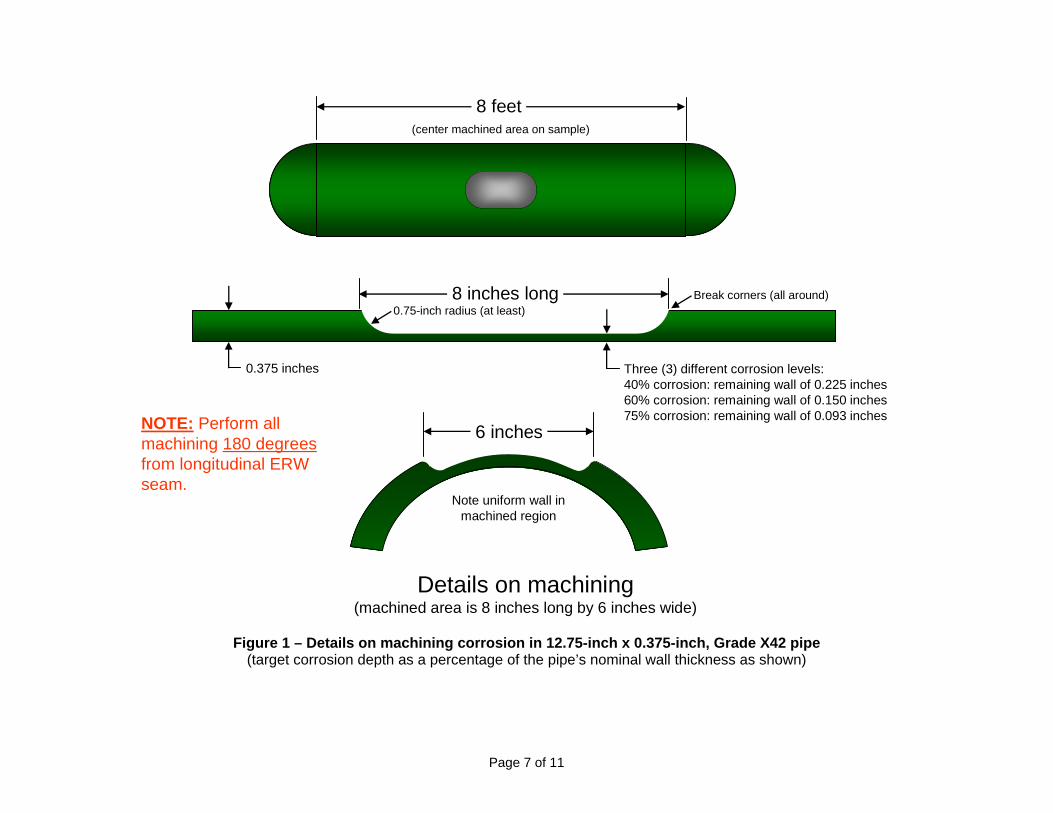
Figure 1 – Details on machining corrosion in 12.75-inch x 0.375-inch, Grade X42 pipe (target corrosion depth as a percentage of the pipe’s nominal wall thickness as shown)
8 inches long0.75-inch radius (at least)
0.375 inches Three (3) different corrosion levels:
40% corrosion: remaining wall of 0.225 inches
60% corrosion: remaining wall of 0.150 inches
75% corrosion: remaining wall of 0.093 inches
Break corners (all around)
Details on machining(machined area is 8 inches long by 6 inches wide)
Note uniform wall in
machined region
6 inches
8 feet(center machined area on sample)
NOTE: Perform all
machining 180 degrees
from longitudinal ERW
seam.

Page 8 of 11
Figure 2 – Test sample layout including strain gage locations NOTE: The plan for strain gauging is that all samples will have at least one bi-axial gage installed beneath the composite repair (Gage #3 in above figure); however, only one-third of all samples will have all four strain gages installed as shown above. In having strain gages installed beneath all repairs, this will permit SES to monitor the critical information regarding load transfer from the pipe to the composite as a function of time. Every effort will be made to ensure survival of the strain gages, although there are no guarantees that these gages will remain on the samples during all stages of testing.
Machined corrosion region (60% of pipe wall thickness)
Strain gage location (2 beneath repair and 1 outside)
Test sample prior to repair
Test sample after repair
Strain gage location (1 outside on composite repair)
1
2 3
Gage #4 on repair

Page 9 of 11
Figure 3 – Layout for buried pipe samples (the layout shown above only includes six total repair systems: three for the 3-year study and three for the 10-year study)
Valves and pressure gauges installed to block off samples as appropriate.
1 year samples
2 year samples
3 year samples
5 year samples
7.5 year samples
10 year samplesPump
System ASystem A
System BSystem B
System CSystem C
System DSystem D
System ESystem E
System FSystem F
Colors denote
different repair
systems involved
in test program.

PRCI Co-sponsored Long-term Composite Repair Study Year 0 Burst Test Progress Report (December 2008)
Prepared by: Chris Alexander ([email protected] and 281-897-6504) Prepared for: Air Logistics (3-year study participant) Subject: Test results for Year 0 burst test involving 12.75-inch x 0.375-inch,
Grade X42 pipe. Composite repair of three samples having corrosion depths of 40, 60, and 75% relative to nominal pipe wall thickness.
Burst and Strain Gage Results The table below lists the results recorded during the burst tests. Consider the following points reviewing the provided data. • The pressure levels for the pipe are MAOP = 1,778 psi and SMYS = 2,470 psi. • Refer to Figure 1 on the attached page for the strain gage locations. Gage #4 on the outside
of the repair is lined up with Gage #3 on the machined corrosion region. • The strain gage results are in units of microstrain (µε = 10-6 in/in). Elastic stress is calculated
by multiplying strain by the material’s elastic modulus (i.e. 30 Msi for steel). For example, if the strain in the steel is 1000 µε, the stress is calculated to be 1000 µε x 30 Msi = 30,000 psi. For the composite material, the elastic modulus will be less than steel.
• The average measured composite thickness values for the 40, 60, and 75 percent samples were 0.690, 0.750, and 0.900 inches, respectively.
Corrosion Depth (%)
Pressure Level
Hoop Strain Under Repair (center)
Hoop Strain Under Repair (offset)
Hoop Strain on Outside Repair
Hoop Strain on Base Pipe
Burst Pressure
(psi)
MAOP 1,167 1,197 675 815SMYS 1,999 2,088 1,005 1,084MAOP 1,879 1,894 919 924SMYS 3,714 3,734 1,809 1,498MAOP 2,999 3,227 1,597 864SMYS 5,224 5,787 2,661 1,197
40 4,147
60 4,090
75 4,291
Photographs

General comments All burst test failures occurred outside of the repairs. The recorded strain gage readings were relatively low and would be considered acceptable for design conditions associated with a typical transmission pipeline system A website has been prepared for this program (www.compositerepairstudy.com). In 2009 we will be contacting manufacturers and pipeline companies to request their participation in completing an on-line survey currently posted on the website. Information from the operator and manufacturer surveys will be important to communicate overall trends associated with using composite materials to repair pipelines. Additionally, it is expected that this website will serve as a communication vehicle for this study in the future.
Figure 1 – Details on strain gage installation
This document prepared by: _______________________________ Dr. Chris Alexander, Principal Stress Engineering Services, Inc. December 30, 2008
1
2 3
Gage #4 on repair
Photograph of strain gages installed in a machined corrosion region
Location of strain gages installed on the test sample
January 25, 2011 PN113586CRA Mr. Franz Worth, P.E.
Air Logistics Corporation 925 North Todd Avenue Azusa, CA 91702 Phone: 626-633-0294 E-mail: [email protected]
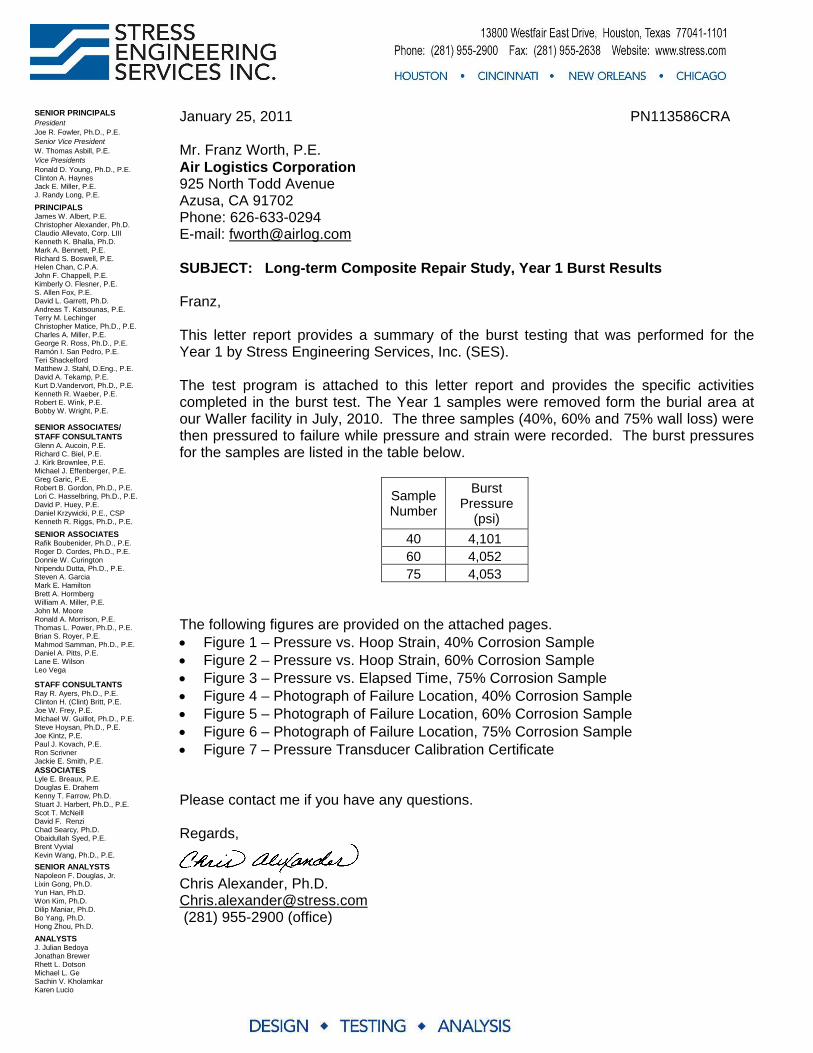
SUBJECT: Long-term Composite Repair Study, Year 1 Burst Results Franz, This letter report provides a summary of the burst testing that was performed for the Year 1 by Stress Engineering Services, Inc. (SES). The test program is attached to this letter report and provides the specific activities completed in the burst test. The Year 1 samples were removed form the burial area at our Waller facility in July, 2010. The three samples (40%, 60% and 75% wall loss) were then pressured to failure while pressure and strain were recorded. The burst pressures for the samples are listed in the table below.
Sample Number
Burst Pressure
(psi)
40 4,101
60 4,052
75 4,053
The following figures are provided on the attached pages.
• Figure 1 – Pressure vs. Hoop Strain, 40% Corrosion Sample
• Figure 2 – Pressure vs. Hoop Strain, 60% Corrosion Sample
• Figure 3 – Pressure vs. Elapsed Time, 75% Corrosion Sample
• Figure 4 – Photograph of Failure Location, 40% Corrosion Sample
• Figure 5 – Photograph of Failure Location, 60% Corrosion Sample
• Figure 6 – Photograph of Failure Location, 75% Corrosion Sample
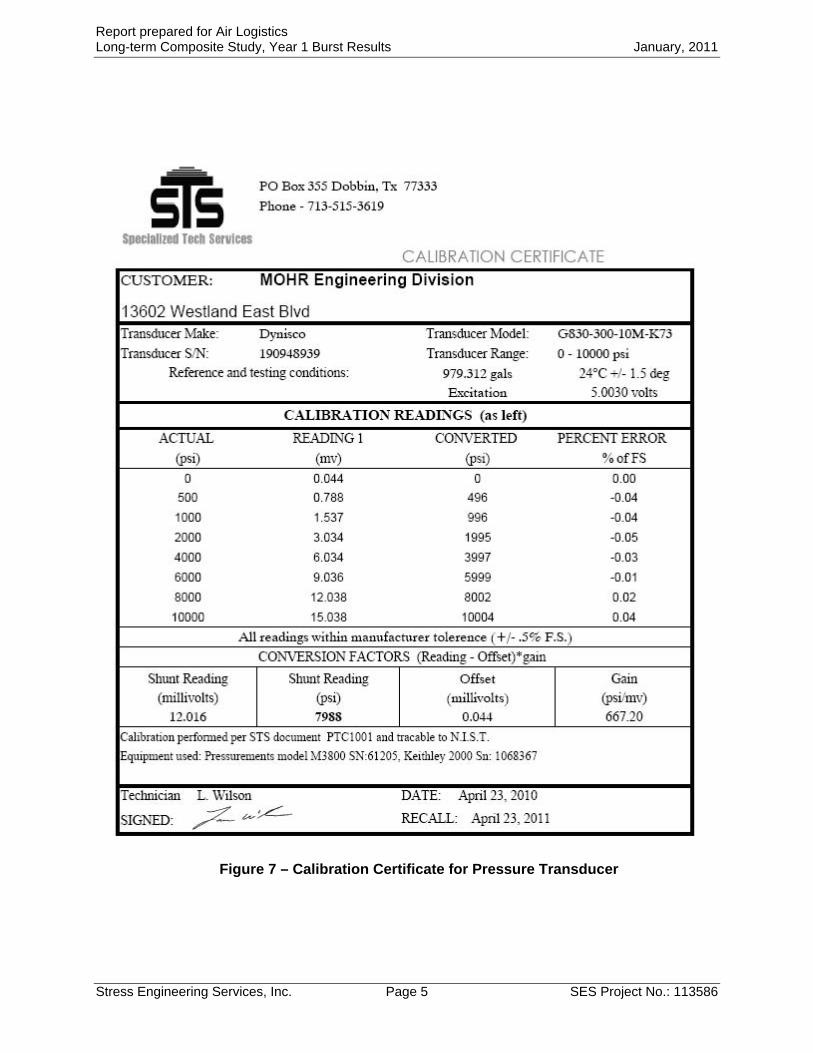
• Figure 7 – Pressure Transducer Calibration Certificate Please contact me if you have any questions. Regards, Chris Alexander, Ph.D. [email protected] (281) 955-2900 (office)
SENIOR PRINCIPALS President Joe R. Fowler, Ph.D., P.E.
Senior Vice President W. Thomas Asbill, P.E.
Vice Presidents Ronald D. Young, Ph.D., P.E. Clinton A. Haynes Jack E. Miller, P.E. J. Randy Long, P.E.
PRINCIPALS James W. Albert, P.E. Christopher Alexander, Ph.D. Claudio Allevato, Corp. LIII Kenneth K. Bhalla, Ph.D. Mark A. Bennett, P.E. Richard S. Boswell, P.E. Helen Chan, C.P.A. John F. Chappell, P.E. Kimberly O. Flesner, P.E. S. Allen Fox, P.E. David L. Garrett, Ph.D. Andreas T. Katsounas, P.E. Terry M. Lechinger Christopher Matice, Ph.D., P.E. Charles A. Miller, P.E. George R. Ross, Ph.D., P.E. Ramón I. San Pedro, P.E. Teri Shackelford Matthew J. Stahl, D.Eng., P.E. David A. Tekamp, P.E. Kurt D.Vandervort, Ph.D., P.E. Kenneth R. Waeber, P.E. Robert E. Wink, P.E. Bobby W. Wright, P.E.
SENIOR ASSOCIATES/ STAFF CONSULTANTS Glenn A. Aucoin, P.E. Richard C. Biel, P.E. J. Kirk Brownlee, P.E. Michael J. Effenberger, P.E. Greg Garic, P.E. Robert B. Gordon, Ph.D., P.E. Lori C. Hasselbring, Ph.D., P.E. David P. Huey, P.E. Daniel Krzywicki, P.E., CSP Kenneth R. Riggs, Ph.D., P.E.
SENIOR ASSOCIATES Rafik Boubenider, Ph.D., P.E. Roger D. Cordes, Ph.D., P.E. Donnie W. Curington Nripendu Dutta, Ph.D., P.E. Steven A. Garcia Mark E. Hamilton Brett A. Hormberg William A. Miller, P.E. John M. Moore Ronald A. Morrison, P.E. Thomas L. Power, Ph.D., P.E. Brian S. Royer, P.E. Mahmod Samman, Ph.D., P.E. Daniel A. Pitts, P.E. Lane E. Wilson Leo Vega
STAFF CONSULTANTS Ray R. Ayers, Ph.D., P.E. Clinton H. (Clint) Britt, P.E. Joe W. Frey, P.E. Michael W. Guillot, Ph.D., P.E. Steve Hoysan, Ph.D., P.E. Joe Kintz, P.E. Paul J. Kovach, P.E. Ron Scrivner Jackie E. Smith, P.E.
ASSOCIATES Lyle E. Breaux, P.E. Douglas E. Drahem Kenny T. Farrow, Ph.D. Stuart J. Harbert, Ph.D., P.E. Scot T. McNeill David F. Renzi Chad Searcy, Ph.D. Obaidullah Syed, P.E. Brent Vyvial Kevin Wang, Ph.D., P.E.
SENIOR ANALYSTS Napoleon F. Douglas, Jr. Lixin Gong, Ph.D. Yun Han, Ph.D. Won Kim, Ph.D. Dilip Maniar, Ph.D. Bo Yang, Ph.D. Hong Zhou, Ph.D.
ANALYSTS J. Julian Bedoya Jonathan Brewer Rhett L. Dotson Michael L. Ge Sachin V. Kholamkar Karen Lucio

Report prepared for Air Logistics Long-term Composite Study, Year 1 Burst Results January, 2011
Stress Engineering Services, Inc. Page 2 SES Project No.: 113586
Pressure versus Hoop StrainSample J-40-1, Burst pressure of 4,101 psi
0
500
1000
1500
2000
2500
3000
3500
4000
4500
0 2000 4000 6000 8000 10000Hoop Strain (microstrain, µε)
(10,000 microstrain equals 1 percent strain)
Inte
rnal
Pre
ssur
e (p
si)
Gage #1 (center of repair)
Gage #3 (2" from center gage)
Figure 1 – Pressure vs. Hoop Strain, 40% Corrosion Sample
Pressure versus Hoop StrainSample J-60-1, Burst pressure of 4,052 psi
0
500
1000
1500
2000
2500
3000
3500
4000
4500
0 2000 4000 6000 8000 10000 12000 14000 16000 18000Hoop Strain (microstrain, µε)
(10,000 microstrain equals 1 percent strain)
Inte
rnal
Pre
ssur
e (p
si)
Gage #1 (center of repair)
Gage #3 (2" from center gage)
Figure 2 – Pressure vs. Hoop Strain, 60% Corrosion Sample

Report prepared for Air Logistics Long-term Composite Study, Year 1 Burst Results January, 2011
Stress Engineering Services, Inc. Page 3 SES Project No.: 113586
Pressure versus Elapsed TimeSample J-75-1, Burst pressure of 4,053 psi
0
500
1000
1500
2000
2500
3000
3500
4000
4500
0 500 1000 1500 2000 2500 3000Elapsed Time (seconds)
Inte
rnal
Pre
ssur
e (p
si)
Figure 3 – Pressure vs. Elapsed Time, 75% Corrosion Sample
Figure 4 – Photograph of Failure Location, 40% Corrosion Sample

Report prepared for Air Logistics Long-term Composite Study, Year 1 Burst Results January, 2011
Stress Engineering Services, Inc. Page 4 SES Project No.: 113586
Figure 5 – Photograph of Failure Location, 60% Corrosion Sample
Figure 6 – Photograph of Failure Location, 75% Corrosion Sample
Report prepared for Air Logistics Long-term Composite Study, Year 1 Burst Results January, 2011
Stress Engineering Services, Inc. Page 5 SES Project No.: 113586
Figure 7 – Calibration Certificate for Pressure Transducer

Report prepared for Air Logistics Long-term Composite Study, Year 1 Burst Results January, 2011
Stress Engineering Services, Inc. Page 6 SES Project No.: 113586
Test Overview Test Sample Configuration The basic elements of this program include the following:
• Fabrication of 180 12.75-inch x 0.375-inch, Grade X42 8-ft long test samples with welded end caps (36 Year 0 burst tests and 144 buried samples).
• Sample preparation included simulated corrosion installed via machining with depths of 40%, 60%, and 75% of the pipe’s nominal wall thickness (refer to Figure A for geometry of the machined regions).
• All samples were repaired by the participating manufacturers. All manufacturers repaired samples for a three-year test period (12 total samples), while four of the manufacturers elected to participate for a 10-year study (requiring an additional 9 samples).
• Burst tests were planned for all of the repaired samples at 0, 1, 2, and 3 years. The 10-year participants will have additional burst periods at 5, 7.5, and 10 years.
• While 36 samples were burst during the Year 0 test period, 144 samples were buried in the ground (cover depth of approximately 18 inches) at Stress Engineering’s Waller, Texas Test Facility. Samples will be pressurized continuously at 36% SMYS (890 psi) and cycled 75 times per month at 36% SMYS (890 – 1,780 psi) and once per quarter at 72% SMYS (0 to 1,780 psi). Burst test samples will be removed from the buried trenches at the designated test periods and taken to failure.
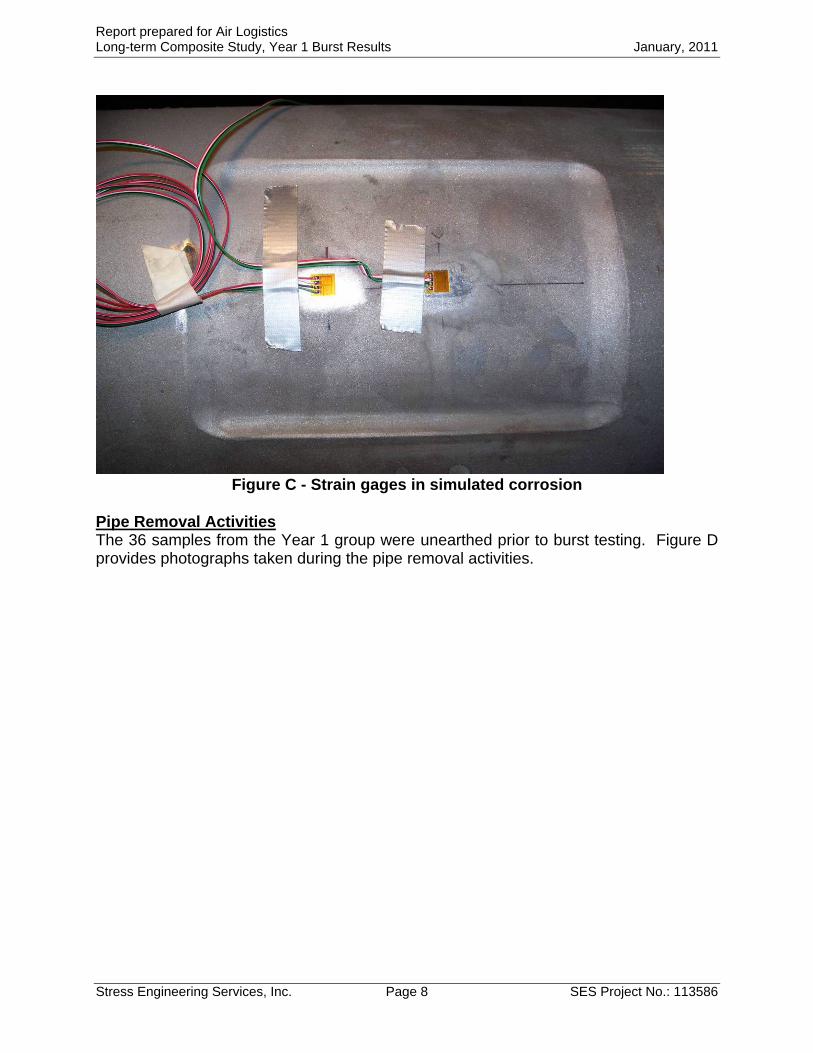
• During the testing period, strain gages will be used to monitor strain in the corroded steel beneath the composite repairs. Figure B and Figure C provide a schematic of the strain gage locations and a photograph of the machined region with strain gages, respectively.

Report prepared for Air Logistics Long-term Composite Study, Year 1 Burst Results January, 2011
Stress Engineering Services, Inc. Page 7 SES Project No.: 113586
Figure A - Sketch of simulated corrosion
Figure B- Diagram of strain gage locations
1
2 3
Gage #4 on repair
75% corrosion sample12.75-inch x 0.375-inch, Grade X42 pipe (8-feet long)
8 inches long0.75-inch radius (at least)
0.375 inches 0.093 inches(simulating 75% corrosion)
Break corners (all around)
Details on machining(assume machined area is 8 inches long by 6 inches wide)
Note uniform wall in
machined region
6 inches
8 feet(center machined area on sample)
NOTE: Perform all
machining 180 degrees
from longitudinal ERW
seam.
Steps for machining1. Measure nominal wall and mark on
pipe
2. Machine material to reach target wall
thickness
3. Verify wall thickness using a UT meter
(average 9 points) and mark on pipe
Report prepared for Air Logistics Long-term Composite Study, Year 1 Burst Results January, 2011
Stress Engineering Services, Inc. Page 8 SES Project No.: 113586
Figure C - Strain gages in simulated corrosion
Pipe Removal Activities The 36 samples from the Year 1 group were unearthed prior to burst testing. Figure D provides photographs taken during the pipe removal activities.

Report prepared for Air Logistics Long-term Composite Study, Year 1 Burst Results January, 2011
Stress Engineering Services, Inc. Page 9 SES Project No.: 113586
Figure D - Photographs from Year 1 sample removal


EVALUATION OF THE AQUAWRAPTM SYSTEM IN REPAIRING MECHANICALLY- DAMAGED PIPES
PN114315CRA Prepared for AIR LOGISTICS, INC. Azusa, California September 2005 Revision 2
STRESS ENGINEERING SERVICES, INC. Houston, Texas

EVALUATION OF THE AQUA WRAPTM SYSTEM IN
REPAIRING MECHANICALLY-DAMAGED PIPES
PN114315CRA
Prepared for AIR LOGISTICS CORPORATION
Azusa, California
Prepared by: ________________________ Chris Alexander
Reviewed by: ________________________
Daniel A. Pitts, P. E.
Stress Engineering Services, Inc. 13800 Westfair East Drive Houston, Texas 77041
September 2005 Revision 2
i
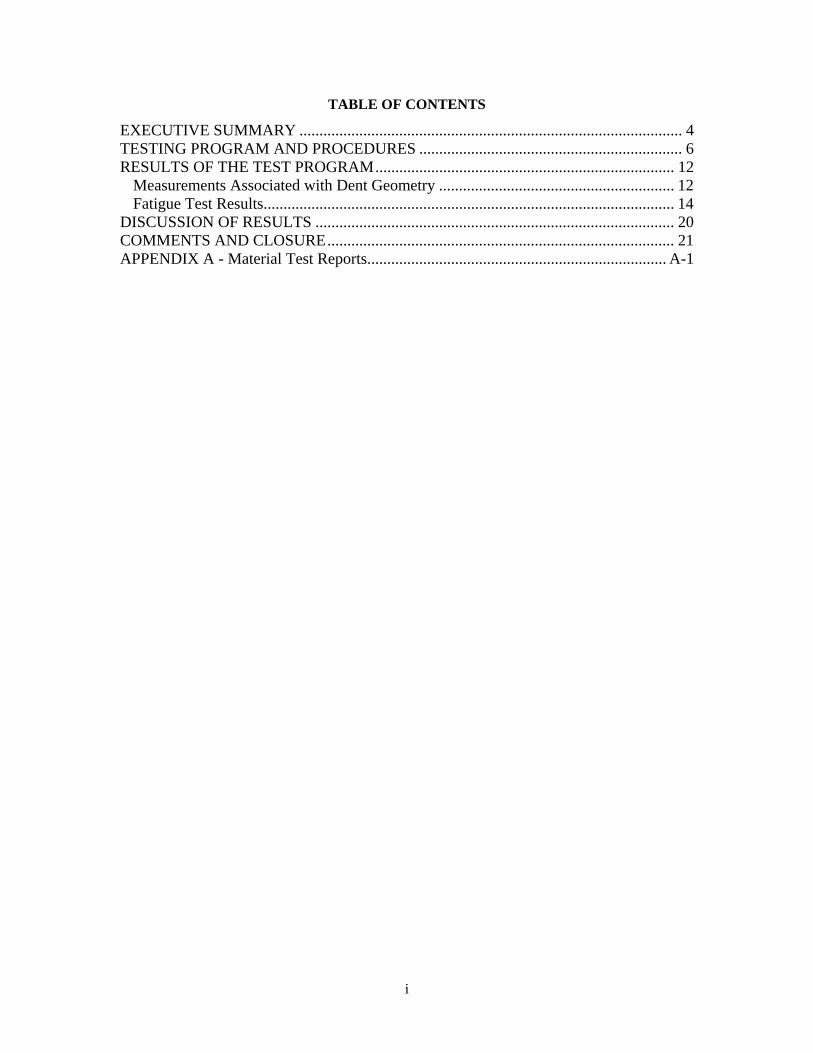
TABLE OF CONTENTS
EXECUTIVE SUMMARY ................................................................................................ 4 TESTING PROGRAM AND PROCEDURES .................................................................. 6 RESULTS OF THE TEST PROGRAM........................................................................... 12
Measurements Associated with Dent Geometry ........................................................... 12 Fatigue Test Results....................................................................................................... 14
DISCUSSION OF RESULTS .......................................................................................... 20 COMMENTS AND CLOSURE....................................................................................... 21 APPENDIX A - Material Test Reports........................................................................... A-1

ii
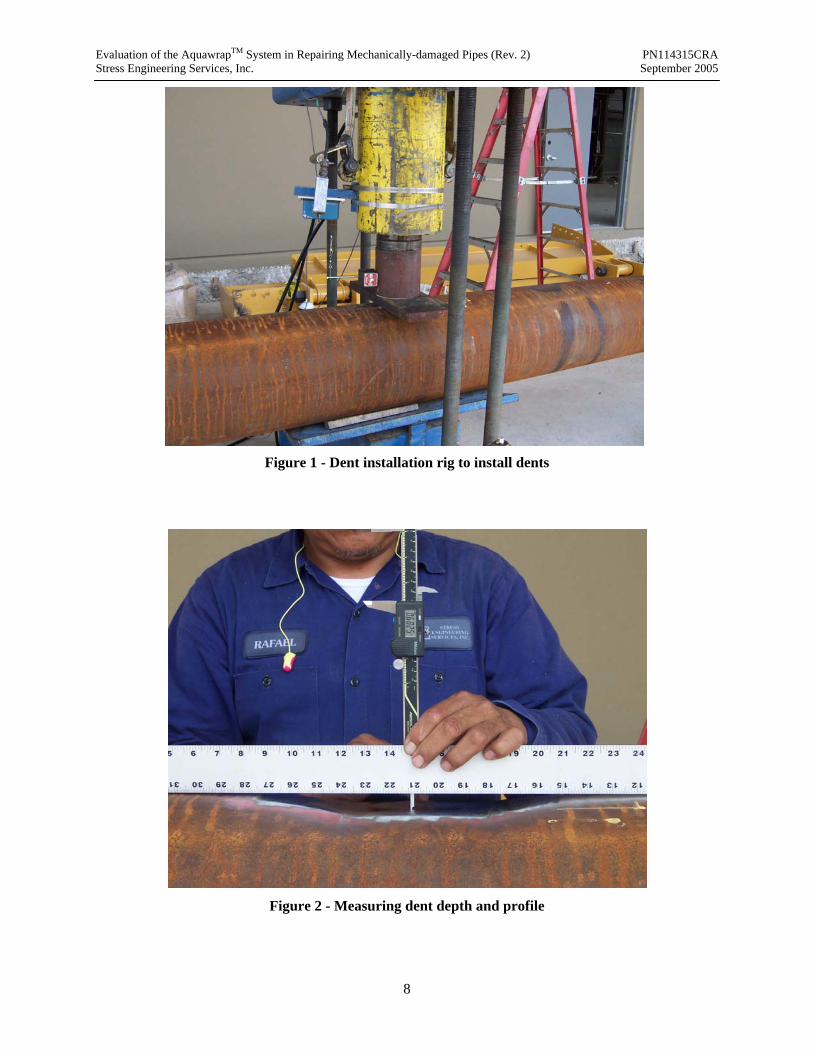
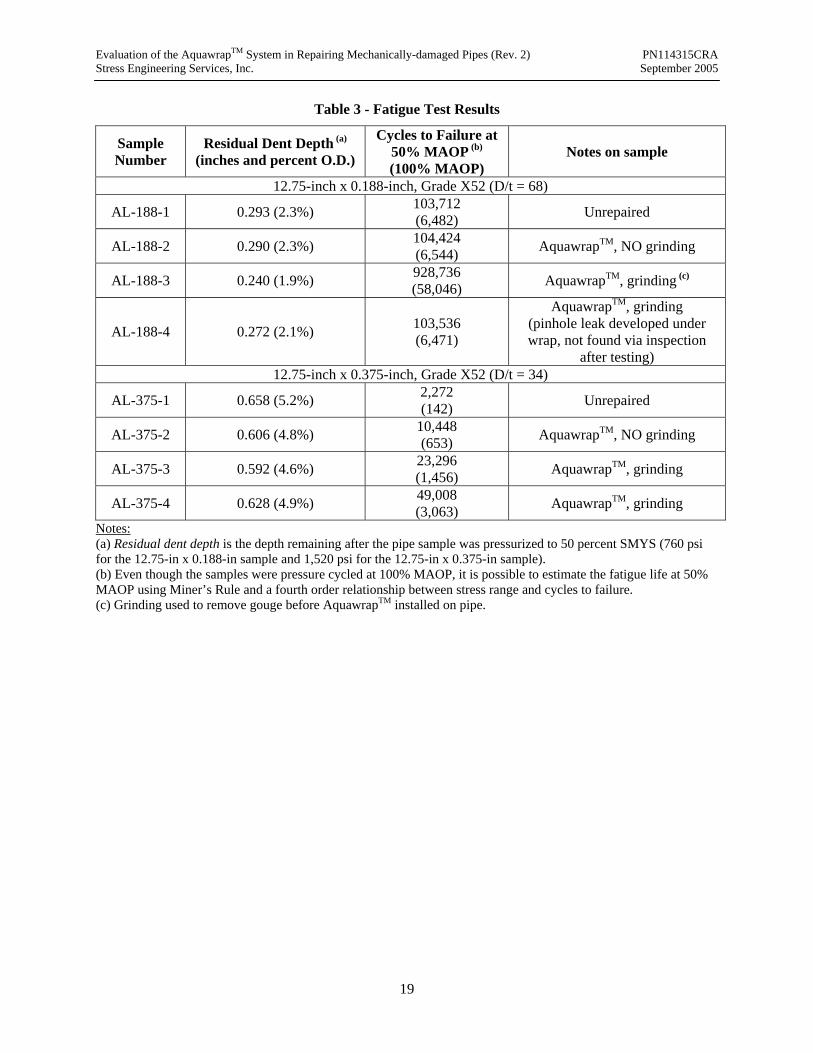
LIST OF FIGURES
Figure 1 - Dent installation rig to install dents ................................................................................ 8 Figure 2 - Measuring dent depth and profile ................................................................................... 8 Figure 3 - Dye penetrant used to ensure gouge removal by grinding.............................................. 9 Figure 4 - Gouge removed by grinding ........................................................................................... 9 Figure 5 - Epoxy material used fill dent region............................................................................. 10 Figure 6 - First layer of AquawrapTM installed on pipe................................................................. 10 Figure 7 - Continued wrapping of AquawrapTM in repairing damage ........................................... 11 Figure 8 - Perforating plastic wrap to permit off-gassing during cure .......................................... 11 Figure 9 - Longitudinal profile measurements of exemplar dents................................................. 14 Figure 10 - Fatigue test results for mechanically-damaged samples............................................. 16 Figure 11 - Post-failure photo of Sample AL-188-1 ..................................................................... 17 Figure 12 - Post-failure photo of Sample AL-188-2 ..................................................................... 17 Figure 13 - Post-failure photo of Sample AL-375-1 ..................................................................... 18 Figure 14 - Post-failure photo of Sample AL-375-2 ..................................................................... 18

iii
LIST OF TABLES
Table 1 - Sample dent depths ........................................................................................................ 13 Table 2- Wall thickness change of samples repaired by grinding ................................................. 13 Table 3 - Fatigue Test Results ....................................................................................................... 19

Evaluation of the AquawrapTM System in Repairing Mechanically-damaged Pipes (Rev. 2) PN114315CRA Stress Engineering Services, Inc. September 2005
4
EXECUTIVE SUMMARY
Stress Engineering Services, Inc. performed a series of tests for Air Logistics, Inc. to evaluate the
AquawrapTM system for repairing mechanically-damaged pipelines. The purpose of the test program was
to determine the benefits derived in repairing damaged pipelines subjected to cyclic pressure service using
composite materials as well as grinding to remove gouges. Recognizing that third-party damage is the
leading cause of pipeline failures in the United States, there is a significant need to have repair systems
that can restore the serviceability of damaged pipelines.
The test program involved installing mechanical damage in the form of gouges and dents in two Grade
X52 pipe sizes: 12.75-inch x 0.188-inch and 12.75-inch x 0.375-inch. Four 6-inch longitudinal gouges
(depths of 15 percent of wall thickness) were installed in each of the 20-ft pipe samples using electric
discharge machining (EDM). Dents were installed in each of these gouges with an initial depth of 15
percent of the pipe diameter (an elastic rebound occurs after the indenter is removed). Previous
experience and research has shown that dents combined with gouges represent the most severe type of
pipeline damage. After the dents were installed, the pipe samples were taken to 50 percent of the
operating pressure which was selected as72% SMYS (specified minimum yield strength) to achieve a
final residual dent depth. After pressurization a significant portion of the dent depth was removed (e.g. the
dent depth for Sample AL-188-1 went from 5.0 percent before pressurization to a final dent depth of 2.3
percent after pressurization, while Sample AL-375-1 went from 7.8 percent before pressurization to a
final dent depth of 5.2 percent after pressurization). This rerounding is expected, typical, and indicates
that initial indentation levels may be severe even though a relatively shallow dent remains. After the dents
were installed and pressurized according to the test procedure, the gouges were removed by grinding.
This was done using a hand-held grinder and performed using gradual passes to ensure that too much of
the pipe wall would not be removed. The dye penetrant inspection technique was used to ensure that the
cracks at the base of the gouge were completely removed. On each of the two samples two of the
dent/gouge defects were repaired by grinding, the other two were not. Of the two unground defects on
each pipe sample, one was repaired using AquawrapTM (making for a total of three composite repairs on
each 20-ft long pipe sample). The intent of this repair was to see what level of reinforcement would be
provided to unground dent/gouge defects.
Once the dents and gouges were removed, AquawrapTM was installed over the appropriate damaged
regions of the pipe samples. Installation was performed in accordance with the manufacturer’s
recommendations that specified the width and thickness of the repair. Once all of the repairs were made,

Evaluation of the AquawrapTM System in Repairing Mechanically-damaged Pipes (Rev. 2) PN114315CRA Stress Engineering Services, Inc. September 2005
5
the materials were allowed to cure and pressure cycling was initiated. Testing involved cycling the
samples to a pressure range equaling 100 percent of the maximum operating pressure. The test pipes were
cycled until a failure occurred. When a failure did occur it was removed via cut-out and the remaining
sections of the pipe re-welded so that pressure cycling could continue.
It is clear from the results of the test program that the reinforcement provided by AquawrapTM provides an
increase in the fatigue life of unrepaired mechanical damage. For the 12.75-inch x 0.188-inch pipe (D/t =
68) the fatigue life was increased from 103,712 cycles for the unrepaired sample, up to 928,736 cycles for
the repaired sample (increase by a factor of 8.9). In a similar but more significant manner, the fatigue for
the 12.75-inch x 0.375-inch pipe (D/t = 34) was increased from 2,272 cycles for the unrepaired sample up
to 49,008 cycles for the repaired sample (increase by a factor of 21.6).
Evaluation of the AquawrapTM System in Repairing Mechanically-damaged Pipes (Rev. 2) PN114315CRA Stress Engineering Services, Inc. September 2005
6
TESTING PROGRAM AND PROCEDURES
A specific test program was carried out on AquawrapTM. This program represents experience in testing
and analyzing mechanically-damaged pipe spanning more than a 15-year period. The test program
involves the two pipe sizes shown below. Appendix A contains documents associated with material
testing (originally used to confirm the X52 grade). The purpose in selecting two pipes with different
diameter to wall thickness ratios (D/t) is that the fatigue life of dented and mechanically-damaged pipes
has been shown to be directly related to the pipe D/t ratio.
• 12.75-in x 0.188-in, Grade X52, diameter to wall thickness ratio of 68 (Sample AL-188)
• 12.75-in x 0.375-in, Grade X52, diameter to wall thickness ratio of 34 (Sample AL-375)
The test procedures for the cyclic pressure fatigue test are outlined below.
[1] Purchase pipes and install end caps that have been fitted with 1-inch weld-o-let bossets.
[2] Use EDM to create 6-inch longitudinally-oriented gouges that are 15 percent of the pipes nominal
wall. The cross-sectional profile of the gouge is similar to a Charpy V-notch configuration with a 90°
bevel and a 0.002-inch radius at the base of the notch. Four (4) gouges were installed in each of the
two (2) pipe samples, making for a total of eight (8) defects. The following gouge defects were made
90 degrees relative to the longitudinal pipe weld seam.
a. Four (4) 6-inch long gouges, 0.028-inch deep in the 12.75-in x 0.188-in pipe
b. Four (4) 6-inch long gouges, 0.056-inch deep in the 12.75-in x 0.375-in pipe
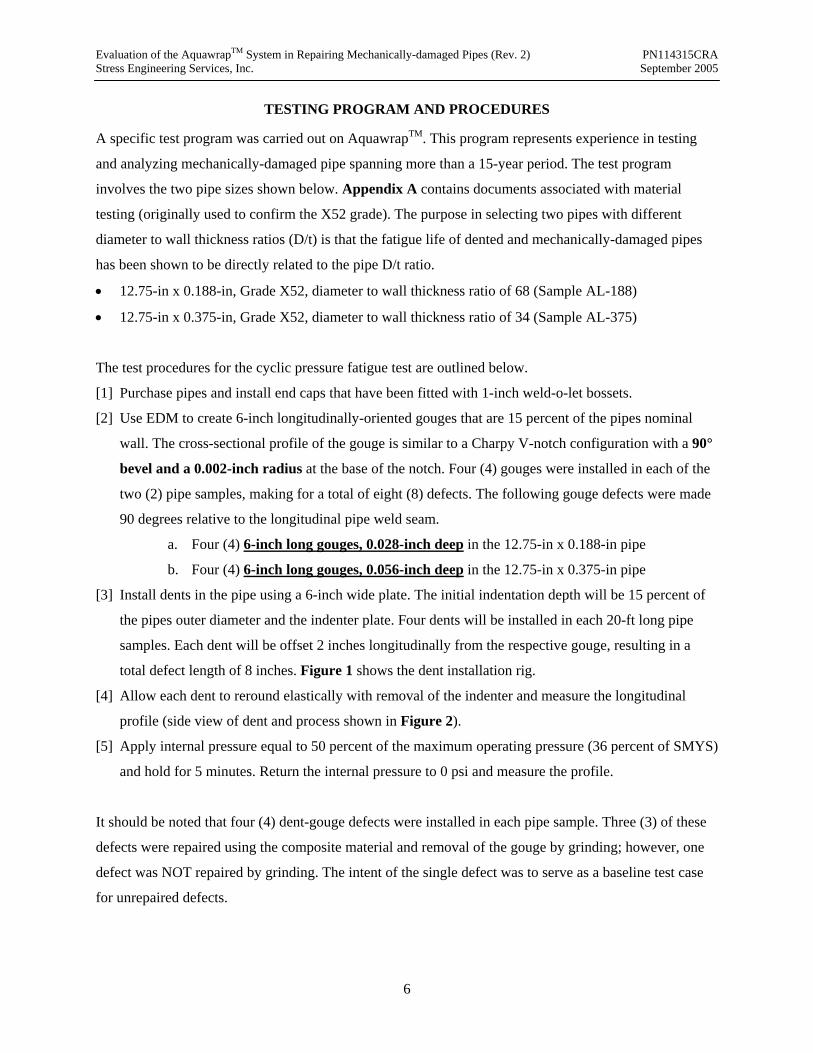
[3] Install dents in the pipe using a 6-inch wide plate. The initial indentation depth will be 15 percent of
the pipes outer diameter and the indenter plate. Four dents will be installed in each 20-ft long pipe
samples. Each dent will be offset 2 inches longitudinally from the respective gouge, resulting in a
total defect length of 8 inches. Figure 1 shows the dent installation rig.
[4] Allow each dent to reround elastically with removal of the indenter and measure the longitudinal
profile (side view of dent and process shown in Figure 2).
[5] Apply internal pressure equal to 50 percent of the maximum operating pressure (36 percent of SMYS)
and hold for 5 minutes. Return the internal pressure to 0 psi and measure the profile.
It should be noted that four (4) dent-gouge defects were installed in each pipe sample. Three (3) of these
defects were repaired using the composite material and removal of the gouge by grinding; however, one
defect was NOT repaired by grinding. The intent of the single defect was to serve as a baseline test case
for unrepaired defects.

Evaluation of the AquawrapTM System in Repairing Mechanically-damaged Pipes (Rev. 2) PN114315CRA Stress Engineering Services, Inc. September 2005
7
The following sequence of events was used in performing the repair of the defects:
[1] Remove the gouge by grinding with a hand-held grinder. Dye penetrant was used to ensure that the
crack was completely removed. Measure the remaining wall thickness. Figure 3 shows the
application of dye penetrant to the damaged region and Figure 4 shows one of the samples polished
in its final state before installation of the repair material.
[2] Repair three of the four pipe defects using the composite reinforcement system. This includes the
following activities:
a. Prepare surface of pipe (for present short-term study, sandblasting not required)
b. Fill in dented region of the pipe with a filler material to ensure proper load transfer for
composite material from the carrier pipe.
c. Install the composite material using the appropriate number of wraps.
i. 12.75-in x 0.188-in pipe (thickness measured to be 0.830 inches)
ii. 12.75-in x 0.375-in pipe (thickness measured to be 1.125 inches)
d. Allow to cure in accordance with the manufacturer’s recommendations.
[3] Start fatigue testing. Each sample was pressure cycled at 100% MAOP (72% SMYS or 100 to 1,200
psi for the 0.188-in wall pipe and 100 - 2,300 psi for the 0.375-in wall pipe) until failure occurs. As
failures occur, the defects were cut out and removed to permit continued pressure cycling.
Figures 5 through 8 are photographs taken during the installation of AquawrapTM on the damaged
sections of the test pipes.
Evaluation of the AquawrapTM System in Repairing Mechanically-damaged Pipes (Rev. 2) PN114315CRA Stress Engineering Services, Inc. September 2005
8
Figure 1 - Dent installation rig to install dents
Figure 2 - Measuring dent depth and profile

Evaluation of the AquawrapTM System in Repairing Mechanically-damaged Pipes (Rev. 2) PN114315CRA Stress Engineering Services, Inc. September 2005
9
Figure 3 - Dye penetrant used to ensure gouge removal by grinding
Figure 4 - Gouge removed by grinding

Evaluation of the AquawrapTM System in Repairing Mechanically-damaged Pipes (Rev. 2) PN114315CRA Stress Engineering Services, Inc. September 2005
10
Figure 5 - Epoxy material used to fill the dented region
Figure 6 - First layer of AquawrapTM installed on pipe

Evaluation of the AquawrapTM System in Repairing Mechanically-damaged Pipes (Rev. 2) PN114315CRA Stress Engineering Services, Inc. September 2005
11
Figure 7 - Continued wrapping of AquawrapTM in repairing damage
Figure 8 - Perforating plastic wrap to permit off-gassing during cure

Evaluation of the AquawrapTM System in Repairing Mechanically-damaged Pipes (Rev. 2) PN114315CRA Stress Engineering Services, Inc. September 2005
12
RESULTS OF THE TEST PROGRAM
The results associated with implementation of the test program involve several important aspects. The
first involves documentation of the dents themselves such as information on the force required to create
the dents, dent depth, profile length, and response to internal pressure. This information is important as
the ability to relate test data to actual field dents is directly related to the geometry of the dent.
Additionally, it is important to document the test conditions and results associated with cyclic service.
The conditions associated with the test pressure ranges are much more severe than most pipelines will
experience in several lifetimes. For this reason it is important that the presentation help the reader make
sense of the results as they relate to actual operating conditions of typical pipelines. The sections that
follow provide details on these two areas of documentation.
Measurements Associated with Dent Geometry
There are several important parameters that were measured during the process of creating the test dents.
These include:
• Dent depth as a function of test period (initial dent, rebound after indentation, and depth after
pressurization)
• Dent profile measured along the length of the pipeline
• Force required to create the dents
• Pipe wall thickness before and after grinding
Table 1 provides a list of dent depth measurements taken during testing. Also included in this table are
the average forces required to create the dents. As noted, the average force required to generate dents in
the thicker-walled pipe is approximately 3.5 times the average force required to create dents in the thinner
pipe having a nominal wall thickness of 0.188 inches. Table 2 provides a list of measured wall
thicknesses taken near the two defects in each sample that were repaired by grinding. Also included in
this table are the percentages of remaining wall after grinding.
Figure 9 shows the longitudinal profile measurements for test samples AL-188-1 and AL-375-1. The
measurements correspond to readings taken after initial indentation that capture the elastic rebound and
measurements taken after pressurization to 50 percent MAOP. As with the data presented in Table 1, it is
clear that a significant portion of the dent is removed by the application of internal pressure.

Evaluation of the AquawrapTM System in Repairing Mechanically-damaged Pipes (Rev. 2) PN114315CRA Stress Engineering Services, Inc. September 2005
13
Table 1 - Sample dent depths
Sample Number
Target Dent Depth (a) (inches and percent O.D.)
Interim Dent Depth (b) (inches and percent O.D.)
Residual Dent Depth (c) (inches and percent O.D.)
12.75-inch x 0.188-inch, Grade X52 (D/t = 68) Average force of 26,010 lbs. required to generate dents
AL-188-1 1.9 (15%) 0.637 (5.0%) 0.293 (2.3%) AL-188-2 1.9 (15%) 0.626 (4.9%) 0.290 (2.3%) AL-188-3 1.9 (15%) 0.514 (4.0%) 0.240 (1.9%) AL-188-4 1.9 (15%) 0.607 (4.8%) 0.272 (2.1%)
12.75-inch x 0.375-inch, Grade X52 (D/t = 34) Average force of 94,056 lbs. required to generate dents
AL-375-1 1.9 (15%) 1.001 (7.9%) 0.658 (5.2%) AL-375-2 1.9 (15%) 1.020 (8.0%) 0.606 (4.8%) AL-375-3 1.9 (15%) 1.001 (7.9%) 0.592 (4.6%) AL-375-4 1.9 (15%) 1.028 (8.1%) 0.628 (4.9%)
Notes: (a) Target dent depth is depth indenter initially pushed into pipe with no internal pressure (b) Interim dent depth is the depth corresponding to elastic rebound as the indenter is removed from the pipe with no internal pressure. (c) Residual dent depth is the depth remaining after the pipe sample was pressurized to 50 percent SMYS (760 psi for the 12.75-in x 0.188-in sample and 1,520 psi for the 12.75-in x 0.375-in sample)
Table 2- Wall thickness change of samples repaired by grinding
Sample Number
Nominal Wall Thickness (inches)
Measured Wall Base Pipe Thickness
(inches)
Wall Thickness after Grinding (inches and percent nominal wall)
AL-188-3 0.168 (89.4%) AL-188-4 0.188 0.198 0.158 (84.0%) AL-375-3 0.314 (83.7%) AL-375-4 0.375 0.385 0.306 (81.6%)

Evaluation of the AquawrapTM System in Repairing Mechanically-damaged Pipes (Rev. 2) PN114315CRA Stress Engineering Services, Inc. September 2005
14
Figure 9 - Longitudinal profile measurements of exemplar dents
Fatigue Test Results
Fatigue testing applied a range of pressures equaling 100 percent of the MAOP (72% SMYS) to each
pipe. The following pressure ranges were applied to the test samples:
• 12.75-in x 0.188-in, Grade X52: pressure range from 100 psi to 1,200 psi (1,100 psi MAOP)
• 12.75-in x 0.375-in, Grade X52: pressure range from 100 psi to 2,300 psi (2,200 psi MAOP)
Table 3 provides a summary of the fatigue test results including the cycles to failure for each of the 8 test
samples. There are several noteworthy trends associated with the tabulated data.
• The cycles to failure for the unrepaired defects in the 12.75-inch x 0.188-inch pipe are unusually high.
It is quite likely that the trend is due to the fact that the yield strength for this pipe was measured to be
69,700 psi. In this situation the applied stress range was insufficient to generate and grow the crack in
a short period of time. The thicker wall pipe did not demonstrate this trend and showed a greater
difference between the unrepaired and repaired samples.
• As expected, the pipe having the larger D/t ratio had a long fatigue life. This is consistent with the
mechanics of the problem and previous research that show thinner wall pipes reround with internal
pressure. As the effects of the dent are reduced, the fatigue life is increased.
Measured Longitudinal Profiles of Dents During InstallationData for dents AL-188-1 and AL-375-1 recorded after initial indentation (elastic rebound) andafter pressurization to 50% MAOP (final residual dent depth). Initial dent depths of 1.9 inches.
0.000
0.200
0.400
0.600
0.800
1.000
1.2000 5 10 15 20 25 30 35 40
Longitudinal Position (inches)
Den
t Dep
th (i
nche
s)
AL-188-1 (elastic rebound)AL-188-1 (final residual)
AL-375-1 (elastic rebound)AL-375-1 (final residual)

Evaluation of the AquawrapTM System in Repairing Mechanically-damaged Pipes (Rev. 2) PN114315CRA Stress Engineering Services, Inc. September 2005
15
• Although AquawrapTM increased the fatigue life of the AL-188 sample, the effects of the repair were
more pronounced with lower D/t pipe of the AL-375 sample.
In addition to the tabulated data, fatigue results are presented in Figure 10 that plots cycles to failure for
the AquawrapTM samples as well as data from previous research programs associated with mechanical
damage. The predominant observation made in viewing this figure are the benefits derived in repair by
grinding and using composite materials as compared to unrepaired mechanical damage. If one considers a
pipe having a D/t ratio of 50 with a dent of 15 percent and a gouge of 15 percent, the fatigue life can be
estimated from Figure 10 as follows.
• An unrepaired defect has an approximate fatigue life of 100 cycles
• A defect that has been repaired by grinding has an approximate fatigue life of 1,000 cycles
• A defect that has been repaired by grinding and fitted with an AquawrapTM composite sleeve has an
approximate fatigue life of 100,000 cycles
This trend is consistent in what has been observed with other composite repair systems. The primary
reason for the increase in fatigue life is that the composite material restrains the dent and prevents
significant rerounding during the process of pressure cycling. It is the flexure of the dent that is the basis
for the initiation and propagation of fatigue cracks in both mechanically-damages pipes as well as pipes
having plain dents (i.e. dents without gouges). Even though plain dents have fatigue lives that are
significantly longer than pipes with mechanical damage (i.e. dents with gouges), the long-term failure of
plain dents results from fatigue cracks that initiate in the dented region of the pipe.
Figures 11, 12, 13, and 14 show failures for samples AL-188-1, AL-118-2, AL-375-1, and AL-375-2,
respectively. The key point to note is the radial deformation that occurs in the unrepaired defects (AL-
188-1 and AL-375-1). The extensive deformation associated with the unrepaired defects confirms that the
filler material must have a sufficient level of rigidity to prevent the radial deformation due to internal
pressure.

Evaluation of the AquawrapTM System in Repairing Mechanically-damaged Pipes (Rev. 2) PN114315CRA Stress Engineering Services, Inc. September 2005
16
Figure 10 - Fatigue test results for mechanically-damaged samples
NUMBER OF CYCLES AS A FUNCTION OF PIPEDIAMETER TO WALL THICKNESS RATIO
Data plotted are based on a cyclic pressure range of 50% MAOPAll defects involved a dent of 15 percent (d/D) and a gouge depth of 15 percent (d/t)
20 40 60 80 100Pipe Diameter to Wall Ratio (D/t)
1
10
100
1000
10000
100000
1000000
Num
ber o
f Cyc
les
Specimen Configuration(Curve Fits)
Dents with gouges - repaired bygrinding and Aqua WrapDents with gouges - groundDents with gouges - not ground
Repaired by grinding and Aqua Wrap
Repaired by grinding
Mechanical damage NOT repaired

Evaluation of the AquawrapTM System in Repairing Mechanically-damaged Pipes (Rev. 2) PN114315CRA Stress Engineering Services, Inc. September 2005
17
Figure 11 - Post-failure photo of Sample AL-188-1
Figure 12 - Post-failure photo of Sample AL-188-2

Evaluation of the AquawrapTM System in Repairing Mechanically-damaged Pipes (Rev. 2) PN114315CRA Stress Engineering Services, Inc. September 2005
18
Figure 13 - Post-failure photo of Sample AL-375-1
Figure 14 - Post-failure photo of Sample AL-375-2
Evaluation of the AquawrapTM System in Repairing Mechanically-damaged Pipes (Rev. 2) PN114315CRA Stress Engineering Services, Inc. September 2005
19
Table 3 - Fatigue Test Results
Sample Number
Residual Dent Depth (a) (inches and percent O.D.)
Cycles to Failure at 50% MAOP (b) (100% MAOP)
Notes on sample
12.75-inch x 0.188-inch, Grade X52 (D/t = 68)
AL-188-1 0.293 (2.3%) 103,712 (6,482) Unrepaired
AL-188-2 0.290 (2.3%) 104,424 (6,544) AquawrapTM, NO grinding
AL-188-3 0.240 (1.9%) 928,736 (58,046) AquawrapTM, grinding (c)
AL-188-4 0.272 (2.1%) 103,536 (6,471)
AquawrapTM, grinding (pinhole leak developed under wrap, not found via inspection
after testing) 12.75-inch x 0.375-inch, Grade X52 (D/t = 34)
AL-375-1 0.658 (5.2%) 2,272 (142) Unrepaired
AL-375-2 0.606 (4.8%) 10,448 (653) AquawrapTM, NO grinding
AL-375-3 0.592 (4.6%) 23,296 (1,456) AquawrapTM, grinding
AL-375-4 0.628 (4.9%) 49,008 (3,063) AquawrapTM, grinding
Notes: (a) Residual dent depth is the depth remaining after the pipe sample was pressurized to 50 percent SMYS (760 psi for the 12.75-in x 0.188-in sample and 1,520 psi for the 12.75-in x 0.375-in sample). (b) Even though the samples were pressure cycled at 100% MAOP, it is possible to estimate the fatigue life at 50% MAOP using Miner’s Rule and a fourth order relationship between stress range and cycles to failure. (c) Grinding used to remove gouge before AquawrapTM installed on pipe.

Evaluation of the AquawrapTM System in Repairing Mechanically-damaged Pipes (Rev. 2) PN114315CRA Stress Engineering Services, Inc. September 2005
20
DISCUSSION OF RESULTS
In order for composites to be used on gas and transmission pipelines, pipeline operators will eventually
require compliance with a recognized code or standard. Although the use of composites in repairing steel
pipelines is widely-accepted among both gas and liquid operators, only recently have the ASME
transmission pipeline codes recognized their use (B31.4 for liquid transmission pipelines and B31.8 for
gas transmission pipelines). Additionally, in general the emphasis in using composite material has been
on the repair of corrosion and not dents, gouges, or mechanical damage. This is expected as the greater
potential for catastrophic failure in pipelines resides in the repair of mechanical damage as opposed to
repairing corroded sections of pipe.
This section of the report has been prepared to address statements in the ASME B31.4 and B31.4 pipeline
codes that relate to using composite materials to repair pipelines as well as comments related to repairing
mechanical damage. To ensure clarity, an independent discussion on each of the two codes is provided.
ASME B31.4 - Pipeline Transportation Systems for Liquid Hydrocarbons and Other Liquids
In terms of composite usage the following statement is made in ASME B31.4
451.6.2 Disposition of Defects
(c) Repair Methods
(14) Mechanically applied composite material wrap may be used to reinforce the pipeline
provided that design and installation methods are proven for the intended service prior to
application. The user is cautioned that a qualified written procedure performed by trained
personnel is a requirement and records shall be retained…
ASME B31.8 - Gas Transmission and Distribution Piping Systems
In terms of composite usage the following statement is made in ASME B31.8.
851.42 Permanent Field Repairs of Injurious Dents and Mechanical Damage
(e) Nonmetallic composite wrap repairs are not acceptable for the repair of injurious dents or
mechanical damage, unless proven through reliable engineering tests and analysis.

Evaluation of the AquawrapTM System in Repairing Mechanically-damaged Pipes (Rev. 2) PN114315CRA Stress Engineering Services, Inc. September 2005
21
COMMENTS AND CLOSURE
This report has provided documentation on a test program performed by Stress Engineering Services, Inc.
for Air Logistics on the AquawrapTM composite repair system for high pressure pipelines. AquawrapTM is
a water-activated pre-impregnated (i.e. prepreg) composite system that is installed directly over areas of
pipeline damage. The focus of the test program carried out by SES was to address the ability of
AquawrapTM to repair mechanically-damaged pipes involving dents with gouges. The test program
involved full-scale testing involving two Grade X52 pipe sizes: 12.75-inch x 0.188-inch and 12.75-inch x
0.375-inch. Four 6-inch long gouges (depths of 15 percent of wall thickness) were installed in each of the
20-ft pipe samples using EDM. Dents were installed in each of these gouges with an initial depth of 15
percent of the pipe diameter (an elastic rebound occurs after the indenter is removed). After the dents
were installed, the pipes were pressurized to 50% MAOP to achieve a final residual dent depth. Finally,
select gouges were removed by grinding and repairs were made using AquawrapTM. Once all of the
repairs were made, the materials were allowed to cure and pressure cycling was initiated. Testing
involved cycling the samples to a pressure range equaling 100 percent of the maximum operating
pressure. The test pipes were cycled until a failure occurred. When a failure did occur it was removed
(cut-out) and the remaining sections of the pipe re-welded so that pressure cycling could continue.
It is clear from the results of the test program that the reinforcement provided by AquawrapTM provides an
increase in the fatigue life of unrepaired mechanical damage. For the 12.75-inch x 0.188-inch pipe (D/t =
68) the fatigue life was increased from 103,712 cycles for the unrepaired sample, up to 928,736 cycles for
the repaired sample (increase by a factor of 8.95). In a similar but more significant manner, the fatigue for
the 12.75-inch x 0.375-inch pipe (D/t = 34) was increased from 2,272 cycles for the unrepaired sample to
49,008 cycles for the repaired sample (increase by a factor of 21.6).
When AquawrapTM is properly used to repair damaged pipeline, including the removal of shallow gouge
defects by grinding, it is possible that a significant increase in fatigue life can be achieved over unrepaired
defects. The results of this test program, along with supporting data from similar repair system, confirm
the validity of this repair system. It should be noted, however, that significant care should be taken in
repairing actual mechanically-damaged pipelines. Consideration of period service history, material
quality, and extent of overall pipeline damage must be considered before making a pipeline repair using
composite materials.

A- 1
APPENDIX A - Material Test Reports

2400 Central Parkway, Suite R Houston, TX 77092-7712
Phone: (713) 688-2777 Fax: (713) 688-2818
Email: [email protected]
HML letters / reports are for the exclusive use of the client to whom they are addressed and apply only to the sample tested and/or inspected. Letters/reports are not necessarily indicative of the qualities of apparently identical or similar products.
TO: Stress Engineering Services TEST NO: 795-05 13800 Westfair East Drive P. O. NO: Houston, Texas 77041 DATE: 6-7-05 Attn: Chris Alexander
DATE OF TEST: 6-7-05 REPORT OF TENSILE AND CHARPY TEST
MATERIAL / DESCRIPTION: One (1) piece 12” OD x .188” wall API 5L Gr. X52 Pipe IDENTIFICATION: P/N 114315 CRA TECHNICIAN: M. Steel / D. Chalmers DATE RECEIVED: 6-6-05 PROCEDURE: HML-TTM-1-94 Rev. 1 SPECIFICATIONS: Client instructions HML-CVN-1-94 Rev. 1 TEST EQUIPMENT: T.O. 120990-1 Ext. CL5284 COMPLIANCE: Tinius Olsen Model 74:264 Ft./Lb. 16.8 Ft./Sec. S/N 121155 Temp.. Monitor: S/N C-111 Temp. Controller: S/N 194047049
TENSILE TEST RESULTS
SPECIMEN NO: DIMENSIONS SQ. AREA
INCH YIELD STRENGTH
PSI .2% OFFSET TENSILE
STRENGTH PSI % ELONG.
IN 2 IN. % ROA
795-05 1.505 x .184 .2769 69,700 78,900 31.25 48.2
CHARPY IMPACT TEST RESULTS ASTM E23 TYPE: a SIZE: 10mm x 2.5mm
SPECIMEN NO: TEST TEMP. NOTCH LOCATION FT. LBS. % SHEAR LAT. EXP (MILS)
795-05 (Transverse)
#1 Ambient Base 19 99 55 #2 “ “ 18 99 52 #3 “ “ 18 99 51
#1 +32 degrees F Base 18 99 54 #2 “ “ 18 99 53 #3 “ “ 18 99 53
ID AFTER MAPPING AFTER MACHINING
REVIEWED BY: RONALD RICHTER PRINCIPAL / QA MANAGER

2400 Central Parkway, Suite R Houston, TX 77092-7712
Phone: (713) 688-2777 Fax: (713) 688-2818
Email: [email protected]
HML letters / reports are for the exclusive use of the client to whom they are addressed and apply only to the sample tested and/or inspected. Letters/reports are not necessarily indicative of the qualities of apparently identical or similar products.
TO: Stress Engineering Services TEST NO: 796-05 13800 Westfair East Drive P. O. NO: Houston, Texas 77041 DATE: 6-7-05 Attn: Chris Alexander
DATE OF TEST: 6-7-05 REPORT OF TENSILE AND CHARPY TEST
MATERIAL / DESCRIPTION: One (1) piece 12” OD x .375” wall API 5L Gr. X52 Pipe IDENTIFICATION: P/N 114315 CRA TECHNICIAN: M. Steel / D. Chalmers DATE RECEIVED: 6-6-05 PROCEDURE: HML-TTM-1-94 Rev. 1 SPECIFICATIONS: Client instructions HML-CVN-1-94 Rev. 1 TEST EQUIPMENT: T.O. 120990-1 Ext. CL5284 COMPLIANCE: Tinius Olsen Model 74:264 Ft./Lb. 16.8 Ft./Sec. S/N 121155 Temp.. Monitor: S/N C-111 Temp. Controller: S/N 194047049
TENSILE TEST RESULTS
SPECIMEN NO: DIMENSIONS SQ. AREA
INCH YIELD STRENGTH
PSI .2% OFFSET TENSILE
STRENGTH PSI % ELONG.
IN 2 IN. % ROA
796-05 1.501 x .369 .5539 66,100 73,100 39.85 63.6
CHARPY IMPACT TEST RESULTS ASTM E23 TYPE: a SIZE: 10mm x 7.5mm
SPECIMEN NO: TEST TEMP. NOTCH LOCATION FT. LBS. % SHEAR LAT. EXP (MILS)
796-05 (Transverse)
#1 Ambient Base 54 99 65 #2 “ “ 50 99 64 #3 “ “ 50 99 63
#1 +32 degrees F Base 37 99 51 #2 “ “ 36 99 47 #3 “ “ 30 99 42
ID AFTER MAPPING AFTER MACHINING
REVIEWED BY: RONALD RICHTER PRINCIPAL / QA MANAGER

Analysis of Aquawrap® for use in Repairing Damaged Pipelines
Environmental Exposure Conditions Property Testing Procedures
Field Testing Evaluations
Prepared By Franz L. Worth, PE
January 7, 2005
Air Logistics Corporation F.A.C.S.™ Group
925 North Todd Avenue Azusa, CA 91702 USA
Phone 626-633-0294 • Fax 626-633-0791 INTRODUCTION
TM

Air Logistics Corporation Aquawrap® Analysis
Page 2 of 19 Copyright © 2005 Air Logistics Corporation. All Rights Reserved.
The repair of corroded or damaged pipelines using composite repair systems is growing, especially in the oil and gas industries. Composites have proved themselves as a strong and durable material, capable of providing the qualities required when performing critical repairs. Numerous field trials, in-house testing, and third party testing has demonstrated that Aquawrap® possesses those performance qualities, and as such, has been successfully used on many pipelines for repairing external corrosion and mechanical damage. Aquawrap® is comprised of a proprietary polyurethane formula and custom-woven biaxial glass fiber. As a biaxial fabric, it provides strength in two directions, hoop and transverse. For piping, hoop strength is critical, but handling the transverse load is also important. Strength in two directions can be equally important to many other types of reinforcement that Aquawrap® is designed to handle. For these reasons, biaxial fabric was a sound choice. The material installation requires use of a base primer material to provide a proper bond to the surface being repaired. Aquawrap® is then installed, utilizing water as the activator. The material can be installed circumferentially around the object, or spiraled at an angle to provide uniform coverage over long distances. After installation, a unique method is used to compress and consolidate the composite. The purpose of this analysis is to provide a single document, which summarizes the entire properties test results and field testing results. The following is an analysis of tests and trials completed that relate to repairing pipelines, as well as other cylindrical objects of metal or concrete. The results will reveal that these tests prove Aquawrap® is a practical and economical repair for damage to these structures, and in many cases, can increase the strength and durability of the virgin object. F.A.C.S.™ GROUP QUALITY OVERVIEW Objective To produce a high quality product having outstanding performance characteristics with consistent handling and mechanical properties coupled with excellent longevity. The program, from product design through field performance monitoring, is outlined below. Design The design activity entails not only that of the product but of the facility and equipment required to produce it.
Product Design: The product design activity required several years of resin development and testing coupled with evaluation of fabric weaves and construction alternates. The design activity has produced a number of product variants to suit specific customer applications. Facility and Equipment: Due to the water cure nature of the product, consideration must be given to the facility design and construction. The facility must be designed to maintain a low ambient humidity and temperature control in spite of the effects of material and personnel entry and egress. The equipment required to produce the product entails measuring and mixing of the various resin formulations, drying the fabric, impregnation of the fabric, and product packaging. Air Logistics has completed the design, fabrication and construction of a well-equipped facility for the Manufacturer of its Aquawrap products.

Air Logistics Corporation Aquawrap® Analysis
Page 3 of 19 Copyright © 2005 Air Logistics Corporation. All Rights Reserved.
Development and Qualification Testing Air Logistics has completed extensive strength and environmental testing as a part of the product development process utilizing our internal test facility. Outside test laboratories have confirmed the results of this internal testing. Having complete test capability is a key asset in the product formulation and the ongoing product improvement process. Workmanship Practices The development of, and rigorous adherence to, proper workmanship and processing practices is essential to achieve quality manufacturing of a unique product such as Aquawrap®. Air Logistics has developed a complete set of operational processes and procedures for the manufacture of its products. These processes include, but are not limited to, incoming material inspection, resin mixing, facility environment monitoring, equipment set-up, operational functions, and packaging integrity.
Incoming Material: Supplier certifications are required on all incoming production material used in the manufacturing process. The certifications are maintained as a part of the quality records. Where appropriate, physical measurements of testing are completed and recorded. Material Traceability: Lot numbers of all materials used in production are recorded. Retains are also kept for future inspection if needed. Resin mixing and daily run MO logs are used to record traceability data for all components used in the production of each lot of Aquawrap® material. In addition, equipment setup settings are also logged. Packaging: Packaging quality is essential to the production process due to the moisture cure nature of Aquawrap®. If the packaging material is faulty or if the pouch seal is improperly finished, the material will cure before it can be used in the field. Close attention to the sealing machine setup and operation is crucial. Each pouch is inspected as it is labeled for shipment to assure that the pouch and its seal are intact. Product Testing: As part of our commitment to quality assurance, samples from different lots of product are periodically drawn from production, made into coupons, and tested. Field Evaluation: Material quality data are collected and monitored as received from users. Should problems develop, they will be investigated to isolate the root cause and corrective actions will be taken as required.
Test Facilities Air Logistics has a test facility capable of verifying most of the mechanical and life characteristics of our Aquawrap® products. Each test complies with the appropriate ASTM standard and procedure. When a required test is beyond the scope of our facility, the material is sent to a reputable third-party test lab. The ability to test and verify new and existing products is key in the development process, as well as ongoing quality assessments. TEST DESCRIPTIONS This section details the various property tests Air Logistics Corporation has completed on its Aquawrap® material. Results of the test are provided. As mentioned, testing has been conducted in a multitude of venues. Each test indicates the location of the test facility. All of the testing, as well as the results, have been reviewed and approved by Air Logistics’ quality control department.

Air Logistics Corporation Aquawrap® Analysis
Page 4 of 19 Copyright © 2005 Air Logistics Corporation. All Rights Reserved.
Those tests that were done by an independent group have been referenced here. The results indicated by those tests have been reviewed by Air Logistics Corporation, and found to be consistent with its own private and third party tests. 2.0 Individual Tests Performed Tests 2.1 through 2.7, 2.9, 2.10, 2.16, 2.24 and 2.25 were performed on the current Aquawrap® product. The balance of the tests have been conducted over the past two years and used a number of different fabric weaves and weights which produced lower and sometimes higher tensile and other properties. Unless otherwise noted, the resin system in all of the tests is the same and, as such, the comparative results remain valid. 2.1 Tension -
The tensile properties of the material are determined in accordance with ASTM D-3039. The data includes not only the tensile characteristics of the material but modulus and strength per ply data as well.
2.2 Flexural Strength - The flexural properties of the product were determined by testing in accordance with ASTM 790. The data includes both the flexural strength and modulus.
2.3 Compressive Strength - The compressive properties of the product were determined by testing in accordance with ASTM D-695.
2.4 Interlaminar Shear - The interlaminar shear strength of the product was determined by the short beam shear method in accordance with ASTM D-2344.
2.5 Tg - The Tg of the material was determined in accordance with ASTM D-831.
2.6 Flammability - The flammability of the product was determined by testing in accordance with ASTM E-84.
2.7 Burst Strength - The burst strength of the product was determined by testing cured NOL rings on a burst fixture. The results were converted into strength per ply and compared to tensile strength determined in paragraph 2.1 above.
2.8 Tension Properties of the product cured under water - This test was done in order to determine if the tensile properties are affected when Aquawrap® is
cured under water. This test duplicates any situation where the material is applied under water such as on a pier piling or pipeline. The test consists of preparing and curing a panel under water and then tension testing it in accordance with ASTM D-3039. In this case the important parameter is the strength per ply, as the compression of the lay-up completed under water is not as good as a normally prepared laboratory sample.
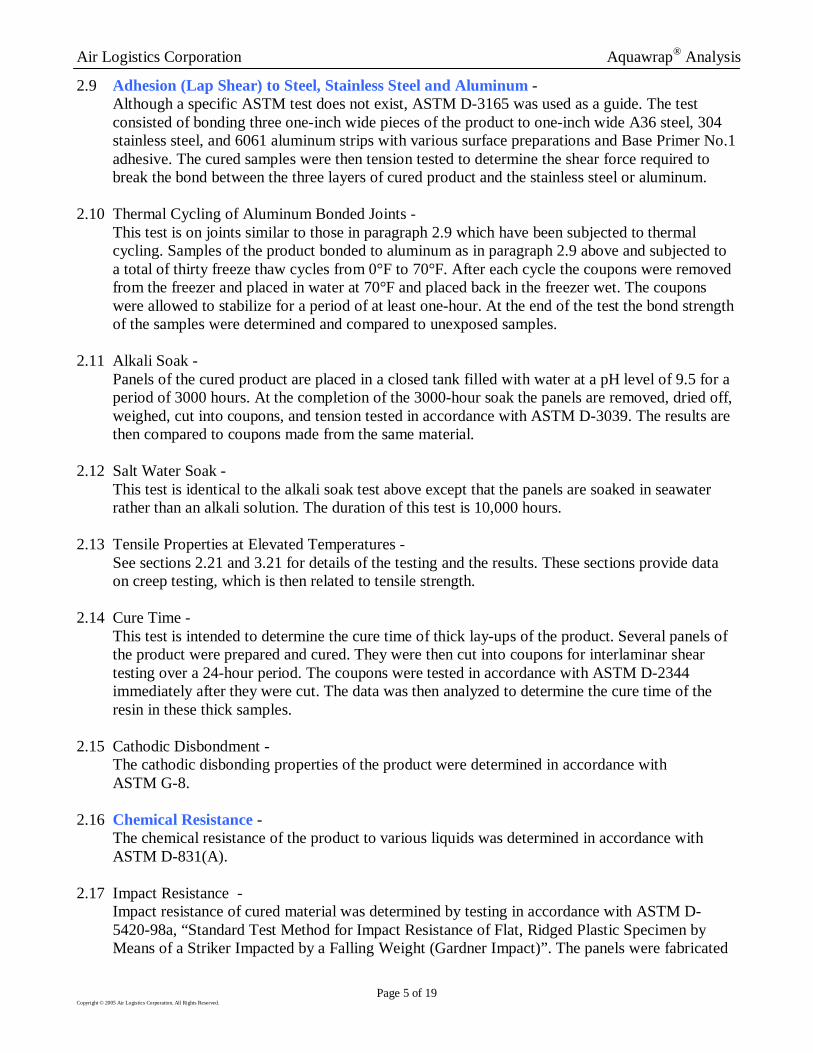
Air Logistics Corporation Aquawrap® Analysis
Page 5 of 19 Copyright © 2005 Air Logistics Corporation. All Rights Reserved.
2.9 Adhesion (Lap Shear) to Steel, Stainless Steel and Aluminum - Although a specific ASTM test does not exist, ASTM D-3165 was used as a guide. The test consisted of bonding three one-inch wide pieces of the product to one-inch wide A36 steel, 304 stainless steel, and 6061 aluminum strips with various surface preparations and Base Primer No.1 adhesive. The cured samples were then tension tested to determine the shear force required to break the bond between the three layers of cured product and the stainless steel or aluminum.
2.10 Thermal Cycling of Aluminum Bonded Joints - This test is on joints similar to those in paragraph 2.9 which have been subjected to thermal cycling. Samples of the product bonded to aluminum as in paragraph 2.9 above and subjected to a total of thirty freeze thaw cycles from 0°F to 70°F. After each cycle the coupons were removed from the freezer and placed in water at 70°F and placed back in the freezer wet. The coupons were allowed to stabilize for a period of at least one-hour. At the end of the test the bond strength of the samples were determined and compared to unexposed samples.
2.11 Alkali Soak - Panels of the cured product are placed in a closed tank filled with water at a pH level of 9.5 for a period of 3000 hours. At the completion of the 3000-hour soak the panels are removed, dried off, weighed, cut into coupons, and tension tested in accordance with ASTM D-3039. The results are then compared to coupons made from the same material.
2.12 Salt Water Soak - This test is identical to the alkali soak test above except that the panels are soaked in seawater rather than an alkali solution. The duration of this test is 10,000 hours.
2.13 Tensile Properties at Elevated Temperatures - See sections 2.21 and 3.21 for details of the testing and the results. These sections provide data on creep testing, which is then related to tensile strength.
2.14 Cure Time - This test is intended to determine the cure time of thick lay-ups of the product. Several panels of the product were prepared and cured. They were then cut into coupons for interlaminar shear testing over a 24-hour period. The coupons were tested in accordance with ASTM D-2344 immediately after they were cut. The data was then analyzed to determine the cure time of the resin in these thick samples.
2.15 Cathodic Disbondment - The cathodic disbonding properties of the product were determined in accordance with ASTM G-8.
2.16 Chemical Resistance - The chemical resistance of the product to various liquids was determined in accordance with ASTM D-831(A).
2.17 Impact Resistance - Impact resistance of cured material was determined by testing in accordance with ASTM D-
5420-98a, “Standard Test Method for Impact Resistance of Flat, Ridged Plastic Specimen by Means of a Striker Impacted by a Falling Weight (Gardner Impact)”. The panels were fabricated

Air Logistics Corporation Aquawrap® Analysis
Page 6 of 19 Copyright © 2005 Air Logistics Corporation. All Rights Reserved.
using three layers of woven roving (G-05) and one layer of tape (G-03).
2.18 UV Resistance - A cured panel of colored UV resistant material was placed in a chamber simulating the conditions of ASTM D-2565 for a period of five weeks. After the exposure the panel was visually examined and cut into coupons. The coupons were then tension tested in accordance with ASTM D-3039 and the results compared to unexposed coupons.
2.19 Long Term Exposure to Dry Heat - Two panels of slightly different construction were placed in dry heat at 140°F for periods of 1000 and 3000 hours. At the end of each exposure the panels were visually examined, weighed, cut into coupons, and tension tested in accordance with ASTM D-3039. The results were then compared to unexposed coupons.
2.20 Diesel Soak - This test is identical to the Alkali Soak test above except that the panels are soaked in diesel rather than an alkali solution. The duration of this test is 2,000 hours.
2.21 Creep Rupture Tests - Coupons were loaded in tension on a specially designed load frame, which maintains a constant tensile force on the coupons. The basis for this test is ASTM’s D-2990 and D-2992. The intent of the test is to determine the long-term tensile performance of the composite material by establishing a load profile and extrapolating it on a semi-logarithmic scale. These tests were conducted at the University of Wyoming.
2.22 Cyclic Loading - ASTM D-3039 type coupons were subjected to repetitive loads (sine wave) in a conventional load frame. Coupons were tested over a range of peak loads until they failed. The load vs. cycles to failure was then recorded and plotted on a semi-logarithmic scale.
2.23 NSF Approval - NSF International tested and approved Aquawrap® under its guidelines for NSF Standard 61.
3.0 Summary of Test Results 3.1 Tension: The tension test results are summarized in the following table: 3.1 TENSION PROPERTIES
THICKNESS (inches)
AREA SQUARE (inches)
ULTIMATE LOAD
(pounds)
TENSILE STRENGTH
(psi)
TENSILE MODULUS
(e6 psi)
STRENGTH PER INCH PER PLY
(pounds) AVERAGE RESULTS 0.056 0.057 3,921 68,983 3.74 769
Test number 1691. The standard deviation of the tensile strength of the samples is 3,140 PSI, or about 4.6% of the average tensile and is an indication of a good test. Location L1. 3.2 Flexural Strength: The results of the testing are as follows: 3.2 FLEXURAL STRENGTH
PROPERTIES WIDTH (inches)
THICKNESS (inches)
SPAN (inches)
ULTIMATE LOAD
(pounds)
FLEXURAL STRENGTH
(psi)
FLEXURAL MODULUS
(e6 psi) AVERAGE RESULTS 1.033 0.107 2.00 167 42,368 2.968
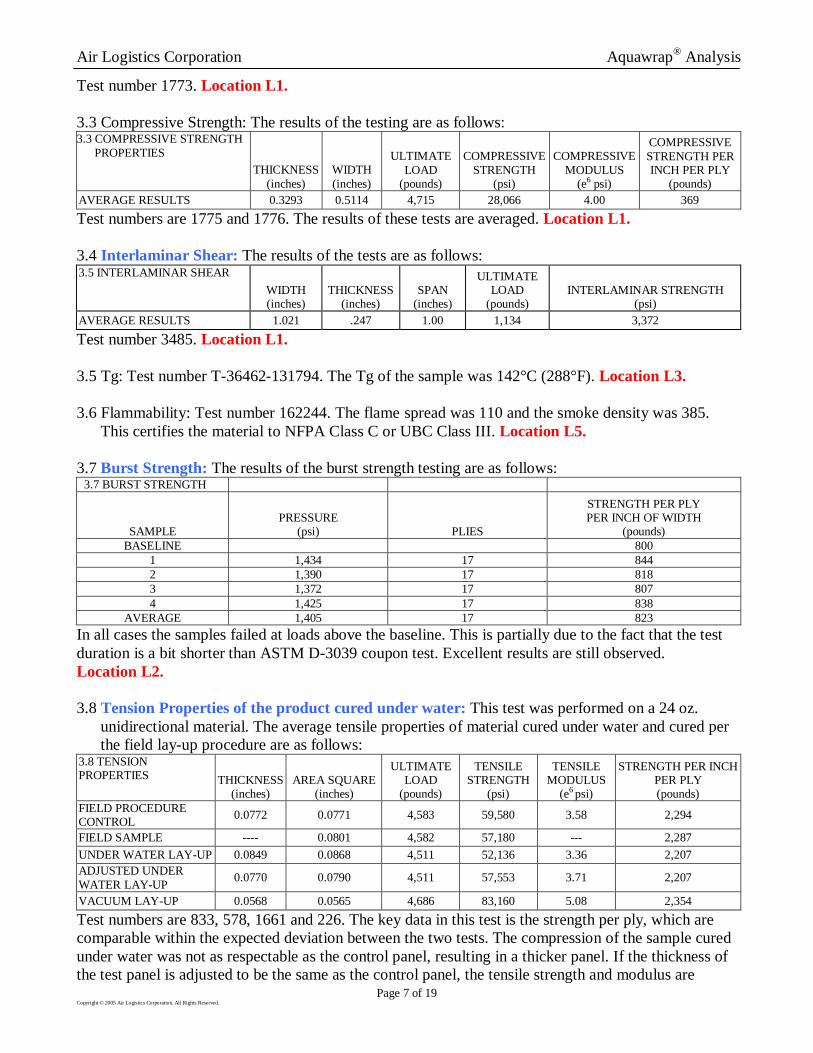
Air Logistics Corporation Aquawrap® Analysis
Page 7 of 19 Copyright © 2005 Air Logistics Corporation. All Rights Reserved.
Test number 1773. Location L1. 3.3 Compressive Strength: The results of the testing are as follows: 3.3 COMPRESSIVE STRENGTH
PROPERTIES THICKNESS
(inches) WIDTH (inches)
ULTIMATE LOAD
(pounds)
COMPRESSIVE STRENGTH
(psi)
COMPRESSIVE MODULUS
(e6 psi)
COMPRESSIVE STRENGTH PER INCH PER PLY
(pounds) AVERAGE RESULTS 0.3293 0.5114 4,715 28,066 4.00 369
Test numbers are 1775 and 1776. The results of these tests are averaged. Location L1. 3.4 Interlaminar Shear: The results of the tests are as follows: 3.5 INTERLAMINAR SHEAR
WIDTH (inches)
THICKNESS (inches)
SPAN (inches)
ULTIMATE LOAD
(pounds) INTERLAMINAR STRENGTH
(psi) AVERAGE RESULTS 1.021 .247 1.00 1,134 3,372
Test number 3485. Location L1. 3.5 Tg: Test number T-36462-131794. The Tg of the sample was 142°C (288°F). Location L3. 3.6 Flammability: Test number 162244. The flame spread was 110 and the smoke density was 385.
This certifies the material to NFPA Class C or UBC Class III. Location L5.
3.7 Burst Strength: The results of the burst strength testing are as follows: 3.7 BURST STRENGTH
SAMPLE PRESSURE
(psi) PLIES
STRENGTH PER PLY PER INCH OF WIDTH
(pounds) BASELINE 800
1 1,434 17 844 2 1,390 17 818 3 1,372 17 807 4 1,425 17 838
AVERAGE 1,405 17 823
In all cases the samples failed at loads above the baseline. This is partially due to the fact that the test duration is a bit shorter than ASTM D-3039 coupon test. Excellent results are still observed. Location L2. 3.8 Tension Properties of the product cured under water: This test was performed on a 24 oz.
unidirectional material. The average tensile properties of material cured under water and cured per the field lay-up procedure are as follows:
3.8 TENSION PROPERTIES THICKNESS
(inches) AREA SQUARE
(inches)
ULTIMATE LOAD
(pounds)
TENSILE STRENGTH
(psi)
TENSILE MODULUS
(e6 psi)
STRENGTH PER INCH PER PLY (pounds)
FIELD PROCEDURE CONTROL
0.0772 0.0771 4,583 59,580 3.58 2,294
FIELD SAMPLE ---- 0.0801 4,582 57,180 --- 2,287
UNDER WATER LAY-UP 0.0849 0.0868 4,511 52,136 3.36 2,207 ADJUSTED UNDER WATER LAY-UP
0.0770 0.0790 4,511 57,553 3.71 2,207
VACUUM LAY-UP 0.0568 0.0565 4,686 83,160 5.08 2,354
Test numbers are 833, 578, 1661 and 226. The key data in this test is the strength per ply, which are comparable within the expected deviation between the two tests. The compression of the sample cured under water was not as respectable as the control panel, resulting in a thicker panel. If the thickness of the test panel is adjusted to be the same as the control panel, the tensile strength and modulus are

Air Logistics Corporation Aquawrap® Analysis
Page 8 of 19 Copyright © 2005 Air Logistics Corporation. All Rights Reserved.
comparable to those of the control panel. The Shore D hardness of the panel cured under water was 85, which is typical of a normal vacuum lay-up. Location L1. 3.9 Adhesion to Steel, Stainless Steel, and Aluminum: The test was performed on steel and
aluminum with four configurations using Base Primer No. 1 adhesive. The results of the test are as follows:
3.9 SUBSTRATE NO ADHESIVE NO ABRASION
(psi)
ABRASION NO ADHESIVE
(psi)
ADHESIVE NO ABRASION
(psi)
ADHESIVE ABRASION
(psi) STEEL NO TEST NO TEST NO TEST 910
STAINLESS STEEL 602 717 1,008 1,128
ALUMINUM 557 604 557 1,009
Test numbers are 1130, 1132, 1133, 1135, 1824 and 3342. The area of the bond in each test was one inch and the units of the pull off strength are both pounds and PSI. Location L1. 3.10 Thermal Cycling of Aluminum Bonded Joints: The results of the tests are as follows: 3.10 BONDING TO ALUMINUM AVERAGE PULL OFF STRESS
(psi) BASELINE 870
CYCLED - NO ALODINE 537
CYCLED - WITH ALODINE 965
Test numbers are 2957 and 3008. The bond does not appear to be affected by the freeze thaw cycling, in fact the strength increased during the cycling. The use of Alodine is important as the bond strength increased dramatically by its use. This is true in pull off tests without freeze thaw cycling as well. Location L1. 3.11 Alkali Soak: The tensile strength of the processed panels and reference panels are as follows: 3.11 TENSION
THICKNESS (inches)
AREA SQUARE (inches)
ULTIMATE LOAD
(pounds)
TENSILE STRENGTH
(psi)
TENSILE MODULUS
(e6 psi)
STRENGTH PER INCH PER PLY
(pounds) BASELINE RESULTS 0.043 0.044 1,860 42,743 3.02 366
AVERAGE RESULTS 0.035 0.035 1,576 44,827 2.50 315
Test numbers 1753 and 1223. The weight of the coupon at the start of the test was 107.7 grams. The weight at the end of the test was 107.6 grams. The Shore D at the end of the test was 85. There is no change in the appearance of the coupon. The difference between the baseline and processed data are within the normally expected deviation and the conclusion is that the processing had no affect on the material. However, for some reason the modulus of the processed panel appears to be low. Location L1. 3.12 Salt Water Soak: The tensile strength of the processed panels after 8000 hours and reference
panels are as follows. Note that the test is continuing and will run to 10,000 hours. 3.12 TENSION
THICKNESS (inches)
AREA SQUARE (inches)
ULTIMATE LOAD
(pounds)
TENSILE STRENGTH
(psi)
TENSILE MODULUS
(e6)
STRENGTH PER INCH PER PLY
(pounds) BASELINE 0.1024 0.1022 4,799 46,957 3.0 1,202 PROCESSED PANEL 8000 HOURS
0.1202 0.1215 4,466 36,757 2.4 1,116
Test numbers 263 and 2276. There was a slight softening and swelling of the resin, which increased the thickness of the panel and reduced the tensile and modulus. The important parameter is that the strength per ply was reduced by only 8%. Location L1.

Air Logistics Corporation Aquawrap® Analysis
Page 9 of 19 Copyright © 2005 Air Logistics Corporation. All Rights Reserved.
3.13 Tensile Properties at elevated temperatures: See paragraph 3.21 for creep-rupture test details. The slope of the load vs. cycles to failure for the room and elevated temperature (160°F) tests were the same and the offset between the plots is 9%. This indicates that the creep-rupture performance at the material at the elevated temperature is 9% lower than at room temperature.
3.14 Cure Time: The results of the cure time were converted into percent of the final interlaminar shear
strength. These tests were completed on coupons over 0.25” thick to simulate the cure of a thick lay-up. Due to the coupon thickness, the data needed to be plotted and then analyzed to determine the actual cure times of each sample.
The conclusion is that the material cures to about 60% of its final strength in about 8 hours. Location L1. 3.15 Cathodic Disbondment: Test number 28184. The preliminary results of the test are 0.6 inches. Subsequent testing results showed no evidence of cathodic disbondment. Location L4. 3.16 Chemical Resistance: The results of the test are: CHEMICAL REACTION Acetone No Reaction Diesel Fuel No Reaction Ethyl Alcohol No Reaction Gasoline No Reaction HCL (30%) Slight Softening MEK No Reaction Toluene No Reaction 3.17 Impact Resistance: Test number 162527. The coupons had a Mean-Energy of 80 in.-lbf.
Location L5.
CURE TIME
0
20
40
60
80
100
120
1 3 5 7 9 11 13 15 17 19 21 23
TIME IN HOURS
% C
UR
E

Air Logistics Corporation Aquawrap® Analysis
Page 10 of 19 Copyright © 2005 Air Logistics Corporation. All Rights Reserved.
3.18 UV Resistance: Two panels were prepared using our UV resistant resin formulation. The tensile strength of the processed panels and reference panels are as follows:
3.18 TENSION
THICKNESS (inches)
AREA SQUARE (inches)
ULTIMATE LOAD
(pounds)
TENSILE STRENGTH
(psi)
TENSILE MODULUS
(e6 psi)
STRENGTH PER INCH PER PLY
(pounds) BASELINE RESULTS
0.060 0.060 2,644 43,870 3.07 524
AVERAGE RESULTS
0.055 0.055 2,520 45,460 2.86 504
Test numbers are 800 and 801. The strength data between the two samples is less than normal to test variance. The conclusion is that the exposure had no effect on the coupons. Location L1. 3.19 Dry Heat: The tensile strength of the baseline and processed panels are as follows: 3.19 TENSION
TENSILE STRENGTH (psi)
TENSILE MODULUS (e6 psi)
BASELINE (5011) 49,200 2.9
AVERAGE RESULTS - 1000 HOURS 50,200 3.2
AVERAGE RESULTS - 3000 HOURS 49,500 3.2
BASELINE (5050) 41,611 2.8
AVERAGE RESULTS - 1000 HOURS 44,400 2.8
AVERAGE RESULTS - 3000 HOURS 42,400 2.9
Test number 939799. The tensile and modulus data between the processed and baseline panels are essentially identical. Location L7. 3.20 Diesel Soak: The tensile strength of the processed panels and reference panels are as follows: 3.20 TENSION
THICKNESS (inches)
AREA SQUARE (inches)
ULTIMATE LOAD
(pounds)
TENSILE STRENGTH
(psi)
TENSILE MODULUS
(e6 psi)
STRENGTH PER INCH PER PLY (pounds)
BASELINE RESULTS 0.042 0.043 2,730 63,627 3.2 667
AVERAGE RESULTS 0.042 0.042 2,704 65,832 3.1 673
Test numbers are 1727 and 1726. The weight of the processed panel increased slightly during the processing from 65.6 grams to 67.1 grams. There does not appear to be any difference in the appearance of the panels and the Shore D Hardness of both panels was 90. The conclusion of the test is that there was no difference between the processed and baseline panel. Location L1.

Air Logistics Corporation Aquawrap® Analysis
Page 11 of 19 Copyright © 2005 Air Logistics Corporation. All Rights Reserved.
3.21 Creep Rupture: Test number 907198. The results of the room temperature 10,000-hour test are shown in the following graphs:
The baseline strength of this 11 oz. tape material is 801 pounds per ply. The 25-year projection of 416 pounds per inch represents a long-term load capability of 52% of its initial tensile strength. The results of the testing at 160o F are shown in the following graph.
y = -11.68Ln(t) + 559.98
0
100
200
300
400
500
600
700
800
10 100 1000 10000Time (hrs)
Uni
t Ply
Fai
lure
Lo
ad (
lbs
)
y = -11.68Ln(t) + 508.84
0
100
200
300
400
500
600
700
800
1 10 100 1000 10000
Time (hrs)
Uni
t Ply
Fai
lure
Loa
d (lb
s)

Air Logistics Corporation Aquawrap® Analysis
Page 12 of 19 Copyright © 2005 Air Logistics Corporation. All Rights Reserved.
First the slope of the room and elevated temperature plots is identical and the offset between them is 9%. This indicates that the long term load handling capability at elevated temperatures had a difference of only 9%. This is an excellent result. Location L7.
3.22 Cyclic Loading: Test number 907198A. The results of the testing to date are shown in the following graph. The baseline load per ply of this material is 801 pounds per ply. Location L7.
3.23 NSF Approval: Aquawrap® was tested by NSF International and was determined to comply with
ANSI/NSF 61. As such, we are authorized to use the NSF mark on our products specified on the NSF listing. Certificate #37231-01. Location L4.
Fatigue
y = -36.761Ln(x) + 823.08
260
310
360
410
460
510
560
610
100 1,000 10,000 100,000 1,000,000
Cycles
Un
it P
ly L
oad
(lb
)

Air Logistics Corporation Aquawrap® Analysis
Page 13 of 19 Copyright © 2005 Air Logistics Corporation. All Rights Reserved.
4.0 Burst Testing 4.1 Pipe Burst Test
Although multiple burst tests have been performed under a variety of conditions, the validation of the material should be based on its ability to contain the Maximum Allowable Operating Pressure of any given system. The following chart outlines results from a few of these tests.
Discussion of the Chart
• The first column outlines the pipe detail such as the outside diameter of the pipe, the original wall thickness of the pristine pipe, the grade of the pipe, the specified minimum yield strength (SMYS) of the pipe, and the ultimate tensile strength (UTS) of the pipe.
• The second column is the calculated yield pressure of the particular specimen. This is derived using Barlow’s Equation (P=2ST/D).
• The third column is the calculated burst pressure of the particular specimen. This is also derived using Barlow’s Equation.
• The fourth column represents the calculated maximum allowable operating pressure (MAOP) of the pristine pipe. This number uses 72% of the calculated yield pressure of the pristine pipe.
• The fifth column is a summary of the defect that was created in the pipe. It lists the length and width of the defect, as well as the depth. All defects were machined and measurements confirmed. Depth of the defect and the remaining pipe wall thickness were verified using calibrated ultrasonic testing equipment.
• The sixth column is the calculated burst pressure of the pipe specimen when the defect is entered into the equation.
• The seventh column indicates the number of layers of Aquawrap® G-03 Fabric that was applied and the approximate thickness of the lay-up.
• The final column lists the failure mode of the test. Pipe Preparation
• All pipe specimens were verified for proper diameter and wall thickness. • The pipe was cleaned to a near-white metal finish and then wiped with a solvent cleaner
such as acetone. • The filler material, or load transfer compound, was then applied in the defect area. Enough
material was applied to restore the profile of the pipe. This was allowed to cure prior to subsequent steps.
• Proper primer was applied and the required number of layers of Aquawrap® G-03 Fabric were installed.
• Stricture Banding™ was used to compress and consolidate the final installation. • The lay-up was allowed to completely cure prior to any pressure application.
Burst Testing
• A section of pipe was capped on both ends with welded end-caps. On opposite ends of the pipe specimen, ¾” threaded half couplings were welded on. One was to accept the pressurization hose and the other was used to bleed air during the filling process.
• Pipe was filled with ambient temperature water and all air was purged. • Pressure was applied steadily throughout the test. On some instances, the pressure was held
at particular stages for 5-10 minutes. • Test was completed upon failure of the pipe specimen or the wrap itself.

Air Logistics Corporation Aquawrap® Analysis
Page 14 of 19 Copyright © 2005 Air Logistics Corporation. All Rights Reserved.
Burst Test Results
PIPE DETAILS
PIPE YIELD
PRESSURE
PIPE BURST
PRESSURE
MAOP1 DEFECT DETAILS
CALCULATED BURST
PRESSURE WITH DEFECT
CALCULATED BURST PRESSURE WITH REPAIRED
DEFECT LAYERS RESULT 8.644” OD 2 0.322” wall A53 Gr.B
44,000 SMYS 71,000 UTS
(Serial #967296)
3,278 psi 5,290 psi 2,360 psi
External 8” long 4” wide
0.192” deep (59.6% wall loss)
2,136 psi 5,271 psi 38 layers (0.418”)
Leakage under
wrap at 5,100 psi
8.644” OD 2 0.322” wall
API 5L 44,000 SMYS 71,000 UTS
(Serial #947996)
3,278 psi 5,290 psi 2,360 psi
External 8” long 4” wide
0.192” deep (59.6% wall loss)
2,136 psi 5,897 psi 44 layers (0.484”)
Burst under
wrap at 5,159 psi
12.75” OD 2 0.250” wall
ERW 54,000 SMYS 72,000 UTS
(Serial #958497)
2,118 psi 2,824 psi 1,525 psi
External 6” long
1.47” wide 0.125” deep
(50% wall loss)
1,412 psi 4,311 psi 62 layers (0.6875”)
Pipe burst outside of wrap at
2,740 psi
16” OD 3
0.250” wall ERW
50,000 SMYS 70,000 UTS
(Serial #938098)
1,563 psi 2,188 psi 1,125 psi
External 8.50” long 4” wide
0.125” deep (50% wall loss)
1,460 psi 4 1,513 psi 13 layers (0.143”)
Wrap failure at 2,045 psi
20” OD 3
0.562” wall API 5L X60 60,000 SMYS 87,747 UTS
(Serial #899697)
3,374 psi 4,934 psi 2,428 psi
External 19.69” long 3.74” wide 0.370” deep
(66% wall loss)
1,536 psi 3,204 psi 89 layers (0.984”)
Held at 3,374 psi
for a 4 hour test
1. Using a 0.72 design factor 2. Pipe specimens were prepared and wrapped at Air Logistics, Azusa, CA facility. Tests completed by a third party at their testing
facility. Location L2. 3. Tests were conducted at the request of a third party. Installations and testing were done at their site, with their material and test
equipment. 4. The calculated burst pressure with the defect was 1,094 using Barlow’s formula and 1,213 using RSTRENG. Pressure indicated was
derived from a ruptured test sample using similar corrosion depth, width, and length dimensions.
Figure 4.2 12.75” OD pipe with ruptured section adjacent to wrap.

Air Logistics Corporation Aquawrap® Analysis
Page 15 of 19 Copyright © 2005 Air Logistics Corporation. All Rights Reserved.
4.2 Burst Test Evaluation The following provides a simple background of each of the tests that were performed. 1. 8.644” OD Pipe (Serial #967296) -
This test involved a pipe section with a machined defect measuring 8” long x 4” wide x .192” deep (59.6% wall loss). The pipe section was 60” long and closed at both ends with welded end-caps. Actual failure occurred within 3.5% of the calculated failure. This test provided very desirable results. Location L2.
2. 8.644” OD Pipe (Serial #967296) - This test was similar to the previous test done on 8” pipe, yet the test duration was longer. During the first pressure stage, the test piece was taken from 0 psi to 2,771 psi (over 400 psi beyond the MAOP of the pipe) in 90 seconds. It was then held at that pressure for 3 minutes. No drop in pressure or material damage was observed. The second stage increased the pressure from 2,771 psi to 3,265 psi, which is just under the yield point of the steel. Elapsed time to reach this pressure was 2 minutes, and it was held at that point for 3 minutes. The final stage was a slow increase in pressure until failure occurred. The duration of this stage was 10 minutes. This type of test was useful in qualifying previous tests done on the creep-rupture properties of Aquawrap®. This test resulted in a very successful outcome. Location L2.
3. 12.75” OD Pipe (Serial #958497) - This section of pipe had a machined defect measuring 6” long x 1.47” wide x .125” deep (50% wall loss). The pipe section was 60” long and closed at both ends with welded end caps. The wrap installation was fairly conservative, as the goal was to burst the pipe outside the wrap section. Using our current Aquawrap® Composite Wrap Reinforcement Calculator, the 62 layers that were applied equates to inputs of 400 pounds per ply for the material, using a 0.67 design factor for the composite, and a safety factor of 1.25. Location L2.
4. 16” OD Pipe (Serial #938098) - This test specimen was provided by a third party for testing at their facility. This test was designed to take the pipe over the yield pressure, as the normal operating pressure would never be expected to reach that point. The defect was 8.5” long x .125” deep (50% wall loss). The pipe section was 20 feet long and closed at both ends with welded end caps. A static burst test of a similar piece of pipe ruptured in the defect area at 1,406 psi. This pressure was used as the base to determine how much load the composite wrap was to hold.
5. 20” OD Pipe (Serial #899697) - The pipe specimen used in this test had a machined defect measuring 19.69” long x 3.74” wide x .370” deep (66% wall loss). The purpose of this test was to verify the capability of the composite to repair external defects. This test was comprised of three pressure cycles. The first cycle took the specimen to 90 percent of the design pressure of the piping (2,428 psi). After this, the pressure was relieved and the repair inspected for visual defects. The second pressure cycle took the specimen to the SMYS of the pipe (3,374 psi). It was held at this pressure for four hours and then the pressure was once again relieved. The last pressure cycle was composed of ten cycles that went from 0-2,428 psi. The repair passed all three test cycles for external repair of the defect. Location L9.

Air Logistics Corporation Aquawrap® Analysis
Page 16 of 19 Copyright © 2005 Air Logistics Corporation. All Rights Reserved.
4.3 NOL Ring Test Data Summary The NOL (Naval Ordinance Laboratory) ring test is done on a 0.20 inch thick, 1” inch wide ring of composite material, 20” in diameter. The ring is placed in a special test machine mounted outside of a bladder. The bladder is then pressurized with liquid, thus causing hoop stress to be applied to the entire ring simultaneously. The pressure is increased until the ring fails. The stress in the ring at failure is then compared to that of ASTM D 3039 coupon results. The reason this test was devised is that test results done on composite structures, such as rocket motor casings and infrastructure column reinforcements, did not always match those calculated using coupon test data. The reason for this is inadequate interlaminar shear strength of the composite. If the interlaminar shear properties of the composite are not good enough, the composite delaminates rather than fails in a normal tension mode. The NOL ring test was devised to measure the composite system under true hoop stress loading. Air Logistics has completed NOL ring tests on four of its materials; Glass Tape (G-03 Fabric), Glass Woven Roving (G-05 Fabric), UD Glass (G-06 Fabric), and UD Carbon (C-14 Fabric). Although this paper focuses on the G-03 Fabric, the other materials are included for reference. The NOL ring testing was performed at Alliant TechSystems Inc. (Location L8). Chart Layout • The first column is the coupon test number. • The second column is the pressure at which the ring failed. • The third column is the force on the ring at failure. • The next four columns list the number of layers and the per layer strength of materials used to
fabricate the ring. • The next column is the total calculated force of the ring. • The last column lists the difference between the actual test results and the calculated force.
Discussion of Test Results In all cases the actual force the material withstood during the test was greater than that calculated based on the ASTM D3039 coupon test data. It should be noted that the pressurization rate of the rings generally resulted in failure in about 30 seconds. This rate is determined by the test machine and cannot be easily changed. The specified time to failure of coupons in the ASTM test is between one and ten minutes. The pull rate of the data taken on the coupons of the materials listed generally resulted in failure between two and four minutes. The creep rupture characteristics of these materials could explain the better results of the rings with respect to coupons.

Air Logistics Corporation Aquawrap® Analysis
Page 17 of 19 Copyright © 2005 Air Logistics Corporation. All Rights Reserved.
NOL Ring Test Results
TEST NUMBER
PRESSURE AT FAILURE
(psi) FORCE (pounds)
PLIES G-03
PLIES OTHER
STRENGTH PER PLY
G-03 FABRIC (pounds)
STRENGTH PER PLY OTHER FABRIC (pounds)
TOTAL
CALCULATED FORCE (pounds)
DELTA FORCE (pounds)
G-03 FABRIC
Ring 1 1,434 14,340 17 750 12,750 1,590
Ring 2 1,390 13,900 17 750 12,750 1,150
Ring 3 1,372 13,720 17 750 12,750 970
Ring 4 1,425 14,250 17 750 12,750 1,500
Average 1,405 14,053 750 12,750 1,303
G-05 FABRIC
WR 7-101 1,132 11,320 7 1,200 8,400 2,920
WR 7-201 1,024 10,240 7 1,200 8,400 1,840
WR 7-301 968 9,680 7 1,200 8,400 1,280
Average 1,041 10,413 1,200 8,400 2,013
G-06 UD FABRIC
SIR00101 2,189 21,890 1 8 (G-06) 750 2,400 19,950 1,940
SIR00102 2,357 23,570 1 8 (G-06) 750 2,400 19,950 3,620
Average 2,273 22,730 750 2,400 19,950 2,780
C-14 UD FABRIC
SIR00103 3,003 30,030 2 8 (C-14) 750 3,400 28,700 1,330
SIR00104 2,680 26,800 2 8 (C-14) 750 3,400 28,700 1,900
SIR00105 2,868 28,680 1 8 (C-14) 750 3,400 27,950 730
SIR00106 2,890 28,900 1 8 (C-14) 750 3,400 27,950 950
Average 2,860 28,603 750 3,400 28,325 1,227

Air Logistics Corporation Aquawrap® Analysis
Page 18 of 19 Copyright © 2005 Air Logistics Corporation. All Rights Reserved.
5.0 Test Locations
Location L1 Air Logistics Corporation 3600 East Foothill Boulevard Pasadena, CA 91107 Phone 626-795-9971
Location L2 Authorized Testing Inc. 2522 Kansas Avenue Riverside, CA 92507 Phone 909-682-4110
Location L3 Delsen Test Laboratories, Inc. 1024 Grand Central Avenue Glendale, CA 91201-3011 Phone 818-247-4106
Location L4 National Testing Laboratories 877 Rose Place Anaheim, CA 92805 Phone 714-991-5520
Location L5 SGS U.S. Testing Company, Inc. 5555 Telegraph Road Los Angeles, CA 90040 Phone 323-838-1600
Location L6 University of Utah Civil & Environmental Engineering College of Engineering 122 South Central Campus Drive - Rm. 104 Salt Lake City, UT 84112-0561 Report No. CVEEN-03/01
Location L7 University of Wyoming Composite Materials Research Group PO Box 3295 Laramie, WY 82071 Phone 307-766-4266 Fax 307 766-2695
Location L8 Alliant Techsystems Inc. Freeport Center PO Box 160433 Clearfield, UT 84016-0433 Phone 801-775-1729 Fax 801-775-1207
Location L9 Petrobras Research Center (CENPES) Luiz C.M. Meniconi Catholic University of Rio de Janeiro Jose L.F. Freire Ronaldo D. Vieira Jorge L.C. Diniz Reference ASME Document IPC02-27372

Air Logistics Corporation Aquawrap® Analysis
Page 19 of 19 Copyright © 2005 Air Logistics Corporation. All Rights Reserved.
6.0 Conclusion Through laboratory testing and field testing, Aquawrap® has proven itself to be an easy to use, reliable, and efficient means of repairing piping that has been subjected to damage caused by external corrosion or by other mechanical means. The product has undergone extensive development to arrive at the final stage you see today. By testing many different resin formulations, fabric weaves and types, and the combination of both, Air Logistics was able to distinguish itself from other products in the same market. Aquawrap® is an engineered composite product, designed specifically for structural reinforcement. By performing burst tests, we are able to see the actual performance of material in a real life situation. Most pipelines may never see their maximum allowable operation pressure, but testing to that threshold proves the viability of the product. The ability of Aquawrap® to be applied in layers provides the end user with the option of installing more strength to the system if they so choose. A minimum of four layers is recommended on any installation, regardless of strength calculation results. Air Logistics provides a simple calculation program that one can use to determine the number of layers required for a given repair. Aquawrap® is an environmentally safe product which uses no hazardous chemicals. No measuring or mixing of resins is required and clean-up is safe and quick. Primer systems are prepackaged to ensure the right ratios, and are designed to be mixed in their own containers. This eliminates the need for extra mixing buckets, and extra waste. Air Logistics will continue its commitment to provide high strength composites to the pipeline market. These products will help prevent system shut-downs, costly repairs, and damage to the environment.

Air Logistics Corporation, Pasadena, CA
Aquawrap Concrete Repair and Restoration System
[Factory Pregged (Saturated) Composite System]
March 2003
Reinforced Concrete Beam Test Report
Structural Evaluation of Aquawrap Composite System
for Repair and Strengthening of Reinforced Concrete
Beams
Prepared for:
Air Logistics Corporation
3600 Foothill Blvd
Pasadena, CA 91107
Prepared by: James Korff

Table of Contents 1. Abstract 2. Object Statement
3. Introduction to Aquawrap System 4. Identification and Dates of Tests 5. Description of Specimens and Apparatus
5.1. Specimen Description 5.1.1. Reinforcement 5.1.2. Concrete 5.1.3. Aquawrap Material Properties
5.2. Test Assembly 6. Testing Program
6.1. Test protocol 6.1.1. Loading 6.1.2. Environmental Conditions
7. Test Results
7.1. Control Specimen
7.2. Strengthened Specimens 7.2.1. Aquawrap Strengthening Schemes
7.2.1.1. B1 – Two Layers AquaWrap w / No. 1 Urethane Adhesive 7.2.1.2. B2 – Two Layers AquaWrap w/ No. 3 Epoxy Adhesive 7.2.1.3. B3 – Two Layers AquaWrap w / No. 1 Adhesive w/ Anchorage
7.3. Summary of Results
7.4. Conclusion 7.4.1. Increase in Capacity 7.4.2. Mode of Failure

2
1. Abstract This report provides results of the structural testing and evaluation of the Air Logistics “Aquawrap”
Concrete Repair and Restoration System conducted on full-scale reinforced concrete beams. Loads and
displacements were continuously monitored and recorded during the tests. A total of three (3) tests were
conducted on beams strengthened with Air Logistics “Aquawrap” systems.
2. Object Statement The purpose of testing was to evaluate the structural performance of reinforced concrete beams
strengthened externally with Air Logistics “Aquawrap” Concrete Repair and Restoration System. Three
strengthening configurations were tested, all in accordance with the recently released “Guide for the
Design and Construction of Externally Bonded FRP Systems for Strengthening Concrete Structures”, as
reported by ACI Committee 440 ( ACI 440.2R-02).
3. Introduction to Aquawrap System
The Air Logistics “Aquawrap” Concrete Repair and Restoration System is a proven, engineered, field-applied composite system. It features a high mechanical strength, fast and simple installation, no field mixing, measuring or saturation, wide application temperature range, wet or underwater application, fast cure, and non-hazardous shipping.
It is an ideal system for concrete strengthening per ACI Publication ACI 440.2R-02 “ Guide for the Design and Construction of Externally Bonded FRP Systems for Strengthening Concrete Structures”.
Aquawrap is a pre-impregnated, water activated, structural wrap that has been used successfully to repair and strengthen NYDOT and IDAHO DOT bridge columns and piers, and has also been tested extensively and utilized as a FRP Wrap for repairing damaged aluminum and steel freeway sign structures. The product has also been utilized in the repair of wooden utility poles and for pipeline reinforcement. Aquawrap consists of either glass fiber (Woven and UD) or carbon fiber (Woven and UD) sheets pre-impregnated with water cured polyurethane resin. The resin content is set at the factory. No impregnation equipment or effort is required at the job site. There is no field saturation required. The material comes in hermetically sealed pouches that are opened prior to use. The water activated polyurethane resin has a faster cure than most epoxy systems. It cures under ambient temperature, with a relatively high glass transition temperature. The wrap may be applied in cold temperatures (32 F.), and in wet conditions, even in the rain or under water.

3
4. Identification and Dates of Tests
A total of four (4) reinforced concrete beams were fabricated and a total of four (4) tests were conducted up to the ultimate capacity of each specimen. The test matrix is shown in Table 1.
TABLE 1
Test # Description Test Date
B0 As Built – No Composite Strengthening Jan 17, 2003
B1 Two Layers of UD Carbon w/ Adhesive N0. 1 Jan 17, 2003
B2 Two Layers of UD Carbon w/ Epoxy Adhesive Jan 17, 2003
B3 Two Layers of UD Carbon w/ Adhesive No. 1 Jan 17, 2003
and Fabric U-Strap Stirrups at ends.
5. Description of Specimens and Apparatus
5.1. Specimen Description
5.1.1. Reinforcement
All beams were fabricated using Grade 60 reinforcing steel from the same mill batches. Beam widths were 4 in. Beam depths were 7 in. Tension (bottom) reinforcement consisted of two (2) #3 steel with a one-inch cover of concrete. One (1) #3 steel bar was placed at the center at the top of the beam with a one-inch cover of concrete. Shear reinforcement consisted of #3 stirrups spaced evenly along the beam ends. The clear span of all beam specimens was 6 ft 1 in. Beams had a centerline in each direction.
5.1.2. Concrete
Concrete with a nominal compressive strength of 6,000 psi was used in the construction of each beam. Four (4) beams were fabricated. All beams were poured from the same batch of concrete. Specified concrete mix design was for 28-day strength of 6,000 psi.

4
5.1.3. Aquawrap Material Properties
UD Carbon Tensile Strength = 120,000 psi Tensile Strength per inch width = 3,400 lbs E-Modulus = 11,000 ksi Elongation at break = 1.1 %
5.2. Test Assembly
The concrete beams were simply supported at either end and a vertical downward load applied at two points along the top of the beam (Four-point Loading). All test specimens were fabricated on site at Air Logistics Corporation, Pasadena, CA, under continuous supervision of the program manager. The test assembly and the special transfer fixtures were designed and calibrated to perform this type of full-scale beam evaluation test. The test actuator was a located between the actuator and the test specimen. 6. Testing Program 6.1. Test protocol One (1) as built full-scale beam (without composite materials) was tested to failure. The purpose of the test was to evaluate the ultimate flexural strength of the beam and to identify modes of failure. As built beams and beams strengthened with the Aquawrap systems were then tested to ultimate failure. Aquawrap systems were bonded to the reinforced concrete beams with either polyurethane or epoxy adhesives.
Weak concrete on the tensile surface of the beams to be strengthened was prepared with a needle scaler to produce a surface similar to that achieved with high pressure water or sand blasting. Four point bending tests were performed on all beams. Deflections at the midspan of the beam were measured.
6.1.1. Loading For all tests, the load was applied using a four-point loading configuration with a constant rate of loading of about 1 kip per minute ramp. Loads were applied monotonically in a vertical downward direction until failure occurred and the beam would no longer sustain a load.
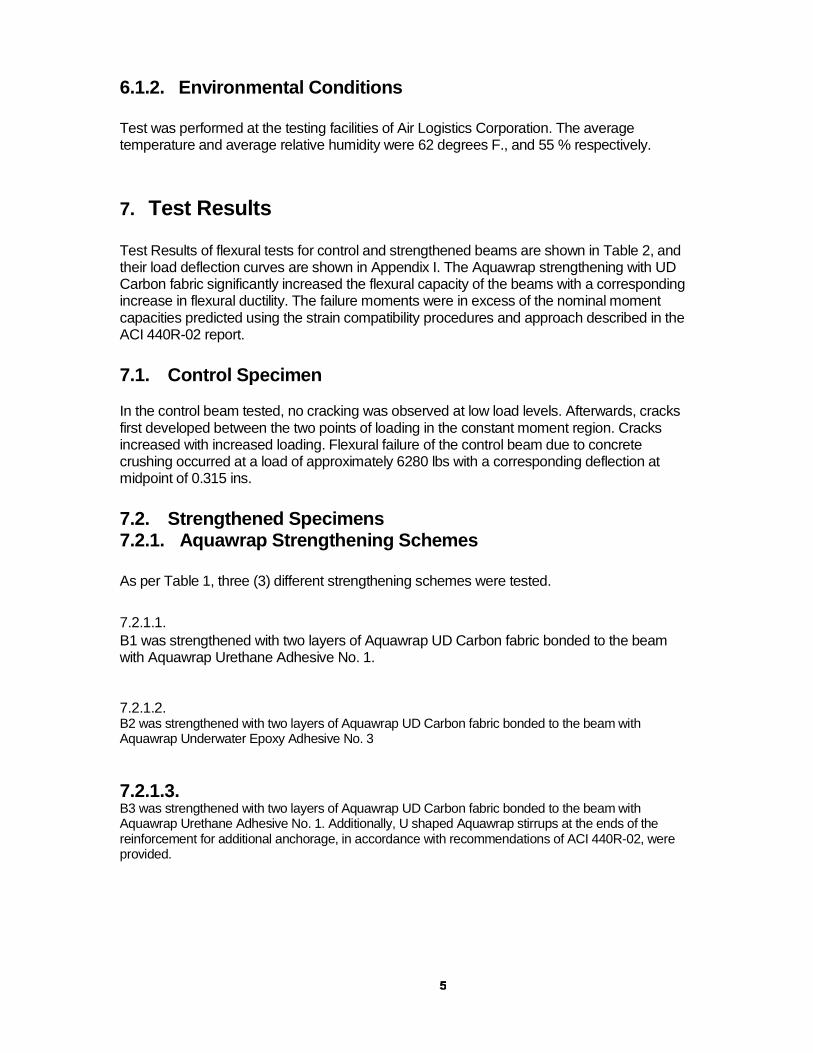
5
6.1.2. Environmental Conditions
Test was performed at the testing facilities of Air Logistics Corporation. The average temperature and average relative humidity were 62 degrees F., and 55 % respectively.
7. Test Results
Test Results of flexural tests for control and strengthened beams are shown in Table 2, and their load deflection curves are shown in Appendix I. The Aquawrap strengthening with UD Carbon fabric significantly increased the flexural capacity of the beams with a corresponding increase in flexural ductility. The failure moments were in excess of the nominal moment capacities predicted using the strain compatibility procedures and approach described in the ACI 440R-02 report.
7.1. Control Specimen In the control beam tested, no cracking was observed at low load levels. Afterwards, cracks first developed between the two points of loading in the constant moment region. Cracks increased with increased loading. Flexural failure of the control beam due to concrete crushing occurred at a load of approximately 6280 lbs with a corresponding deflection at midpoint of 0.315 ins.
7.2. Strengthened Specimens 7.2.1. Aquawrap Strengthening Schemes As per Table 1, three (3) different strengthening schemes were tested. 7.2.1.1. B1 was strengthened with two layers of Aquawrap UD Carbon fabric bonded to the beam with Aquawrap Urethane Adhesive No. 1. 7.2.1.2. B2 was strengthened with two layers of Aquawrap UD Carbon fabric bonded to the beam with Aquawrap Underwater Epoxy Adhesive No. 3
7.2.1.3. B3 was strengthened with two layers of Aquawrap UD Carbon fabric bonded to the beam with Aquawrap Urethane Adhesive No. 1. Additionally, U shaped Aquawrap stirrups at the ends of the reinforcement for additional anchorage, in accordance with recommendations of ACI 440R-02, were provided.
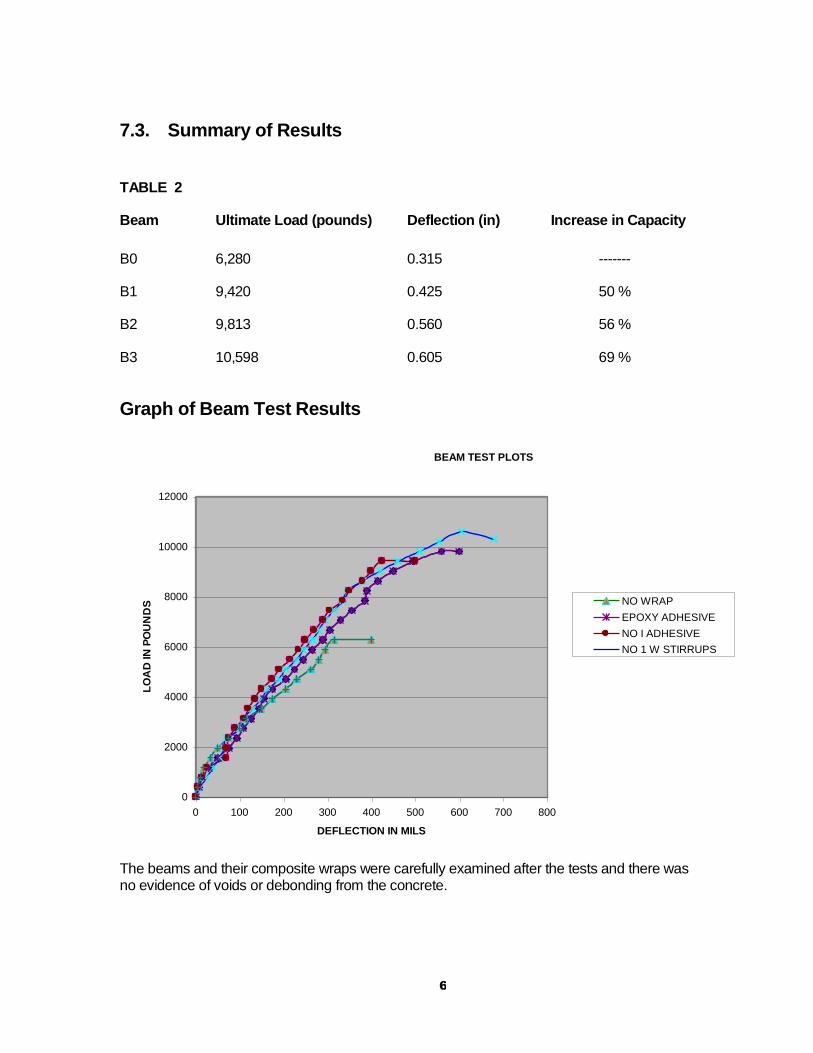
6
7.3. Summary of Results
TABLE 2
Beam Ultimate Load (pounds) Deflection (in) Increase in Capacity B0 6,280 0.315 -------
B1 9,420 0.425 50 %
B2 9,813 0.560 56 %
B3 10,598 0.605 69 %
Graph of Beam Test Results
BEAM TEST PLOTS
0
2000
4000
6000
8000
10000
12000
0 100 200 300 400 500 600 700 800
DEFLECTION IN MILS
LOA
D IN
PO
UN
DS NO WRAP
EPOXY ADHESIVE
NO I ADHESIVE
NO 1 W STIRRUPS
The beams and their composite wraps were carefully examined after the tests and there was no evidence of voids or debonding from the concrete.

7
7.4. Conclusion Aquawrap Pre-Pregged UD Carbon fabric bonded longitudinally with adhesives to the bottom of the reinforced concrete beams in accordance with procedures outlined in ACI 440R-02 strengthened the beams significantly, increasing their flexural strength over that of the control beams without reducing the beam ductilities. Shear and normal stress concentrations occur near the ends of the FRP reinforcement. To ensure a flexural mode of failure, guarding against such stress concentrations, the longest possible bonded lengths were utilized. . As expected, the additional bond supplied at the ends by utilizing fabric U-Shaped straps contributed to additional flexural performance.
7.4.1. Increase in Capacity Results of the tests performed showed a substantial increase in the flexural capacity of the strengthened beams versus the control reinforced concrete beams. This increase ranged from 56% to 69% over the capacity of the control beam. This increase in flexural capacity is within the limits of established guidelines for reinforcing with FRP sheets. As per the ACI 440R-02 and other guidelines, FRP reinforcement should be used only as supplemental reinforcement. This is to guarantee that in the event of loss of the FRP reinforcement, due to fires, vandalism or other such events, the structural member will remain capable of sustaining dead and live loads, although with much more deflection than in the service limit states.
7.4.2. Mode of Failure FRP reinforcement can fail in two basic ways; flexural and local. The flexural mode of failure includes crushing of concrete or rupture of the FRP reinforcement. The local mode of failure can involve debonding of the FRP sheets or a shear failure of the concrete layer between the FRP and the longitudinal reinforcement. The flexural mode of failure supports a ductile behavior of the reinforced concrete element and is thus desirable. Local failures are to be avoided. Bond strength between the FRP and the concrete is thus a crucial factor affecting the structural response of the member. The underlying purpose of the above beam testing was to verify the high level of performance of the Aquawrap FRP System. Failure of the above Aquawrap strengthened beams, whether with urethane adhesive or epoxy adhesive, consistently occurred as compression failures of the concrete. There was no failure in the Aquawrap composite FRP system.

PRODUCT TECHNICAL DATA SHEET
Aquawrap® G-03 & G-05 Highly Conformable Tape and Woven Roving Fabric Constructions
Aquawrap® is a low cost composite system for use in repair and reinforcement of existing mechanical systems, structures and piping. Furnished factory-impregnated with the proprietary 22-77 resin system. It is odorless and solvent-free. Cured Aquawrap®
is a very durable, high long term strength material, impervious to fuels, most chemicals and solvents. It permanently bonds to a wide variety of surfaces such as metals, composites, concrete, plastics and wood. Certified to NSF/ANSI Standard 61. Qualified in accordance with the ASME PCC-2 piping repair standard.
Aquawrap® is ready to apply, right out of the bag and cures by way of a chemical reaction with field-applied water. This offers considerable advantages over conventional cloth-resin systems in that there is no resin measuring, mixing, spreading, solvents, or dripping polymer mess.
PRODUCT PROPERTIES
Working Time: 30-40 min. at 25°C (77°F) Mix Ratio: No mixing required
Application Temps:
4-93°C (40-200°F) Service Temps: -40°C - 121°C (-40°F - 250°F)
Cure Time (dry to touch):
30-60 minutes at 25°C (77°F) Full Cure: 7 days at 25°C (77°F)
Usual Packaging: Pre-Packaged Rolls Shelf Life: 1 year
Chemical Resistance:
Acetone, mek, toluene, gasoline, ethyl alcohol and many others
Hardness: 90 Shore D - ASTM D-2240
COMPOSTIE PROPERTIES
TEST G-03 FABRIC G-05 FABRIC
Tensile Strength (warp direction). psi 52089 46525
Tensile Strength (fill direction), psi 26236 46525
Tensile Modulus (warp direction), msi 2.78 2.63
Tensile Modulus (fill direction), msi 1.34 2.63
Tensile load per ply (warp direction), pounds per inch of width 814 1175
Tensile load per ply (fill direction), pounds per inch of width 457 1175
Thickness, mils 15.5 25.5
HDT, OF 325 325
CTE,in/in OF 8.2 e-6 NA
Tg OF 288 288
Bond strength to steel with BP-1 Adhesive, psi 1360 989
Aquawrap Tech Sheet-4.doc Page 1 of 2 May 17, 2010 Copyright © 2006 Air Logistics Corporation. All Rights Reserved.

ATTENTION: All of the following data are based on laboratory conditions, at room temperature. Field conditions can radically change the characteristics of this product. Higher temperatures will lessen the working life of the product. Allow adequate time for application. Field testing is strongly recommended prior to application.
Design and Application Instructions
Design guidelines, application notes and wrap calculations for various applications are available from the factory.
Storage Store at 60-90° F in a dry place. Keep from freezing. Dispose of any leftover material.
Handling Aquawrap® is shipped in a sealed protective bag to protect it from atmospheric moisture. Because it cures with the application of water (and air humidity), care must be taken in handling the sealed bags to prevent puncturing or scuffing, which would cause the product to cure in the bag. Once the bag is opened and the Aquawrap® is exposed to the humidity in the air, it will begin to cure and will gel within about 60 minutes. Therefore, work must be well planned prior to opening the bag. Aquawrap® requires no other special handling or application procedures. This resin is slightly irritating to certain sensitive people; it will give off a small amount of carbon dioxide vapor while curing; and the cured resin is permanent and very difficult to remove, so gloves, safety glasses and other personnel protection equipment appropriate for the task must be used.
Shelf Life
12 months from date of sale, in an unopened package, stored in cool warehouse conditions.
Caution – Read MSDS prior to use. Some persons may be irritated by this compound. Use caution and PPE. This product is for industrial use by professionally trained personnel only. Please read and understand all application instructions prior to using.
Warranty The manufacturer warrants that the goods delivered hereunder shall be free from defects in material and workmanship. The WARRANTY shall extend for a period of one (1) year after date of delivery of such goods to customer. This warranty is void in the event that the protective pouch has been damaged. THE MANUFACTURER MAKES NO WARRANTY EXPRESS, IMPLIED, (INCLUDING BUT NOT LIMITED TO WARRANTIES OF MERCHANTABILITY AND FITNESS FOR INTENDED PURPOSE), OR STATUTORY, OTHER THAN THE FOREGOING EXPRESS WARRANTY. Failure of customer to submit any claim hereunder within the Warranty Period after receipt of such goods shall be an admission by customer and conclusive proof that such articles are in every respect as warranted and shall release the manufacturer from any and all claims for damage or loss sustained by customer. In the event customer submits a claim for defective material within the required Warranty Period, the parties agree that customer’s sole and exclusive remedy shall be the replacement of such defective goods or a refund of the price of the defective goods. To the greatest extent practical defective goods shall be returned to the manufacturer for analysis. IN NO EVENT SHALL THE MANUFACTURER BE LIABLE FOR INCIDENTAL OR CONSEQUENTIAL DAMAGES OR SPECIAL, INDIRECT OR INCIDENTAL DAMAGES ARISING OUT OF, OR AS THE RESULT OF, THE SALE, DELIVERY, NON-DELIVERY, LOSS OF USE OF GOODS OR ANY PART THEREOF, EVEN THOUGH THE MANUFACTURER HAS BEEN NEGLIGENT OR HAS BEEN INFORMED OF CIRCUMSTANCES WHICH MIGHT GIVE RISE TO SUCH DAMAGES.
Data and parameters listed herein and in our data sheets have been obtained by Air Logistics Corporation using materials under carefully controlled conditions. Data of this type should not be used by engineers as design specifications, but rather as indicative of ultimate properties obtainable. Before using, user should determine the suitability of the product for its intended use. In determining whether the material is suited for a particular use, such factors as overall application configuration and design, field conditions and environmental criteria to which it will be subjected should be considered by the user.
AIR LOGISTICS CORPORATIONField-Applied Composite Systems™ Group925 North Todd Avenue • Azusa, CA 91702
Phone: 626-633-0294Fax: 626-633-0791
www.airlog.com
TM
Aquawrap Tech Sheet-4.doc Page 2 of 2 May 17, 2010 Copyright © 2006 Air Logistics Corporation. All Rights Reserved.

PRODUCT TECHNICAL DATA SHEET
Aquawrap® Black High Strength/Modulus Carbon Fabric Construction
Aquawrap® BlackTM is a high strength high modulus repair and reinforcement system for existing mechanical systems,
structures and piping. This product is especially suited for the economical repair of large piping systems. Furnished factory-impregnated with our proprietary urethane resin system. It is odorless and solvent-free. Cured Aquawrap®
is a very durable, high long term strength material, impervious to fuels, most chemicals and solvents. It permanently bonds to a wide variety of surfaces such as metals, composites, concrete, plastics and wood.
Aquawrap® is ready to apply, right out of the bag and cures by way of a chemical reaction with field-applied water. This offers considerable advantages over conventional cloth-resin systems in that there is no resin measuring, mixing, spreading, solvents, or dripping polymer mess.
PRODUCT PROPERTIES
Working Time: 30-40 min. at 25°C (77°F) Mix Ratio: No mixing required
Application Temps: 4-93°C (40-200°F) Service Temps:
-18 - 121°C (0 - 250°F)
Cure Time (dry to touch): 30-60 minutes at 25°C (77°F) Full Cure: 7 days at 25°C (77°F)
Usual Packaging: Pre-Packaged Rolls Shelf Life: 1 year
Chemical Resistance: Acetone, mek, toluene, gasoline, ethyl alcohol and many others
Hardness: 90 Shore D - ASTM D-2240
TEST C-2 FABRIC
Tensile Strength (warp direction). psi 77605
Tensile Strength (fill direction), psi 48,330
Tensile Modulus (warp direction), msi 6.45
Tensile Modulus (fill direction), msi 3.65
Tensile load per ply (warp direction), pounds per inch of width 2897
Tensile load per ply (fill direction), pounds per inch of width 1787
Thickness, mils .037
HDT, OF 325
CTE,in/in OF 8.7 e-6
Tg OF 288
Bond strength to steel with BP-1 Adhesive, psi 1000 (est)
Aquawrap Tech Sheet-CARBON.doc Page 1 of 2 March 30, 2009 Copyright © 2006 Air Logistics Corporation. All Rights Reserved.

ATTENTION: All of the following data are based on laboratory conditions, at room temperature. Field conditions can radically change the characteristics of this product. Higher temperatures will lessen the working life of the product. Allow adequate time for application. Field testing is strongly recommended prior to application.
Design and Application Instructions
Design guidelines, application notes and wrap calculations for various applications are available from the factory.
Storage Store at 60-90° F in a dry place. Keep from freezing. Dispose of any leftover material.
Handling Aquawrap® is shipped in a sealed protective bag to protect it from atmospheric moisture. Because it cures with the application of water (and air humidity), care must be taken in handling the sealed bags to prevent puncturing or scuffing, which would cause the product to cure in the bag. Once the bag is opened and the Aquawrap® is exposed to the humidity in the air, it will begin to cure and will gel within about 60 minutes. Therefore, work must be well planned prior to opening the bag. Aquawrap® requires no other special handling or application procedures. This resin is slightly irritating to certain sensitive people; it will give off a small amount of carbon dioxide vapor while curing; and the cured resin is permanent and very difficult to remove, so gloves, safety glasses and other personnel protection equipment appropriate for the task must be used.
Shelf Life
12 months from date of sale, in an unopened package, stored in cool warehouse conditions.
Caution – Read MSDS prior to use. Some persons may be irritated by this compound. Use caution and PPE. This product is for industrial use by professionally trained personnel only. Please read and understand all application instructions prior to using.
Warranty The manufacturer warrants that the goods delivered hereunder shall be free from defects in material and workmanship. The WARRANTY shall extend for a period of one (1) year after date of delivery of such goods to customer. This warranty is void in the event that the protective pouch has been damaged. THE MANUFACTURER MAKES NO WARRANTY EXPRESS, IMPLIED, (INCLUDING BUT NOT LIMITED TO WARRANTIES OF MERCHANTABILITY AND FITNESS FOR INTENDED PURPOSE), OR STATUTORY, OTHER THAN THE FOREGOING EXPRESS WARRANTY. Failure of customer to submit any claim hereunder within the Warranty Period after receipt of such goods shall be an admission by customer and conclusive proof that such articles are in every respect as warranted and shall release the manufacturer from any and all claims for damage or loss sustained by customer. In the event customer submits a claim for defective material within the required Warranty Period, the parties agree that customer’s sole and exclusive remedy shall be the replacement of such defective goods or a refund of the price of the defective goods. To the greatest extent practical defective goods shall be returned to the manufacturer for analysis. IN NO EVENT SHALL THE MANUFACTURER BE LIABLE FOR INCIDENTAL OR CONSEQUENTIAL DAMAGES OR SPECIAL, INDIRECT OR INCIDENTAL DAMAGES ARISING OUT OF, OR AS THE RESULT OF, THE SALE, DELIVERY, NON-DELIVERY, LOSS OF USE OF GOODS OR ANY PART THEREOF, EVEN THOUGH THE MANUFACTURER HAS BEEN NEGLIGENT OR HAS BEEN INFORMED OF CIRCUMSTANCES WHICH MIGHT GIVE RISE TO SUCH DAMAGES.
Data and parameters listed herein and in our data sheets have been obtained by Air Logistics Corporation using materials under carefully controlled conditions. Data of this type should not be used by engineers as design specifications, but rather as indicative of ultimate properties obtainable. Before using, user should determine the suitability of the product for its intended use. In determining whether the material is suited for a particular use, such factors as overall application configuration and design, field conditions and environmental criteria to which it will be subjected should be considered by the user.
AIR LOGISTICS CORPORATION
Field-Applied Composite Systems™ Group925 North Todd Avenue • Azusa, CA 91702
Phone: 626-633-0294Fax: 626-633-0791
www.airlog.com
TM
Aquawrap Tech Sheet-CARBON.doc Page 2 of 2 March 30, 2009 Copyright © 2006 Air Logistics Corporation. All Rights Reserved.