omae2010-20101: analysis methodology of vortex-induced motions (vim) on a monocolumn platform...
DESCRIPTION
Vortex-Induced Motion (VIM) is a highly non-linear dynamic phenomenon. Usual spectral analysis methods, using the Fourier transform, rely on the hypotheses of linear and stationary dynamics. A method to treat non-stationary signals that emerge from non-linear systems is denoted Hilbert-Huang transform method (HHT). The development of an analysis methodology to study the VIM of a MPSO (Monocolumn Production, Storage and Offloading System) using HHT was presented. The purposes of the analysis methodology are to improve the statistics characteristics of VIM. The results showed to be comparable to results obtained from the traditional analysis (mean of the 10% highest peaks) principally for the motions in the transverse direction, although the difference between the results from the traditional analysis for the motions in the in-line direction showed a difference of around 25%. The results from the HHT analysis are more reliable than the traditional ones, owing to the larger number of points to calculate the statistics characteristics. These results should be used to design the risers and mooring lines, as well as to obtain parameters of the VIM to calibrate numerical predictions.TRANSCRIPT

Shanghai | China | june | 2010 29th International Conference on Ocean, Offshore and Arctic Engineering 1
ANALYSIS METHODOLOGY OF VORTEX-INDUCED MOTIONS (VIM) ON A MONOCOLUMN PLATFORM APPLYING THE
HILBERT-HUANG TRANSFORM METHOD
june | 2010
Rodolfo T. Gonçalves
Guilherme R. Franzini
Guilherme F. Rosetti
André L. C. Fujarra
Kazuo Nishimoto
TPN – Numerical Offshore Tank
Department of Naval Architecture and Ocean
Engineering
Escola Politécnica – University of São Paulo
São Paulo, SP, Brazil
Shanghai | China | june | 2010 29th International Conference on Ocean, Offshore and Arctic Engineering 2
Introduction
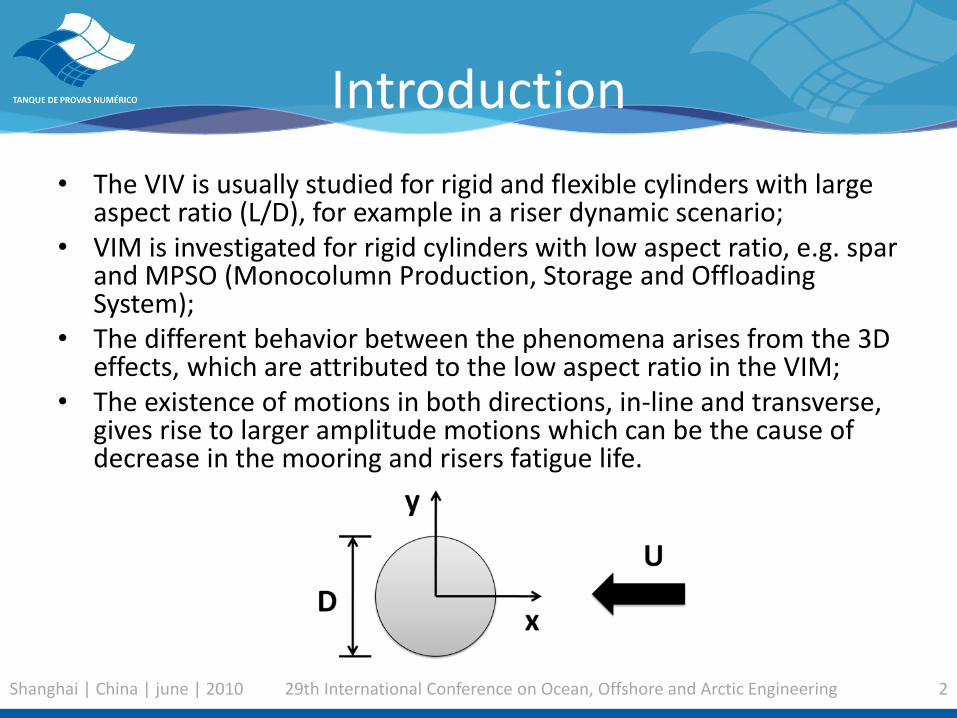
• The VIV is usually studied for rigid and flexible cylinders with large aspect ratio (L/D), for example in a riser dynamic scenario;
• VIM is investigated for rigid cylinders with low aspect ratio, e.g. spar and MPSO (Monocolumn Production, Storage and Offloading System);
• The different behavior between the phenomena arises from the 3D effects, which are attributed to the low aspect ratio in the VIM;
• The existence of motions in both directions, in-line and transverse, gives rise to larger amplitude motions which can be the cause of decrease in the mooring and risers fatigue life.

Shanghai | China | june | 2010 29th International Conference on Ocean, Offshore and Arctic Engineering 3
Motivation
• Experimental time-histories that emerge from VIM investigations are non-linear and non-stationary;
• Usual spectral analysis methods, based on Fourier Transform, rely on the hypotheses of linear and stationary dynamics;
• A method developed to treat non-stationary signals that originate from non-linear systems was presented by (Huang, et al., 1998). It is referred to as Hilbert-Huang transform method (HHT).
• The work proposes to create an analysis methodology to improve the statistics characteristics of VIM signal using the HHT.
Shanghai | China | june | 2010 29th International Conference on Ocean, Offshore and Arctic Engineering 4
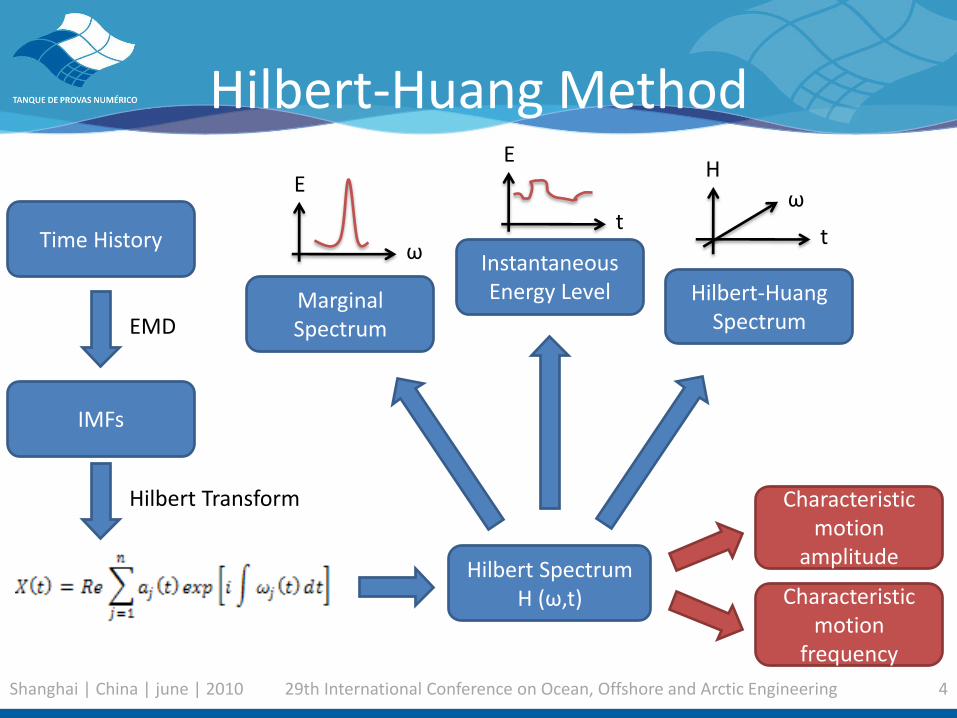
Hilbert-Huang Method
Time History
EMD
IMFs
Hilbert Transform
Hilbert Spectrum H (ω,t)
Marginal Spectrum
Instantaneous Energy Level Hilbert-Huang
Spectrum
Characteristic motion
amplitude
Characteristic motion
frequency
ω
E
t
E
t
ω H
Shanghai | China | june | 2010 29th International Conference on Ocean, Offshore and Arctic Engineering 5
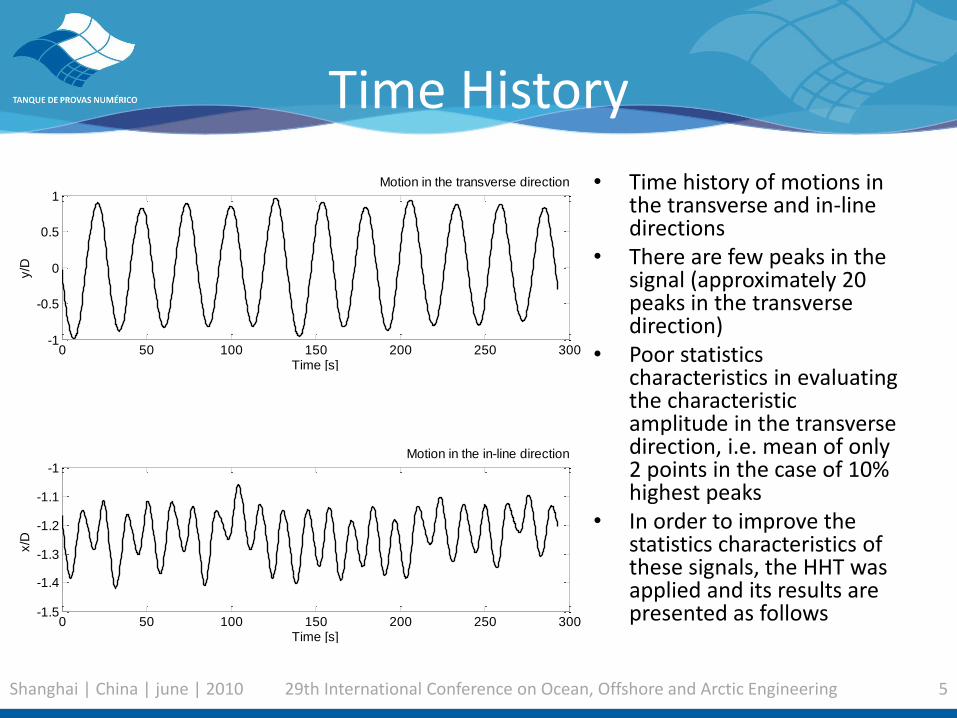
• Time history of motions in the transverse and in-line directions
• There are few peaks in the signal (approximately 20 peaks in the transverse direction)
• Poor statistics characteristics in evaluating the characteristic amplitude in the transverse direction, i.e. mean of only 2 points in the case of 10% highest peaks
• In order to improve the statistics characteristics of these signals, the HHT was applied and its results are presented as follows
Time History
0 50 100 150 200 250 300-1
-0.5
0
0.5
1
Time [s]
y/D
Motion in the transverse direction
0 0.05 0.10
10
20
30
40
50
Frequency [Hz]
Ma
rgin
al S
pe
ctr
um
0 100 200 3000
1
2
3
4
5x 10
-3
Insta
nta
ne
ou
s E
ne
rgy
Time [s]
0 50 100 150 200 250 300-1.5
-1.4
-1.3
-1.2
-1.1
-1
Time [s]
x/D
Motion in the in-line direction
0 0.05 0.10
0.5
1
1.5
2
Frequency [Hz]
Ma
rgin
al S
pe
ctr
um
0 100 200 3000
0.2
0.4
0.6
0.8
1
1.2x 10
-4
Insta
nta
ne
ou
s E
ne
rgy
Time [s]
Shanghai | China | june | 2010 29th International Conference on Ocean, Offshore and Arctic Engineering 6
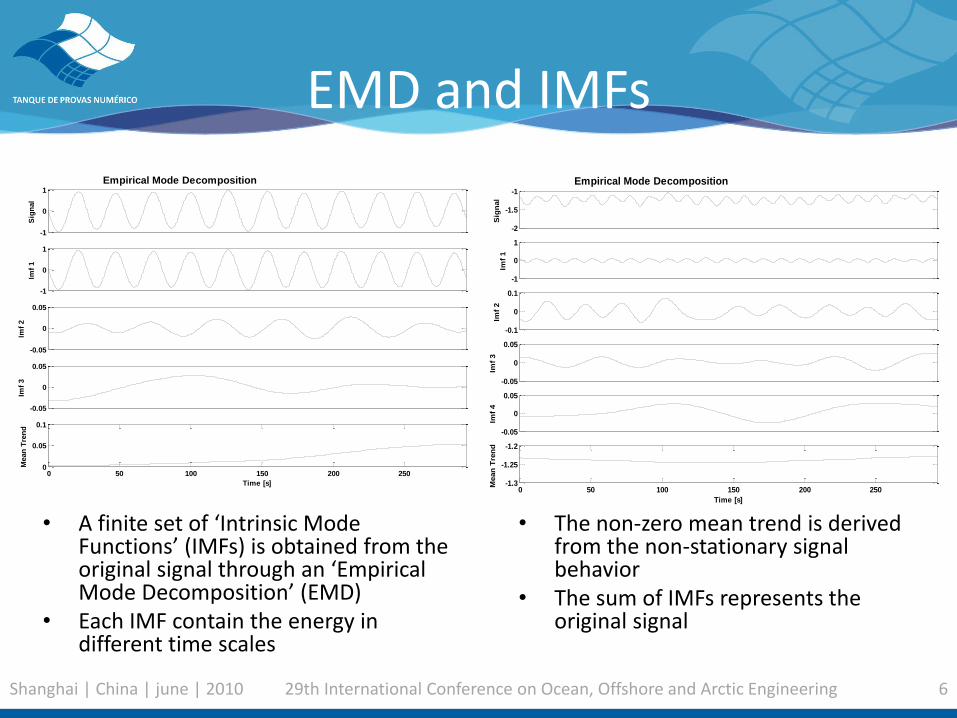
EMD and IMFs
• A finite set of ‘Intrinsic Mode Functions’ (IMFs) is obtained from the original signal through an ‘Empirical Mode Decomposition’ (EMD)
• Each IMF contain the energy in different time scales
-1
0
1
Sig
nal
Empirical Mode Decomposition
-1
0
1
Imf
1
-0.05
0
0.05
Imf
2
-0.05
0
0.05
Imf
3
0 50 100 150 200 2500
0.05
0.1
Time [s]
Mean
Tre
nd
-2
-1.5
-1
Sig
nal
Empirical Mode Decomposition
-1
0
1
Imf
1
-0.1
0
0.1
Imf
2
-0.05
0
0.05
Imf
3
-0.05
0
0.05
Imf
40 50 100 150 200 250
-1.3
-1.25
-1.2
Time [s]M
ean
Tre
nd
• The non-zero mean trend is derived from the non-stationary signal behavior
• The sum of IMFs represents the original signal

Shanghai | China | june | 2010 29th International Conference on Ocean, Offshore and Arctic Engineering 7
Hilbert-Huang Spectrum
• This frequency-time distribution of the amplitude is designated as the Hilbert spectrum
Time [s]
Fre
qu
en
cy [H
z]
Hilbert-Huang Spectrum
0 50 100 150 200 2500
0.01
0.02
0.03
0.04
0.05
0.06
0.07
0.08
0.09
0.1
Y/D
0.1
0.2
0.3
0.4
0.5
0.6
0.7
0.8
0.9
Time [s]
Fre
qu
en
cy [H
z]
Hilbert-Huang Spectrum
0 50 100 150 200 2500
0.01
0.02
0.03
0.04
0.05
0.06
0.07
0.08
0.09
0.1
X/D
0.02
0.04
0.06
0.08
0.1
0.12
0.14
0.16
0.18
• The frequency time-trace for the motions in the transverse direction is very energetic, but presents small fluctuations around 0.35 Hz.
• The frequency time-trace for the motions in the in-line direction has large fluctuation due to the highly non-stationary nature of the VIM.

Shanghai | China | june | 2010 29th International Conference on Ocean, Offshore and Arctic Engineering 8
Marginal Spectrum
• The marginal spectrum offers a measure of total amplitude (or energy) contribution from each frequency value. It is similar a the Power Spectrum by FFT
0 0.01 0.02 0.03 0.04 0.05 0.06 0.07 0.08 0.09 0.10
5
10
15
20
25
30
35
40
45
50
Frequency [Hz]
Ma
rgin
al S
pe
ctr
um
0 0.01 0.02 0.03 0.04 0.05 0.06 0.07 0.08 0.09 0.10
0.2
0.4
0.6
0.8
1
1.2
1.4
1.6
1.8
Frequency [Hz]
Ma
rgin
al S
pe
ctr
um
• The high energy level is comprised of a low width range of frequencies for the motions in the transverse direction, whereas the energy level is significant in a large width range for the motions in the in-line direction.

Shanghai | China | june | 2010 29th International Conference on Ocean, Offshore and Arctic Engineering 9
Intantaneous Energy Level
• The IE can be used to check the energy fluctuation over time, i.e. the amplitude modulation.
0 50 100 150 200 250 3000
0.5
1
1.5
2
2.5
3
3.5
4
4.5
5x 10
-3
Insta
nta
ne
ou
s E
ne
rgy
Time [s]0 50 100 150 200 250 300
0
0.2
0.4
0.6
0.8
1
1.2x 10
-4
Insta
nta
ne
ou
s E
ne
rgy
Time [s]
• The IE for the motions in the in-line direction is more irregular than the transverse direction ones. This fact confirms the high modulation amplitude present in the signal.

Shanghai | China | june | 2010 29th International Conference on Ocean, Offshore and Arctic Engineering 10
Characteristic Amplitudes
• The characteristic motion amplitude is evaluated applying the mean of the 10% largest amplitudes from H(ω,t).
• The characteristic motion frequency is the mean of the frequency related to the 10% largest amplitudes from H(ω,t).
0 2 4 6 8 10 12 14 160
0.2
0.4
0.6
0.8
1
Vr0
Y / D
Traditional AnalysisFujarra, et al. (2009)
HHT AnalysisGonçalves, et al. (2010)
0 2 4 6 8 10 12 14 160
0.05
0.1
0.15
0.2
Vr0
X / D
Traditional AnalysisFujarra, et al. (2009)
HHT AnalysisGonçalves, et al. (2010)
• The numbers of points to calculate the mean is proportional to the number of points in the signal time history, which provides a better statistics.
• The comparison between HHT and Traditional Analysis showed: • Small difference in the transverse
direction (around 2%) • Differences around 25% in the
in-line direction for Vr > 9.0

Shanghai | China | june | 2010 29th International Conference on Ocean, Offshore and Arctic Engineering 11
Conclusions
• The values of characteristic motion amplitudes showed to be more reliable owing to the large number of points to calculate the statistics using HHT.
• The comparison between traditional analysis (mean of the 10% highest peaks) and HHT analysis for VIM pointed out to larger differences observing the motion in the in-line direction. The difference is due to the non-stationary behavior of the VIM phenomenon (modulation in the amplitude and frequency).

Shanghai | China | june | 2010 29th International Conference on Ocean, Offshore and Arctic Engineering 12
THANKS