on children’s height, fixed effects regression and observations from a rural district of uttar...
TRANSCRIPT

on children’s height, fixed effects regression and observations from a
rural district of Uttar Pradesh
Diane Coffey Office of Population Research,
Princeton University &Centre for Development Economics,
Delhi University &rice institute (www.riceinstitute.org)
photo credit: Kit Shangpliang

what we’ll talk about for the next 2 hours
• some methodology– fixed effects as an identification strategy (with
examples from population studies)• some new quantitative research
– women’s status and children’s height in India: evidence from joint rural households
• some reflections on fieldwork in Uttar Pradesh– thinking about why Indian children are so short and
what can be done about it

some methodology:
using fixed effects as an identification strategy (with examples from population studies)

what is an identification strategy?
• use the words identification strategy to talk about how we argue that the independent variable has a causal effect on the dependent variable
• correlation is not causation– example: ice cream and drowning

what are some common identification strategies?
• randomized controlled experiments– time intensive, costly and quite risky
• instrumental variables– a good instrument is hard to find…
• natural experiments– again, hard to find
• well thought through cross sectional analysis• panel data
– fixed effects is one way of analyzing panel, or group, data

fixed effects• used with group or panel data• allow the researcher to correlate within group
changes/differences/deviations in y with changes/differences/deviations in x
• some examples of panel data:– more than one observation about the same person– more than one observation about the same place– comparison within groups of similar individuals
(siblings, cousins)
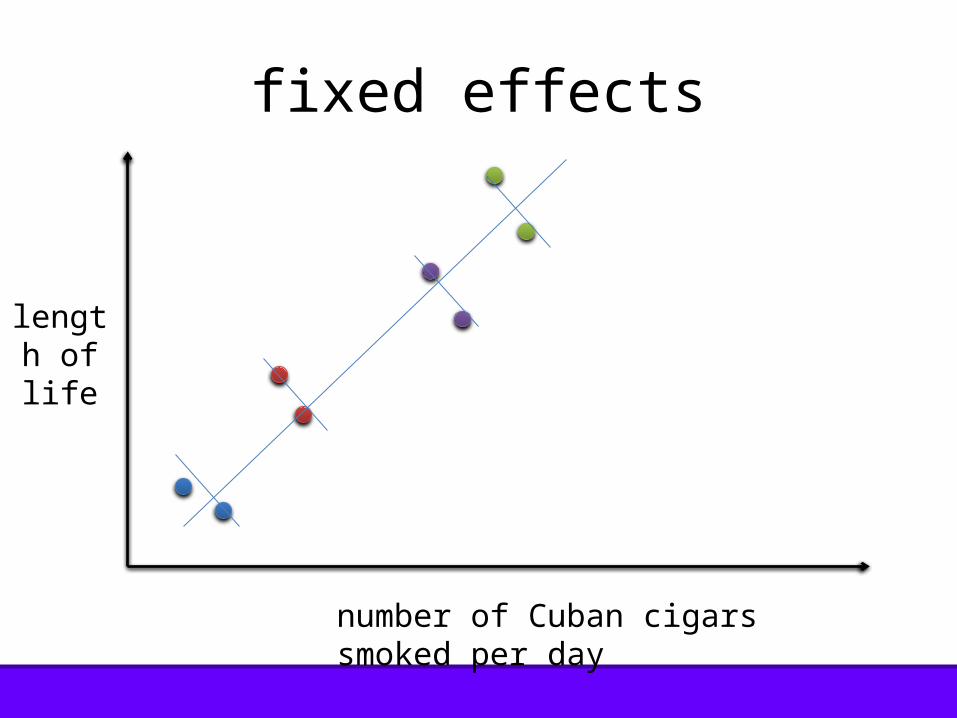
fixed effects
number of Cuban cigars smoked per day
length of life

example 1: African orphans & schooling
Case, Anne and Callie Ardington. (2006). The Impact
of Parental Death on School Outcomes: Longitudinal
Evidence From South Africa. Demography 43(3): 401-420.
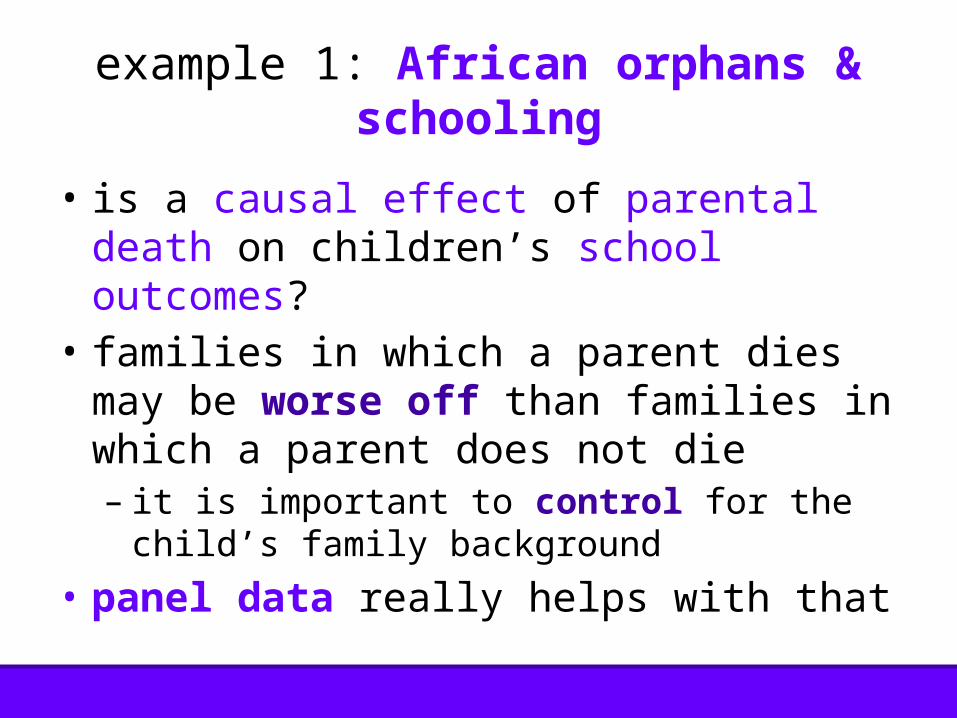
• is a causal effect of parental death on children’s school outcomes?
• families in which a parent dies may be worse off than families in which a parent does not die– it is important to control for the child’s family
background• panel data really helps with that
example 1: African orphans & schooling

(technically a first difference analysis, but same concept as fixed effects)
• same child was surveyed at two points in time– is she enrolled in school?– what grade has she achieved?
• regress difference in education outcomes (change in enrollment, change in grade achieved) on whether a mother died between the two surveys
• children whose mothers die are more likely to drop out of, or fall behind in school
example 1: African orphans & schooling

example 2: height and early life disease
Bozzoli, C., A. Deaton, and C. Quintana-Domeque
(2009). Adult height and childhood disease.
Demography 46 (4), 647–669.

example 2: height and early life disease
• does early life disease affect height in the populations of modern, developed countries?– children who spend energy fighting infection cannot
grow as tall as they otherwise would• use PNM (deaths per thousand live births of
children 1-12 months old) as a measure of early life disease
• but maybe the correlation between a cohort’s height and its PNM is just reflecting things getting better over time?

• add year fixed effects to rule out the time trend explanation– now the regression is asking: how do differences from
the time trend in postneonatal mortality correlate with differences from the time trend in the heights of a cohort?
• this provides stronger evidence that early life disease was a determinant of adult height in modern developed countries
example 2: height and early life disease

example 2: sex work & HIV in Mexico
Gertler, P., M. Shah, and S. Bertozzi (2005). Risky
business: The market for unprotected commercial sex. Journal of political economy
113 (3), 518-550.

example 3: sex work & HIV in Mexico
• why do sex workers offer sex without condoms despite the risk of HIV?
• authors expected that sex without a condom fetches a higher price– but what if price and condom use are both
based on other characteristics of the sex worker?

example 3: sex work & HIV in Mexico
• repeated observations from the same sex worker (four from each sex worker)
• regress an the price paid on condom use and a fixed effect for each sex worker– controls for her education, bargaining power, looks and
other things that might determine price and condom use• comparing clients of the same sex worker, those
who do not use a condom pay more– on average, it is enough to highly compensate the sex
worker for the risk of contracting HIV (transmission rates in Mexico are low)

are fixed effects a good idea for my project?
• do I have appropriate data?– do I have more than one observation for each
group?– do I know which group each observation is in?– do the observations within groups have, at
least in some cases, different values of the independent variable?

are fixed effects a good idea for my project?
• why does the independent variable deviate or change?– example: imagine regressing adult health in a
given country year on income in that country year, with country fixed effects• reverse causality?• is some third factor, say investment in education,
causing both?

• could fixed effects “concentrate bias?”– example: imagine comparing difference in
wages of twins (who share same socioeconomic and health environment) on difference in schooling
– you might end up identifying ability bias!
are fixed effects a good idea for my project?

• do you have a good measurement of the independent variable?– fixed effects uses a smaller fraction of the
variation, so measurement error is a bigger deal
– measurement error may attenuate the coefficient (that is, bias to zero)
– (or, maybe you’ve eliminated omitted variable bias?)
are fixed effects a good idea for my project?

is within variation something that you care about?
are fixed effects a good idea for my project?

within and across variation
by Dean Spears, from How much international variation in height can sanitation explain?

programming fixed effects in Stata: sanitation & stunting example
Spears, Dean. (2013). How much
international variation in height can
sanitation explain?
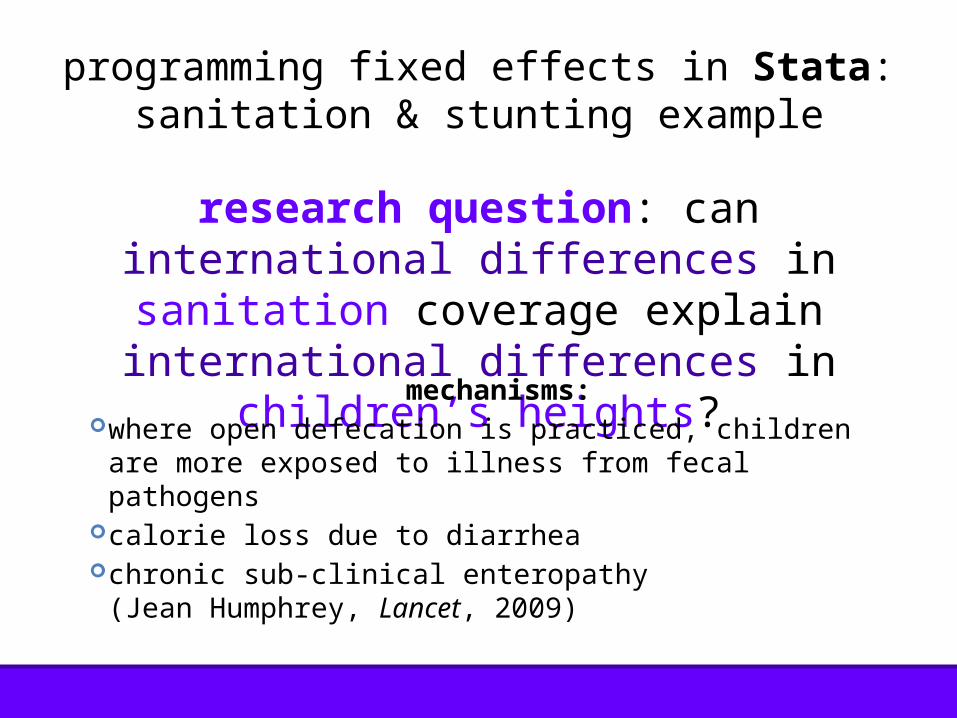
research question: can international differences in sanitation coverage explain international
differences in children’s heights?
programming fixed effects in Stata: sanitation & stunting example
mechanisms:where open defecation is practiced, children are more
exposed to illness from fecal pathogens calorie loss due to diarrheachronic sub-clinical enteropathy
(Jean Humphrey, Lancet, 2009)

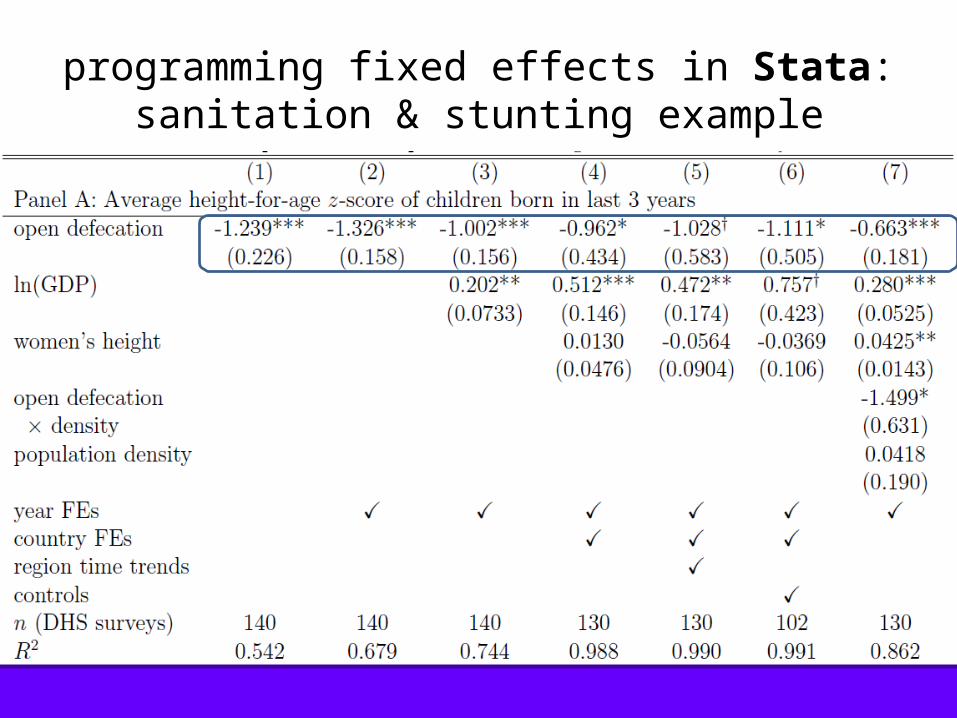
observations: 140 collapsed DHS surveys, 1990-2010
DHS survey (country-year) mean height and open defecation country fixed effect year fixed effect other variables from DHS: female literacy, water women’s
height, knowledge of oral rehydration, electrification ln(GDP per capita), population from Penn World Tables “polity” and “democracy” from Polity IV
programming fixed effects in Stata: sanitation & stunting example
programming fixed effects in Stata: sanitation & stunting example

programming fixed effects in Stata: sanitation & stunting example

questions&
discussion

some new quantitative research:
women’s status and children’s height in India: evidence from joint rural households
Diane Coffey, Reetika Khera &
Dean Spears
women’s status and
children’s height in India:
evidence from joint rural households
photo credit: Kyle Merrit Ludowitz

Indian children are short
• Indian children under 5 years old, are, on average, 2 standard deviations below the heights of children in the international reference population (NFHS 2005)
• for a 5 year old girl, this is a deficit of about 10 centimeters, or 3.9 inches
introduction

height, health, and wealth
• height is a summary measure of early life health
• height in childhood is correlated with height in adulthood (Waterlow, 2011)
• height in adulthood is a marker of human capital, economic productivity, and lifespan (Case & Paxson, 2008; Vogl, 2011; Jousilahti et al., 2000)
introduction
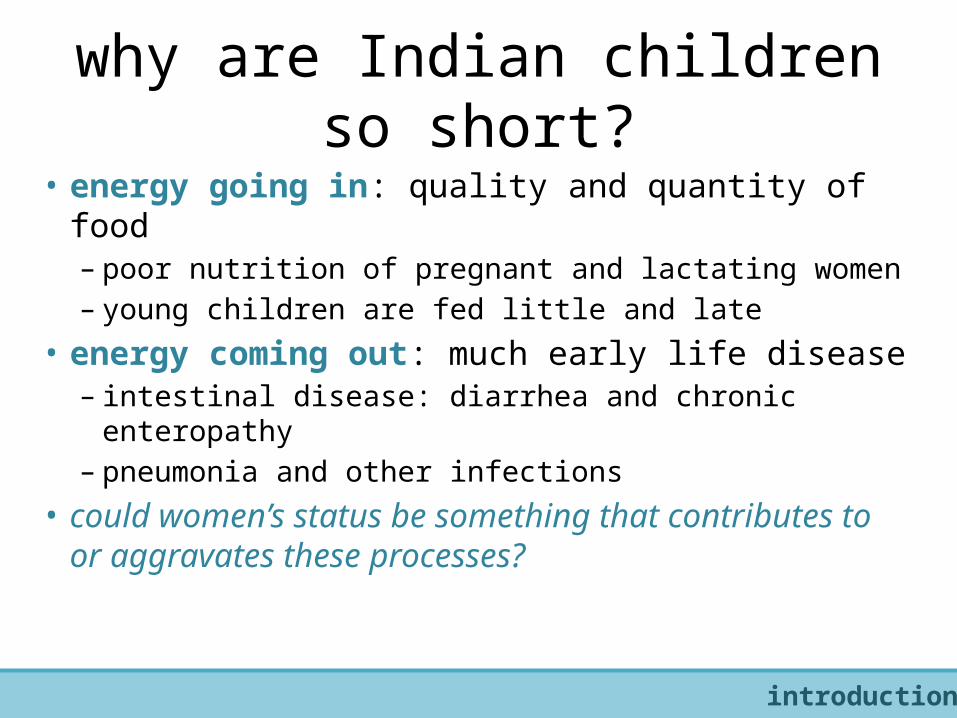
why are Indian children so short?
• energy going in: quality and quantity of food– poor nutrition of pregnant and lactating women– young children are fed little and late
• energy coming out: much early life disease– intestinal disease: diarrhea and chronic enteropathy– pneumonia and other infections
• could women’s status be something that contributes to or aggravates these processes?
introduction

prior papers: children’s health reflects women’s health
Ramalingaswami et al., 1996• 36% of Indian women have BMIs below 18.5
(NFHS 2005)• almost 60% of pregnant women are anemic
(NFHS 2005)• weight gain in pregnancy is very low (WHO,
1995; Agarwal et al., 1996)
introduction

prior papers: women’s autonomy
Das Gupta, 1995• in India, women have low status in their
child-bearing years, it grows as they age• cultural norms around behavior in
women’s marital homes mean that they do not seek resources for themselves or their children
introduction

prior papers: it’s hard to identify an effect of women’s status on kids’ health
several papers regress children’s anthropometric indicators on an index of women’s status variables
• omitted variables• women’s status is hard to measure– education?...seems to be different…– some “empowerment” variables may suffer from
reporting problemsintroduction

preview: our strategy
compare the children of higher and lower ranking daughters-in-law in the same household
find that the children of lower ranking daughters-in-law are on average shorter than their cousins born to higher ranking daughters-in-law
provide evidence for our interpretation of this finding as an effect of women’s status on children’s height
introduction
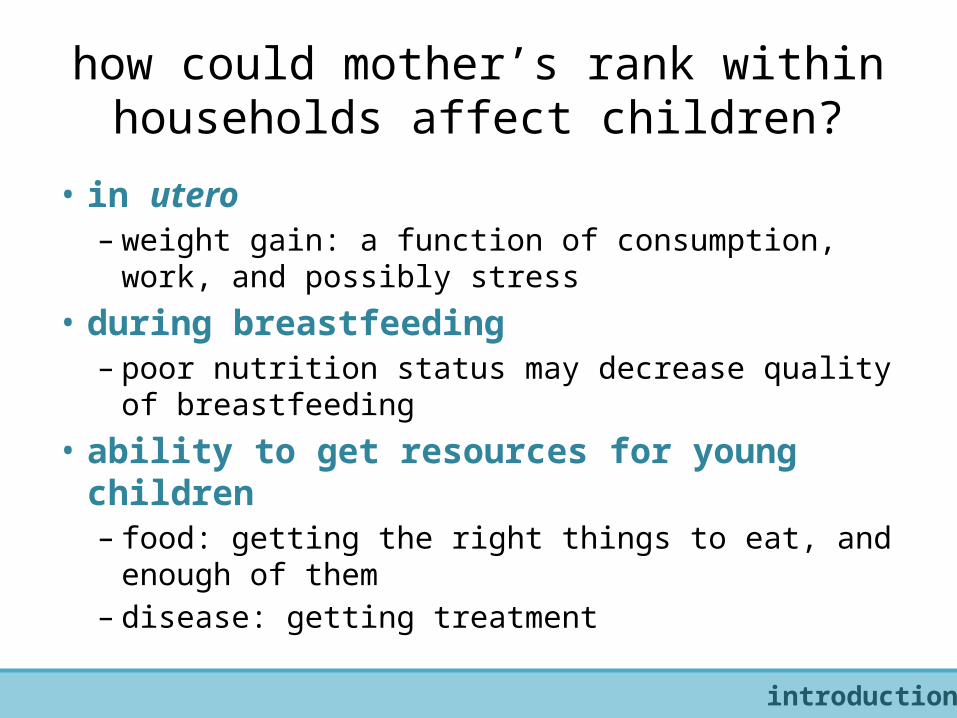
how could mother’s rank within households affect children?
• in utero– weight gain: a function of consumption, work, and
possibly stress• during breastfeeding
– poor nutrition status may decrease quality of breastfeeding
• ability to get resources for young children– food: getting the right things to eat, and enough of
them– disease: getting treatment
introduction

outlineo background—joint Indian householdso empirical strategyo main results—the children of lower ranking
daughters-in-law are shorter than their cousinso interpretation—women’s status
o confirming lower statusodecision making, mobility & nutrition
o ruling out pre-marriage sortingo ruling out differences in nuclear family resources
introduction

background
background
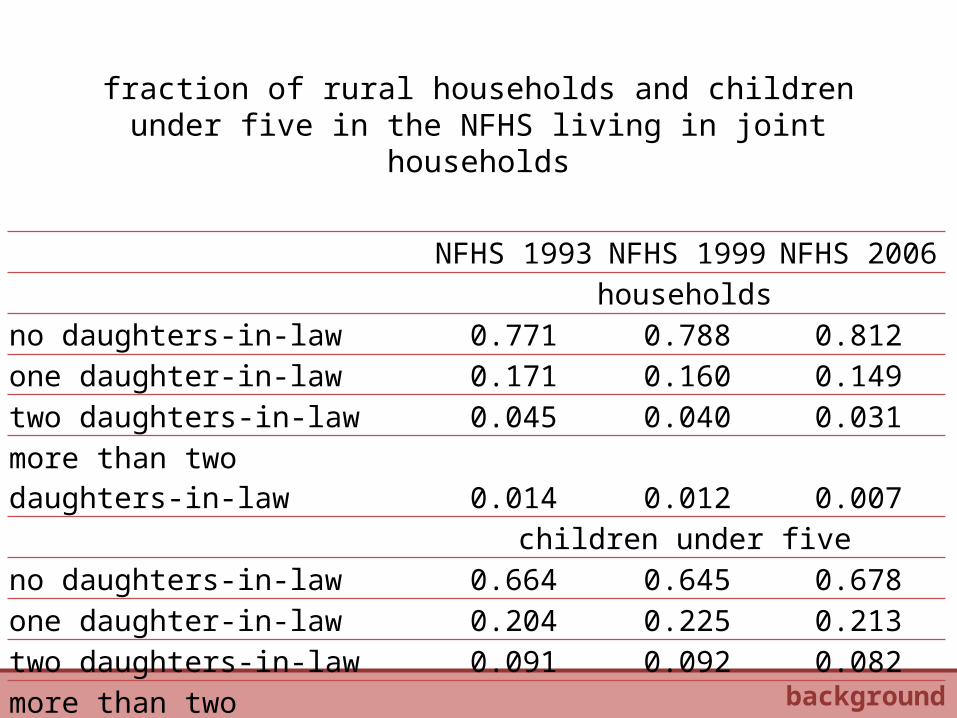
fraction of rural households and children under five in the NFHS living in joint households
NFHS 1993 NFHS 1999 NFHS 2006households
no daughters-in-law 0.771 0.788 0.812one daughter-in-law 0.171 0.160 0.149two daughters-in-law 0.045 0.040 0.031more than two daughters-in-law 0.014 0.012 0.007
children under fiveno daughters-in-law 0.664 0.645 0.678one daughter-in-law 0.204 0.225 0.213two daughters-in-law 0.091 0.092 0.082more than two daughters-in-law 0.041 0.039 0.027
background

where are the joint households?
JMHP
PJ
UC
HR
DL
RJ
UP
BH
SKARNAMNMZTRAS
WB
JHORCH
MP
GJ
MH
APKA
GO
KE
TN0.0
5.1
.15
.2.2
5fr
act
ion
of
child
ren
und
er f
ive
in s
ampl
e
0 .05 .1 .15 .2 .25percent of rural children under five in NFHS-3 data
background
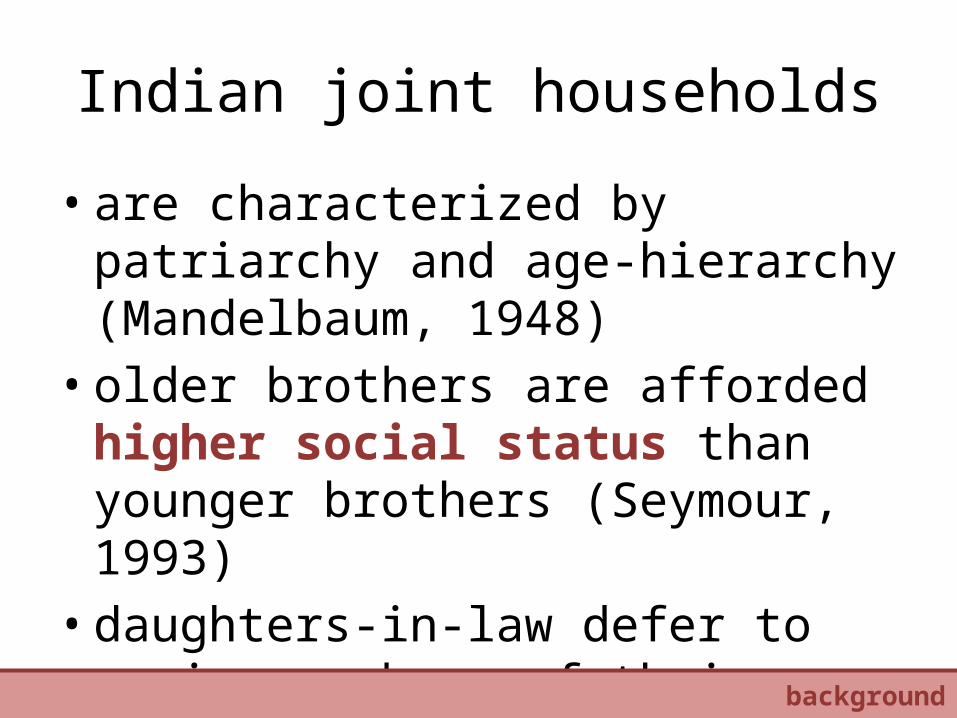
Indian joint households
• are characterized by patriarchy and age-hierarchy (Mandelbaum, 1948)
• older brothers are afforded higher social status than younger brothers (Seymour, 1993)
• daughters-in-law defer to senior members of their marital families
background

rank among daughters-in-law
• a wife inherits her husband’s status in the household, which is determined by his birth order (Singh, 2005)
• there are more people to whom a second daughter-in-law must defer than a first daughter-in-law (Mandelbaum, 2005)
• “senior wives tend to dominate young in-marrying wives” (Dyson & Moore, 1983)
background
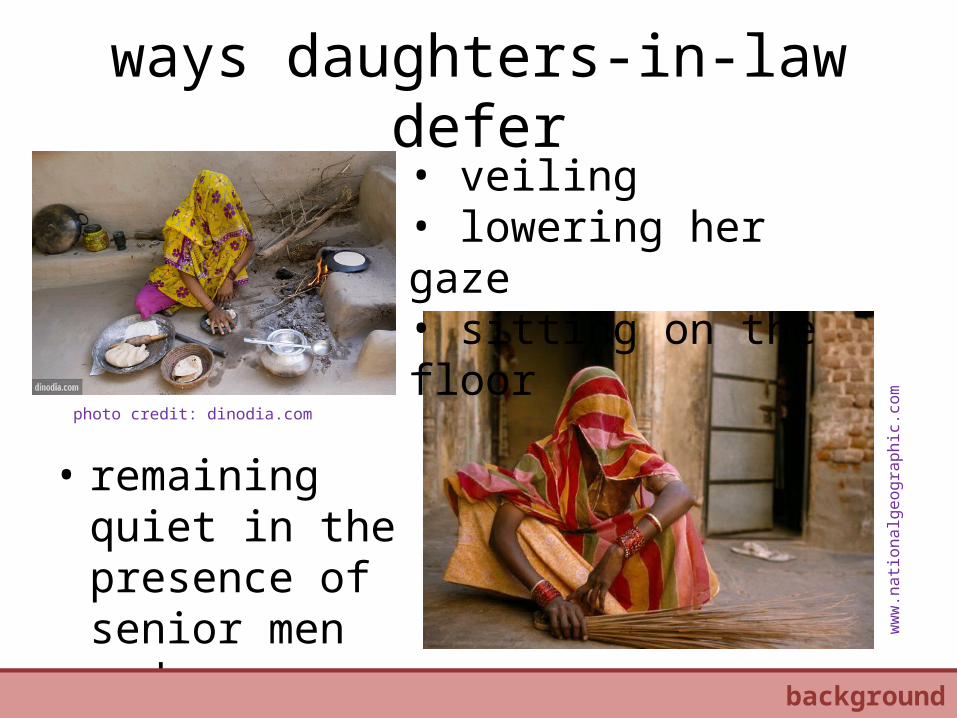
ways daughters-in-law defer
• remaining quiet in the presence of senior men and women
• veiling• lowering her gaze• sitting on the floor
photo credit: dinodia.com
ww
w.n
ation
alge
ogra
phic
.com
our strategybackground

empirical strategy
empirical strategy

our sample: children in joint rural households in NFHS 3
empirical strategy
older brother
younger brother
children in our sample
household heads

main regression
• low ranking motherih indicates that the child's mother is the low ranking daughter-in-law
• h is a household fixed effect
• Aih is a vector of 120 age-in-months X sex dummies
empirical strategy
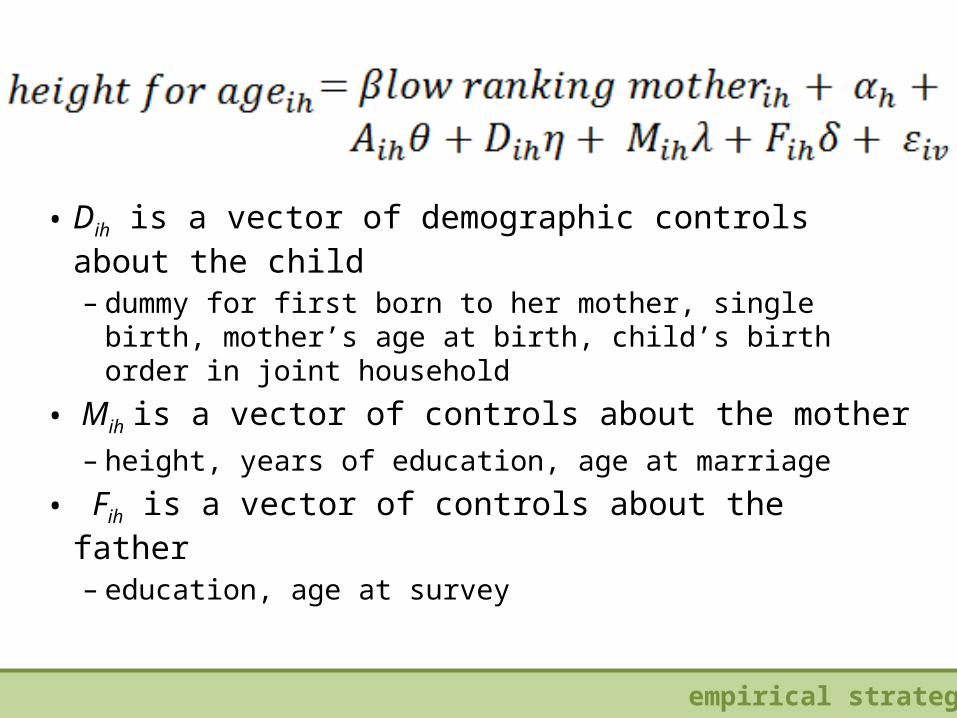
• Dih is a vector of demographic controls about the child– dummy for first born to her mother, single birth,
mother’s age at birth, child’s birth order in joint household
• Mih is a vector of controls about the mother– height, years of education, age at marriage
• Fih is a vector of controls about the father– education, age at survey
empirical strategy

main results
main results

in the same household, are
children of lower ranking
mothers shorter than children
of higher ranking mothers?
main results
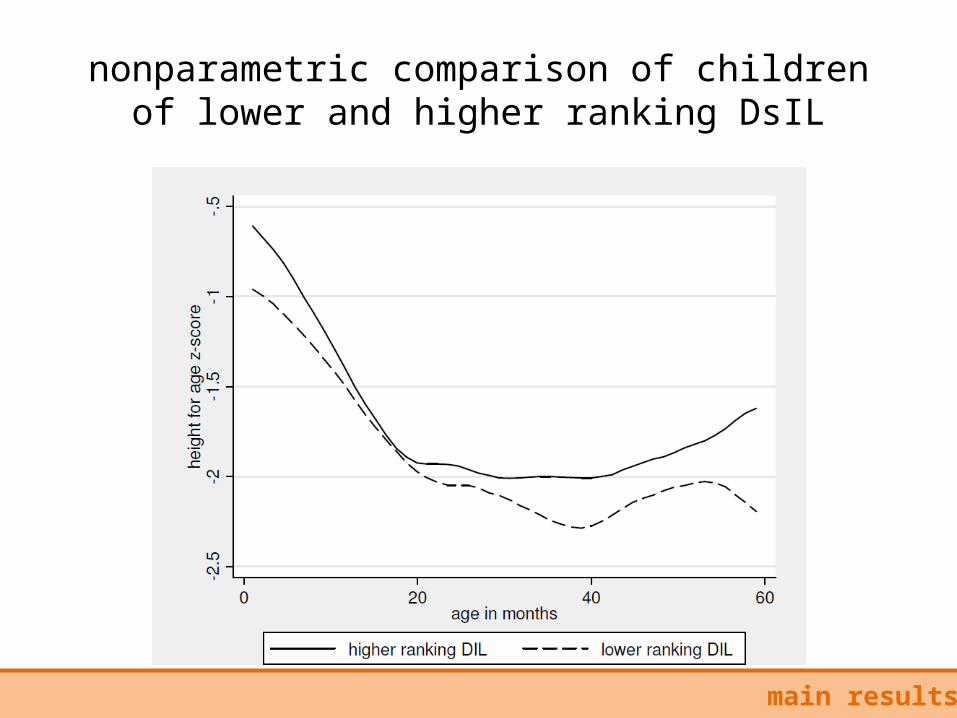
nonparametric comparison of children of lower and higher ranking DsIL
main results

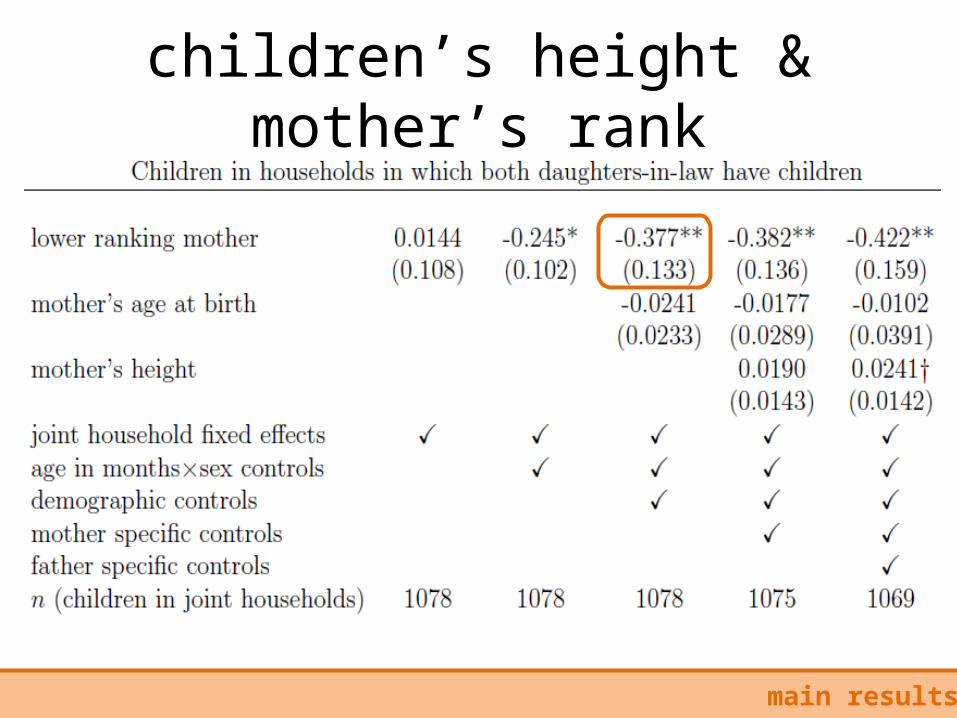
children’s height & mother’s rank
main results
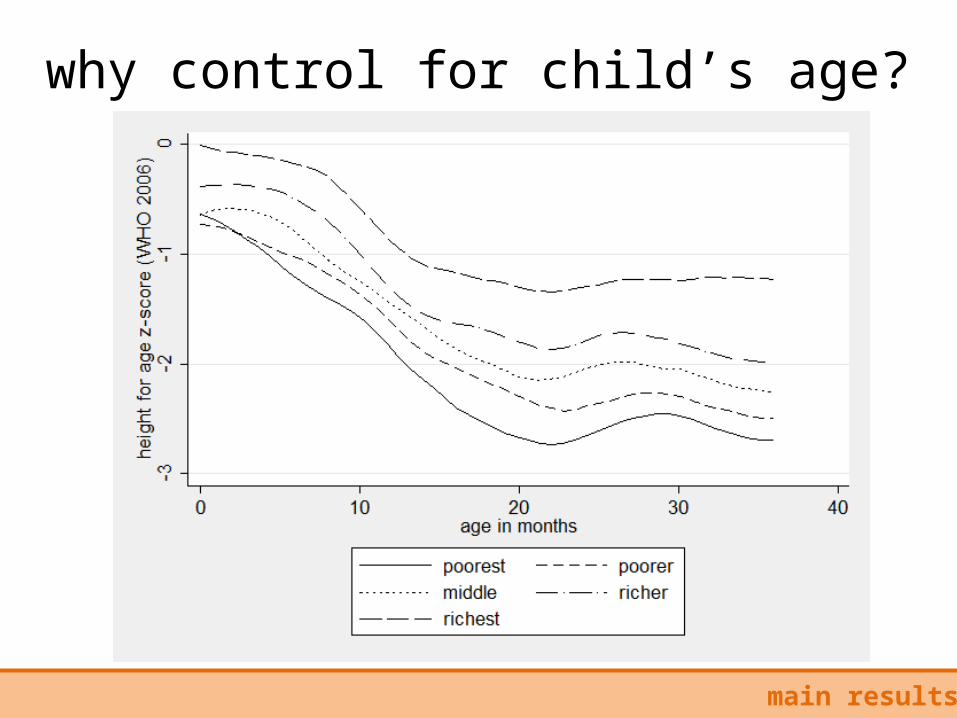
why control for child’s age?
main results

children’s height & mother’s rank
main results
demographic controls: are the results driven by direct effects of
household size?
main results
do grandmothers prefer their earlier born grandchildren (or even the first born), regardless of mothers’ status?
could having older cousins increase babies’ exposure to disease?
children’s height & mother’s rank
main results

height difference not due to comparing children of different birth orders
main results

mother controls: do lower ranking wives differ on pre-marriage
characteristics?
main results
could “inferior” daughters become lower ranking daughters-in-law?
could women who are “less fit” to be mothers become lower ranking daughters-in-law?
children’s height & mother’s rank
main results

height difference present for all maternal heights
main results
father controls: could resource differences
between “nuclear families” (within joint families) influence the results?
main results

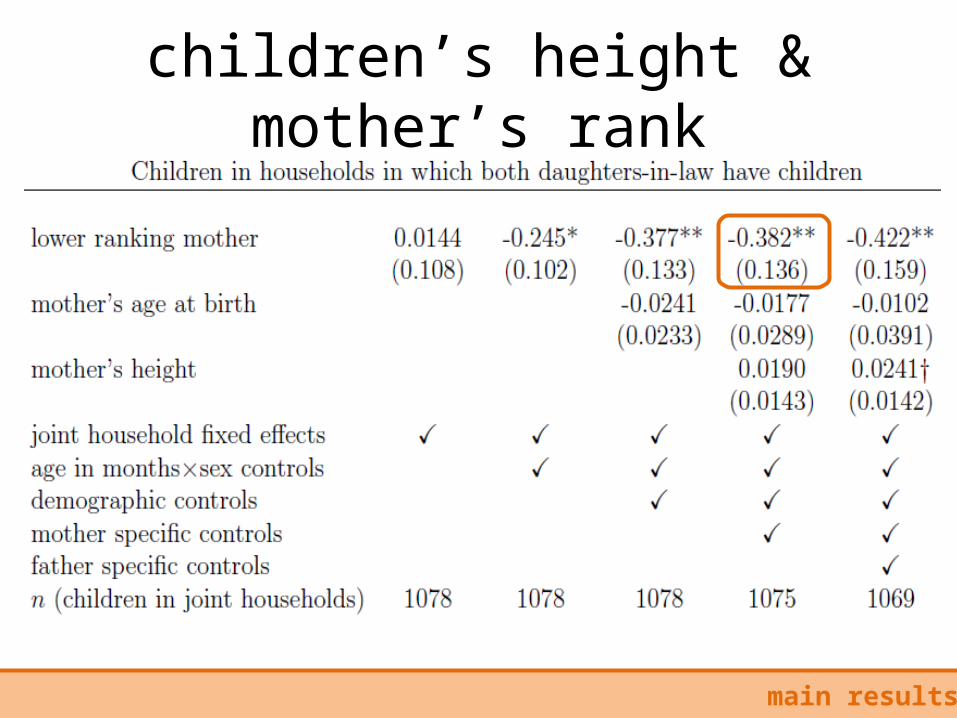
children’s height & mother’s rank
main results

interpretations
interpretations
1. confirming lower status: decision making, mobility & nutrition
2. ruling out pre-marriage sorting 3. ruling out differences in nuclear
family resources

interpretations: confirming lower status

decision making: say in household decisions
vinterpretations: confirming lower status
in NFHS 3, does the woman have “final say” in decisions related to:• own health care?• large household purchases?• daily purchases?• visits to her relatives and friends?• what to do with the money her husband earns?
regress an indicator for “say” on intrahousehold status using joint household fixed effects

vinterpretations: confirming lower status
decision making: say in household decisions
lower ranking daughters-in-law similarly have less “say” in the NFHS 2
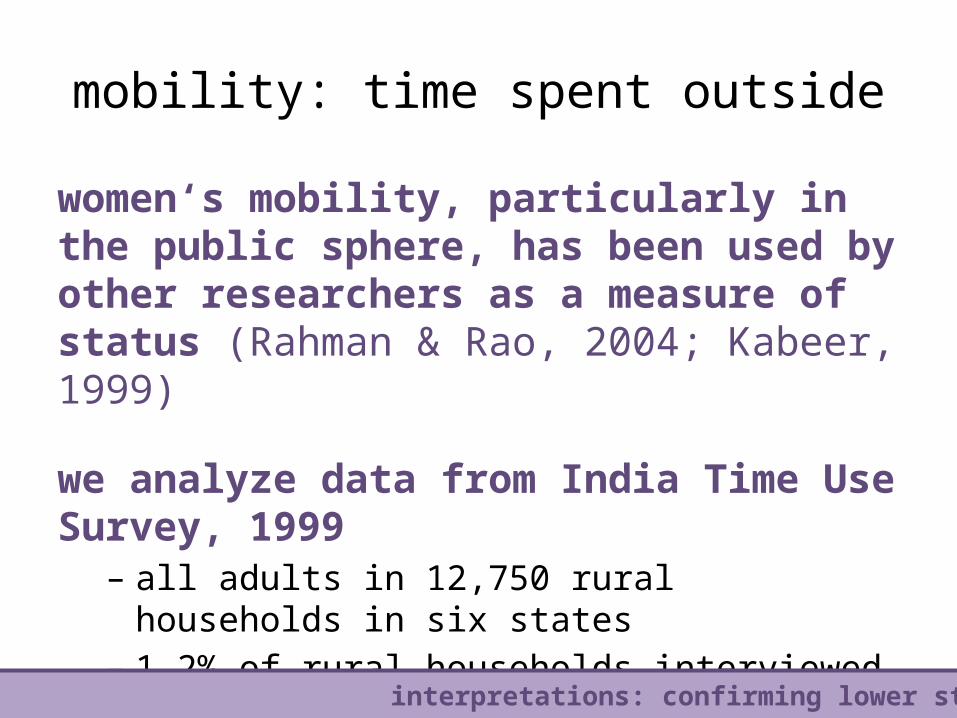
mobility: time spent outside
women‘s mobility, particularly in the public sphere, has been used by other researchers as a measure of status (Rahman & Rao, 2004; Kabeer, 1999)
we analyze data from India Time Use Survey, 1999 – all adults in 12,750 rural households in six states– 1.2% of rural households interviewed (n=312) had two
daughters-in-law– data time use for the “typical” day before the survey
vinterpretations: confirming lower status

mobility: time spent outside
vinterpretations: confirming lower status
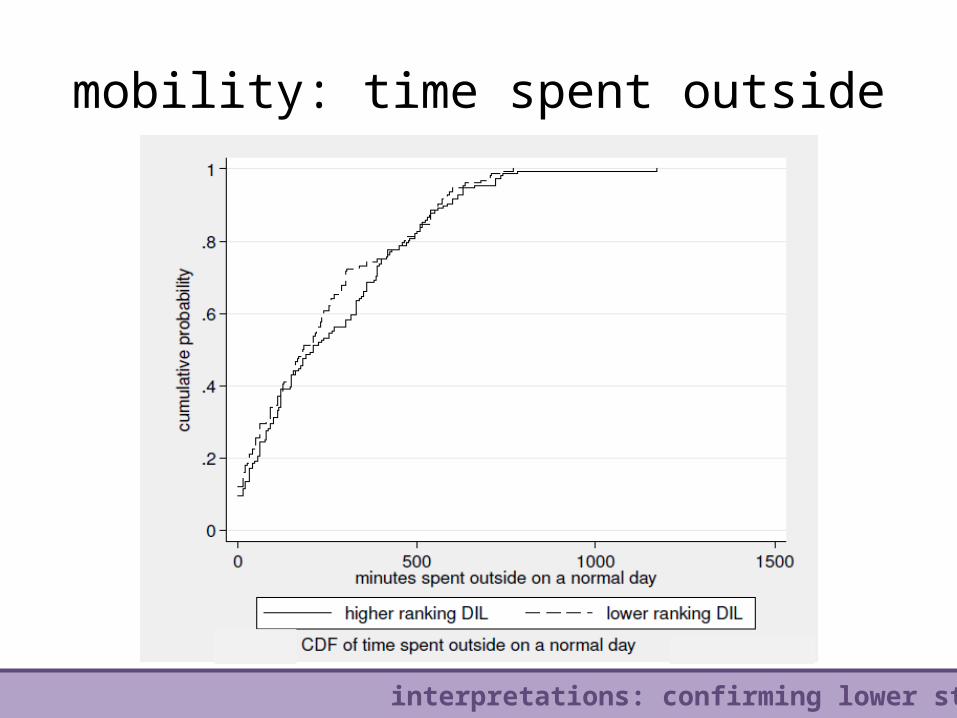
mobility: time spent outside
vinterpretations: confirming lower status
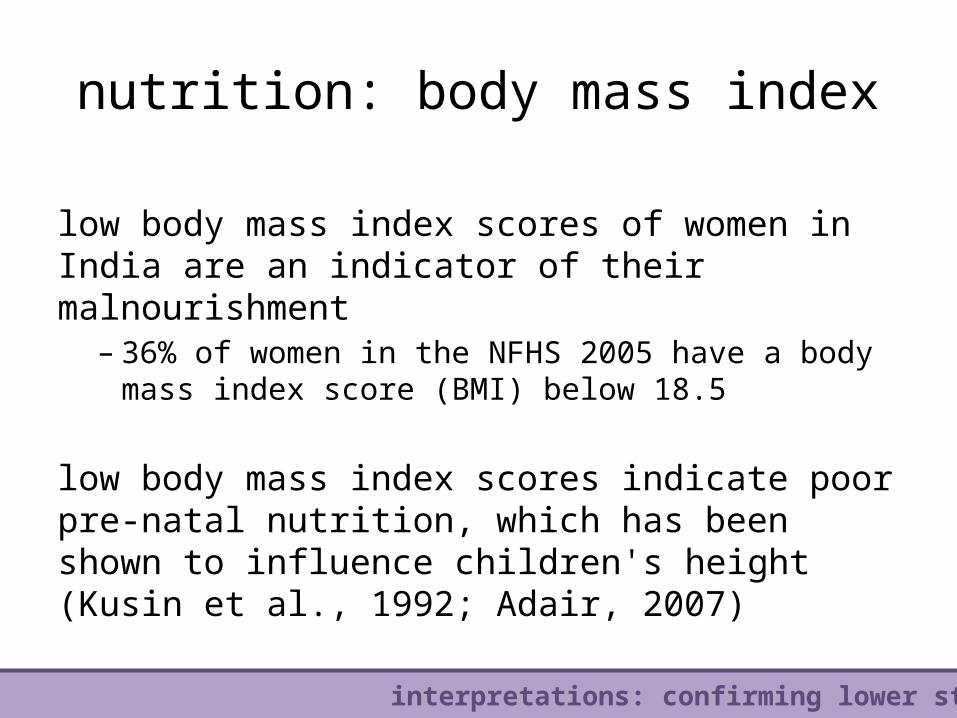
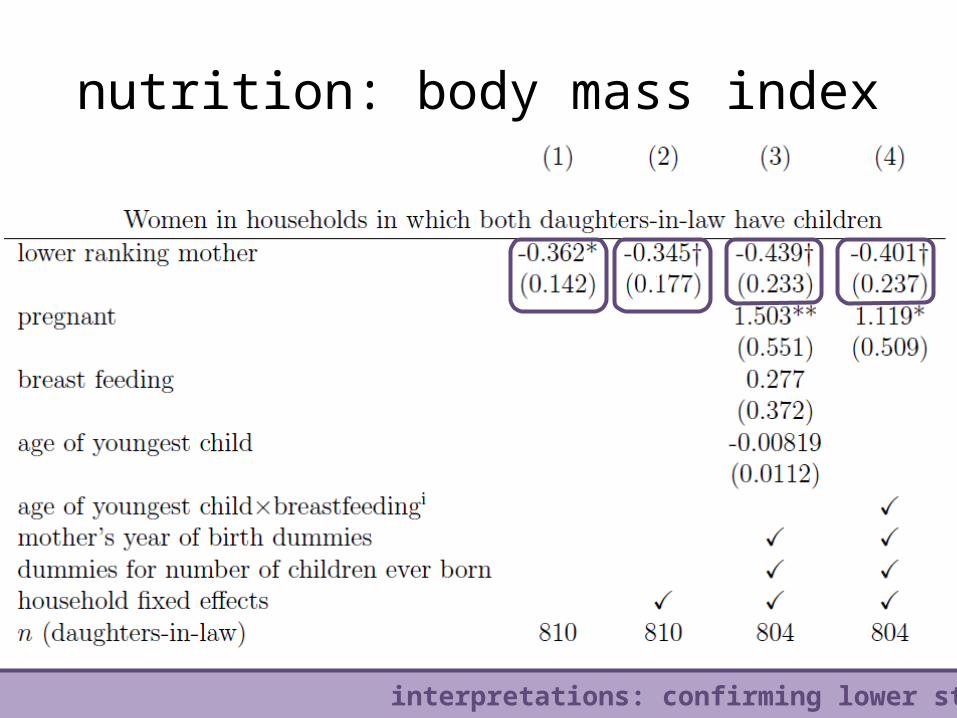
nutrition: body mass index
vinterpretations: confirming lower status
low body mass index scores of women in India are an indicator of their malnourishment
– 36% of women in the NFHS 2005 have a body mass index score (BMI) below 18.5
low body mass index scores indicate poor pre-natal nutrition, which has been shown to influence children's height (Kusin et al., 1992; Adair, 2007)
nutrition: body mass index
vinterpretations: confirming lower status
h

nutrition: body mass index
"The person who cooked and the youngest daughter in law, usually the same person, ate last. This acted
against her, even if there was no conscious discrimination. Thus after feeding unexpected guests, the person who ate last, the cook, could prefer to do
without rather than cook again. In middle peasant households, often there could be no vegetables or lentils left and she made do with a pepper paste
and/or raabri. In a situation of deficit she went hungry when other household members did not have to.”
from: Palriwala, 1993 pg. 60
vinterpretations: confirming lower status

interpretations: ruling out pre-marriage sorting
no differences on pre-marriage characteristics
vinterpretations: ruling out pre-marriage sorting
are lower ranking daughter-in-laws inferior on pre-marriage characteristics?
regress characteristics of mothers fixed before marriage on intrahousehold rank and household fixed effect
dependent variables: height, education, literacy, age at marriage (from NFHS 3)

no differences on pre-marriage characteristics
vinterpretations: ruling out pre-marriage sorting

interpretations: ruling out differences in nuclear family resources
no differences between brothers
can older brothers contribute more resources to their children’s early life health than younger brothers?
use NFHS 3 men’s survey to look at a representative sample of brothers who live in the same household
vinterpretations: ruling out differences in nuclear family resources

no differences between brothers
vinterpretations: ruling out differences in nuclear family resources

conclusion
conclusion

conclusion
conclusion
• used a novel identification strategy to show the children of lower ranking daughters-in-law are shorter than the children of higher ranking daughters-in-law
• interpreted this difference as evidence that women’s status influences children’s health
• provided evidence that women’s status indeed differs by daughter-in-law’s intrahousehold rank
• ruled out competing explanations for the result

why it matters
conclusion
• little prior well-identified evidence of an effect of women’s status on children’s health
• potentially broad implications for human capital formulation – other manifestations of low women’s status
may also hurt children – other forms of hierarchy may also hurt
children

comments? questions?
photo credit: Gates Foundation
conclusion

some reflections on fieldwork in Sitapur, Uttar Pradesh:
thinking about why Indian children are so short and what can be done about it
v
photo credit: forbes website

Sitapur, Uttar Pradesh

Sitapur
Photo credit: Dean Spears

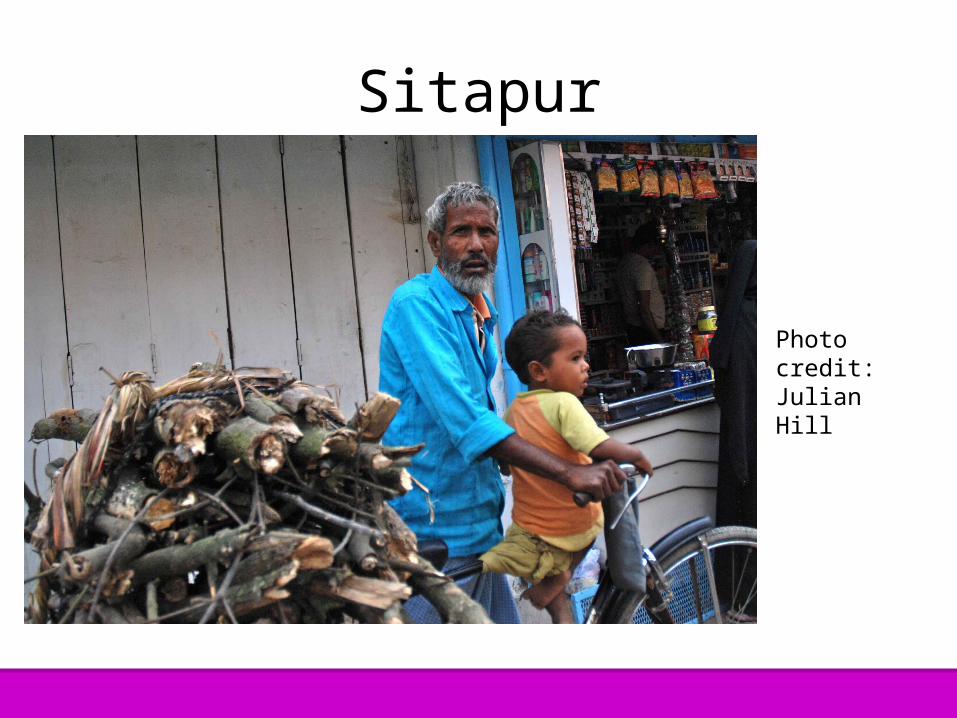
Sitapur
Photo credit: Julian Hill
Sitapur
Photo credit: Julian Hill

Sitapur
Photo credit: Julian Hill

SitapurPhoto credit: Julian Hill

Sitapur
Photo credit: Kyle Merritt Ludowitz (right) & Claude Renault (left)

why Sitapur?
• to complicate our understanding of health production and health promotion
• to gain a deeper understanding of
quantitative findings
• to generate ideas and build intuition
complicating our understanding of children’s health: a mini-ethnography
from a qualitative perspective, what factors seem to be influencing infant health and can parents
and the government do anything about it?
an ethnographic project following 20 infants from 3 villages from February, 2012

complicating our view of children’s health: death
• 4 of 20 infants have died• cause of death is very hard to identify; in some
cases there are likely many contributing factors– neonatal death to a severely anemic teenaged mother– death at 3.5 months old from diarrhea and
dehydration related to not breastfeeding– death at 3 months old from diarrhea and probably
poor maternal nutrition– death at 1 year old, probably from pneumonia

complicating our view of children’s health: stunting
• like other babies in Uttar Pradesh, and India, these babies were born smaller than healthy babies and get shorter relative to healthy children as they get older
• for me, watching mothers care for babies has raised many questions about how growth deficits happen
complicating our view of children’s health: questions raised
to what extent are poor breastfeeding practices contributing to poor growth?
(not just the whether breastfed soon after birth or exclusive breastfeeding for 6 months, but harder to measure things, like
time spent breastfeeding, milk production, and habits)

complicating our view of children’s health: questions raised
to what extent is the practice of feeding cow’s milk to infants, particularly among better off
families, contributing to poor growth?

complicating our view of children’s health: questions raised
where parents are uneducated and health providers have almost no incentive to provide proper treatment, what is the role of a health
system in producing infant health?

complicating our view of children’s health: questions raised
how could sanitation and hygiene be improved in a place with extremely low state capacity
and where people do not believe in the germ theory of disease?

gaining a deeper understanding of quantitative
findings: watching bahus

generating ideas and building
intuition: sanitation &
health
828 people per square kilometer in UP
64% of households openly defecating
about 485 open defecators per
square kilometer!

generating ideas and building
intuition: sanitation
policy

