on interpreting hydrological change from regional climate...
TRANSCRIPT

Graham et al. - On interpreting hydrological change from regional climate models Page 1 of 31
revised version re-submitted to Climatic Change, June 2006
ON INTERPRETING HYDROLOGICAL CHANGE FROM
REGIONAL CLIMATE MODELS
L. PHIL GRAHAM1, STEFAN HAGEMANN2, SIMON JAUN3 and MARTIN BENISTON4
1Swedish Meteorological and Hydrological Institute, SE-60176 Norrköping, Sweden
E-mail: [email protected], tel: +46-11-4958245, fax: +46-11-4958001
2Max-Planck-Institute for Meteorology, Bundesstrasse 55, D-20146 Hamburg, Germany
3Swiss Federal Institute of Technology, Institute for Atmospheric and Climate Science ETH, Winterthurerstrasse
190, CH-8057 Zürich, Switzerland
4Department of Geosciences, University of Fribourg, Chemin du Musee 4, CH-1700 Fribourg, Switzerland
Abstract. Although representation of hydrology is included in all regional climate models
(RCMs), the utility of hydrological results from RCMs varies considerably from model to
model. Studies to evaluate and compare the hydrological components of a suite of RCMs and
their use in assessing hydrological impacts from future climate change were carried out over
Europe. This included using different methods to transfer RCM runoff directly to river
discharge and coupling different RCMs to offline hydrological models using different
methods to transfer the climate change signal between models. The work focused on drainage
areas to the Baltic Basin, the Bothnian Bay Basin and the Rhine Basin. A total of 20
anthropogenic climate change scenario simulations from 11 different RCMs were used. One
conclusion is that choice of GCM (global climate model) has a larger impact on projected
hydrological change than either selection of emissions scenario or RCM used for
downscaling.

Graham et al. - On interpreting hydrological change from regional climate models Page 2 of 31
revised version re-submitted to Climatic Change, June 2006
1. Introduction
This paper focuses on interpreting the hydrological response to projected changes in climate
that for brevity we define as “hydrological change.” Earlier work exists for a host of different
drainage basins (Kaczmarek et al., 1996; Vehviläinen and Huttunen, 1997; Gellens and
Roulin, 1998; Arnell, 1999; Hamlet and Lettenmaier, 1999; Middelkoop et al., 2001;
Andréasson et al., 2004; Vanrheenen et al., 2004). The typical approach for such studies is to
evaluate representative climate changes from the climate models and introduce these changes
to a hydrological model. The majority of previous studies were based on climate change
results from global general climate models (GCMs), while some included results from a
regional climate model (RCM).
For this study, climate change inputs were derived from an ensemble of regional climate
model (RCMs) simulations produced in the PRUDENCE Project (Christensen et al., 2006).
RCMs provide a means to add regional detail to GCM simulations. Evaluating added benefits
from RCMs and how additional uncertainty is introduced by using different models was a
primary focus of PRUDENCE. More specific to hydrological applications is how well the
hydrological cycle is represented. Although climate models include full representation of the
hydrological cycle and usually resolve the overall water balance, they typically do not provide
sufficient detail to satisfactorily address impacts on hydrology and water resources. Therefore,
hydrological models are used.
This paper addresses how differences in the climate models affect estimates of projected
hydrological change. Other changes due to direct human activity (e.g. modifications to
floodplains or vegetation) are not considered here. For a suite of models applied over Europe,
we evaluated the hydrological components from the RCMs by first comparing the partitioning
of precipitation into evapotranspiration and runoff, and then using two different river routing

Graham et al. - On interpreting hydrological change from regional climate models Page 3 of 31
revised version re-submitted to Climatic Change, June 2006
schemes to compare to observed river discharge. The RCM simulations were further tested by
inputting precipitation and temperature results directly into a hydrological model. Climate
change impacts on river discharge were evaluated by using different methods to transfer the
RCM simulation results to hydrological models (see also Graham et al., 2006). The drainage
basins studied were the Bothnian Bay Basin and the entire Baltic Sea Basin in Northern
Europe, and the Rhine River Basin in Central Europe (Figure 1).
1.1. THE BALTIC SEA BASIN
The Baltic Sea Basin covers some 1.6 million km2 in 14 nations—Belarus, Czech
Republic, Denmark, Estonia, Finland, Germany, Latvia, Lithuania, Norway, Poland, Russia,
Slovakia, Sweden and Ukraine. It is characterized by boreal forests in the north and
agriculture in the south. The five largest rivers in descending order are Neva, Vistula,
Daugava, Neman, and Oder. Several large lakes lie in the basin, including the two largest in
Europe, Lake Ladoga and Lake Onega, both in Russia. There are mountains in the northwest
(Scandinavian Mountains) and in the south (Carpathian Mountains). In total, 85 million
people live in this region, with the highest concentrations in the south.
1.2. THE RHINE RIVER BASIN
The Rhine River Basin originates in the Alps of Central Europe and flows generally
northwest to the North Sea. The total catchment contains 185,000 km2 in 9 nations—
Switzerland, Austria, Italy, Liechtenstein, Germany, France, Luxembourg, Belgium and The
Netherlands. Some 50 million people live in this basin. It includes three major hydrological
areas; these are Alpine, German Middle Mountain and Lowland.
Graham et al. - On interpreting hydrological change from regional climate models Page 4 of 31
revised version re-submitted to Climatic Change, June 2006
1.3. REGIONAL CLIMATE MODELS USED
Due to the varying extent of RCM model domains and other limitations, all 11 PRUDENCE
RCMs (Christensen and Christensen, 2006) were not used in all of the hydrological studies.
Table I shows a summary of hydrological applications and the RCMs used. The majority of
simulations were performed with a horizontal resolution around 50 km, using the global
HadAM3H scenario A2 for boundary driving conditions. Two simulations were performed
with 25 km resolution (henceforth referred to as RCAO25 and HIRHAM25). Four simulations
used the global ECHAM4/OPYC3 for boundary conditions (henceforth designated with “E”
after the name). For all cases, 30-year control climate simulations of present climate
representing the period 1961-1990 were compared to future climate simulations representing
the period 2071-2100. More detail on the RCMs and their results are found in Christensen and
Christensen (2006), Déqué et al. (2006), and Jacob et al. (2006). The future climate scenarios
are based on the IPCC (Intergovernmental Panel on Climate Change) A2 and B2 SRES
anthropogenic emissions scenarios (Nakićenović et al., 2000).
2. Modelling and Analysis
2.1. RIVER ROUTING
Runoff generated from RCMs is the instantaneous excess water per grid square, without any
translation or transformation for groundwater, lake and channel storage, or transport time.
Two river routing schemes were used to convert RCM runoff to river discharge in offline
applications. These are the HD Model, which was used for both the Baltic Basin and the
Rhine Basin, and the RCroute scheme, which was used for the Baltic Basin. RCroute uses
runoff directly from the RCMs whereas the HD Model performs its own re-partitioning of
RCM precipitation into runoff and evapotranspiration. Both operate on a daily time step.

Graham et al. - On interpreting hydrological change from regional climate models Page 5 of 31
revised version re-submitted to Climatic Change, June 2006
2.1.1. HD Model
The HD river discharge model (Hagemann and Dümenil Gates, 2001) simulates the lateral
freshwater fluxes at the land surface. This has been applied and validated on the global scale,
and is also part of the coupled atmosphere-ocean ECHAM5/MPI-OM GCM (Latif et al.,
2003). Inputs required are daily time series of surface runoff and drainage from the soil.
Applied on a standard 0.5 degree horizontal grid, these are converted into the three flow
processes of overland flow, baseflow and river flow. The model parameters are functions of
1) topography gradient between gridboxes, 2) slope, 3) length, 4) lake area, and 5) wetland
fraction for each gridbox.
Some modifications to the standard HD Model were needed. As only total runoff (surface
runoff plus drainage) was available from the RCMs, it was necessary to partition this into
representative components for fast and slow runoff responses. This was done with a
simplified land surface scheme (SL), which uses daily fields of precipitation, 2 m
temperature and evapotranspiration (Hagemann and Jacob, 2006).
2.1.2. RCroute
The RCroute scheme is the river routing module from the Rossby Centre Regional
Atmosphere Ocean Model (RCAO; Döscher et al., 2002). Here, it is used in standalone mode,
where input is total daily runoff generated from the PRUDENCE RCMs.
RCroute uses the same runoff response routine and subbasin delineation as HBV-Baltic
(see below). It consists of a series of two linear reservoirs that represent fast and slow runoff
responses. Flow recession parameters are associated with each linear reservoir for each
subbasin modeled. Total runoff generation is the input to the routing routine and river
discharge from the subbasins is the output. Where upstream subbasins connect to a

Graham et al. - On interpreting hydrological change from regional climate models Page 6 of 31
revised version re-submitted to Climatic Change, June 2006
downstream subbasin before reaching the sea, calibrated lag times were applied. The result is
daily average river discharge in m3 s-1 to the Baltic Sea from each of the coastal subbasins.
2.2. HYDROLOGICAL MODELLING
Two hydrological models were used in this study; the conceptual rainfall-runoff HBV Model
(Lindström et al., 1997) for the Baltic Basin and the physically-based distributed WASIM
Model (Schulla, 1997) for the Rhine Basin. The two models were applied under substantially
different considerations and scales. HBV could be used to generate many simulations of
hydrological change whereas WASIM provides a more detailed distribution of hydrological
results over a given basin.
2.2.1. HBV-Baltic
The Baltic Basin Water Balance Model—HBV-Baltic—was developed to perform large-scale
hydrological modelling over the basin (Graham, 1999; Graham, 2004). It includes routines for
snow accumulation and melt, soil moisture accounting, groundwater response and river
routing. Although it uses large subbasins, detailed topography is included in the form of
elevation zones. It operates on a daily basis using 2 m temperature and precipitation as inputs.
A database of monthly runoff to the Baltic Sea (Bergström and Carlsson, 1994) was used for
model calibration and verification. The simulated time period used as a baseline in this study
was 1980-2003. Analysis here generally focuses on the five main Baltic Sea sub-regional
drainage basins shown in Figure 1. Model performance is evaluated by the Nash and Sutcliffe
(1970) efficiency criterion, R2, which is a sum of squares function of the variance in observed
river discharge to the variance in computed river discharge. The calibrated monthly
efficiency criteria over the period 1980-1991 for the five sub-regional drainage basins are

Graham et al. - On interpreting hydrological change from regional climate models Page 7 of 31
revised version re-submitted to Climatic Change, June 2006
0.95, 0.94, 0.81, 0.81 and 0.73, respectively, resulting in a value of 0.91 for the total Baltic
Basin (a perfect fit would be 1.0; Graham, 1999).
2.2.2. WASIM
The Water Flow and Balance Simulation Model—WASIM—uses a horizontal grid size of
1 km for the Rhine Basin and operates on an hourly time step (Kleinn et al., 2005). It includes
a soil-vegetation-atmosphere-transfer scheme (SVAT), a soil-water model, a groundwater
model, and a runoff generation and routing scheme (Jasper and Kaufmann, 2003; Jasper et al.,
2004). The WASIM simulations in this study cover 20 subcatchments of the Rhine River
down to Cologne for a total area of 145,000 km2. Results are summarized for river discharge
stations along the Rhine at Diepoldsau, Rheinfelden, Kaub, and Cologne, as well as for
Untersiggenthal on the Aare River and Cochem on the Mosel River.
2.3. TRANSFERRING CLIMATE CHANGE FROM RCMS TO
HYDROLOGICAL MODELS
Transferring the signal of climate change from climate models to hydrological models is not a
straightforward process as meteorological variables from climate models are often subject to
systematic errors. For example, in the Alpine region, many RCMs exhibit a dry summertime
precipitation bias on the order of 25% (Frei et al., 2003). Including such biases would affect
hydrological simulations considerably.
Most studies of hydrological change to date have resorted to a delta approach (Hay et al.,
2000), adding the change in climate to an observational database that is then used as input to
hydrological models to represent the future climate. A major disadvantage of the delta
approach is that representation of extremes from future climate scenarios effectively gets
filtered out in the transfer process. The extremes resulting from this approach are simply the

Graham et al. - On interpreting hydrological change from regional climate models Page 8 of 31
revised version re-submitted to Climatic Change, June 2006
extremes from present climate observations that have either been enhanced or dampened
according to the delta factors. More direct methods have recently been investigated. This
requires modification to RCM outputs to correct for biases before transfer to hydrological
models. Although such methods also have limitations, they are more consistent with the
RCMs compared to the delta approach (Lenderink et al., 2006).
The studies performed here use both the delta approach, which is robust regardless of the
quality of the RCMs, and more direct methods, which work best if seasonality is well-
represented. The HBV Model was applied with both approaches. The WASIM Model used
only a more direct, bias-correction approach.
2.3.1. HBV Application
The signal of climate change was transferred from the RCMs to HBV-Baltic via 2 m
temperature, precipitation and evapotranspiration. As mentioned above, only changes
between the future and the present climate simulations were used for the delta approach.
Projected climate changes are most pronounced for colder temperatures (i.e. winter) in
Northern Europe. Therefore, algorithms were derived from the climate simulation results to
relate the magnitude of future change to present-day average daily temperatures. This
provides a distribution of the change in temperature that represents the RCM simulated
seasonal changes more accurately than simple monthly or seasonal means would. Trends in
changes to precipitation were less systematic; these were input using monthly change factors
applied to daily precipitation values.
Evapotranspiration is calculated by the hydrological model according to a temperature
index method. Although this works well for present-day conditions where one can calibrate
relevant parameters, there is no way to assure that this is valid for the future climate.
Evapotranspiration was therefore modified in the future climate hydrological simulations so

Graham et al. - On interpreting hydrological change from regional climate models Page 9 of 31
revised version re-submitted to Climatic Change, June 2006
that the annual percent change matched the RCM simulations. More detail on delta
procedures is found in Andréasson et al. (2004).
For the direct approach, 2 m temperature results from the RCMs was input directly per
subbasin of HBV-Baltic. Biases in precipitation were adjusted with a simple precipitation
scaling approach that corrected the mean annual RCM precipitation from control simulations
to match the mean annual precipitation from observations used as a baseline condition. No
attempt was made to perform seasonal precipitation bias corrections. A similar approach that
includes seasonal corrections of both temperature and precipitation was tested for the Lule
River Basin as reported by Graham et al. (2006). Evapotranspiration changes were restricted
to match the respective RCM, as in the delta approach.
2.3.2. WASIM Application
WASIM simulations were only performed with the CHRM RCM (Vidale et al., 2003). RCM
results for precipitation, 2 m temperature, net radiation, relative humidity, and wind speed
were transferred from the CHRM grid (56 km) onto the WASIM grid (1 km) using parameter-
specific interpolation schemes.
A simple bilinear interpolation was used for relative humidity and wind speed. For 2 m
temperature, a lapse-rate approach was applied, where standardized temperatures are
bilinearly interpolated to the WASIM grid and then lapsed to the elevation of the WASIM
grid points. For precipitation high-resolution observational climatology was used (Schwarb et
al., 2001) to introduce fine-scale precipitation patterns. This distributes precipitation within an
RCM gridbox according to the climatological pattern, which is dominated by topographic
features (Widmann and Bretherton, 2000).
Temperature and precipitation data from the RCM were corrected for systematic errors.
The biases were determined from a simulation using the large-scale boundary conditions from

Graham et al. - On interpreting hydrological change from regional climate models Page 10 of 31
revised version re-submitted to Climatic Change, June 2006
the ECMWF 40-year reanalysis (ERA-40; Uppala et al., 2005) as a baseline period, compared
to observed temperatures in the New et al. (2000) data set and observed precipitation in the
Frei and Schär (1998) data set.
2.4. EMPIRICAL SNOW ANALYSIS
Mountain snowpack is a considerable control on surface runoff in the European Alps as it
determines the timing of peak river discharge during melting in the spring and sustains
discharge in numerous rivers during summer periods. Changes in temperature and
precipitation will modify snow amounts and duration. However, orographic precipitation in
general, and snowfall in particular, are among the most difficult variables to simulate, even at
high spatial and temporal resolutions (Marinucci et al., 1995; Giorgi and Mearns, 1999).
As a complement to modelling approaches, observational studies of the behavior of the
alpine snowpack were applied (Beniston et al., 2003a). This resulted in empirical relationships
of how both the amount and duration of snow changes at various altitudes as a function of the
type of winter (i.e., warm/moist, warm/dry, cold/moist, or cold/dry). The volume of snow in
the Alps was determined under current climatic conditions (1961-1990) and departures of
snow volume from average conditions during mild winters could be identified. Such
information provides an analog to what could be expected in the future when similar mild
winters are likely to occur with greater frequency.
3. Results for the Baltic Basin
Eight different RCMs were used for the Baltic Basin with the HD Model, RCroute and
HBV-Baltic (Table I). A total of 18 scenario simulations were made with HBV-Baltic.

Graham et al. - On interpreting hydrological change from regional climate models Page 11 of 31
revised version re-submitted to Climatic Change, June 2006
3.1. ANALYSIS OF THE RCMS – BALTIC
The mean annual cycle of precipitation, 2 m temperature and evapotranspiration from RCM
control simulations is presented in Figure 2 for the Bothnian Bay and in Hagemann and Jacob
(2006) for the total Baltic Basin. Comparison is made to GPCP (Global Precipitation
Climatology Project; Huffman et al., 1997) and CMAP (CPC Merged Analysis of
Precipitation; Xie and Arkin, 1997) databases. The GPCP data have been corrected for gauge
losses, but this correction is reported to overestimate precipitation (Rudolf and Rubel, 2005).
The CMAP data are uncorrected gauge data. One would thus expect “real” precipitation
values to fall somewhere between GPCP and CMAP values. From this comparison, RCMs do
a reasonable job of representing the seasonal distribution of precipitation in this region, but
tend to overestimate its magnitude.
Regarding 2 m temperature, the RCM simulations are more evenly distributed around the
observations. Annual biases for the total Baltic Basin range from -1.3ºC to +0.9ºC.
Evapotranspiration varies considerably between the RCMs throughout the year. Results from
ERA15 (ECMWF 15-year reanalysis) coincide fairly well with the multi-model ensemble
mean during warm months, but are lower during cold months. This could indicate that cold
season evapotranspiration is overestimated by many of the models, however there is
considerable uncertainty associated with the ERA15 estimate (Hagemann et al., 2004).
An important factor in determining how well the hydrological cycle is represented by
climate models is how they partition precipitation into evapotranspiration and runoff
generation, as shown in Figure 3a for annual RCM values for the Baltic Basin. Results from
HBV-Baltic using observations are also shown. As the latter were calibrated to observed river
discharge, they should better represent the basinwide hydrological processes. Comparing
these, many of the RCMs appear to overestimate evapotranspiration for the Baltic Basin,
while runoff generation is underestimated.

Graham et al. - On interpreting hydrological change from regional climate models Page 12 of 31
revised version re-submitted to Climatic Change, June 2006
Total river discharge from Bothnian Bay using the HD Model and RCroute for the RCM
control simulations is shown in Figure 4. The two modelling approaches result in generally
similar representations of the seasonal river flow. However, peak flows from the HD Model
tend to occur almost one month later than those from RCroute. The magnitude of the peaks
also varies between the models.
A further test of the hydrology in the RCMs used precipitation and temperature from
control simulations directly in HBV-Baltic to produce estimates of river discharge, akin to
Graham and Jacob (2000). Most models show overestimation of river discharge throughout
the Baltic Basin, in some cases by as much as 70% more than observations (Table II). This
reflects the overestimation of precipitation over this region by most of the models.
RCM generated changes in precipitation, 2 m temperature and evapotranspiration are
shown in Figure 5 for the Bothnian Bay and in Hagemann and Jacob (2006) for the total
Baltic Basin. Maximum changes in both precipitation and temperature occur during colder
months. The model spread around the mean temperature signal is relatively small. Exceptions
are HadRM3P, which deviates considerably from the other models in the summer, and CLM
that shows large peaks in May. The largest increases in evapotranspiration are also shown for
winter.
3.2. HYDROLOGICAL SIMULATIONS OF CLIMATE CHANGE – BALTIC
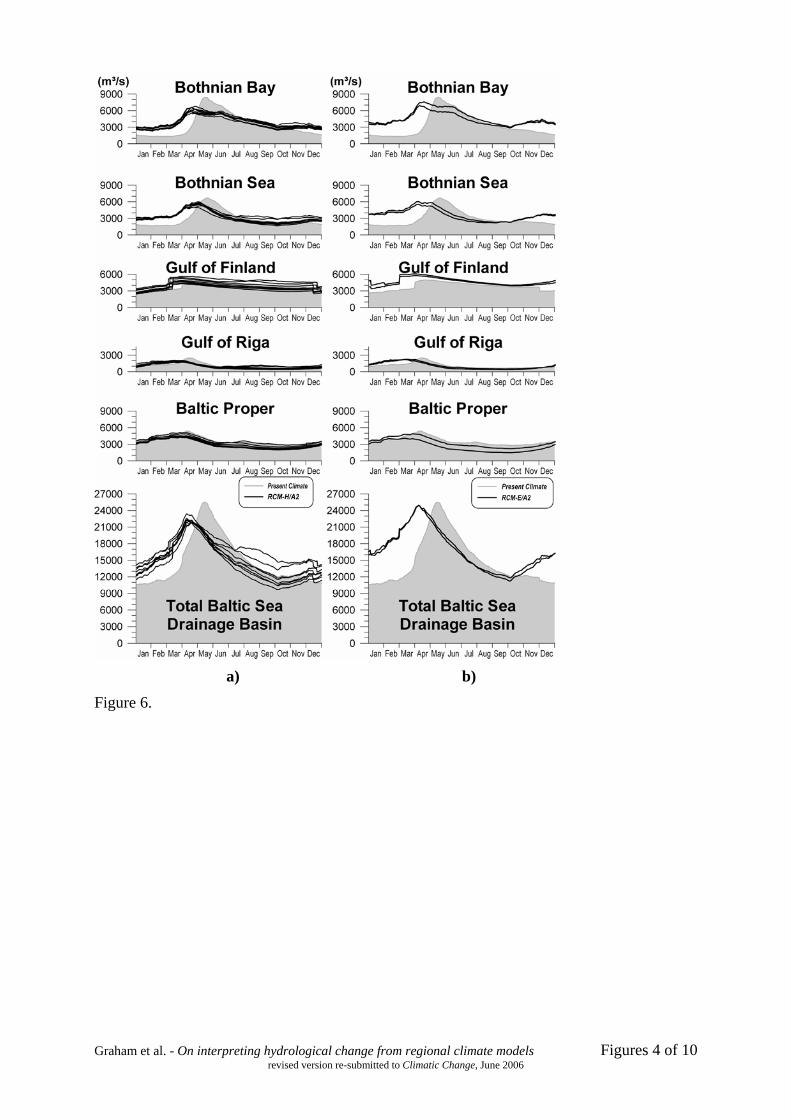
River discharge from hydrological simulations using HBV-Baltic together with RCM climate
change simulations is shown in Figures 6 through 9, summarized as total inflows to the five
main sub-regional Baltic Sea drainage basins and for the total Baltic Basin. The shaded area
represents the present-day climate with results from HBV-Baltic using observations as model
inputs for the baseline period of 1980-2003.

Graham et al. - On interpreting hydrological change from regional climate models Page 13 of 31
revised version re-submitted to Climatic Change, June 2006
Figure 6 shows the A2 RCM simulations. Results between the different models for the
HadAM3H simulations generally follow a similar pattern with the exception of more
pronounced deviation by two models in late summer and early autumn. This is most clearly
seen in the plot for the total Baltic, which is the accumulation of flow from all of the basins.
The two simulations available using ECHAM4/OPYC3 show higher mean river discharge in
all basins except for the Baltic Proper, compared to the HadAM3H simulations.
Figure 7a shows the B2 RCM simulations. Here again, the ECHAM4/OPYC3 simulations
show higher future river discharge through most of the Baltic Basin as compared to
HadAM3H. Figure 7b shows results according to variations in RCM resolution, including two
RCMs at 50 km and 25 km resolution shown together with a hydrological simulation using
HadAM3H (150 km). Little difference is apparent for the northernmost Bothnian Bay, but
differences increase for basins further south and east. Although not shown here, larger
differences are found for Bothnian Bay if one looks separately at the western part of the basin
versus the eastern part.
Figure 8a shows results using direct input of precipitation and 2 m temperature from the
control simulations after precipitation scaling to present-day observations. As only annual
precipitation amounts were adjusted, the seasonal distribution of precipitation comes directly
from the RCMs. Figure 8b shows results after applying the same precipitation scaling factors
to the corresponding A2 scenarios of these RCMs. Although there are obvious differences
between the three model simulations shown, they all differ considerably in character from the
A2 delta approach simulations (Figure 6a). Both peak flows and low flows from the
precipitation scaling approach are higher and lower, respectively, compared to the delta
approach. The considerably lower river flow for the RACMO simulations for the eastern and
southern basins (Gulf of Finland, Gulf of Riga, Baltic Proper) follows from lower
precipitation in the RACMO-H/A2 simulation.

Graham et al. - On interpreting hydrological change from regional climate models Page 14 of 31
revised version re-submitted to Climatic Change, June 2006
Figure 9 shows the period maximum and minimum values corresponding to the same
50 km scenario simulations using precipitation scaling (Figure 8). Also shown are values from
the corresponding delta approach simulations. The simulations with the scaling approach
show different patterns of extremes that more closely reflect the variability coming from the
RCMs. The maximum and minimum curves from the delta approach follow each other quite
closely, showing little difference between the two simulations.
Figure 10 shows routed river discharge from RCM-A2 scenario simulations for the
Bothnian Bay Basin from the HD Model and RCroute. Both applications show similar trends
of increased river flow for winter/spring months and decreases during summer, which are in
agreement with the offline HBV-Baltic results above. However, the range of differences
between RCM simulations is much greater for RCroute than for HD, particularly during cold
season months.
4. Results for the Rhine Basin
Ten different RCMs were used by the HD Model for the Rhine Basin (Table I). The WASIM
Model used only the CHRM RCM simulations; these are referred to as WASIM-CTRL,
WASIM-A2 and WASIM-ERA40 (see section 2.3.2) in the remainder of the paper.
4.1. ANALYSIS OF THE RCMS – RHINE
The mean annual cycle for precipitation and evapotranspiration from ten RCM control
simulations over the Rhine Basin is presented in Hagemann and Jacob (2006), and compared
with observations from the GPCP and CMAP. The models all show a similar seasonal
distribution for precipitation, with a common drying problem apparent in September. Many of
the models also tend to overestimate precipitation in the spring. For evapotranspiration, the
range between the models is quite large and particularly pronounced during the warm summer

Graham et al. - On interpreting hydrological change from regional climate models Page 15 of 31
revised version re-submitted to Climatic Change, June 2006
months, although the multi-model ensemble mean tends to agree well with ERA15.
Partitioning of annual RCM precipitation into evapotranspiration and runoff generation is
shown in Figure 3b. Almost all of the RCMs show a higher percentage of runoff for the Rhine
Basin than for the Baltic Basin. River discharge simulated directly from the RCM control
simulations with the HD Model is shown in Figure 11. For all of the models, peak discharge
is out of phase with observations. This delayed peak is partly caused by insufficient
representation of the complex snow processes in the Alpine part of the Rhine Basin in the SL
scheme (Hagemann and Jacob, 2006).
RCM generated changes in precipitation, 2 m temperature and evapotranspiration are
shown in Figure 12 for the Rhine Basin. Although the RCMs follow similar trends throughout
the year, large differences are apparent, particularly in summer and autumn. Maximum
temperature change is shown for the summer months, with a peak in August for most RCMs.
HadRM3P deviates considerably from the other models and RCAO shows a large deviation in
August. Regarding precipitation, an increase is shown for mid to late winter, a considerable
decrease is shown for summer, and autumn months oscillate between increases and decreases.
Evapotranspiration for summer months remains almost unchanged for most models, likely
as a result of low soil moisture values due to the warmer, dryer future climate. Exceptions are
HadRM3P and PROMES, which show considerable decreasing and increasing values,
respectively. During wetter winter months, warming enhances evapotranspiration.
4.2. HYDROLOGICAL SIMULATION OF CLIMATE CHANGE – RHINE
Looking first at the performance for the present climate, Figure 13a compares Rhine river
discharge from the bias-corrected WASIM-CTRL and WASIM-ERA40 simulations to
observations. The simulations reproduce the predominant pattern of the mean seasonal river
discharge cycle at Cologne. Also the characteristic regime change along the river course

Graham et al. - On interpreting hydrological change from regional climate models Page 16 of 31
revised version re-submitted to Climatic Change, June 2006
(Disse and Engel, 2001) is captured, from predominantly snowmelt dominated with peak
discharge in early summer (e.g. Diepoldsau) to rainfall dominated with peak discharge in
winter (e.g. Cologne). However, for the upper reaches of the basin at Diepoldsau and
Rheinfelden, the spring snowmelt peak is underestimated and occurs approximately one
month too late. Mean river discharge at downstream Kaub and Cologne is overestimated,
particularly for late summer and autumn.
Figure 13b shows Rhine river discharge from WASIM-A2 compared to WASIM-CTRL.
An overall decrease in runoff for summer and autumn is apparent, reaching up to 40%. This
primarily reflects the substantial decrease in mean summer precipitation. In late winter and
early spring, runoff increases at downstream Kaub and Cologne, reflecting a change in regime
for the larger lower elevation subbasins. These changes result from decreased winter snow
storage combined with increased precipitation and a shift in the winter maximum precipitation
to later months. For Alpine catchments at Diepoldsau and Rheinfelden, the spring snowmelt
peak occurs about one month earlier with a reduced magnitude of some 20% from the control
simulation.
Figure 12d shows change in Rhine river discharge simulated by the HD Model directly
from the RCM-A2 scenario simulations. As with the WASIM-A2 simulation, the largest
changes occur as decreases from summer to early winter. River discharge increases for late
winter and spring. Figure 14 compares change in river discharge using the CHRM RCM in
both the HD Model and WASIM. The two approaches agree for the overall trend of change.
4.3. CONSIDERATION OF SNOW IN THE ALPS
Large Alpine areas in the Rhine Basin exceed elevations of 1000 m.a.s.l. and have seasonal
snow cover with a duration of some 70 days or more per year for the present climate, on
average (Schär et al., 1998). Using results from WASIM, snow cover duration can be shown

Graham et al. - On interpreting hydrological change from regional climate models Page 17 of 31
revised version re-submitted to Climatic Change, June 2006
in relation to elevation. Figure 15 shows vertical snow profiles for the control and A2 scenario
simulations from a combined Alpine area with elevations predominantly exceeding
1000 m.a.s.l. The reduction in the annual number of snow cover days in the scenario is 75-100
days at 1500 to 3000 m.a.s.l. At 1000 m.a.s.l., duration goes from about 50 days at present to
about 7 days for the future. These changes correspond to a vertical shift of snow conditions by
approximately 500 m.
The empirical snow analysis examined average observed snow volume in the Alps as a
function of elevation for the present long-term mean and for winters where the average
temperature was 4°C warmer than the long-term mean. The maximum snow volume is
observed at an altitude of about 2000 m.a.s.l. and tails off both above and below this level.
Reduction in snow volume during the warm winters is close to 95% at the 1000 m level, some
40% at 2000 m, and only about 10% at elevations above 3500 m. This suggests that warm
conditions at low elevations would lead to little or no snow, while changes at very high
elevations would be minor. The 4°C temperature criterion corresponds to scenario changes
from many of the PRUDENCE RCMs for the Alps.
Empirical methods combined with climatological data (Beniston et al., 2003a) were also
used to estimate the duration of snow cover as a function of mean winter temperature and
precipitation, as shown in Figure 16. Superimposing projected future climate change onto the
chart shows that an increase in mean winter minimum temperature of 4°C would reduce the
length of the snow season by more than 100 days at sites such as Säntis (eastern Switzerland)
and Arosa (south-eastern Switzerland). Such estimates can be viable as the simulated increase
in winter precipitation for the climate scenarios only slightly offsets the influence of warming
and temperature is the dominant control on snow duration and seasonal snow accumulation
(Beniston et al., 2003b). The empirical result using CHRM-A2 scenario changes leads to
similar conclusions about snow cover duration to those from the WASIM Model.

Graham et al. - On interpreting hydrological change from regional climate models Page 18 of 31
revised version re-submitted to Climatic Change, June 2006
5. Discussion
The primary goal of hydrological change studies (as defined here) is to obtain a plausible
estimate of projected future climate impacts on hydrology and water resources. None of the
methods investigated here are completely satisfactory in their approach. However, taken as a
whole this work provides new insights.
All of the steps used in downscaling from the global climate to local hydrological regimes
add some transformation of climate information. Using multiple RCMs helps identify how
much the hydrological change signal can vary due to using different dynamical models to go
from global to regional scale. Using different hydrological approaches helps identify how
much the signal can vary due to hydrological modelling.
Analysis of outputs from the RCMs themselves indicates that most of the RCMs do not
provide a reasonable apportioning of the hydrological cycle for the Baltic Basin. A much
larger portion of precipitation goes to evapotranspiration than to runoff generation, in excess
of what is expected for this northern climate. The case of RCAO-E is an exception and shows
slightly more runoff than evapotranspiration. HIRHAM-E shows more evapotranspiration
than the HIRHAM simulation. If these two cases are representative, it appears that
apportionment of the hydrological cycle in the models is also sensitive to the driving GCMs.
For the Rhine, there is generally more variation between models, however most show a
smaller percentage of precipitation going to evapotranspiration than for the Baltic. Thus, the
RCMs show a gradient with higher apportionment of precipitation going to evapotranspiration
in Northern Europe than in Central Europe.
Runoff generation from the RCM simulations was also investigated with two river routing
models. This resulted in a wide range of results, both in timing and magnitude, reflecting both
model biases in precipitation and how the respective models partition precipitation into

Graham et al. - On interpreting hydrological change from regional climate models Page 19 of 31
revised version re-submitted to Climatic Change, June 2006
runoff. For some models river discharge shows considerable deviation from observations even
though precipitation may be reasonably represented. For others, overestimation of
evapotranspiration helps to dampen biases of overestimated precipitation. Comparing routing
methods, the HD Model performs its own precipitation partitioning and enhances the RCM
results. This qualitatively improves the seasonal distribution of river discharge, although
annual peak flows lag after observed peaks. RCroute uses a simpler approach, which gives a
more stringent comparison of RCM runoff outputs.
The RCM simulations were also tested by inputting precipitation and temperature results
directly into a hydrological model. Results from this rather tough test are a further indication
of the overestimation of precipitation from all models. This shows by example why
hydrological change studies require an interface between climate models and hydrological
models. As seen in this ensemble of simulations, annual river discharge from a continental
scale basin can deviate from observations by +6% to +72% for the same representative period
(1961-1990) if no scaling of present RCM inputs is performed.
For the Baltic Basin, a number of hydrological change simulations were carried out using
the delta approach to transfer the climate change signal from RCMs to a hydrological model.
The range of outcomes from an ensemble of RCMs driven by the same GCM with the same
emissions scenario represents the uncertainty due to using different RCMs. For RCMs driven
by HadAM3H, this range is fairly narrow. The largest deviation occurs in late summer and
autumn months for the Gulf of Finland and other eastern drainage basins. According to
Kjellström and Ruosteenoja (2006), the climate change signal for precipitation in this area is
affected by different approaches in the RCMs to represent feedback from the Baltic Sea itself,
in particular anomalously high sea surface temperatures (SSTs).
Further applications of the delta approach included looking at varying effects from using a
different GCM, different emissions scenarios and different RCM resolutions. Use of

Graham et al. - On interpreting hydrological change from regional climate models Page 20 of 31
revised version re-submitted to Climatic Change, June 2006
ECHAM4/OPYC3-A2 produced considerably different river discharge response than
simulations using HadAM3H-A2. This difference is also clearly seen in simulations from the
B2 scenarios. These differences generally exceed the differences between RCM simulations
driven by the same GCM.
Results using different RCM resolutions with the delta approach are less conclusive. There
is little difference in hydrological change simulations for the Bothnian Bay Basin, regardless
of whether one uses RCMs with 25 or 50 km, or HadAM3H at 150 km resolution. The
Bothnian Bay may be less sensitive in this application due to a combination of coarse
resolution in HBV-Baltic, and a hydrological regime dominated by energy-limited snow
hydrology (Bowling et al., 2003). Differences are more apparent in other drainage basins,
where using HadAM3H deviates considerably from all of the RCM simulations. However, the
finer resolution RCM simulations resulted in only slightly higher river flow than simulations
using the same model at coarser resolution. A possible explanation for this is that the delta
approach does not fully take advantage of differences that result in RCMs due to increasing
resolution.
Use of precipitation scaling as a transfer method to hydrological models provides results
that are more consistent with the RCMs. Although past studies have calculated changes to
such variables as the 100-year flow (e.g. Bergström et al., 2001), such results are of limited
use when based upon the delta approach. In comparison, hydrological simulations with
precipitation scaling provide representation of changes in variability. However, RCM
simulations with large biases in the seasonal cycle do not respond well to simple precipitation
scaling. This leads to additional scaling to get good representation of hydrological regimes in
the present climate (Graham et al., 2006). This methodology shows promise, but one must
keep in mind the alterations that are made to the RCM results, and the important assumption

Graham et al. - On interpreting hydrological change from regional climate models Page 21 of 31
revised version re-submitted to Climatic Change, June 2006
that RCM model biases in the future climate are systematically the same as in the control
climate. The more scaling applied, the further away one gets from “direct” use of the RCM.
Regarding hydrological change from river routing techniques, the magnitude of these
results are highly influenced by RCM biases. They are best used when expressed as percent
change in river discharge. Despite large differences in individual RCM simulations, the
overall signal of the response is in agreement between the HD Model and RCroute. These are
also qualitatively in agreement with the results using HBV-Baltic. However, choosing a single
RCM as a basis for further impact study, e.g. socio-economic response, would result in quite
different answers depending on the model used. Results from the HD Model show a narrower
range of uncertainty around the mean than those from RCroute. This is likely due to more
consistency in partitioning precipitation to runoff with the SL scheme (Hagemann and Jacob,
2006).
High resolution hydrological change simulations using the WASIM model for the Rhine
Basin provide detailed modelling of hydrological regimes at a horizontal resolution of 1 km
and a timestep of 1 hour. Although results are promising, one should question their
applicability at the finest scales of the model. It is also evident that WASIM is less skillful in
Alpine catchments compared to flatland catchments. As precipitation scaling was used, one
explanation is inadequate precipitation distribution over the Alps in the CHRM simulation
(Kleinn et al., 2005). Additional factors include the lack of a glacier model, and lack of lake
retention and regulation in WASIM, all of which become more important the finer the
resolution of the model.
The percent change in river discharge from the HD Model over the Rhine Basin is in basic
agreement with WASIM at Cologne. Change in river discharge from the other nine RCMs
provides some estimate of the general uncertainty in hydrological change from these models
over the Rhine Basin. This range is considerably narrower than shown for the Bothnian Bay.

Graham et al. - On interpreting hydrological change from regional climate models Page 22 of 31
revised version re-submitted to Climatic Change, June 2006
This implies that the RCMs react with a more unanimous signal of hydrological change for
the Rhine than for Bothnian Bay farther north.
Recognizing the complexity of representing the Alps with numerical models, an
alternative approach is the use of empirical methods to estimate changes in the snowpack. The
methods presented here complement modelling techniques by providing an independent check
on model results. An application would be to use these relationships as a type of updating
approach within the models themselves, although this warrants further investigation.
6. Conclusions
6.1. MODEL OUTCOMES
Using different RCMs with the same GCM forcing and emissions scenario results in similar
hydrological trends. Using different GCMs for forcing the RCMs has more effect on
hydrological impacts than using different RCMs with the same GCM forcing. Partitioning of
precipitation into evapotranspiration and runoff varies widely between RCMs and many tend
to overestimate evapotranspiration in the Baltic Basin. Use of the delta approach to transfer
climate change to hydrological models offers a robust method to compare average outcome
from different climate models, but not hydrological extremes. Using a scaling approach better
preserves changes in variability from the RCMs, however successful use of precipitation
scaling varies between RCMs. River flow routing of RCM runoff can be used to analyse both
model performance and scenario trends, but regard must be given to the precipitation biases
that most RCMs show.

Graham et al. - On interpreting hydrological change from regional climate models Page 23 of 31
revised version re-submitted to Climatic Change, June 2006
6.2. PROJECTED BALTIC BASIN HYDROLOGICAL IMPACTS FROM FUTURE
SCENARIO SIMULATIONS
Summer river flows show a decrease of as much as -16% , while winter flows show an
increase of up to 54%, on average for the total Baltic Basin. Annual river flows show an
increase in the northernmost catchments, while the southernmost catchments show a decrease.
The occurrence of medium to high river flow events shows a higher frequency. High flow
events show no pronounced increase in magnitude on the large scale. The greatest range of
variation in flow due to different RCMs occurs during summer and autumn.
6.3. PROJECTED RHINE BASIN HYDROLOGICAL IMPACTS FROM FUTURE
SCENARIO SIMULATIONS
Summer and autumn river flows show a decrease of as much as -42% , while winter flows
show an increase of up to 14%, on average for the Rhine Basin. Most of the winter river flow
increase comes from lowland catchments. Winter river flow increase for lowland catchments
is cancelled out by a decrease in alpine catchments in some years. Snowpack volume in
Alpine catchments could be reduced by up to 60% and snowmelt peak flows shift to occur
earlier in the season. Snowpack duration in Alpine catchments shows a reduction of about 3
weeks for each degree (ºC) of warming.
6.4. SOCIO-ECONOMIC RELEVANCE
The water sector must oversee the management of both excess and scarcity of water in
society. Specific applications of relevance include, among others, municipal and industrial
water supply, hydropower, flood prevention, drought management, irrigation management,

Graham et al. - On interpreting hydrological change from regional climate models Page 24 of 31
revised version re-submitted to Climatic Change, June 2006
dam safety, storm sewer design and maintenance, and nutrient transport analysis.
Identification of potential trends for change thus has both strategic and policy implications.
Conclusions about model outcomes provide an indication of how large the range of
uncertainties is according to different model combinations and configurations. This provides
insight into the error sources of impacts assessments. It also highlights how impact
assessment results can vary with different hydrological methods.
Conclusions about the specific river basin impacts provide initial insight to
decisionmakers on how hydrological regimes in these areas will respond to projected climate
change. For some sectors this overview may be enough to initiate preliminary action; for
others this may identify where further or more detailed studies are needed.
Acknowledgements
This work was carried out within the PRUDENCE Project with funds from the European
Commission’s Programme Environment and Climate (Contract No. EVK2-CT-2001-00132).
It was also supported in part by the Swiss Ministry for Education and the Swiss National
Science Foundation (NCCR). The HadAM3H data were provided by the Hadley Centre of the
United Kingdom Meteorological Office. The ECHAM4/OPYC3 data were provided by the
Max Planck Institute for Meteorology in Germany and the Danish Meteorological Institute
(DMI). CRU data were supplied by the Climate Impacts LINK Project (UK Department of the
Environment Contract EPG 1/1/16) on behalf of the Climatic Research Unit, University of
East Anglia. PRUDENCE RCM results were provided by the participating regional modelling
centers in the project. Special recognition is given to Ole Bøssing Christensen (DMI) for
design, maintenance and support of the PRUDENCE data center, and to Anders Ullerstig
(SMHI) for processing RCM results for use in the hydrological modelling. The authors also

Graham et al. - On interpreting hydrological change from regional climate models Page 25 of 31
revised version re-submitted to Climatic Change, June 2006
wish to acknowledge Christoph Frei (ETH), Jan Kleinn (ETH) and Daniela Jacob (MPI),
researchers who provided both hands-on contributions and scientific guidance in this work.
References
Andréasson, J., Bergström, S., Carlsson, B., Graham, L.P. and Lindström, G.: 2004,
'Hydrological change - climate change impact simulations for Sweden', Ambio 33, 228-
234.
Arnell, N.W.: 1999, 'The effect of climate change on hydrological regimes in Europe: a
continental perspective', Global Environmental Change 9, 5-23.
Beniston, M., Keller, F. and Goyette, S.: 2003a, 'Snow pack in the Swiss Alps under changing
climatic conditions: an empirical approach for climate impacts studies', Theor. Appl.
Climatol. 74, 19-31.
Beniston, M., Keller, F., Koffi, B. and Goyette, S.: 2003b, 'Estimates of snow accumulation
and volume in the Swiss Alps under changing climatic conditions', Theor. Appl. Climatol.
76, 125-140.
Bergström, S. and Carlsson, B.: 1994, 'River runoff to the Baltic Sea: 1950-1990', Ambio 23,
280-287.
Bergström, S., Carlsson, B., Gardelin, M., Lindström, G., Pettersson, A. and Rummukainen,
M.: 2001, 'Climate change impacts on runoff in Sweden - assessments by global climate
models, dynamical downscaling and hydrological modelling', Climate Res. 16, 101-112.
Bowling, L.C., Lettenmaier, D.P., Nijssen, B., Graham, L.P., Clark, D.B., Maayar, M.E.,
Essery, R., Goers, S., Habets, F., van den Hurk, B., Jin, J., Kahan, D., Lohmann, D.,
Mahanama, S., Mocko, D., Nasonova, O., Samuelsson, P., Shmakin, A.B., Takata, K.,
Verseghy, D., Viterbo, P., Xia, Y., Ma, X., Xue, Y. and Yang, Z.-L.: 2003, 'Simulation of

Graham et al. - On interpreting hydrological change from regional climate models Page 26 of 31
revised version re-submitted to Climatic Change, June 2006
high latitude hydrological processes in the Torne-Kalix basin: PILPS Phase 2(e) - 1:
Experiment description and summary intercomparisons', Glob. Planet. Change 38, 1-30.
Christensen, J.H., Carter, T.R. and Rummukainen, M.: 2006, 'Evaluating the performance and
utility of regional climate models: the PRUDENCE Project', Climatic Change,
(provisionally accepted).
Christensen, J.H. and Christensen, O.B.: 2006, 'A summary of the PRUDENCE model
projections of changes in European climate by the end of this century', Climatic Change,
(provisionally accepted).
Déqué, M., Rowell, D.P., Lüthi, D., Giorgi, F., Christensen, J.H., Rockel, B., Jacob, D.,
Kjellström, E., de Castro, M. and van den Hurk, B.: 2006, 'An intercomparison of regional
climate simulations for Europe: assessing uncertainties in model projections', Climatic
Change, (provisionally accepted).
Disse, M. and Engel, H.: 2001, 'Flood events in the Rhine Basin: genesis, infuences, and
mitigation', Natural Hazards 23, 271-290.
Döscher, R., Willén, U., Jones, C., Rutgersson, A., Meier, H.E.M., Hansson, U. and Graham,
L.P.: 2002, 'The development of the regional coupled ocean-atmosphere model RCAO',
Boreal Environ. Res. 7, 183-192.
Frei, C., Christensen, J.H., M. Déqué, M., Jacob, D., Jones, R.G. and Vidale, P.L.: 2003,
'Daily precipitation statistics in regional climate models: Evaluation and intercomparison
for the European Alps', J. Geo. Res. 108, 4124, doi: 10.1029/2002JD002287.
Frei, C. and Schär, C.: 1998, 'A precipitation climatology of the Alps from high-resolution
raingauge observations', Int. J. Climatology 18, 878-900.
Gellens, D. and Roulin, E.: 1998, 'Streamflow response of Belgian catchments to IPCC
climate change scenarios', J. Hydrology 210, 242-258.

Graham et al. - On interpreting hydrological change from regional climate models Page 27 of 31
revised version re-submitted to Climatic Change, June 2006
Giorgi, F. and Mearns, L.O.: 1999, 'Regional climate modeling revisited', J. Geophys. Res.
104, 6335-6352.
Graham, L.P.: 1999, 'Modeling runoff to the Baltic Sea', Ambio 28, 328-334.
Graham, L.P.: 2004, 'Climate change effects on river flow to the Baltic Sea', Ambio 33, 235-
241.
Graham, L.P., Andréasson, J. and Carlsson, B.: 2006, 'Assessing climate change impacts on
hydrology from an ensemble of regional climate models, model scales and linking
methods - a case study on the Lule River Basin', Climatic Change, (provisionally
accepted).
Graham, L.P. and Jacob, D.: 2000, 'Using large-scale hydrologic modeling to review runoff
generation processes in GCM climate models', Meteorol. Z. 9, 49-57.
Hagemann, S. and Dümenil Gates, L.: 2001, 'Validation of the hydrological cycle of ECMWF
and NCEP reanalyses using the MPI hydrological discharge model', J. Geo. Res. 106,
1503-1510.
Hagemann, S. and Jacob, D.: 2006, 'Gradient in the climate change signal of European
discharge predicted by a multi-model ensemble', Climatic Change, (provisionally
accepted).
Hagemann, S., Machenhauer, B., Jones, R., Christensen, O.B., Déqué, M., Jacob, D. and
Vidale, P.L.: 2004, 'Evaluation of Water and Energy Budgets in Regional Climate Models
Applied Over Europe', Clim. Dynamics 23, 547-567.
Hamlet, A.F. and Lettenmaier, D.: 1999, 'Effects of climate change on hydrology and water
resources in the Columbia River Basin', Am. Water Resour. Ass. 35, 1597-1623.
Hay, L.E., Wilby, R.L. and Leavesley, G.H.: 2000, 'A comparison of delta change and
downscaled GCM scenarios for three mountainous basins in the United States', J. Am.
Water Res. Ass. 36, 387-398.
Graham et al. - On interpreting hydrological change from regional climate models Page 28 of 31
revised version re-submitted to Climatic Change, June 2006
Huffman, G.J., Adler, R.F., Arkin, A., Chang, A., Ferraro, R., Gruber, A., Janowiak, J., Joyce,
R.J., McNab, A., Rudolf, B., Schneider, U. and Xie, P.: 1997, 'The global precipitation
climatology project (GPCP) combined precipitation data set', Bull. Amer. Meteorol. Soc.
78, 5-20.
Jacob, D., Bärring, L., Christensen, O.B., Christensen, J.H., de Castro, M., Déqué, M., Giorgi,
F., Hagemann, S., Hirschi, M., Jones, R., Kjellström, E., Lenderink, G., Rockel, B.,
Sánchez, E.S., Schär, C., Seneviratne, S., Somot, S., van Ulden, A. and van den Hurk, B.:
2006, 'An intercomparison of regional climate models for Europe: Model performance in
Present-Day Climate', Climatic Change, (submitted).
Jasper, K., Calance, D. and Fuhrer, J.: 2004, 'Differential impacts of climate change on the
hydrology of two Alpine river basins', Climate Res. 26, 113-129.
Jasper, K. and Kaufmann, P.: 2003, 'Coupled runoff simulations as validation tool for
atmospheric models at the regional scale', Q. J. R. Meteorol. Soc. 129, 673-692.
Kaczmarek, Z., Napiórkowski, J. and Strzepek, K.M.: 1996, 'Climate change impacts on the
water supply system in the Warta River Catchment, Poland', Int. J. Water Resour. Dev. 12,
165-180.
Kjellström, E. and Ruosteenoja, K.: 2006, 'Present-day and future precipitation in the Baltic
Sea region as simulated in a suite of regional climate models', Climatic Change,
(provisionally accepted).
Kleinn, J., Frei, C., Gurtz, J., Lüthi, D., Vidale, P.L. and Schär, C.: 2005, 'Hydrologic
Simulations in the Rhine Basin driven by a Regional Climate Model', J. Geophysical
Research 110, D04102, doi:10.1029/2004JD005143.
Latif, M., Roeckner, E., Botzet, M., Esch, M., Haak, H., Hagemann, S., Jungclaus, J.,
Legutke, S., Marsland, S. and Mikolajewicz, U.: 2003, 'Reconstructing, Monitoring, and

Graham et al. - On interpreting hydrological change from regional climate models Page 29 of 31
revised version re-submitted to Climatic Change, June 2006
Predicting Decadal-Scale Changes in the North Atlantic Thermohaline Circulation with
Sea SurfaceTemperature', J. Climate 17, 1605-1613.
Lenderink, G., Buishand, A. and van Deursen, W.: 2006, 'Estimates of future discharges of
the river Rhine using two scenario methodologies: direct versus delta approach', Hydrol.
Earth Sys. Sci. (in press).
Lindström, G., Johansson, B., Persson, M., Gardelin, M. and Bergström, S.: 1997,
'Development and test of the distributed HBV-96 model', J. Hydrology 201, 272-288.
Marinucci, M.R., Giorgi, F., Beniston, M., Wild, M., Tschuck, P., Ohmura, A. and
Bernasconi, A.: 1995, 'High resolution simulations of January and July climate over the
Western alpine region with a nested regional modelling system', Theor. Appl. Climatol.
51, 119-138.
Middelkoop, H., Daamen, K., Gellens, D., Grabs, W., Kwadijk, J.C.J., Lang, H., Parmet,
B.W.A.H., Schädler, B., Schulla, J. and Wilke, K.: 2001, 'Impact of climate change on
hydrological regimes and water resources management in the Rhine Basin', Climatic
Change 49, 105-128.
Nakićenović, N., Alcamo, J., Davis, G., de Vries, B., Fenhann, J., Gaffin, S., Gregory, K.,
Grübler, A., Jung, T.Y., Kram, T., La Rovere, E.L., Michaelis, L., Mori, S., Morita, T.,
Pepper, W., Pitcher, H., Price, L., Riahi, K., Roehrl, A., Rogner, H.-H., Sankovski, A.,
Schlesinger, M., Shukla, P., Smith, S., Swart, R., van Rooijen, S., Victor, N. and Dadi, Z.:
2000, IPCC Special Report on Emissions Scenarios, Cambridge University Press,
Cambridge, UK and New York, NY, USA, 599.
Nash, J.E. and Sutcliffe, J.V.: 1970, 'River flow forecasting through conceptual models part I
- A discussion of principles', J. Hydrology 10, 282-290.

Graham et al. - On interpreting hydrological change from regional climate models Page 30 of 31
revised version re-submitted to Climatic Change, June 2006
New, M., Hulme, M. and Jones, P.: 2000, 'Representing twentieth century space-time climate
variability II: Development of 1901-1996 monthly grids of terrestrial surface climatology',
J. Climate 13, 2217-2238.
Rudolf, B. and Rubel, F.: 2005, 'Global precipitation', in Hantel, M. (eds.), Observed Global
Climate, Springer-Verlag, pp. (in press).
Schulla, J.: 1997, Hydrologische Modellierung von Flussgebieten zur Abschätzung der
Folgen von Klimaänderungen (Hydrological Modelling of Riverine Areas for estimation of
Climate Change Impacts, in German), Doctoral Thesis, Institute for Atmospheric and
Climate Science, Zürich, Switzerland, Swiss Federal Institute of Technology (ETH), 116.
Schwarb, M., Daly, C., Frei, C. and Schär, C.: 2001, Mean Annual Precipitation throughout
the European Alps 1971-1990. Hydrological Atlas of Switzerland, Plates 2.6 and 2.7.
Schär, C., Davies, T.D., Frei, C., Wanner, H., Widmann, M., Wild, M. and Davies, H.C.:
1998, 'Current Alpine climate', in Cebon, P., Dahinden, U., Davies, H.C., Imboden, D. and
Jaeger, C.C. (eds.), A view from the Alps: regional perspectives on climate change, pp. 21-
72.
Uppala, S.M., Kållberg, P.W., Simmons, A.J., Andrae, U., da Costa Bechtold, V., Fiorino, M.,
Gibson, J.K., Haseler, J., Hernandez, A., Kelly, G.A., Li, X., Onogi, K., Saarinen, S.,
Sokka, N., Allan, R.P., Andersson, E., Arpe, K., Balmaseda, M.A., Beljaars, A.C.M., van
de Berg, L., Bidlot, J., Bormann, N., Caires, S., Chevallier, F., Dethof, A., Dragosavac,
M., Fisher, M., Fuentes, M., Hagemann, S., Hólm, E., Hoskins, B.J., Isaksen, V., Janssen,
P.A.E.M., Jenne, R., McNally, A.P., Mahfouf, J.-F., Morcrette, J.-J., Rayner, N.A.,
Saunders, R.W., Simon, P., Sterl, A., Trenberth, K.E., Untch, A., Vasiljevic, D., Viterbo,
P. and Woollen, J.: 2005, 'The ERA-40 Reanalysis', Q. J. R. Meteorol. Soc. 131, 2961-
3012.doi:10.1256/qj.04.176.

Graham et al. - On interpreting hydrological change from regional climate models Page 31 of 31
revised version re-submitted to Climatic Change, June 2006
Vanrheenen, N.T., Wood, A.W., Palmer, R.N. and Lettenmaier, D.P.: 2004, 'Potential
implications of PCM climate change scenarios for Sacramento-San Joaquin River Basin
hydrology and water resources', Climatic Change 62, 257-281.
Vehviläinen, B. and Huttunen, M.: 1997, 'Climate change and water resources in Finland',
Boreal Environ. Res. 2, 3-18.
Vidale, P.L., Lüthi, D., Frei, C., Seneviratne, S. and Schär, C.: 2003, 'Predictability and
uncertainty in a regional climate model', J. Geophysical Research 108, 4586, doi:
10.1029/2002JD002810.
Widmann, M. and Bretherton, C.S.: 2000, 'Validation of Mesoscale Precipitation in the NCEP
Reanalysis Using a New Gridcell Dataset for the Northwestern United States', J. Climate
13, 1936-1950.
Xie, P. and Arkin, A.: 1997, 'Global precipitation: a 17-year monthly analysis based on gauge
observations, satellite estimates and numerical model outputs', Bull. Amer. Meteorol. Soc.
78, 2539-2558.

Graham et al. - On interpreting hydrological change from regional climate models Captions 1 of 4
revised version re-submitted to Climatic Change, June 2006
Table I Summary of RCM simulations used in this study. Each “x” indicates a projected
hydrological change simulation. The table headings specify boundary GCM,
hydrological basin, hydrological application, SRES emissions scenario and
approximate RCM resolution.
Table II Mean annual river discharge from HBV-Baltic using direct input of precipitation
and 2 m temperature from RCM control simulations. Most of the RCM
simulations used boundary conditions from HadAM3H. Two RCMs used
boundary conditions from ECHAM4/OPYC3 and are specified with “-E” in the
model name. Observations shown in the top row are from 1961-1990. The
separate column to the right shows the percent difference between each control
simulation and observations for the total Baltic Basin.
Figure 1. Location map of basin study areas.
Figure 2. a) Precipitation, b) 2 m temperature and c) evapotranspiration from RCM control
simulations for the Bothnian Bay Basin.
Figure 3. RCM partitioning of precipitation into evapotranspiration and runoff generation
over a) the total Baltic Basin and b) the Rhine Basin. All used HadAM3H
boundary conditions with the exception of two that used ECHAM4/OPYC3
(marked with “E”). HBV-Baltic results using observations are also shown in a)
(HBV-base).

Graham et al. - On interpreting hydrological change from regional climate models Captions 2 of 4
revised version re-submitted to Climatic Change, June 2006
Figure 4. Routed river discharge from RCM control simulations for the Bothnian Bay Basin
from a) HD Model and b) RCroute.
Figure 5. Change in a) precipitation, b) 2 m temperature and c) evapotranspiration from
RCM-H/A2 scenario simulations for the Bothnian Bay Basin. The pronounced
percent increases in c) for some models reflects the relatively small
evapotranspiration values generated for the control climate.
Figure 6. Mean daily river discharge from HBV-Baltic using the delta approach for
RCM-A2 scenarios at ~50 km resolution, driven by a) HadAM3H and
b) ECHAM4/OPYC3. Shown in gray shading is the present climate.
Figure 7. Mean daily river discharge from HBV-Baltic using the delta approach for
a) RCM-B2 scenarios at ~50 km resolution driven by HadAM3H and
ECHAM4/OPYC3, and b) RCM-A2 scenarios driven by HadAM3H at resolutions
of ~25 km and ~50 km, and HadAM3H at ~150 km. Shown in gray shading is the
present climate.
Figure 8. Mean daily river discharge from HBV-Baltic using the precipitation scaling
approach for three RCMs driven by HadAM3H-A2 for a) control simulation, and
b) scenario simulation. Shown in gray shading is the present climate.
Figure 9. Model period maximum and minimum daily river discharge from HBV-Baltic
using both the precipitation scaling approach and the delta approach for two
RCMs (RACMO and RCAO) driven by the HadAM3H-A2 scenario. Shown in

Graham et al. - On interpreting hydrological change from regional climate models Captions 3 of 4
revised version re-submitted to Climatic Change, June 2006
gray shading are corresponding maximum and minimum values for the present
climate.
Figure 10. Percent change in routed river discharge from RCM-A2 scenario simulations for
the Bothnian Bay Basin from a) HD Model and b) RCroute.
Figure 11. HD Model routed river discharge from RCM control simulations for the Rhine
Basin.
Figure 12. Change in a) precipitation, b) 2 m temperature, c) evapotranspiration and d) HD
Model routed river discharge from RCM-H/A2 scenario simulations for the Rhine
Basin.
Figure 13. Mean monthly river discharge at four locations along the Rhine River for a) the
WASIM-CTRL and WASIM-ERA40 simulations, and b) the WASIM-H/A2
simulation. Cologne is shown with bolder lines to emphasize that it is the most
downstream location.
Figure 14. Comparison of WASIM and HD Model generated Rhine river discharge changes
at Cologne using the CHRM-H/A2 scenario.
Figure 15. Snow duration versus elevation from WASIM-CTRL and WASIM-H/A2
simulations for the combined Alpine area of Aare, Limmat, Reuss and Rhine
subbasins.
Graham et al. - On interpreting hydrological change from regional climate models Captions 4 of 4
revised version re-submitted to Climatic Change, June 2006
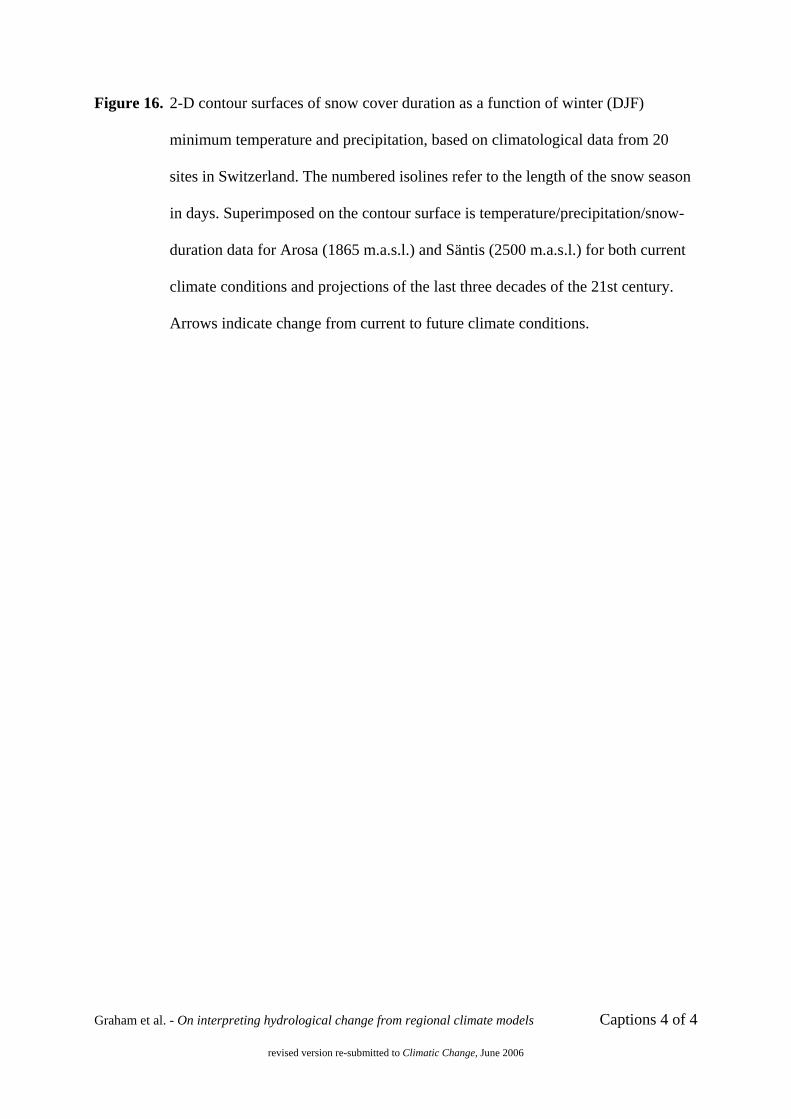
Figure 16. 2-D contour surfaces of snow cover duration as a function of winter (DJF)
minimum temperature and precipitation, based on climatological data from 20
sites in Switzerland. The numbered isolines refer to the length of the snow season
in days. Superimposed on the contour surface is temperature/precipitation/snow-
duration data for Arosa (1865 m.a.s.l.) and Säntis (2500 m.a.s.l.) for both current
climate conditions and projections of the last three decades of the 21st century.
Arrows indicate change from current to future climate conditions.

Graham et al. - On interpreting hydrological change from regional climate models Tables 1 of 2 revised version re-submitted to Climatic Change, June 2006
Table I
Summary of RCM simulations used in this study. Each “x” indicates a projected hydrological change simulation. The table headings specify boundary GCM, hydrological basin, hydrological application, SRES emissions scenario and approximate RCM resolution.
HadAM3H
(150 km) ECHAM4/
OPYC3 (250 km)
Baltic Basin Rhine Basin Baltic Basin HBV-Baltic Rcroute HD
Model HD
Model WaSIM HBV-Baltic
RCM A2 50 km
B2 50 km
A2 25 km
A2 50 km
A2 50 km
A2 50 km
A2 50 km
A2 50 km
B2 50 km
REMO x x x x HIRHAM (HIRHAM25)
x
x x
x
x x
x
CLM x x x x RACMO x x x x ARPEGE* x x x x CHRM x x x x x HadRM3H x HadRM3P x x x x x RCAO (RCAO25)
x
x
x
x
x
x x
x
PROMES x RegCM x
(*ARPEGE is technically a GCM, but it uses a variable resolution grid that corresponds to RCM resolution over Europe, see Déqué et al., 2006.)

Graham et al. - On interpreting hydrological change from regional climate models Tables 2 of 2 revised version re-submitted to Climatic Change, June 2006
Table II
Mean annual river discharge from HBV-Baltic using direct input of precipitation and 2 m temperature from RCM control simulations. Most of the RCM simulations used boundary conditions from HadAM3H. Two RCMs used boundary conditions from ECHAM4/OPYC3 and are specified with “-E” in the model name. Observations shown in the top row are from 1961-1990. The separate column to the right shows the percent difference between each control simulation and observations for the total Baltic Basin.
River Discharge (m3/s) from the main Baltic Sea sub-regional drainage basins and the total basin
BB BS GOF GOR BP BT BT
Observations 3108 2893 3540 994 3675 14210 % difference
REMO 4923 4296 5924 1295 5481 21918 +54%
HIRHAM 3667 3184 3703 767 3690 15011 +6%
HIRHAM-E 4411 4212 6010 1423 6648 22705 +60%
HIRHAM25 3814 3279 4157 870 4202 16322 +15%
CLM 3814 3311 4375 944 4288 16733 +18%
RACMO 3941 3684 4828 1162 4874 18489 +30%
ARPEGE 4545 4607 6577 1540 7210 24479 +72%
CHRM 4509 3889 5401 1280 4685 19763 +39%
HadRM3H 4124 3960 5160 1106 5021 19371 +36%
HadRM3P 3912 3470 4001 815 4005 16204 +14%
RCAO 4239 4033 4695 1173 4966 19106 +34%
RCAO-E 4375 4714 6181 1658 7271 24199 +70%
RCAO25 4778 4299 5110 1156 5374 20717 +46%
(BB – Bothnian Bay, BS – Bothnian Sea, GOF – Gulf of Finland, GOR – Gulf of Riga, BP – Baltic Proper, BT – total Baltic Basin)

Graham et al. - On interpreting hydrological change from regional climate models Figures 1 of 10 revised version re-submitted to Climatic Change, June 2006
Figure 1.

Graham et al. - On interpreting hydrological change from regional climate models Figures 2 of 10 revised version re-submitted to Climatic Change, June 2006
a) b)
c) Figure 2.
a) b) Figure 3.

Graham et al. - On interpreting hydrological change from regional climate models Figures 3 of 10 revised version re-submitted to Climatic Change, June 2006
a) b) Figure 4.
a) b)
c)
Figure 5.
Graham et al. - On interpreting hydrological change from regional climate models Figures 4 of 10 revised version re-submitted to Climatic Change, June 2006
a) b) Figure 6.

Graham et al. - On interpreting hydrological change from regional climate models Figures 5 of 10 revised version re-submitted to Climatic Change, June 2006
a) b) Figure 7.

Graham et al. - On interpreting hydrological change from regional climate models Figures 6 of 10 revised version re-submitted to Climatic Change, June 2006
a) b) Figure 8.

Graham et al. - On interpreting hydrological change from regional climate models Figures 7 of 10 revised version re-submitted to Climatic Change, June 2006
Figure 9.
a) b) Figure 10.

Graham et al. - On interpreting hydrological change from regional climate models Figures 8 of 10 revised version re-submitted to Climatic Change, June 2006
Figure 11.
a) b)
c) d) Figure 12.

Graham et al. - On interpreting hydrological change from regional climate models Figures 9 of 10 revised version re-submitted to Climatic Change, June 2006
2 4 6 8 10 12
050
015
0025
00
Month
Riv
er D
isch
arge
[m3/
s]
Diepoldsau
Rheinfelden
Kaub
Cologne OBSERA40CTRL
2 4 6 8 10 12
050
015
0025
00
Month
Riv
er D
isch
arge
[m3/
s]
Diepoldsau
Rheinfelden
Kaub
Cologne CTRLSCEN
a) b) Figure 13.
Figure 14.
Figure 15.

Graham et al. - On interpreting hydrological change from regional climate models Figures 10 of 10 revised version re-submitted to Climatic Change, June 2006
Figure 16.