on the exposure of insurance companies to …eprints.lse.ac.uk/83195/1/koenig_on exposure...
TRANSCRIPT

Robert Düll, Felix König, Jana Ohls On the exposure of insurance companies to sovereign risk − portfolio investments and market forces 1 Article (Accepted version) (Refereed)
Original citation: Düll, Robert and König, Felix and Ohls, Jana (2017) On the exposure of insurance companies to sovereign risk − portfolio investments and market forces 1. Journal of Financial Stability. ISSN 1572-3089 DOI: 10.1016/j.jfs.2017.06.008 Reuse of this item is permitted through licensing under the Creative Commons:
© 2017 Elsevier B.V. CC BY-NC-ND 4.0 This version available at: http://eprints.lse.ac.uk/83195/ Available in LSE Research Online: July 2017
LSE has developed LSE Research Online so that users may access research output of the School. Copyright © and Moral Rights for the papers on this site are retained by the individual authors and/or other copyright owners. You may freely distribute the URL (http://eprints.lse.ac.uk) of the LSE Research Online website.
Accepted Manuscript
Title: On the exposure of insurance companies to sovereignrisk − portfolio investments and market forces1
Authors: Robert Dull, Felix Konig, Jana Ohls
PII: S1572-3089(17)30445-XDOI: http://dx.doi.org/doi:10.1016/j.jfs.2017.06.008Reference: JFS 558
To appear in: Journal of Financial Stability
Received date: 18-7-2016Revised date: 28-2-2017Accepted date: 21-6-2017
Please cite this article as: Dull, Robert, Konig, Felix, Ohls, Jana, On the exposureof insurance companies to sovereign risk − portfolio investments and marketforces1.Journal of Financial Stability http://dx.doi.org/10.1016/j.jfs.2017.06.008
This is a PDF file of an unedited manuscript that has been accepted for publication.As a service to our customers we are providing this early version of the manuscript.The manuscript will undergo copyediting, typesetting, and review of the resulting proofbefore it is published in its final form. Please note that during the production processerrors may be discovered which could affect the content, and all legal disclaimers thatapply to the journal pertain.

1
On the exposure of insurance companies to sovereign risk -
portfolio investments and market forces1
Robert Düllᵃ, Felix Königᵇ, Jana Ohlsᵃ,*
This version: June 2017
Highlights of the paper „On the exposure of insurance companies to sovereign risk“ Since the onset of the European sovereign debt crisis, sovereign risk has been one of
the main threats to financial stability. While most recent research investigates the link
between sovereign risk and the banking system, this paper analyzes the transmission
of sovereign risk to insurance companies.
We use a firm level panel dataset that covers large insurance companies, banks and
non-financial firms from nine countries over the time period from 1 January2008 to
1 May 2013.
We find that domestic sovereign risk significantly increases insurer risk as perceived
by markets. While the impact on insurers is similar to the effect on banks, it is
substantially larger than for non-financial companies.
The link to domestic sovereigns was stronger for insurers that have subsequently been
identified as systemically important by the Financial Stability Board.
Based on European data, we show that risks in sovereign bond portfolios are an
important driver of insurer risk, which is not reflected in current insurance regulation
(incl. Solvency II in Europe).
1 Contact: Felix König, [email protected]. Robert Düll, [email protected]. Jana Ohls, [email protected]. *) Corresponding author: Jana Ohls, +49 69 9566-6503. The authors would like to thank the following for their helpful comments and suggestions: Jörg Breitung, Claudia Buch, Calebe de Roure, Sebastian Schlütter, Kevin Sheppard, Robert Vermeulen , two anonymous referees, and the participants of the 2014 IWH Halle doctoral seminar, the Deutsche Bundesbank research seminarin 2015, the 5th International Conference of the Financial Engineering and Banking Society (FEBS), the 2015 World Risk and Insurance Economics Congress (WRIEC), the 2015 Financial Stability Conference of the Federal Reserve Bank of Cleveland and the Office of Financial Research, and the 23rd Annual Conference of the Multinational Finance Society. Furthermore, the authors would like to thank J.P. Morgan for its permission to use the published sovereign bond data in this research project. The opinions expressed in this discussion paper are the authors' personal opinions and do not necessarily reflect the views of the Deutsche Bundesbank or its staff. Any remaining errors are our own. ᵃ Deutsche Bundesbank, Wilhelm-Epstein-Strasse 14, 60431 Frankfurt am Main, Germany. ᵇ London School of Economics, Houghton St, London WC2A 2AE, United Kingdom.

2
Abstract
A sovereign debt crisis can have significant knock-on effects in the financial markets and put financial
stability at risk. This paper focuses on the transmission of sovereign risk to insurance companies as
some of the largest institutional investors in the sovereign bond market. We use a firm level panel
dataset that covers large insurance companies, banks and non-financial firms from nine countries over
the time period from 1 January 2008 to 1 May 2013. We find significant and robust transmission
effects from sovereign risk to domestic insurers. The impact on insurers is not significantly different
from that on banks but larger than for non-financial firms. We find that systemically important
insurers are more closely linked to the domestic sovereign. Based on European data, we show that
risks in sovereign bond portfolios are an important driver of insurer risk, which is not reflected in
current insurance regulation (incl. Solvency II in Europe).
Keywords: insurance, sovereign risk, sovereign bond portfolio
JEL-Classification: G22, G28, G15
“The exposures that banks and insurance corporations have held vis-à-vis sovereigns have been seen by many
as a source of fragility in the recent and prolonged episodes of financial stress, while others have seen them as a
factor of crisis mitigation. […] from a macro-prudential point of view, the current regulatory framework may
have led to excessive investment by financial institutions in government debt.”
Mario Draghi, Foreword to the ESRB report on the regulatory treatment of sovereign exposures, March 2015.
1 Introduction
Since the onset of the European sovereign debt crisis, sovereign risk has been one of the
main threats to financial stability. Many recent research papers investigate the link between
sovereign risk and the banking system. By contrast, however, research on the effects of
sovereign risk on insurance companies is very rare. This is surprising, given the importance of
insurance companies as large institutional investors in sovereign bond markets. Insurers hold
roughly 12% of all global financial assets (IAIS, 2011) and they invest a major share of those
assets in sovereign bonds (see J.P. Morgan Cazenove, 2014). To the best of our knowledge,
our paper is the first to analyze empirically the channels of risk transmission from sovereigns
to insurers.
Our analysis is based on a novel panel dataset that covers sovereigns, insurance companies,
banks and non-financial firms from nine countries (Belgium, France, Germany, Italy, Japan,
the Netherlands, Switzerland, the United Kingdom, and the United States) over the time
period from 1 January 2008 to 1 May 2013. We analyze the market’s expectations of default

3
risk by using CDS spreads as our baseline risk measure. In our empirical methodology, we
control for reverse causality and identify several channels of risk transmission.
We find that there is a strong and robust transmission of default risk from sovereigns to
insurers. This risk spillover is not significantly different from the spillover of sovereign risk
onto banks but it is stronger than for non-financial firms. We take a closer look at the
channels of risk transmission and find that insurers which later have been classified as global
systemically important insurer systemically important financial institutions (G-SII) by the
Financial Stability Board (FSB) were more susceptible to domestic sovereign risk during our
sample period.
We also test for the impact of insurers’ sovereign bond holdings using portfolio data for 16
large European insurers as provided by J.P. Morgan Cazenove (2014). These data are based
on the financial reports published by insurance companies and are available quarterly from
Q4 2009 through to Q1 2013 (see Annex for a list of insurers). We expect the default risk of
insurers to increase with the credit risk of their sovereign bond holdings. At the same time,
however, insurance companies may benefit from higher yields on new investments in risky
sovereign debt, especially in the current low-interest-rate environment. Ex ante, therefore, it is
unclear whether it is the risk or the return effect of sovereign bonds which dominates. Our
results suggest that the risk effect was more important than the return effect in large European
insurers’ sovereign bond portfolios in our sample period. We find that insurer default risk is
driven by the riskiness of their sovereign bond portfolios. In particular, we show that
sovereign risk may spill across borders through insurers’ holdings of foreign sovereign bonds.
Domestic sovereign bond holdings were not a significant driver of insurer default risk in our
sample, probably because data was available predominantly for insurers from relatively safe
countries. Domestic sovereign risk was not a key issue for these insurers, but exposure to
foreign, risky sovereigns was more important. We also document that diversification in
sovereign bond portfolios is low and has been declining in recent years.
Furthermore, we find that sovereign risk transmission to domestic insurers increases with
the level of sovereign risk and has been stronger in the euro area than elsewhere. Over time,
however, the transmission of sovereign risk to domestic insurers is rather stable.
Finally, risk in the domestic banking sector also significantly raises insurance companies’
default risk.
Our findings are important for policymakers, regulators and the industry alike. The
portfolio channel identified has important implications for supervisory monitoring and
designing regulations. At present, domestic sovereign bond investments are generally exempt

4
from capital charges under insurance regulations. Under the new European insurance
regulation, Solvency II, which came into effect at the beginning of 2016, EU sovereign bonds
are exempt from the credit and concentration risk modules when calculating solvency capital
requirements under Pillar 1. The regulation thus deems domestic and EU sovereign bonds to
be risk free for European insurance companies. We show, however, that markets take risks in
sovereign bond portfolios into account when assessing insurer default risk.
Insurer stability is of interest from a macroprudential perspective as insurance companies
pool and allocate risks in the economy, thereby contributing to financial stability. Moreover,
distress in the insurance sector can destabilize the financial system (International Monetary
Fund, 2016) given its importance as a large institutional investor.
Taking into account these issues, it is surprising that research on insurers’ vulnerability to
sovereign risk is so rare. The only paper known to us that includes insurance companies as
part of the nexus between sovereigns and the financial system is Billio, Getmansky, Gray, Lo,
Merton, and Pelizzon (2013). Based on Granger causality and network analysis, this paper
finds that the system of banks, insurance companies, and sovereigns is highly dynamically
connected. It does not, however, discuss the channels of risk transmission, which is what we
do in this paper.
The literature on risk spillovers between sovereigns and the private sector focuses almost
exclusively on (i) banks (see, for example, Acharya, Drechsler, and Schnabl, 2014; Altera and
Schüler, 2012; Battistini, Pagano, and Simonelli, 2014)2 or (ii) (non-financial) firms (see, for
example, Ciocchini, 2002; Durbin and Ng, 2005). We contribute to this strand of the literature
by providing insights into the effects of sovereign risk on a third important sector: insurance.
Before turning to the empirical approach, we first look at the mere correlation of sovereign
risk and insurer risk, and find that both sectors tend to move together (see Figure 1). The blue
(red) line reports the average 5-year CDS spread of the insurance sector (the sovereign) as
published by the data provider, Markit (in basis points).
While Figure 1 gives a first hint at a relationship between sovereign and insurer risk, this
finding might be driven by different factors that affect both sovereign and insurer risk
simultaneously. We will address these concerns in our empirical strategy.
2 For the sake of completeness, it should be mentioned that several studies analyze contagion from banks to the sovereign, e.g. through bank bail-outs (Alter und Beyer, 2014; Gerlach, Schulz and Wolff, 2010; International Monetary Fund, 2012).

5
First, we estimate a reduced form equation of insurer risk on sovereign risk, controlling for
a number of confounding factors (following the methodology in Acharya et al., 2014 for an
application to the banking sector). We perform additional checks to address whether
sovereign risk transmission has a causal and insurer-specific effect. We compare the
magnitude of transmission across sectors (as in Bühler and Prokopczuk, 2010) and control for
reverse causality through instrumental variable (IV) regressions (as in Bedendo and Colla,
2013).
The paper is structured as follows. In Section 2 we discuss our hypotheses of the
transmission channels through which sovereign risk spills over onto insurer risk; Section 3
presents the dataset and our empirical strategy; in Section 4 we present the results; Section 5
concludes and offers insights into policy implications.
2 Hypotheses of risk transmission channels
To the best of our knowledge, there is no theoretical model to guide our hypotheses of the
relationship between sovereigns and insurance companies. We, therefore, build on the
findings of the related literature on banks and non-financial firms mentioned above and adapt
them to suit the insurance-specific case. In our empirical setup, we consider several
transmission channels through which sovereign risk can spill over onto insurer risk.
1. Various studies have shown that banks are vulnerable to sovereign risk due to their
sovereign bond portfolios (Buch, Kötter and Ohls, 2016; De Bruyckere, Gerhardt, Schepens
and Vander Vennet, 2013). This may stem from the risk of incurring direct losses on bond
holdings as well as from the importance of sovereign bonds as collateral to obtain funding.
Similarly, sovereign risk may affect insurers through a portfolio channel. We will study this
channel by including company-level information on insurers’ sovereign bond holdings.
Insurers are highly exposed to sovereigns through their bond holdings. Our data suggest
that insurers hold a larger share of their assets in sovereign bonds than banks do (in Europe,
the portions are roughly 20% and 11%, respectively).3 Moreover, anecdotal evidence suggests
that insurers’ (domestic) sovereign bond investments are particularly large and growing in
countries experiencing sovereign stress. Italian insurers, for instance, increased their exposure
to Italian public debt from 33% of their total asset portfolio in 2008 to 50% of their portfolio
3 For European banks, see EBA (2011a); for insurers, see J.P. Morgan Cazenove (2014).

6
by the end of 2012.4 In this study, therefore, we focus on the impact of sovereign bond
portfolios on risk transmission.
In terms of assets, in particular sovereign bonds, life insurers are by far the most important
players and thus feature prominently in our sample. Life insurance companies often have
long-term nominal liabilities. In respect of duration matching, these are best matched with
long-term low-risk bonds which “guarantee” a fixed nominal return. This ‒ together with
preferential regulatory treatment ‒ has led many insurance companies to invest heavily in
government bonds (Wilson, 2013).
According to Ernst & Young, the majority of insurers’ sovereign bonds (over 60%) are
classified as “available for sale” (Ernst & Young, 2011).5 This is because they are held as a
liquidity buffer with the option of selling them before maturity. Given current accounting
rules (i.e. IAS 39 - Financial Instruments), this implies that movements in the price of
sovereign bonds will affect the insurers’ capital position directly.
However, it should be noted that, in contrast to banks, insurers rely less on sovereign
bonds as collateral for funding. Insurers are prefunded as they receive regular payments from
insurance customers. Insurers typically impose costs on their customers for lapsing an
insurance policy and are hence less prone to liquidity runs than banks.6 Although insurance
companies may need collateral for hedging operations such as interest rate swaps, direct
losses in the market value of their sovereign portfolio are likely to pose the greatest risk (see
also Bank of England, 2014; Ellul, Jotikasthira, Lundblad and Wang, 2014).
There is a trade-off between the risks and the returns connected with sovereign bonds. If
higher returns are compensation for higher risks, then the impact of new sovereign bond
purchases on insurer default risk is ambivalent. Life insurers, in particular, have, in some
jurisdictions, issued fixed nominal interest rate guarantees which they are struggling to fulfil
in the current low-interest-rate environment (Kablau and Weiss, 2014). As we base our
analysis on the market’s expectations of insurer default risk, the trade-off between risks and
returns should already be priced in, meaning that the estimated coefficients should give the
net effect of the risk and return effects.
2. Risk transmission from the banking system to insurance companies may also play a
role. Our portfolio data suggests that insurers’ exposure to bank debt is of a similar size to
4 See speech by Aldo Minucci, the Head of Italy's insurance association, ANIA (Bloomberg news, 2.7.2013). 5 This view is supported by Impavido and Tower (2014), p. 18. 6 Under certain circumstances, large-scale policy lapses cannot be ruled out completely (Feodoria and Förstemann, 2015; Foley-Fisher et al., 2015).

7
their exposure to sovereigns. A number of earlier studies find that insurers are affected by
bank risk (Bernoth and Pick, 2011; Chen, Cummins, Viswanathan and Weiss, 2014;
Hammoudeh, Nandha and Yuan, 2013). We control for the banking channel by including a
measure of domestic banking system risk. There is some indication that risk spillovers can
also occur from insurers to banks (Podlich and Wedow, 2013). We take this potential
endogeneity into account by using instrumental variables regression as a robustness check
(see Section 4). The banking channel may capture part of the (indirect) transmission of
sovereign risk to insurers, as banks are also highly exposed to the sovereigns themselves.
Insurers’ and banks’ common exposure to their domestic sovereign may reinforce risk
transmission beyond insurers’ direct holdings of sovereign bonds.
3. A large number of studies have found that the expectation of government bail-outs
creates a robust link between the credit risk of key financial intermediaries’ and the domestic
sovereign (e.g. Acharya et al., 2014; Correa, Lee, Sapriza and Suarez, 2014; Noss und
Sowerbutts, 2012). While these study findings are most significant for banks, government
guarantees for insurance companies or insurance guarantee funds7 may also lead to sovereign
risk spillovers onto insurers. If a government guarantees that it will rescue an insurance
company (or is expected to do so), then the perceived risk for insurers grows if the risk of
sovereign default increases, i.e. if bail-out capacity decreases. We will show results which
support the market’s expectations of government guarantees for insurers which the FSB has
later classified as G-SIIs, although not for all insurers. While this is a plausible result, we are
unable to provide a direct test for government guarantees. Such a test would require data on
the market’s expectations regarding bail-outs ‒ which are unavailable to us ‒ and is therefore
left to future research.
4. Insurer risk and sovereign risk are also linked through the macroeconomic
environment. Heightened sovereign risk often goes hand in hand with an economic downturn
and reduced domestic demand which, in turn, impairs private firms’ earning opportunities and
increases their probability of default (see, for example, Ciocchini, 2002; Durbin and Ng,
2005). Moreover, Acharya et al. (2014) argue that sovereign default risk increases the
expected tax burden, consequently reducing firms’ profitability and investment. Based on
these findings, our analysis includes the national stock index as a proxy for the
macroeconomic environment. Also, by explicitly comparing the vulnerability of insurance
7 Insurance guarantee funds step in to honour the covered claims of an insolvent insurer’s policyholders, similar to a deposit insurance system.
8
companies with that of other private sector firms, we control for the transmission effect
common to all firms.
5. Insurance regulation can alter the incentives for investing in sovereign bonds and
thus change insurers’ vulnerability to sovereign risk through the portfolio channel. The
Solvency I framework, which does not involve capital requirements for holding financial
assets, including government bonds, applied in most of the countries sampled over the time
period of our study (e.g. Belgium, France, Germany, Italy).8 Some countries within our
sample have introduced additional requirements, thus augmenting the Solvency I rules (the
Netherlands and the United Kingdom), while other countries have introduced risk-based
capital requirements (Switzerland, Japan, and the United States). However, in these latter
countries, sovereign bonds are generally also excluded from both capital requirements and
diversification requirements.9
6. A new regulatory framework, Solvency II, was introduced in Europe in 2016. Under
Solvency II, all assets held by insurance companies, including any holdings of sovereign
bonds, have to be marked to market. Thus, a Solvency II balance sheet reflects the expected
value of an insurer’s assets and liabilities. In addition, insurers have to hold capital to cover
unexpected losses under different risk categories (e.g. spread and concentration risks). 10
However, sovereign bonds issued by the government (or central bank) of an EU member state
are exempt from the capital requirements for spread and concentration risks. Thibeault and
Wambeke (2014) show that an investment in long-term EU government bonds could even
result in a marginal decrease in capital requirements if this investment reduces the overall
interest rate risk from a duration mismatch between assets and liabilities. The standard
formula for calculating the Solvency Capital Requirement (SCR) under Solvency II does not
require capital buffers against the risk of holding EU sovereign bonds.11 Our results question
this thinking as, according to market perceptions, insurers are affected by the riskiness of their
sovereign portfolios.
3 Dataset and empirical strategy
8 Capital requirements were generally based on the volume of premiums, technical provisions or claims incurred. 9 At least those issued by OECD countries and especially those issued by the domestic sovereign. In Switzerland, claims against AAA-rated sovereigns are exempt from diversification requirements. 10 The solvency capital requirement is calibrated in such a way that it reflects the value-at-risk at the 99.5%
quantile. 11 Under Pillar 2 of Solvency II, however, insurance companies still have to assess their overall solvency needs in relation to their specific risk profile (Own Risk and Solvency Assessment (ORSA)).

9
We construct a panel dataset with information on the credit default risk of firms in different
industries around the world. It covers insurance companies, banks, and non-financial firms
from nine countries (Belgium, France, Germany, Italy, Japan, the Netherlands, Switzerland,
the United Kingdom, and the United States) over the time period from 1 January 2008 to
1 May 2013. The countries were selected on the basis of data availability on CDS or the stock
prices of insurance companies from these countries.
Our dataset includes all types of insurers (life, reinsurance, health, property, etc.) except
insurers that provide financial guarantees (e.g. AIG or MBIA). The latter have a very special
business model which focuses on so-called “non-traditional insurance activities”, such as
bond insurance. Sovereign risk is, therefore, likely to be transmitted differently in the case of
these firms. This factor would not be covered adequately by our focus on traditional insurance
companies’ business models. Our exclusion of financial guarantee insurers reduces the sample
size from 48,630 to 41,762. Also, we exclude three financial conglomerates whose business
includes not only insurance but also banking activities to a non-negligible extent (above 10%
of their group balance sheet).12 This reduces our sample to 37,642 observations. The resulting
sample covers 26 insurance companies and 1,379 trading days (unbalanced sample). To make
sure that only quotes for frequently traded CDS are used in the analysis, we exclude any
company reporting CDS values for less than three years over our sample period (750 trading
days).13 This reduces our sample further to 33,055 observations. Owing to missing control
variables, our final sample comprises 30,986 observations (26 insurance companies, 1,379
days). We also collect CDS data for banks and non-financial firms from the aforementioned
countries. This increases our sample size to 396 private sector firms in ten industry sectors
over 1,379 trading days.14
Table 1 contains summary statistics of the variables in the different estimation samples. All
in all, our estimation sample is rather similar to the overall sample.
As a baseline, we regress risk in the insurance sector on home sovereign risk. This yields
Equation (I)
12 Some insurance groups conducted banking activities exceeding 10% of their group balance sheet total until the financial crisis. Allianz, for instance, owned Dresdner Bank before selling it to Commerzbank on 12 January 2009. Ageas was also part of a financial conglomerate (Fortis group) until October 2008. We thus exclude the initial observations for these companies. 13 We also collect data on the trading volume of each insurer CDS used. This confirms that our risk measure is based on a highly liquid market. 14 We distinguish between the following sectors as classified by the data provider, Markit: insurance, banks,
basic materials, consumer goods, consumer services, energy (including oil and gas), healthcare, industrials,
technology and telecommunications.

10
∆ ln(𝑟𝑖𝑠𝑘𝑖,𝑡) = 𝛽0 + 𝛽1∆ ln(𝑟𝑖𝑠𝑘𝑗,𝑡ℎ𝑜𝑚𝑒) + 𝛽2∆𝑙𝑛𝑋𝑗𝑡 + 𝜀𝑖,𝑡 (I)
where 𝑟𝑖𝑠𝑘𝑖,𝑡 is a measure of insurer performance at time t, 𝑟𝑖𝑠𝑘𝑗,𝑡ℎ𝑜𝑚𝑒 is domestic
sovereign risk, and 𝑋𝑗𝑡 is a matrix of country-specific control variables. We control for growth
(expectations), risk aversion in financial markets, counterparty risk in the CDS market and
risks in the national banking system. All variables are measured daily and in changes of their
logs ∆ ln(. ). The log transformation allows us to interpret the coefficients as elasticity, a
measure of sensitivity that is independent of the scale of our risk measure. That is to say, the
coefficient captures the percentage increase in insurer risk for a 1% increase in the
independent variable.
Our baseline empirical strategy follows the approach chosen by Acharya et al. (2014) in their
study on banks and sovereign risk. In this baseline specification, our independent variables
vary within the country-time dimension only. Time-invariant insurer characteristics have been
removed by the first difference transformation. In an augmented specification (II), which is
described below, we allow the independent variable to vary at the insurer level and can thus
control for country-time fixed effects.
Dependent variable
We use two alternative measures of performance for 𝑟𝑖𝑠𝑘𝑖𝑛𝑠,𝑡: CDS spreads with a five-year
maturity published by Markit and stock returns published by Bloomberg. CDS spreads
measure default risk and are the standard metric in recent literature (Longstaff, Pan, Pedersen,
and Singleton, 2011; Acharya et al., 2014).15 These papers discuss the two main reasons for
choosing CDS spreads in lieu of bond spreads: first, they better reflect risk, as CDS are
designed to insure against default risk and serve no other purpose that might affect their price;
second, the CDS market is more liquid than most bond markets. Liquidity is key, as our
analysis seeks to uncover risk transmission at a relatively high frequency (daily and weekly
data). This is ensured by excluding all companies reporting CDS values for less than three
years over our sample period (750 trading days) as discussed above.
As a robustness check, we use a measure of insurer performance, namely stock returns.
They reflect a broad set of developments, including default risk and insurer profitability. The
15We selected USD-denominated CDS quotes published by the Markit group with a five-year maturity for senior
unsecured debt, with the modified-modified restructuring clause for financial and non-financial firms and the
cumulative restructuring clause for sovereigns. These represent the conventional and most liquid terms for CDS
contracts on European reference entities, which will be the focus of our analysis. See also Bedendo and Colla (2013) and Bai and Wei (2012).

11
advantage of stock returns is that they are more widely available and thus allow us to check
whether our results hold more broadly. However, they include additional information that is
unrelated to default risk.
One great advantage of both market-based performance measures over balance sheet data
is that they capture ex ante anticipated risk exposures and are available at a high frequency.
Balance sheet measures would reflect only ex post realized risk. Our measures capture only
risks that are correctly priced by the market, however. We, thus, do not seek to uncover
hidden risks, but rather to highlight how risk passes from the sovereign sector to insurers
based on the market’s expectations.
Independent variables
Our variable of interest is 𝑘𝑠𝑜𝑣,𝑡 , which is measured on the basis of domestic sovereign CDS
with a five-year maturity (drawn from Markit).
We include country-specific measures of economic performance, market confidence and
banking risk as control variables. The national stock market index is a proxy for economic
activity and growth in the estimation (drawn from Bloomberg). Both insurers (through loss
events and premium income) and sovereigns (through tax income and social expenditure) are
influenced by real economic activity. It is, therefore, important to control for growth in order
to avoid an omitted variable bias. Market sentiment and risk aversion are measured by
implied volatility on the national stock indexes over 30 days, e.g. VDAX-NEW for Germany
and VIX for the United States (drawn from Bloomberg).16
To control for risks emanating from the banking sector, we take the weighted average of
the CDS of domestic banks, where we weight each bank by its relative size in the country.17
The current low-interest-rate environment poses a challenge for (life) insurer solvency,
especially if the insurer has promised fixed nominal interest rates to its policyholders (IMF,
2015; Kablau and Weiss, 2014). Typically, insurance companies’ vulnerability depends on the
level of interest rates as well as on the business model. Therefore, we control for any
structural differences between insurers in e.g. asset liability management, by estimating all of
the specifications in log changes. Also, we include time fixed effects that capture the common
decrease in interest rates across advanced economies during our time period. In an augmented
16 We were unable to obtain a national volatility index for Belgium, which is why we take VSTOXX in this case. 17 Size is measured by total assets. National currency-denominated CDS spreads with a five-year maturity were taken from Markit.

12
specification, we include country-time fixed effects, which also capture the time-varying
differences in insurers’ business models from country to country.18
Econometric issues
Since our data contain a substantial time series component, we check for stationarity and
find no evidence of unit roots in first differences.19
We also check for autocorrelation in our standard errors, but find little evidence of this.20
Our baseline regression does not control for auto correlation. However, the results are
unaffected if we do so.21 Apart from a correlation of shocks over time, there may be concerns
about a correlation of shocks between firms during the same time period. To take this into
account, we allow shocks to be correlated contemporaneously by clustering standard errors on
the time dimension.
Another econometric concern may arise in the presence of reverse causality. Equation (I) is
a reduced form regression, which yields the “true” causal effect of sovereigns on insurers only
if there is no reverse causality, i.e. no effect of insurance companies on both sovereign risk
and banking system risk. There are a number of a priori reasons why reverse causality would
not be expected to be a concern in this specific context.
First, traditional insurance companies have not featured prominently in the debate on
government solvency. The insolvency of Equitable Life (UK) in 2000, for instance, is seen as
an example of how policyholders can incur considerable losses without a subsequent need for
state intervention. Empirically, Billio et al. (2013) provide evidence on the Granger causality
relations between sovereigns, banks and insurers, suggesting that the predictive power of
insurer risk for sovereign risk is far weaker than the opposite relation from sovereigns to
insurers. Furthermore, the systemic risk from insurance companies arises mainly from “non-
traditional” insurance activities, such as issuing credit default swaps (Baluch, Mutenga and
Parsons, 2011; Acharya et al., 2010; International Association of Insurance Supervisors
18 For example, the duration gap between assets and liabilities varies substantially between insurers in different European countries. On average, German insurers have the largest duration gap, while the assets and liabilities of UK insurers are matched quite well (EIOPA, 2014). 19 We perform the Fisher unit root test for heterogeneous mixed panel data. This assumes that there is no cross-
sectional dependence within the dataset. Our analysis has no independent cross sections as several insurance
companies are from the same country, which means that they are related and exposed to common shocks. In
order to mitigate this problem, we demean our time series as suggested by Levin, Lin, and Chu (2002). 20 Autocorrelation in the errors is below 0.2 and insignificant from the second lag onwards in all time series. 21 As a robustness check, we allow for autocorrelated errors of up to one month (i.e. 20 trading days) (see
Driscoll and Kraay (1998)). The results (available upon request) remain practically unchanged.

13
(IAIS), 2013). Our analysis, however, focuses on traditional insurance companies and we
exclude monoliners that typically engage in credit protection.
Second, our dependent variable is measured at the micro level. We consider individual
insurance companies which are less likely to impact the macro level, such as the overall
banking system and the sovereign.
Finally, we perform instrumental variables regressions to test the robustness of our results.
Following Bedendo and Colla (2013), we use average foreign sovereign risk as the instrument
for domestic sovereign risk and, similarly, foreign banking system risk as the instrument for
domestic banking system risk. This eliminates the concern that our observed link between
insurers and sovereigns is due to implicit guarantees by their home governments. Our
instrument is the average risk in the largest sovereign bond markets and banking systems.22
This instrument is relevant since foreign risks are correlated with domestic risks through
contagion effects on the sovereign and banking CDS markets.
With regard to the exogeneity of the instrument, one concern is that insurers are directly
exposed to foreign sovereign risk, most notably through their foreign sovereign bond
holdings. However, reverse causality is unlikely to bias our results in this case, since
individual insurers hold only a small share of outstanding foreign sovereign bonds. AXA
holds the largest market share, it has 4% of Irish sovereign bonds in one quarter. It is thus
unlikely that insurers cause fluctuations in the foreign sovereign bond market. We perform
overidentification tests to corroborate the argumentation. Another concern is that our
instrumental variable approach will give a combined “reduced form” effect of the portfolio
channel and the risk transmission channel. This is because insurers are affected directly by
foreign sovereign risk through their bond holdings. As an additional robustness test, we use
alternative instruments. First, we use a weighted measure of foreign sovereign risk that
downweights the sovereigns to which an insurer is exposed directly. Second, we use a
measure of political uncertainty as reflected in Google searches for the term “country
government”.23 Both instruments plausibly do not affect insurer risk directly. Owing to data
availability (e.g. portfolio data), we have to run these additional tests on a reduced sample and
thus standard errors increase. Point estimates for home sovereign risk in the second stage
22 For sovereign bonds, these are US, JP, DE, IT, FR, UK, ES, CA, NL KR. In terms of banking systems, we
take those of the largest non-developing countries, namely US, CA, BE, CH, DE, FR, UK, IT, NL, ES, JP and
AU. 23 To measure political uncertainty we collate Google searches for the term “country government” using Google
Stats. During periods of high political uncertainty, the number of search queries rises. This allows us to construct
a country-specific high frequency dataset of political risks. The search data are available at weekly frequency.
We thus run the regressions at the weekly level.

14
remain very similar, albeit not always significant. A final concern is omitted variable bias.
General market risk sentiment or shocks to global economic output may impact foreign
sovereign risk and insurer risk simultaneously. Therefore, we explicitly control for stock
index volatility and stock index developments in order to capture these common factors.
Overall, our robustness tests confirm that home sovereign risk plays an important role in
insurance industry risk.
Testing for transmission channels
In order to analyze the transmission channels, we introduce additional variables to
Equation (I). The portfolio channel captures exposure to (domestic and foreign) sovereign risk
through insurers’ sovereign bond holdings. We construct a measure of a sovereign portfolio’s
riskiness by weighing each sovereign CDS with its relevant sovereign share in an insurer’s
portfolio, i.e.
𝑅𝑖𝑠𝑘𝑖𝑛𝑒𝑠𝑠 𝑜𝑓 𝑠𝑜𝑣𝑒𝑟𝑒𝑖𝑔𝑛 𝑝𝑜𝑟𝑡𝑓𝑜𝑙𝑖𝑜 = ∑𝑠𝑜𝑣𝑏𝑜𝑛𝑑𝑠𝑖𝑗𝑡
𝑡𝑜𝑡𝑎𝑙𝑎𝑠𝑠𝑒𝑡𝑠𝑖𝑡∗ 𝑟𝑖𝑠𝑘𝑗,𝑡𝑎𝑙𝑙 𝑠𝑜𝑣𝑒𝑟𝑒𝑖𝑔𝑛𝑠 𝑗 .
where 𝑠𝑜𝑣𝑏𝑜𝑛𝑑𝑠𝑖𝑗𝑡 refers to insurer i’s holdings of bonds issued by sovereign j (in USD) and
𝑟𝑖𝑠𝑘𝑗,𝑡 refers to the CDS quote for the same sovereign j. We divide the sovereign bond
holding by total assets instead of the insurer’s overall sovereign bond portfolio in order to
differentiate between insurers with a large or small overall sovereign bond portfolio relative
to their total assets.
This yields Equation (II):
∆ ln(𝑟𝑖𝑠𝑘𝑖,𝑡) = 𝛽0 + 𝛽1∆ ln (𝑟𝑖𝑠𝑘𝑗,𝑡ℎ𝑜𝑚𝑒
) + 𝛽2∆𝑙𝑛𝑋𝑗,𝑡 + 𝛽4 ∑ (𝑠𝑜𝑣𝑏𝑜𝑛𝑑𝑠𝑖,𝑗,𝑡
𝑡𝑜𝑡𝑎𝑙𝑎𝑠𝑠𝑒𝑡𝑠𝑖,𝑡𝑎𝑙𝑙 𝑠𝑜𝑣𝑒𝑟𝑒𝑖𝑔𝑛𝑠 𝑗 ∗ ∆ ln(𝑟𝑖𝑠𝑘 𝑗,𝑡)) + 𝜀𝑖,𝑡 (II)
where the subscript sov denotes the domestic sovereign and j all other sovereigns. All other
variables and econometric specifications are equivalent to those in Equation (I). The new
measure of portfolio risk here is institution-specific. This will allow us to control for country-
specific time effects in a robustness check.
As we are analyzing market behaviour, we use the market estimate of an insurer’s
exposure as provided by J.P. Morgan (J.P. Morgan Cazenove, 2014) rather than
administrative data. J.P. Morgan regularly publishes estimates of the sovereign bond holdings
of 16 large European insurers (see Annex for a list of insurers). These data are based on the
insurance companies’ own financial reports and are available quarterly from Q4 2009 through
Q1 2013.
In order to test for international versus domestic transmission of sovereign risk, we
separate the overall sovereign portfolio into its domestic and foreign parts, constructing the

15
riskiness of both parts of the portfolio separately. In this specification, the riskiness of the
home sovereign portfolio is simply the home sovereign bonds’ share of total assets multiplied
by the CDS of the home sovereign. The riskiness of the foreign sovereign portfolio is
constructed in a similar way to the riskiness of the overall sovereign portfolio, but excludes
the domestic sovereign.
Finally, we create a G-SII dummy that differentiates between insurers which the FSB
(2013) classifies as systemically important and those which it does not. We will test whether
the transmission of sovereign risk is the same for both groups.
4 Estimation and results
4.1 Does sovereign risk transmit to risk in insurance?
Table 2 reports the results of estimating specification (I). In column 1, we estimate
Equation (I) without any controls. The coefficient thus reflects the correlation between
insurance risk and the domestic sovereign. We find a highly significant positive elasticity. A
10% rise in sovereign risk leads to a roughly 2% rise in insurance sector risk. Column 2
controls for the national volatility index and stock market movements. The coefficients on the
volatility index (stock market index) show the expected positive (negative) sign and reduce
the effect of sovereign risk on insurer risk.
In column 3, we control for risks in the banking sector. Including controls for the banking
sector has two effects. First, as discussed above, the banking sector could be an omitted
variable, which needs to be introduced for correct estimation. At the same time, however the
proxies for the domestic banking system may also capture an indirect transmission channel
from sovereigns to insurers, as discussed in Section 2. Therefore, the estimated direct impact
of home sovereign CDS on insurer CDS (=0.07) in column 3 can be interpreted as a lower
bound of the total impact. The transmission of sovereign risk to insurers may also be captured
by the banking channel due to banks’ and insurers’ common exposure to sovereign risk, as
well as to other asset classes. Similarly, bank bonds are roughly as important in insurers’
balance sheets as sovereign bonds are (J.P. Morgan Cazenove, 2014). Indeed, we find that the
stability of the domestic banking system is important for insurer stability. A 10% increase in
banking risk increases a domestic insurer’s default risk by 4%. This finding is in line with
previous studies, which found a significant transmission of banking risk to the insurance
sector (Bernoth and Pick, 2011; Chen, Cummins, Viswanathan, and Weiss, 2014;

16
Hammoudeh, Nandha, and Yuan, 2013). We will control for the potential endogeneity
between insurer CDS and banking system CDS by using instrumental variables.
In column 4, we use time fixed effects to absorb factors that are common to all insurers.
What remains is a conservative estimate of risk contagion from the sovereign to the domestic
insurer, as the average transmission at a given date will be absorbed by the time fixed effects.
As expected, the elasticity decreases further in economic terms. However, even at this lower
bound, the elasticity remains significant at the 1% confidence level.
These findings prove robust to a number of different specifications. We perform the above
regression in level changes rather than log changes and using weekly data instead of daily
quotes (not reported). These results are in line with what we report above. Furthermore, we
estimate Equation (I) with two alternative dependent variables: the log change in an insurer’s
stock price and in an insurer’s expected default frequency (EDF).24 The results are reported in
Table 3 and confirm our findings based on CDS spreads. An increase in domestic sovereign
risk is associated with a decrease in the insurer stock price and an increase in the EDF.25
Finally, we extend our time period to include data from 1 January 2006 onwards so as not to
focus exclusively on the crisis period.26 The coefficient on home sovereign CDS becomes
slightly smaller when pre-crisis data are included, but remains positively significant at the 1%
level (not reported). We test for differences in risk transmission over time in Section 4.4.
IV Estimation
To address endogeneity concerns, we perform an instrumental variables regression (as
described in the previous section) with foreign sovereign CDS and banking CDS as
instruments for domestic sovereign risk and banking risk respectively. Our instruments are
relevant with highly significant F-statistics in the first stage regressions. Weak identification
tests, as proposed by Angrist and Pischke (2010), confirm the relevance of our instruments
above the conventional threshold.
24 We use Moody’s KMV EDF over a one-year horizon as a measure of the probability that a company will
default within the next year. 25 In this regression, we exclude the domestic stock index as an explanatory variable, as it often bundles the
respective insurer stock prices into a single element. 26 Owing to liquidity concerns regarding the CDS market prior to 2008, we use the extended time series as a
robustness check only.

17
In order to test the exogeneity of our instruments formally, we run an overidentification
test. We include the interbank lending rate to satisfy the overidentification restriction.27 The
overidentification test is not rejected at the 5% significance level. We can, thus, be more
confident that our IV estimates identify the transmission effect.
Table 4 reports the results of the instrumental variables regression. As in the OLS
regressions, we find that domestic sovereign risk has a strong and significant effect on
insurers. This also holds true if we introduce the interbank rate as an additional instrument
(column 4).
One interesting finding is that the coefficient of interest on domestic sovereign risk
increases in IV estimation relative to our OLS estimates: it is twice as large as in the baseline
column 3 of Table 2. At the same time, the effect emanating from the banking system also
increases, while the effect assigned to wider market developments decreases substantially.
The changes in coefficients relative to the OLS setting are in line with a negative effect of
insurers on sovereigns and banks in the structural equation. This implies that our reduced
form regression above underestimates the effect which sovereign risk has on insurers. One
interpretation is that insurers absorb risks by providing stable liquidity in times of market
stress (see Bank of England (2014) for an illustration of this point).
4.2 Are insurers different to banks and non-financial firms?
Sovereign default risk can create problems for any private sector firm, not just insurance
companies. As discussed above, such risk spillovers may occur for a number of reasons. We
would, therefore, like to know whether insurers are special when it comes to sovereign risk.
We re-estimate specification (I) for insurers, banks and non-financial firms from the same
nine countries (Belgium, France, Germany, Italy, Japan, the Netherlands, Switzerland, the
United Kingdom and the United States) and over the same time period between 1
January 2008 and 1 May 2013. This increases our sample size to 393 private sector firms
from ten industry sectors over 1,379 trading days. We include all firms with non-missing CDS
pricing data for 750 trading days. The sample is composed of the following: 7% insurance
27 Since short-term liquidity is less of a concern for insurers, movements in this rate should not affect the
solvability of insurers directly. It does, however, have considerable effects on banks’ funding costs and, thus, on
bank default risk.

18
companies, 20% banks and 73% non-financial firms. As we include bank risk as a dependent
variable, we no longer control for average banking system CDS on the right-hand side in
order to avoid correlation by construction. All other variable definitions remain the same as
described in Section 3.
Table 5 reports the results of these regressions. In the pooled regression (column 1), the
sovereign risk estimate is about 0.08 and highly statistically significant. We, thus, conclude
that there is risk transmission from the domestic sovereign to private firms in general. This
average effect disguises substantial differences across industries, however. In column 2, we
use insurance companies as a baseline category and introduce interaction effects between
domestic sovereign risk and an identifier for banks and non-financial firms, respectively.
Column 2 of Table 5 shows that risk transmission to non-financial firms is significantly lower
than transmission to the insurance sector. This finding is not driven by specific non-financial
sectors. In column 3, we use a more detailed breakdown by sector and find that insurers are
more affected than any non-financial sector. In terms of economic magnitude, domestic
sovereign risk has an impact on insurers which is about twice as large (coefficient = 0.130) as
that on non-financial firms (coefficient = 0.130 [baseline effect] - 0.066 [interaction effect] =
0.064; see column 2 of Table 5).
In a comparison between banks and insurers, we do not find a significant difference in
these financial institutions’ vulnerability to sovereign risk (column 2 of Table 5). Given the
importance of sovereign bonds for bank funding (see, for example, Correa, Lee, Sapriza, and
Suarez, 2014; International Monetary Fund, 2012) and the value of implicit state guarantees
for banks, one might have expected banks to be more vulnerable than insurers. However,
insurers also rely on sovereign bonds as collateral for swaps and they hold a larger share of
their assets in sovereign bonds than banks do. In column 4, we add time fixed effects to
account for common developments across firms and the results still hold.
Overall, we find that banks and insurers are affected to a similar degree by domestic
sovereign risk, while non-financial firms are significantly less affected. In what follows, we
analyze the additional transmission channels that explain this gap between insurers and non-
financial firms.
4.3 Taking a closer look at risk transmission channels
In this section, we test for the transmission channels from sovereign risk to the insurance
sector which were discussed in Section 2 and which may explain the greater vulnerability of
insurers compared with non-financial firms. We start with a description of insurers’ sovereign

19
bond portfolios. We then formally test the importance of the portfolio channel using the
sovereign bond portfolio figures published by J.P. Morgan. These are available only from
Q4 2009 to Q1 2013, and for 16 European insurers. We, therefore, perform the subsequent
analysis with this reduced sample.
Descriptive facts concerning insurers’ sovereign portfolios
Overall, sovereign bond investments play a sizeable and increasing role in the balance
sheets of European insurance companies, amounting to around 22% of total assets in Q1 2013
(see Figure 2), which is significantly more than in the balance sheets of European banks
(approximately 11% of total assets).28
Interestingly, the heterogeneity between countries is high. At the country level, the average
importance of sovereign bonds is lowest for Dutch and UK insurers at 10% of total assets and
highest for Italian and Belgian insurers at 35% of total assets. There is also within-country
heterogeneity between insurers. We make use of this in the regressions.
The importance of home sovereign bonds in insurers’ balance sheets stands out when
considering their sovereign bond portfolios (see Figure 2): domestic sovereign bonds are the
most important item, with an average share of 33%. If there were no home bias in sovereign
bond portfolios, we would expect the average share of domestic sovereign bonds to equal
1/number of sovereigns j = 1/11, i.e. 9%. Taking unweighted averages across all countries
should mitigate the size effects of different countries, which could impact their weight in the
sovereign portfolio. A study of the incentives for this home bias (33% actual portfolio weight
of home sovereigns relative to 9% in the benchmark) is an interesting avenue for future
research. One reason may be asset-liability management with respect to currencies. However,
this argument does not hold for a currency union like the euro area.
We take a closer look at diversification in insurers’ sovereign bond portfolios given the
strong home bias. To measure portfolio concentration, we use the Herfindahl-Hirschman-
Index (HHI). The HHI is calculated as the sum of the squared shares of sovereign j in the total
sovereign portfolio. In our case, the index can, in theory, range from 0.09 (perfectly
diversified) to 1 (completely concentrated). 29 The average concentration index increased
28 See EBA (2011). 29 We have exposure information for 11 sovereigns; the HHI may lie between 0.09 (equal shares for all
sovereigns) and 1 (full concentration on only one sovereign)

20
continuously, from 0.3 in Q4 2009 to 0.4 in Q1 2013. Moreover, heterogeneity is high as the
HHI ranges from 0.2 (10% quantile) to 0.9 (90% quantile) in Q1 2013.
One remarkable event within our sample period is the restructuring of Greek debt in early
2012. This induced losses on the part of private investors, including insurance companies. US
insurance companies, for instance, realized losses amounting to $859.5 million due to the
Greek bond exchange (NAIC, 2013). Before turning to the econometric analysis of the
portfolio channel, we take a first descriptive look at whether the market differentiated
between insurers with and insurers without exposure to the Greek sovereign. Figure 3 shows
that the market charged higher CDS premiums for those insurers that had a high exposure to
the Greek sovereign at the time of the restructuring event (see the red horizontal line in Figure
3). The CDS price for the highly exposed insurers increased markedly from mid-2011
onwards and became more volatile than that of the other insurers. However, in the period of
the restructuring announcement, the highly exposed insurers’ risk decreased. This descriptive
analysis does not take into account any determinants of insurer risk other than Greek debt
exposures. We next turn to the empirical analysis of the portfolio channel’s impact on
changes in insurer risk.
Testing the portfolio channel
To test the portfolio channel of sovereign risk transmission, we estimate Equation (II). In
Table 6, column 1 shows that an insurer’s default risk increases significantly with growing
riskiness in the sovereign bond portfolio. In column 2, we include country-time fixed effects
to check the robustness of this finding. The fixed effects capture the unconditional effect of
domestic sovereign risk and all other macro variables on insurers, but the impact of sovereign
portfolio risk can still be estimated since it is insurer-specific. Importantly, the portfolio
channel remains significant.
Overall, the results confirm that the market takes account of the investment risk in an
insurer’s balance sheet or, more specifically, the credit risk involved in sovereign bond
holdings. The major insurance regulations, such as Solvency I in Europe, have not
acknowledged these connections. The traditional regulatory view is that insurance risk is
driven by insurance policy-related risk on the liability side and not asset-related risk (Schinasi
(2005), page 266). The introduction of Solvency II in 2016 changed the regulatory treatment
of investment risk in Europe. Our results underline the importance of taking asset risk into
account. Our findings highlight the fact that sovereign bonds cannot be considered to be risk

21
free. However, sovereign bonds issued by EU countries remain largely exempt from capital
requirements under Solvency II.
In column 3, we split the overall sovereign bond portfolio into its domestic and foreign
parts. The domestic part is measured as the home sovereign bond holding share of total assets
multiplied by the home sovereign CDS; its coefficient is positive but insignificant. The
finding that larger home sovereign bond holdings do not significantly increase an insurer’s
default risk is surprising at first. However, it may simply reflect the fact that the sample
covers mainly insurers from stable countries where domestic sovereign risk does not vary
very much. Ideally, we would have included a greater number of insurers from countries that
experienced a sovereign debt crisis, such as Greece, Ireland or Portugal, but no CDS and/or
portfolio data were available for insurers from those countries. Thus, Italy is the only stressed
country included in this regression and relatively stable countries, such as Germany, the UK
and Switzerland, dominate the sample. In line with this explanation, we find that foreign
sovereign bond holdings, which include bonds from stable countries as well as from countries
in crisis, are an important driver of insurer default risk. Increases in the riskiness of the
foreign sovereign bond portfolio significantly amplify an insurer’s default risk. Sovereign risk
thus spills over internationally through insurers’ cross-border sovereign bond holdings.
Implicit government guarantees
In Table 5, we show that, on average, insurers are more susceptible to domestic sovereign
risk than non-financial firms are. In the previous section, we rejected the hypothesis that
insurers’ holdings of domestic sovereign bonds are an explanation for why insurers are more
vulnerable to domestic sovereign risk. Next, we test whether the nexus between the insurance
sector and sovereign risk is stronger for certain types of insurers. In column 4 of Table 6, we
differentiate between insurers that have been classified as systemically important by the
Financial Stability Board in July 2013 (FSB, 2013) and those who have not. The FSB based
its decision regarding the systemic importance of insurers on five criteria (size, global
activity, interconnectedness, non-traditional and non-insurance activities and substitutability;
see IAIS, 2013). It should be noted that the FSB’s decision was taken after the end of our
sample period. We, thus, do not test for the effect of the announcement. Instead, we analyze
whether the systemically important insurance companies’ CDS spreads reacted more
sensitively to sovereign risk than those of others before the FSB decision was made public.
Indeed, the elasticity of insurer risk to sovereign risk is 0.17 percentage point higher for
systemically important insurers. This is a substantial difference given the baseline effect of

22
around 0.05 (column 4 of Table 6). The difference between insurers classified as G-SII and
other insurers is not driven by variations in their sovereign bond exposures, however, as we
simultaneously control for the riskiness of their sovereign bond portfolios. As we allow for
greater sensitivity to sovereign risk on the part of systemically important insurers, the baseline
effect which domestic sovereign risk has on insurer risk decreases to 0.05 and becomes
similar in magnitude to the effect which sovereign risk has on non-financial firms (column 2
of Table 5).
All in all, after controlling for sovereign bond exposure, we find that systemically
important insurers are more closely linked to their home sovereign than other insurers are.
This is not direct evidence for the existence of implicit guarantees but provides a clue that
should be explored further in future research.
4.4 Heterogeneity across countries and over time
Our panel dataset, which covers various countries, allows us to test for heterogeneity in the
transmission of sovereign risk between countries and over time. The euro area is a special
case during our sample period from 2008 until May 2013, since several countries experienced
a severe sovereign debt crisis in that time. Therefore, in Table 7, we look at the transmission
of sovereign risk within the euro area in more detail. Column 1 shows that insurers located in
a euro area country were more sensitive to sovereign risk than insurers located in other
countries. Next, we study whether the level of sovereign risk plays a role in risk transmission
to domestic insurers. We do so by including an interaction effect between the log changes of
home sovereign risk and the level of home sovereign risk. The results are presented in column
2 and confirm that the elasticity of insurer risk is higher in the crisis countries than in the
relatively safe countries. Thus, the transmission of sovereign risk to insurers is heterogeneous
across countries.
Next, we investigate changes in the sovereign-insurer relationship over time. We closely
follow Acharya et al. (2014) who study sovereign-banking spillovers during the pre-bailout,
bailout and post-bailout periods of the recent financial crisis. For comparability purposes, we
closely follow the specifications of Acharya et al. (2014) and regress insurer risk on domestic
sovereign CDS, domestic stock index volatility and domestic banking system CDS, including
time fixed effects and standard errors clustered at the company level (see Table 3 in Acharya
et al., 2014). An augmented specification additionally controls for insurer fixed effects and
the effects of insurer-specific parameters on domestic stock index volatility and domestic
banking system CDS (as in Acharya et al., 2014).

23
Columns 1 and 2 of Table 8 give the results for the pre-bailout period (1 January 2007 to
15 September 2008). Insurer risk is not significantly affected by domestic sovereign risk
during this period, which is in line with the findings of Acharya et al. (2014) regarding banks.
The bailout period starts on 16 September 2008, when the US government decided to bail out
AIG, and runs until 21 October 2008 (following Acharya et al., 2014). In contrast to bank risk
(Acharya et al., 2014, Table 3, columns 3 and 4), however, insurer risk is not significantly
reduced by sovereign risk during the bailout period, but remains insignificant. This arguably
shows that the traditional insurers on which we focus did not receive a bailout from their
domestic governments. These insurers, thus, did not transfer part of their risk to domestic
sovereigns like banks did (Acharya et al., 2014). Finally, the post-bailout period runs from 21
October 2008 to 30 April 2011, for consistency with Acharya et al. (2014); the estimation
results are given in columns 5 and 6 of Table 8.
In addition to the financial crisis, the European sovereign debt crisis may have affected the
relationship between sovereign risk and insurer risk. Bijlsma and Vermeulen (2016) find that
Dutch insurers showed a marked flight to quality behaviour in their sovereign bond portfolios
during the height of the sovereign debt crisis. The flight to quality behaviour disappeared,
however, after ECB President Mario Draghi’s speech in mid-2012. We, thus, look at the post-
bailout period in greater detail and focus exclusively on euro area insurers. We distinguish
between the post-bailout but pre-sovereign debt crisis period (October 2008 to 2010), the
height of the sovereign debt crisis (2010 to mid-2012) and the period following Mario
Draghi’s speech in London, in which he announced that the ECB would do “whatever it
takes” to protect the euro within the limits of its mandate, and the subsequent announcement
of outright monetary transactions (OMT) (from 26 July 2012 to May 2013). Column 3 of
Table 7 shows that the transmission of home sovereign risk to insurer risk in the euro area did
not change significantly between these time periods.
Thus, while the market did not price domestic sovereign risk into insurer default risk prior
to the financial crisis, sovereign risk has increased insurer CDS since the bailout period and
these transmission effects have remained fairly stable since then.
5 Conclusion
In this paper, we have addressed the following questions: is domestic sovereign risk
transmitted to insurer default risk?; does sovereign risk affect insurers differently to other
sectors of the economy (i.e. banks and non-financial firms)?; which transmission channels
play a role?

24
We find a strong and highly significant link between sovereign default risk and risks in the
insurance sector. Such transmission has been found for a number of different sectors. We
document, however, that there are major differences in the various sectors’ vulnerability to
sovereign risk. Insurers are affected by domestic sovereign risk to a similar extent as banks,
but significantly more than non-financial firms.
We investigate why such differences arise and find that sovereign risk has a greater impact
on insurance companies which the FSB has subsequently classified as global systemically
important insurers (G-SII). This finding indicates that government guarantees may play a
bigger role for some insurers.
We also find that the riskiness of the sovereign bond portfolio is an important determinant
of an insurer’s default risk, even after controlling for time-country fixed effects. As data are
available mainly for insurers from relatively stable countries, we find holdings of foreign
sovereign bonds (which include bonds from crisis countries) to be more important than
holdings of domestic sovereign bonds. Thus, sovereign risk spills over internationally through
insurers’ cross-border bond holdings. We descriptively document a high concentration in
insurers’ sovereign bond portfolios as measured by the Herfindahl-Hirschman-Index.
Importantly, the concentration (along with the share of domestic bonds) has increased
substantially since the beginning of 2010. Also, heterogeneity between insurers is high, with
Italian insurers being particularly exposed to the home sovereign. The incentives behind this
home bias may be an interesting avenue for future research.
Finally, we take a more detailed look at heterogeneity across countries and over time. We
find that risk transmission to insurers is more prolific in high-risk countries. Similarly, the
link between the sovereign and domestic insurers is stronger in the euro area than in other
regions. While the market did not price domestic sovereign risk into insurer default risk prior
to the financial crisis, it recognized the risk of spillovers after the bailout period; the
transmission effects from sovereign to insurers have remained fairly stable since then.
Overall, our results underline the fact that sovereign bonds should not be regarded as a risk-
free investment. We provide a detailed analysis of how sovereign risk is transmitted to insurer
default risk and find the asset portfolio channel to be important. Hence, the market generally
takes sovereign bond portfolio risk into account when assessing insurer default risk. Against
this backdrop, our results challenge the regulatory treatment of sovereign bonds in most
jurisdictions, including the Solvency II regulations in Europe, which exempt EU sovereign
bonds from the credit risk and concentration risk modules when calculating the solvency

25
capital requirement. Future research is needed to better understand the investment incentives
induced by insurance regulation and their general equilibrium effects.

26
References Acharya, V. V., Biggs, J., Le, H., Richardson, M., Ryan, S., Cooley, T. F., & Walter, I., 2010.
“Systemic Risk and the Regulation of the Insurance Industry.” In: Regulating Wall Street: The Dodd-Frank Act and the New Architecture of Global Finance, by Acharya, Cooley, Richardson and Walter, 241-300. Holboken, New Jersey: John Wileys & Sons.
Acharya, V.V., Drechsler, I., Schnabl, P., 2014. "A Pyrrhic Viictory? Bank Bailouts and Sovereign Credit Risk." Journal of Finance 69 (6), 2689-2739.
Alter, A., Beyer, A., 2014. The dynamics of spillover effects during the European sovereign debt turmoil. Journal of Banking and Finance 42, 134-153.
Altera, A., Schüler, Y.S., 2012. "Credit spread interdependencies of European states and banks during the financial crisis." Journal of Banking and Finance 36 (12), 3444-3468.
Angrist, J., Pischke, J.-S., 2010. "The credibility revolution in empirical economics: How better research design is taking the con out of econometrics." National Bureau of Economic Research Working Paper, No. w15794.
Baluch, F., Mutenga, S., Parsons, C., 2011. “Insurance, Systemic Risk and the Financial Crisis.” The Geneva Papers, 126-163.
Bank of England, 2014. "Procyclicality and structural trends in investment allocation by insurance companies and pension funds." Discussion Paper by the Bank of England and the Procyclicality Working Group, July 2014.
Battistini, N., Pagano, M., Simonelli, S., 2014. "Systemic Risk, Sovereign Yields and Bank Exposures in the Euro Crisis." Economic Policy, Vol. 29, Issue 78, 203-251.
Bedendo, M., Colla, P., 2013. "Sovereign and corporate credit risk: Spillover effects in the Eurozone." CEPR Working Paper.
Bernoth, K., Pick, A., 2011. "Forecasting the Fragility of the Banking and Insurance Sector." Journal of Banking & Finance 35 (4), 807-818.
Bijlsma, M., Vermeulen, R., 2016. "Insurance Companies’ Trading Behaviour during the European Sovereign Debt Crisis: Flight Home or Flight to Quality?" Journal of Financial Stability 27, 137-154.
Billio, M., Getmansky, M., Gray, D., Lo, A.W., Merton, R.C., Pelizzon, L., 2013. "Sovereign, Bank, and Insurance Credit Spreads: Connectedness and System Networks." Sloan School of Management Working Paper, Massachusetts Institute of Technology, (forthcoming).
Buch, C.M., Kötter, M., Ohls, J., 2016. "Banks and sovereign risk: A granular view." Journal of Financial Stability 25, 1–15.
Bühler, W., Prokopczuk, M., 2010. "Systemic Risk: Is the Banking Sector Special?" Chen, H., Cummins, J.D., Viswanathan, K.S., Weiss, M.A., 2014. "Systemic Risk and the
Interconnectedness Between Banks and Insurers: An Econometric Analysis." The Journal of Risk and Insurance 81 (3), 623-652.
Ciocchini, F.J., 2002. "Country risk and the interest rate on private debt." Universidad Católica Argentina Working paper.
Correa, R., Lee, K.-H., Sapriza, H., Suarez, G.A., 2014. "Sovereign credit risk, banks' government support, and bank stock returns around the world." Journal of Money, Credit and Banking 46.s1, 93-121.

27
De Bruyckere, V., Gerhardt, M., Schepens, G., Vander Vennet, R., 2013. "Bank/sovereign risk spillovers in the European debt crisis." Journal of Banking & Finance 37 (12), 4793-4809.
Driscoll, J.C., Kraay, A.C., 1998. "Consistent Covariance Matrix Estimation With Spatially Dependent Panel Data." Review of Economics and Statistics 80 (4), 549-560.
Durbin, E., Ng, D., 2005. "The sovereign ceiling and emerging market corporate bond spreads." Journal of International Money and Finance 24(4), 631-649.
Ellul, A., Jotikasthira, C., Lundblad, C.T., Wang, Y., 2014. "Mark-to-market accounting and systemic risk: Evidence from the insurance industry." Economic Policy 29 (78) , 297-341.
Ernst & Young, 2011. "Measure by measure, Synchronising IFRS 9 and IFRS 4 Phase II for Insurers." http://www.ey.com/Publication/vwLUAssets/Measure_by_Measure/$FILE/Insurance_IFRS_9.pdf (accessed 10 January 2014).
European Banking Authority, 2011. “2011 EU-wide stress test results.” http://www.eba.europa.eu/risk-analysis-and-data/eu-wide-stress-testing/2011/results (accessed 15 July 2015).
European Banking Authority, 2011. "EU Capital exercise final results." https://www.eba.europa.eu/risk-analysis-and-data/eu-capital-exercise/final-results (accessed 21 July 2015).
European Insurance and Occupational Pensions Authority, 2014. "Insurance Stress Test 2014."
Feodoria, M., Förstemann, T., 2015. "Lethal lapses: How a positive interest rate shock might stress German life insurers." Bundesbank Discussion Paper Series 12/2015.
Financial Stability Board, 2013. "Global systemically important insurers (G-SIIs) and the policy measures that will apply to them." https://www.financialstabilityboard.org/publications/r_130718.pdf (accessed 15 October 2014).
Foley-Fisher, N., Narajabad, B., Verani, S.H., 2015. "Self-fulfilling Runs: Evidence from the U.S. Life Insurance Industry." Finance and Economics Discussion Series 2015-032. https://www.federalreserve.gov/econresdata/feds/2015/files/2015032pap.pdf (accessed 5 January 2017).
Gerlach, S., Schulz, A., Wolff, G.B., 2010. "Banking and Sovereign Risk in the Euro Area." Deutsche Bundesbank Discussion Paper Series 09/2010.
Hammoudeh, S., Nandha, M., Yuan, Y., 2013. "Dynamics of CDS spread indexes of US financial sectors." Applied Economics 45 (2), 213-223.
Impavido, G., Tower, I., 2014. "How the Financial Crisis Affects Pensions and Insurance and Why the Impacts Matter." IMF Working Paper 09/151.
Insurance Europe, 2014. "European Insurance - Key Facts." International Association of Insurance Supervisors, 2011. "Insurance and Financial
Stability." International Association of Insurance Supervisors, 2013. "Global Systemically
Important Insurers: Initial Assessment Methodology." International Monetary Fund, 2012. "Global Financial Stability Report." April 2012. International Monetary Fund, 2015. "Global Financial Stability Report." April 2015. International Monetary Fund, 2016. "Global Financial Stability Report." April 2016. J.P. Morgan Cazenove, 2014. "Europe Equity Research - European Insurance." 2009-
2014.

28
Kablau, A., Weiss, M., 2014. "How is the low-interest-rate environment affecting the solvency of German life insurers?" Deutsche Bundesbank Discussion Paper Series 27/2014.
Levin, A., Lin, C.-F., Chu, C.-S.J., 2002. "Unit Root Tests in Panel Data: Asymptotic and Finite Sample Properties." Journal of Econometrics 108 (1), 1-24.
Longstaff, F.A., Pan, J., Pedersen, L.H., Singleton, K.J., 2011. "How sovereign is sovereign credit risk?" American Economic Journal: Macroeconomics 3(2), 75-103.
Minucci, Aldo, 2013. Speech, Bloomberg news, July 2, 2013. National Association of Insurance Commissioners NAIC, 2013. "Foreign Exposure in the
U.S. Insurance Industry – Update." Capital Markets Bureau Special Reports. http://www.naic.org/capital_markets_archive/130131.htm (accessed 18 January 2017)
Noss, J., Sowerbutts, R., 2012. "The implicit subsidy of banks." Bank of England Financial Stability Paper, 15.
Podlich, N., and Wedow, M., 2013. "Are insurers SIFIs?" Applied Economics Letters, 20 (7), 677-681.
Schinasi, G.J., 2005. “Safeguarding financial stability: theory and practice.” Washington, D.C.: International Monetary Fund.
Thibeault, ., Wambeke, M., 2014. "Regulatory impact on banks' and insurers' investments." Vlerick Business School Working Paper.
Wilson, T.C., 2013. "Risk Management in the Face of Risky Sovereign Debt: Four Observations ." BIS Paper No. 72w.

29
Annex
List of life insurers ACE Ltd
*Aegon N.V.
*Ageas N.V.
*Allianz AG
Allstate Corp
Aon Corp
*Assicurazioni Generali S p A
*Aviva plc
*AXA
Genworth Financial Inc
Groupe des Assurances Mutuelles Agricoles
*Hannover Re AG
*Legal & Gen Gp plc
Liberty Mutual Group Inc
MetLife Inc
*Munich Re
Old Mutual plc
Prudential Financial Inc
*Prudential PLC
*Royal & Sun Alliance Insurance Group plc
*SCOR
Sompo Japan Insurance Inc
*Standard Life Assurance Co
*Swiss Life Insurance & Pension Co
*Swiss Re Co
*Zurich Insurance Co Ltd
* Relevant information on sovereign bond portfolios is available in the J.P. Morgan Cazenove (2014) dataset

30
Figure 1: CDS spreads of insurers and sovereigns
CDS spread movements of the insurance sector (blue) and the sovereign (red) in
Germany, Italy, the UK, and the USA in the time period from 1 January 2008 to
1 May 2013 in basis points (Source: Markit).
Figure 2: Importance of sovereign bond portfolio
Share of sovereign bonds to total assets (blue line) and domestic sovereign bonds to total
assets (red line) of the 16 insurance companies in our sample (unweighted averages) in the
time period from 1 October 2009 to 1 May 2013 (Source: J.P. Morgan Cazenove, own
calculations).

31
Figure 3: CDS spreads of insurers by size of exposure to the Greek
sovereign bond restructuring
CDS spreads of the group of insurers with low exposure to the Greek sovereign (lowest quartile of
Greek sovereign exposure to total assets as of Q1 2012) relative to group of insurers with high
exposure to the Greek sovereign (lowest quartile of Greek sovereign exposure to total assets as of
Q1 2012), in basis points. The total sample consists of 16 insurance companies with available
portfolio data from J.P. Morgan Cazenove. The red vertical line indicates the Greek bond exchange.

32
Table 1 Summary statistics of variables
Table 1 gives descriptive statistics of the estimation sample (left-hand side) and the full sample (right-hand
side) of insurer and country-specific variables. It should be noted that the variables have not yet been
transformed into log differences in this table (like in the regressions) in order to facilitate the interpretation of
magnitudes. Panel a shows the sample of the regressions on insurer risk in Tables 2 to 4 and 6 and 7. Panel b
shows the sample of the regressions on the risks of insurers, banks and non-financial firms in Table 5. The
sample covers the period from 1 January 2008 to 1 May 2013 for panel a and b.
a. Estimations of insurer risk
Estimation sample
Full sample
Obs Mean Std. dev.
Obs Mean Std. dev.
Insurer CDS 30555 186.07 258.66
52452 141.22 224.65
Sovereign CDS 30555 64.48 59.34
66307 45.74 59.31
Stock index volatility 30555 24.76 10.23
68338 22.90 10.30
Stock index 30555 5591.25 6078.19
70441 5547.57 8212.14
Banking system CDS 30555 153.87 70.49
71727 113.90 88.97
Systemically important dummy 30555 0.29 0.45
71727 0.17 0.38
Home sovereign bonds / total
assets 10815 0.06 0.05
12458 0.07 0.06
Home sovereign bonds (EUR
million) 12150 20506.73 22160.81
14123 22774.63 24052.96
b. Are insurers different?
Estimation sample
Full sample
Obs Mean Std. dev.
Obs Mean Std. dev.
CDS 461138 223.78 401.73
594409 264.51 4543.97
of which
insurer CDS 30588 186.13 258.58
37163 186.19 251.72
bank CDS 91063 221.85 386.94
107771 219.80 395.32
non-financial firm CDS 339487 227.69 415.80
449475 281.88 5223.29
Sovereign CDS 461138 62.56 60.47
589222 57.83 56.19
Stock index volatility 461138 25.35 10.39
581379 25.89 10.68
Stock index 461138 5367.12 6417.91
580106 4843.77 6093.65
Insurer dummy 461138 0.07
594409 0.06
Bank dummy 461138 0.20
594409 0.18
Basic material dummy 461138 0.09
594409 0.08
Consumer goods dummy 461138 0.16
594409 0.17
Consumer services dummy 461138 0.21
594409 0.20
Energy, oil & gas dummy 461138 0.03
594409 0.04
Health care dummy 461138 0.04
594409 0.05
Industrials dummy 461138 0.13
594409 0.14
Technology dummy 461138 0.03
594409 0.03
Telecom. dummy 461138 0.05
594409 0.05

33
Table 2 Baseline regressions explaining changes in insurance risk
Table 2 gives regression results for an estimation of the determinants of insurer risk. The log
change in insurer i’s CDS spread is the dependent variable. All explanatory variables are measured
as log changes. Column 4 includes time fixed effects. The sample covers the period from 1 January
2008 to 1 May 2013. Cluster-robust standard errors (clustered at time t) are shown in brackets.
***, **, * = significant at the 1%, 5%, 10% level.
(1) (2) (3) (4)
Home sovereign CDS 0.181*** 0.121*** 0.063*** 0.019***
(0.015) (0.012) (0.007) (0.006)
Home stock index volatility
0.057*** 0.018* -0.011
(0.011) (0.010) (0.013)
Home stock index
-0.662*** -0.284*** -0.171***
(0.061) (0.047) (0.053)
Home banking system CDS
0.446*** 0.164***
(0.023) (0.019)
Constant 0.000 0.000 0.000 -0.005***
(0.001) (0.001) (0.000) (0.001)
Observations 30,555 30,555 30,555 30,555
Number of insurers 26 26 26 26
Time FE N N N Y
R-squared 0.052 0.141 0.257 0.403

34
Table 3 Regressions with alternative dependent variables
Table 3 gives regression results for an estimation of the determinants of insurer performance and
risk using alternative dependent variables. The dependent variable is the log change in insurer i’s
stock price in columns 1 and 2 and the log change in insurer i’s expected default frequency (EDF)
over a one-year horizon as provided by Moody’s KMV. All explanatory variables are measured as
log changes. Columns 2 and 4 include time fixed effects. The sample covers the period from 1
January 2008 to 1 May 2013. Cluster-robust standard errors (clustered at time t) are shown in
brackets. ***, **, * = significant at the 1%, 5%, 10% level.
(1) (2) (3) (4)
Stock price Stock price EDF EDF
Home sovereign CDS -0.021*** -0.017*** 0.020*** 0.007*
(0.005) (0.004) (0.004) (0.004)
Home stock index volatility -0.178*** -0.132*** 0.047*** 0.053***
(0.007) (0.008) (0.006) (0.006)
Home stock index
-0.699*** -0.520***
(0.028) (0.037)
Home banking system CDS -0.149*** -0.083*** 0.053*** 0.031***
(0.015) (0.016) (0.009) (0.012)
Constant -0.000 0.039*** 0.000 0.003***
(0.000) (0.001) (0.000) (0.001)
Observations 39,070 39,070 24,744 24,744
Number of insurers 30 30 23 23
Time FE N Y N Y
R-squared 0.216 0.394 0.316 0.475

35
Table 4 Instrumental variables regression explaining changes in insurance risk Table 4 gives instrumental variables regression results for an estimation of the determinants of
insurer risk. The log change in insurer i’s CDS spread is the dependent variable in the second stage
(columns 1 and 4). Home sovereign CDS and home banking CDS are both instrumented by average
foreign sovereign CDS and banking system CDS in columns 2 and 3. In Column 4, we also add the
interbank rate as an instrument and report only the second stage results for the sake of brevity. All
explanatory variables are measured as log changes. The sample covers the period from 1 January
2008 to 1 May 2013. Cluster-robust standard errors (clustered at time t) are shown in brackets. ***,
**, * = significant at the 1%, 5%, 10% level.
(1) (2) (3) (4)
Second stage First stage First stage Second stage,
overidentified
Insurer CDS
Home
sovereign
CDS
Home
banking
system CDS Insurer CDS
Home sovereign CDS 0.148***
0.220***
(0.054)
(0.075)
Home banking system CDS 0.008
0.015
(0.051)
(0.050)
Average of foreign sovereign
CDS
0.041*** 0.002
(0.015) (0.003)
Average of foreign bank CDS
0.498*** 0.898***
(0.042) (0.021)
Stock index volatility 0.699*** 0.011 0.036*** 0.657***
(0.047) (0.015) (0.011) (0.060)
Home stock index -0.017 -0.279*** -0.269*** -0.016
(0.011) (0.063) (0.040) (0.011)
Constant -0.000 0.001 -0.000 -0.000
(0.000) (0.001) (0.000) (0.000)
Observations 30,455 30,455 30,455 30,315
Number of insurers 26 26 26 26
R-squared 0.187 0.123 0.528 0.172

36
Table 5 Are insurers different?
Table 5 gives regression results for an estimation of sovereign risk transmission to insurers, banks and non-
financial firms. The log change in company i’s CDS spread is the dependent variable. All explanatory
variables are measured as log changes. Column 1 gives the pooled effect of domestic sovereign risk. In
columns 2 to 4, the insurance sector is the omitted category and reflected in the baseline effect of sovereign
risk. The sample covers the period from1 January 2008 to 1 May 2013. Column 3 gives a detailed
breakdown into non-financial sectors. Column 4 includes day fixed effects. Cluster-robust standard errors
(clustered at time t) are shown in brackets. ***, **, * = significant at the 1%, 5%, 10% level.
(1) (2) (3) (4)
Aggregate
view
Sectoral
breakdown
Disaggregate
breakdown
Disaggregate
breakdown
Home sovereign CDS 0.082*** 0.130*** 0.132*** 0.056***
(0.008) (0.012) (0.012) (0.007)
Home stock index volatility 0.053*** 0.054*** 0.054*** 0.015**
(0.007) (0.007) (0.007) (0.007)
Home stock index -0.544*** -0.539*** -0.539*** -0.217***
(0.039) (0.038) (0.038) (0.027)
Banks *home sov CDS
0.011 0.011 0.007
(0.009) (0.009) (0.008)
Real sector *home sov CDS
-0.066***
(0.008)
Basic materials *home sov CDS
-0.051*** -0.051***
(0.008) (0.008)
Consumer goods *home sov CDS
-0.063*** -0.063***
(0.008) (0.008)
Consumer services *home sov CDS
-0.074*** -0.065***
(0.008) (0.007)
Energy, oil & gas *home sov CDS
-0.083*** -0.062***
(0.008) (0.007)
Health care *home sov CDS
-0.092*** -0.065***
(0.009) (0.008)
Industrials *home sov CDS
-0.048*** -0.051***
(0.007) (0.007)
Technology *home sov CDS
-0.086*** -0.069***
(0.010) (0.009)
Telecom. *home sov CDS
-0.054*** -0.050***
(0.008) (0.008)
Constant 0.000 0.000 0.000 -0.017***
(0.000) (0.001) (0.001) (0.000)
Observations 461,138 461,138 461,138 461,138
Time FE N N N Y
Number of firms 393 393 393 393
R-squared 0.123 0.125 0.125 0.286

37
Table 6 Regressions explaining transmission channels
Table 6 gives regression results for an estimation of the transmission channels from sovereign risk to
insurer risk. The log change in insurer i’s CDS spread is the dependent variable. All explanatory variables
are measured as log changes. The exposure and portfolio variables are measured as shares relative to total
assets and are drawn from J.P. Morgan publications. An insurer is a G-SII if the FSB has classified it as
being systemically important. The sample covers the period from 1 October 2009 to 1 May 2013 and
includes 16 large European insurers. Country-time fixed effects are introduced in column 2. Cluster-robust
standard errors (clustered at time t) are shown in brackets. ***, **, * = significant at the 1%, 5%, 10%
level.
(1) (2) (3) (4)
Overall
sovereign
portfolio
Country-
time FE
Home and
foreign
sovereign
exposure
Systemic
relevance
Home sovereign CDS 0.081***
0.101*** 0.035**
(0.018)
(0.023) (0.015)
Stock index volatility 0.015
0.013 0.020*
(0.012)
(0.012) (0.011)
Home stock index -0.382***
-0.389*** -0.365***
(0.045)
(0.045) (0.044)
Home banking system CDS 0.426***
0.424*** 0.412***
(0.033)
(0.033) (0.031)
Riskiness of overall sovereign portfolio 0.488*** 0.261***
0.458***
(0.076) (0.093)
(0.074)
Exposure to home sovereign * CDS
0.002
(0.005)
Riskiness of foreign sovereign portfolio
0.533***
(0.090)
G-SII insurer * home sovereign CDS
0.151***
(0.019)
High exposure to Greek restructuring event
(1/0)
Constant 0.000 0.001*** 0.000 0.000
(0.000) (0.000) (0.001) (0.000)
Observations 10,814 10,814 10,814 10,814
Number of insurers 16 16 16 16
R-squared 0.437 0.862 0.437 0.442

38
Table 7 Heterogeneity across countries and over time
Table 7 gives regression results for an estimation of the transmission channels from sovereign risk to insurer
risk across countries and over time. The log change in insurer i’s CDS spread is the dependent variable. All
explanatory variables are measured as log changes. The period "prior to debt crisis" runs from 1 January 2008 to
1 January 2010. The period "height of sovereign debt crisis" is defined as starting on 1 January 2010 and ending
with Mario Draghi’s speech on 26 July 2012, in which he first announced the OMT and stated that the ECB
would "do whatever it takes" (the period thereafter is defined as "post-Draghi speech"). Cluster-robust standard
errors (clustered at time t) are shown in brackets. ***, **, * = significant at the 1%, 5%, 10% level.
(1) (2) (3)
All
countries:
All
countries: Euro area:
euro area
effects
country risk
effects
time period
split
Home sovereign CDS 0.036*** 0.047*** 0.168***
(0.007) (0.009) (0.029)
Stock index volatility 0.023** 0.020* 0.010
(0.010) (0.010) (0.013)
Home stock index -0.237*** -0.269*** -0.211***
(0.047) (0.049) (0.045)
Home banking system CDS 0.437*** 0.443*** 0.507***
(0.023) (0.023) (0.036)
Home sovereign CDS*euro area 0.138***
(0.018)
Home sovereign CDS*level of sovereign CDS
0.038***
(0.014)
Home sovereign CDS * height of sovereign debt crisis
-0.025
(0.036)
Home sovereign CDS * post- Draghi speech
-0.033
(0.038)
Constant 0.000 0.000 -0.001
(0.000) (0.000) (0.001)
Observations 30,555 30,555 11,158
Number of insurers 26 26 9
R-squared 0.262 0.258 0.292
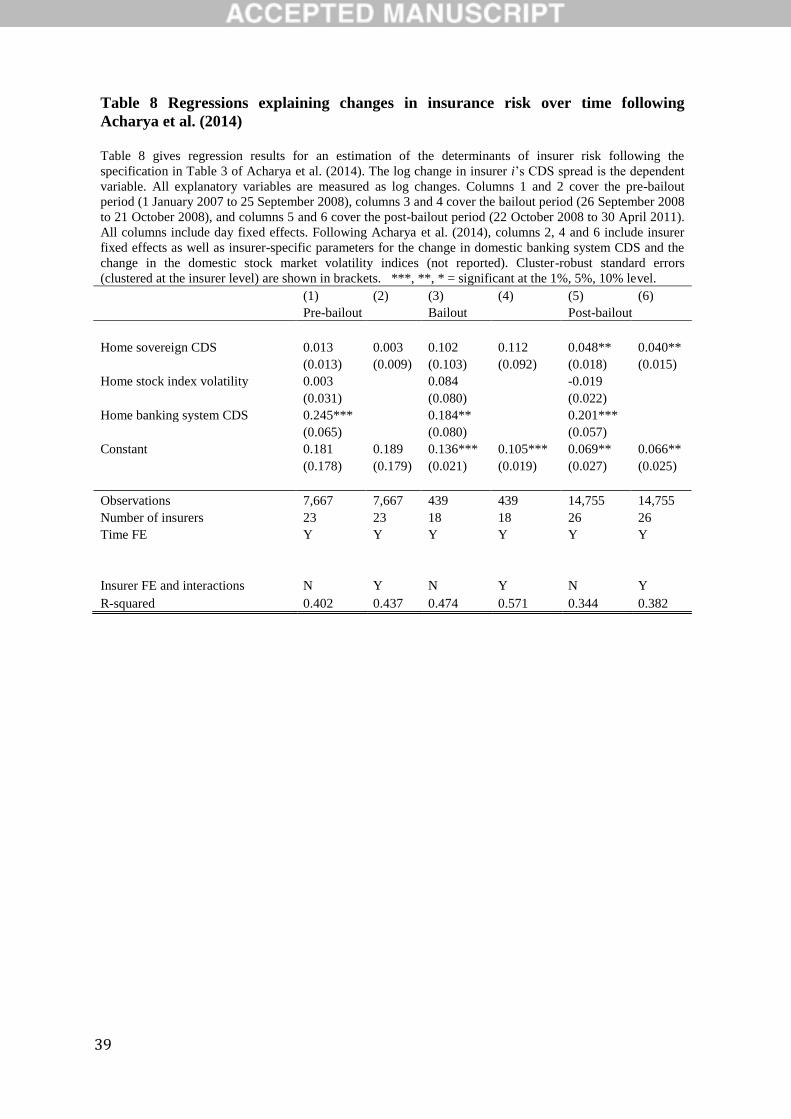
39
Table 8 Regressions explaining changes in insurance risk over time following
Acharya et al. (2014)
Table 8 gives regression results for an estimation of the determinants of insurer risk following the
specification in Table 3 of Acharya et al. (2014). The log change in insurer i’s CDS spread is the dependent
variable. All explanatory variables are measured as log changes. Columns 1 and 2 cover the pre-bailout
period (1 January 2007 to 25 September 2008), columns 3 and 4 cover the bailout period (26 September 2008
to 21 October 2008), and columns 5 and 6 cover the post-bailout period (22 October 2008 to 30 April 2011).
All columns include day fixed effects. Following Acharya et al. (2014), columns 2, 4 and 6 include insurer
fixed effects as well as insurer-specific parameters for the change in domestic banking system CDS and the
change in the domestic stock market volatility indices (not reported). Cluster-robust standard errors
(clustered at the insurer level) are shown in brackets. ***, **, * = significant at the 1%, 5%, 10% level.
(1) (2) (3) (4) (5) (6)
Pre-bailout Bailout Post-bailout
Home sovereign CDS 0.013 0.003 0.102 0.112 0.048** 0.040**
(0.013) (0.009) (0.103) (0.092) (0.018) (0.015)
Home stock index volatility 0.003
0.084
-0.019
(0.031)
(0.080)
(0.022)
Home banking system CDS 0.245***
0.184**
0.201***
(0.065)
(0.080)
(0.057)
Constant 0.181 0.189 0.136*** 0.105*** 0.069** 0.066**
(0.178) (0.179) (0.021) (0.019) (0.027) (0.025)
Observations 7,667 7,667 439 439 14,755 14,755
Number of insurers 23 23 18 18 26 26
Time FE Y Y Y Y Y Y
Insurer FE and interactions N Y N Y N Y
R-squared 0.402 0.437 0.474 0.571 0.344 0.382