on the feasibility of using textile electrodes for ...876997/fulltext01.pdf · using textile...
TRANSCRIPT

JUAN CARLOS MÁRQUEZ RUIZ
On the Feasibility of Using Textile Electrodes for
Electrical Bioimpedance Measurements
A thesis submitted to the KTH – Royal Institute of Technology in partial fulfillment of the requirements for the degree of Licentiate of Technology
Stockholm, Sweden, February 2011

Juan Carlos Márquez Ruiz, 2011 School of Engineering, University of Borås Borås and School of Technology and Health, KTH Stockholm Sweden ISSN 1653-3836 TRITA-STH Report 2011:1 ISRN/KTH/STH/2011:1--SE ISBN 978-91-7415-857-1
iii
ABSTRACT
The application of textile electrodes has been widely studied for biopotential recordings, especially for monitoring cardiac activity. Commercially available applications, such as the Adistar T-shirt and the Numetrex Cardioshirt, have shown good performance for heart rate monitoring and are available worldwide.
Textile technology can also be used for electrical bioimpedance (EBI) spectroscopy measurements in home and personalized health monitoring applications, however solid basic research about the measurement performance of the electrodes must be performed prior to the development of any textile-enabled EBI application.
This research work studies the performance of EBI spectroscopy measurements when performed with textile electrodes. An analysis using an electrical circuit equivalent model and experimental data obtained with the Impedimed spectrometer SFB7 was carried out. The experimental study focused on EBI spectroscopy measurements obtained with different types of textile electrodes and in different measurement scenarios. The equivalent model analysis focused on the influence of the electrode polarization impedance Zep on the EBI spectroscopy measurements in the frequency range of 3 kHz to 500 kHz.
The analysis of the obtained complex EBI spectra shows that the measurements obtained with textile electrodes produce constant and reliable EBI spectra. The results also indicate the importance of the skin-electrode interface in EBI spectroscopy measurement.
Textile technology, if successfully integrated, may enable the performance of EBI spectroscopy measurements in new scenarios, which would allow the generation of novel, wearable, or textile-enabled applications for home and personal health monitoring.


v
ACKNOWLEDGEMENTS
This research work was founded by the Mexican CONACYT (Consejo Nacional de Ciencia y Tecnología) reference: 210788/304684.
I am heartily thankful to my supervisor and co-supervisor, Prof. Kaj Lindecrantz and
Dr.Fernando Seoane Martínez, for their guidance, advice and support during all the process. I would like to thank my mother, Carmen, and my brothers, José Antonio and Francisco Javier, for encouraging me to pursue my goals and for their unconditional support. Special thanks also to my friends and members of the research team at the University of Borås, Maulo, Javier, Ruben and Johan, who have made available their support in a number of ways.
Finally, I offer my thanks, regards and blessings to all of those who supported me in any
respect during the completion of the project. Juan Carlos Márquez Ruiz Borås, March 2011


vii
TABLE OF CONTENTS
Abstract ________________________________________________________________ iii
Acknowledgements ________________________________________________________ v
Table of Contents _________________________________________________________ vii
List of Acronyms _________________________________________________________ ix
Chapter 1 ________________________________________________________________ 1
Introduction ______________________________________________________________ 1 1.1 Introduction ____________________________________________________________ 1
1.2 Motivation _____________________________________________________________ 2
1.3. Research Goals. _________________________________________________________ 3
1.4. Work done _____________________________________________________________ 3
1.5. Structure of the Thesis Report _____________________________________________ 3
1.6. Beyond the Scope of this Work ____________________________________________ 3
Chapter 2 ________________________________________________________________ 5
Electrical Bioimpedance ____________________________________________________ 5 2.1. Electrical Properties of Biological Tissue ____________________________________ 5
2.2. Electrical Bioimpedance Background ______________________________________ 5
2.3. Electrical Bioimpedance Applications _______________________________________ 7 2.3.1. Single-Frequency Bioimpedance for BCA _________________________________________ 8 2.3.2. Multi-Frequency Spectroscopy Bioimpedance. _____________________________________ 8 2.3.3. Whole Body, Segmental and Focal Bioimpedance Measurements ______________________ 8
2.4. EBI Measurements ______________________________________________________ 9 2.4.1. Two-Electrode Measurement ___________________________________________________ 9 2.4.2. Four-Electrode Measurement __________________________________________________ 10
2.5. Influence of Zep on EBI ___________________________________________________11 2.5.1. Capacitive Leakage __________________________________________________________ 12
Chapter 3 _______________________________________________________________ 13
Electrodes & Textile-enabled Physiological Measurements _______________________ 13 3.1. Electrode Classification ___________________________________________________13
3.2. Traditional Ag/AgCl Electrodes ____________________________________________13
3.3. Textile Electrodes _______________________________________________________14
3.4. Skin-electrode Interface __________________________________________________15 3.4.1. Skin-Electrode Model ________________________________________________________ 16 3.4.2 Electrode Polarization Impedance in Textile Electrode ______________________________ 17

Chapter 4 _______________________________________________________________ 19
Influence of Skin-Electrode Interface on EBI Measurements _____________________ 19 4.1. Impedance Estimation Error Caused by Capacitive Leakage ___________________19
4.2. Influence of Zep and Cpar sensitivity in the measurement ________________________20
Chapter 5 _______________________________________________________________ 23
Performed studies ________________________________________________________ 23
Chapter 6 _______________________________________________________________ 27
General Discussion & Conclusions __________________________________________ 27 6.1 Discussion & Conclusions ________________________________________________27
6.2. Future work ___________________________________________________________28
References ______________________________________________________________ 29
Appended Papers _________________________________________________________ 31

ix
LIST OF ACRONYMS
BCA Body composition analysis BLM Bilayer lipid membrane CVD Cardiovascular diseases Cpar Parasitic capacitance EBI Electrical bio-Impedance EEG Electroencephalography ECF Extracellular fluid ECG Electrocardiography EIP Electrical impedance plethysmography FFM Fat-free mass FRC Functional residual capacity ICG Impedance cardiography ICF Intracellular fluid IPG Impedance plethysmography MF-EBI Multi-frequency electrical bio-impedance RV Residual volume SF-EBI Single-frequency electrical bio-impedance SVD Singular value decomposition TEB Thoracic electrical bioimpedance TLC Total lung capacity TUS Tissue under study TBW Total body water TUS Tissue under study V/I Voltage / current Zep Electrode polarization impedance


1
CHAPTER 1
INTRODUCTION
1.1 Introduction
The integration of functional applications in textiles for leisure and sport [1] has become a reality during the past years. These wearable applications with textile sensors embedded in the garment are available on the market, with most of them focused on the evaluation of heart rate during training activity. Figure 1.1 shows some textile garments with embedded electrodes developed by Adidas, Polar and NuMetrex that are available on the market.
Figure 1.1. Textile garments with textile electrodes embedded. A) AdiSTAR fusion t-shirt, B) NuMetrex Control Bra and C) NuMetrex Cardio Shirt.
Such integration of measurement systems in textile garments facilitates the acquisition of
physiological measurements to allow personalized health monitoring and enable new scenarios for point-of-care. The project MyHeart [2-4]is a feasible application where functional garments with integrated textile sensors were used for prevention and early diagnosis of cardiovascular diseases (CVD). Figure 1.2 presents the functional garments used in the MyHeart project.

2
Figure 1.2. Textile sensors integrated in functional garments utilized in the MyHeart project (Source: Philips) Besides Electrocardiography (ECG), functional garments with textile electrodes could be also utilized for electrical bioimpedance spectroscopy for body composition analysis (BCA), impedance cardiography, cancer detection, etc. In an EBI measurement, the electrode has a determinant role in the system due to its double function in the system, i.e., as a potential sensing element and as an electrical charge interface between the measurement system and the body. The absence of an electrolyte compound in the composition of textile electrodes may impede the charge transfer from the current injecting terminals into the body, thus affecting the measurement.
1.2 Motivation
Work has intensified around the integration of textile and measurement technologies for physiological measurements; and electrical bioimpedance (EBI) is an example of physiological measurement that can be used for personal healthcare monitoring and would benefit from the integration of textile technology. Traditional electrodes present drawbacks, i.e., allergic reactions to the electrolytic gel and the need to be careful to get the correct placement of the electrodes to obtain good measurements. On the other hand, (dry) textile electrodes do not present allergic problems; the wearability as a garment easily ensures correct electrode positioning and the functionality and comfort of a garment with electrodes and cables can be integrated in the same solution. Measurements performed with traditional electrodes are subject to different sources of interference. These interferences are more accentuated with dry textile electrodes due to the lack

3
of an electrolyte. Therefore, it is important to study the behavior of textile sensors so that the skin-electrode interface can be optimized and disturbances can be compensated.
1.3. Research Goals.
This research work was targeted to analyze the following issues:
• Performance of textile electrodes for electrical bioimpedance (differences between traditional electrolytic and textile electrodes).
• Influence of size, material and structure of the textile electrode
• Influence of the conditions of the skin-electrode interface
1.4. Work done
A study of the performance of different textile electrodes was done as comparisons with Ag/AgCl electrodes. The comparisons were based on analysis of complex impedance spectra, Cole parameters and body composition parameters. Commercially available textile electrodes and self-manufactured prototypes with different characteristics regarding structure, electrode-skin interface (dry/wet), material and design were studied using a tetra-polar electrode configuration.
1.5. Structure of the Thesis Report
This work report contains six chapters and an appendix with the papers. Chapters one and two are a general introduction into the topic of the use of textile sensors for physiological measurements and into the electrical bioimpedance scenario respectively. Chapter three presents the role of the textile electrode in the physiological measurements. In chapter four the influence of the skin-electrode interface on EBI measurements is explained. The research studies performed are summarized in chapter five. Finally in chapter six the obtained results are discussed, the conclusions drawn and future work is proposed.
1.6. Beyond the Scope of this Work
Motion artifacts were not considered in this work. All measurements were performed in healthy volunteers lying supine in a resting state. There are several factors and conditions that may have a significant influence on the quality of the measurement when using textile electrodes and were not part of this study; they include the variation of the skin humidity from patient to patient and the electrode-skin contact force.

4
The conductive element in the electrode could be integrated in the electrode in different ways, most commonly with the addition of metal fibers or coating with a conductive polymer. However, in this study, only the addition of metal fibers was evaluated. Characteristics of the manufacturing process of the electrode such as the material used, yarn structure in the textile and yarn constitution were considered (See Section 3.4) but not analyzed. In this study, the quality characteristics of the textile electrodes, such as ease of washing and comfort, were not considered.

5
CHAPTER 2
ELECTRICAL BIOIMPEDANCE
2.1. Electrical Properties of Biological Tissue
Biological tissue is composed of cells surrounded by extracellular medium. A cell is composed of several organelles or constituents enclosed by a bi-layer membrane known as the cell membrane. The electrical properties of the biological tissue are determined by the electrical characteristics of the extracellular medium, the cells and the cellular content or intracellular medium. The extracellular medium is an ionic solution or liquid electrolyte that is composed of diverse ions, Na+ and Cl- ions being of highest concentration; and the electrical properties of the extracellular medium depend on physical and chemical parameters as well as on ion concentration and mobility. Similarly, the ionic constitution and concentration of the intracellular medium determine its electrical properties. In this case, the most abundant ions are K+ and other charged molecules [5] Although it is also possible to find membrane structures providing certain capacitive properties inside the cell, the intracellular medium is generally considered to serve as an ionic conductor. The cell membrane, on the other hand, presents a double role. The first is to delimit or separate the intra- and extra-cellular media (a passive function), and the second is to control the chemical exchange (active function). From the electrical point of view, the cell membrane can be considered to have very low conductive and dielectric properties. Therefore, the intracellular medium, cell membrane and extracellular medium form a conductor-dielectric-conductor structure with a capacitive behavior.
2.2. Electrical Bioimpedance Background
At the beginning of the 20th century, studies regarding the structure of biological tissue and its electrical properties contributed to the discovery of the ability of biological tissue to allow the flow of electrical charges, they have an electrical conductivity. Further studies helped to suggest electric models, where the impedance exhibited by the biological tissue to the flow of electrical current, was modeled with capacitive and resistive
6
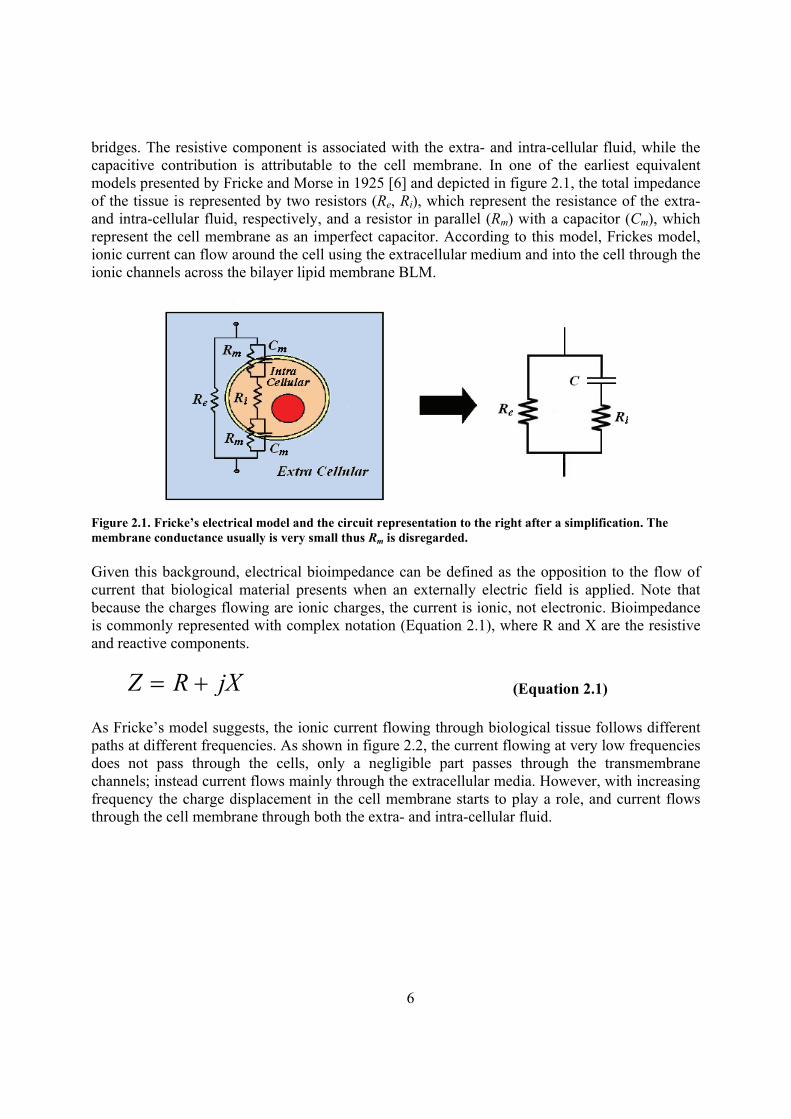
bridges. The resistive component is associated with the extra- and intra-cellular fluid, while the capacitive contribution is attributable to the cell membrane. In one of the earliest equivalent models presented by Fricke and Morse in 1925 [6] and depicted in figure 2.1, the total impedance of the tissue is represented by two resistors (Re, Ri), which represent the resistance of the extra- and intra-cellular fluid, respectively, and a resistor in parallel (Rm) with a capacitor (Cm), which represent the cell membrane as an imperfect capacitor. According to this model, Frickes model, ionic current can flow around the cell using the extracellular medium and into the cell through the ionic channels across the bilayer lipid membrane BLM.
Figure 2.1. Fricke’s electrical model and the circuit representation to the right after a simplification. The membrane conductance usually is very small thus Rm is disregarded.
Given this background, electrical bioimpedance can be defined as the opposition to the flow of current that biological material presents when an externally electric field is applied. Note that because the charges flowing are ionic charges, the current is ionic, not electronic. Bioimpedance is commonly represented with complex notation (Equation 2.1), where R and X are the resistive and reactive components.
(Equation 2.1)
As Fricke’s model suggests, the ionic current flowing through biological tissue follows different paths at different frequencies. As shown in figure 2.2, the current flowing at very low frequencies does not pass through the cells, only a negligible part passes through the transmembrane channels; instead current flows mainly through the extracellular media. However, with increasing frequency the charge displacement in the cell membrane starts to play a role, and current flows through the cell membrane through both the extra- and intra-cellular fluid.
Z = R + jX

7
Figure 2.2. Current flow in tissue at low and high frequency shown in A and B, respectively
2.3. Electrical Bioimpedance Applications
The dependency of EBI measurements to tissue composition and structure allows the implementation of several applications based on time analysis, single frequency and spectroscopy. EBI has proven to be an efficient and non-invasive method for patient monitoring, a diagnostic tool for several health conditions and some applications of EBI have reached clinical practice. Variations of electrical impedance in the thorax are correlated with heart and respiratory activity. Impedance plethysmography (IPG) of the lungs allows the monitoring of different respiratory volumes such as residual volume (RV), functional residual capacity (FRC) and total lung capacity (TLC) for pulmonary function [7-8]. Spectroscopy analysis of skin EBI measurements allows for early detection of melanoma [9]. Abnormal accumulation of fluid in the lungs or thoracic region, pulmonary edema, can also be detected by means of electrical impedance. Commercially available devices such as the bioimpedance monitor ZOE (developed by Noninvasive Medical Technologies) that measures the resistance of the thoracic region at 100 kHz thereby assessing the accumulation of fluid in the lung [10]. Less fluid accumulated in the thoracic cavity is associated with a high resistance, whereas low resistance values are an indicator of excessive fluid accumulation. The ability of EBI-based body composition analysis (BCA) to estimate body composition parameters and assess hydration status has made it a common tool in nutrition assessment. Water content, intra- and extra-cellular fluid and fat mass content are some of the parameters obtained in the BCA [11-12]. Additional information regarding BCA, based on EBI measurements, is provided in the following subsections.

8
2.3.1. Single-Frequency Bioimpedance for BCA
Single-frequency EBI (SF-EBI) measurements for BCA are typically taken at 50 kHz with an electrode configuration known as Total Right Side, where the electrodes are placed on the right hand and the right ankle. At this frequency the EBI measurement contains information from both the intracellular and the extracellular medium, but it is not possible to distinguish between intracellular fluid (ICF) and extracellular fluid (ECF); it is only possible to estimate the total body water (TBW) and the fat-free mass (FFM).
2.3.2. Multi-Frequency Spectroscopy Bioimpedance.
Multi-frequency EBI (MF-EBI) utilizes spectroscopy measurements usually taken between 5 kHz and 1 MHz to estimate the BCA parameters TBW, ICF, ECF and FFM. Also for this type of measurement the most commonly used electrode configuration is Total Right Side. The multi-frequency technique has proven to be less biased and more precise than the single frequency for ECF estimation but more biased and less precise for TBW estimation [13].
2.3.3. Whole Body, Segmental and Focal Bioimpedance Measurements
Whole body bioimpedance, which provides information about the entire body, is most often performed with right-side EBI measurements and is commonly used to estimate the complete set of BCA parameters for the whole body.
Figure 2.4. Total body water analysis using a four-electrode EBIS set-up

9
EBI measurements can also be taken from different portions of the body; such as the full limb or the full trunk. These EBI measurements are called segmental EBI. If the EBI measurement is focused on a localized portion of the body, such as the belly or the ankle, the EBI measurement is called focal EBI. In focal EBI, the measurements provide information only from the specific body regions or limbs (arm, leg and trunk). Although segmental EBI is claimed to have better theoretical support than whole body bioimpedance, both methods produce reliable measurements [14-15].
2.4. EBI Measurements
Because EBI is based on the passive electrical properties of tissue, energy must be applied to the tissue sample to perform a deflection measurement. Electrical energy, voltage or current, is applied in to the tissue under study, and the resulting current or voltage respectively is measured. Thus, the EBI is obtained from the applied electrical energy and the tissue’s response [16-17]. Application of the electrical energy to the tissue and the measurement of the response is done by means of electrodes.
The measurement method will determine the measurement instrumentation and thus the number of electrodes used in the system. Similarly, the number of electrodes used in the measurement system will determine the influence of the electrode polarization impedance (Zep) on the measurement. To illustrate the importance of Zep when performing EBI measurements, in the following sections the two- and four-electrode methods are introduced.
2.4.1. Two-Electrode Measurement
In the two-electrode configuration described in figure 2.2, the same two electrodes are used for current injection and for sensing of the resulting voltage signal. Analysis of this circuit reveals how the pair of electrodes utilized to inject the excitation signal affect the measured voltage VTUS. (The voltage measured in the tissue under study)
Figure 2.2. Standard two-electrode configuration (Source [18])

10
The main drawback of this configuration is that because the electrical current flows through the sensing electrodes, the voltage generated by the Zep is included in the voltage measurement, and it is impossible to discern whether the voltage is generated by the current flowing through the tissue under study or by the current flowing across the skin-electrode interface. Equations (2.2) to (2.5) show the influence of the electrode polarization impedance on the calculation of the measured impedance Zm from the measured voltage, Vm.
Equation (2.2)
Equation (2.3)
Equation (2.4)
Equation (2.5)
2.4.2. Four-Electrode Measurement
In the four-electrode configuration shown in figure 2.3, the signal injection and the response measurement are performed with two different pairs of electrodes. One pair of electrodes is used to inject the current into the tissue under study (TUS), while a second pair of electrodes is used to measure the voltage VTUS.
Figure 2.3. Standard four-electrode configuration (Source [18]) With this electrode configuration, the voltage generated by the Zep of the injecting leads does not affect the voltage measurement. Based on equations (2.2) and (2.3) and considering that the current Iep flowing through the voltage-measuring electrodes is zero, the impedance measured as Zm is the impedance of the tissue under study as presented in equation (2.6). Note that for Iep to be zero, the sensing amplifier must have very high input impedance, ideally infinite.
Zep IV m ep =
m
mm I
VZ =
epTUSepTUSepm VVVVVV 2+=++=
epTUSm
epTUSm ZZ
IVV
Z 22
+=⋅+
=

11
TUSm
epTUSm Z
IVV
Z =+
=2
Equation (2.6)
2.5. Influence of Zep on EBI
An EBI measurement can be affected by several sources of error, and as a consequence, measurement artifacts might corrupt the obtained EBI data. Although the four-electrode method is a method that removes the direct influence of Zep (electrode polarization impedance) on the EBI measurements, the four-electrode method does not eliminate all aspects of influence. The sensitivity to unwanted capacitances in the measurement system will increase with increasing Zep. These unwanted capacitances may come from stray capacitive pathways such as the capacitance between electrode leads, between body limbs and the earth, between the leads and the ground, etc. See Figure 2.4. These stray, parasitic, capacitances form different electrical pathways so that part of the current that is supposed to flow through the TUS flows through alternative ways instead. The sensitivity of the measurement set-up, including the electrodes, to these unwanted capacitances is small at low frequencies.
Figure 2.4. Electrical representation of a standard EBI measurement scenario. In the circuit diagram shown in Figure 2.4, parasitic capacitances that are present in a standard EBI measurement set-up are included. The capacitance Cie represents the capacitance in the neighboring electrode leads, Clg represents the capacitance between the signal leads and ground, Cge represents the capacitance between the signal ground and the earth and Cbg represents the capacitance between the residual body and ground.

12
2.5.1. Capacitive Leakage
The Tail or Hook Effect is a measurement artifact that is noticed as a deviation in the impedance at high frequencies. The deviation is larger in reactance and phase than it is in the resistance and module of the EBI spectrum as it can be seen in [19]. The origin of this effect is the parasitic capacitances in the measurement set-up, as illustrated in figure 2.4. The existence of parasitic capacitances allows for fractions of the injected electrical current to leak away through alternative electrical parasitic pathways instead of through the measured load. Therefore, this leakage of current impairs the impedance estimation process and produces an estimation error.
Figure 2.5. Hook effect observed in A) module of the reactance vs. frequency plot and B) Cole plot.
The estimation error caused by the leakage effect produces a high-frequency artifact. In figure 2.5, plots of the impedance of the TUS obtained from the model presented (figure 2.6) with a Cpar value of 50 pF are depicted. The impedance that is free from artifacts is plotted in blue with a solid line, and the red trace presents the impedance data that are contaminated with capacitive leakage. The reactance spectrum is plotted in A) and the impedance plot in B).
Figure 2.6. Electrical model used in [20]
13
CHAPTER 3
ELECTRODES & TEXTILE-ENABLED PHYSIOLOGICAL MEASUREMENTS
3.1. Electrode Classification
A skin electrode is a contact sensor that creates an electrical interface between the body and the measurement system, allowing the electrical charges to flow through the tissue and to sense the endogenous biopotential. Electrodes can be classified into two types: polarizable electrodes and non-polarizable electrodes. In the ideal case of perfectly polarizable electrodes, also known as totally polarizable electrodes, no electrode reactions occur when a given electrical potential is applied. Therefore, no charge will flow across the electrode-electrolyte interface, and the electrode will behave as a capacitor. Any current flowing through a lead with this type of electrode is a displacement current. In contrast, perfectly non-polarizable electrodes are electrodes that are not polarizable; thus, the electrode potential will not change from its equilibrium potential when a current density is applied. In this type of electrode, the current flows freely across the electrode without producing any potential. An ideal non-polarizable electrode behaves as a resistor with a nominal resistance value that is ideally to zero. Neither perfectly polarizable electrodes nor perfectly non-polarizable electrodes can be manufactured, although similar characteristics can be obtained. For the characteristics previously mentioned, polarizable electrodes are more suitable for sensing biopotentials, while non-polarizable electrodes are more suitable for current stimulation [21].
3.2. Traditional Ag/AgCl Electrodes
Silver-silver chloride (Ag/AgCl) electrodes belong to the category of non-polarizable electrodes; this makes them especially able to allow the transfer of charges, thus producing very little voltage, ideally none. On the other hand, when used in combination with measurement instrumentation that has high input impedance, ideally infinite, these electrodes are very suitable for measuring electrical biopotential as they are completely polarizable electrodes with extremely low over-potential. Therefore, Ag/AgCl electrodes are the most commonly used electrode for non-invasive physiological measurements.

14
The reaction between the metal, Ag, and the salt, Ag/AgCl, produces fast electrode kinetics that facilitates the current flow through the electrode, improving the interfacing. This type of electrode has been shown to have several favorable characteristics such as stable behavior, non-toxic composition, low frequency noise and low cost. In figure 3.1, an example of an Ag/AgCl electrode is presented.
Figure 3.1. Ag/AgCl electrodes, 3M Red Dot repositionable electrode.
The electrodes shown in fig 3.1 use a conductive and sticky gel that improves the electrical properties of the interface between the electrode and the skin and at the same time helps to attach the electrode to the surface of the skin. This electrolytic gel reduces the electrode polarization impedance to improve the charge transfer.
3.3. Textile Electrodes
Development of a good textile electrode requires textile and electrode theoretical competence. The right textile choice, with suitable characteristics for the specific application that also fulfills the requirements of electrode theory, will result in reliable measurements.
From the textile point of view, several manufactured characteristics can be chosen to generate an electrode with suitable properties Among the most significant properties are the material used (cotton, polyamide, spandex, etc.), the yarn structure of the fabric (knitted, woven, non-woven, etc.), yarn constitution (staple fibers, filament fibers, twined yarns, etc.) and the final treatment (coating) [22]. The appropriate selection of these parameters could result in an electrode with good characteristics with respect to: strength, smoothness, moisture absorption, drapeability, stretchability and water and chemical resistance.
According to electrode theory, an effective way to evaluate electrode performance is based on the electrode polarization and electrode impedance. Improvement of the conductive properties of the textile material in the electrode will result in a good electrode polarization properties and low electrode impedance. Thus, the main problem faced by textile electrodes is the poor conductivity exhibited by the textile material and by the outer layer of the skin.

15
For this reason, textile electrodes are often made by adding conductive material to the textile. The conductive material can be integrated into the textile as metal fibers (silver, platinum, stainless steel, gold, etc.) in the manufacturing process by coating or laminating the conductive material (conductive polymers) or by embroidering the conductive yarn over the textile structure as in [23].
Figure 3.2. Textile electrodes. A) Textile bracelet with Velcro adjustment and B) Stretch textile cuffs.
Many common electrodes used in the biomedical field contain an electrolytic gel that attaches the electrode to the body and improves the skin-electrode interface. Textile electrodes, on the other hand, do not contain an electrolytic gel or fluid. This is an important factor that impedes the ion-electron circulation at the skin-electrode interface, which affects the electrode polarization and electrode impedance. In figure 3.2 two examples of textile electrodes used in this work are presented.
3.4. Skin-electrode Interface
As previously mentioned, the main function of an electrode is to interface between the surface of the skin and the measurement instrumentation, thus converting ionic current from the biological tissue into electronic current and vice versa. In a measurement set-up, the electrode is an element that is sensitive to several factors, which can be affected by several sources of interference. Among these factors, the skin-electrode boundary is probably the factor with the largest influence on the overall performance of the electrodes.
As explained earlier in this work, the presence of an electrolytic medium, such as a gel, improves the skin-electrode interface. However, in textile electrodes, the lack of electrolytic gel at the skin-electrode boundary produces a deficiency in the conductive properties and a higher sensitivity to external disturbances.

16
3.4.1. Skin-Electrode Model
It is important to make a general explanation of the skin conformation. The skin is made of three principal layers: the epidermis, the dermis and a subcutaneous layer. The outer layer, the epidermis, is divided in three sub-layers and is the most significant in the skin-electrode interface. The controlling factor in the epidermal characteristics is the outer sub-layer known as the stratum corneum, which is basically comprised of dead material and can be considered as a membrane that is semi-permeable to ions.
Considering this previous information, a circuit model is described in Figure 3.3. In this model, the parallel circuit Rskin// Cskin represents the epidermis, specifically the stratum corneum. This upper skin layer consists of dead cells that have a relevant contribution to the total impedance. The dermis and the subcutaneous layer have a purely resistive behavior, and they are represented as Rsc in this model.
Figure 3.3. Electrical model illustrating the electrical behavior of the skin-electrode contact.
The interface between the tissue and the electric conductor is an ionic conductor. The ionic conductor is the electrolytic medium that can be represented by a resistance in series. In the case of dry textile electrodes, the electrolytic medium will be determined by the presence of sweat or by the natural skin humidity of each person. For instance, in a person with dry skin conditions and no presence of sweat, the value of Rem will be high.
The sweat produced by the sweat glands is a significant conductive component in the skin-electrode interface and is represented in the circuit by Rem. The presence of sweat produces more charges between the electrode and the skin; with a higher number of charges, a lower electrode impedance polarization is expected.
In the same model, the parallel circuit Relectrode//Celectrode represents the electrode surface, which is where the conversion of ionic current to electric current takes place. The contact between a metallic electrode and an electrolyte such as an ionic conductor produces an electrochemical reaction that results in an ion-electron exchange. This ion-electron exchange behaves as a capacitor with a double layer of charges created at the interface.

17
In the end of the circuit, USE represents two voltage sources at the skin and electrodes. Consequently, the total impedance expression for this circuit is shown in equation 3.4.
electrodeelectrode
electrodeem
skinskin
skinSCelectrodeskin CRj
RRCRj
RRZωω +
+++
+=− 11 Equation (3.4)
For dry electrodes such as textile electrodes, it is important to mention the skin-electrode interaction that produces sweat at the contact area, which creates impedance variations.
3.4.2 Electrode Polarization Impedance in Textile Electrode
The electrode polarization is produced by a displacement of positive and negative electric charges in the skin electrode interface to opposite ends of the electrode. The impedance is obtained using the current I flowing through the tissue under study, and the voltage drop V is directly affected by the electrode polarization. Conventional Ag/AgCl electrodes contain an electrolytic medium with conductive properties that reduce the value of the polarization impedance Zep; however, in dry-textile electrodes the lack of this electrolytic medium may increase the Zep. The resulting high value of Zep contributes to the effect of capacitive leakage.

18

19
CHAPTER 4
INFLUENCE OF SKIN-ELECTRODE INTERFACE ON EBI MEASUREMENTS
4.1. Impedance Estimation Error Caused by Capacitive Leakage The combination of a high electrode polarization impedance Zep in the stimulating lead and
the existence of parasitic capacitances produces an error in the impedance estimation process. To evaluate the influence of the contribution of both Zep and the parasitic capacitances on the impedance estimation, the measurement scenario presented in section 2.4 has been simplified into the electrical equivalent circuit presented in on figure 4.1, which models a current leakage from the measurement load. In this model, the parasitic capacitance is represented by a single capacitor, Cpar, in parallel with the measurement load and the electrode polarization impedance, i.e., ZLoad and Zep, respectively.
Figure 4.1. Electric model representing a bioimpedance measurement using the 4-electrode configuration.

20
Analyzing the circuit presented in the Figure 4.1, the following equations are obtained:
Equation (4.1)
Equation (4.2)
From the right side of (4.2) and solving for Im:
Equation (4.3)
Using equation 4.1 and 4.3 and simplifying the following expression for Zm results in:
Equation (4.4)
From (4.4) it is possible to see that without parasitic capacitance, the measured impedance Zm would be equal to the impedance of the measurement load ZLoad.
4.2. Influence of Zep and Cpar sensitivity in the measurement
A simple way to analytically study the role of the electrode polarization impedance and the parasitic capacitance sensitivity in the measurement is to calculate the relative error for different values of Zep and Cpar .The relative error in the measurement is obtained by first calculating the absolute error using the following expression:
AbsError = |Zm – ZLoad| Equation (4.5)
where Zm is the impedance estimated from the electric model in section 4.1, and ZLoad is the impedance of the load. Using the expression obtained from equation 4.4 in equation 4.5, equation 4.6 is obtained:
Load
cp
Loadep
LoadLoadmError Z
XZZ
ZZZAbs −+
+=−=
21
Equation (4.6)
Simplifying equation 4.6, the error expression is obtained:
cpm
Loadmmm II
ZIIVZ
+==
0
cpcpLoadepm XIZZIV =+= )2(0
Loadep
cpcpm ZZ
XII
+=
2
cp
Loadep
Load
cpLoadep
cpcp
LoadLoadep
cpcp
m
XZZ
Z
IZZ
XI
ZZZ
XI
Z+
+=
++
+= 2
12
2

21
Equation (4.7)
From the expression in (4.7), it is simple to observe the role of the parasitic capacitance, i.e., the polarization impedance of the electrode, in the impedance estimation error. Once the absolute error is obtained, the relative error is calculated with the formula shown in (4.8).
m
errorErrorError Z
AbsTrueValue
AbsREL == Equation (4.8)
Table I presents the values of Cpar and Zep used to simulate the impedance; this simulation is based on the electric model explained in Figure 4.3. The results obtained in the simulation are plotted in Figure 4.6. The resistance and reactance spectrum were analyzed separately in the frequency range of 3 kHz to 1 MHz
TABLE I: VALUES OF THE ELECTRODE IMPEDANCE AND PARASITIC CAPACITANCE
Zep (Ω) Cpar (pFarads) 0
1.5
7.5
20
100
500
1000 The plot depicted in figure 4.2 shows both the resistance and the reactance spectra; the impedance load is plotted with a solid black trace, while the spectrum of measured impedance, Zm affected by Cpar and Zep, is plotted with colored traces and markers.
Figure 4.2. Impedance spectra with a value of Cpar and different values of Zep. A) Resistance spectrum. B) Reactance spectrum
Loadep
cp
LoadError
ZZX
ZAbs
++
=
21

To betteand reac
Figure 4.and B) R As is shfrom thinfluencgreater relative sources impedan Becausesetup, timpedanelectrodmust bedesignininterfacimpedanto increskin to electrod
er observe tctance spect
.3. ImpedancReactance rela
hown from e simulatioce the impein the reacterror is smof error, th
nce estimati
e parasitic cthe effect once, and thdes than in Ae sufficientng garmentse must be nce. Naturaase the surfremove de
de and the sk
the influenctra.
ce spectra relative error.
the analysins, the para
edance valutance comp
maller by anhe parasitic ion at highe
capacitanceof capacitivhe electrodeAg/AgCl eltly small ns for EBI spcarefully c
al steps towaface of the
ead cells frokin.
ce of Zep an
lative error w
is of the imasitic capac
ue. The specponent. Even order of te
capacitanceer frequenci
e cannot be ve leakage e polarizatilectrodes. T
not to conpectroscopyconsidered ard the reducontact areom the sur
22
nd Cpar, fig
with Cpar and
mpedance escitance and ctral plots f
en though then. From the and the elies.
predicted oincreases w
ion impedaThe error prntaminate thy using textwith the a
uction of tha between tface and to
2
4.3 shows t
different val
stimation erthe impeda
from figurehe resistanc
he spectral plectrode pol
or removedwith the vaance is exproduced in the EBI spetile electrodaim of achihe electrodethe electrod
o keep a go
the relative
lues of Zep A)
rror and froance electro 4.2 indicat
ce componeplots, it is alarization im
d completelyalue of the pected to betextile-enabectroscopy des, the issuieving low polarizatio
de and the sood contact
e error of th
) Resistance r
om the resuode polarizate that that
ent is also aalso easy to mpedance in
y from a melectrode
e larger in bled EBI medata. There
ue of the skelectrode
on impedancskin, prepart pressure b
he resistance
relative error
ults obtainedation clearly
the error isaffected, the
realize thanfluence the
measuremenpolarizationdry textile
easurementsefore, when
kin-electrodepolarizationce would beration of thebetween the
e
r
d y s e
at e
nt n e s n e n e e e

23
CHAPTER 5
PERFORMED STUDIES
In order to assess the properties of textile electrodes and their potential use in bioimpedance measurements, a series of studies was performed. The initial study aimed at clarifying whether it is at all possible to use textile electrodes in the bioimpedance field [paper I]. For the purpose the performance of the Adistar Knitted Textile Electrode (silver fiber as conductive element) was compared with the performance of two standard types of electrodes the Impedimed Electrode and the Red Dot 3M repositionable monitoring electrode, with respect to the recorded impedance spectra. In this initial study the textile electrode was moistened with electrolytic gel. As seen in figure 5.1 there is a noticeable difference between normalized spectra from the different electrodes, particularly at higher frequencies, but the result is none-the-less reassuring that textile electrodes may be usable.
Fig. 5.1a Resistance spectrum of the three electrodes Adistar, Impedimed and RedDot-3M
Fig. 5.1b Reactance spectrum of the three electrodes Adidas, Impedimed and RedDot-3M
In the next study an alternative knitted custom made textile bracelet electrode with sensor element manufactured by Clothing+ with silver fibres as conductive element was examined [paper II]. The comparison was made versus Red Dot 3M repositionable monitoring electrode with and without a skin preparation with conductive and abrasive paste. In both cases the textile
24
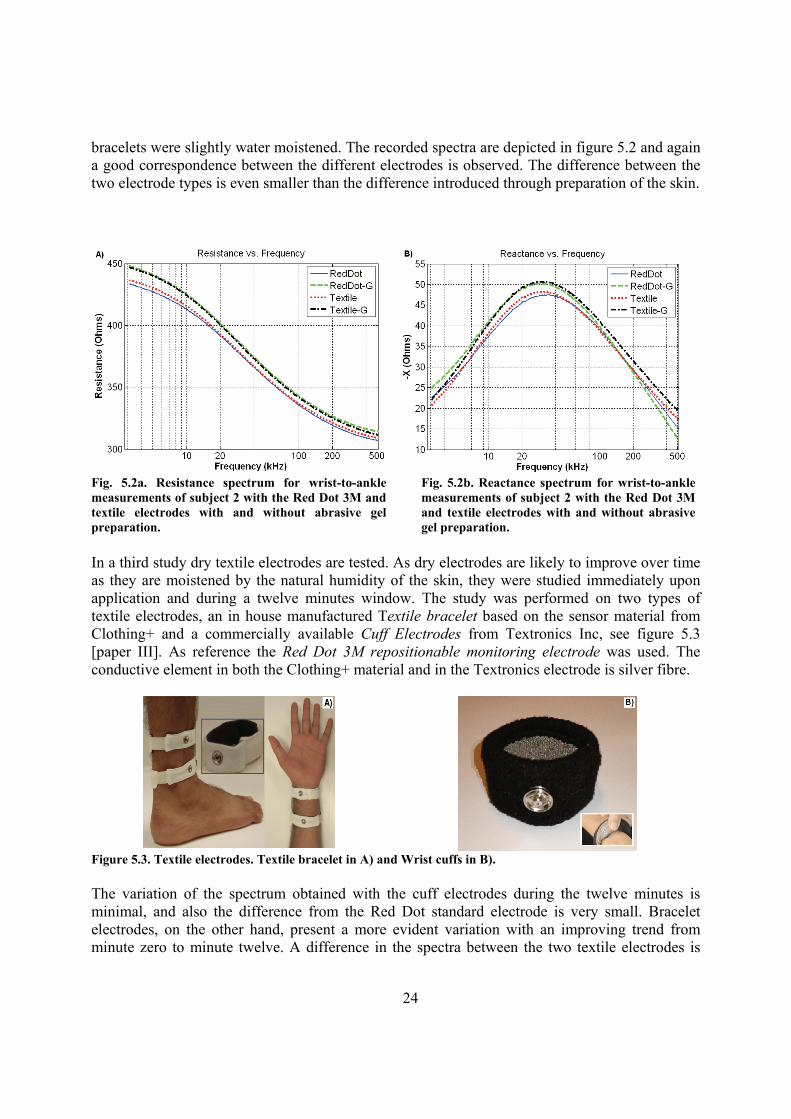
bracelets were slightly water moistened. The recorded spectra are depicted in figure 5.2 and again a good correspondence between the different electrodes is observed. The difference between the two electrode types is even smaller than the difference introduced through preparation of the skin.
Fig. 5.2a. Resistance spectrum for wrist-to-ankle measurements of subject 2 with the Red Dot 3M and textile electrodes with and without abrasive gel preparation.
Fig. 5.2b. Reactance spectrum for wrist-to-ankle measurements of subject 2 with the Red Dot 3M and textile electrodes with and without abrasive gel preparation.
In a third study dry textile electrodes are tested. As dry electrodes are likely to improve over time as they are moistened by the natural humidity of the skin, they were studied immediately upon application and during a twelve minutes window. The study was performed on two types of textile electrodes, an in house manufactured Textile bracelet based on the sensor material from Clothing+ and a commercially available Cuff Electrodes from Textronics Inc, see figure 5.3 [paper III]. As reference the Red Dot 3M repositionable monitoring electrode was used. The conductive element in both the Clothing+ material and in the Textronics electrode is silver fibre.
Figure 5.3. Textile electrodes. Textile bracelet in A) and Wrist cuffs in B). The variation of the spectrum obtained with the cuff electrodes during the twelve minutes is minimal, and also the difference from the Red Dot standard electrode is very small. Bracelet electrodes, on the other hand, present a more evident variation with an improving trend from minute zero to minute twelve. A difference in the spectra between the two textile electrodes is

25
seen and it can be attributed to the larger effective surface of the sensor material in the cuff electrode. The results are show in figure 5.4.
Figure 5.4. Spectra obtained from the EBI measurements with both textile electrodes at different times. The spectrum obtained with the Red Dot electrolytic electrode is shown as a reference value The fourth study aimed to evaluate the use of a customized electrode garment for right-side EBI measurements. The electrodes under study were a custom made prototype textile hand-wrist & foot-ankle electrodes figures 5.5 and the Impedimed electrode used as reference.
Figure 5.5. Prototype textile hand-wrist & foot-ankle electrodes In figure 5.6 the resistance spectra obtained with both electrodes present a similar frequency dependency and similar shape. However a visible magnitude difference is noticed. The textile electrodes show a lower magnitude over the whole frequency range. Correction for parasitic capacitance is performed but not perceptible in the resistance spectrum; thus, an overlap of the two traces is plotted. On the other hand, the reactance spectrum presents a more evident divergence, mostly at frequencies below 100 kHz. The divergence at higher frequencies seems to be effectively removed with the capacitance compensation.

26
Fig.5.6A. Resistance Spectrum measured with Impedimed and Textile electrodes after and before compensation for parasitic capacitance
Fig.5.6B. Reactance Spectrum measured with Impedimed and Textile electrodes after and before compensation for parasitic capacitance

27
CHAPTER 6
GENERAL DISCUSSION & CONCLUSIONS
6.1 Discussion & Conclusions
The results obtained in this research work suggest that textile electrodes can be used for EBI measurements and not only for biopotential sensing applications, such as heart rate measurement. However, the quality of measurement needs to be improved by reducing the different factors that distort the EBI spectroscopy measurements.
Conventional textile materials commonly present poor conductivity properties. However, the lack of a conductive medium, such as water or electrolytic gel in the skin-electrode interface, is probably the most significant factor that hampers the measurement. The research presented in the first and second paper showed a good agreement in the measurements with standard electrodes in the impedance spectra when either water or electrolytic gel was used as an interface medium.
As previously mentioned in Section 3.4, the electrolytic medium is an ionic conductor that increases the number of charges at the skin-electrode interface thus reducing the electrode polarization impedance. In textile electrodes that do not have electrolytic medium, it is expected that a larger value of Zep will increase the total impedance of the electrical pathway in series with the measuring load, making the EBI measurement more susceptible to capacitive leakage in the presence of parasitic capacitances[20]. Another factor of importance for the performance of textile electrodes is the proportion of conductive fibers in the sensor and the structure of the textile sensor that is in contact with the skin, i.e., the total surface of the skin-electrode interface. The third study was basically a benchmarking of two types of textile structures, and the result indicate how the electrode with a higher amount of conductive material and an uneven or rough surface produced more reliable measurements. Fabrics with sensors made of conductive fibers or material with an exposed or uneven surface, such as loops or embroidering seem to have a better skin-electrode contact and, for the same reason, better measurements can be obtained. In contrast, textiles with sensor structures with especially flat surfaces present a less uniform skin-sensor contact that is more susceptible to motion artifacts.

28
A larger sensor area, together with a more ergonomic design, also plays an important role in the quality of the measurement. In paper IV, the improved strap-electrode design placed around the hand-wrist and foot-ankle with a considerably larger sensor area produced acceptable measurements, considering the area difference and that the interface was dry. The reasons behind this may be the increased current-injecting area and the more effective electrode placement. In standard Ag/AgCl electrodes, the current injected into the body is concentrated in the proximity of the contact area defined by the electrode, with dimensions around 10 cm2. The concentrated current density decreases the effective volume used by the electrical current to flow through the portion of the body in the constriction area, resulting in larger impedance values. Conversely, electrodes with a larger injecting area surrounding the limbs have a more uniform current distribution that maximizes the effective conductive volume used by the measuring current near the injecting electrodes. This phenomenon may reduce the constriction, resulting in slightly smaller impedance values. In addition, according to some authors, the skin resistance is inversely proportional to the skin-electrode contact area [21]. Parasitic capacitances also alter the measurement in a noticeable manner. The presence of parasitic capacitances creates leakage current pathways that are parallel to the measurement load and create a current divider that reduces the current flow through the load; for this reason, the expected voltage is reduced. A reduced voltage could lead to an underestimation of the impedance of the measurement load. The parasitic capacitances seem to also be responsible for an increased capacitance in the EBI measurement, and thus influence the shifting of the characteristic frequency towards higher frequency values. The simulation explained in Section 5.2 corroborates how variations of Zep and Cpar affect the impedance measurement primarily in the capacitive spectrum and at frequencies over 50 kHz. The aforementioned aspects, as well as other possible ones not covered in this work, seem to have direct implications on the deviation of the impedance spectra and therefore influence the estimation of the Cole and BCA parameters.
6.2. Future work
The results achieved show that is feasible to obtain EBI measurements with dry textile electrodes. However, at this stage it is not completely clear whether dry textile sensors can be used for assessment on body composition because reliable Cole parameters could not be obtained. More experiments focused on the identification of the causes of the variations, and the development and testing of a third prototype that addresses issues, such as a larger sensor area, a more effective textile structure and an improved design, could provide better reliability in the measurement. Once this prototype is ready, a good validation experiment would be to measure the bioimpedance in different subjects and analysis of the TBW parameters before and after a sport activity, or in patients before and after dialysis. Measurements done with traditional electrolytic and textile electrodes could give a good reference for the performance. The availability of a textile garment with an integrated EBI spectroscopy device and embedded textile sensors would allow the implementation of EBI-based personalized monitoring health monitoring systems for body fluid distribution and shift current health care policies regarding the monitoring of patients under home-bounded dialysis treatment.

29
REFERENCES
[1]. Hännikäinen J, Vuorela T, and Vanhala J 2007 Physiological measurements in smart
clothing: a case study of total body water estimation with bioimpedance Transactions of the Institute of Measurement and Control, (29): p. 337-354.
[2]. Amft O and Habetha J, Smart medical textiles for monitoring patients with heart conditions, in Smart textiles for medicine and healthcare. Materials, systems and applications, L. Van Langenhove, Editor. 2007, Woodhead Publishing Limited. p. 275-301.
[3]. Paradiso R and De Rossi D. Advances in textile technologies for unobtrusive monitoring of vital parameters and movements. in Engineering in Medicine and Biology Society, 2006. EMBS '06. 28th Annual International Conference of the IEEE. 2006. New York.
[4]. Paradiso R, Loriga G, and Taccini N, Wearable Health Care System for Vital Signs Monitoring, in MEDICON 2004. 2004: Naples.
[5]. Ivorra A July 2003 Bioimpedance Monitoring for physicians: an overview. [6]. Cole KS, Membranes, Ions and Impulses. Second ed. 1972: University of California,
Berkeley. [7]. Agarwal R, et al. 2007 Electrical impedance plethysmography technique in estimating
pulmonary function status J Med Eng Technol, 31(1): p. 1-9. [8]. Weng TR, et al. 1986 Bioimpedance measurement with respect to pulsatile pulmonary
blood flow Aviat Space Environ Med, 57(5): p. 449-56. [9]. Sun TP, et al. 2010 The use of bioimpedance in the detection/screening of tongue cancer
Cancer Epidemiol, 34(2): p. 207-11. [10]. Milzman D, et al. 2009 Thoracic impedance vs chest radiograph to diagnose acute
pulmonary edema in the ED Am J Emerg Med, 27(7): p. 770-5. [11]. Azar R, et al. 2009 [Assessment and follow-up of nutritional status in hemodialysis
patients] Nephrol Ther, 5 Suppl 5(5): p. S317-22. [12]. Kushner RF and Schoeller DA 1986 Estimation of total body water by bioelectrical
impedance analysis Am J Clin Nutr, 44(3): p. 417-24. [13]. Patel RV, et al. 1994 Estimation of total body and extracellular water using single- and
multiple-frequency bioimpedance Ann Pharmacother, 28(5): p. 565-9. [14]. Wotton MJ, et al. 2000 Comparison of whole body and segmental bioimpedance
methodologies for estimating total body water Ann N Y Acad Sci, 904: p. 181-6. [15]. Thomas BJ, et al. 2003 A comparison of the whole-body and segmental methodologies of
bioimpedance analysis Acta Diabetol, 40 Suppl 1(1): p. S236-7. [16]. Woo EJ, et al. 1992 Skin impedance measurements using simple and compound electrodes
Med Biol Eng Comput, 30(1): p. 97-102. [17]. Pallàs-Areny R and Webster JG, Sensors and Signal Conditioning (2nd Edition), John
Wiley & Sons. [18]. Seoane F, Electrical Bioimpedance Cerebral Monitoring: Fundamental Steps towards
Clinical Application, in Signal & Systems. 2007, Chalmers University of Technology: Göteborg. p. 154.

30
[19]. Buendia R, Hook Effect on Electrical Bioimpedance Spectroscopy Measurements. Analysis, Compensation and Correction, in Biomedical Engineering. 2009, University of Borås: Borås.
[20]. Buendia R, Seoane F, and Gil-Pita R 2010 Novel Approach for Removing the Hook Effect Artefact from Electrical Bioimpedance Spectroscopy Measurements Journal of Physics: Conference Series, 224(1): p. 121-126.
[21]. J.W Clark MRN, W.H. Olson, R.A. Peura, F.P.Primiano, M.P Siedband, J.G Webster, L.A. Wheeler, Medical Instrumentation Application and Design. Fourth ed. 2010: John Wiley & Sons, Inc.
[22]. Rattfalt L, et al. 2007 Electrical properties of textile electrodes Conf Proc IEEE Eng Med Biol Soc, 2007: p. 5736-9.
[23]. Pola T and Vanhala J. Textile Electrodes in ECG Measurement. in Intelligent Sensors, Sensor Networks and Information, 2007. ISSNIP 2007. 3rd International Conference on. 2007.
31
APPENDED PAPERS
List of Papers
Paper I. Textile Electrodes for Electrical Bioimpedance Measurements. J. C. Márquez, F.Seoane, E. Välimäki and K. Lindecrantz The 6th international workshop on Wearable Micro and Nanosystems for Personalised Health, Norway Oslo 2009. Paper II. Textile Electrodes in Electrical Bioimpedance Measurements – A Comparison with Conventional Ag/AgCl Electrodes. J. C. Marquez, F. Seoane, E. Välimäki and K. Lindecrantz The 31st Annual International Conference of the IEEE Engineering in Medicine and Biology Society, EMBC 2009, Minneapolis USA 2009. Paper III. Comparison of Dry-Textile Electrodes for Electrical Bioimpedance Spectroscopy Measurements. J C Márquez, F Seoane, E Välimäki and K Lindecrantz The XIVth International Conference on Electrical Bioimpedance, Florida USA 2010 Paper IV. Textile Electrode Straps for Wrist-to-Ankle Bioimpedance Measurements for Body Composition Analysis. Initial Validation & Experimental Results. J. C. Marquez, J. Ferreira F. Seoane, R. Buendia, and K. Lindecrantz The 32nd Annual International Conference of the IEEE Engineering in Medicine and Biology Society, EMBC 2010, Buenos Aires Argentina 2010.
Textile Electrodes for Electrical Bioimpedance Measurements
J. C. Márquez 1,2, F.Seoane1,2, E. Välimäki3,4 and K. Lindecrantz1,2 1School of Engineering, University of Borås, SE-501 90 Borås, SWEDEN
2Department of Signal & Systems, Chalmers University of Technology, SE-41296, Gothenburg, SWEDEN [email protected]
[email protected] 3Swedish School of Textiles, University of Borås, SE-501 90 Borås, SWEDEN
4Institute of Fibre Material Science, Tampere University of Technology, Tampere, 33720,FINLAND [email protected]
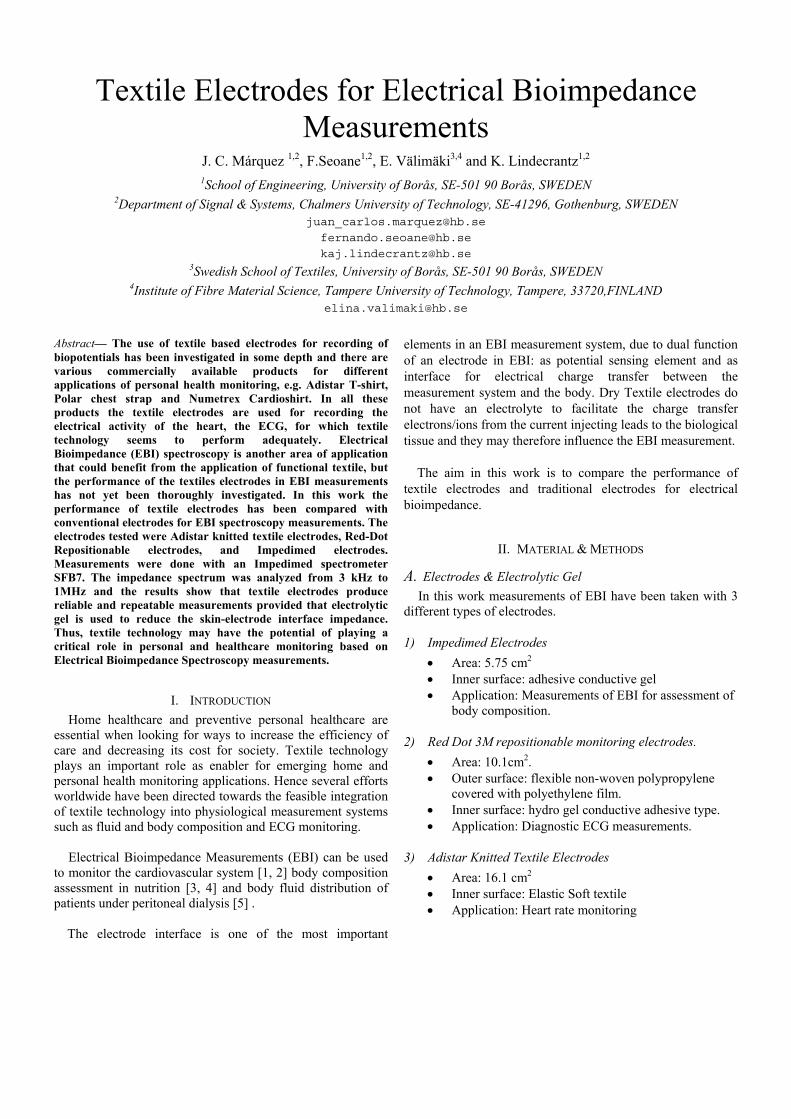
Abstract— The use of textile based electrodes for recording of biopotentials has been investigated in some depth and there are various commercially available products for different applications of personal health monitoring, e.g. Adistar T-shirt, Polar chest strap and Numetrex Cardioshirt. In all these products the textile electrodes are used for recording the electrical activity of the heart, the ECG, for which textile technology seems to perform adequately. Electrical Bioimpedance (EBI) spectroscopy is another area of application that could benefit from the application of functional textile, but the performance of the textiles electrodes in EBI measurements has not yet been thoroughly investigated. In this work the performance of textile electrodes has been compared with conventional electrodes for EBI spectroscopy measurements. The electrodes tested were Adistar knitted textile electrodes, Red-Dot Repositionable electrodes, and Impedimed electrodes. Measurements were done with an Impedimed spectrometer SFB7. The impedance spectrum was analyzed from 3 kHz to 1MHz and the results show that textile electrodes produce reliable and repeatable measurements provided that electrolytic gel is used to reduce the skin-electrode interface impedance. Thus, textile technology may have the potential of playing a critical role in personal and healthcare monitoring based on Electrical Bioimpedance Spectroscopy measurements.
I. INTRODUCTION Home healthcare and preventive personal healthcare are
essential when looking for ways to increase the efficiency of care and decreasing its cost for society. Textile technology plays an important role as enabler for emerging home and personal health monitoring applications. Hence several efforts worldwide have been directed towards the feasible integration of textile technology into physiological measurement systems such as fluid and body composition and ECG monitoring.
Electrical Bioimpedance Measurements (EBI) can be used
to monitor the cardiovascular system [1, 2] body composition assessment in nutrition [3, 4] and body fluid distribution of patients under peritoneal dialysis [5] .
The electrode interface is one of the most important
elements in an EBI measurement system, due to dual function of an electrode in EBI: as potential sensing element and as interface for electrical charge transfer between the measurement system and the body. Dry Textile electrodes do not have an electrolyte to facilitate the charge transfer electrons/ions from the current injecting leads to the biological tissue and they may therefore influence the EBI measurement.
The aim in this work is to compare the performance of
textile electrodes and traditional electrodes for electrical bioimpedance.
II. MATERIAL & METHODS
A. Electrodes & Electrolytic Gel In this work measurements of EBI have been taken with 3
different types of electrodes.
1) Impedimed Electrodes • Area: 5.75 cm2 • Inner surface: adhesive conductive gel • Application: Measurements of EBI for assessment of
body composition.
2) Red Dot 3M repositionable monitoring electrodes. • Area: 10.1cm2. • Outer surface: flexible non-woven polypropylene
covered with polyethylene film. • Inner surface: hydro gel conductive adhesive type. • Application: Diagnostic ECG measurements.
3) Adistar Knitted Textile Electrodes • Area: 16.1 cm2 • Inner surface: Elastic Soft textile • Application: Heart rate monitoring

4) Lectro Derm 1Gel • A conductive electrolytic gel manufactured by
Stockholms Analytiska Lab AB.
Fig. 1 Size of the electrodes. A) Adistar electrodes and B) RedDot-3M electrodes.
B. EBI Measurements Using the 4-Electrode method, measurements of complex
EBI have been taken in three healthy subjects from the ankle to the wrist. The measurements have been performed with Impedimed SFB7 spectrometer in the range from 3 kHz to 1 MHz. The performed measurements have been taken with all the three different types of electrodes: Impedimed, RedDot 3M and Adistar textile. N.B for the EBI measurements taken with the textile electrodes, to improve the Dry electrode-skin interface, electrolytic Lectro Derm 1 gel has been used.
C. Impedance Data Analysis and Visualization For each type of electrode and each subject 100 EBI
measurements have been taken. The obtained data have been averaged and resistance and reactance have been plotted in against frequency.
III. RESULTS A. Reactance & Resistance Spectrum
In Figures 2 and 3 it is possible to see certain differences in the impedance spectra obtained with the three electrodes. The observed differences are more appreciable at higher than at lower frequencies in both the resistance and reactance spectra. Nevertheless the reactance spectrum exhibits a higher grade of divergence for the three measurements compared to the resistance spectrum.
In Figure 2, it is possible to perceive a significant
coincidence in the normalized spectra for both electrolytic electrodes whereas the spectrum obtained with the textile electrodes deviates slightly.
Fig. 2 Resistance spectrum of the three electrodes Adistar, Impedimed and RedDot-3M
In the case of the reactance spectrum in Figure 3, it is observed a relevant coincidence in the spectra obtained with the textile electrode and the RedDot 3M electrode for most of the frequency range under study. In this figure it is possible to observe that the measurements that deviate slightly from the rest are the measurements obtained with the Impedimed electrodes.
In any case the observed discrepancies do not reveal
significant difference in the spectra . However in Figure 2 it is clearly perceived a small disparity in the normalized resistance spectrum obtained with the Adistar electrodes for frequencies above 100 kHz while in the normalized reactance spectrum the changes are negligible below 500 kHz.
Fig. 3 Reactance spectrum of the three electrodes Adidas, Impedimed and RedDot-3M

IV. .DISCUSSION The results presented in figures 2 and 3 indicate that the
performance of the Adistar textile electrodes with electrode gel it is similar to the performance of conventional electrolytic electrodes.
Initially, we expected to observe a much larger differences
in the measured spectrum than the observed ones due to the expected difference polarization impedances and the impedance of the electrode-skin interface. It was assumed that the expected higher polarization of the textile electrodes and interface impedance would influence in the EBI measurement, especially in relation to the influence of parasitic impedances in parallel with the load or in parallel with the output of the current source. That is, the higher impedance in the injected current pathway with textile than with electrolytic electrodes would increase the effect of the current divider created by any parasitic capacitance present in parallel with the load in to the EBI measurement. We can see certain effect of that kind in the resistance plot, decreasing the resistance of the measurement with frequency, but it is very slight difference.
The observed difference in the measurement can be due to
the fact that area of the textile electrode is much larger than area of the electrolytic electrodes and in addition electrolytic gel has been added to the textile electrodes. These two facts may have contributed a lot to decrease the interface impedance created by the electrode polarization impedance and the electrode-skin interface. Therefore the possible effects cause by an increasing in the impedance in the current pathway can be lower than expected.
V. CONCLUSION The results suggest that the Adistar textile electrodes
perform very well for measurements of Electrical Bioimpedance. Nevertheless there are slight differences in the obtained spectra, but this difference might not cause any difference when performing a spectroscopy analysis for a specific Electrical Bioimpedance application. These cases deserve to be studied further for the specific application of measurements of Electrical Bioimpedance, for instants assessment of body composition.
The effect of the difference in the electrode area and the
effect of the application of the electrolytic gel on the electrode polarization impedance and the electrode-skin interface impedance require specific attention.
Preliminary results suggest that textile electrodes can be
used not only for biopotential sensing applications like heart rate measurements but also for measurements of Electrical Bioimpedance. The good performance of the obtained measurements encourages continued investigation of basic aspects of the use of textile electrodes application of Electrical Bioimpedance.
REFERENCES 1] J. Habetha, "The MyHeart project--fighting cardiovascular diseases by
prevention and early diagnosis," Conf Proc IEEE Eng Med Biol Soc, vol. Suppl, pp. 6746-9, 2006.
[2] O. Amft and J. Habetha, "Smart medical textiles for monitoring patients with heart conditions," in Smart textiles for medicine and healthcare. Materials, systems and applications, L. Van Langenhove, Ed.: Woodhead Publishing Limited, 2007, pp. 275-301.
[3] C. Earthman, D. Traughber, et al., "Bioimpedance spectroscopy for clinical assessment of fluid distribution and body cell mass," Nutr Clin Pract, vol. 22, pp. 389-405, Aug 2007.
[4] U. G. Kyle, I. Bosaeus, et al., "Bioelectrical impedance analysis-part II: utilization in clinical practice," Clin Nutr, vol. 23, pp. 1430-53, Dec 2004.
[5] F. Zhu, G. Wystrychowski, et al., "Application of bioimpedance techniques to peritoneal dialysis," Contrib Nephrol, vol. 150, pp. 119-28, 2006.

Fig. 1 Textile bracelet electrode prototype for wrist and ankle
Abstract— Work has been intensified around the integration of textile and measurement technology for physiological measurements in the last years. As a result nowadays it is possible to find available commercial products for cardiovascular personal healthcare monitoring. Most of the efforts have been focused in the acquisition of EKG for cardiovascular monitoring where textile electrodes have shown satisfactory performance. Electrical Bioimpedance is another type of physiological measurement that can be used for personal healthcare monitoring where the integration and the performance of the textile electrodes has not been investigated that thoroughly.
In this work, the influence of the textile electrodes on the measurements and on the estimation of the Cole (R0 , R∞, fC and α) and body composition (TBW, ICW, ECW and FFM) parameters has been especially addressed. Complex Spectroscopy 4-electrode wrist-to-ankle electrical bioimpedance measurements taken with conventional Ag/AgCl and textile- electrodes on customized bracelets have been compared and analyzed in the frequency range 3 to 500 kHz.
The obtained results suggest that the use of textile electrodes do not influence remarkably on the complex spectral measurements neither in the estimation of Cole nor body composition parameter. In any case any possible effect introduced by the use of textile is smaller than the effect of preparing the skin by the using abrasive conductive paste.
I. INTRODUCTION ERSUING to reduce costs for society, there is an ongoing shift in paradigm within healthcare towards home
healthcare and preventive Personal Healthcare. The emerging home and personal health monitoring applications require a combination of several technologies for the implementation of what is call E-health applications and services.
Textile technology has been identified as the key element to catalyze the proliferation of E-health monitoring
Manuscript received April 23, 2009. This work was supported in part by the Mexican Conacyt under Scholarship 304684.
J.C. Márquez is with the School of Engineering at the University of Borås, 501 90 SWEDEN and the Department of Signals & Systems at Chalmers University of Technology. (phone:+46334354630; fax: +46334354408, [email protected]).
F. Seoane is with the School of Engineering at the University of Borås, 501 90 SWEDEN and the Department of Signals & Systems at Chalmers University of Technology. ([email protected]).
K Lindecrantz is with the School of Engineering at the University of Borås, 501 90 SWEDEN and the Department of Signals & Systems at Chalmers University of Technology. ([email protected]).
E. Välimäki is with the Swedish School of Textiles at the University of Borås, 501 90 SWEDEN and the Tampere University of Technology ([email protected]).
application for Home and Personal health care. Thus several research initiatives have been dedicated worldwide to investigate the feasibility of integrating textile technology into physiological Measurements System.
Measurements of Electrical Bioimpedance (EBI) can be used to monitor the cardiovascular personal health care [1, 2] body composition assessment in nutrition [3, 4] and body fluid distribution of patients under peritoneal dialysis [5].
The electrode is one of the most influential elements in an EBI measurement system, because electrodes do not only function as potential sensing elements but also as electrical charge interface between the measurement system and the body. Dry Textile electrodes do not have an electrolyte to facilitate the charge transfer, electrons or ions, from the current injecting leads to the biological tissue and this may influence the EBI measurement.
In this work, the influence of textile electrodes in the acquisition measurements of EBI first and later in the estimation of body composition contents is studied.
II. MATERIAL & METHODS In this study textile electrodes are compared with
conventional Ag/AgCl electrodes with respect to their ability to perform in spectroscopy measurement of complex EBI. The obtained complex spectra have been compared and used for estimation of body composition parameters. The variability of obtained parameters has also been studied.
A. Electrodes & Electrolytic Paste 1) Textile bracelet for wrist and ankle • Width: 2.5 cm & length: adjustable, velcro fastener. • Inner surface, sensor: Synthetic wrap knitted textile
material with silver fibre as a conductive element. Sensor Manufactured by Clothing+ and developed by Elina Välimäki.
• Application: body monitoring in medical and healthcare applications.
• Outer material, garment: knitted cotton with
Textile Electrodes in Electrical Bioimpedance Measurements – A Comparison with Conventional Ag/AgCl Electrodes
J. C. Marquez, F. Seoane, E. Välimäki and K. Lindecrantz
P

elastane. 2) Red Dot 3M repositionable monitoring electrodes. • Area: 10.1cm2 with a snap-button connector. • Outer surface: flexible non-woven polypropylene
covered with polyethylene film. • Inner surface: hydro gel conductive adhesive type. • Application: diagnostic ECG measurements.
3) EVERY Paste • Conductive and abrasive paste manufactured by
spes medica.
B. Measurements & Analysis Using the 4-Electrode method wrist-to-ankle Electrical
Bioimpedance Spectroscopy (EBIS) measurements have been taken in four healthy subjects: 3 male and 1 female. See Fig.2. The Impedimed SFB7 spectrometer has been used to measure between 3 to 1000 kHz for the four different types of measurement: Red Dot 3M and Textile, with and without paste in both cases. N.B. The textile electrodes were slightly wet for the measurements.
1) Spectral Analysis 100 measurements have been taken for each type of
measurement and both the reactance and the resistance spectra in the frequency range of 3 to – 500 kHz have been statistically analyzed and plotted with Matlab. The analysis was limited to 500 kHz following the recommendation of Scharffeter in [6]. From the measurements the Cole parameters, R0, R∞, α and fC have been also estimated using BioImp software.
2) Body Composition & Cole Analysis The obtained EBIS measurements have been process with the BioImp software to estimate the body composition parameters, TBW, ICW, ECW, and FFM, of each of the healthy subjects.
III. RESULTS
A. Impedance Spectrum Figures 3 and 4 show that the spectra of the measurements
with Ag/AgCl and with the textile bracelets do not exhibit any marked differences. In Fig. 3 it is possible to appreciate the coincidence on the resistance spectra between the Ag/AgCl and the textile electrode measurements. Fig. 4 shows that the coincidence is high but not as high as in the resistance spectra, especially at low and high frequencies where the spectra of the reactance differ the most.
TABLE I MEAN VALUE OF THE ESTIMATED COLE PARAMETERS FROM EBI MEASUREMENTS WITH TEXTILE & ELECTROLYTIC ELECTRODES WITH & WITHOUT GEL
R0 (Ω) R∞ (Ω) fC (kHz) α S 3M Tex 3M_G Tex_G 3M Tex 3M_G Tex_G 3M Tex 3M_G Tex_G 3M Tex 3M_G Tex_G
1 424.0 445.3 447.9 439.4 265.9 282.5 276.6 276.7 31.1 29.8 29.6 31.1 0.728 0.711 0.714 0.713 2 461.4 439.5 478.4 464.6 301.0 288.4 310.9 301.7 35.7 37.1 32.7 36.9 0.709 0.717 0.702 0.706 3 581.9 567.3 595.3 581.4 425.3 410.2 420.6 417.4 41.7 42.0 40.9 40.5 0.714 0.721 0.701 0.721 4 449.4 451.6 465.5 463.7 295.9 298.1 305.0 299.0 32.9 33.0 29.5 33.4 0.705 0.713 0.713 0.702 N.B. the index _G indicates the use of abrasive conductive gel for that type of measurements
Fig. 3. Resistance spectrum for wrist-to-ankle measurements of subject 2with the Red Dot 3M and textile electrodes with and without gel.
Fig. 4. Reactance spectrum for wrist-to-ankle measurements of subject 2 with the Red Dot 3M and textile electrodes with and without gel.
Fig. 2 Measurement protocol for the performed EBIS measurements with Ag/AgCl and textile electrodes.

On the other hand, Figures 3 and 4 show that the use of conductive paste introduces more noticeable differences. Fig. 3 shows that resistance increases at all frequencies while Fig. 4 shows an increase in reactance up to frequencies around 150kHz with the use of conductive paste in the case of electrolytic electrodes and from 4 kHz and above of textile electrodes. Notice that above 200 kHz the reactance measured by the Red Dot 3 decreases remarkably.
B. Cole Parameters Table I contains the mean values for the Cole parameters
estimated from each type of measurements and for all the subjects, while Fig. 4 contains the minimum, maximum and mean values for the Cole parameters estimated for subject 4.
1) R0 and R∞ estimation The values in Table I indicates that the mean of the
observed differences, with the exception of R0 estimation for subject 1, are below 5% and occur in both directions.
2) α estimation According to Table I, the maximum observed difference
in mean of the estimated values is smaller than 2.4%. 3) fC estimation
In this case, according to Table I, the mean of the deviations do not reach the 4.4%. In the case of using abrasive electrolytic paste, the use of textile electrodes creates an overestimation of fC.
4) Influence of application of abrasive conductive paste Looking at Table I it is possible to see that the differences
observed between the estimation done with textile electrodes and with conventional Ag/AgCl is smaller in the case of using abrasive conductive paste than without it for the estimation of R0 and R∞.
C. Body Composition Analysis Table II contains the mean values for the Cole parameters
estimated from each type of measurements and for all the subjects while Fig. 6 contains the minimum, maximum and mean values for the Body Composition parameters estimated for subject 4.
1) Total Body Water According to Table II, the use of textile electrodes do not
introduce a remarkable difference. In Fig. 6.A) it is possible to observe that the range of the estimations of TBW presents noticeable overlaps. The only remarkable difference occurs for subject 1 where the difference reaches 4%.
2) Body Fluid Distribution The mean values in Table II for estimation ECF and ICF
exhibit differences below 2%, that is similar to the dynamic range of the estimation for a single type of measurement in a single subject, see Fig. 6.B.
3) Fat Mass In this case the mean values show larger relative
differences, up to 14% in subject 1.
Fig. 6. BCA Parameters estimated from wrist-to-ankle measurements of subject 4 with the Red Dot 3M and textile electrodes with and without gel.
Fig. 5. Cole Parameters estimated from wrist-to-ankle measurements of subject 4 with the Red Dot 3M and textile electrodes with and without gel.
TABLE II BODY COMPOSITION PARAMETERS ESTIMATED FROM EBI MEASUREMENTS WITH TEXTILE & ELECTROLYTIC ELECTRODES WITH & WITHOUT GEL
TBW (%) ECF (%) FM (%)
Subject 3M Tx 3M_g Tx_g 3M Tx 3M_g Tx_g 3M Tx 3M_g Tx_g 1 57.0 54.5 55.7 55.4 50.3 50.8 49.6 50.5 22.2 25.5 23.9 24.3 2 52.7 54.2 51.7 52.7 52.2 52.5 52.0 52.0 28.0 26.0 29.4 28.0 3 46.1 47.5 47.1 47.0 59.9 59.3 57.9 58.9 37.0 35.2 35.7 35.8 4 60.2 59.9 59.1 60.2 52.7 52.8 52.4 51.6 17.7 18.2 19.2 17.8
N.B. The ECF and ICF and complementary parameters, related by ECF (%) = 1- ICF (%)

4) Influence of application of abrasive conductive paste From Table II, In general no remarkable influence can be
observed in the use of textile electrodes with or without conductive paste. But the differences observed in TBW (%) when using textile electrodes are slightly smaller with conductive paste.
IV. DISCUSSION
A. Influence of the use of the Textile Electrodes Since the textile electrodes do not have any electrolytic
properties like an Ag/AgCl electrode, it would be expected that an increase in the Electrode Polarization impedance, Zep, would caused more noticeable changes in the measurements, but such remarkable difference has not been observed. This can be due to the fact the textile electrodes were wet prior the measurement. Wetting the textile electrodes is necessary in order to obtain any measurement and it improves the electrical interface between the electrode and the body. Thus by wetting the surface of the electrode the Zep of the textile electrode might not be much larger than the Zep of the Conventional Ag/AgCl Electrode.
To apply electrolytic gel onto the textile electrode should decrease the Zep as much as using water providing a reliable measurement. The use of electrolytic gel on textile electrodes for EBI measurements has been studied already in [7] reporting good obtained measurement performance.
Motion artifacts are a source of error in any wearable systems and even when the use of knitted structures as pointed in [8] decrease textile structure-related motion artifact, additional tests should be performed to study the influence of activity-related motion artifacts.
B. Influence of the use of the abrasive conductive paste Preparing the skin using abrasive conductive paste would
improve the interface resistance by removing dead cells from the skin, increasing the number of free charges available for the charge transfer process and increasing the humidity of the most superficial skin layer. Reducing the Zep reduces the total impedance of the electrical path that the injecting current should use through the body making the measurement more insensitive to influence of any parasitic capacitance that might be present with the load.
Decreasing the impedance of the current signal pathway would minimize the effect of small increments of Zep that could be introduced by using textile electrodes. There is not much information available about the influence of the Zep on EBI measurements but we see a direct relationship between Zep and the effects of parasitic capacitances that deserves to be investigated further.
The observed slight reduction in the differences estimation R0 and TBW(%) when using textile electrodes is due to the fact the body Composition Analysis method use by the BioImp estimates TBW(%) from R0 and R∞ [9].
V. CONCLUSION The reported results suggest that the use of these textile
electrodes instead of conventional 3M Red Dot does not significantly influence the EBI measurement. The spectral measurements obtained with textile electrodes and with conventional Ag/AgCl agree well and therefore the Cole and the body composition parameter that are estimated from EBI spectra do present any remarkable difference either.
On the other hand the use of abrasive conductive paste does introduce changes in the spectrum that are more noticeable than the changes introduce by the textile electrodes. Therefore any influence that the use of textile might introduce is not as strong as the influence of the use of abrasive conductive past.
This work initially suggests that textile electrodes can be use for EBI measurements for body composition assessment by Bioimpedance Spectroscopy analysis. Nevertheless, the role and influence of Zep on the EBI measurement should be investigated further to extend the work done by Medrano in [10], especially targeting the effects of conductive gels and the relationship of Zep with eventual parasitic capacitances.
REFERENCES [1] J. Habetha, "The MyHeart project--fighting cardiovascular diseases
by prevention and early diagnosis," Conf Proc IEEE Eng Med Biol Soc, vol. Suppl, pp. 6746-9, 2006.
[2] O. Amft and J. Habetha, "Smart medical textiles for monitoring patients with heart conditions," in Smart textiles for medicine and healthcare. Materials, systems and applications, L. Van Langenhove, Ed.: Woodhead Publishing Limited, 2007, pp. 275-301.
[3] C. Earthman, D. Traughber, et al., "Bioimpedance spectroscopy for clinical assessment of fluid distribution and body cell mass," Nutr Clin Pract, vol. 22, pp. 389-405, Aug 2007.
[4] U. G. Kyle, I. Bosaeus, et al., "Bioelectrical impedance analysis-part II: utilization in clinical practice," Clin Nutr, vol. 23, pp. 1430-53, Dec 2004.
[5] F. Zhu, G. Wystrychowski, et al., "Application of bioimpedance techniques to peritoneal dialysis," Contrib Nephrol, vol. 150, pp. 119-28, 2006.
[6] H. Scharfetter, P. Hartinger, et al., "A model of artefacts produced by stray capacitance during whole body or segmental bioimpedance spectroscopy," Physiological Measurement, vol. 19, pp. 247-261, 1998.
[7] J. C. Márquez, F. Seoane, et al., "Textile Electrodes for Electrical Bioimpedance Measurements," in International Workshop on Wearable, Micro and Nano Technologies for the Personalised Health, pHealth 2009Oslo, 2009.
[8] J.Stefan Karlsson, Urban Wiklund,, et al., "Wireless Monitoring of Heart Rate and Electromyographic Signals using a Smart T-shirt," in International Workshop on Wearable, Micro and Nano Technologies for the Personalised Health, pHealth 2008Valencia, 2008.
[9] R. Gudivaka, D. A. Schoeller, et al., "Single- and multifrequency models for bioelectrical impedance analysis of body water compartments," J Appl Physiol, vol. 87, pp. 1087-96, Sep 1999.
[10] G. Medrano, A. Ubl, et al., "Skin Electrode Impedance of Textile Electrodes for Bioimpedance Spectroscopy," in 13th International Conference on Electrical Bioimpedance and the 8th Conference on Electrical Impedance Tomography, 2007, pp. 260-263.

Comparison of Dry-Textile Electrodes for Electrical Bioimpedance Spectroscopy Measurements.
J C Márquez 1,2, F Seoane1,2, E Välimäki3,4 and K Lindecrantz5 1School of Engineering, University of Borås, SE-501 90 Borås, SWEDEN 2Department of Signal & Systems, Chalmers University of Technology, SE-41296, Gothenburg, SWEDEN
3Swedish School of Textiles, University of Borås, SE-501 90 Borås, SWEDEN 4Institute of Fibre Material Science, Tampere University of Technology, Tampere, 33720, FINLAND
5School of Technology and Health, Royal Institute of Technology, SE-141 52 Huddinge, SWEDEN
E-mail: [email protected]
Abstract.Textile Electrodes have been widely studied for biopotentials recordings, specially for monitoring the cardiac activity. Commercially available applications, such as Adistar T-shirt and Textronics Cardioshirt, have proved a good performance for heart rate monitoring and are available worldwide. Textile technology can also be used for Electrical Bioimpedance Spectroscopy measurements enabling home and personalized health monitoring applications however solid ground research about the measurement performance of the electrodes must be done prior to the development of any textile-enabled EBI application. In this work a comparison of the measurement performance of two different types of dry-textile electrodes and manufacturers has been performed against standardized RedDot 3M Ag/AgCl electrolytic electrodes. 4-Electrode, whole body, Ankle-to-Wrist EBI measurements have been taken with the Impedimed spectrometer SFB7 from healthy subjects in the frequency range of 3kHz to 500kHz. Measurements have been taken with dry electrodes at different times to study the influence of the interaction skin-electrode interface on the EBI measurements. The analysis of the obtained complex EBI spectra shows that the measurements performed with textile electrodes produce constant and reliable EBI spectra. Certain deviation can be observed at higher frequencies and the measurements obtained with Textronics and Ag/AgCl electrodes present a better resemblance. Textile technology, if successfully integrated it, may enable the performance of EBI measurements in new scenarios allowing the rising of novel wearable monitoring applications for home and personal care as well as car safety.
1. Introduction Textile technology might play an essential role enabling home and personal healthcare systems and applications. Measurements of Electrical Bioimpedance (EBI) are being uses for cardiovascular monitoring[1], body composition assessment [2] and other monitoring applications that could benefit significantly from smart textile technology. The reliability of physiological measurements obtained

with textile-enabled measurements systems must be ensured prior obtaining any satisfactory optimal integration of textile technology in a health-related measurement system.
Recent developments in textile technology have made available textile electrodes [3] that can function as sensors in non-invasive physiological measurements[4]. In an EBI measurement the electrode has a determinant role in the system due to its double function in the system: as potential sensing elements and as electrical charge interface between the measurement system and the body. The absence of an electrolyte compound in the composition of textile electrodes may impede the charge transfer from the current injecting terminals into the body, thus affecting the measurement.
In this work the performance of two different kinds of dry-textile electrodes from two manufacturers are compared against the performance of typical Ag/AgCl electrolytic electrode, observing the possible influence of time in the obtained EBI complex spectra.
2. Material & Methods In this study ankle-to-wrist EBI spectroscopy measurements have been done on three healthy subjects lying supine in a resting state at different times, using two types of textile electrodes and conventional electrolytic electrodes. The EBI spectra obtained with textile and electrolytic electrodes have been studied in order to assess their resemblance.
2.1. Electrodes For this comparative, three different types of electrodes have been used: textile bracelets, wrist cuffs both shown in Figure 1 A) and B) respectively and sticky electrolytic Ag/AgCl pads.
2.1.1. Textile bracelet.- The bracelet has been custom made with a width of 2.5 cm and adjustable length. The material of the inner surface is the electrode sensor manufactured by Clothing+ with synthetic wrap knitted textile material with silver fibre as a conductive element. The outer material of the bracelet is knitted cotton with spandex and Velcro for fastening it around the wrist and ankle.
2.1.2. Wrist/Ankle Cuffs Electrode.- The cuffs are manufactured by Textronics Inc. and made of polyamide (nylon) 15%, conductive fibres 30%, Spandex 20% and polypropylene 35%. The conductive textile material is knitted in the inner surface of the cuff electrode.
2.1.3. Electrolytic electrode.- The electrode is a repositionable electrode of the RedDot series manufactured by 3M with conductive and adhesive hydro gel. The electrode patch is rectangular with an area of 10.1cm2 a snap-button connector.
2.2. Measurements & Analysis EBI measurements with textile electrodes have been taken at four different times in a time window of 12 minutes with the Impedimed SFB7 spectrometer in the frequency range 3-500 kHz. The obtained EBI measurements have been compared with a final measurement taken with electrolytic electrodes. The comparison, based in a relative error analysis, has been made studying the deviation observed from the complex spectral values obtained with the electrolytic electrodes.
Figure 1. Textile electrodes. Textile bracelet in A) and Wrist cuffs in B).

Figure 2. Spectra obtained from the EBI measurements with both textile electrodes at different times. The spectrum obtained with the electrolytic electrode is shown as a reference value.
3. Results
3.1. Complex EBI Spectrum Figure 1 contains the EBI spectra obtained with both textiles, dotted trace for the bracelet and continuous trace for the cuff, at two different times indicated by a circular marker. The EBI spectra obtained with electrolytic electrodes is included for comparison purposes with dashed trace. In the case of the resistance spectrum, depicted in Figure 2.a), the only spectrum that is remarkably different from the rest is the one obtained with the bracelet electrodes for t=0. The same EBI measurement taking 12 minutes later exhibit a better resemblance. In the case of the reactance spectrum, depicted in Figure 2.b), only the measurements obtained with the elastic cuff electrodes produce an EBI spectra that closely resemblances the spectrum obtained with the electrolytic electrodes.
While Figure 1 contains the obtained spectra from the measurements on a single subject, Figure 2 presents the averaged relative error of complex impedance spectra. The error has been calculated considering the spectra obtained with the electrolytic electrode as reference.
It is clearly observed in Figure 2, that the deviation from the reference value obtained with the cuff electrodes is much smaller than the deviation obtained with the bracelet electrodes. The deviation obtained with the cuff electrodes exhibit also a smaller frequency dependency.
In Figure 3, it is also possible to observe certain time dependency. The relative error obtained with the bracelets exhibit a denoted time dependency that suggests that the error decreases with time. In the
Figure 3. Mean relative error of the resistance and reactance averaged among three subjects for both textile electrodes at different times

case of the cuff electrodes such trend cannot be confirmed, since in most of the frequency range the deviations obtained are very similar.
The mean impedance relative error depicted in Figure 3 is obtained as the mean of the relative errors for the reactance and the resistance, averaged for the three subjects. Therefore, the differences between resistance and reactance for each of the subjects cannot be evaluated from Figure 3 alone. In order to study the error obtained in the resistance and the reactance as well as the time dependency for each of the subjects, the averaged sum of the relative errors have been calculated for both resistance and reactance spectra specifically at four different times for both textile electrodes. The obtained values are presented in Table 1.
In Table 1, the averaged sum values of the resistance and reactance relative errors are presented. From this table is possible to observe that in terms of the averaged sum of relative error the deviation obtained from the resistance spectrum is smaller than the produced in the reactance. The deviation obtained from de resistance measurements with both type of textile electrodes follow the same general trend seen in Figure 1, time reduces the obtained deviation. Therefore the averaged sum of the relative error for the measurements taken after minute 12 are smaller than the ones obtained at t=0. In the case of the reactance spectrum, the bracelet electrodes follow the general trend previously indicated while the deviation obtained with the cuff electrodes does not exhibit any specific trend.
When comparing the deviation obtained with both type of electrodes, it is easy to notice that for all cases with the exception of one, the deviation obtained with the cuff electrodes is smaller.
4. Discussion The results obtained showed that the EBI measurements done with both textiles electrodes present reliable and repetitive measurements for the resistance spectrum. The error obtained with the bracelet electrodes for the reactance spectrum is very high while the reactance spectra obtained with the cuffs present exhibit a relatively low deviation.
Certain improvements can be observed on the performed spectroscopy measurements. In the case of the measurements taken with the bracelets an improvement can be observed especially in the reactance spectrum, where the initial error is significantly high. In the case of the measurements obtained with the electrode cuff such improvement cannot be notice, but this can be due to the fact that the error is much smaller. Such a smaller error can be due to the fact that the textile sensor used in the cuff exhibits a higher conductivity and the surface of the conductive sensor is also much larger than in the case of the bracelets. Such higher conductivity combined with a larger surface may improve significantly the electrode-skin interface.
5. Conclusion The results obtained suggest a general good performance of textile electrodes when measuring
resistance. The reactance spectrum obtained with the bracelets is not reliable enough while the reactance spectrum obtained with the cuff electrodes is more reliable. Moreover to be able to assess on
Table 1. Averaged Sum of the Relative Error of the Resistance and Reactance Spectrum for both Textile Electrodes at Several Times.
RESISTANCE SPECTRUM REACTANCE SPECTRUM Subject 1 Subject 2 Subject 3 Time Subject 1 Subject 2 Subject 3
Bracelet Cuffs Bracelet Cuffs Bracelet Cuffs (min) Bracelet Cuffs Bracelet Cuffs Bracelet Cuffs
0,022 0,056 0,128 0,090 0,039 0,022 0 0,259 0,095 6,767 0,125 0,969 0,077 0,019 0,058 0,123 0,080 0,065 0,016 4 0,239 0,102 2,567 0,147 0,151 0,093 0,015 0,056 0,112 0,072 0,045 0,015 8 0,218 0,111 5,585 0,154 0,135 0,092 0,022 0,054 0,115 0,076 0,024 0,010 12 0,218 0,092 2,397 0,187 0,377 0,085
0,020 0,056 0,120 0,080 0,043 0,016 Mean 0,234 0,100 4,329 0,153 0,408 0,087

their reliability for EBI applications for body composition further analysis must be done, especially regarding the estimation of the Cole parameters like in [5]. With Home monitoring applications in mind, further improvements in the electrode ergonomics and textile design should be done aiming to increase their usability.
The cuff electrodes apparently exhibit a better performance and stability in time and frequency than the bracelet electrodes. As this study gives no clue to whether the difference is due to material or design of the electrode further studies may point out ways to improve the performance of textile electrodes for recording of Electrical Bioimpedance.
In any case the resistance spectra from the EBI measurements obtained with the textile and electrolytic electrodes exhibit a close resemblance. Recent work done on Cole parameters estimation from EBI measurements suggest that EBI applications using Cole model-based analysis can be implemented by only measuring the spectrum of the reactance [6]. Therefore if the latter it is confirmed the implementation Textile-enabled EBI application is not so far ahead.
References [1] Habetha J 2006 The MyHeart project--fighting cardiovascular diseases by prevention and early
diagnosis Int. Conf Proc IEEE Eng Med Biol Soc Suppl: p. 6746-9 [2] Kyle UG, et al. 2004 Bioelectrical impedance analysis-part II: utilization in clinical practice
Clin Nutr 23(6): p. 1430-53 [3] De Rossi D and Lymberis A 2005 New generation of smart wearable health systems and
applications IEEE Trans Inf Technol Biomed, 9(3): p. 293-4 [4] Paradiso R, Loriga G, and Taccini N 2005 A wearable health care system based on knitted
integrated sensors IEEE Trans Inf Technol Biomed, 9(3): p. 337-44 [5] Marquez JC, et al. 2009 Textile electrodes in electrical bioimpedance measurements - a
comparison with conventional Ag/AgCl electrodes Int Conf Proc IEEE Eng Med Biol Soc, 1: p. 4816-9
[6] Ayllon D, Seoane F, and Gil-Pita R 2009 Cole equation and parameter estimation from electrical bioimpedance spectroscopy measurements - A comparative study Int Conf Proc IEEE Eng Med Biol Soc, 1: p. 3779-82

Abstract— Electrical Bioimpedance (EBI) is one of the non-invasive monitoring technologies that could benefit from the emerging textile based measurement systems. If reliable and reproducible EBI measurements could be done with textile electrodes, that would facilitate the utilization of EBI-based personalized healthcare monitoring applications. In this work the performance of a custom-made dry-textile electrode prototype is tested. Four-electrodes ankle-to-wrist EBI measurements have been taken on healthy subjects with the Impedimed spectrometer SFB7 in the frequency range 5 kHz to 1 MHz. The EBI spectroscopy measurements taken with dry electrodes were analyzed via the Cole and Body Composition Analysis (BCA) parameters, which were compared with EBI measurements obtained with standard electrolytic electrodes. The analysis of the obtained results indicate that even when dry textile electrodes may be used for EBI spectroscopy measurements, the measurements present remarkable differences that influence in the Cole parameter estimation process and in the final production of the BCA parameters. These initial results indicate that more research work must be done to in order to obtain a textile-based electrode that ensures reliable and reproducible EBI spectroscopy measurements.
I. INTRODUCTION n recent years, research and development efforts spent on functional textile and materials have positioned textile technology as an enabling element in personalized
healthcare monitoring applications [1, 2]. Several of the afore-mentioned efforts have been focused on the use of textile electrodes for non-invasive monitoring [3-5].
Measurements of Electrical Bioimpedance (EBI) have been used in several health care applications such as cardiovascular health monitoring [6], Body Composition
Manuscript received April 1, 2010. This work was supported in part by
the Mexican Conacyt under Scholarship 304684. J.C. Márquez is with the Department of Signals & Systems at Chalmers
University of Technology and with School of Engineering at the University of Borås, 501 90 SWEDEN (phone:+46334354630; fax: +46334354408, [email protected]).
J. Ferreira is with the School of Engineering at the University of Borås, 501 90 SWEDEN ([email protected])
F. Seoane is with the School of Engineering at the University of Borås, 501 90 SWEDEN and the Department of Signals & Systems at Chalmers University of Technology. ([email protected]).
R. Buendia is with the School of Engineering at the University of Borås and with the Department of Signal Theory and Communications at the University of Alcala, ES-28871, Madrid, SPAIN ([email protected])
K Lindecrantz is with the School of Engineering at the University of Borås and the School of Technology and Health at Royal Institute of Technology, SE-141 52 Huddinge, SWEDEN. ([email protected])
Analysis (BCA) for nutritional assessment [4] or monitoring body fluid balance in peritoneal dialysis patients [5].
EBI applications for home health monitoring would be greatly facilitated if textile based systems for instants integrated in cloths or furniture could produce reliable measurements. The availability of such textile-integrated measurement systems would, not only improve the comfort for the patients, but also help to place the sensing electrodes in the same position in a reliable manner.
EBI measurements taken with textile electrodes for BCA have been shown possible [7] and even good performance when producing spectroscopy measurements [8, 9]. To fully exploit the versatility that comes with textile based electrodes they should preferably function without use of electrode gel or other additional electrolyte. However, the use of dry electrodes is very likely to reduce the quality of the signals, and the aim of the presented study is to assess how much.
Thus, a textile prototype to perform EBI measurements for total BCA has been built and its performance has been experimentally tested and compared with the measurements taken with electrolytic gel electrodes.
II. MATERIAL & METHODS
A. Measurements & Analysis Electrical Bioimpedance Spectroscopy (EBIS)
measurements for Body Composition Analysis have been performed with 4-electrodes from the wrist to ankle as shown with Fig. 1. The EBI measurements were taken with Impedimed electrolytic and textile electrodes in 3 healthy subjects lying supine in a resting state.
Fig. 1. Textile electrodes prototype placement.
The EBIS measurements were made with the Impedimed
Textile Electrode Straps for Wrist-to-Ankle Bioimpedance Measurements for Body Composition Analysis. Initial Validation &
Experimental Results J. C. Marquez, J. Ferreira F. Seoane, R. Buendia, and K. Lindecrantz
I

SFB7 spectrometer in the frequency range 5 to 1000 kHz. 1) EBI Spectral Analysis
A set of 20 complex EBI measurements was taken for each subject with both types of electrodes. The mean of the reactance and resistance spectra obtained for each of the subjects and type of electrode has been studied.
2) Measurement Correction The performed EBIS measurements may be influenced by
parasitic capacitances. Therefore the obtained susceptance has been analyzed to test for capacitive artifacts and if present, it has been removed using a correction function [10].
3) Cole Model & Body Composition Analysis BCA parameters, Total Body Water (TBW), Intra Cellular
Fluid (ICF), Extra Cellular Fluid (ECF), and Fat Free Mass (FFM), and the Cole model parameters Resistance at zero frequency (R0), Resistance at infinite frequency (R∞), as well as the characteristic frequency fC have been calculated with the BioImp software.
B. Electrodes 1) Textile prototype hand-wrist & foot-ankle
• Hand-wrist: variable width & adjustable length up to 60 cm with adjustable Velcro fasteners and snap-buttons. Containing two textile-electrodes of 32 and 90 cm2, black fabric in Fig. 2.
• Foot-ankle: 7 cm width & adjustable length up to 53 cm with adjustable Velcro fasteners and snap-buttons. Containing two textile-electrodes of 163 and 117 cm2, black fabric in Fig. 2.
• Inner surface, sensor: Synthetic wrap knitted textile material with silver fiber as a conductive element. Sensor Manufactured by Clothing+.
Fig. 2. Foot-Ankle strap, up, and Hand-Ankle Textile-electrode prototype.
2) Impedimed Electrodes
• Area: 5.75 cm2 • Inner surface: adhesive conductive gel, electrode
manufactured by Impedimed ltd.
III. RESULTS
A. Complex EBI Spectrum The averaged resistance and the reactance spectra of the
measurements taken on one of the subjects are shown in Fig. 3 and 4 respectively. Both plots show the EBI data obtained with the electrolytic electrodes with solid line, while the EBI data obtained with the dry textile prototype is shown using the trace with circular markers. The trace with point maker
shows the EBI data obtained after correcting the capacitive influence present on the textile measurement.
Fig.3. Resistance Spectrum measured with Impedimed and Textile electrodes after and before correction for subject 2
Fig.4. Reactance Spectrum measured with Impedimed and Textile electrodes after and before correction for subject 2
The plots in Fig. 3 show that the resistance obtained with both types of electrodes present a similar frequency dependency but a noticeable difference in the magnitude. The resistance obtained with the textile electrodes exhibits considerable lowers values and this is seen for the resistance in all 3 subjects.
The reactance spectra plotted in Fig. 4 present a remarkable difference at frequencies lower than 100 kHz. The characteristic frequency of the impedance taken with the textiles is shifted towards higher frequencies.
B. Measurement Correction In Fig. 4 is possible to see the difference between the
measurement taken with the textile, solid trace with circular marker, and its correction with solid trace and point marker.
Table I contains the mean values estimated for the parasitic impedance for the measurements taken with the textile electrodes. The Standard Deviation (S.D) is also indicated. Note that no parasitic capacitance was found for the measurement taken with the electrolytic electrodes.
TABLE I MEAN VALUE AND STANDARD DEVIATION OF THE PARASITIC
CAPACITANCE CORRECTED IN THE TEXTILE ELECTRODES Subject 1 Subject 2 Subject 3
Mean (pF) 13,37 15,91 09,39 SD 6,10E‐13 3,51E‐13 4,66E‐13

TABEL II
MEAN VALUE OF THE COLE PARAMETERS OBTAINED WITH THE IMPEDIMED ELECTRODES AND THE TEXTILE ELECTRODES
R0 (Ω) R∞ (Ω) fC (kHz) Subject gel Textile gel Textile gel Textile
1 559,19 473,91 352,22 330,97 24,90 43,23 2 592,01 514,76 386,24 352,03 29,08 50,10 3 671,81 536,13 445,46 421,59 33,52 53,72
N.B. The data showed for the textile electrode is after the correction
C. Cole Parameters In Table II is possible to observe that the mean value of
both R0 and Rinf estimated from the textile EBI measurements are remarkable smaller than the values obtained from the EBI measurements taken with electrolytic electrodes for all 3 subjects. Notice that in the case of the parameter fC the estimated value is higher.
D. Body Composition Parameters The mean of the parameters for BCA estimated from the
performed EBI measurements are listed in Table III. Notice that the ICF parameter is not indicated since it is equal to 1-ECF.
TABEL III MEAN VALUE OF THE BODY COMPOSITION PARAMETERS OBTAINED WITH THE IMPEDIMED ELECTRODES AND THE TEXTILE ELECTRODES CORRECTED
TBW (%) ECF (%) FM (%) Subject gel Textile gel Textile gel Textile
1 56,86 57,64 40,54 44,66 22,33 21,25 2 51,32 53,89 41,88 43,78 29,89 26,37 3 57,88 56,84 42,51 50,32 20,93 22,36
N.B. The data showed for the textile electrode is after the correction
IV. DISCUSSION
A. Influence of dry textile electrodes in the measurement Standard Ag/AgCl electrodes use conductive gel that
reduces the electrode polarization impedance, Zep, facilitating the electron transfer between the measurement system and the body, thus improving the electrical interface between the electrode and the body. As we use dry textile electrodes, it is expected that measurements will give a larger value of Zep. Such an increment in the value of Zep increases the total impedance of the electrical pathway in series with the measuring load and making the EBI measurement more susceptible to the presence of parallel parasitic capacitances [10]. In this way the current through the measuring load decreases and the smaller voltage than expected yields an underestimation of the measured impedance. The effect would be more pronounced at higher frequencies than lower, and this may be the reason behind the under estimation of R∞.
The presence of a parasitic capacitance in parallel with the load creates a current divider that increasing the capacitance of the EBI measurement. This parasitic capacitance is accountable for the shift towards higher frequencies of the characteristic frequency, seen in Fig. 4. It is likely that the
parasitic capacitance is underestimated, since estimating it from susceptance requires enough measurement points taken at high frequencies.
Wetting the electrodes has shown to improve the performance on EBI spectroscopy measurements, even when the electrolyte comes from the own sweet [9], the improvement in the performance is noticeable within minutes. Therefore just by waiting some time certain improvement on the EBI measurement could be obtained.
The structure on the surface of the textile electrode [9] and the pressure on the electrode [5] can also reduce the Zep.
B. Influence of a large current injecting area Since textile electrodes are dry, it was expected that
without wetting the electrodes or preparing the skin no EBI spectra would be obtained at all, but to our surprise EBI measurements were taken straight away with the dry electrodes. This is due to the large area of contact of each electrode, which is several times larger that the contact area of the electrolytic electrodes or the textile electrodes previously used in [8, 11].
The area together with the placement around the wrist, hand, foot and ankle also contributes to reduce the influence the constriction area on the EBI measurement. In standard electrodes the current injected into the body is concentrated near the contact area defined by the electrode. This current concentration reduces the effective volume used by the electrical current to flow through the portion of the body in the constriction area producing a larger impedance. Using a large electrode with a surface surrounding the limbs will cause a more homogeneous current distribution maximizing the effective conductive volume use by the measuring current near the injecting electrodes reducing the constriction and producing a slightly smaller impedance. This reduction of the constriction area would explain the observation of obtaining smaller values of impedance with the dry textile electrodes than with the electrolytic at all frequencies, especially at low.
C. Cole & BCA parameters The aforementioned presence of the parasitic capacitances
and the large contact area of the textile electrodes cause the observed deviation in the impedance spectroscopy data. Such deviation influences in a noticeable manner the estimation of the Cole and the BCA parameters.
V. CONCLUSION & FUTURE WORK Even if the obtained results show that it is possible to
obtain EBI spectroscopy measurements with dry textile electrodes, the obtained spectroscopy measurements present differences that influence on the Cole and BCA parameters.
Whether the differences are due to the extended electrode area of the textile prototype or due to larger Zep of the textile electrodes, it is not completely clear. This work initially suggests that dry textile electrodes might be able to be used

for obtaining EBI spectroscopy measurements, but at this stage it is not clear if textile electrode can be used for assessment on body composition since reliable Cole. parameters cannot be obtain from the EBI measurements.
To increase the reliability of the estimation of the Cole parameters from dry textile electrodes measurements deviation-free EBI spectroscopy measurement must be obtained. Experiments focused to identify the causes of the differences observed in the spectroscopy EBI data are being done and preliminary results indicate that effective conductive area of the textile material and the robustness of the method to estimate the Cole parameters will play an important role in obtaining reliable EBI measurements and accurate estimations of the BCA parameters.
The availability of a textile garment integrated EBI spectroscopy measurements would allow the implementation of EBI-based monitoring systems of body fluid distribution that could shift care approaches for patients under dialysis therapy.
REFERENCE [1] D. De Rossi, and A. Lymberis, “New generation of smart
wearable health systems and applications,” IEEE Trans Inf Technol Biomed, vol. 9, no. 3, pp. 293-4, Sep, 2005.
[2] R. Paradiso, G. Loriga, and N. Taccini, “A wearable health care system based on knitted integrated sensors,” IEEE Trans Inf Technol Biomed, vol. 9, no. 3, pp. 337-44, Sep, 2005.
[3] G. Medrano, L. Beckmann, N. Zimmermann et al., “Bioimpedance Spectroscopy with textile Electrodes for a continuous Monitoring Application,” in 4th International Workshop on Wearable and Implantable Body Sensor Networks (BSN 2007), 2007, pp. 23-28.
[4] G. Medrano, A. Ubl, N. Zimmermann et al., "Skin Electrode Impedance of Textile Electrodes for Bioimpedance Spectroscopy," 13th International Conference on Electrical Bioimpedance and the 8th Conference on Electrical Impedance Tomography, pp. 260-263, 2007.
[5] L. Beckmann, C. Neuhaus, G. Medrano et al., “Characterization of textile electrodes and conductors using standardized measurement setups,” Physiological Measurement, vol. 31, no. 2, pp. 233, 2010.
[6] M. Packer, W. T. Abraham, M. R. Mehra et al., “Utility of Impedance Cardiography for the Identification of Short-Term Risk of Clinical Decompensation in Stable Patients With Chronic Heart Failure,” Journal of the American College of Cardiology, vol. 47, no. 11, pp. 2245-2252, 2006.
[7] J. Hännikäinen, T. Vuorela, and J. Vanhala, “Physiological measurements in smart clothing: a case study of total body water estimation with bioimpedance,” Transactions of the Institute of Measurement and Control, no. 29, pp. 337-354, 2007.
[8] J. C. Marquez, F. Seoane, E. Valimaki et al., "Textile electrodes in electrical bioimpedance measurements: a comparison with conventional Ag/AgCl electrodes." pp. 4816-4819.
[9] J. C. Marquez, F. Seoane, E. Välimäki et al., “Comparison of Dry-Textile Electrodes for Electrical Bioimpedance Spectroscopy Measurements.,” in ICEBI2010, Gainesville, 2010.
[10] R. Buendia, F. Seoane, and R. Gil-Pita, “ Novel Approach for Removing the Hook Effect Artefact from Electrical Bioimpedance Spectroscopy Measurements,” ournal of Physics: Conference Series, 2010.
[11] J. C. Márquez, F. Seoane, E. Välimäki et al., “Textile Electrodes for Electrical Bioimpedance Measurements,” in International Workshop on Wearable, Micro and Nano Technologies for the Personalised Health, pHealth 2009, Oslo, 2009.