on the performance of metrics to predict quality in point
TRANSCRIPT

On the performance of metrics to predict quality in pointcloud representations
Evangelos Alexiou and Touradj Ebrahimi
Multimedia Signal Processing Group (MMSPG)
Ecole Polytechnique Federale de Lausanne (EPFL)CH-1015, Lausanne, Switzerland
ABSTRACT
Point clouds are a promising alternative for immersive representation of visual contents. Recently, an increasedinterest has been observed in the acquisition, processing and rendering of this modality. Although subjectiveand objective evaluations are critical in order to assess the visual quality of media content, they still remainopen problems for point cloud representation. In this paper we focus our efforts on subjective quality assessmentof point cloud geometry, subject to typical types of impairments such as noise corruption and compression-likedistortions. In particular, we propose a subjective methodology that is closer to real-life scenarios of point cloudvisualization. The performance of the state-of-the-art objective metrics is assessed by considering the subjectivescores as the ground truth. Moreover, we investigate the impact of adopting different test methodologies bycomparing them. Advantages and drawbacks of every approach are reported, based on statistical analysis. Theresults and conclusions of this work provide useful insights that could be considered in future experimentation.
Keywords: Point cloud, quality assessment, subjective methodologies, quality metrics
1. INTRODUCTION
The significant growth of 3D sensing technologies, along with the increased interest in adopting 3D representationsin imaging systems, are shaping the way media content is created and used. In this environment, point cloudshave become a viable solution, since they provide a practical way for capture, storage, delivery and rendering inaugmented reality, mixed reality, virtual reality, medical imaging and 3D printing applications, among others. Apoint cloud can be defined as a collection of three-dimensional points in space representing the external surfaceof an object. Each sample is defined by its position, which is obtained by the measured or reconstructed X,Y, and Z coordinates. Associated features can also be used in conjunction with the coordinate data to providefurther information, such as the point’s color, intensity, normal, size, curvature, and specularity.
Business and technology specialists predict that immersive applications will become mainstream by 2020.1
Point clouds and mesh representations are expected to be modalities that will be extensively exploited, sincethey allow users to visualize static or dynamic contents in a more natural and immersive way. Although polygonmesh has been the prevailing form in computer graphics for 3D representations, point cloud is expected to bethe future solution in real-time applications due to several important features: (a) High resolution point cloudscan be directly acquired nowadays using professional or even consumer devices (e.g., Kinect v1,2 Kinect v2∗,Intel RealSense†, MC3D3). In the near future, conventional cameras are expected to be replaced by RGB-Dcameras, since depth information can be simultaneously provided at approximately the same cost. (b) Polygonmeshes require sophisticated reconstruction techniques when updating the content for every additional collectionof points, with significant cost in terms of time and computational complexity.4–8 Using point clouds, thecaptured objects could be updated directly by rendering the additional points. (c) Compared to the mesh-based compression algorithms,9–13 point clouds do not require storage, delivery and decoding of connectivity
Further author information: (Send correspondence to authors) E-mail: [email protected]∗http://www.xbox.com/en-US/xbox-one/accessories/kinect†https://software.intel.com/en-us/realsense/home
brought to you by COREView metadata, citation and similar papers at core.ac.uk
provided by Infoscience - École polytechnique fédérale de Lausanne
information (i.e., mesh topology and faces). The conversion to mesh representation for coding or rendering canalso be avoided in many situations.
For these reasons, it is clear that point clouds will be extensively used in immersive communications in thenear future. Visual quality and user experience of such emerging modalities play an important factor in how thecontent is acquired, transmitted and visualized. Hence, quality assessment should be investigated in a throroughmanner. In general, quality evaluation is implemented via either objective or subjective assessments. Objectivequality assessment is performed through computer algorithms that are designed to estimate signal distortionsof a content. Typically, scores that correspond to human quality judgements are obtained. Subjective qualityassessment is commonly conducted based on the ITU-R BT.500 recommendation14 and involves the participationof subjects in experiments in which distorted objects are visualized and their quality is rated. Such experimentsare expensive in terms of both cost and time and, thus, objective quality metrics are frequently used instead.However, in order to get meaningful objective scores that can accurately predict human judgements, objectivequality metrics have to be properly calibrated with respect to the subjective ratings, which are considered as theground truth.
In the case of point clouds, quality assessment is still an open problem. As it provides a richer representationwhen compared to tradional media, traditional methodologies that were used until now in 2D imagery may notbe suitable. Our approach on addressing subjective quality assessment of point cloud geometry is by adoptingtraditional methodologies, which are extended by involving interactivity between the user and the content indifferent experimental setups (i.e., environment and equipment). A double-stimulus impairement scale (DSIS)methodology has already been proposed under two different experimental frameworks; that is, a typical desktopsetup and a head-mounted display in an augmented reality scenario.15,16 Although DSIS is preferred for its highaccuracy and reliability in constructing a scale of perceptual references, it does not necessarily correspond toa realistic application where no reference of the distorted object is provided. In particular, it is substantiallydifferent when both the reference and the processed contents are visualized simultaneously, since the subjectstypically rate based on relative geometrical differences that can be easily observed.
In this paper we extend our efforts on quality assessment of point cloud geometry by proposing the use ofabsolute category rating (ACR) of content impairement, as it consists of a methodology that is closer to real-lifevisualization of point clouds. We compare the results of subjective assessments of visual quality obtained bythis methodology, with the results obtained by using DSIS methodology which was proposed in our previouswork.15 This way we aim to address whether the subjects are able to perceive distortions in the same way whenthe reference object is absent and, more generally, what is the impact of adopting different methodologies insubjective quality assessment of point cloud geometry. In both cases, the experimental setup involves a typicaldesktop arrangement in a controlled environment through which the subjects are able to visualize, interactand rate the level of impairment of point cloud geometry after introducing typical degradations, such as noiseand compression-like distortions. Identical contents, degradation values and equipment are used. Finally, thesubjective scores are correlated with the state-of-the-art objective metrics.
2. RELATED WORK
A limited amount of work on subjective quality assessment of point clouds has been reported in the literature.Zhang et al.17 conducted experiments to subjectively assess colored point clouds for different geometric resolu-tions (i.e., downsampled versions of the original point cloud), and different values of geometric and color noise.The uniform noise that is applied, though, does not correspond to a realistic model of noise for point clouds,neither for geometric nor for color degradations. A typical desktop setup was used for experiments. However,it is not clearly reported by the authors whether the evaluation was passive or interactive and what was theadopted subjective methodolgy (i.e., ACR, DSIS, etc.). Mekuria et al.18 proposed a 3D tele-immersive systemin which users represented by avatars (i.e., 3D point clouds captured by multiple Microsoft Kinect sensors) wereable to interact in a virtual (i.e., synthetic) room, enabling a mixed reality scenario. The subjects were able tocontrol the interaction of their avatar with the virtual environment through the use of the mouse in a desktopsetup. The quality assessment of the dynamic colored point cloud (i.e., the navigavable avatar), was only a partof this complex experiment, whose main goal was to evaluate the efficiency of the proposed codec; that is, tosubjectively assess the proposed compression algorithm in terms of distortions. In both cases, though, point

cloud quality is not explicitly assessed. Furthermore, the point-to-plane metric is not taken under considerationand the correlation between objective and subjective metrics is not reported.
Javaheri et al.19 performed quality assessment of point cloud denoising algorithms. The authors use impulsenoise (i.e., Gaussian noise with zero mean and large standard deviation) to simulate outlier errors. Two outlierremoval algorithms (i.e., radius and sparse outlier removal) were tested with the first being adopted for thesubsequent expermental procedure, as it was better correlated with the point-to-point objective metrics. Afterthis pre-processing step, different amount of Gaussian noise was added to the processed models to mimic differentlevels of sensor imprecisions. Two denoising algorithms, namely Tikhonov regularization and total variationregularization were then applied on each of the degraded contents and subjectively assessed in a passive way.To visualize the content, the Poisson surface reconstruction was used and the resulted 3D object was capturedby different viewpoints with a specific pattern to form a video. A continuous double-stimulus impairement scaleprotocol was adopted. The subjective scores were correlated with state-of-the-art objective metrics. However, asit is clearly stated, the scope of this paper was to subjectively assess denoising algorithms for point clouds, ratherthan the quality of the content. Furthermore, although the pre-processing steps followed before the visualizationof the content could be considered realistic, their exact influence on the object under assessment is not evaluatedand, thus, it is unknown. The impact of pre-processing is rather critical especially after applying a surfacereconstruction technique, which typically changes the exact position and the number of points of the distortedpoint cloud to fit the underlying surface. This methodology, also, leads to assessment of meshes instead of pointclouds. Finally, the passive subjective assessment protocol that is followed sounds interesting since the subjectsare exposed to identical information regarding the content under evaluation; however, interactivity is a desirableand natural characteristic when it comes to immersive content which is not exploited.
In,15,16 we proposed an interactive subjective evaluation of point cloud geometry using a typical desktopsetup and a head-mounted display in an augmented reality scenario, respectively. In both cases, two differenttypes of distortions were evaluated, namely Gaussian noise and octree-pruning, to simulate position errors fromsensor inaccuracies and compression-like artifacts, correspondingly. Simultaneous DSIS subjective methodologywas adopted and, thus, the subjects were assessing the level of impairment, after visualizing and interacting withboth the original and the processed contents simultaneously. Although this protocol is preferred for its highaccuracy, it does not correspond to a realistic application of visualizing point clouds. In this study, we adoptthe ACR content impairement methodology and we compare it against the DSIS test method. Furthermore, theperformance of the objective metrics is assessed against the subjective ratings.
3. SUBJECTIVE EXPERIMENTS
This section reports how the subjective quality evaluation experiments were designed. Specifically, the creationof the contents, the adopted distortions, the equipment and the testing environment are described.
3.1 Selection of contents
In this study, subjective quality assessment of point cloud geometry is performed in a typical desktop setup. Thepoint clouds are displayed without using any rendering algorithm or surface reconstruction technique; that is, acollection of points is rendered in a flat screen. In order to assess only the geometrical errors, no color values wereassigned to the points since the presence of additional attributes can be considered distracting. For this reasonfive simple objects were selected, since it would be difficult for complex scenes or models to be distinguishablein the absence of color. In addition, increasing the complexity of the object would lead to more uncertainty inthe exact representation of the underlying object, since the underlying surface is practically reconstructed byinternal cognitive processess that takes place in the human brain. Moreover, the contents were scaled to be fittedin a minimum bounding box of size 1 in order to normalize the impact of distortions. Finally, they were selectedso as to be diverse in terms of geometrical structure.
In Figure 1 the selected contents are presented, while in Table 1 the corresponding number of points, minimumand maximum Nearest Neighbour (NN) distances (i.e., intrinsic resolutions), and the dimensions of the minimumbounding box across X, Y and Z axes are provided. Cube and sphere are artificially generated point clouds andrepresent synthetic contents with perfect geometry. Vase is a model captured by Intel RealSense R200 andconstitutes a representative irregular point cloud that can be acquired from a low-cost consumer market device.

Finally, bunny and dragon are selected from the Stanford 3D Scanning Repository‡ and represent less irregularcontents with very limited amount of noise and smooth underlying surfaces.
(a) Bunny (b) Cube (c) Dragon (d) Sphere (e) Vase
Figure 1: Selected contents
It should be mentioned that in order to eliminate the impact of highly diverse contents in terms of density,a sparser version of the dragon was used (i.e., namely, dragon vrip res3 ), and the initially captured vase wasdownsampled using CloudCompare20 software. For the former case, a minimal distance between two points wasset to a specific value, ensuring that no point in the output content is closer to another point than the specifiedvalue. Furthermore, no displacements in the original coordinates of the points was introduced, maintaining thedefault irregular structure of this content.
Table 1: Number of points and intristic resolutions per content
Contents: Bunny Cube Dragon Sphere VasePoints: 35947 30246 22998 30135 36022
Minimum NN: 0.000038 0.010051 0.000758 0.000148 0.005501Maximum NN: 0.014384 0.014142 0.011309 0.012825 0.010421
Dimensions X/Y/Z: 1/0.99/0.78 1/1/1 1/0.71/0.45 1/1/1 0.68/1/0.67
3.2 Degradation types
In this experiment, two different types of geometrical degradations are assessed: (a) noise, which results inposition errors after points’ displacement according to the selected distribution, and (b) octree-pruning, whichleads to a sparser and more regular version of the original point cloud, obtained after applying an octree structurewith appropriate level-of-detail (LoD) values. Thus, in the latter case, the processed content is subject to bothpoints’ displacement and points’ removal. The distortion values in both cases were selected so as to cover a widerange of subjective scores (i.e., from the lowest to the highest) for both types of distortions.
3.2.1 Noise
Gaussian noise is widely used in the literature to model position errors due to sensor imperfections duringacquisition, or after stereoscopic triangulation which can be performed either in real-time using more than onesynchronized cameras, or offline by using images of the same scene taken from different viewpoints. In our case,we assume that the noise affects the position of all points of the point cloud and its level is determined by atarget standard deviation (i.e., σ = {0.0005, 0.002, 0.008, 0.016}).
3.2.2 Octree-pruning
Octree structure is extensively exploited in point cloud compression algorithms, as it enables an efficient way forregular representations of points with known maximum geometrical error. It is the basis of many compressionalgorthms that are currently used, and it is further exploited to reduce the size of data needed for contentreconstruction.21–25 This regular representation, though, leads to visible artifacts in the form of structuredloss. Octree-pruning can be obtained by setting a desirable octree LoD, which defines the size of leaf nodes.
‡http://graphics.stanford.edu/data/3Dscanrep/
A minimum bounding box encloses the content and, in each level, each box is sub-divided into 8 smaller andequally sized boxes. A point can be appended only in leaf nodes and all the points that are enclosed in a leafnode are collectively represented by the center of that node. Thus, octree stucture leads to points’ removal anddisplacement, while the error is limited by the diagonal of the leaf node divided by two. By increasing the LoD,the number of points of the processed content obviously decreases. In our case, LoD values are selected foreach content in order to obtain target percentages (p), with respect to the original number of points, with anacceptable deviation of ±2% (i.e., p = {30%, 50%, 70%, 90%}).
3.3 Environment and equipment
The experiments were conducted in the MMSPG laboratory which fulfills the recommendations for subjectiveevaluation of visual data issued by ITU.14 PCLVisualizer26 with an Apple Cinema Display of 30 inch (res.2560x1600) was used to display the stimuli. The background of the environment was set to black and the colorof the point cloud was set to white. The luminance of the points and the background was measured on the flatscreen with a luminosity sensor§ providing the values of 354 and 0.5 nits, respectively. The subjects were able tovisualize the point clouds on the flat screen, interact with them using the mouse (left, right, up, down, zoom),and provide their scores using the keyboard.
3.4 Subjective evaluation methodologies
The ACR with 5-scale impairment rating test methodology was selected in order to (a) perform quality assessmentadopting a more realistic type of point cloud visualization, and (b) assess the impact of adopting differentsubjective methodologies in point cloud geometry evaluation. As the selected degradation values for the Gaussiannoise and the sparsity level of dragon and vase were modified with respect to our previous work,15 as reported inSection 3.1, we also re-ran the experiments adopting the DSIS test methodology and using the updated contents.
Since two different types of degradations were assessed, the evaluation procedure of each test methodologywas split in two different sessions (i.e., 4 sessions in total: DSIS with Gaussian noise, DSIS with octree-pruning,ACR with Gaussian noise, and ACR with octree-pruning). Each session was launched after a training phase,where special care was given in order for the subjects to well understand the impact of each type of impairment.During training, the subjects also familiarized with the interaction part.
In the DSIS test method, participants were instructed to rate the level of impairment of the processed contentwith respect to the reference, which was always visible. The users always knew the position of both contents,since the stimuli were annotated with text in the visualization software. In the ACR experiment, the subjectswere asked to rate the level of impairment of the processed content with respect to their internal reference. Inboth cases, the subjects were free to interact with the content and change the angle of view according to theirpreference. No time limitation was set before providing their scores.
In both ACR and DSIS experiments, different permutations of the order of visualization content was appliedper subject and session. In addition, to reduce contextual effects in the DSIS method, the position of the referencewhile remaining fixed across each session for every subject, changed randomly for different subjects. Finally, thesame content was never displayed consecutively.
A total of 5 contents and 4 degradation values were used, along with a hidden reference. This leads to 25stimuli per session. A total of 28 naive subjects (17 males and 11 females) participated in the experiments; 12of them were involved in both experiments while 16 participated in just one, leading to 20 scores per stimulus.The age was ranging from 20.56 to 37.4 with an average of 28.18 and a median of 28.04 years old.
4. STATISTICAL ANALYSIS
In this section the statistics computed from the subjective scores are reported, followed by an overview of thestate-of-the-art objective metrics. Then, a description of the performance indexes used to assess the objectivemetrics is provided. Finally, the statistics to compare the subjective methodologies are described.
§X-Rite i1 Display Pro - http://www.xrite.com/
4.1 Subjective quality metrics
For each session and each experiment, outlier detection and removal was performed on the subjective scoresfollowing the Recommendation ITU-T P.1401.27 In the ACR experiment, no outlier was detected in none of thetwo sessions (i.e., Gaussian noise and octree-pruning) leading to 20 out of the 20 scores for both cases, whilein the DSIS experiment one outlier was detected in the second session leading to 20 out of 20 and 19 out of 20scores for Gaussian noise and octree-pruning, respectively. After outlier removal, the mean opinion score (MOS)was computed for each degraded content, along with the corresponding 95% confidence intervals assuming aStudent’s t-distribution.
4.2 Objective quality metrics
In objective quality assessment of point clouds, full-reference metrics are used and are based on the relativegeometrical differences between the points of the processed and the reference contents. In other terms, geometricalsimilarity is the key factor. The state-of-the-art objective metrics for geometric distortions can be classified aspoint-to-point (p2point) and point-to-plane (p2plane).18,28 In the first case, p2point error is calculated byconnecting each point of the content under evaluation to the closest point that belongs to the reference pointcloud. In the second case, the normal of each point of the reference point cloud should be given or estimated.Then, the p2plane error of a point of a content under evaluation is calculated by measuring the projected erroralong the normal of the closest point that belongs to the reference point cloud. This applies when both stimulihave identical number of points. Otherwise, every point of the content under evaluation is associated with anon-overlapping nearest neighborhood of points that belongs to the reference. Then, an average normal vectorof the points classified into the same neighborhood is computed. Finally, the p2plane error of a point underassessment is calculated by measuring the projected error along the associated averaged normal vector.
Geometric errors between the original and the processed point clouds can be estimated either using the RootMean Square (RMS) difference, the Mean Squared Error (MSE), or the Hausdorff¶ distance for both p2pointand p2plane cases. It is rather common to use the symmetric distance, which is obtained by setting both theoriginal and the processed content as reference and estimating the absolute values of error in both cases. Then,the maximum value is considered as the error.18 However, such absolute values do not provide meaningful resultswhen contents of different dimensions are assessed. For this purpose, the Peak-to-Signal Noise Ratio (PSNR) isproposed. In the literature, it is defined as the ratio of the squared maximum distance of the nearest neighbours(potentially, multiplied by a scalar), or the squared distance of the diagonal of the minimum bounding box dividedby the squared error value (i.e., MSE, squared RMS or squared Hausdorff). For the sake of completeness, weshould also mention that the color distortion of a point cloud is commonly assessed using the well-know PSNRratio used in conventional 2D images; that is the maximum color value divided by the mean squared error.
In this study, the version 0.02 of the software described in28 is used. In particular, the RMS difference andthe Hausdorff distance are considered for both cases of p2point and p2plane metrics. To compute the p2planeerror, the normals of each content are estimated based on principal component analysis considering 12-nearestneighbours around each point. The PSNR is defined as the ratio of the squared maximum distance of the nearestneighbours divided by the squared error value. After evaluating the error by setting both the original and theprocessed content as a reference, the symmetrical distance is considered as the final error value. This leads to atotal of 8 different objective metrics, for which performance is assessed with respect to the subjective scores ofboth testing methodologies.
4.3 Performance indexes for objective metrics
The objective metrics are benchmarked with respect to the subjective MOS, which are considered as the groundtruth. The result of execution of a particular objective metric indicates a Point cloud Quality Rating (PQR).A predicted MOS, denoted as MOSP which corresponds to a specific distorted content, is estimated by apply-ing a fitting function to each [PQR, MOS] pair. According to Recommendation ITU-T P.1401,27 the followingproperties of the PQR are considered: linearity, monotonicity, accuracy and consistency. They are obtained
¶The Hausdorff distance is defined as the greatest of all the distances from a point in one set to the closest point inthe other set.

by computing the Pearson linear correlation coefficient (PCC), the Spearman rank order correlation coefficient(SROCC,), the root-mean-square error (RMSE) and the outlier ratio (OR) between MOS and MOSP , respec-tively. Linear, logistic and cubic fittings were tested and it was found that the latter provides the best results.Hence, the cubic fitting is used to demonstrate the performance indexes results.
4.4 Comparison between subjective methodologies
In this experiment two different types of degradations are adopted. The comparison between subjective meth-dologies, as described below, is performed per degradation type, as the visible distortions in the processed pointclouds from these types of impairments are radically different. This, essentially, means that we compare ACRagainst DSIS after introducing Gaussian noise, and ACR against DSIS after octree-pruning, separately.
According to Recommendation ITU-T P.1401,27 to compare two different testing methodologies, severalfittings were applied to the obtained MOS values. In particular, no fitting, linear, and cubic fitting were tested.The PCC, SROCC, RMSE and OR were also computed to account for linearity, monotonicity, accuracy andconsistency, respectively. Finally, correct estimation (CE), under estimation (UE) and over estimation (OE)percentages were determined after a multiple comparison test at a 5% significance level to check whether bothmethodologies give statistically equivalent MOS results. CE is obtained when the MOS of a data point obtainedfrom the first methodology (i.e., ground truth) lies within the confidence interval estimated using the secondmethodology for this content, and vice versa. UE occurs when the MOS of a data point obtained from the secondmethodology is lower than the lower bound of the confidence interval estimated for this content from the firstmethodology. OE occurs when the MOS of a data point obtained from the second methodology is higher thanthe upper bound of the confidence interval estimated from the first methodology.
The classification errors, namely false ranking (FR), false differentiation (FD) and false tie (FT), were alsocomputed along with correct decision (CD), to check whether the subjective methodologies lead to differentconclusions on a pair of data points.29 A multiple comparison test at a 5% significance level was performedto determine when two data points are statistically equivalent, and when they are statistically distinguishable.Then, for each pair of data points (A, B), there are three possible categories: (i) A is better than B, (ii) Ais the same as B, and (iii) A is worse than B. This three-way classification is performed for both subjectivemethodologies. When both test methods agree, a CD occurs. When the first subjective methodology (i.e.,ground truth) says that A is better than B, or A is worse than B, and the second subjective methodology saysthat A is the same as B, a FT occurs. This is the least offensive error. When the first subjective methodologysays that A is the same as B, and the second subjective methodology says that A is better than B, or A is worsethan B, a FD occurs. This is a more offensive error. Finally, when the first subjective methodology says that Ais better than B, or A is worse than B, and the second subjective methodology says the opposite, a FR occurs.This is the most offensive type of error.
Finally, one-way analysis of variance (ANOVA) was performed to identify whether the subjective evaluationmethodologies are statistically different. Additionally, multi-way ANOVA was performed on the raw scores ofeach type of distortion to further assess the influence of the selected parameters (i.e., degradation level, content)on the subjective results.
5. RESULTS AND DISCUSSION
In this section the performance of the objective metrics against the degradation levels for each type of distortionare provided. Then, the subjective scores as obtained from every evaluation methodology are presented, againstthe degradation levels. Moreover, the performance of the objective metrics is investigated per type of impairmentand test method, considering as ground truth the corresponding subjective scores. Finally, a comparison isconducted between the adopted subjective methodologies based on a statistical analysis.
5.1 Objective results
In Figure 2 the error as computed by two out of the eight objective metrics is presented against the targetstandard deviation of Gaussian noise. In particular, in Figure 2a, the estimated geometric error using thep2point metric with Hausdorff distance is depicted, whilst in Figure 2b the PSNR values using the same metric

and distance are presented, for every selected content. In Figure 3 the error as computed by two other objectivemetrics against the target percentage of remaining points after octree-pruning is demonstrated. Specifically, inFigure 3a, the geometric error using the p2plane metric with Hausdorff distance is presented, while in Figure 3bthe corresponding PSNR values are provided, for all contents. As can be seen, the geometric errors occuringeither after the displacement of the points due to Gaussian noise, or by decreasing the number of points afteroctree-pruning are captured by the objective metrics. Similar trends are observed in other objective metrics, foreach type of impairment.
(a) p2pointHausdorff (b) PSNR - p2pointHausdorff
Figure 2: Objective scores against degradation values in the presence of Gaussian noise in a logarithmic scale.
(a) p2planeHausdorff (b) PSNR - p2planeHausdorff
Figure 3: Objective scores against degradation values after octree-pruning in a logarithmic scale.
5.2 Subjective results
In Figures 4 and 5 the MOS along with the confidence intervals against the degradation values of every typeof impairment are presented for the DSIS and ACR experiments, respectively. The markers with faces indicatethe scores for the distorted versions of the original point clouds, while the markers without faces (i.e., at thetop-right of Figures 4a, 5a and top-left of Figures 4b, 5b) correspond to the scores of the hidden references.
Regarding the results obtained from the DSIS experiment, it is obvious that as the level of impairmentis increasing, the MOS decreases, except in the case of dragon which is slighlty worse after octree-pruning for

(a) Gaussian noise. (b) Octree-pruning.
Figure 4: Subjective scores against degradation values adopting DSIS test method.
(a) Gaussian noise. (b) Octree-pruning.
Figure 5: Subjective scores against degradation values adopting ACR test method.
p = 90% when compared to p = 70%. In general, the subjects were able to recognize easily the level of distortion,since the reference content was always visible. In case of Gaussian noise, the subjective scores are decreasingfollowing a logarithmic trend as the target standard deviation increases, for every type of content. The shape ofthe underlying surface of the content seems to be critical in the case of compression-like distortions. In particular,cube, which is the only content that consists of only planar surfaces, is rated remarkably higher than any othercontent, for every level of impairement.
Considering the results of the ACR experiment, generally, similar trends for both types of degradations areobserved. The confidence intervals are larger in this case; however, this is expected as the subjects do not ratethe level of impairement of the processed content with respect to the visible reference, but based on their internalreference. In the case of Gaussian noise, the dragon and vase are rated slightly but consistently lower than theother contents, for every target standard deviation value. This difference is even more observable in the case ofthe hidden references. For dragon, we assume that this behavior is observed due to the complexity of the object.In particular, although the density of all the contents is similar (i.e., in the same order of magnitude), the dragonis a substantially more complex object and, thus, a denser version would be preferred. This speculation couldbe partially verified by how the subjects rate the hidden reference after octree-pruning, which is lower than allthe other contents; meaning that subjects tend to believe that the original content is perceived as being alreadysimplified. Regarding vase, the difference in subjective scores is assumed to be observed due to its irregular

geometrical structure. There are two main reasons for this: (a) due to the training phase, which was conductedinvolving a more regular content; thus, when irregular geometry was observed, participants tended to associateit with the existence of noise, and (b) due to a general preference of subjects to visualize regular point clouds.In the case of the octree-pruning, as the subjects expected structure loss which was not perceived, the hiddenreference was rated similarly to the other original contents.
In the ACR experiment and considering the case of compression-like distortions, cube is again rated substan-tially higher than all other contents. Interestingly, in the ACR test method it is rated even higher than in theDSIS method for p = 30%. Furthermore, a steep increase of the MOS of the sphere can be observed for p = 90%.The same trend can be noticed also in the DSIS scores. Sphere was artificially generated and the distributionof points across its surface is not uniform. In particular, the density of points in the poles is much higher and,thus, for p = 90%, no significant distortions are perceived in the remaining surface. This can be also observedin Figure 3, where a reduction in the amount of error captured by the objective metrics is notable. Finally,bunny is rated remarkably lower for p = 90% when compared to p = 70%. This is because, indeed, additionalartifacts are visible that reduce the perceptual quality of the content for p = 90%. However, this trend is notthat clear in the case of DSIS test method, although the scores are not better as anyone would expect. Thisleads to the assumption that subjects tend to rate based on the number of points of the processed point cloudwhen the reference content is provided. However, when just one point cloud is visualized, the visual quality isthe only factor that is assessed. These obserations also suggest that simplifying objects without considering theirunderlying geometrical properties, or without using more sophisticated methods, even with more data, enhancedvisual distortions may occur.
5.3 Performance of the objective metrics
In Tables 2 and 3, the performance indexes of the state-of-the-art objective metrics against the subjectivescores are presented. In particular, Table 2 indicates the performance of objective metrics adopting the DSISmethodology, while Table 3, depicts their performance when adopting the ACR methodology. In both cases,both types of impairment are investigated separately.
Table 2: Performance indexes for the different objective metrics adopting the DSIS test method.
MetricGaussian noise Octree-pruning
PCC SROCC RMSE OR PCC SROCC RMSE ORp2pointRMS 0.9949 0.9488 0.1404 0.05 0.1524 -0.1499 0.9403 0.70p2planeRMS 0.9905 0.9388 0.1904 0.10 0.1884 -0.2004 0.9344 0.70p2pointHausdorff 0.9936 0.9353 0.1569 0.10 0.2473 0.2525 0.9219 0.55p2planeHausdorff 0.9931 0.9368 0.1622 0.10 0.2219 0.1695 0.9277 0.60PSNR - p2pointRMS 0.9948 0.9707 0.1416 0.10 0.2840 0.2765 0.9122 0.50PSNR - p2planeRMS 0.9947 0.9707 0.1424 0.05 0.2837 0.2328 0.9123 0.50PSNR - p2pointHausdorff 0.9960 0.9782 0.1231 0.05 0.3364 0.4384 0.8960 0.60PSNR - p2planeHausdorff 0.9959 0.9782 0.1251 0.05 0.2860 0.3119 0.9177 0.50
Table 3: Performance indexes for the different objective metrics adopting the ACR test method.
MetricGaussian noise Octree-pruning
PCC SROCC RMSE OR PCC SROCC RMSE ORp2pointRMS 0.9867 0.9326 0.2232 0.25 0.3698 -0.0045 0.8497 0.60p2planeRMS 0.9862 0.9439 0.2276 0.15 0.3985 -0.0467 0.8388 0.60p2pointHausdorff 0.9864 0.9304 0.2260 0.15 0.2540 -0.0956 0.8846 0.60p2planeHausdorff 0.9871 0.9304 0.2201 0.20 0.3185 -0.0211 0.8670 0.60PSNR - p2pointRMS 0.9930 0.9846 0.1629 0.10 0.2207 0.1415 0.8920 0.65PSNR - p2planeRMS 0.9949 0.9846 0.1391 0.10 0.3059 -0.0805 0.8707 0.60PSNR - p2pointHausdorff 0.9945 0.9846 0.1435 0.15 0.2291 0.2942 0.8902 0.65PSNR - p2planeHausdorff 0.9950 0.9846 0.1371 0.15 0.2202 0.1685 0.8921 0.65

In Figures 6 and 7 scatter plots of the subjective scores against the most efficient objective metric are provided.In Figure 6, the MOS values are obtained from the DSIS test method. In Figure 7, the subjective scores from theACR experiment are used. In both figures, the performance against all types of distortion is presented separately.
(a) Gaussian noise. (b) Octree-pruning.
Figure 6: Subjective vs objective results adopting DSIS test method.
(a) Gaussian noise. (b) Octree-pruning.
Figure 7: Subjective vs objective results adopting ACR test method.
In both subjective methodologies, strong correlation between the objective metrics and subjective scores canbe observed in presence of Gaussian noise. Considering that the objective metrics capture geometrical distancesof closest points between the reference and the processed contents, by increasing the standard deviation ofnoise the objective scores worsen. The subjects were able to perceive such distortions and identify the level ofdiscrepancies, either when the reference was visible or not (i.e., DSIS and ACR, respectively).
On the contrary, the correlation between subjective and objective scores in presence of compression-likedistortions is poor. Despite the fact that the level of perceptual impairment is reflected in the objective scoresfor contents with curved surfaces, this is not the case for objects with planar surfaces, such as cube. As thenumber of points decreases, less details and more rough representations of curved edges are observed, whichhas a strong impact on the perceptual quality; thus, the subjects rate the distorted contents lower. This isaligned with our prior knowledge of how the human visual system works, based on which once missing points
are perceived, people tend to interpolate the visible points. Thus, when the underlying surface is a curve, it isperceived as a straight line which leads to perception of the impairment as more annoying. This is not applied inthe case of cube, though, which consists of planar surfaces. In addition, the geometry of this particular content ishighly regular, as it was artificially generated. The octree structure, by default, arranges the points of the contentin a structured and equally spaced way. Thus, the underlying geometry of cube is not significantly affected and,by extension, the structured loss after octree-pruning is not perceived as truly annoying.
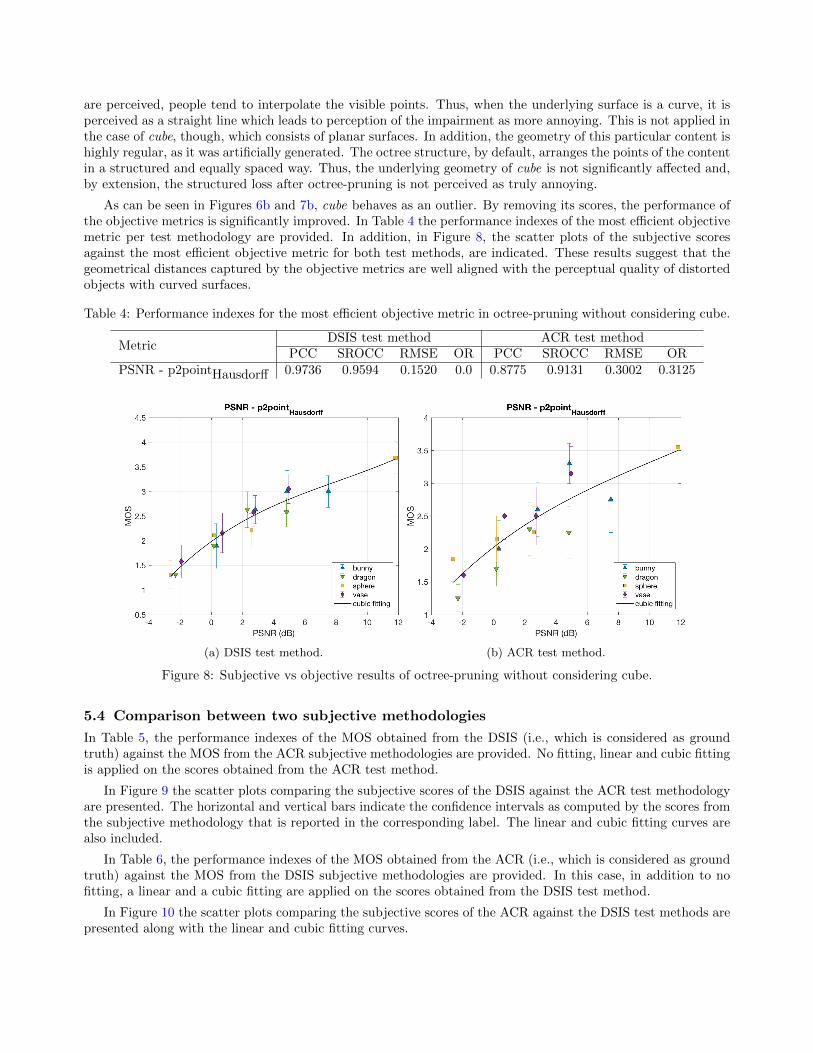
As can be seen in Figures 6b and 7b, cube behaves as an outlier. By removing its scores, the performance ofthe objective metrics is significantly improved. In Table 4 the performance indexes of the most efficient objectivemetric per test methodology are provided. In addition, in Figure 8, the scatter plots of the subjective scoresagainst the most efficient objective metric for both test methods, are indicated. These results suggest that thegeometrical distances captured by the objective metrics are well aligned with the perceptual quality of distortedobjects with curved surfaces.
Table 4: Performance indexes for the most efficient objective metric in octree-pruning without considering cube.
MetricDSIS test method ACR test method
PCC SROCC RMSE OR PCC SROCC RMSE ORPSNR - p2pointHausdorff 0.9736 0.9594 0.1520 0.0 0.8775 0.9131 0.3002 0.3125
(a) DSIS test method. (b) ACR test method.
Figure 8: Subjective vs objective results of octree-pruning without considering cube.
5.4 Comparison between two subjective methodologies
In Table 5, the performance indexes of the MOS obtained from the DSIS (i.e., which is considered as groundtruth) against the MOS from the ACR subjective methodologies are provided. No fitting, linear and cubic fittingis applied on the scores obtained from the ACR test method.
In Figure 9 the scatter plots comparing the subjective scores of the DSIS against the ACR test methodologyare presented. The horizontal and vertical bars indicate the confidence intervals as computed by the scores fromthe subjective methodology that is reported in the corresponding label. The linear and cubic fitting curves arealso included.
In Table 6, the performance indexes of the MOS obtained from the ACR (i.e., which is considered as groundtruth) against the MOS from the DSIS subjective methodologies are provided. In this case, in addition to nofitting, a linear and a cubic fitting are applied on the scores obtained from the DSIS test method.
In Figure 10 the scatter plots comparing the subjective scores of the ACR against the DSIS test methods arepresented along with the linear and cubic fitting curves.

Table 5: Performance indexes considering DSIS as ground truth.
FittingGaussian noise
PCC SROCC RMSE OR CE CD FR FD FTNo fitting 0.9920 0.9763 0.2109 0.20 100% 95.79% 0% 1.58% 2.63%Linear fitting 0.9920 0.9763 0.1748 0.10 100% 95.79% 0% 1.58% 2.63%Cubic fitting 0.9921 0.9763 0.1738 0.05 100% 95.79% 0% 1.58% 2.63%
FittingOctree-pruning
PCC SROCC RMSE OR CE CD FR FD FTNo fitting 0.9478 0.9551 0.3049 0.20 100% 84.74% 0% 8.94% 6.32%Linear fitting 0.9478 0.9551 0.3035 0.20 100% 84.74% 0% 7.89% 7.37%Cubic fitting 0.9520 0.9551 0.2913 0.20 100% 86.84% 0% 8.42% 4.74%
(a) Gaussian noise. (b) Octree-pruning.
Figure 9: Comparison between subjective methodologies, assuming DSIS method as ground truth.
Table 6: Performance indexes considering ACR as ground truth.
FittingGaussian noise
PCC SROCC RMSE OR CE CD FR FD FTNo fitting 0.9920 0.9763 0.2109 0.25 100% 95.79% 0% 2.63% 1.58%Linear fitting 0.9920 0.9763 0.1732 0.10 100% 95.79% 0% 2.63% 1.58%Cubic fitting 0.9922 0.9763 0.1708 0.10 100% 95.79% 0% 1.58% 2.63%
FittingOctree-pruning
PCC SROCC RMSE OR CE CD FR FD FTNo fitting 0.9478 0.9551 0.3049 0.15 100% 84.74% 0% 6.32% 8.94%Linear fitting 0.9478 0.9551 0.2917 0.20 100% 83.68% 0% 4.74% 11.58%Cubic fitting 0.9538 0.9551 0.2747 0.10 100% 83.16% 0% 4.21% 12.63%
Based on our results for Gaussian noise, in both Figures 9a and 10a the fitting curve achieves an angle of 45°.However, the intercept is not zero. This, essentially, means that DSIS methodology gives slightly higher MOSresults consistently. This tendency can be explained by the fact that visual quality of point clouds is difficult tobe assessed considering that, essentially, a collection of points is displayed and “holes” in the contents are alwaysvisible. When the reference point cloud is absent, which enables rating according to the actual visual qualityand not based on relative differences, it is reasonable to obtain lower scores.
Considering the performance indexes, it is clear that the subjective methodologies are strongly correlated.The low RMSE and OR values, are evident for high accuracy and consistency of the results. Furthermore, theCE is 100%, indicating that there is no statistically significant difference between the MOS obtained from eachmethodology. This is also why OE and UE are not indicated in the tables. There is 0% FR, which is the most

(a) Gaussian noise. (b) Octree-pruning.
Figure 10: Comparison between subjective methodologies, assuming ACR method as ground truth.
offensive error, while the FD and FT have very low percentages.
Based on our results after octree-pruning, when the MOS results obtained from DSIS are considered as groundtruth, an angle of 45° can be observed in the fitting line. However, when the ACR experiment is set as the groundtruth, the subjective scores from ACR are slightly higher for higher levels and slightly lower for lower levels ofimpairement, leading to an angle less than 45°.
The linearity and monotonicity coefficients are high in both cases while the RMSE and OR values are stillrelatively low. Moreover, the CE is 100% and the FR is 0%. The high FD percentages observed in Table 5 whensetting the DSIS scores as ground truth suggest that this methodology does not differentiate two stimuli, whilethe ACR methodology decides that they are statistically different. The same tendency can be observed throughthe high FT percentages of Table 6. In other terms, the ACR methodology shows more discriminating power forsuch type of distortion when compared to the DSIS.
One-way ANOVA was performed on the processed contents grouped by methodology, separately for eachdegradation type. Results showed that there is no significant difference between the scores obtained with eitherDSIS or ACR, neither for Gaussian noise (p = 0.2711) nor for octree-pruning (p = 0.7598). One-way ANOVA wasalso performed on the entire set of processed contents. Results show that the two methodologies are statisticallyequivalent (p = 0.5086).
To gain further insights on what impact different parameters had on the final scores, multi-way ANOVA wasperformed on the data associated with each degradation type, separately for level of impairment and content.Since the type of methodology was shown not to bear any statistically significant difference, the results were notdivided by methodology.
Multi-way ANOVA performed on data from Gaussian noise shows that both contents and degradation levelspresent statistical differences (p = 0 in both cases), while the interaction did not have an impact on the final scores(p = 0.4291). In order to better understand from which specific parameter the differences arose, we performedone-way ANOVA on the same set of data, separately for level of impairment and content. As expected, the levelof impairments were found to be significantly different for all contents. However, analysis on different degradationlevels showed that, while the contents give statistically different results with the highest levels of degradation(p = 0.0108 and p = 0.0188 for σ = 0.008 and σ = 0.016, respectively), they are statistically equivalent for thelowest levels of degradation (p = 0.1476 and p = 0.0965 for σ = 0.0005 and σ = 0.002, respectively). This can beexplained by the fact that the dragon was rated lower than the other contents in the ACR test methodology, asexplained in Section 5.2, and for σ = 0.008 statistical difference was found. In addition, bunny was rated higherthan the other contents for σ = 0.016 in the context of the DSIS test method, leading to statistical significantdifference. In this case, no particular reason is obvious - maybe the content was pleasant to the subjects.

Multi-way ANOVA performed on the data after octree-pruning also shows that degradation levels and contentshave statistical differences (p = 0 in both cases), and the interaction was also found to be statistically significantfor the final scores (p = 0). One-way ANOVA performed separately for each content showed that the level ofimpairments gave statistically different results (p = 0), as expected. Finally, performing one-way ANOVA ondifferent levels of impairment showed statistical difference among contents for all levels (p = 0). This can beexplained, as cube was rated remarkably higher than all the other contents, for both cases of DSIS and ACR testmethods.
6. CONCLUSIONS
In this paper a subjective methdology closer to realistic visualization of point cloud content was proposed andevaluated. Our results show that although point cloud is a modality difficult to be assessed in terms of visualquality, strong correlation is achieved with respect to a test method that allows the simultaneous visualizationof the reference content. In particular, based on our analysis, ACR and DSIS methodologies found to bestatistically equivalent. The comparison between DSIS and ACR methodology shows that in the first case, thesubjects tend to rate the contents slightly higher in the presence of Gaussian noise, while for octree-pruning, norepetitive tendencies are observed. The DSIS methodology is more consistent in terms of identifying the levelof impairment, which is also projected in the trends of the MOS against degradation values curves. However,subjects tend to rate based on relative differences (i.e., geometrical distances or number of points) and notexplicitly according to the visual quality; the latter is achieved through the ACR methodology though. Forinstance, adopting the ACR test method, dragon and vase are rated lower than the other contents in thepresence of Gaussian noise, due to complexity and geometrical structure, respectively. The classification errors,also, show that the ACR methodology shows more discriminating power when compared to the DSIS for octree-pruning. However, larger confidence intervals are observed, suggesting the necessity of involving more subjectsin the experiments. Regarding the performance of the objective metrics with respect to the subjective scores, inboth test methodologies, similar trends are observed; that is, in the presence of Gaussian noise strong correlationis achieved, while after octree-pruning, regular objects with planar surfaces behave as outliers and the correlationis poor. The DSIS method, though, provides better results for each type of impairment (i.e., if we exclude thescores of cube from octree-pruning).
7. ACKNOWLEDGMENT
This paper reports a research performed under the frame- work of a collaborative project Random Access VideoEn- coding (RAVE) with Teleport SA and funded by The Swiss Commission for Technology and Innovation(CTI) under the grant 18875.1PFES-ES. A special thanks to Irene Viola and Evgeniy Upenik for the fruitfuldiscussions.

REFERENCES
[1] MPEG Virtual Reality AhG, “Summary of MPEG VR questionnaire results.” ISO/IEC JTC N16542 (Oct.2016).
[2] Smisek, J., Jancosek, M., and Pajdla, T., “3D with Kinect,” in [Consumer Depth Cameras for ComputerVision ], pp. 3–25, Springer London (2013).
[3] Matsuda, N., Cossairt, O., and Gupta, M., “MC3d: Motion contrast 3d scanning,” in [ComputationalPhotography (ICCP), 2015 IEEE International Conference on ], pp. 1–10 (2015).
[4] Newcombe, R. A. and Davison, A. J., “Live dense reconstruction with a single moving camera,” in [ComputerVision and Pattern Recognition (CVPR), 2010 IEEE Conference on ], 1498–1505, IEEE (Aug. 2010).
[5] Newcombe, R. A., Izadi, S., Hilliges, O., Molyneaux, D., Kim, D., Davison, A. J., Kohi, P., Shotton, J.,Hodges, S., and Fitzgibbon, A., “KinectFusion: Real-time dense surface mapping and tracking,” in [Mixedand augmented reality (ISMAR), 2011 10th IEEE international symposium on ], 127–136, IEEE (2011).
[6] Newcombe, R. A., Lovegrove, S. J., and Davison, A. J., “DTAM: Dense tracking and mapping in real-time,”in [Computer Vision (ICCV), 2011 IEEE International Conference on ], 2320–2327, IEEE (2011).
[7] Engel, J., Schops, T., and Cremers, D., “LSD-SLAM: Large-scale direct monocular SLAM,” in [EuropeanConference on Computer Vision ], 834–849, Springer (2014).
[8] Dai, A., Nießner, M., Zollhofer, M., Izadi, S., and Theobalt, C., “BundleFusion: Real-Time Globally Consis-tent 3d Reconstruction Using On-the-Fly Surface Reintegration,” ACM Trans. Graph. 36, 24:1–24:18 (May2017).
[9] Hoppe, H., “Efficient implementation of progressive meshes,” Computers & Graphics 22, 27–36 (Feb. 1998).
[10] Gumhold, S. and Straßer, W., “Real time compression of triangle mesh connectivity,” in [Proceedings ofthe 25th Annual Conference on Computer Graphics and Interactive Techniques ], SIGGRAPH ’98, 133–140,ACM (1998).
[11] Rossignac, J., “Edgebreaker: connectivity compression for triangle meshes,” IEEE Transactions on Visual-ization and Computer Graphics 5, 47–61 (Jan. 1999).
[12] Peng, J., Kim, C.-S., and Jay Kuo, C. C., “Technologies for 3d mesh compression: A survey,” Journal ofVisual Communication and Image Representation 16, 688–733 (Dec. 2005).
[13] Han, S. R., Yamasaki, T., and Aizawa, K., “Time-Varying Mesh Compression Using an Extended BlockMatching Algorithm,” IEEE Transactions on Circuits and Systems for Video Technology 17, 1506–1518(Nov. 2007).
[14] ITU-R BT.500-13, “Methodology for the subjective assessment of the quality of television pictures.” Inter-national Telecommunication Union (Jan. 2012).
[15] Alexiou, E. and Ebrahimi, T., “On subjective and objective quality evaluation of point cloud geometry,” in[Proceedings of the 9th International Conference on Quality of Multimedia Experience (QoMEX) ], (2017).
[16] Alexiou, E., Upenik, E., and Ebrahimi, T., “Towards subjective quality assessment of point cloud imaging inaugmented reality,” in [2017 IEEE 19th International Workshop on Multimedia Signal Processing (MMSP) ],(2017).
[17] Zhang, J., Huang, W., Zhu, X., and Hwang, J. N., “A subjective quality evaluation for 3d point cloudmodels,” in [International Conference on Audio, Language and Image Processing ], 827–831 (2014).
[18] Mekuria, R., Blom, K., and Cesar, P., “Design, Implementation, and Evaluation of a Point Cloud Codecfor Tele-Immersive Video,” IEEE Transactions on Circuits and Systems for Video Technology 27, 828–842(Apr. 2017).
[19] Javaheri, A., Brites, C., Pereira, F., and Ascenso, J., “Subjective and objective quality evaluation of 3Dpoint cloud denoising algorithms.” ISO/IEC JTC m75024 (Mar. 2017).
[20] Girardeau-Montaut, D., “Cloud compare—3d point cloud and mesh processing software.”
[21] Peng, J. and Kuo, C. J., “Octree-based progressive geometry encoder,” in [ITCom ], 301–311, InternationalSociety for Optics and Photonics (2003).
[22] Huang, Y., Peng, J., Kuo, C.-C. J., and Gopi, M., “Octree-based progressive geometry coding of pointclouds,” in [SPBG ], 103–110 (2006).
[23] Schnabel, R. and Klein, R., “Octree-based point-cloud compression,” in [Spbg ], 111–120 (2006).

[24] Yan Huang, Jingliang Peng, Kuo, C.-C., and Gopi, M., “A generic scheme for progressive point cloudcoding,” IEEE Transactions on Visualization and Computer Graphics 14(2), 440–453 (2008).
[25] Kammerl, J., Blodow, N., Rusu, R. B., Gedikli, S., Beetz, M., and Steinbach, E., “Real-time compressionof point cloud streams,” in [2012 IEEE International Conference on Robotics and Automation ], 778–785(2012).
[26] Rusu, R. B. and Cousins, S., “3D is here: Point cloud library (PCL),” in [2011 IEEE International Con-ference on Robotics and Automation ], 1–4 (2011).
[27] ITU-T P.1401, “Methods, metrics and procedures for statistical evaluation, qualification and comparison ofobjective quality prediction models.” International Telecommunication Union (Jul. 2012).
[28] Tian, D., Ochimizu, H., Feng, C., Cohen, R., and Vetro, A., “Evaluation metrics for point cloud compres-sion.” ISO/IEC JTC m74008 (January 2017).
[29] ITU-T J.149, “J.149 : Method for specifying accuracy and cross-calibration of Video Quality Metrics(VQM).” International Telecommunication Union (Mar. 2004).