onboard monitoring for truck safety: from concept to ... · -px $ptu 7fijdmf %fufdujpo boe...
TRANSCRIPT

Intellimotion Vol. 12 no. 2 2006
continued on page 11
Each year over 450,000 large trucks are involved in crashes resulting in about 5000 fatalities and 120,000 injuries according to the most
recent compilation of traffic safety facts released by the National Highway Traffic Safety Administration (NHTSA). Overall, crashes involving large trucks comprise 4.1 percent of all crashes, but they also contribute to 12 percent of all fatalities (or one out of every nine). Furthermore, more than 85 percent of the time, the fatality was not an occupant of the truck [1]. These numbers underscore the fact that reduc-tion of commercial motor vehicle (CMV) crashes should be an essential element of highway safety. Granted, in 71-percent of truck-involved crashes with multiple vehicles, police assign error to pas-senger vehicle drivers. However, CMV driver error is still a major causal factor to truck-involved crashes. Consider that:
• Almost 30-percent of large truck drivers involved in fatal crashes had at least one prior conviction for speeding, compared to slightly less than 20-percent of the passenger vehicle drivers in fatal crashes. [1]
• A loaded tractor-trailer requires 20-40-per-cent further stopping distance than a car. This
situation is worsened with downgrades and wet pavement. [1]
• Crashes involving trucks are more likely to involve a serious injuries or fatalities than are crashes involving only passenger vehicles. [1]
• Over the past 10 years (1992 to 2002) there has been a 31 percent increase in registered large trucks and a 40-percent increase in miles traveled by large trucks. [1]
One means to lower the amount of CMV driver errors is to improve driver performance through CMV Onboard monitoring systems, coupled with appropriate feedback to the driver. Onboard moni-toring may provide a mechanism to encourage good driving behavior by recognizing and correcting self-induced hazardous driving situations. This is the basis for a Federal Motor Carrier Safety Administration Cooperative Agreement with Caltrans, which has turned into an active PATH project (with CCIT (California Center for Innovative Transportation) assistance, particularly in the area of system admin-istration), Onboard Monitoring and Reporting for Commercial Motor Vehicle Safety (which we simply dub OBMS).
Onboard Monitoring for Truck Safety: From Concept to Prototype to Field Operational TestJim Misener, Christopher Nowakowski (California PATH), Doug Cooper (Traffic Safety Center), JD Margulici (CCIT)
Volume 12, No. 2 2006
California PATH—Partners for Advanced Transit and Highways—is a collaboration between the California Department of Transportation (Caltrans), the University of California, other public and private academic institutions, and private industry.
PATH’s mission: applying advanced technol ogy to increase highway capacity and safety, and to reduce traffic congestion, air pollution and energy consumption.
Special on Trucks
Page 1Onboard Monitoring for Truck Safety:From Concept to Prototype to FieldOperational Test
Page 2Improving Freight Movement by Using Automated Trucks on Dedicated Truck Lanes: A Chicago Case Study
Page 4Automated Trailer Steering for Reduction of Off-tracking of Large Trucks and Improvement of Trucking Productivity
Page 8EasyConnect: Easing the Connection Between Transit and Employment
Page 12PATH on Paper: Recent PATH Research Publications
Intellimotion vol. 12 no. 2 2006
Heavy truck traffic has been growing faster than passenger vehicle traffic in recent decades, and all indications are that this trend will continue in
the future. Truck traffic has become a significant contribu-tor to congestion problems on many highways, especially in the vicinity of ports and industrial and warehousing districts. At the same time, the general congestion of the road transportation system has become a serious cost and inefficiency penalty to truck operations. This has broader negative implications for the economic health of our major ports and urban areas, as well as for the productivity and competitiveness of the state and national economies.
Modern manufacturing and logistics operations have become increasingly sensitive to congestion delays. The productivity improvements from “Just in time” production processes and from the minimization of inventories stored in warehouses and factories can only be gained if the trans-
portation system supports timely and predictable delivery schedules. If operations are designed assuming such timely and predictable deliveries, but congestion delays prevent them from being realized, the economic consequences can be severe, well beyond the direct costs of the additional time of truck operations.
Truck-only lanes
As traffic congestion has worsened, while goods movement has become less tolerant of delays, interest has grown in the possibility of developing special-purpose truck-only lanes. Studies have addressed the possibilities of adding truck-only lanes on I-10 from coast to coast, on I-81 in Virginia, on three freeways connecting the Los Angeles/ Long Beach port complex to inland rail terminals (I-710, SR-60, I-15) and in several corridors crossing Texas. The Reason Foundation issued a highly publicized report advocating
the development of a national network of tolled truck-only lanes [1].
A variety of factors contribute to the desirability of separating heavy trucks from passenger car traffic on highways that handle large volumes of truck traffic:
- enabling trucks to bypass congestion produced by passenger cars, especially with major ports being concentrated in the most congested urban regions
- providing more reliable and shorter travel times for time-critical cargoes, especially in just-in-time production and goods distribution
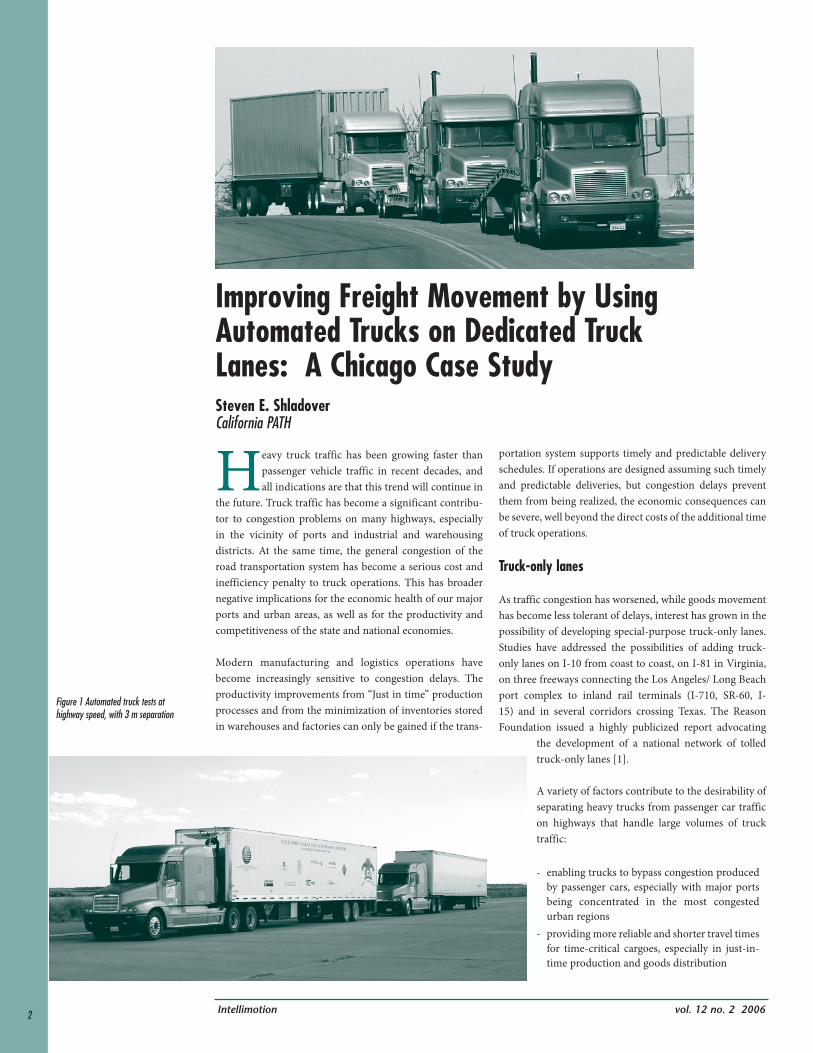
Improving Freight Movement by Using Automated Trucks on Dedicated Truck Lanes: A Chicago Case StudySteven E. ShladoverCalifornia PATH
Figure 1 Automated truck tests at highway speed, with 3 m separation
2
Intellimotionvol. 12 no. 2 2006
- opening opportunities for financing new facilities using tolls related to the benefits the trucks gain from use of those facilities
- avoiding hazardous driving conditions for trucks caused by the behavior of drivers of passenger cars
- avoiding serious crashes between vehicles of dramati-cally different mass and stiffness
- facilitating efficient matching of structural and pave-ment strength and durability to the loads that will be imposed (heavy-duty designs for truck lanes and light-duty designs for passenger car lanes), saving overall roadway construction and maintenance costs.
Despite these important potential benefits, there has been little progress on implementation of dedicated truck lanes in the U.S. The impediments to implementation are gener-ally associated with the high costs of new infrastructure construction and unavailability of right of way in the con-gested urban regions where truck lanes are most needed. The SR-60 study illustrated these challenges, with an esti-mated price tag of $4.3 billion for a 38-mile truck facility, much of which would have had to be elevated because of right of way constraints [2].
Opportunities with truck automation
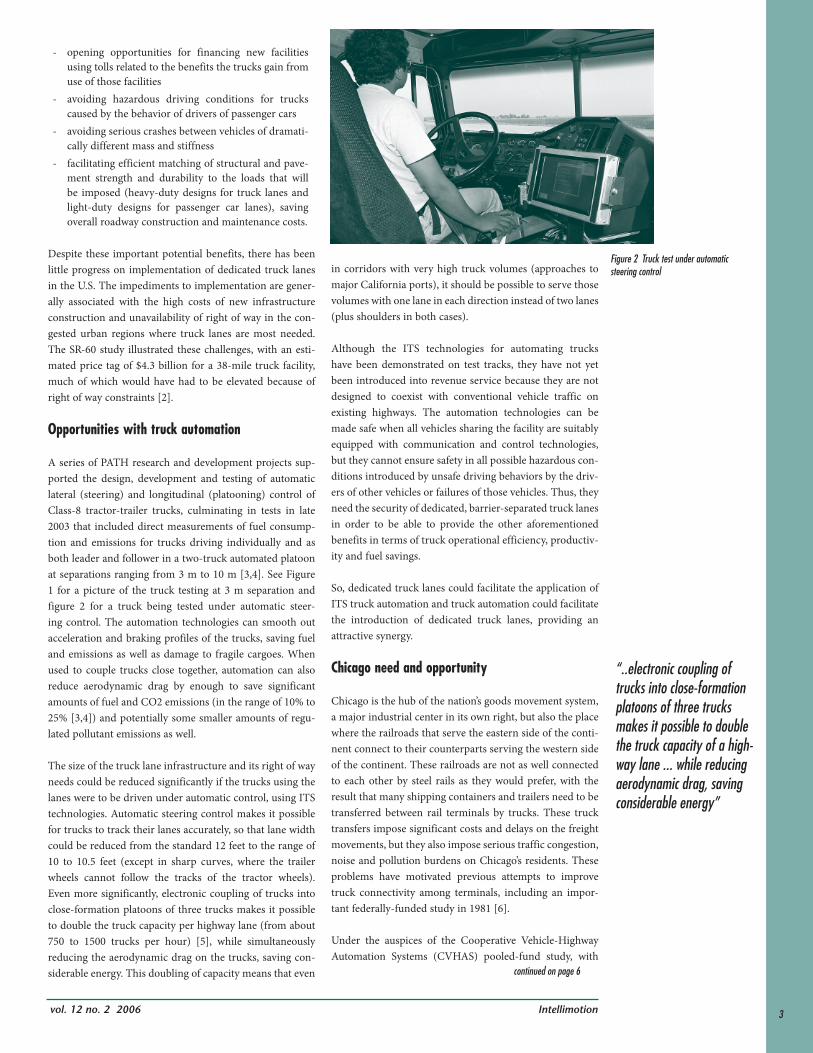
A series of PATH research and development projects sup-ported the design, development and testing of automatic lateral (steering) and longitudinal (platooning) control of Class-8 tractor-trailer trucks, culminating in tests in late 2003 that included direct measurements of fuel consump-tion and emissions for trucks driving individually and as both leader and follower in a two-truck automated platoon at separations ranging from 3 m to 10 m [3,4]. See Figure 1 for a picture of the truck testing at 3 m separation and figure 2 for a truck being tested under automatic steer-ing control. The automation technologies can smooth out acceleration and braking profiles of the trucks, saving fuel and emissions as well as damage to fragile cargoes. When used to couple trucks close together, automation can also reduce aerodynamic drag by enough to save significant amounts of fuel and CO2 emissions (in the range of 10% to 25% [3,4]) and potentially some smaller amounts of regu-lated pollutant emissions as well.
The size of the truck lane infrastructure and its right of way needs could be reduced significantly if the trucks using the lanes were to be driven under automatic control, using ITS technologies. Automatic steering control makes it possible for trucks to track their lanes accurately, so that lane width could be reduced from the standard 12 feet to the range of 10 to 10.5 feet (except in sharp curves, where the trailer wheels cannot follow the tracks of the tractor wheels). Even more significantly, electronic coupling of trucks into close-formation platoons of three trucks makes it possible to double the truck capacity per highway lane (from about 750 to 1500 trucks per hour) [5], while simultaneously reducing the aerodynamic drag on the trucks, saving con-siderable energy. This doubling of capacity means that even
in corridors with very high truck volumes (approaches to major California ports), it should be possible to serve those volumes with one lane in each direction instead of two lanes (plus shoulders in both cases).
Although the ITS technologies for automating trucks have been demonstrated on test tracks, they have not yet been introduced into revenue service because they are not designed to coexist with conventional vehicle traffic on existing highways. The automation technologies can be made safe when all vehicles sharing the facility are suitably equipped with communication and control technologies, but they cannot ensure safety in all possible hazardous con-ditions introduced by unsafe driving behaviors by the driv-ers of other vehicles or failures of those vehicles. Thus, they need the security of dedicated, barrier-separated truck lanes in order to be able to provide the other aforementioned benefits in terms of truck operational efficiency, productiv-ity and fuel savings.
So, dedicated truck lanes could facilitate the application of ITS truck automation and truck automation could facilitate the introduction of dedicated truck lanes, providing an attractive synergy.
Chicago need and opportunity
Chicago is the hub of the nation’s goods movement system, a major industrial center in its own right, but also the place where the railroads that serve the eastern side of the conti-nent connect to their counterparts serving the western side of the continent. These railroads are not as well connected to each other by steel rails as they would prefer, with the result that many shipping containers and trailers need to be transferred between rail terminals by trucks. These truck transfers impose significant costs and delays on the freight movements, but they also impose serious traffic congestion, noise and pollution burdens on Chicago’s residents. These problems have motivated previous attempts to improve truck connectivity among terminals, including an impor-tant federally-funded study in 1981 [6].
Under the auspices of the Cooperative Vehicle-Highway Automation Systems (CVHAS) pooled-fund study, with
continued on page 6
Figure 2 Truck test under automatic steering control
“..electronic coupling of trucks into close-formation platoons of three trucks makes it possible to double the truck capacity of a high-way lane ... while reducing aerodynamic drag, saving considerable energy”
3

Intellimotion vol. 12 no. 2 2006
Project background
Faced with rising fuel and health care costs, and labor shortages the trucking industry urgently needs a sig-nificant increase in fuel, equipment and driver pro-
ductivity. A major method for achieving such an increase is to transport freight with larger trailer capacity. A method would be to use a group of large trucks known as the longer combination vehicles (LCVs). LCVs include three major configurations: Rocky Mountain Double (a tractor-semitrailer combination plus an additional trailer up to 28 feet), Turnpike Double (a tractor hauling two trailers up to 48 feet each), and Triple (a tractor hauling three trailers up to 28 feet each). Twenty states permit one or more of these configurations on selected highways and access roads.
LCV operations not only raise safety concerns for the surrounding traffic and the LCV drivers themselves but also can damage roadways not equipped to support the operations. Size and weight limits on trucking operations
have long been imposed and were motivated to limit the possible safety and infrastructure hazards. The Intermodal Surface Transportation Efficiency Act of 1991 (ISTEA) (P.L. 102-240) imposed an “LCV freeze” prohibiting all 50 states from allowing any expansion of LCV operations either in terms of routes upon which LCVs may operate or in terms of the vehicle weights or dimensions that may be allowed. The Transportation Equity Act for the 21st Century (TEA-21) (P.L. 105-85) kept the LCV freeze. 2003 Senate Joint Resolution No. 7 of the State of California “respectfully memorialize the President and the Congress of the United States to maintain the current federal truck size and weight limitations and to oppose proposals to experiment with longer and heavier trucks on public highways in the reau-thorization of the federal Transportation Equity Act for the 21st Century (Public Law 105-178).” The railroad industry also voiced its strong opposition to relaxing the size and weight limits for fear that such relaxation may lure business away from the railroad; it views trucking industry’s use of the national highway system as governmental subsidy of the trucking industry. Several activist alliances have been formed to oppose relaxation of limitations on truck size and weight. With these opposing forces, expansion of LCV operations for the purpose of a significant increase in pro-ductivity appears difficult at a time when such an increase seems to be needed more than ever.
Discussions about truck size and weight limitations or about the use of LCV operations are predicated on the use of conventional tractors and trailers. The industry and the research community seem resigned to the status quo and
Automated Trailer Steering for Reduction of Off-tracking of Large Trucks and Improvement of Trucking ProductivityH.-S. Jacob Tsao, Yasser Dessouky, and Krishna RangavajhulaSan Jose State University
Rocky Mountain Double
4

Intellimotionvol. 12 no. 2 2006
are not exploring the use of modern vehicle automation technology to improve LCV operations. We observed that a root cause of several major issues associated with LCV operations is the problem of off-tracking, during either low-speed or high-speed travel. We believe that this off-tracking problem can be drastically reduced with a new operational concept and corresponding partial-automation technology: automated trailer steering (ATS). With respect to the “dumb” trailers being used today, trailers equipped with such automated trailer steering may be called “intel-ligent trailers.”
This one-year $58K project was motivated to study the potential of automated trailer steering for LCV and other large-truck operations, particularly from the perspectives of productivity, safety and roadway geometry. In this research, we developed vehicle-dynamics models to show the poten-tial of automated trailer steering in drastically reducing off-tracking for several critical scenarios. The per-tractor productivity gain achievable with LCVs is relatively clear. The proposed technology of automated trailer steering can also be used to create a new mode of operations in which a tractor can pull a larger number of short trailers. We refer to such combination vehicles as Shorter Trailer Combination Vehicles (STCVs) and the corresponding operations as STCV operations. Such operations can be used not only for trucking on the nation’s roadway systems but also for other operations involving towed vehicles, e.g., warehouse opera-tions where a tractor pulls a number of vehicles carrying merchandise for storage or dispensing. In this article, we focus on (a) off-tracking reduction with automated trailer steering and (b) productivity improvement with STCV operations for household-freight moving companies, i.e., the “van lines.”
The research findings of this project have been documented in “Automatic Steering For Conventional Truck Trailers: Development And Assessment Of Operating Concepts For Improving Safety, Productivity And Pavement Durability - Final Report, “ Tsao, H.-S.J., Dessouky, Y., Rangavajhula, K, Zeta, J.B., and Zhou, L., California PATH Research Report UCB-ITS-PRR-2006-8, Institute of Transportation Studies, University of California, Berkeley, 2006.
Vehicle-dynamics models for longer combination vehicles and drastic reduction of off-tracking
We extended the linear yaw-plane model developed by Wu and Lin (2003) for a tractor and one trailer to include up to two additional trailers. For Wu and Lin’s tractor-and-one-trailer problem, there are three degrees of freedom corresponding to side slip velocity, yawing motion of the tractor and trailer, and the articulation angle between the tractor and the trailer. For a tractor-and-three-trailers system considered in this project, the articulation angles between trailer 1 and trailer 2, and between trailer 2 and trailer 3 provide two additional degrees of freedom, result-ing in a five-degree-of-freedom motion. Only the front
axle of a trailer is equipped with steering capability. Tractor and trailer units are considered as rigid masses with body-fixed coordinates centered on the mass centers of the units. Aerodynamic forces, rolling and pitching motions, braking inputs and the longitudinal forces generated by tires and road interactions are neglected. Lateral forces generated by tires and road interactions, which constitute the main influence on yaw dynamics and lateral stability, are of course included in the model. Each wheel in this zero-vehicle-width model represents an axle. Using Newton’s second law, equations of motion were derived for the trac-tor and trailer units. The equations were linearized under the small-displacements assumption. Further simplification was achieved by assuming steady forward speed.
For each of a set of tractor steering angles selected for the purpose of a 90-degree turn, steering angles for the trailers that reduce off-tracking significantly were identified. Low-speed off-tracking occurs when the wheels of the rearmost trailer axle traverse a path inside the path of the tractor’s front steering axle. We examined low-speed off-tracking for articulated systems with 1, 2 and 3 trailers at a low speed of Vx=5 ft/sec (or 3.4 miles/hour) during a 90-degree turn. For a case of three trailers, off-tracking is reduced from 3.7 ft to 0.6 ft. For low-speed 90-degree turns, trailer steering also reduces the minimum turning radius.
We also examined high-speed off-tracking for 1-, 2-, and 3-trailer systems with a forward speed of Vx=50 ft/sec (or 34.2 miles/hour) during a 90-degree turn. In high-
continued on page 14
Triple trailershowing off-tracking
Turnpike Double showing off-tracking
5
Intellimotion vol. 12 no. 2 2006
continued from page 3
funding from Caltrans and several other state DOTs, PATH led a new study of the opportunities to improve freight movement in the Chicago region by use of dedicated truck lanes, with and without the application of truck automation technology. Local knowledge and stakeholder interactions were provided by Illinois DOT (IDOT) and the Chicago Area Transportation Study (CATS), the regional MPO, with support from the University of Illinois at Chicago (UIC).
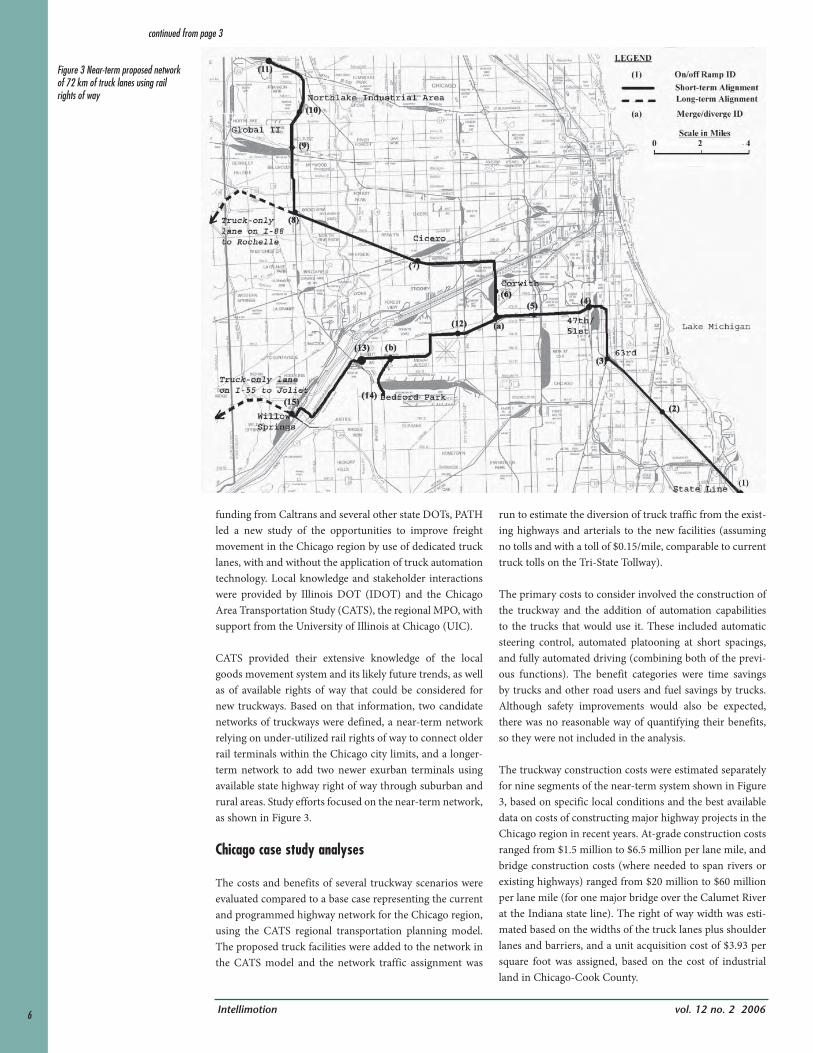
CATS provided their extensive knowledge of the local goods movement system and its likely future trends, as well as of available rights of way that could be considered for new truckways. Based on that information, two candidate networks of truckways were defined, a near-term network relying on under-utilized rail rights of way to connect older rail terminals within the Chicago city limits, and a longer-term network to add two newer exurban terminals using available state highway right of way through suburban and rural areas. Study efforts focused on the near-term network, as shown in Figure 3.
Chicago case study analyses
The costs and benefits of several truckway scenarios were evaluated compared to a base case representing the current and programmed highway network for the Chicago region, using the CATS regional transportation planning model. The proposed truck facilities were added to the network in the CATS model and the network traffic assignment was
run to estimate the diversion of truck traffic from the exist-ing highways and arterials to the new facilities (assuming no tolls and with a toll of $0.15/mile, comparable to current truck tolls on the Tri-State Tollway).
The primary costs to consider involved the construction of the truckway and the addition of automation capabilities to the trucks that would use it. These included automatic steering control, automated platooning at short spacings, and fully automated driving (combining both of the previ-ous functions). The benefit categories were time savings by trucks and other road users and fuel savings by trucks. Although safety improvements would also be expected, there was no reasonable way of quantifying their benefits, so they were not included in the analysis.
The truckway construction costs were estimated separately for nine segments of the near-term system shown in Figure 3, based on specific local conditions and the best available data on costs of constructing major highway projects in the Chicago region in recent years. At-grade construction costs ranged from $1.5 million to $6.5 million per lane mile, and bridge construction costs (where needed to span rivers or existing highways) ranged from $20 million to $60 million per lane mile (for one major bridge over the Calumet River at the Indiana state line). The right of way width was esti-mated based on the widths of the truck lanes plus shoulder lanes and barriers, and a unit acquisition cost of $3.93 per square foot was assigned, based on the cost of industrial land in Chicago-Cook County.
Figure 3 Near-term proposed network of 72 km of truck lanes using rail rights of way
6
Intellimotionvol. 12 no. 2 2006
continued on page 10
Dedicated truck lanes, without automation
Even without considering the use of automation technol-ogy on the trucks, the implementation of the truckway was found to be highly beneficial. By smoothing the flow of truck traffic and enabling it to shift from congested arteri-als and freeways to free flow on the truckways, there were modest savings in fuel consumption. The more dramatic benefits were from travel time savings, which averaged 0.7% for passenger cars in the region but 3.8% for heavy trucks in the region. Over a 20-year study period, these time sav-ings were estimated to be worth over $2.9 billion, of which more than $1.1 billion was saved by the trucks (at a rate of $65/hour in current dollars). The construction and right of way costs for the truckway totaled $790 million, and after addition of annual operating and maintenance costs, the ratio of benefits to costs exceeded 3.6.
It is important to note that the projected growth in truck traffic was such that a truckway with a single traffic lane in each direction would have reached its capacity mid-way through the study period, so the analysis assumed that a second lane in each direction would be added at that time, significantly impacting the cost of implementation.
Effects of adding automation capabilities to trucks
For the Chicago region scenario, the primary automa-tion benefits were associated with automated platooning at short spacings rather than with automatic steering or fully automated driving. The main advantage of automatic steering is the opportunity to reduce lane width, thereby saving construction and right of way costs. However, the lane width can only be reduced if all the trucks using the lane are suitably equipped, which introduces a “chicken and egg” deployment challenge. In the Chicago case study con-text, this would have required equipping all the trucks that would use the new facility with automatic steering from the start, limiting the number of trucks that could benefit from
its use and imposing relatively high capital costs per truck while the technology was still relatively immature. This would have been less cost effective than implementing the truckways entirely with conventional technology.
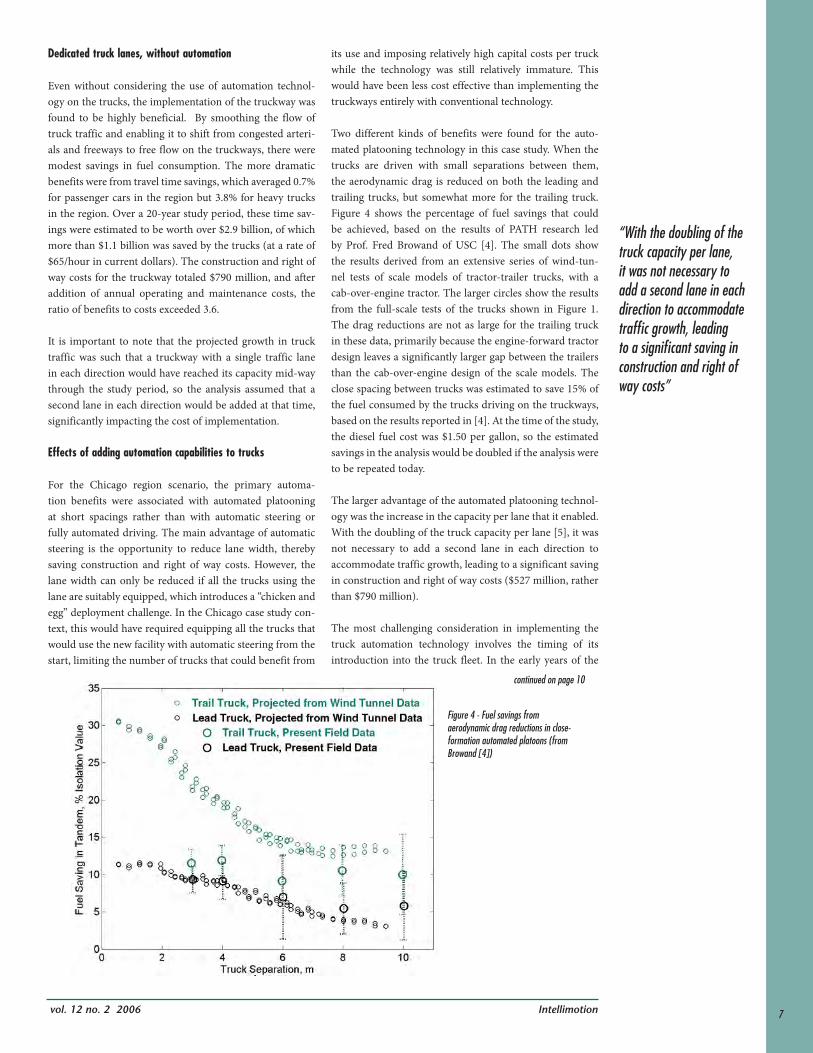
Two different kinds of benefits were found for the auto-mated platooning technology in this case study. When the trucks are driven with small separations between them, the aerodynamic drag is reduced on both the leading and trailing trucks, but somewhat more for the trailing truck. Figure 4 shows the percentage of fuel savings that could be achieved, based on the results of PATH research led by Prof. Fred Browand of USC [4]. The small dots show the results derived from an extensive series of wind-tun-nel tests of scale models of tractor-trailer trucks, with a cab-over-engine tractor. The larger circles show the results from the full-scale tests of the trucks shown in Figure 1. The drag reductions are not as large for the trailing truck in these data, primarily because the engine-forward tractor design leaves a significantly larger gap between the trailers than the cab-over-engine design of the scale models. The close spacing between trucks was estimated to save 15% of the fuel consumed by the trucks driving on the truckways, based on the results reported in [4]. At the time of the study, the diesel fuel cost was $1.50 per gallon, so the estimated savings in the analysis would be doubled if the analysis were to be repeated today.
The larger advantage of the automated platooning technol-ogy was the increase in the capacity per lane that it enabled. With the doubling of the truck capacity per lane [5], it was not necessary to add a second lane in each direction to accommodate traffic growth, leading to a significant saving in construction and right of way costs ($527 million, rather than $790 million).
The most challenging consideration in implementing the truck automation technology involves the timing of its introduction into the truck fleet. In the early years of the
Figure 4 - Fuel savings from aerodynamic drag reductions in close-formation automated platoons (from Browand [4])
“With the doubling of the truck capacity per lane, it was not necessary to add a second lane in each direction to accommodate traffi c growth, leading to a signifi cant saving in construction and right of way costs”
7

Intellimotion vol. 12 no. 2 2006
June 12, 2006 marked the début of the EasyConnect field test, a unique inter-modal transportation program coordinated
by researchers at California PATH. EasyConnect enables businesses within a four mile radius of the Pleasant Hill Bay Area Rapid Transit (BART) District station to rent shared-use bicycles, electric bicycles, and Segway® Human Transporters (HTs) for their employees to use for commuting and day-time travel. Instead of driving all the way to work, participants can now take transit and carpool—sav-ing fuel, reducing emissions and congestion, and lessening demand for limited parking in the area.
Each morning, employees can check out a bicycle or Segway HT from an electronic locker at the Pleasant Hill BART station and then ride to work along the scenic Iron-Horse Trail, for instance. Units are also available for rental from nearby offices as well for off-site meetings, errands, or lunch appointments. At the end of the day, employees can ride the bicycles or Segway HTs back to the station, where they are stored and recharged in electronic lockers.
The Pleasant Hill BART station was chosen as the base for the project because of its proximity to Contra Costa Centre, a well-planned business and residential development. The Centre is also the future site of a “transit village,” currently
under construction, that is designed to facilitate occupants’ use of public transit.
Approximately ten companies and more than 25 employees have already signed up to participate during the ini-tial recruitment phase of the project. The PATH team is actively recruiting additional employers and employees to participate through the summer. Businesses pay $150 per vehicle per month, which allows their employees to use the HTs and bikes for free, after taking a short training course. Segway, Inc. has loaned the program 10 of its unique self-balancing, electric vehicles called Human Transporters or HTs, and Giant Bicycle, Inc. has loaned
10 bicycles to the program: five electric and five standard models.
The employer shared-use rental model appears to be unique to EasyConnect among bicycle-sharing programs in the U.S. and Europe, and the transit linkage of the Segway HTs is novel in the U.S. One other city-based program that explicitly links Segway HTs to transit stations and transit use is the “Oxygen Network” in Lille, France. An “Oxygen Station” and “Oxygen Boutique,” operated by a private company and funded by government subsidies, allows indi-viduals to rent any of the 16 Segways HTs and 25 electric bicycles available in intervals ranging from one half-hour to monthly. Discounts are given to those who use public trans-portation. The Oxygen Boutique is conveniently located at a railway station, while the Oxygen Station resides near a parking lot, increasing the likelihood that the devices will be used to finish the final leg of trips.
The California Department of Transportation is support-ing the EasyConnect program with $369,000 in grants. Another $131,000 in funding is provided by grants from the Metropolitan Transportation Commission, the Bay Area Quality Management District, Contra Costa Centre, Contra Costa County, 511 Contra Costa, Segway, Inc., and Giant Bicycles. A total of $530,000 is supporting this effort.
Preliminary field test results will be available next summer and the final evaluation will be completed six months after the close of the field test. The program evaluation will gauge the effect of the program on transit access, transit use, auto travel, and local parking.
EasyConnect: Easing the Connection Between Transit and Employment
Susan Shaheen and Caroline RodierCalifornia PATH
Susan Shaheen, Policy & Behavioral Research Program Leader/principal
investigator, introduces the EasyCon-nect project at the media launch
8
Intellimotionvol. 12 no. 2 2006
If successful, EasyConnect will be expanded to other areas of California. The plan is to eventually combine the project at the Pleasant Hill BART station with other successful transportation technologies, such as smart parking reserva-tion services, real-time freeway and transit information sig-nage, carsharing (short-term auto use), and power supplied by a hydrogen fuel cell to support a small electric vehicle and the Segway HTs.�
For more information about EasyConnect see:
“EasyConnect: Low-Speed Modes Linked to Transit Planning Project”, Susan A. Shaheen, Caroline J. Rodier. California PATH Research Report, UCB-ITS-PWP-2006-7.
“Improving Bay Area Rapid Transit District Connectivity and Access with the Segway Human Transporter and Other Low-Speed Mobility Devices.” Susan A. Shaheen, Caroline J. Rodier, Amanda Eaken. Transportation Research Record, (2005).
“EasyConnect II: Integrating Transportation, Information, and Energy Technologies at Transit Oriented Developments.” Susan A. Shaheen, Caroline
J. Rodier, Joshua Seelig. Transportation Research Board (TRB), 2006.
“Improving Bay Area Rapid Transit (BART) District Connectivity and Access with the Segway Human Transporter and Other Low Speed Mobility Devices” Caroline J. Rodier, Susan A. Shaheen, Linda Novick. California PATH Research Report, UCB-ITS-PRR-2004-27.
“Unsafe at Any Speed?: What the Literature Says about Low-Speed Modes.” Caroline J. Rodier, Susan A. Shaheen, Linda Novick. Transportation Research Board (TRB), 2004.
“Bridging the Last Mile: A Study of the Behavioral, Institutional, and Economic Potential of the Segway Human Transporter.” Susan A. Shaheen, Rachel Finson. Transportation Research Board (TRB), 2003.
Available for download athttp://www.innovativemobility.org/
http://www.easyconnect.com
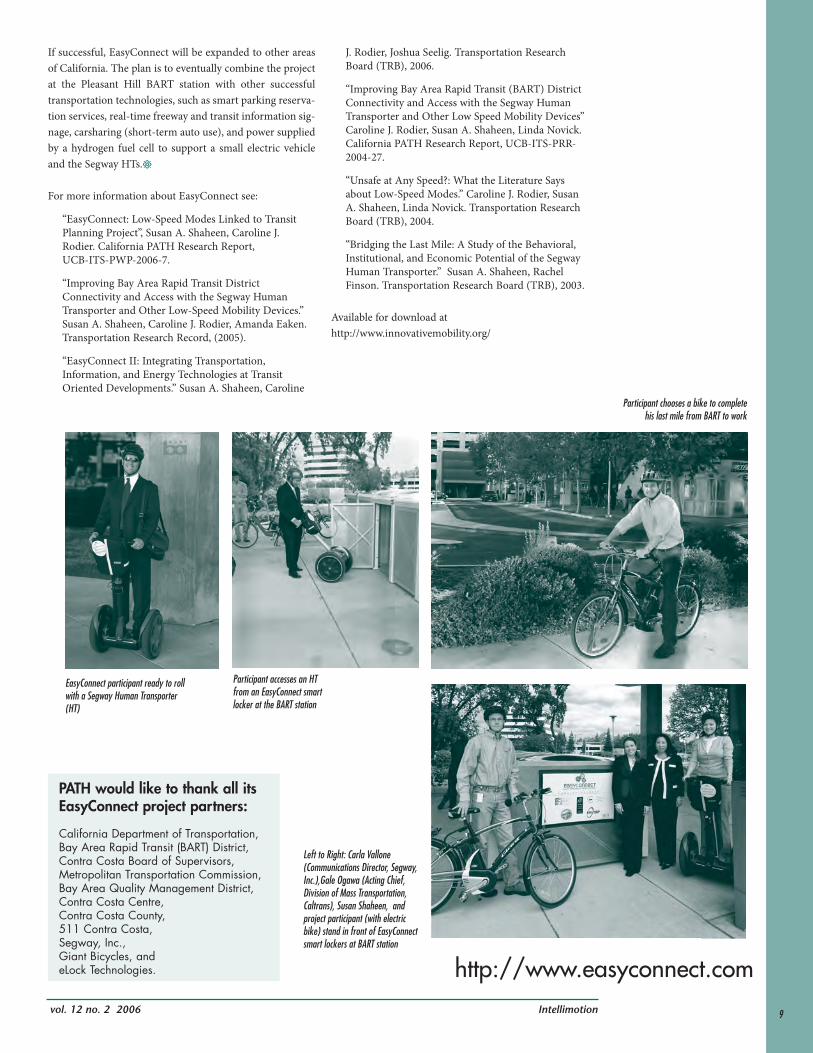
EasyConnect participant ready to roll with a Segway Human Transporter (HT)
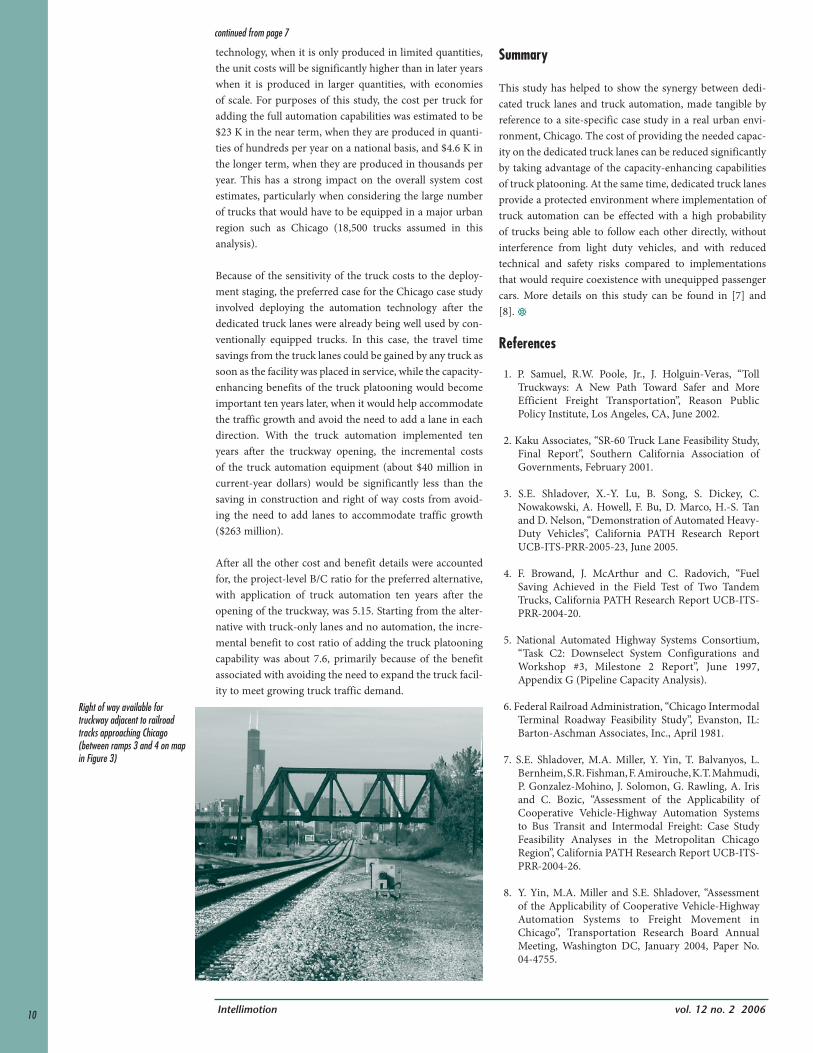
Participant accesses an HT from an EasyConnect smart locker at the BART station
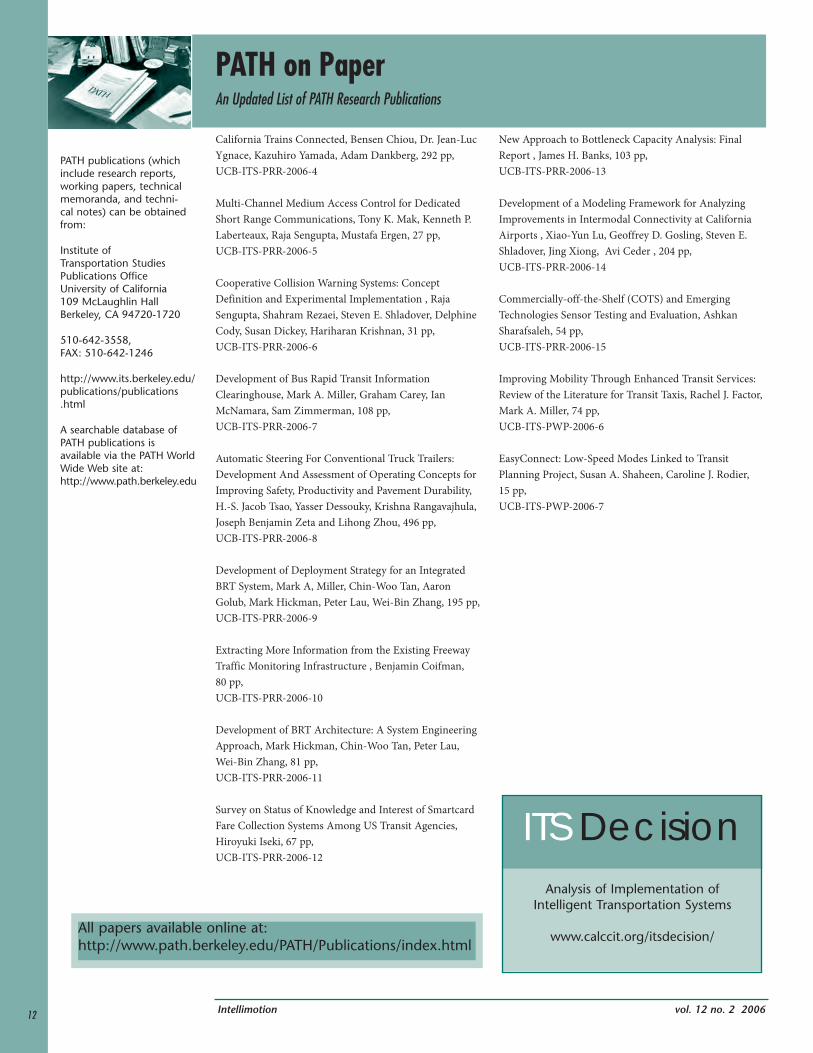
Left to Right: Carla Vallone (Communications Director, Segway, Inc.),Gale Ogawa (Acting Chief, Division of Mass Transportation, Caltrans), Susan Shaheen, and project participant (with electric bike) stand in front of EasyConnect smart lockers at BART station
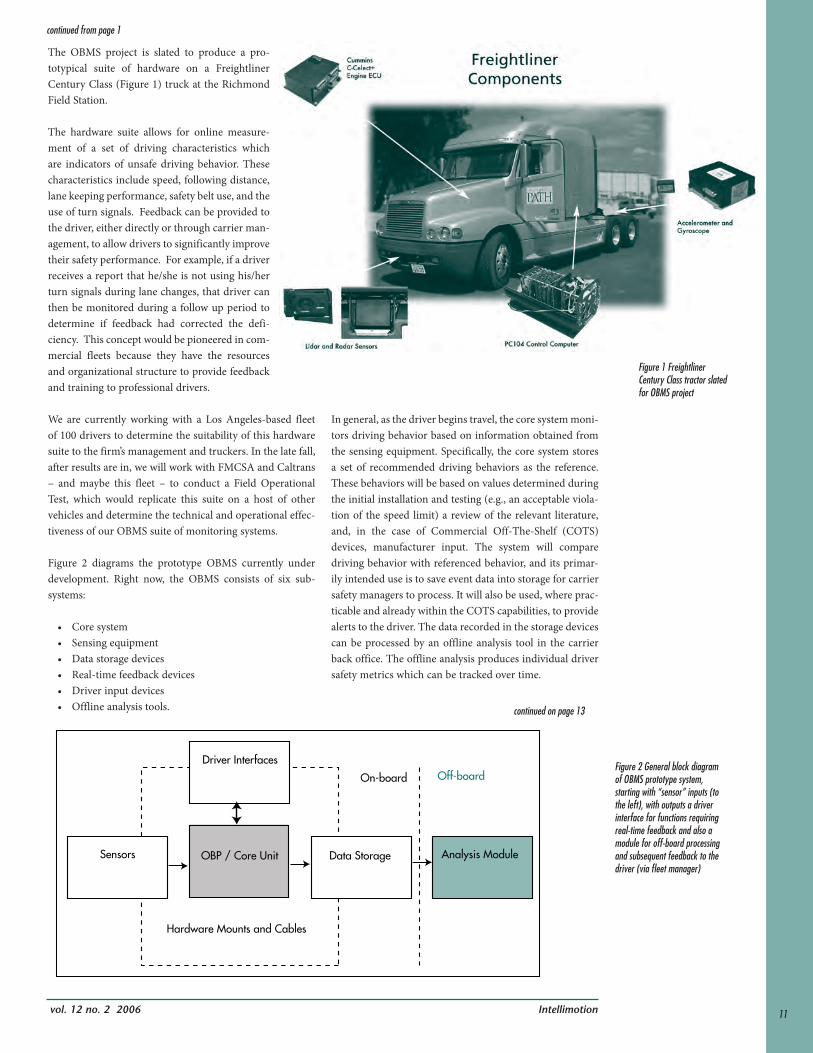
Participant chooses a bike to complete his last mile from BART to work
9
PATH would like to thank all its EasyConnect project partners:
California Department of Transportation,Bay Area Rapid Transit (BART) District,Contra Costa Board of Supervisors,Metropolitan Transportation Commission,Bay Area Quality Management District,Contra Costa Centre,Contra Costa County,511 Contra Costa,Segway, Inc.,Giant Bicycles, andeLock Technologies.
Intellimotion vol. 12 no. 2 2006
technology, when it is only produced in limited quantities, the unit costs will be significantly higher than in later years when it is produced in larger quantities, with economies of scale. For purposes of this study, the cost per truck for adding the full automation capabilities was estimated to be $23 K in the near term, when they are produced in quanti-ties of hundreds per year on a national basis, and $4.6 K in the longer term, when they are produced in thousands per year. This has a strong impact on the overall system cost estimates, particularly when considering the large number of trucks that would have to be equipped in a major urban region such as Chicago (18,500 trucks assumed in this analysis).
Because of the sensitivity of the truck costs to the deploy-ment staging, the preferred case for the Chicago case study involved deploying the automation technology after the dedicated truck lanes were already being well used by con-ventionally equipped trucks. In this case, the travel time savings from the truck lanes could be gained by any truck as soon as the facility was placed in service, while the capacity-enhancing benefits of the truck platooning would become important ten years later, when it would help accommodate the traffic growth and avoid the need to add a lane in each direction. With the truck automation implemented ten years after the truckway opening, the incremental costs of the truck automation equipment (about $40 million in current-year dollars) would be significantly less than the saving in construction and right of way costs from avoid-ing the need to add lanes to accommodate traffic growth ($263 million).
After all the other cost and benefit details were accounted for, the project-level B/C ratio for the preferred alternative, with application of truck automation ten years after the opening of the truckway, was 5.15. Starting from the alter-native with truck-only lanes and no automation, the incre-mental benefit to cost ratio of adding the truck platooning capability was about 7.6, primarily because of the benefit associated with avoiding the need to expand the truck facil-ity to meet growing truck traffic demand.
Summary
This study has helped to show the synergy between dedi-cated truck lanes and truck automation, made tangible by reference to a site-specific case study in a real urban envi-ronment, Chicago. The cost of providing the needed capac-ity on the dedicated truck lanes can be reduced significantly by taking advantage of the capacity-enhancing capabilities of truck platooning. At the same time, dedicated truck lanes provide a protected environment where implementation of truck automation can be effected with a high probability of trucks being able to follow each other directly, without interference from light duty vehicles, and with reduced technical and safety risks compared to implementations that would require coexistence with unequipped passenger cars. More details on this study can be found in [7] and [8]. �
References
1. P. Samuel, R.W. Poole, Jr., J. Holguin-Veras, “Toll Truckways: A New Path Toward Safer and More Efficient Freight Transportation”, Reason Public Policy Institute, Los Angeles, CA, June 2002.
2. Kaku Associates, “SR-60 Truck Lane Feasibility Study, Final Report”, Southern California Association of Governments, February 2001.
3. S.E. Shladover, X.-Y. Lu, B. Song, S. Dickey, C. Nowakowski, A. Howell, F. Bu, D. Marco, H.-S. Tan and D. Nelson, “Demonstration of Automated Heavy-Duty Vehicles”, California PATH Research Report UCB-ITS-PRR-2005-23, June 2005.
4. F. Browand, J. McArthur and C. Radovich, “Fuel Saving Achieved in the Field Test of Two Tandem Trucks, California PATH Research Report UCB-ITS-PRR-2004-20.
5. National Automated Highway Systems Consortium, “Task C2: Downselect System Configurations and Workshop #3, Milestone 2 Report”, June 1997, Appendix G (Pipeline Capacity Analysis).
6. Federal Railroad Administration, “Chicago Intermodal Terminal Roadway Feasibility Study”, Evanston, IL: Barton-Aschman Associates, Inc., April 1981.
7. S.E. Shladover, M.A. Miller, Y. Yin, T. Balvanyos, L. Bernheim, S.R. Fishman, F. Amirouche, K.T. Mahmudi, P. Gonzalez-Mohino, J. Solomon, G. Rawling, A. Iris and C. Bozic, “Assessment of the Applicability of Cooperative Vehicle-Highway Automation Systems to Bus Transit and Intermodal Freight: Case Study Feasibility Analyses in the Metropolitan Chicago Region”, California PATH Research Report UCB-ITS-PRR-2004-26.
8. Y. Yin, M.A. Miller and S.E. Shladover, “Assessment of the Applicability of Cooperative Vehicle-Highway Automation Systems to Freight Movement in Chicago”, Transportation Research Board Annual Meeting, Washington DC, January 2004, Paper No. 04-4755.
Right of way available for truckway adjacent to railroad tracks approaching Chicago (between ramps 3 and 4 on map in Figure 3)
continued from page 7
10
Intellimotionvol. 12 no. 2 2006
The OBMS project is slated to produce a pro-totypical suite of hardware on a Freightliner Century Class (Figure 1) truck at the Richmond Field Station.
The hardware suite allows for online measure-ment of a set of driving characteristics which are indicators of unsafe driving behavior. These characteristics include speed, following distance, lane keeping performance, safety belt use, and the use of turn signals. Feedback can be provided to the driver, either directly or through carrier man-agement, to allow drivers to significantly improve their safety performance. For example, if a driver receives a report that he/she is not using his/her turn signals during lane changes, that driver can then be monitored during a follow up period to determine if feedback had corrected the defi-ciency. This concept would be pioneered in com-mercial fleets because they have the resources and organizational structure to provide feedback and training to professional drivers.
We are currently working with a Los Angeles-based fleet of 100 drivers to determine the suitability of this hardware suite to the firm’s management and truckers. In the late fall, after results are in, we will work with FMCSA and Caltrans – and maybe this fleet – to conduct a Field Operational Test, which would replicate this suite on a host of other vehicles and determine the technical and operational effec-tiveness of our OBMS suite of monitoring systems.
Figure 2 diagrams the prototype OBMS currently under development. Right now, the OBMS consists of six sub-systems:
• Core system• Sensing equipment• Data storage devices• Real-time feedback devices• Driver input devices• Offline analysis tools.
In general, as the driver begins travel, the core system moni-tors driving behavior based on information obtained from the sensing equipment. Specifically, the core system stores a set of recommended driving behaviors as the reference. These behaviors will be based on values determined during the initial installation and testing (e.g., an acceptable viola-tion of the speed limit) a review of the relevant literature, and, in the case of Commercial Off-The-Shelf (COTS) devices, manufacturer input. The system will compare driving behavior with referenced behavior, and its primar-ily intended use is to save event data into storage for carrier safety managers to process. It will also be used, where prac-ticable and already within the COTS capabilities, to provide alerts to the driver. The data recorded in the storage devices can be processed by an offline analysis tool in the carrier back office. The offline analysis produces individual driver safety metrics which can be tracked over time.
Driver Interfaces
Sensors OBP / Core Unit
Hardware Mounts and Cables
Data Storage Analysis Module
On-board Off-board
continued from page 1
Figure 1 Freightliner Century Class tractor slated for OBMS project
Figure 2 General block diagram of OBMS prototype system, starting with “sensor” inputs (to the left), with outputs a driver interface for functions requiring real-time feedback and also a module for off-board processing and subsequent feedback to the driver (via fl eet manager)
continued on page 13
11
Intellimotion vol. 12 no. 2 2006
ITS DecisionAnalysis of Implementation of
Intelligent Transportation Systems
www.calccit.org/itsdecision/
PATH publications (which include research reports, working papers, technical memoranda, and techni-cal notes) can be obtained from:
Institute of Transportation Studies Publications OfficeUniversity of California109 McLaughlin HallBerkeley, CA 94720-1720
510-642-3558, FAX: 510-642-1246
http://www.its.berkeley.edu/publications/publications.html
A searchable database of PATH publications is available via the PATH World Wide Web site at:http://www.path.berkeley.edu
California Trains Connected, Bensen Chiou, Dr. Jean-Luc Ygnace, Kazuhiro Yamada, Adam Dankberg, 292 pp, UCB-ITS-PRR-2006-4
Multi-Channel Medium Access Control for Dedicated Short Range Communications, Tony K. Mak, Kenneth P. Laberteaux, Raja Sengupta, Mustafa Ergen, 27 pp, UCB-ITS-PRR-2006-5
Cooperative Collision Warning Systems: Concept Definition and Experimental Implementation , Raja Sengupta, Shahram Rezaei, Steven E. Shladover, Delphine Cody, Susan Dickey, Hariharan Krishnan, 31 pp, UCB-ITS-PRR-2006-6
Development of Bus Rapid Transit Information Clearinghouse, Mark A. Miller, Graham Carey, Ian McNamara, Sam Zimmerman, 108 pp, UCB-ITS-PRR-2006-7
Automatic Steering For Conventional Truck Trailers: Development And Assessment of Operating Concepts for Improving Safety, Productivity and Pavement Durability, H.-S. Jacob Tsao, Yasser Dessouky, Krishna Rangavajhula, Joseph Benjamin Zeta and Lihong Zhou, 496 pp, UCB-ITS-PRR-2006-8
Development of Deployment Strategy for an Integrated BRT System, Mark A, Miller, Chin-Woo Tan, Aaron Golub, Mark Hickman, Peter Lau, Wei-Bin Zhang, 195 pp, UCB-ITS-PRR-2006-9
Extracting More Information from the Existing Freeway Traffic Monitoring Infrastructure , Benjamin Coifman, 80 pp, UCB-ITS-PRR-2006-10
Development of BRT Architecture: A System Engineering Approach, Mark Hickman, Chin-Woo Tan, Peter Lau, Wei-Bin Zhang, 81 pp, UCB-ITS-PRR-2006-11
Survey on Status of Knowledge and Interest of Smartcard Fare Collection Systems Among US Transit Agencies, Hiroyuki Iseki, 67 pp, UCB-ITS-PRR-2006-12
New Approach to Bottleneck Capacity Analysis: Final Report , James H. Banks, 103 pp, UCB-ITS-PRR-2006-13
Development of a Modeling Framework for Analyzing Improvements in Intermodal Connectivity at California Airports , Xiao-Yun Lu, Geoffrey D. Gosling, Steven E. Shladover, Jing Xiong, Avi Ceder , 204 pp, UCB-ITS-PRR-2006-14
Commercially-off-the-Shelf (COTS) and Emerging Technologies Sensor Testing and Evaluation, Ashkan Sharafsaleh, 54 pp, UCB-ITS-PRR-2006-15
Improving Mobility Through Enhanced Transit Services: Review of the Literature for Transit Taxis, Rachel J. Factor, Mark A. Miller, 74 pp, UCB-ITS-PWP-2006-6
EasyConnect: Low-Speed Modes Linked to Transit Planning Project, Susan A. Shaheen, Caroline J. Rodier, 15 pp, UCB-ITS-PWP-2006-7
12
PATH on PaperAn Updated List of PATH Research Publications
All papers available online at:http://www.path.berkeley.edu/PATH/Publications/index.html
Intellimotionvol. 12 no. 2 2006
The OBMS will perform the following operating modes:• Driver identification • Monitoring, recording, and as available, real-time
feedback during normal driving conditions• Incident and event recording • Reporting (generated from system logs)• Idle mode (when ignition is off)
Functionally, the system will monitor following param-eters:
1. Driving behaviors related to vehicle speed
This includes vehicle speed relative to speed limit, with speed transgressions recorded in storage devices. In this case, a visual/audible warning shall be given to the driver since this can be done quite easily, and speeding is widely acknowledged to be dangerous.
Another monitored parameter will be vehicle speed relative to safe curve speed, as determined by an online calculation of vehicle dynamics, coupled with road surface sensing. The feedback approach for unsafe speed is TBD.
Also to be measured is vehicle speed relative to road-way (weather) condition. The OBMS will provide offline analysis on the roadway and weather conditions by using information, such as stored regional weather map, wiper usage, and an in situ road surface (ice vs. no ice) sensor. The envisioned system will obtain wiper usage by COTS sensors mounted onboard (as wiper usage is not part of the serial data bus stream). The feedback approach for unsafe speed is TBD.
The final driver behavior related to vehicle speed to be monitored will be vehicle speed relative to traffic flow. The OBMS will include an Eaton VORAD EVT-300 with lane change detection. The feedback approach for unsafe speed is TBD.
2. Driving behaviors related to following distance
This relates to following too close for the combination of traveling speed and trailer loading. The OBMS will use the same EVT-300 used to determine vehicle speed relative to traffic flow. In this case, however, the OBMS shall also com-bine EVT-300 information with the speedometer reading available through the truck data bus to determine unsafe following distance. Because of the risk of this behavior and the (relative) ease in displaying a warning, the OBMS shall provide real-time feedback in the form of a warning/status light in addition to offline processing and feedback.
Another monitored parameter will be following too close for weather conditions. The OBMS will provide, at a mini-mum, offline analysis on the roadway and weather condi-tions by employing information, such as stored regional weather map, wiper usage, and sensor output of road sur-face (ice vs. no ice) condition. If it is feasible to do so, real-
time information will be given to the driver. The feedback approach for the unsafe following distance is TBD.
Also recorded will be hard braking events and the causes to include cut-ins. To do so requires speedometer, accelerome-ter, and video camera data. The OBMS will use DriveCAM, a product that combines accelerometer and video camera. Delayed or off-line feedback with summary statistics will be given to the driver.
3. Driving behaviors related to lateral control
Lane position and lane changes will be recorded. The OBMS system will be Assistware’s systems to provide lane position with respect to the lane marking. Such commercial systems can provide real-time lane departure warning in the form of a visual/audible warning. Delayed or offline feedback with summary statistics shall be given to the driver.
The use of turn signal before merging. The OBMS will include a turn signal “on” detector, for which we will wire. Delayed or off-line feedback with summary statistics will be given to the driver.
Also recorded will be side or blind spot vehicle presence during lane changes. The system will use a TBD side colli-sion warning system to determine blind spot vehicle pres-ence. The side collision warning system will provide real-time feedback in the form of a visual/audible signal to the driver. Delayed or offline feedback with summary statistics shall be given to the driver.
4. Other driving behaviors
A surrogate measure of driver fatigue will be recorded. The OBMS will incorporate the lane departure warning system to examine driver fatigue. The lane departure warning system shall give a real-time visual or audible warning to the driver.
Hours of service will be recorded. The system will utilize a COTS product to record such HOS information.
Driving behavior at intersections will be monitored. The primary candidate system incorporate GPS/GIS and speed-ometer information with NAVTEQ’s system to determine if the vehicle stops for stop signs. Delayed or off-line feedback with summary statistics based on recorded data shall be given to the driver.
In addition, driver attention will be monitored. While the most direct measure for both distraction and drowsiness is monitoring eye scan behavior; the cost for such systems is prohibitive at this point. The primary candidate system, therefore, will use recognized (e.g., [2]) surrogate measures including steering input, lane position, and pedal inputs. The offline feedback with summary statistics will be given to the driver. �
continued from page 11
continued next page
13
Intellimotion vol. 12 no. 2 2006
speed off-tracking, the trailer units move outward due to lateral accelerations. For a case of three trailers, the severe off-tracking of 22 ft is reduced significantly to 4 ft. These drastic reductions of off-tracking can benefit the operations of all large trucks, including the ubiquitous tractor-semi-trailer combinations, regular (“STAA”) doubles and LCVs. For high-speed 90-degree turns, trailer steering causes the whole tractor-trailer(s) combination to negotiate a larger turn radius.
It is well known that low- and high-speed off-tracking for Rocky Mountain doubles and turnpike doubles is more severe than that for tractor-triple-trailer combinations. We expect that automated trailer steering is even more benefi-cial for these two categories of two-trailer LCVs. We also studied trailer yaw velocities, slip velocities, lateral forces and the effect of steering-axle location on the stability of the systems during a lane change.
A linear stability analysis indicates that adding non-steered trailer(s) considerably reduces system lateral stability and that the trailer steering-axle location plays a critical role in such stability. We believe that implementation of automated trailer steering should reduce LCV off-tracking signifi-cantly. Developing control algorithms and mechanisms is a worthy research subject for reducing the safety and infra-structure hazards associated with large-truck operations.
The findings on vehicle-dynamics models and their appli-cations to off-tracking reduction have been summarized in “Effect of Multi-Axle Steering on Off-tracking and Dynamic Lateral Response of Articulated Tractor-Trailer Combinations,” which has been accepted for publication in a forthcoming issue of the International Journal of Heavy Vehicle Systems.
A new mode of freight transportation – short trailer combination vehicles
A truck may safely haul a larger number of shorter trail-ers, and hence have a higher productivity potential for the Less-Than-Truck-Load (LTL) freight industry, particularly those segments of the LTL industry in which loading, pack-ing, load balancing, picking and unloading, account for a significant amount of the total time of truck operation. For example, in the “van-line” industry, an 18-wheeler typically hauls belongings of multiple households and parks at a des-tination for either loading or unloading while the rest of the load or at least the tractor waits for hours or even a day. A solution to this problem is the use of the short trailers that can be easily coupled and decoupled from the tractor, and hence the trailers can be dropped off for loading and unloading by local loading/unloading specialists or the cus-tomer before and after transportation. This allows the truck to do what it is meant to do: traveling, not waiting. This cuts down on the idle time for truck, the driver and the freight. The productivity of trucks is also a function of the pickup and delivery strategy used for the trucks. The objective of
Endnote
The general case for truck driver monitoring in the trucking industry has already been made through research sponsored by the Federal Motor Carrier Safety Administration (FMCSA) and is best summarized in a technical brief [3]. In its most sim-plistic form, the behavior-based safety approach is a method for improving safety, by which, behaviors critical to safety are identified and monitored. Safe behavior is rewarded and unsafe behavior is discouraged and improved upon, thereby proac-tively improving overall safety.
While strict driver training programs, vehicle safety inspec-tions, and the constant monitoring of crash statistics have all been means for monitoring safety in the past, the advent of cheap sensing technologies has made possible the continuous monitoring speed, headway, and other driving parameters. This new technology provides the fundamentals to enable a true behavior-based safety approach. Implementing an onboard driver-monitoring behavior-based safety approach requires four steps:
1. Identify behaviors which may be precursors to increased crash rates.
2. Determine cost-effective ways to monitor safe and unsafe behaviors.
3. Determine the best way to provide the driver with feedback which rewards safe behavior and discourages unsafe behavior.
4. Establish management and driver acceptance to the program.
In the road ahead, we look forward to prototyping, testing and with the future potential FOT, implementing and evaluating, OBMS.
References
1 Federal Motor Carrier Safety Administration. (2006). Report to Congress on the Large Truck Crash Causation Study. Washington, D.C.: The Federal Motor Carrier Safety Administration’s Office of Research and Technology. [Available Online at http://www.fmcsa.dot.gov/facts-research/research-technology/report/ltccs-2006.htm].
2 Rimini-Doering, Maria, Altmueller, Tobias, Ladstaetter, Ulrich, Rossmeier, Markus (2005), Effects Of Lane Departure Warning On Drowsy Driversí Performance And State In A Simulator, PROCEEDINGS of the Third International Driving Symposium on Human Factors in Driver Assessment, Training and Vehicle Design.
3 Behavioral Science and Technology, Inc. (2000). The Potential Application of Behavior-Based Safety in the Trucking Industry (Publication No. FMCSA-MCRT-00-009). Washington DC: Federal Motor Carrier Safety Administration.
continued from page 13 continued from page 5
14

Intellimotionvol. 12 no. 2 2006
our study was to minimize the total cost, which may include the fixed vehicle cost and the travel cost, while satisfying all customer demand.
In this project, we consider a stochastic multi-vehicle pick-up and delivery problem with random demand (request arrival, load, loading time, unloading time, pickup location, delivery location and delivery due date) with a focus on productivity comparison between the conventional mode of transportation and a new mode of freight transportation using Short Trailer Combination Vehicles (STCVs).
Two transportation strategies are evaluated: the conven-tional point-to-point strategy and a hub-and-spoke strategy for the empty trailers. In the conventional point-to-point strategy, a truck, with its tractor and semi-trailer always traveling together as one unit, always travel directly from one city to another. The empty-trailer hub-and-spoke strat-egy is characterized as follows:
• A small number of cities are selected as trailer hubs or, simply, hubs. Each trailer hub serves several cities, and each city is served by only one trailer hub.
• An empty trailer is always hauled to, stored, and dispatched from the hub serving the city where the empty trailer is located.
• Each truck is dedicated to serving one and only one of the two functions: (a) hauling loaded trailers from the pick-up location directly to the delivery location (without regard to the empty-trailer hubs) and (b) hauling empty trailers (after being unloaded) from the delivery location to the serving empty-trailer hub and hauling empty trailers from an empty-trailer hub to a pick-up location within the serving area for loading.
Computer simulation models have been developed to rep-resent and analyze the operating concepts and the logistics for the STCV mode versus the conventional mode. The objective of the simulation was to determine the number of trucks and trailers, the pickup and delivery dispatch rule, and the type of transportation strategy that optimize various performance measures, in particular the cycle time (time in system), throughput, and tardiness of a demand order, for both the STCV mode and the conventional mode
of operation. These two operational modes are evaluated and different input parameters of the individual strategies are varied to study their impact on the productivity of the system. ProModel is the simulation software used for this study. A quantitative evaluation of the expected gain in logistics efficiency is performed from the simulation output results. Both operational modes assume the same amounts of resources, e.g., truck weight capacity. However, the weight capacity for the STCV mode is distributed across a larger number of trailers. In the conventional mode of operation, the simulation assumes one large trailer for each truck whereas the STCV model assumes that a truck can pull three smaller trailers of total equal weight as what it can in the conventional model. Furthermore, the STCV simulation model allows the decoupling of the small trail-ers from the tractor for loading and unloading operations. Therefore, the tractor is freed to travel to other pickup and/or delivery locations during the loading and unloading operation for the trailer.
To make the study more realistic, we conducted a numerical analysis and comparison for the state of California. Twenty cities in California are selected as demand origins and des-tinations in this study. A network of roads is assumed for routing a truck between the pickup/delivery locations.
The productivity gains of the STCV mode of operation ver-sus the conventional mode of operation is a function of the system capacity and demand pattern. These are scenarios where system truck capacity is limited, and hence freeing the trucks from the loading and unloading tasks will have a significant productivity gain. However, in scenarios where truck capacities are sufficient to meet the demand pattern, the conventional mode may outperform the SCTV mode of operation since the extra travel time from the hub to the pickup location and the random waiting time for two differ-ent types of trucks can offset the productivity gained from freeing the truck from the loading and unloading task.
The findings on STCV operations have been summarized in “A Simulation Study of the Productivity of Large Trucks with Shorter Trailers and Empty-Trailer Hubs,” which has been accepted by the International Journal of Industrial and Systems Engineering for publication in 2007.�
Left - double trailer Right - short version Rocky Mountain Double
15
University of California
California PATH PublicationsRichmond Field Station, Bldg. 452Berkeley, CA 94720-3580
Address Service Requested
1-15857-23929-44
Get on the Mailing List!FAX, mail or e-mail us the following information for a free subscription to Intellimotion:Name & TitleAddressE-mail address
If you wish to be notified by email when the next issue is ready online, and not receive a paper copy, please let us know.
Please mention the Intellimotion mailing list. See this page for our address and fax number.
Due to mailing costs we can no longer send paper copies inter-nationally. Please send us your email and we will notify you when the next issue is ready online.
Intellimotion is a quarterly newsletter edited and designed by the California PATH Publications Department.
Publications Manager Bill Stone Multimedia Specialist Jay Sullivan
For more information or to offer comments about this newsletter, please write, call, fax or e-mail:
PATH Publications1357 South 46th Street, Bldg. 452
Richmond, CA 94804-4648Tel: 510/665-3406 FAX: 510/665-3537e-mail: [email protected]
http://www.path.berkeley.edu
Photos by Bill Stone, Gerald Stone, Steve Shladover, authors, istockphotos, and http://www.hankstruckpictures.com. Figures by author and Frederick Browand.
Partners for Advanced Transit and Highways
Director Alexander SkabardonisCaltrans Management Liaison Homar Noroozi
Primary funding provided by:
©2006 UC Regents. All rights reserved. Unless permission is granted, this material shall not be reproduced, stored in a retrieval system, or transmitted in any form or by any means, electronic, mechanical, photocopying, recording or otherwise.
ISSN-1061-4311
Printed on recycled paper
Member Intelligent Transportation
Society of California (ITS-CA)
NON-PROFIT ORGANIZATIONU.S. POSTAGE PAID
UNIVERSITY OF CALIFORNIA