onboarding 2011: the path to productivity - talentwise
TRANSCRIPT

09
Onboarding 2011 The Path to Productivity
March 2011
Mollie Lombardi

Onboarding 2011: The Path to Productivity Page 2
© 2011 Aberdeen Group. Telephone: 617 854 5200
Executive Summary Research Benchmark
Aberdeen’s Research Benchmarks provide an in-depth and comprehensive look into process, procedure, methodologies, and technologies with best practice identification and actionable recommendations
Given the emphasis on growth and recovery in late 2010, and into 2011, this benchmark study looks at how organizations are using the tools and processes of onboarding to manage costs, improve workflows, and set the stage for individual, group and organizational performance with new hires. This study explores the technologies and practices put in place by Best-in-Class organizations to help achieve organizational goals while improving time-to-performance and productivity. It addresses best practices for accelerating the integration of new full time employees, individuals brought on board through merger or acquisition, and how organizations are extending the concepts and tools of onboarding to contingent labor, contractors and other workers. Conducted during January and February 2011, this report is based on analysis of 282 organizations and their onboarding practices.
Best-in-Class Performance Aberdeen used the following three key performance criteria to distinguish Best-in-Class companies:
• 96% of first-year employees were retained, as compared to 18% of employees at Laggard organizations
• 82% of employees hired in the last 12 months met first performance milestones on time, as compared to 3% at Laggard organizations
• 18% year-over-year improvement in hiring manager satisfaction, as compared to a 1% decrease among Laggards
Competitive Maturity Assessment Survey results show that the firms enjoying Best-in-Class performance shared several common characteristics, including:
• The involvement of wide group of stakeholders, from the individual up through company leadership, taking ownership for their role in ensuring the productivity of new hires
• A standard, efficient onboarding process that addressees both the tactical and strategic elements of onboarding, that also sets the stage for further efficiency gains through automation
Required Actions In addition to the specific recommendations in Chapter Three of this report, to achieve Best-in-Class performance, companies must:
• Centralize and standardize the onboarding process • Automate to drive efficiency • Extend onboarding beyond full-time hires to contingent and
contract workers
www.aberdeen.com Fax: 617 723 7897 This document is the result of primary research performed by Aberdeen Group. Aberdeen Group's methodologies provide for objective fact-based research and represent the best analysis available at the time of publication. Unless otherwise noted, the entire contents of this publication are copyrighted by Aberdeen Group, Inc. and may not be reproduced, distributed, archived, or transmitted in any form or by any means without prior written consent by Aberdeen Group, Inc.
Onboarding 2011: The Path to Productivity Page 3
© 2011 Aberdeen Group. Telephone: 617 854 5200 www.aberdeen.com Fax: 617 723 7897
Table of Contents Executive Summary....................................................................................................... 2
Best-in-Class Performance..................................................................................... 2 Competitive Maturity Assessment....................................................................... 2 Required Actions...................................................................................................... 2
Chapter One: Benchmarking the Best-in-Class.................................................... 5 Business Context ..................................................................................................... 5 The Maturity Class Framework............................................................................ 7 The Best-in-Class PACE Model ............................................................................ 8 Best-in-Class Strategies........................................................................................... 9
Chapter Two: Benchmarking Requirements for Success.................................15 Competitive Assessment......................................................................................16 Capabilities and Enablers ......................................................................................17
Chapter Three: Required Actions .........................................................................24 For All Organizations ............................................................................................24 Laggard Steps to Success......................................................................................24 Industry Average Steps to Success ....................................................................25 Best-in-Class Steps to Success ............................................................................25
Appendix A: Research Methodology.....................................................................27 Appendix B: Related Aberdeen Research............................................................29
Figures Figure 1: Elements Most Frequently Included in Onboarding ............................ 5 Figure 2: Pressures........................................................................................................ 6 Figure 3: Impact of Standardized Onboarding........................................................ 7 Figure 4: Impact of Standardized Onboarding........................................................ 9 Figure 5: Achievement of Organizational Goals and Engagement ...................10 Figure 6: Year-over-Year Improvement in Customer Metrics.........................11 Figure 7: Onboarding of Contingent and Contract Labor ................................12 Figure 8: Leadership Involvement in Onboarding................................................13 Figure 9: Accountability for Onboarding Success................................................19 Figure 10: Automation of Onboarding...................................................................20 Figure 11: Barriers to Automation..........................................................................21 Figure 12: Performance Gains from Automation of Forms and Benefits Enrollment.....................................................................................................................21
Tables Table 1: Top Performers Earn Best-in-Class Status.............................................. 7 Table 2: The Best-in-Class PACE Framework ....................................................... 8 Table 3: The Competitive Framework...................................................................16 Table 4: The PACE Framework Key ......................................................................28

Onboarding 2011: The Path to Productivity Page 4
© 2011 Aberdeen Group. Telephone: 617 854 5200 www.aberdeen.com Fax: 617 723 7897
Table 5: The Competitive Framework Key ..........................................................28 Table 6: The Relationship Between PACE and the Competitive Framework.........................................................................................................................................28

Onboarding 2011: The Path to Productivity Page 5
© 2011 Aberdeen Group. Telephone: 617 854 5200
Chapter One: Benchmarking the Best-in-Class
Business Context Fast Facts
Organizations with a standard onboarding process experienced:
√ 54% greater new hire productivity
√ 50% greater new hire retention
√ Two-times the level of new hire engagement
When you step back and think about it, most people's lives are a continual parade of "onboarding" experiences, whether it's starting at a new school or job, entering into a new romantic relationship, or moving into a new apartment building. It's both a formal (here's the office, there's where you put the trash) and informal (Ms. Johnson always has a spare kickball at recess). But the intent is about getting you familiar, providing you with tools and information, and welcoming you while also making it clear that there are certain norms and expectations to which you will be required to adhere to and perform. In a professional context, Aberdeen has defined onboarding as "the strategic process designed to integrate and acclimate new employees into the organization and prepare them to contribute to a desired level as quickly as possible." The tricky part is that when it comes to business, it's not enough to just give an orientation and hope new hires can keep up. It's imperative that substantive contribution start as soon as possible.
In Aberdeen's 2009 and 2010 onboarding research, much of the focus was on engagement, making sure that individuals are aligned with the social fabric of the organization and that their decision to join the company is affirmed in the first days and weeks. Engagement and socialization are critical to this onboarding process, but the research also shows that alone they are not sufficient to drive productivity. The path to productivity must also include the necessary transactional steps to enroll new employees into the various systems and programs they are a part of, from payroll and benefits to IDs and parking, as illustrated by Figure 1.
Figure 1: Elements Most Frequently Included in Onboarding
71%72%73%85%87%92%
0%
25%
50%
75%
100%
Newemployee
forms
Benefitsenrollment
Orientationto companyinformation
Employmenteligibility
verification(I-9)
Socialization Provisioning(equipment
andsystemsaccees)
perc
enta
ge o
f res
pond
ents
, n=2
82
All Respondents
Source: Aberdeen Group, February 2011
www.aberdeen.com Fax: 617 723 7897

Onboarding 2011: The Path to Productivity Page 6
© 2011 Aberdeen Group. Telephone: 617 854 5200
There are many elements that go into a successful onboarding process, and the importance of each will vary depending on the organization and its specific culture, processes and goals. But an organization's ability to orchestrate both the more tactical elements such as forms and provisioning as well as the more strategic socialization into a cohesive, efficient and engaging process is critical to driving productivity and performance.
Why Onboarding? Clearly people have been starting jobs and joining organizations for centuries before the term onboarding was coined for it, and something must have been working because there have been successful individuals and business throughout history. So why is it so important to focus on onboarding now as a distinct process? In short it is because companies can ill afford to waste any time or talent in today's marketplace. Figure 2 shows the top pressures forcing organizations to focus on onboarding, and they are all about moving faster, as well as tapping into and retaining key talent needed to move the business forward.
Figure 2: Pressures
46%46%50%
0%
25%
50%
Pressure to meet thecompany’s growth
objectives
Shortages of requiredskills available in the
labor pool
Increasing competitionin the marketplace for
top talent
perc
enta
ge o
f res
pond
ents
, n=2
82
All Respondents
Source: Aberdeen Group, February 2011
Companies are looking to grow, and they need the talent to support those growth goals. And that critical talent is in increasingly short supply so being seen as an attractive place to work that ensures that employee experience is positive from day one and holding on to new hires is critical. Aberdeen's research has shown that the presence of a standard and formalized onboarding process is having a big impact on these issues and more. Among organizations that have an onboarding process in place, 82% describe that process as standardized - a single process that is consistent for all hires, but that may also be tweaked by location or business unit to address unique needs. And as Figure 3 demonstrates, the impact of standardization can be huge, including 50% greater new hire retention and over twice the level of new hire engagement.
www.aberdeen.com Fax: 617 723 7897

Onboarding 2011: The Path to Productivity Page 7
© 2011 Aberdeen Group. Telephone: 617 854 5200
Figure 3: Impact of Standardized Onboarding
35%36%37%44%
57%
24%
17%24%
39%38%
0%
20%
40%
60%
New hireretention
Organizationalgoals met
New hireperformance
goals met
New hireengagement
Internal fill rateperc
enta
ge o
f res
pond
ents
, n=2
82
Standardized
Not Standard
Source: Aberdeen Group, February 2011
Onboarding is having a real impact on how organizations are able to achieve their goals. In the following pages we will explore how they're going about this, as well as how onboarding practices differ among various organizational models.
The Maturity Class Framework Aberdeen used three key performance criteria to distinguish the Best-in-Class from Industry Average and Laggard organizations:
• First year retention - measured as the percentage of hires that stay with the organization through the first year
• Time to performance - measured as the percentage of new employees that meet their first performance milestone on time
• Hiring manager satisfaction - measured as the year-over-year change in hiring manager satisfaction with the employees that have come into the firm
Table 1: Top Performers Earn Best-in-Class Status
Definition of Maturity Class Mean Class Performance
Best-in-Class: Top 20%
of aggregate performance scorers
96% of first-year employees were retained 82% of employees hired in the last 12 months met first performance milestones on time 18% year-over-year improvement in hiring manager satisfaction
www.aberdeen.com Fax: 617 723 7897

Onboarding 2011: The Path to Productivity Page 8
© 2011 Aberdeen Group. Telephone: 617 854 5200 www.aberdeen.com Fax: 617 723 7897
Definition of Maturity Class Mean Class Performance
Industry Average: Middle 50% of aggregate
performance scorers
61% of first-year employees were retained 39% of employees hired in the last 12 months met first performance milestones on time 3% year-over-year improvement in hiring manager satisfaction
Laggard: Bottom 30% of aggregate
performance scorers
27% of first-year employees were retained 17% of employees hired in the last 12 months met first performance milestones on time 1% year-over-year decrease in hiring manager satisfaction
Source: Aberdeen Group, February 2011
The Best-in-Class PACE Model Using onboarding to achieve corporate goals requires a combination of strategic actions, organizational capabilities, and enabling technologies that can be summarized as follows:
• Stakeholders, from the individual up through company leadership, must be involved and accountable for the onboarding process from the time of offer through the first several months of employment
• A standard, efficient onboarding process that ensures that the tactical aspects of the new hire process are executed effectively is critical to success
• Automation is a critical element of onboarding to ensure efficiency and accuracy as well as free up resources to focus on engaging and socializing new employees
Table 2: The Best-in-Class PACE Framework
Pressures Actions Capabilities Enablers Pressure to meet the company’s growth objectives
Assign metrics to quantitatively measure the effectiveness of onboarding and its impact on the organization Better involve hiring managers and other line of business stakeholders in the onboarding process
Clear accountability given to all stakeholders involved in ensuring that the employee is set up and ready to go on day one Clear accountability given to all stakeholders involved in onboarding the new employee within the first 90 days Localization of onboarding practices / forms / technologies Onboarding is centralized - one dedicated resource has oversight and decision authority over the organiz-ation's entire onboarding process
Automated benefits enrollment Tools to enroll new hires into learning and development programs Assessments to determine appropriate career / development track for new employees Automated new employee forms (e.g., W2, non-compete, direct deposit, medical / dental) Automated provisioning tools to manage the process for granting system and facility access Automated workflow / tasks management
Source: Aberdeen Group, February 2011

Onboarding 2011: The Path to Productivity Page 9
© 2011 Aberdeen Group. Telephone: 617 854 5200
Best-in-Class Strategies The case can clearly be made for the "why" of onboarding, but when looking at the "what" it's really a story of two ends of a spectrum. Best-in-Class performers are far more mature in their onboarding processes - 51% indicate their formal onboarding programs have been in place for three or more years, as compared to 32% of Industry Average and 30% of Laggards. These varying levels of maturity are reflected in the top actions that these groups plan to undertake regarding their onboarding efforts in the coming year. While Best-in-Class companies are focused on measurement, stakeholder involvement and data integration, all other organizations (the combined group of Industry Average and Laggards) are still placing priority on formalizing and standardizing their process (Figure 4).
Figure 4: Impact of Standardized Onboarding
56%52%
33%
19%15%
35%32%
19%
43%39%
0%
20%
40%
60%
Assign metrics Involvebusiness
stakeholders
New employeeinfo useable inother systems
Formalizeonboarding
Standardizeonboarding
perc
enta
ge o
f res
pond
ents
, n=2
82
Best-in-Class
All Others
Source: Aberdeen Group, February 2011
While 82% of all organizations indicate they have a standard onboarding process in place, Best-in-Class companies are 5% more likely than Industry Average companies to do so (93% vs. 89%) and 45% more likely than Laggards (93% vs. 45%). As reflected in the recommendations in Chapter Three of this report, formalizing and standardizing the onboarding process is a critical first step. However, standardization does not always mean that every element of the onboarding process is identical for every new hire. Among the 93% of Best-in-Class companies that do have a standard onboarding process, two thirds (66%) describe their standard onboarding as one process that can be tweaked by location or business unit to address unique needs. So while standardization is critical, awareness of the unique needs of specific roles, geographies or functions are also being incorporated in a consistent way.
www.aberdeen.com Fax: 617 723 7897

Onboarding 2011: The Path to Productivity Page 10
© 2011 Aberdeen Group. Telephone: 617 854 5200
The Goals of Onboarding Despite these differences in how they are going about it, depending on their maturity, the goals organizations are trying to achieve through their onboarding efforts are all quite similar. And that primary goal is about helping people assimilate into the fabric of the organization in ways that allow them to be productive as quickly as possible. Among all organizations, the top three most important objectives for onboarding were:
• Better assimilation of new hires into company culture (cited by 66% of respondents)
• Getting new employees productive more quickly (62%)
• Improve employee engagement (54%)
And as Figure 5 and Figure 6 show, Best-in-Class organizations are seeing a huge payoff for going after these goals.
Figure 5: Achievement of Organizational Goals and Engagement
30%
18%
62%
75%
35%
48%
0%
25%
50%
75%
Percent of Organizational GoalsAchieved
Percent of New Hires Highly Engaged
perc
enta
ge o
f res
pond
ents
, n=2
82
Best-in-Class
Industry Average
Laggard
Source: Aberdeen Group, February 2011
www.aberdeen.com Fax: 617 723 7897

Onboarding 2011: The Path to Productivity Page 11
© 2011 Aberdeen Group. Telephone: 617 854 5200
Figure 6: Year-over-Year Improvement in Customer Metrics
2%
10%
12%
3%
5%
2%
0%
5%
10%
15%
Improvement in Customer Satisfaction Improvement in Customer Retention
perc
enta
ge o
f res
pond
ents
, n=2
82
Best-in-Class
Industry Average
Laggard
Source: Aberdeen Group, February 2011
An important thing to remember about onboarding is that it is about a smooth transition for the individual as well as for the organization, group and team they are joining. A strong onboarding process makes it less stressful for the new employee and their manager, and minimizes the disruption caused to the rest of the organization - and its customers. An effective onboarding process ensures that forms are completed, equipment and access codes are in place, and critical benefits questions are answered. This allows hiring managers, coworkers and the individual themselves to more quickly and readily get to the business of specific role training and orientation, and enables that new person to become a fully contributing member of the team more quickly.
Measuring Onboarding's Impact Effectively measuring and communicating the impact of onboarding within the organization can be difficult. And the measures that are most important to one organization may not be the right ones for another. But in order to get the ongoing involvement of the required stakeholders, it is important to show demonstrable results. When it comes to the more tactical elements, measurement can be somewhat more straightforward. By measuring the number of incomplete or incorrectly filled out forms pre- and post-implementation of an onboarding process is one measure. Or if the organization is moving to an automated system to move some of these activities out prior to day one on the job, measuring how often those timelines are met is another. Knowing how many new hires are missing ID badges or phones or email log-ons are all ways to measure the impact of a more cohesive onboarding process.
Aberdeen's Quarterly Business Review from Q4 2010 found that the number one and two goals for companies in 2011 are organic growth and profitability. Things like automation of forms can contribute huge cost savings to the bottom line, and free up new hires to get to work faster and contribute to the top line. The critical thing to remember is to decide what it is you want to impact and monitor it before and after a new onboarding
www.aberdeen.com Fax: 617 723 7897

Onboarding 2011: The Path to Productivity Page 12
© 2011 Aberdeen Group. Telephone: 617 854 5200
process or element is added. For organizations just starting down this path, compliance and tracking the completion of onboarding tasks may be sufficient. Where things start to get more complicated is when it comes to measurement of the more strategic elements of onboarding like socialization and culturalization.
As mentioned above, the top goals for organizations when it comes to their onboarding programs are integration of new hires into the culture, productivity and engagement. And new hire retention comes just after those. When measuring the impact of onboarding elements that have to do with orienting individuals with company culture, training them on the specifics of their role or division, and helping them understand the unwritten rules that are the underpinning of any organizational culture, a direct measure is difficult. It is hard to quantify how "socialized" or "mentored" someone is. But by keeping a close eye on the metrics associated with those goals - productivity, engagement and retention - important correlations can be drawn. In order to do so, however, a baseline for these metrics must be established prior to the introduction or enhancement of an onboarding initiative. This can be difficult if an organization does not already have the ability to track these metrics. But, if an organization wants to really understand the impact onboarding is having on these important goals it has set for itself, focus on these metrics before and after implementation or changes is 100% necessary.
Expanding the Onboarding Footprint In comparing the data from Aberdeen's 2010 onboarding research with the 2011 findings, overall we see that more employee populations are going through a formal onboarding process, but one area where there has been exponential growth is in the area of contingent and contract labor (Figure 7).
Figure 7: Onboarding of Contingent and Contract Labor
39%43%
17%
23%
0%
25%
50%
Contract Labor Contingent Labor
perc
enta
ge o
f res
pond
ents
, n=2
82
2011Best-in-Class
2010 Best-in-Class
Source: Aberdeen Group, February 2011
For this research, Aberdeen defined contract labor as professional, long-term staff working under a Statement of Work (SOW) contract, and contingent labor as temporary staff in jobs structured to be short-term or
www.aberdeen.com Fax: 617 723 7897

Onboarding 2011: The Path to Productivity Page 13
© 2011 Aberdeen Group. Telephone: 617 854 5200
part-time / seasonal. Contingent labor is an important and growing part of the labor force. Aberdeen's June 2010 study on Contingent Labor Management found that 20% of the average workforce is contingent or contract labor, up from 17% in 2009, with this upward trend expected to continue. With at least a fifth of the future labor force expected to fall into this category, organizations must think about how to adapt their talent management practices, including onboarding, to this distinct group of workers. And companies that do onboard their contingent labor force saw a 16% greater success rate in achieving annual organizational goals (51% vs. 44%). The 2010 contingent labor study indicated that, "The majority of companies consider their contingent workforce as a value-add strategy that supports their overall corporate objectives." Clearly, the effective onboarding of this critical group is helping organizations achieve that goal more effectively. Among organizations that do have a formal onboarding process for contingent labor, the three most common elements are:
• Socialization - introductions to the go-to people within the company, co-workers, etc.
• An orientation to company information • Provisioning - the steps required to manage system and facility
access required for the new employee to do his / her job To reap the full benefits of its contingent workforce, bringing them into the fabric of the organization and making their presence seamless is a critical part of onboarding.
Aberdeen Insights — Strategy
One of the most prevalent onboarding strategies cited by Best-in-Class organizations is to better involve hiring managers and other line of business stakeholders in the onboarding process. And indeed, these top performing companies are outpacing the rest in terms of this involvement (Figure 8).
Figure 8: Leadership Involvement in Onboarding
69%
29%23%
41%
52%
83%
29%35%
74%
0%
25%
50%
75%
100%
Hiring manager Senior-rankingorganizational executive
Buddy / mentor
perc
enta
ge o
f res
pond
ents
, n=2
82
Best-in-Class
Industry Average
Laggard
Source: Aberdeen Group, February 2011
continued
www.aberdeen.com Fax: 617 723 7897

Onboarding 2011: The Path to Productivity Page 14
© 2011 Aberdeen Group. Telephone: 617 854 5200
Aberdeen Insights — Strategy
This involvement can take many forms, from formal to informal. It may be as simple as a personalized welcome note from a divisional leader, or a short presentation from a senior executive during an onboarding session for a large group.
www.aberdeen.com Fax: 617 723 7897
Overhead Door, headquartered in Lewisville, TX, was founded 90 years ago by the inventor of the electric garage door opener. It now operates in over 100 locations, including 26 manufacturing facilities. Over the past several years the company has been on the path to standardize and formalize an onboarding process for their complex environment. "We had an obvious need," said Heather Gradke, Manager, Recruiting at Overhead Door. "We did not have a focused approach to onboarding and our new employees were many times left to figure it out on their own." As a new process has helped them overcome these tactical challenges, they are also working on practical, easy to execute ideas to address the more strategic aspects.
The corporate headquarters has been a proving ground during this journey for best practices to be shared with the other facilities. One of these has received tremendous positive feedback - the CEO luncheon. Every six months they host a lunch for everyone hired since the previous event, along with their manager. The CEO hosts, but it is an informal session where he shares his personal journey and his pride in the organization. Then, each manager, who has been prepared in advance, shares with the group an accomplishment made by the new employee since joining the organization. Not only does it give the individual line of site into who the organizational leader is and a provide a chance for them to learn more about the company and it's CEO, it also provides the CEO with visibility into his team and highlights the real contribution made by people who have just recently joined the company.
Even something this simple, which can be replicated with site leadership throughout the company, can have a big impact on the onboarding experience. Not only does it help engage new employees, but puts a real emphasis on recognizing the productivity and tangible contribution new employees can make.
"We had an obvious need. We did not have a focused approach to onboarding and our new employees were many times left to figure it out on their own."
~ Heather Gradke, Manager, Recruiting, Overhead Door
In the next chapter, we will see what the top performers are doing to achieve these gains.

Onboarding 2011: The Path to Productivity Page 15
© 2011 Aberdeen Group. Telephone: 617 854 5200
Chapter Two: Benchmarking Requirements for Success
The successful implementation of an onboarding process, as well as an onboarding technology solution to support it, can impact many tactical as well as strategic elements of the new hire experience. As the case study below illustrates, the power of an onboarding technology solution can open up doors far beyond just more efficient forms of management.
Case Study — Embry-Riddle Aeronautical University
Embry-Riddle Aeronautical University was founded in Cincinnati, Ohio, on December 17, 1925; just 22 years after the Wright Brothers first took flight from Kitty Hawk, North Carolina. It is the oldest and largest university specializing in aviation and aerospace and is the only accredited, aviation-oriented university in the world. Embry-Riddle has two primary campuses, located in Daytona Beach, Florida, and Prescott, Arizona. They also have a “third campus” – their Worldwide Campus which operates at more than 150 locations in the United States, Europe, Asia, Canada, and the Middle East. Given the complex nature of managing approximately 5000 employees on two main campuses as well as multiple smaller sites with full and part time workers in three main categories – staff, faculty, and instructor pilots – the challenges of creating efficient and effective onboarding practices are many.
Approximately four years ago, Embry-Riddle knew it had a problem when hiring managers were continually complaining that new hires were showing up for their first day with no system access. It would take a week or more until they were even able to log into the university systems that are core to managing day to day activities. “Our hiring managers were understandably frustrated,” said Kenny Corbin, Director, Recruitment and Compensation. “When I was asked to manage the recruitment function I knew this was an issue that had to be resolved.” So Embry-Riddle went in search of a solution that would automate forms management and let them get people set up in their systems prior to their first day on the job. But as they explored the solutions landscape their eyes were opened to many more opportunities for onboarding automation beyond just forms.
One of the first things they saw was that in addition to receiving W2s, employee data sheets, I9 forms completed in the system, they could start to involve new hires into the fabric of the culture of the organization before they even arrived on campus. “We have a rich history, so opening up our new employees eyes to who we are as an organization served to build their excitement and engagement leading up to day one,” said Corbin.
continued
Fast Facts
√ 61% of Best-in-Class organizations centralize the management of the onboarding process, compared to 30% of all others
√ Companies that automate new hire forms and benefits enrollment indicate 18% greater achievement of first performance goals and 16% greater new hire retention
www.aberdeen.com Fax: 617 723 7897

Onboarding 2011: The Path to Productivity Page 16
© 2011 Aberdeen Group. Telephone: 617 854 5200
Case Study — Embry-Riddle Aeronautical University
Embry-Riddle also implemented “Eagle Eye”, a tool that educates new and existing employees on their benefits, including what their options are, what those options mean, and what is covered under their plans. As a result of these efforts, now 100% of new hires are in the system and have the passwords, log-ons and equipment needed to start work on their first day. And the Eagle Eye portal has also helped reduce calls into HR for general benefits related questions.
Onboarding is still evolving at Embry-Riddle, with plans to add on geographic and job-role specific elements to the existing standard onboarding process, and continued refinement of Eagle Eye to make it more searchable and user friendly. “We started this journey with a vision of simply automating our forms, but we soon saw we could do so much more,” said Corbin. “Employees arrive knowing more about who we are, more about what we can offer them, and we can start them on specialized training on day one to build on that excitement and help them contribute to the organization more efficiently.”
Competitive Assessment Aberdeen Group analyzed the aggregated metrics of surveyed companies to determine whether their performance ranked as Best-in-Class, Industry Average, or Laggard. In addition to having common performance levels, each class also shared characteristics in five key categories: (1) process (the approaches they take to execute daily operations); (2) organization (corporate focus and collaboration among stakeholders); (3) knowledge management (contextualizing data and exposing it to key stakeholders); (4) technology (the selection of the appropriate tools and the effective deployment of those tools); and (5) performance management (the ability of the organization to measure its results to improve its business). These characteristics (identified in Table 3) serve as a guideline for best practices, and correlate directly with Best-in-Class performance across the key metrics.
Table 3: The Competitive Framework
Best-in-Class Average Laggards Process to ensure clear accountability given to all stakeholders involved in ensuring that the employee is set up and ready to go on day one Process
77% 56% 53%
Onboarding is centralized - one dedicated resource has oversight and decision authority over the organization's entire onboarding process Organization
61% 32% 30%
"We started this journey with a vision of simply automating our forms, but we soon saw we could do so much more. Employees arrive knowing more about who we are, more about what we can offer them, and we can start them on specialized training on day one to build on that excitement and helping them contribute to the organization more quickly."
~ Kenny Corbin, Director, Recruitment and
Compensation, Embry-Riddle Aeronautical University
www.aberdeen.com Fax: 617 723 7897

Onboarding 2011: The Path to Productivity Page 17
© 2011 Aberdeen Group. Telephone: 617 854 5200 www.aberdeen.com Fax: 617 723 7897
Best-in-Class Average Laggards Localization of onboarding practices / forms / technologies
54% 51% 37%
Key stakeholders have visibility into development progress of new employees through the onboarding process
Knowledge
41% 36% 32%
Onboarding technology currently in use:
Technology
60% Automated benefits enrollment 57% Assessments to determine appropriate career / development track 54% Automated new employee forms 46% Automated provisioning tools 43% Automated workflow / tasks management
56% Automated benefits enrollment 40% Assessments to determine appropriate career / development track 27% Automated new employee forms 25% Automated provisioning tools 23% Automated workflow / tasks management
43% Automated benefits enrollment 14% Assessments to determine appropriate career / development track 26% Automated new employee forms 32% Automated provisioning tools 32% Automated workflow / tasks management
Metrics to measure effectiveness of onboarding have been agreed to by all relevant stakeholders Performance
44% 24% 14%
Source: Aberdeen Group, February 2011
Capabilities and Enablers Achieving success with onboarding, whether for newly hired permanent employees or contingent labor, comes down to a few fundamental building blocks. Those organizations achieving Best-in-Class results are doing so based on the ability to establish a cohesive, centralized, formalized onboarding process that touches as many categories of new hires as possible; the support and involvement of multiple stakeholders in the onboarding process; and the ability to leverage tools and automation to manage the overall process as well as some of the critical steps of onboarding.
Process The process capabilities most closely aligned with Best-in-Class performance are really about having a process. The most common capability among Best-

Onboarding 2011: The Path to Productivity Page 18
© 2011 Aberdeen Group. Telephone: 617 854 5200
"Our onboarding program has allowed us to move some of the tactical and administrative process, prior to the new employee start date, so we can focus their first day as a real welcoming of new hires into the organization and their role."
~ Michelle Rife, Senior Manager, Staffing Americas,
EMEA and APAC, Imperva, Inc
in-Class performers is to establish clear accountability to all the parties that must be involved to ensure that a new hire has everything they need when they show up on the first day. This can involve IT, security, HR, hiring managers, team members and more. Depending on the organizations size, these roles may be executed by a single person or smaller team, but no matter how large the organization and how many departments are involved, the critical thing is to ensure that there is a process detailing what needs to be done, and clear accountability for who is responsible for making it happen. And Best-in-Class companies are 40% more likely than all others to have this in place for the activities leading up to day one (77% vs. 53%).
Top performing companies also extend this accountability beyond the first day, with 65% indicating that they have a clear plan and accountability for the roles of key stakeholders through the first 90 days, as compared to 41% of all others. And again, company size may influence who these stakeholders are. HR and the hiring manager are the most likely players in any onboarding process, but in companies with over 100 employees 35% assign an onboarding buddy or mentor - nearly twice the rate among sub-100 employee firms (18%). But smaller companies are more likely to involve senior executives in the onboarding. Over half of organizations with fewer than 500 employees indicate senior executives play a role in onboarding (53%), compared to about a quarter (26%) of larger companies. These differences also highlight how companies are overcoming the challenges inherent in their various organizational constructs. While senior leadership involvement is correlated to top performance as shown in Chapter One, in larger organizations the buddy may be helping to make important connections to senior leadership. While it may look slightly different in different organizations, the important thing is to have a process that outlines who is responsible for all of the tactical and strategic aspects of onboarding.
Organization Best-in-Class organizations are twice as likely to centralize the management of the onboarding process (61% vs. 30%), with one dedicated resource with authority over the organization's entire onboarding process. An additional 21% of the Best-in-Class indicate that that the process is centralized but with regional oversight - described as one dedicated corporate resource that works with a team of onboarding managers in each business unit, function, or locale. Clearly, a centralized approach is driving results, but the degree of centralization also varies based on company size. Sixty-five percent (65%) of companies with over 500 employees have fully centralized onboarding, compared to 55% of sub-500 employee organizations, and 44% of sub-100 employee organizations. This would seem to indicate that the larger the organization, the more important it becomes to have a centralized approach that ensures a consistent onboarding experience.
It's also important to note who else is involved in executing that centralized vision - because of course, a unified approach does not mean a single person performs all of the onboarding activities.
www.aberdeen.com Fax: 617 723 7897

Onboarding 2011: The Path to Productivity Page 19
© 2011 Aberdeen Group. Telephone: 617 854 5200
Figure 9: Accountability for Onboarding Success
3.59
3.87
4.084.20
4.34
3.50
3.75
4.00
4.25
4.50
Senior-levelHR leadership
Hiringmanagers
Recruiting /Staffingfunction
Organizationaldevelopment
function
Regional orbusiness unit
leaders
perc
enta
ge o
f res
pond
ents
, n=2
82
Best-in-Class
Source: Aberdeen Group, Onboarding 2010, February 2010
In Aberdeen's 2010 onboarding study, Best-in-Class organizations indicated that senior HR leaders had the primary accountability for onboarding success (Figure 9). Establishing a single source to oversee the process, and ensuring that all other stakeholders are held accountable for their roles, is a critical element to onboarding success.
Knowledge Management Though the case has been made for centralization and standardization of onboarding, there is an equally strong case that has been made for the involvement of multiple players in the execution of that process. Critical to balancing this centralized management of multiple stakeholders is visibility. This is an area where even top performers struggle, as only 41% of Best-in-Class companies indicate that key stakeholders have visibility into the development progress of new employees through the onboarding process. This type of visibility is greatly impacted by the level of automation. Among organizations that describe their onboarding process as fully automated, 62% have this capability in place, as compared to just 35% of those with partial automation and 26% of those with manual onboarding solutions.
Visibility is also a product of compliance and adhering to a single process. Ensuring that onboarding practices, tools, and materials are localized and can be used consistently throughout the organization regardless of location can facilitate this compliance, and ensure that the proper data is gathered. Having the right information is an important first step to being able to share or use it in a meaningful way. In addition, ensuring that the onboarding solution, process and forms are in a new employee's native language helps with engagement, making sure they feel welcomed and ensuring full understanding of each step of the process.
www.aberdeen.com Fax: 617 723 7897

Onboarding 2011: The Path to Productivity Page 20
© 2011 Aberdeen Group. Telephone: 617 854 5200
Technology One of the benefits of establishing a consistent, standard process with centralized oversight is that it then becomes ripe for automation. And top performing companies are taking advantage of automation, as they are twice as likely as all other companies to describe their onboarding process as fully automated (Figure 10).
Figure 10: Automation of Onboarding
39%
35%
31%24%
13%
10%
45%
52%
51%
0% 25% 50% 75% 100%
Laggard
Industry Average
Best-in-Class
percentage of respondents, n=282
Fully Automated Partially Automated Not Automated
Source: Aberdeen Group, February 2011
So what is really being automated in the onboarding process? Among Best-in-Class companies, the most commonly automated elements are:
"The automation of our onboarding process not only made us more efficient, but helps to present ourselves as a current and modern employer. It's all online, not outdated photocopies in a backroom, which demonstrates our commitment to ongoing innovation within the company."
~ Shannon Leska, Senior Manager, Shared
Services/HRAS, Ann Taylor
• Benefits enrollment - 60%
• Enrollment into learning and development programs - 59%
• Assessments to determine appropriate career / development track - 57%
• New employee forms (W2, non-compete, direct deposit, etc.) - 54%
• Provisioning - the steps required to manage system and facility access required for the new employee to do his / her job - 46%
• Workflow / tasks management - the creation, assignment, completion and tracking of checklist items and deliverables required to complete the new employee onboarding process - 43%
Clearly even among top performers there is still a long way to go to achieve full automation, and there are barriers to be overcome, as illustrated in Figure 11. Primarily these are budgetary, with regard to technology or staff investment; however investment in efficiency can lead to improved cost savings. But the third is an interesting one.
www.aberdeen.com Fax: 617 723 7897

Onboarding 2011: The Path to Productivity Page 21
© 2011 Aberdeen Group. Telephone: 617 854 5200
Figure 11: Barriers to Automation
30%31%
50%
0%
25%
50%
Cost is prohibitive / lack ofbudget
Lack of staff to supportautomation initiative
Unique needs /requirements of the
business
perc
enta
ge o
f res
pond
ents
, n=2
82
All Respondents
Source: Aberdeen Group, February 2011
Just under a third (30%) of organizations indicate that their unique business needs and requirements are just too complex for the existing automation solutions. This may indeed be true for some organizations, but it may also be a case of a lack of awareness of what automation offerings exist. Even if a fully automated turnkey solution does not appear to match the unique company needs, at least partial automation is still beneficial. Let's look at the two most common elements of onboarding from Figure 1, new hire forms and benefits enrollment. No matter how complex or unusual the organization, tax forms, medical and dental benefits forms, and other employee data sheets are likely to be quite standard - and indeed many are by law consistent throughout each country or region.
Figure 12: Performance Gains from Automation of Forms and Benefits Enrollment
40%
47%
58%
34%
29%
50%
0%
20%
40%
60%
New Hire Retention New Hire Engagement First Performance GoalsAchieved
perc
enta
ge o
f res
pond
ents
, n=2
82
Automated
Not Automated
Source: Aberdeen Group, February 2011
www.aberdeen.com Fax: 617 723 7897

Onboarding 2011: The Path to Productivity Page 22
© 2011 Aberdeen Group. Telephone: 617 854 5200 www.aberdeen.com Fax: 617 723 7897
By automating just these two elements, significant performance gains can be seen. In addition to the improved new hire engagement, retention and productivity shown in Figure 12, companies that have automated both new hire forms and benefits enrollment saw triple the year-over-year improvement in hiring manager satisfaction (9% vs. 3%), likely due to the fact that hiring managers could start bringing new employees up to speed on their job roles instead of filling out forms.
Performance Management The adage "what gets measured gets done," often attributed to Peter Drucker, is at the core of all performance management for onboarding or any other business process. The number one action among top performing organizations was to assign metrics to quantitatively measure the effectiveness of onboarding and its impact on the organization. But even among these top performers, only 25% indicate the ability to link changes in profitability and/or revenue directly to onboarding activities (as compared to 12% of Industry Average and 4% of Laggards). Even though Best-in-Class companies are doing better than other organizations in this area, it is clearly an area where more attention is needed. Currently, top performing companies are more than three times as likely to have established onboarding metrics, and have key stakeholders agree upon them. In some ways, onboarding has become an essential business process that needs to, and will, be done regardless of the ability to prove business value. But this is a wasted opportunity if that is the case, when measuring the impact can so easily be done with a bit of forethought to establish baselines, the discipline to monitor performance, and follow through to communicate with the business.
Aberdeen Insights — Technology
The activity that ranked third among Best-in-Class organizations for its impact on onboarding success in 2011, cited by 33% was to make new employee information available for use in other systems (e.g., HRMS/HRIS, employee performance management, etc.). Currently, 17% of Best-in-Class companies indicate that their onboarding solutions are not only fully automated, but that data from onboarding is integrated with other talent management systems like applicant tracking, hiring management, or performance management. In addition, Best-in-Class organizations are 50% more likely than all other companies to pull data from recruiting systems into the onboarding process (36% vs. 24%) and nearly twice as likely to pull that data into their performance management systems (31% vs. 18%). And both of these areas were indicated as areas of planned growth in the coming year.
continued

Onboarding 2011: The Path to Productivity Page 23
© 2011 Aberdeen Group. Telephone: 617 854 5200 www.aberdeen.com Fax: 617 723 7897
Aberdeen Insights — Technology
Part of the payoff for investing the dollars and time into HR and talent management systems and tools is the ability to better manage the business through data. By automating and linking processes that can share data, making them more accurate, user friendly and efficient, organizations can achieve this goal. Automated onboarding alone is not enough - and indeed, 25% of respondents indicated that a lack of automation in adjacent processes like recruiting, learning or performance management was a barrier to onboarding automation. But by working toward this integration, organizations will not only have a stronger onboarding process, but also better overall talent data visibility.

Onboarding 2011: The Path to Productivity Page 24
© 2011 Aberdeen Group. Telephone: 617 854 5200
Chapter Three: Required Actions
Fast Facts
√ 83% of Best-in-Class companies start onboarding prior to day one, and nearly half of those (46%) indicate onboarding starts upon offer extension, prior even to acceptance.
√ Best-in-Class companies are 72% more likely than all other organizations to indicate they have automated the onboarding workflow and/or tasks management (defined as the creation, assignment, completion and tracking of checklist items and deliverables required to complete the new employee onboarding process)
Whether a company is trying to move its performance in onboarding from Laggard to Industry Average, or Industry Average to Best-in-Class, the following actions will help spur the necessary performance improvements:
For All Organizations • Start now. If your organization has no formal or standardized
onboarding process, start now. Maturity of practices is strongly correlated to success, as seen by the fact that 51% of Best-in-Class organizations have had onboarding programs in place for three or more years, as compared to 32% of Industry Average and 30% of Laggards. Start now, even if it's simply with developing a standard checklist shared among all the departments that play in the onboarding process, from HR to IT, security and the hiring manager.
• Focus on engagement from the start. Over half (54%) of organizations indicate that improving engagement is among the top three goals of the onboarding process. An informative, comprehensive, easy to use and thoughtful onboarding process can harness and enhance the natural engagement and positive energy associated with starting a new job. New employees are generally looking for guidance and information, eager to make a good impression, and open to learning and onboarding can build on this goodwill. But at the same time, new employees can also be nervous, questioning if they've made the right choice and looking for help through the unknown. When an onboarding process is not there to guide them through the gap between an offer and day one, or when they show up and there is no id badge, computer or even a desk, those fears may be magnified and become a retention risk.
Laggard Steps to Success • Formalize and standardize. If there is any message that has
become crystal clear in this research it is that to achieve more from any onboarding effort, you have to put some good thought and process muscle behind it. Laggards are 28% less likely than Industry Average organizations to have a standardized onboarding process. (89% vs. 54%). And as shown in Chapter One, organizations with a standard onboarding process experienced 54% greater new hire productivity, saw 50% greater new hire retention, and two-times the level of new hire engagement. Whether it means starting out with a simple checklist or putting a third party solution in place, establish a process, make it consistent, and get all the right parties involved.
• Start the onboarding process before day one. As the Embry-Riddle case study showed, there are many benefits to starting the
www.aberdeen.com Fax: 617 723 7897
Onboarding 2011: The Path to Productivity Page 25
© 2011 Aberdeen Group. Telephone: 617 854 5200
onboarding process even before a new employee first sets foot inside the organization as a full fledged employee. For the company, it's critical to start internal processes to requisition equipment, set up a workspace and procure systems access and the like so the new person has the tools they need to be productive. For the individual, the chance to learn about benefits and make selections with any necessary input from family members, the ability to fill out forms during the days when waiting to start, and even the chance to build on the new job anticipation by learning more about the company and coworkers can turn day one into an engaging event for them. And the data shows that only 55% of Laggards start onboarding prior to day one, compared to 70% of the Industry Average. And of the 83% of Best-in-Class companies that start onboarding prior to day one, nearly half of those (46%) indicate onboarding starts upon offer extension, prior even to acceptance.
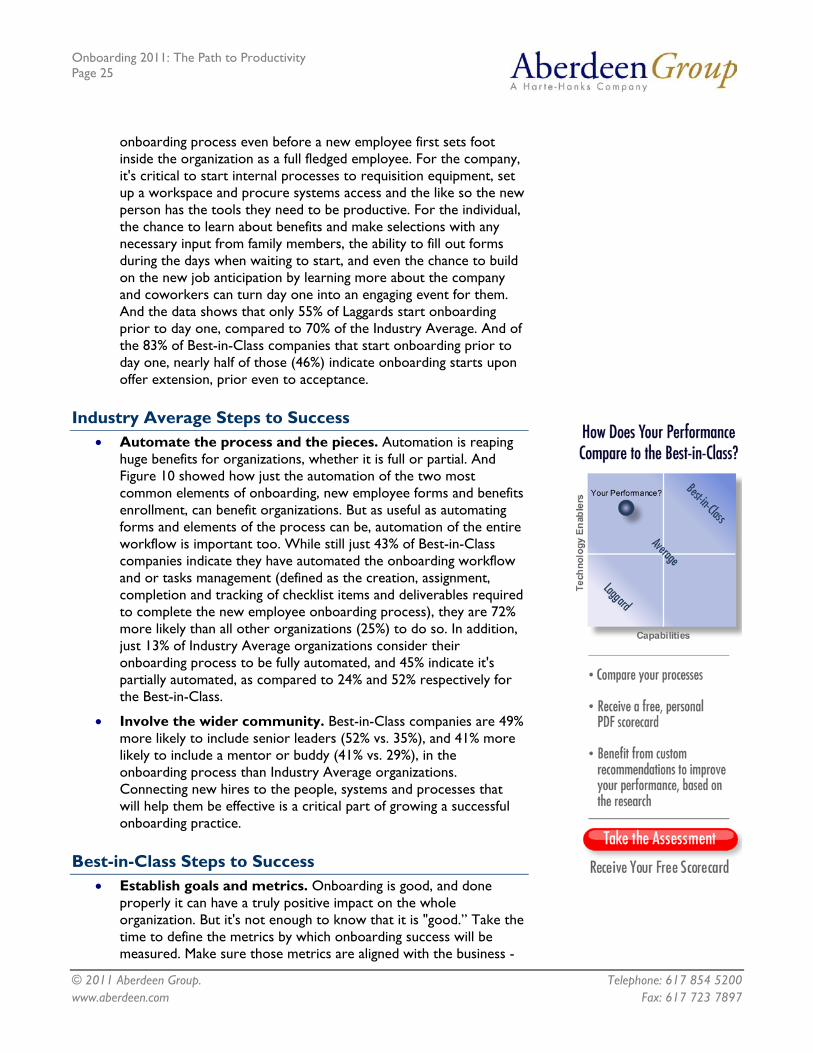
Industry Average Steps to Success • Automate the process and the pieces. Automation is reaping
huge benefits for organizations, whether it is full or partial. And Figure 10 showed how just the automation of the two most common elements of onboarding, new employee forms and benefits enrollment, can benefit organizations. But as useful as automating forms and elements of the process can be, automation of the entire workflow is important too. While still just 43% of Best-in-Class companies indicate they have automated the onboarding workflow and or tasks management (defined as the creation, assignment, completion and tracking of checklist items and deliverables required to complete the new employee onboarding process), they are 72% more likely than all other organizations (25%) to do so. In addition, just 13% of Industry Average organizations consider their onboarding process to be fully automated, and 45% indicate it's partially automated, as compared to 24% and 52% respectively for the Best-in-Class.
• Involve the wider community. Best-in-Class companies are 49% more likely to include senior leaders (52% vs. 35%), and 41% more likely to include a mentor or buddy (41% vs. 29%), in the onboarding process than Industry Average organizations. Connecting new hires to the people, systems and processes that will help them be effective is a critical part of growing a successful onboarding practice.
Best-in-Class Steps to Success • Establish goals and metrics. Onboarding is good, and done
properly it can have a truly positive impact on the whole organization. But it's not enough to know that it is "good.” Take the time to define the metrics by which onboarding success will be measured. Make sure those metrics are aligned with the business -
www.aberdeen.com Fax: 617 723 7897

Onboarding 2011: The Path to Productivity Page 26
© 2011 Aberdeen Group. Telephone: 617 854 5200 www.aberdeen.com Fax: 617 723 7897
remember that improved productivity is the goal so metrics should help describe that improvement. Less than half (44%) of Best-in-Class companies have onboarding metrics in place, but just 20% of all other companies do. Linking onboarding practices to performance, cost savings and productivity is crucial.
• Expand the onboarding footprint. Organizations are using onboarding to improve the success of individuals at all levels of the organization, and even to gain more benefit from their use of contingent labor. As the economy recovers and organizations hire more full time staff, as well as reevaluate old staffing models to include more contract or temporary labor, the ability to offer the right onboarding experience is key. No matter what the role, having the equipment and workspace ready to go, and helping a new employee understand how to navigate the company culture will go a long way.
Aberdeen Insights — Summary
Onboarding has become a critical business practice and is here to stay. Not only is effective onboarding improving compliance and efficiency, but through standardization and automation companies are taking real cost out of the process as well. However, in addition to improving efficiency, onboarding is being seized as an opportunity to build excitement and engagement, and most importantly put a new hire or contingent staffer on an earlier, quicker and more deliberate path to productivity. The goal is to create an experience that helps the individual, the team around them, and the myriad of departments and functions involved in bringing a new employee into the company to work together to remove obstacles and create a smooth transition. By standardizing, centralizing, automating and involving the right key players, top performing companies are truly impacting personal and organizational performance.

Onboarding 2011: The Path to Productivity Page 27
© 2011 Aberdeen Group. Telephone: 617 854 5200
Appendix A: Research Methodology
Between January and February 2011, Aberdeen examined the use, the experiences, and the intentions of more than 280 enterprises using onboarding in a diverse set of enterprises.
Study Focus
Responding HR and line of business executives completed an online survey that included questions designed to determine the following:
√ The degree to which onboarding processes and supporting technologies are in place
√ The structure and effectiveness of top performing onboarding practices
√ Current and planned use of onboarding technologies
√ The benefits, if any, that have been derived from onboarding initiatives
The study aimed to identify emerging best practices for onboarding, and to provide a framework by which readers could assess their own management capabilities.
Aberdeen supplemented this online survey effort with interviews with select survey respondents, gathering additional information on onboarding strategies, experiences, and results.
Responding enterprises included the following:
• Job title: The research sample included respondents with the following job titles: CEO / President (17%); EVP / SVP / VP (20%); Director (25%); Manager (26%); Consultant (7%); and other (5%).
• Department / function: The research sample included respondents from the following departments or functions: HR / talent management (48%); corporate management (14%); business development / sales (10%); operations (8%); and others (20%).
• Industry: The research sample included respondents the following industries: IT / consulting services (13%); software (8%); public sector / government (6%); manufacturing (5%); education (5%); financial services (4%); and others.
• Geography: The majority of respondents (76%) were from North America. Remaining respondents were from the Asia-Pacific region (10%); Europe (9%); and the rest of world (5%).
• Company size: Twenty-nine percent (29%) of respondents were from large enterprises (annual revenues above US $1 billion); 28% were from midsize enterprises (annual revenues between $50 million and $1 billion); and 43% of respondents were from small businesses (annual revenues of $50 million or less).
• Headcount: Twenty-three percent (44%) of respondents were from large enterprises (headcount greater than 1,000 employees); 24% were from midsize enterprises (headcount between 100 and 999 employees); and 32% of respondents were from small businesses (headcount between 1 and 99 employees).
www.aberdeen.com Fax: 617 723 7897

Onboarding 2011: The Path to Productivity Page 28
© 2011 Aberdeen Group. Telephone: 617 854 5200
Table 4: The PACE Framework Key
Overview Aberdeen applies a methodology to benchmark research that evaluates the business pressures, actions, capabilities, and enablers (PACE) that indicate corporate behavior in specific business processes. These terms are defined as follows: Pressures — external forces that impact an organization’s market position, competitiveness, or business operations (e.g., economic, political and regulatory, technology, changing customer preferences, competitive) Actions — the strategic approaches that an organization takes in response to industry pressures (e.g., align the corporate business model to leverage industry opportunities, such as product / service strategy, target markets, financial strategy, go-to-market, and sales strategy) Capabilities — the business process competencies required to execute corporate strategy (e.g., skilled people, brand, market positioning, viable products / services, ecosystem partners, financing) Enablers — the key functionality of technology solutions required to support the organization’s enabling business practices (e.g., development platform, applications, network connectivity, user interface, training and support, partner interfaces, data cleansing, and management)
Source: Aberdeen Group, February 2011
Table 5: The Competitive Framework Key
Overview The Aberdeen Competitive Framework defines enterprises as falling into one of the following three levels of practices and performance: Best-in-Class (20%) — Practices that are the best currently being employed and are significantly superior to the Industry Average, and result in the top industry performance. Industry Average (50%) — Practices that represent the average or norm, and result in average industry performance. Laggards (30%) — Practices that are significantly behind the average of the industry, and result in below average performance.
In the following categories: Process — What is the scope of process standardization? What is the efficiency and effectiveness of this process? Organization — How is your company currently organized to manage and optimize this particular process? Knowledge — What visibility do you have into key data and intelligence required to manage this process? Technology — What level of automation have you used to support this process? How is this automation integrated and aligned? Performance — What do you measure? How frequently? What’s your actual performance?
Source: Aberdeen Group, February 2011
Table 6: The Relationship Between PACE and the Competitive Framework
PACE and the Competitive Framework – How They Interact Aberdeen research indicates that companies that identify the most influential pressures and take the most transformational and effective actions are most likely to achieve superior performance. The level of competitive performance that a company achieves is strongly determined by the PACE choices that they make and how well they execute those decisions.
Source: Aberdeen Group, February 2011
www.aberdeen.com Fax: 617 723 7897

Onboarding 2011: The Path to Productivity Page 29
© 2011 Aberdeen Group. Telephone: 617 854 5200 www.aberdeen.com Fax: 617 723 7897
Appendix B: Related Aberdeen Research
Related Aberdeen research that forms a companion or reference to this report includes:
• The 2011 HR Executives Agenda: Automation, Innovation and Growth; December 2010
• Outsourcing Recruitment Is Not Evil: RPO Builds Its Business Case on Flexibility, Scalability, and Outcomes; November 2010
• Learning & Development 2010: Bridging the Gap Between Strategy and Execution; October 2010
• The Business Leader as Talent Leader; October 2010 • Recruitment Technology: Quality Candidates and Quality Process;
September 2010 • Talent Acquisition Strategies: Candidate Experience and Relationship
Management Come of Age!; August 2010 • Succession Management: Sustainable Leadership for the Future; July
2010 • The 2011 Marketer's Agenda: Accessing and Understanding Customer
Experience Data Is Life or Death; July 2010 • Effective Talent Management Drives Profitable Business Growth; July
2010 • Mobile HCM: Workforce and Talent Management on the Move; June
2010 • Talent Assessment Strategies: A Decision Guide for Organizational
Performance; March 2010 • Onboarding: The First Line of Engagement; February 2010 • Strategic Workforce Planning: Winning Scenarios for Uncertain Times;
January 2010 • Integrated Talent Management: Improving Business Results through
Visibility and Alignment; December 2009 Information on these and any other Aberdeen publications can be found at www.aberdeen.com.
Author: Mollie Lombardi, Senior Research Analyst, Human Capital Management ([email protected])
For more than two decades, Aberdeen's research has been helping corporations worldwide become Best-in-Class. Having benchmarked the performance of more than 644,000 companies, Aberdeen is uniquely positioned to provide organizations with the facts that matter — the facts that enable companies to get ahead and drive results. That's why our research is relied on by more than 2.5 million readers in over 40 countries, 90% of the Fortune 1,000, and 93% of the Technology 500. As a Harte-Hanks Company, Aberdeen’s research provides insight and analysis to the Harte-Hanks community of local, regional, national and international marketing executives. Combined, we help our customers leverage the power of insight to deliver innovative multichannel marketing programs that drive business-changing results. For additional information, visit Aberdeen http://www.aberdeen.com or call (617) 854-5200, or to learn more about Harte-Hanks, call (800) 456-9748 or go to http://www.harte-hanks.com. This document is the result of primary research performed by Aberdeen Group. Aberdeen Group's methodologies provide for objective fact-based research and represent the best analysis available at the time of publication. Unless otherwise noted, the entire contents of this publication are copyrighted by Aberdeen Group, Inc. and may not be reproduced, distributed, archived, or transmitted in any form or by any means without prior written consent by Aberdeen Group, Inc. (2011a)