ontario trauma registry 2011 report: major injury in ontario, …€¦ · trauma cases were...
TRANSCRIPT

pic pic
Types of Care
Ontario Trauma Registry 2011 Report: Major Injury in Ontario, 2009–2010 Data

Who We AreEstablished in 1994, CIHI is an independent, not-for-profit corporation that provides essential information on Canada’s health system and the health of Canadians. Funded by federal, provincial and territorial governments, we are guided by a Board of Directors made up of health leaders across the country.
Our VisionTo help improve Canada’s health system and the well-being of Canadians by being a leading source of unbiased, credible and comparable information that will enable health leaders to make better-informed decisions.
Table of Contents About the Canadian Institute for Health Information .............................................. iii
Acknowledgements ................................................................................................. v
Executive Summary ............................................................................................... vii Overall Trends ......................................................................................... vii Trends by Cause ..................................................................................... vii Context of Injury ..................................................................................... viii Clinical Aspects of Injury ....................................................................... viii
1 Introduction ....................................................................................................... 1
1.1 Purpose of Report .................................................................................... 1
1.2 About the Ontario Trauma Registry ......................................................... 1 1.2.1 Goal .............................................................................................. 1 1.2.2 History .......................................................................................... 1 1.2.3 Structure ....................................................................................... 1
2 Methods ............................................................................................................ 3
2.1 Data Source ............................................................................................. 3
2.2 Inclusion/Exclusion Criteria ..................................................................... 3 2.2.1 Definition of Trauma ..................................................................... 3 2.2.2 Participating Facilities .................................................................. 4
2.3 Data Elements .......................................................................................... 4 2.3.1 Data Dictionary ............................................................................ 4 2.3.2 Data Quality ................................................................................. 5
2.4 Reporting Guidelines ............................................................................... 5
3 Overall Trend Analysis ...................................................................................... 6
3.1 2009–2010 Highlights .............................................................................. 6
3.2 Trend Analysis, 2005–2006 to 2009–2010 .............................................. 7
3.3 Demographic Analysis ............................................................................. 8
4 Analysis of Causes of Injury ............................................................................. 9
4.1 Overall Causes ......................................................................................... 9
4.2 Causes by Age Group ........................................................................... 11 4.2.1 Cases Younger Than Age 20 ..................................................... 11 4.2.2 Cases Age 20 to 34.................................................................... 12 4.2.3 Cases Age 35 to 64.................................................................... 13 4.2.4 Cases Age 65 and Older ........................................................... 14
4.3 Motor Vehicle Collisions ........................................................................ 15

ii
4.3.1 Motor Vehicle Traffic and Non-Traffic Incidents ........................ 15 4.3.2 Injured Persons .......................................................................... 18
4.4 Unintentional Falls ................................................................................. 21
4.5 Intentional Injuries .................................................................................. 25 4.5.1 Suicide and Self-Inflicted Injury (Excluding Poisoning) ............ 25 4.5.2 Assault and Injury Purposely Inflicted by Another Person ........ 27
4.6 Cycling Injuries ...................................................................................... 28
4.7 Other Causes of Injury ........................................................................... 29
5 Context of Injury .............................................................................................. 29
5.1 Place of Injury ........................................................................................ 29
5.2 Work-Related Injury ............................................................................... 29
5.3 Sports and Recreational Injury .............................................................. 30
5.4 Blood Alcohol Concentration ................................................................ 31
6 Clinical Aspects of Injury ................................................................................ 32
6.1 Type of Injury ......................................................................................... 32
6.2 Pre-Hospital Care ................................................................................... 32
6.3 Discharge Disposition ............................................................................ 33
6.4 Deaths .................................................................................................... 35 6.4.1 All Cases .................................................................................... 35 6.4.2 In-Hospital Deaths ..................................................................... 37 6.4.3 Died in Emergency .................................................................... 37
6.5 Injury Severity Score .............................................................................. 38
6.6 Length of Stay ........................................................................................ 41
6.7 Special Care Units ................................................................................. 44
6.8 Unexpected Deaths and Survivals ........................................................ 44 6.8.1 Blunt Injuries: 2005–2006 Through 2009–2010 Cases ............. 45
Appendix A—Definition of Terms ......................................................................... 47
Appendix B—Trauma Definition: External Cause of Injury Code Inclusions and Exclusions ............................................................................... 59
Appendix C—Definition of Trauma ....................................................................... 63
Appendix D—External Cause of Injury Reporting Categories ............................. 67
Appendix E—Nature of Injury Reporting Categories ........................................... 73
Appendix F—Comprehensive Data Set Data Elements ...................................... 75
Appendix G—Unexpected Outcomes Analysis ................................................... 83
Appendix H—2009–2010 Data Tables ................................................................. 85
References .......................................................................................................... 121

iii
Ontario Trauma Registry 2011 Report: Major Injury in Ontario, 2009–2010 Data
About the Canadian Institute for Health Information The Canadian Institute for Health Information (CIHI) collects and analyzes information on health and health care in Canada and makes it publicly available. Canada’s federal, provincial and territorial governments created CIHI as a not-for-profit, independent organization dedicated to forging a common approach to Canadian health information. CIHI’s goal: to provide timely, accurate and comparable information. CIHI’s data and reports inform health policies, support the effective delivery of health services and raise awareness among Canadians of the factors that contribute to good health.
CIHI’s mandate is based on collaborative planning with key stakeholder groups, including all provincial, territorial and federal governments, national health care agencies and service providers.
CIHI is governed by a Board of Directors whose 15 members strike a balance among the health stakeholders, sectors and regions of Canada.

v
Ontario Trauma Registry 2011 Report: Major Injury in Ontario, 2009–2010 Data
Acknowledgements This Ontario Trauma Registry (OTR) report is made possible by the contributions of the 11 participating facilities, the Ontario Trauma Registry Advisory Committee (TRAC) and the Ontario Ministry of Health and Long-Term Care.
The OTR is funded by the Ontario Ministry of Health and Long-Term Care and is managed by the Canadian Institute for Health Information (CIHI).
The Ontario Trauma Registry 2011 report, Major Injury in Ontario, was developed at CIHI by the following:
Vivian Poon, Analyst, Trauma Registries
Patricia Sidhom, Program Lead, Trauma Registries
Claire Marie Fortin, Manager, Clinical Registries
All questions regarding this report should be directed to
Ontario Trauma Registry Canadian Institute for Health Information 4110 Yonge Street, Suite 300 Toronto, Ontario M2P 2B7
Phone: 416-481-2002 ext. 5604 Fax: 416-481-2950 Email: [email protected]


vii
Ontario Trauma Registry 2011 Report: Major Injury in Ontario, 2009–2010 Data
Executive Summary The source of data for this report is the Ontario Trauma Registry Comprehensive Data Set. Trauma cases were selected based on an Injury Severity Score (ISS) of more than 12 and external cause of injury inclusion and exclusion criteria. Cases also met one of the following criteria:
• Were admitted to a participating facility; or
• Were treated in the emergency department of a participating facility (not admitted); or
• Died in the emergency department of a participating facility after treatment was initiated (not admitted).
Overall Trends
In 2009–2010, there were 4,235 cases hospitalized with major trauma in 11 participating facilities across 14 sites in Ontario. This represents an increase of 2.2% compared with 2005–2006, and an average annual increase of 0.44% from 2005–2006 to 2009–2010.
In 2009–2010, these major trauma cases accounted for 61,523 days in the participating facilities. Most (71%, n = 3,017) of these cases were male, and the average age of all cases was 48 years. The average age of patients increased slightly over the last five years, from a low of 45 in 2005–2006 to 48 in 2009–2010.
Of the 4,235 cases, 13% (n = 532) died,i either in hospital (n = 455) or in the emergency department (DIEs) (n = 74). The number of in-hospital deaths remained stable from 2005–2006 to 2009–2010, ranging from 10% to 11% over the last five years. The number of DIEs decreased by 37% since 2005–2006, with an average annual decrease of 8%.
Trends by Cause
Motor vehicle collisions were the leading cause of major injury hospitalizations (39%, n = 1,654), accounting for 30% (n = 159) of major injury in-hospital deaths. Among these cases, 56% (n = 932) were drivers, 19% (n = 310) were pedestrians and 17% (n = 287) were passengers. Following motor vehicle collisions, unintentional falls represented the second most common cause of major hospitalizations (38%, n = 1,604) and the leading cause of in-hospital deaths (50%, n = 226). Among the 1,604 cases injured in unintentional falls, the most commonly specified types were falls on or from stairs or steps (22%, n = 353) and falls from slipping, tripping and stumbling (21%, n = 337). i. Three cases were found to be missing time of death information. These cases were included in the
following analyses but were not captured within the in-hospital death or died in emergency records.

viii
Ontario Trauma Registry 2011 Report: Major Injury in Ontario, 2009–2010 Data
The next most common causes of injury were injuries purposefully inflicted by another person (including cases of attempted homicide and assault) (9%, n = 391) and suicide and self-inflicted injury (excluding poisoning) (2%, n = 89).
Analysis of the causes of injury by age groups revealed that motor vehicle collisions and falls were the leading two causes in all age groups, with the exception of cases age 20 to 34. Although motor vehicle collisions were responsible for the majority (53%, n = 422) of cases in this age group, the second most common cause of injury was injury purposely inflicted by another person (21%, n = 168).
Context of Injury
Overall, 9% (n = 399) of injury cases involved a sports or recreational activity, while 6% (n = 235) of admissions were documented as work-related.
More than half (53%, n = 2,265) of major trauma cases were tested for blood alcohol concentration (BAC).ii Of those, 685 (30%) had a BAC greater than zero and 543 (24%) had a positive BAC (above the legal limit for driving; BAC≥0.08% or 17.4 mmol/L). Cases with positive BAC results represented 13% (n = 543) of all cases.
Clinical Aspects of Injury
In general, the most common injury types were injuries to the internal organs (83%, n = 3,505), followed by musculoskeletal (69%, n = 2,924) and superficial (31%, n = 1,297) injuries. Ninety-three percent (n = 3,917) of cases were documented as blunt injury (including lacerations), while 5% (n = 230) had penetrating injuries and 2% (n = 88) were hospitalized due to burns.
For all cases, the overall mean ISS was 24. In 2009–2010, the highest mean ISS occurred among cases injured in a railway incident (ISS = 38.3, n = 4), followed by cases due to drowning (ISS = 29, n = 9) and motor vehicle traffic incidents (ISS = 27, n = 1,417). The highest ISS, according to injury types, occurred among cases with burn injuries (as opposed to blunt or penetrating injuries) (ISS = 26).
The mean length of stay (LOS) was 15 days. Among survivors, the mean LOS was 16 days, compared with a mean LOS of 9 days for patients who died in hospital. Age group comparisons indicated that the mean LOS increased with advancing age. Specifically, cases age 65 and older had a mean LOS of 16 days, whereas cases younger than 20 had a mean LOS of 12 days. Among the three most common types of major injuries, the longest average LOS for all cases was for those admitted with burn injuries (LOS = 41 days).
Of the 3,703 cases discharged alive, 58% (n = 2,136) were discharged home either with or without support services, 17% (n = 648) were discharged to a rehabilitation facility and 17% (n = 627) were transferred to another acute care facility.
ii. For further information regarding BAC testing, please refer to Section 5.4.

1
Ontario Trauma Registry 2011 Report: Major Injury in Ontario, 2009–2010 Data
1 Introduction
1.1 Purpose of Report
The purpose of this report is to provide a descriptive analysis of patients hospitalized with major trauma in the 11 lead trauma hospitals in Ontario. The data source for this report is the Ontario Trauma Registry Comprehensive Data Set (OTR CDS). Trauma cases were selected based on an Injury Severity Score (ISS) greater than 12 and using external cause of injury inclusion and exclusion criteria.
1.2 About the Ontario Trauma Registry
1.2.1 Goal
The goal of the Ontario Trauma Registry (OTR) is to facilitate the reduction of injury admissions and deaths in the province of Ontario by identifying, describing and quantifying trauma to
1. Increase awareness of injury as a public health problem in Ontario;
2. Assist injury prevention and treatment programs; and
3. Support injury-related analysis and research.
1.2.2 History
The OTR, funded by the Ontario Ministry of Health and Long-Term Care, was established in May 1992. A multidisciplinary advisory committee—the Trauma Registry Advisory Committee (TRAC)—provides guidance to the OTR. The TRAC includes representatives from the ministries of Health and Long-Term Care, Labour and Transportation; CIHI; the Office of the Chief Coroner; the Trauma Association of Canada; and injury prevention organizations; as well as epidemiologists and trauma care providers.
1.2.3 Structure
For injury prevention programs to be effective, data is needed to clearly define the nature and scope of injury in the province. The use of the International Classification of Diseases (ICD) external cause of injury coding system for all injury admissions facilitates the analysis of injury data in Ontario. The OTR consists of three major sources of data, as listed on the next page. Standard and ad hoc reports from these data sets detail demographic information and cause and nature of injury admissions and deaths provincially. This information is used by researchers and injury prevention specialists to develop and monitor injury prevention programs.

2
Ontario Trauma Registry 2011 Report: Major Injury in Ontario, 2009–2010 Data
The OTR is composed of three data sets, as described below.
1. The Comprehensive Data Set (CDS), the data source for this report, is described in detail in the next chapter.
2. The Ontario subset of the National Trauma Registry Minimum Data Set (NTR MDS) contains demographic, diagnostic and procedural information on all acute care hospitalizations due to injury in acute care facilities in Canada. These admissions are selected from the Hospital Morbidity Database at CIHI and downloaded to the registry’s data processing system. As of 2002–2003, inclusion criteria were based on specific external cause of injury codes within the International Classification of Diseases and Related Health Problems, 10th Revision, Canada (ICD-10-CA). Inclusion for Ontario in the NTR MDS for 1994 to 2001 is based on specific external cause of injury codes within the International Classification of Diseases, 9th Revision (ICD-9) (E codes).
Examples of external cause of injury codes that are included in the definition of trauma are motor vehicle collisions, including those involving pedestrians, motorcycles and bicycles; falls; drowning; and burns. External cause of injury codes that are excluded are poisoning, adverse effects and complications. Appendix B—Trauma Definition: External Cause of Injury Code Inclusions and Exclusions lists the external cause of injury codes that are included in and excluded from the definition of trauma used for the NTR MDS.
3. The Death Data Set (DDS) from the Office of the Chief Coroner contains information on all deaths in the province due to injury. There are approximately 3,900 injury deaths annually in Ontario (OTR DDS 2003 to 2008). Reporting on all injury deaths rather than in-hospital deaths (as reported in the OTR MDS) provides a more complete picture of trauma in the province. Information contained in the database at the Office of the Chief Coroner is indispensable to injury prevention programs because a significant percentage of injured people die before admission to hospital. Trauma is defined in the DDS using components of the Office of the Chief Coroner’s classification system of death types, death factors, environments and involvements. The OTR developed a system to map the classification system used by the Office of the Chief Coroner to the external cause of injury codes to allow standardized reporting across the data sets of the OTR and comparisons with other sources of data. Information in the DDS includes demographics, cause of death and factors contributing to death, such as alcohol use.
3
Ontario Trauma Registry 2011 Report: Major Injury in Ontario, 2009–2010 Data
2 Methods
2.1 Data Source
The data source for this report is the OTR CDS. The OTR CDS consists of detailed information on patients hospitalized with major trauma in 11 participating facilities across 14 sites in the province. These lead trauma hospitals are funded by the Ministry of Health and Long-Term Care for hardware, software and dedicated trauma staff, including a medical director, trauma coordinator, data analyst and administrative assistant.
The definition of trauma in the OTR CDS is based on the ISS, an international scoring system created to calculate the severity of injury, and an appropriate external cause of injury code (see Appendix B). External cause of injury code inclusion criteria were expanded for the OTR CDS to include other causes of injury where appropriate, as determined by the OTR CDS Working Group. Appendix C describes these additional guidelines.
Specialized trauma software (Collector and Tri-Code from Digital Innovations and Tri-Analytics, Inc.) is used to collect and analyze data on approximately 4,000 cases annually. This software was customized for the province of Ontario with input from participating facilities and the TRAC. Detailed data is collected, including demographics, pre-hospital and hospital care, and patient outcomes. Data is electronically transmitted monthly to CIHI to create the OTR CDS.
2.2 Inclusion/Exclusion Criteria
2.2.1 Definition of Trauma
Trauma is defined in the OTR CDS as any case
• With an ISS greater than 12 and an appropriate external cause of injury code (see Appendix B) that meets one of the following criteria:
– Admitted to a participating facility; or
– Treated in the emergency department of a participating facility but not admitted; or
– Died in the emergency department of a participating facility after treatment was initiated but prior to admission.
Additional trauma definition guidelines as established by the OTR CDS Working Group and TRAC are found in appendices B and C.

4
Ontario Trauma Registry 2011 Report: Major Injury in Ontario, 2009–2010 Data
2.2.2 Participating Facilities
The following 11 participating facilities (across 14 sites) provide data to the OTR CDS:
• Children’s Hospital of Eastern Ontario, Ottawa
• Hamilton Health Sciences Corporation, Hamilton (two sites)
• Hospital for Sick Children, Toronto
• Hôtel-Dieu Grace Hospital, Windsor
• Kingston General Hospital, Kingston
• London Health Sciences Centre, London (two sites)
• The Ottawa Hospital, Ottawa (two sites)
• Hôpital régional de Sudbury Regional Hospital, Sudbury
• St. Michael’s Hospital, Toronto
• Sunnybrook Health Sciences Centre, Toronto
• Thunder Bay Regional Health Sciences Centre, Thunder Bay
In this report, facilities are anonymized and represented by a letter of the alphabet (A to N); therefore, specific facilities cannot be identified.
2.3 Data Elements
2.3.1 Data Dictionary
The OTR CDS Data Dictionary was prepared by the OTR with input from participating facility staff and members of the TRAC. The purpose of the document is to define each data element in the customized Ontario version of Collector. The data dictionary includes a list of commonly used abbreviations and their meanings; the field name, type and length for each data element; an explanation of what is required for the data element; and a list of menu choices wherever appropriate.
The OTR CDS Data Dictionary appendices include the definition of trauma, the definition of a trauma patient (external cause of injury list), a list of participating facilities, physician services, non-operative procedures definitions and Motor Vehicle Collision Report information. The latest update of the data dictionary was published in July 2005 and is available electronically from CIHI’s website.
A complete list of OTR CDS data elements can be found in Appendix F.

5
Ontario Trauma Registry 2011 Report: Major Injury in Ontario, 2009–2010 Data
2.3.2 Data Quality
There are more than 90 detailed edit checks in the Collector software package to ensure data accuracy, consistency and completeness. These edits include range checks, cross checks, validity checks, date sequence edits and edits for blank fields.
CIHI performs various validity checks on the data submitted by the lead trauma hospitals, such as checking that the diagnosis codes are valid and the data is complete. If the data does not pass CIHI validations, a notification of errors is sent to the lead trauma hospitals, which are then asked to resubmit the corrected or complete data.
CIHI implemented the Data Quality Framework to provide a means to systematically assess, improve and document data quality for all databases at CIHI. Data quality is defined as “fitness for use” from the user’s perspective. Using the Data Quality Framework, the OTR CDS is currently being assessed on the basis of five dimensions: accuracy, timeliness, comparability, usability and relevance. Each of these five dimensions is made up of related characteristics, which are assessed using detailed criteria. A description of CIHI’s Data Quality Framework is available on CIHI’s website (www.cihi.ca).
2.4 Reporting Guidelines
This report
• Contains 2009–2010 data from 11 participating facilities across 14 sites transmitted to the OTR as of May 31, 2010.
• Was created based on fiscal year of discharge as approved by the TRAC in October 2004. This change was initiated in the 2005 report, which included 2004–2005 data.
• Contains totals that may not match exactly when compared with previous reports, as facilities may update data from previous years.
• Discusses five-year trends (2005–2006 to 2009–2010).
• Does not include admissions due to suicide or homicide resulting from poisoning.
• Generally counts admissions to lead trauma hospitals due to major injury, referred to as “cases.” Because patients may be transferred between participating hospitals, the same individual patient may be included more than once in the OTR CDS.
• Includes in-hospital deaths and cases that died in emergency department (DIEs) in participating hospitals; deaths that occurred before active treatment was initiated (that is, dead on arrival or dead at the scene) are not included.
6
Ontario Trauma Registry 2011 Report: Major Injury in Ontario, 2009–2010 Data
• Explores data from facility sites according to a letter of the alphabet (A to N); therefore, specific facilities cannot be identified.
• Includes data from the lead trauma hospitals by site. The data tables in Appendix H report on 14 individual sites.
• Does not include one case due to late submission.
• Contains three cases of deaths for which no information regarding time of death was provided. While these cases were included in the total, they were not captured within the in-hospital death or DIE records.
• May report percentages that do not add to 100% because of rounding.
• Discusses cause of injury by the primary external cause of injury code documented; up to three codes (primary, secondary and tertiary) can be documented in the OTR CDS.
• Calculates percentages using all records as denominators unless otherwise stated.
• Includes tables produced by age and/or sex that may not sum to the total; cases with unknown age and/or unknown sex are included in the total but not in the individual age or sex categories.
• Includes information about positive blood alcohol concentration (BAC), such as all BAC levels greater than zero and BAC levels defined as greater than or equal to 0.08%/17.4 mmol/L (to reflect the legal positive blood alcohol limit for driving).
3 Overall Trend Analysis
3.1 2009–2010 Highlights
In the 2009–2010 OTR CDS, there were 4,235 injury cases with an ISS greater than 12 and an appropriate cause of injury treated in 11 participating facilities (across 14 sites) in Ontario.
• The 4,235 injury cases accounted for 61,523 hospital days.
• The mean length of stay (LOS) was 15 days (median = 7 days).
• The mean ISS was 24 (median = 22).
• There were 532 deaths: 455 in-hospital deaths (admitted patients) and 74 DIEs.
• Of all cases, 3,017 (71%) were male.
• Direct admissions accounted for 2,203 (52%) cases (admitted directly to a participating hospital [not referred]).

7
Ontario Trauma Registry 2011 Report: Major Injury in Ontario, 2009–2010 Data
• Of all cases, 445 (11%) cases were admitted directly as an inpatient, bypassing the emergency department.
• The mean age for all cases was 48 (median = 49).
• One-third of cases (33%, n = 1,406) were younger than 35.
• Out-of-province residents accounted for 101 (2%) cases.
• Of all cases, 1,376 (32.5%) patients had ventilator days;iii the mean number of ventilator days was 7 (median = 2).
• There were 163 (4%) cases that had intracranial pressure (ICP) monitoring days;iii the mean number of ICP days was 5 (median = 3).
• Of all cases, 2,265 (53%) had blood alcohol testing;iv of those, 685 (30%) had a BAC greater than zero.
• There were 543 cases that had a BAC greater than or equal to 0.08% (17.4 mmol/L), accounting for 13% of all cases and 24% of those who were tested for BAC.iv
• The most prevalent specific injury type was an injury to an internal organ (83%), followed by an injury to the musculoskeletal system (69%) and a superficial injury (31%).
• Blunt injury was the most common injury type, representing 3,917 (93%) cases.
• Of all cases, 235 (6%) were work-related.
• In 2009–2010, 399 (9%) injuries occurred during a sports and recreational activity, of which 51% (n = 204) were related to motor vehicle incidents.
3.2 Trend Analysis, 2005–2006 to 2009–2010
Over the past five years, the number of cases appearing annually in the OTR CDS increased from 4,143 in 2005–2006 to 4,235 in 2009–2010 (Appendix H, Table 1). This represents a 2.2% increase compared with 2005–2006 and an average annual increase of 0.44% between 2005–2006 and 2009–2010.
Since 2005–2006, the number of in-hospital deaths (ranging between 10% and 11%), mean ISS (ranging from 24 to 25) and mean LOS (15 days) have remained relatively constant. However, it was observed that the number of DIEs decreased by 37% since 2005–2006, accounting for an average annual decrease of 8% from 2005–2006 to 2009–2010. When we consider DIEs as a percentage of the total caseload, it was observed that values marginally decreased from a high of 2.8% in 2005–2006 to a low of 1.7% in 2009–2010.
iii. Presented results reflect applicable cases only. iv. For further information regarding BAC testing, please refer to Section 5.4.

8
Ontario Trauma Registry 2011 Report: Major Injury in Ontario, 2009–2010 Data
3.3 Demographic Analysis
The mean age of all injury cases was 48 (median = 49).
Statistics pertaining to all injury cases according to age groups are summarized in Figure 1. Highlights include the following:
• Those younger than age 20 accounted for 15% (n = 615) of all cases and 11% (n = 7,035) of participating hospital days.
• Those age 20 to 34 accounted for 19% (n = 791) of all cases and 19% (n = 11,496) of participating hospital days.
• Those age 35 to 64 accounted for 37% (n = 1,576) of all cases and 38% (n = 23,139) of participating hospital days.
• Those age 65 and older accounted for 30% (n = 1,249) of all cases and 32% (n = 19,852) of participating hospital days.
For age-specific statistics, please refer to Appendix H, Table 2.
Figure 1: Injury Cases by Age Group, Ontario, 2009–2010 Cases
Note * Four cases were excluded due to unknown age.
Source Ontario Trauma Registry, 2009–2010, Canadian Institute for Health Information.

9
Ontario Trauma Registry 2011 Report: Major Injury in Ontario, 2009–2010 Data
As seen in Figure 2, males accounted for the greatest (71%) number of cases, with a peak in young males around age 20.
Figure 2: Injuries by Single Year of Age and Sex, All Cases, Ontario, 2009–2010 Cases*
Note * Four cases were excluded due to unknown age.
Source Ontario Trauma Registry, 2009–2010, Canadian Institute for Health Information.
4 Analysis of Causes of Injury
4.1 Overall Causes
In the 2009–2010 OTR CDS, external causes of injuries were defined in accordance with the ICD coding system. For the purpose of the following summary sections, major causes of injury are classified as cases of
• Motor vehicle collisions (including traffic, non-traffic, and motor vehicle boarding or alighting incidents);
• Unintentional falls;
• Suicides and self-inflicted injuries (excluding poisoning);
• Injuries purposely inflicted by another person; and
• All others.

10
Ontario Trauma Registry 2011 Report: Major Injury in Ontario, 2009–2010 Data
Detailed documentation for each category’s inclusion criteria can be found in Appendix D.
Figure 3 shows the causes of injury for the 4,235 cases in the 2009–2010 OTR CDS. The leading cause of major injury hospitalizations was motor vehicle collisions (39%, n = 1,654) followed closely by unintentional falls (38%, n = 1,604).
Figure 3: Causes of Injury, All Cases, Ontario, 2009–2010
Note Inclusion criteria for each category can be found in Appendix D.
Source Ontario Trauma Registry, 2009–2010, Canadian Institute for Health Information.
The mean ages for the most common causes of injury were as follows (Appendix H, Table 14):
• Motor vehicle collisions: 41 (median = 39).
• Unintentional falls: 62 (median = 68).
• Assault and injury purposely inflicted by another person: 32 (median = 28).
• Suicide and self-inflicted injury: 46 (median = 44).

11
Ontario Trauma Registry 2011 Report: Major Injury in Ontario, 2009–2010 Data
4.2 Causes by Age Groupv
4.2.1 Cases Younger Than Age 20
Figure 4 highlights the most common causes of major hospitalized injury among those younger than age 20 (n = 615). Motor vehicle collisions comprised nearly half of these cases (48%, n = 292), followed by unintentional falls (22%, n = 134). Additional analyses presented in Appendix H, Table 20, revealed that sports and recreational activities accounted for more than one-quarter of all injuries among cases younger than 20 (26%, n = 157), with 65 of these cases resulting from motor vehicle collisions.
Figure 4: Causes of Injury, Cases Younger Than Age 20, Ontario, 2009–2010
Note Inclusion criteria for each category can be found in Appendix D.
Source Ontario Trauma Registry, 2009–2010, Canadian Institute for Health Information.
v. For age-specific statistics, please refer to Appendix H, Table 15.

12
Ontario Trauma Registry 2011 Report: Major Injury in Ontario, 2009–2010 Data
4.2.2 Cases Age 20 to 34
Figure 5 illustrates the most common causes of major hospitalized injury among those age 20 to 34 (n = 791). Motor vehicle collisions were responsible for more than half of these cases (53%, n = 422), with 13% of cases (n = 54) being related to sports and recreational activities (Appendix H, Table 21). Injuries purposely inflicted by another person were responsible for 21% of cases (n = 168), while unintentional falls were responsible for 13% (n = 100).
Figure 5: Causes of Injury, Cases Age 20 to 34, Ontario, 2009–2010
Note Inclusion criteria for each category can be found in Appendix D.
Source Ontario Trauma Registry, 2009–2010, Canadian Institute for Health Information.

13
Ontario Trauma Registry 2011 Report: Major Injury in Ontario, 2009–2010 Data
4.2.3 Cases Age 35 to 64
Figure 6 shows the most common causes of major hospitalized injury for cases age 35 to 64 (n = 1,576). Motor vehicle collisions were responsible for almost half of the cases (44%, n = 692), followed by unintentional falls (31%, n = 483).
Figure 6: Causes of Injury, Cases Age 35 to 64, Ontario, 2009–2010
Note Inclusion criteria for each category can be found in Appendix D.
Source Ontario Trauma Registry, 2009–2010, Canadian Institute for Health Information.

14
Ontario Trauma Registry 2011 Report: Major Injury in Ontario, 2009–2010 Data
4.2.4 Cases Age 65 and Older
Figure 7 highlights the most common causes of major hospitalized injury for cases age 65 and older (n = 1,249). Unintentional falls were responsible for the majority of cases (71%, n = 887), followed by motor vehicle collisions (20%, n = 247). Together, these two causes of injury were responsible for 91% (n = 1,134) of the hospitalizations for major injury in this age group.
Figure 7: Causes of Injury, Cases Age 65 and Older, Ontario, 2009–2010
Note Inclusion criteria for each category can be found in Appendix D.
Source Ontario Trauma Registry, 2009–2010, Canadian Institute for Health Information.

15
Ontario Trauma Registry 2011 Report: Major Injury in Ontario, 2009–2010 Data
4.3 Motor Vehicle Collisions
4.3.1 Motor Vehicle Traffic and Non-Traffic Incidents
A motor vehicle is defined within the ICD coding system as any mechanically or electrically powered device not operated on rails upon which any person or property may be transported or drawn upon a highway. Automobiles, buses, construction machinery, farm and industrial machinery, fire engines, motorcycles, motorized bicycles, trolley buses not operating on rails, trucks and vans are all included in this category. A motor vehicle collision (MVC) encompasses motor vehicle traffic incidents (occur on a public highway or roadway), motor vehicle non-traffic incidents (occur entirely in any place other than a public highway) and motor vehicle boarding or alighting incidents.
In the 2009–2010 OTR CDS, MVCs accounted for 1,654 major injury admissions (39% of all cases) and 128 in-hospital deaths (28% of all in-hospital deaths) due to major injury.
Highlighted statistics for all MVC cases (Appendix H, tables 8, 13, 14, 15 and 17) include the following:
• The mean LOS was 16 days (median = 9 days).
• The mean age was 41 (median = 39).
• The mean ISS was 27 (median = 25).
• Almost all MVC injuries (more than 99%, n = 1,645) were documented as blunt injury.
Among all cases of MVC-related deaths
• The mean LOS was 7 days (median = 1 day);
• The mean age was 50 (median = 51);
• The mean ISS was 39 (median = 38); and
• Almost all (more than 99%, n = 158) were documented as blunt injury.
16
Ontario Trauma Registry 2011 Report: Major Injury in Ontario, 2009–2010 Data
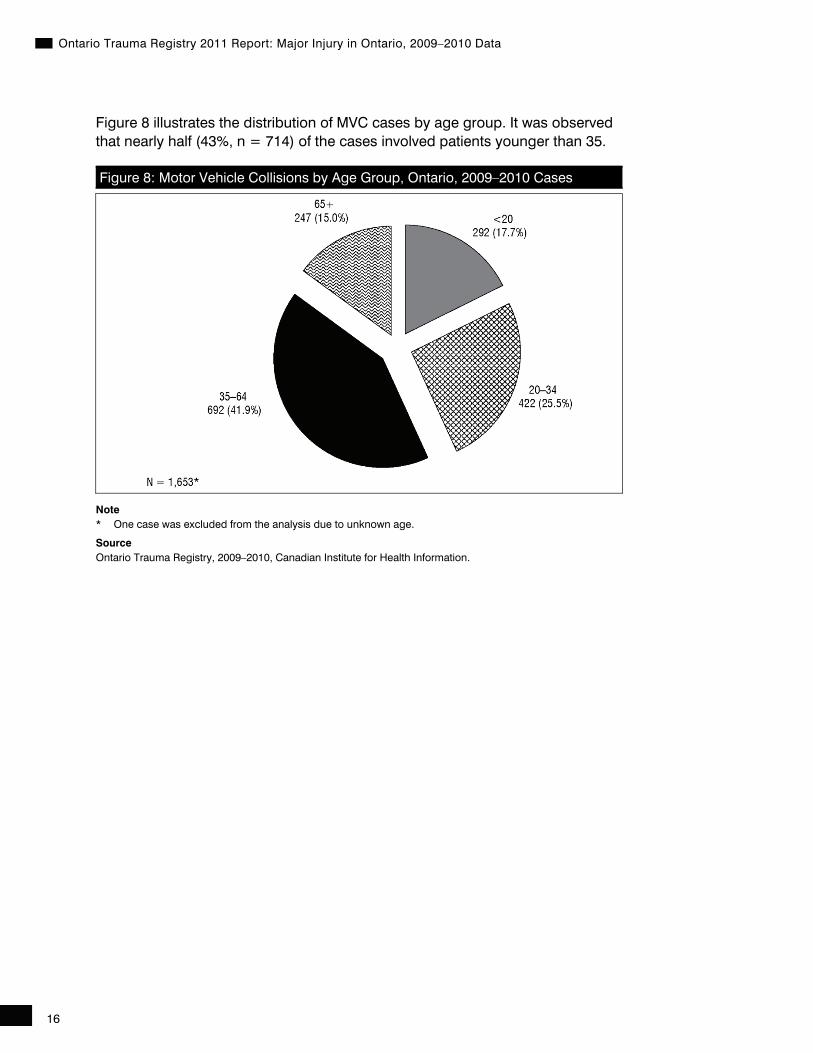
Figure 8 illustrates the distribution of MVC cases by age group. It was observed that nearly half (43%, n = 714) of the cases involved patients younger than 35.
Figure 8: Motor Vehicle Collisions by Age Group, Ontario, 2009–2010 Cases
Note * One case was excluded from the analysis due to unknown age.
Source Ontario Trauma Registry, 2009–2010, Canadian Institute for Health Information.

17
Ontario Trauma Registry 2011 Report: Major Injury in Ontario, 2009–2010 Data
Figure 9 shows that the number of MVC cases in young adult males peaks at around age 20, while a smaller peak is observed among young adult females at around age 19.
Figure 9: Motor Vehicle Collisions by Sex and Single Year of Age, Ontario, 2009–2010 Cases*
Note * One case was excluded due to unknown age.
Source Ontario Trauma Registry, 2009–2010, Canadian Institute for Health Information.
18
Ontario Trauma Registry 2011 Report: Major Injury in Ontario, 2009–2010 Data
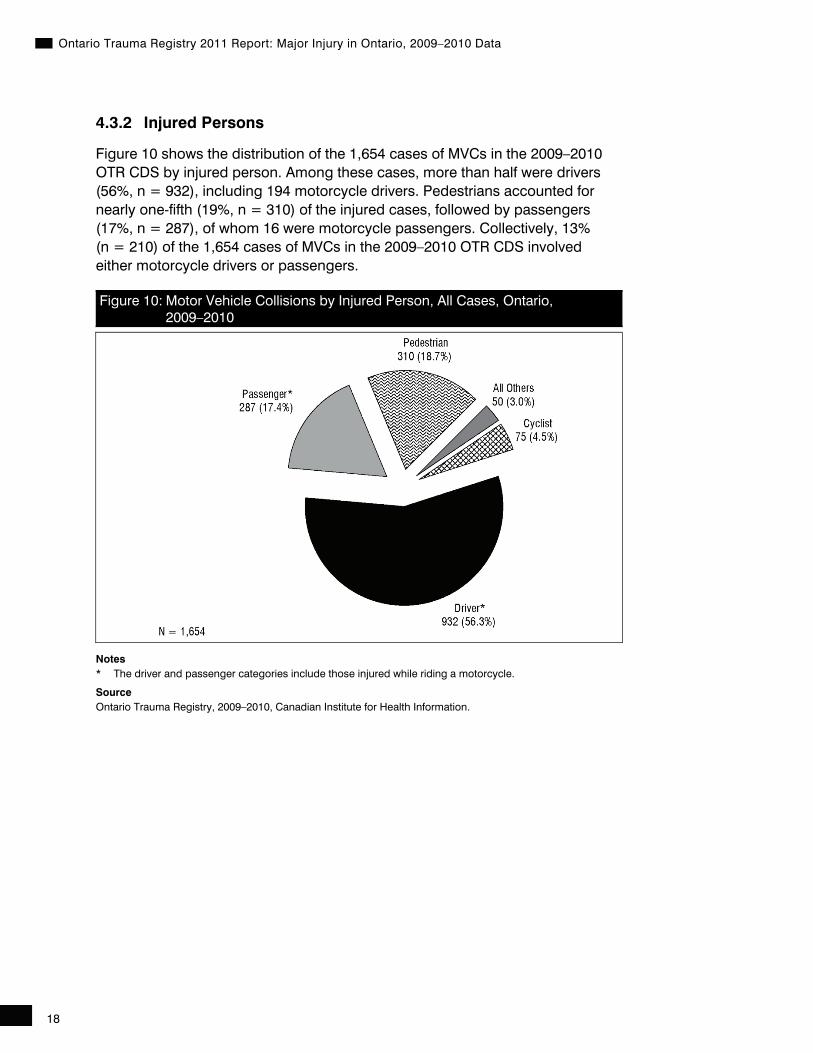
4.3.2 Injured Persons
Figure 10 shows the distribution of the 1,654 cases of MVCs in the 2009–2010 OTR CDS by injured person. Among these cases, more than half were drivers (56%, n = 932), including 194 motorcycle drivers. Pedestrians accounted for nearly one-fifth (19%, n = 310) of the injured cases, followed by passengers (17%, n = 287), of whom 16 were motorcycle passengers. Collectively, 13% (n = 210) of the 1,654 cases of MVCs in the 2009–2010 OTR CDS involved either motorcycle drivers or passengers.
Figure 10: Motor Vehicle Collisions by Injured Person, All Cases, Ontario, 2009–2010
Notes * The driver and passenger categories include those injured while riding a motorcycle.
Source Ontario Trauma Registry, 2009–2010, Canadian Institute for Health Information.
19
Ontario Trauma Registry 2011 Report: Major Injury in Ontario, 2009–2010 Data
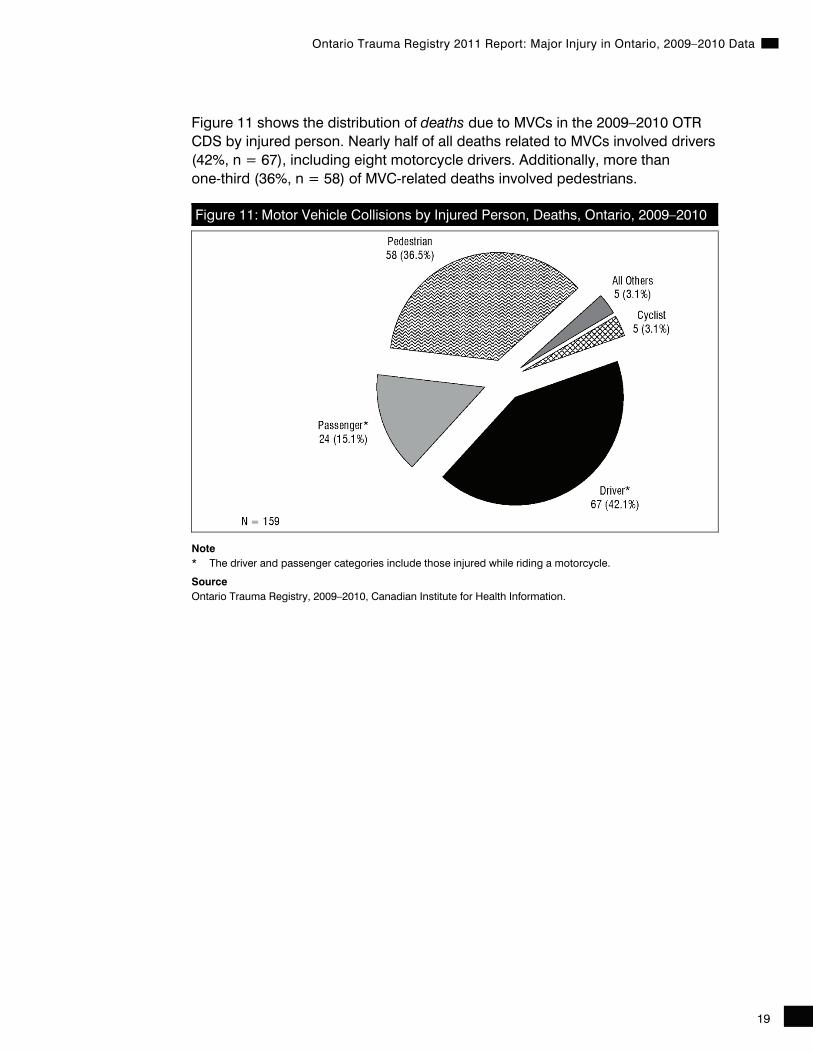
Figure 11 shows the distribution of deaths due to MVCs in the 2009–2010 OTR CDS by injured person. Nearly half of all deaths related to MVCs involved drivers (42%, n = 67), including eight motorcycle drivers. Additionally, more than one-third (36%, n = 58) of MVC-related deaths involved pedestrians.
Figure 11: Motor Vehicle Collisions by Injured Person, Deaths, Ontario, 2009–2010
Note * The driver and passenger categories include those injured while riding a motorcycle.
Source Ontario Trauma Registry, 2009–2010, Canadian Institute for Health Information.

20
Ontario Trauma Registry 2011 Report: Major Injury in Ontario, 2009–2010 Data
Figures 12 and 13 summarize the use of protective devices for MVC occupants, both survivors and non-survivors, in the 2009–2010 OTR CDS. Seatbelt use was documented for less than half of motor vehicle occupants for both survivors (43%, n = 394) and non-survivors (49%, n = 41). For 10% of survivors (n = 94) and 12% of non-survivors (n = 10), protective equipment was noted to be available but not used.
Figure 12: Protective Devices Summary for Motor Vehicle Collisions, Occupant Survivors, Ontario, 2009–2010 Cases*
Notes * Excludes boarding or alighting incidents. † All others includes documented use of other passive restraint devices, helmets, helmets that flew off and other protective devices. ‡ Includes two cases where use of protective devices was not documented.
Source Ontario Trauma Registry, 2009–2010, Canadian Institute for Health Information.

21
Ontario Trauma Registry 2011 Report: Major Injury in Ontario, 2009–2010 Data
Figure 13: Protective Devices Summary for Motor Vehicle Collisions, Occupant Deaths, Ontario, 2009–2010 Cases*
Note * Excludes boarding or alighting incidents. † All others includes documented use of other passive restraint devices, helmets, helmets that flew off and other protective devices. ‡ Includes two cases where use of protective devices was not documented.
Source Ontario Trauma Registry, 2009–2010, Canadian Institute for Health Information.
4.4 Unintentional Falls
In the 2009–2010 OTR CDS, unintentional falls accounted for 38% (n = 1,604) of all cases and 44% (n = 234) of all in-hospital deaths and DIEs.
Selected statistics for all unintentional falls–related cases (Appendix H, tables 8 and 13 to 15) include the following:
• The mean LOS was 14 days (median = 7 days).
• The mean age was 62 (median = 68).
• The mean ISS was 22 (median = 21).
• Almost all (more than 99%, n = 1,601) falls were documented as blunt injury.
• Six percent (n = 97) of all falls were documented as work-related injuries.
22
Ontario Trauma Registry 2011 Report: Major Injury in Ontario, 2009–2010 Data
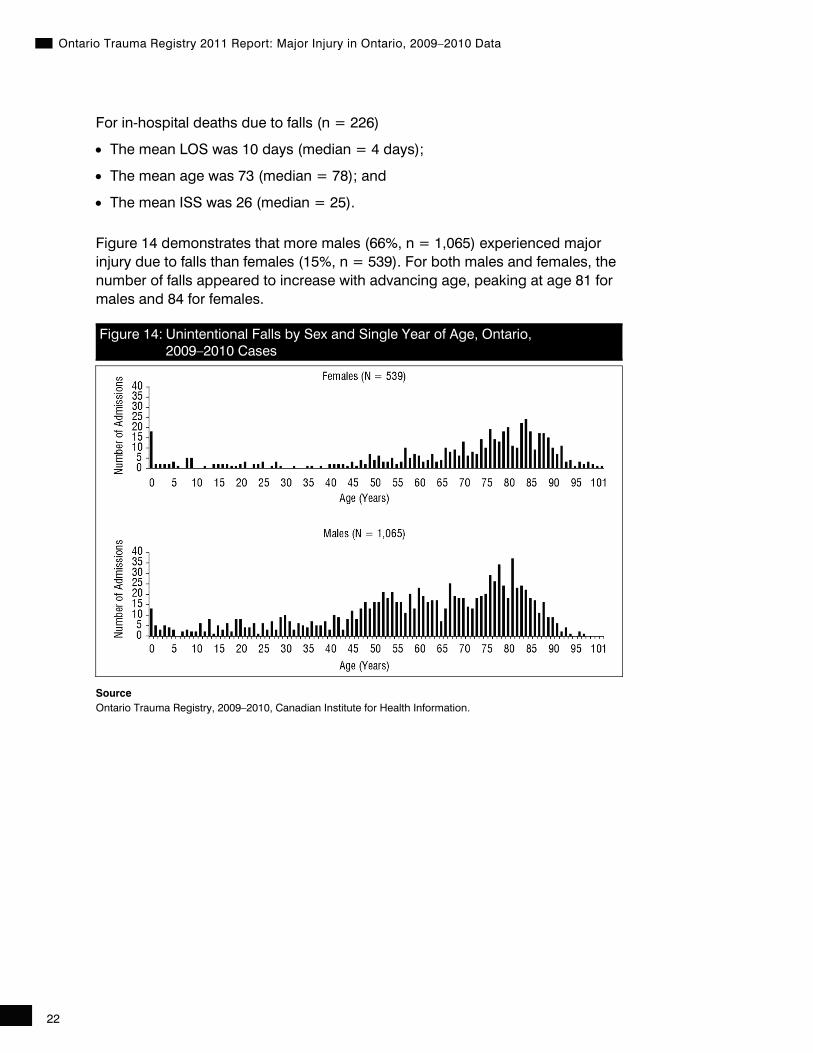
For in-hospital deaths due to falls (n = 226)
• The mean LOS was 10 days (median = 4 days);
• The mean age was 73 (median = 78); and
• The mean ISS was 26 (median = 25).
Figure 14 demonstrates that more males (66%, n = 1,065) experienced major injury due to falls than females (15%, n = 539). For both males and females, the number of falls appeared to increase with advancing age, peaking at age 81 for males and 84 for females.
Figure 14: Unintentional Falls by Sex and Single Year of Age, Ontario, 2009–2010 Cases
Source Ontario Trauma Registry, 2009–2010, Canadian Institute for Health Information.
23
Ontario Trauma Registry 2011 Report: Major Injury in Ontario, 2009–2010 Data
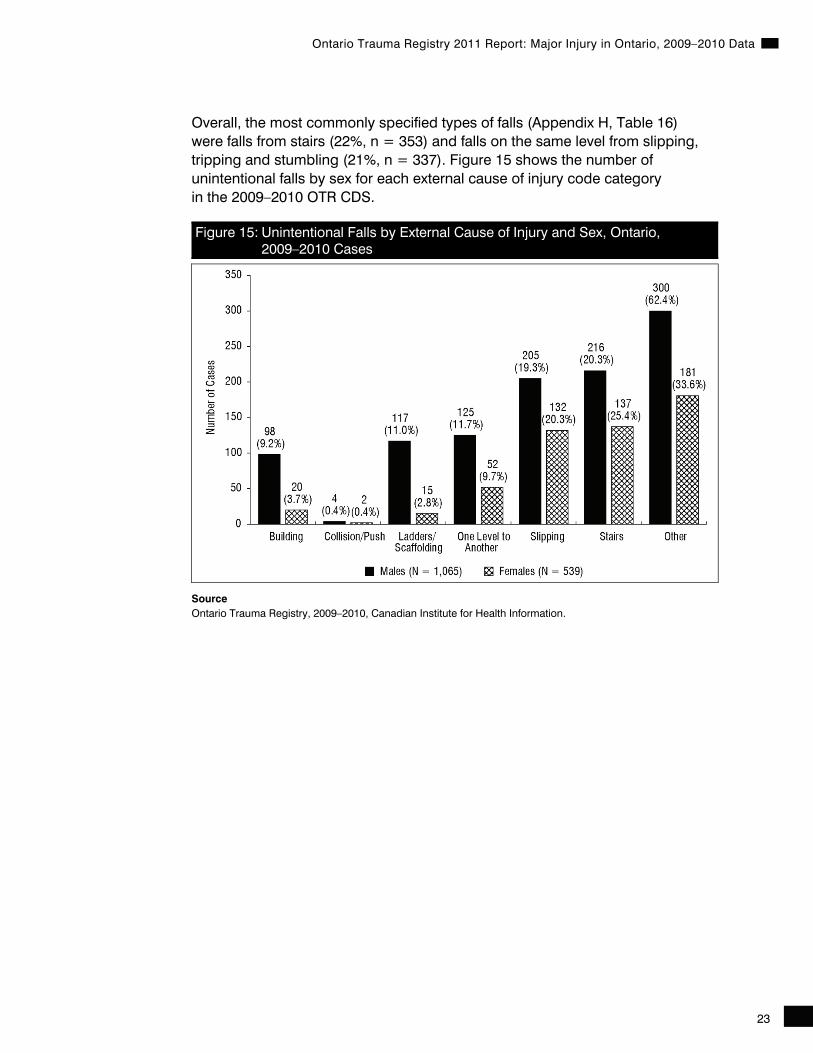
Overall, the most commonly specified types of falls (Appendix H, Table 16) were falls from stairs (22%, n = 353) and falls on the same level from slipping, tripping and stumbling (21%, n = 337). Figure 15 shows the number of unintentional falls by sex for each external cause of injury code category in the 2009–2010 OTR CDS.
Figure 15: Unintentional Falls by External Cause of Injury and Sex, Ontario, 2009–2010 Cases
Source Ontario Trauma Registry, 2009–2010, Canadian Institute for Health Information.
24
Ontario Trauma Registry 2011 Report: Major Injury in Ontario, 2009–2010 Data
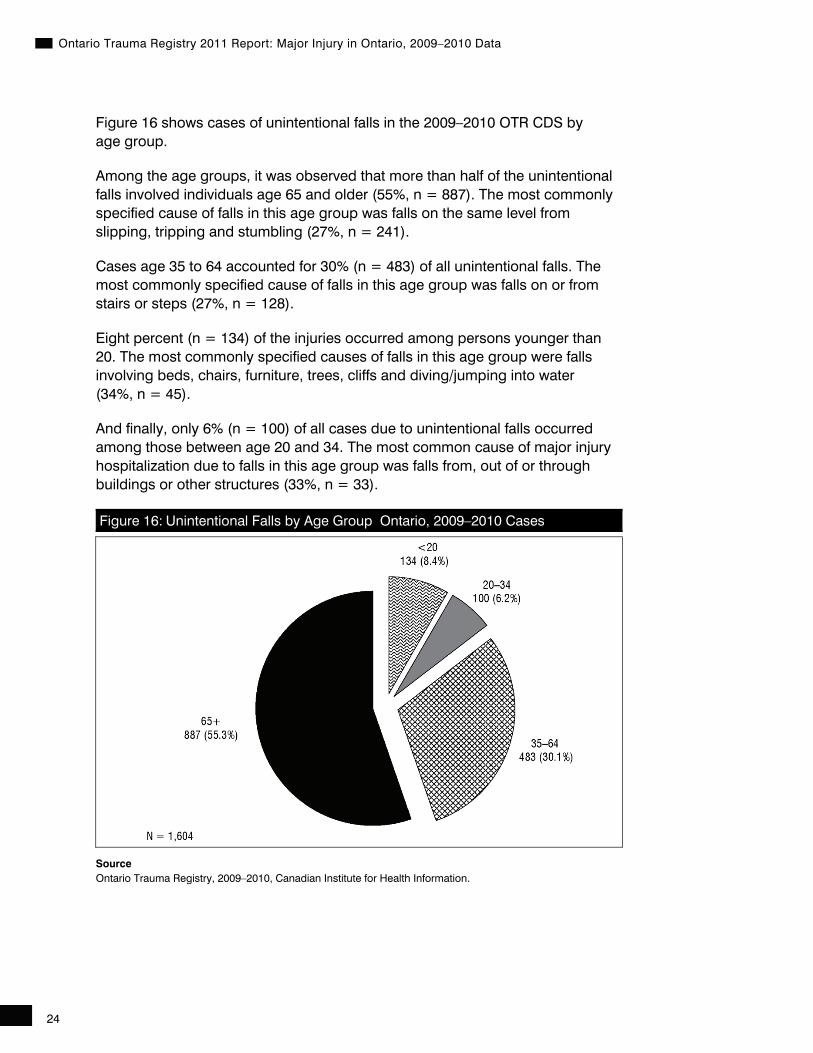
Figure 16 shows cases of unintentional falls in the 2009–2010 OTR CDS by age group.
Among the age groups, it was observed that more than half of the unintentional falls involved individuals age 65 and older (55%, n = 887). The most commonly specified cause of falls in this age group was falls on the same level from slipping, tripping and stumbling (27%, n = 241).
Cases age 35 to 64 accounted for 30% (n = 483) of all unintentional falls. The most commonly specified cause of falls in this age group was falls on or from stairs or steps (27%, n = 128).
Eight percent (n = 134) of the injuries occurred among persons younger than 20. The most commonly specified causes of falls in this age group were falls involving beds, chairs, furniture, trees, cliffs and diving/jumping into water (34%, n = 45).
And finally, only 6% (n = 100) of all cases due to unintentional falls occurred among those between age 20 and 34. The most common cause of major injury hospitalization due to falls in this age group was falls from, out of or through buildings or other structures (33%, n = 33).
Figure 16: Unintentional Falls by Age Group, Ontario, 2009–2010 Cases
Source Ontario Trauma Registry, 2009–2010, Canadian Institute for Health Information.

25
Ontario Trauma Registry 2011 Report: Major Injury in Ontario, 2009–2010 Data
4.5 Intentional Injuries
4.5.1 Suicide and Self-Inflicted Injury (Excluding Poisoning)
There were 89 cases admitted to lead trauma hospitals due to suicide and self-inflicted injury (excluding poisoning) in the 2009–2010 OTR CDS, accounting for 2% of all cases and 5% (n = 25) of all injury deaths. Selected statistics for suicide and self-inflicted injuries (Appendix H, tables 8 and 13 to 15) include the following:
• The mean LOS was 21 days (median = 10 days).
• The mean age was 46 (median = 44).
• The mean ISS was 26 (median = 25).
• Fifty-nine of the admitted cases were male (66%).
Figure 17 shows self-inflicted injury cases according to age group in the 2009–2010 OTR CDS. The largest proportion of cases occurred among those age 35 to 64 (52%, n = 46) and those age 20 to 34 (24%, n = 21).
Figure 17: Suicides and Self-Inflicted Injuries (Excluding Poisoning*) by Age Group, Ontario, 2009–2010 Cases
Note * Poisoning, as defined by ICD-10-CA external cause codes X70 to X84, was excluded.
Source Ontario Trauma Registry, 2009–2010, Canadian Institute for Health Information.

26
Ontario Trauma Registry 2011 Report: Major Injury in Ontario, 2009–2010 Data
As seen in Figure 18, the most commonly specified means/method of self-inflicted injury (excluding poisoning) was jumping (32%, n = 28), followed by stabbing (19%, n = 17) and gunshot wounds (17%, n = 15).
Figure 18: Means/Methods of Suicide and Self-Inflicted Injury (Excluding Poisoning*), Ontario, 2009–2010 Cases
Notes * Poisoning, as defined by ICD-10-CA external cause codes X70 to X84, was excluded. Inclusion criteria for each method of suicide and self-inflicted injury can be found in Appendix B.
Source Ontario Trauma Registry, 2009–2010, Canadian Institute for Health Information.
27
Ontario Trauma Registry 2011 Report: Major Injury in Ontario, 2009–2010 Data
4.5.2 Assault and Injury Purposely Inflicted by Another Person
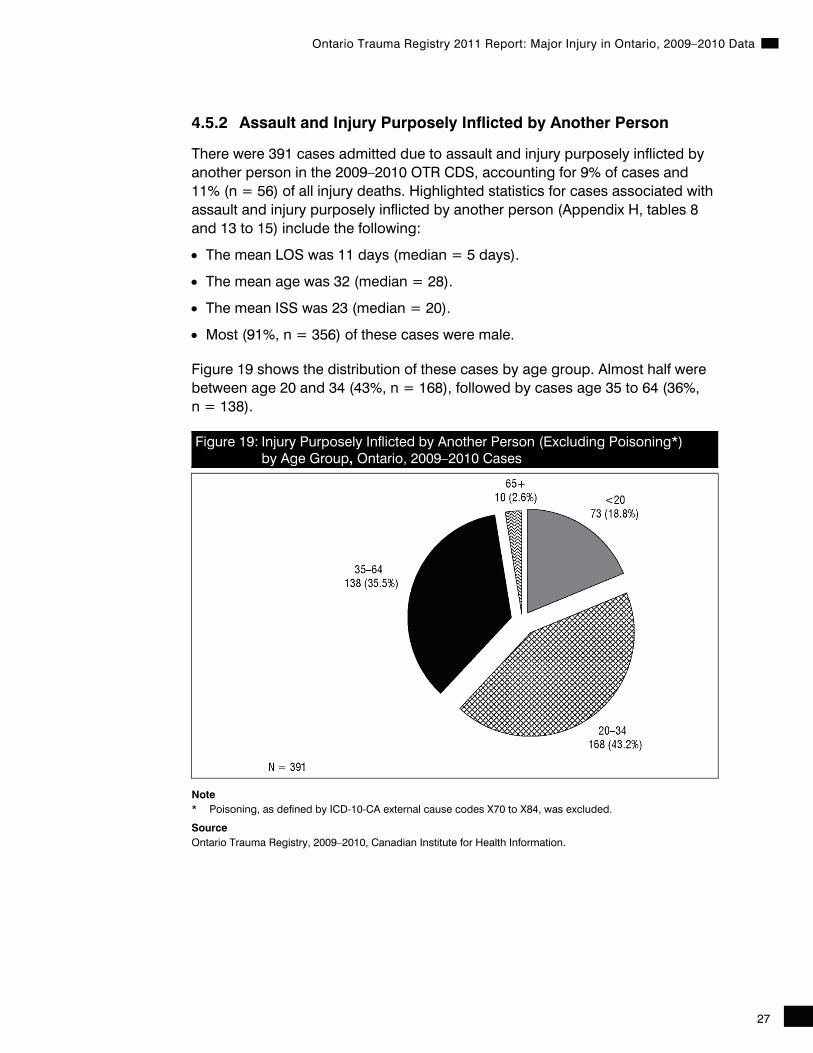
There were 391 cases admitted due to assault and injury purposely inflicted by another person in the 2009–2010 OTR CDS, accounting for 9% of cases and 11% (n = 56) of all injury deaths. Highlighted statistics for cases associated with assault and injury purposely inflicted by another person (Appendix H, tables 8 and 13 to 15) include the following:
• The mean LOS was 11 days (median = 5 days).
• The mean age was 32 (median = 28).
• The mean ISS was 23 (median = 20).
• Most (91%, n = 356) of these cases were male.
Figure 19 shows the distribution of these cases by age group. Almost half were between age 20 and 34 (43%, n = 168), followed by cases age 35 to 64 (36%, n = 138).
Figure 19: Injury Purposely Inflicted by Another Person (Excluding Poisoning*) by Age Group, Ontario, 2009–2010 Cases
Note * Poisoning, as defined by ICD-10-CA external cause codes X70 to X84, was excluded.
Source Ontario Trauma Registry, 2009–2010, Canadian Institute for Health Information.

28
Ontario Trauma Registry 2011 Report: Major Injury in Ontario, 2009–2010 Data
Figure 20 shows that the most commonly specified means/method of injury purposely inflicted by another person was fighting (29%, n = 113), followed by stabbing (27%, n = 105) and gunshot wounds (18%, n = 70).
Figure 20: Means/Methods of Injury Purposely Inflicted by Another Person (Excluding Poisoning*), Ontario, 2009–2010 Cases
Notes * Poisoning, as defined by ICD-10-CA external cause codes X70 to X84, was excluded. Inclusion criteria for each method of assault can be found in Appendix B.
Source Ontario Trauma Registry, 2009–2010, Canadian Institute for Health Information.
4.6 Cycling Injuries
Injuries due to cycling are defined using appropriate ICD-10-CA external cause of injury codes when the injured person is identified as a cyclist; this includes incidents involving motor vehicles and other road vehicles and railway incidents. Highlighted statistics for cycling injuries (Appendix H, tables 13 to 15) include the following:
• There were 150 cycling injuries (representing 4% of all cases).
• There were 9 deaths (2% of all deaths).
• The mean age was 41.
• The mean ISS was 23.
• The mean LOS was 13 days.

29
Ontario Trauma Registry 2011 Report: Major Injury in Ontario, 2009–2010 Data
4.7 Other Causes of Injury
In this report, 497 (12%) injury cases were reported as due to all causes other than MVCs, unintentional falls and intentional injuries. All other causes accounted for 58 deaths (11%) (Appendix H, Table 13). All other causes included injuries due to railway incidents, other road vehicles, water transport, air and space transport, vehicle incidents not elsewhere classified, fire and flames, natural and environmental factors, drowning, suffocation, foreign bodies (excluding choking), injuries due to legal intervention, injuries in which the intentionality is undetermined and injuries due to operations of war.
5 Context of Injury
5.1 Place of Injury
Place of injury is documented in the OTR CDS based on ICD definitions. As seen in Table 7 of Appendix H, 4,212 cases (more than 99%) were documented with a place of injury:
• Almost half (42%, n = 1,760) indicated a street or highway; and
• More than one-quarter (27%, n = 1,139) indicated home as the place of injury.
However, 23 cases (less than 1%) did not have a place of injury documented in the 2009–2010 OTR CDS.
5.2 Work-Related Injury
Work-related injuries accounted for 235 (6%) cases. Among these cases
• The mean ISS was 24;
• The mean age was 45;
• The mean LOS in hospital was 16 days;
• Most (91%, n = 214) were male; and
• Almost half (41%, n = 97) were the result of unintentional falls.

30
Ontario Trauma Registry 2011 Report: Major Injury in Ontario, 2009–2010 Data
5.3 Sports and Recreational Injury
The OTR CDS permits the documentation of whether the injured person was involved in a sports or recreational activity at the time of injury; it also allows for the specification of the type of activity. Currently, the sports and recreation code in the OTR CDS distinguishes 99 types of sports and recreational activities.
Nine percent (n = 399) of injuries were due to participation in sports and recreational activities as defined by the customized sports and recreational activity codes in the OTR CDS. The most common sports and recreational injuries documented in the 2009–2010 OTR CDS, as highlighted in Table 1, were related to cycling (23%, n = 90), using all-terrain vehicles (20%, n = 79), skiing (10%, n = 39), dirt biking/mini-biking/ motocross (9%, n = 36) and horseback riding (6%, n = 22).
Appendix H, tables 19 to 23 provide further information about the context of sports and recreational injuries and external causes of injury.
Table 1: Summary Statistics for Sports and Recreational Injury Activities, Ontario, 2009–2010 Cases
Activity Cases n (%*)
Mean Males n (%†)
In-Hospital Deaths n (%†)
DIEs n (%†) Age
(Years) ISS
LOS (Days)
Cycling 90 (23) 37 22 13 79 (88) 5 (6) 0 (0)
Using All-Terrain Vehicle
79 (20) 33 25 12 66 (84) 1 (1) 1 (1)
Skiing 39 (10) 33 25 12 35 (90) 1 (3) 0 (0)
Dirt Biking/Mini-Biking/ Motocross
36 (9) 27 24 9 34 (94) 1 (3) 0 (0)
Horseback Riding 22 (6) 35 24 8 9 (41) 2 (9) 0 (0)
All Sports/Recreation 399 31 23 12 323 (81) 16 (4) 3 (0.8)
Notes * Percentage of all sports and recreational injuries (n = 399). † Percentage within cause of sport and recreational injury. ISS: Injury Severity Score. LOS: length of stay. DIEs: patients who died in the emergency department.
Source Ontario Trauma Registry, 2009–2010, Canadian Institute for Health Information.
31
Ontario Trauma Registry 2011 Report: Major Injury in Ontario, 2009–2010 Data
5.4 Blood Alcohol Concentration
The TRAC recommended that BAC be routinely collected at lead trauma hospitals on all trauma patients older than age 10 when the patient is admitted within 12 hours of the incident. BAC greater than or equal to 0.08% (17.4 mmol/L) is identified as having a positive BAC, reflecting the legal positive blood alcohol limit for drivers.
In the OTR CDS 2009–2010, more than half of the cases (53%, n = 2,265) were tested for BAC. The remaining 47% comprised either cases with unknown BAC (n = 1,670, 39.4%) or cases where BAC testing was deemed inappropriate (n = 300, 7.1%). Of those who were tested, 685 (30%) had a BAC greater than zero, while 543 (24%) were observed to have a positive BAC. Among the positive BAC cases, 46% (n = 248) were admitted due to MVCs, 26% (n = 146) were admitted due to unintentional falls and 23% (n = 123) were admitted for injury purposely inflicted by another person.
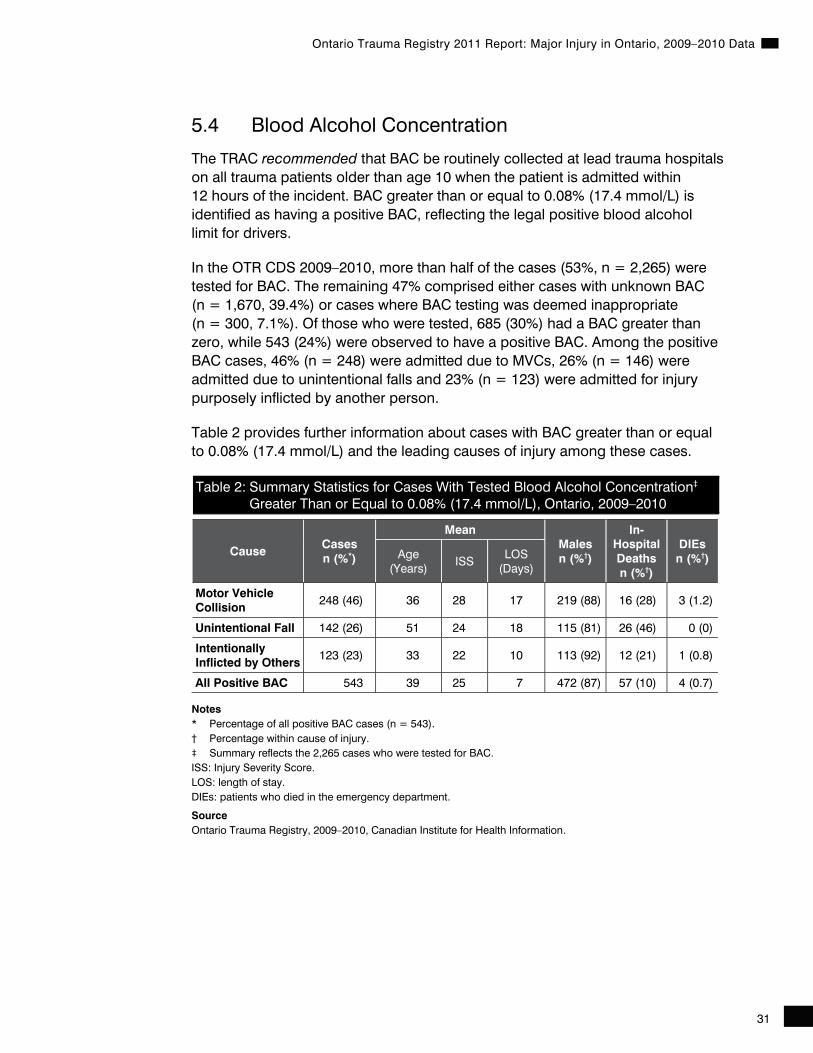
Table 2 provides further information about cases with BAC greater than or equal to 0.08% (17.4 mmol/L) and the leading causes of injury among these cases.
Table 2: Summary Statistics for Cases With Tested Blood Alcohol Concentration‡ Greater Than or Equal to 0.08% (17.4 mmol/L), Ontario, 2009–2010
Cause Cases n (%*)
Mean Males n (%†)
In-Hospital Deaths n (%†)
DIEs n (%†) Age
(Years) ISS
LOS (Days)
Motor Vehicle Collision
248 (46) 36 28 17 219 (88) 16 (28) 3 (1.2)
Unintentional Fall 142 (26) 51 24 18 115 (81) 26 (46) 0 (0)
Intentionally Inflicted by Others
123 (23) 33 22 10 113 (92) 12 (21) 1 (0.8)
All Positive BAC 543 39 25 7 472 (87) 57 (10) 4 (0.7)
Notes * Percentage of all positive BAC cases (n = 543). † Percentage within cause of injury. ‡ Summary reflects the 2,265 cases who were tested for BAC. ISS: Injury Severity Score. LOS: length of stay. DIEs: patients who died in the emergency department.
Source Ontario Trauma Registry, 2009–2010, Canadian Institute for Health Information.

32
Ontario Trauma Registry 2011 Report: Major Injury in Ontario, 2009–2010 Data
6 Clinical Aspects of Injury
6.1 Type of Injury
As highlighted in Appendix H, Table 1, the most common type of injury was due to blunt trauma (93%, n = 3,917), followed by penetrating injury (5%, n = 230) and burns (2%, n = 88).
6.2 Pre-Hospital Care
Collector was customized to include several data elements to describe the patient’s care at the scene and en route to hospital. Included in pre-hospital care data elements are mode of transport information, vital signs and non-operative procedures at the scene.
As seen in Table 9 of Appendix H
• Thirteen percent of applicable cases (n = 529) required extrication from the scene (extrication is documented if the patient was trapped and required release from the scene of the incident; examples include extrication from motor vehicles, dwellings on fire and falls);
• The mean scene time (time between ambulance arrival at and departure from the scene) was 19 minutes (median = 17); and
• The mean pre-hospital time (time between initial moment of incident and the ambulance arrival time at the first hospital) was 78 minutes (median = 52).

33
Ontario Trauma Registry 2011 Report: Major Injury in Ontario, 2009–2010 Data
6.3 Discharge Disposition
Figure 21 shows the discharge disposition of all cases. In the 2009–2010 OTR CDS, 13% (n = 532) of the 4,235 cases died.
Figure 21: Discharge Disposition, All Cases, Ontario, 2009–2010
Source Ontario Trauma Registry, 2009–2010, Canadian Institute for Health Information.
34
Ontario Trauma Registry 2011 Report: Major Injury in Ontario, 2009–2010 Data
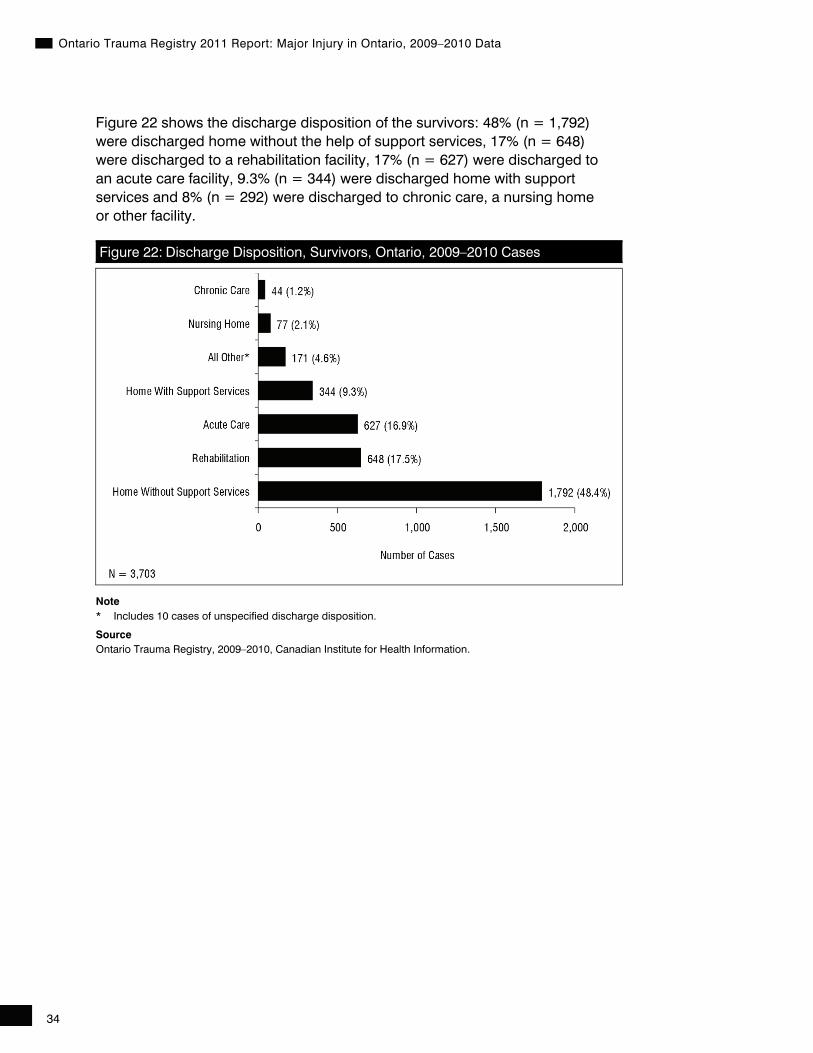
Figure 22 shows the discharge disposition of the survivors: 48% (n = 1,792) were discharged home without the help of support services, 17% (n = 648) were discharged to a rehabilitation facility, 17% (n = 627) were discharged to an acute care facility, 9.3% (n = 344) were discharged home with support services and 8% (n = 292) were discharged to chronic care, a nursing home or other facility.
Figure 22: Discharge Disposition, Survivors, Ontario, 2009–2010 Cases
Note * Includes 10 cases of unspecified discharge disposition.
Source Ontario Trauma Registry, 2009–2010, Canadian Institute for Health Information.

35
Ontario Trauma Registry 2011 Report: Major Injury in Ontario, 2009–2010 Data
6.4 Deaths
6.4.1 All Cases
In the 2009–2010 OTR CDS, there were 532 deaths (12% of all cases).vi These deaths included 455 in-hospital deaths (11% of all cases) and 74 DIEs (2% of all cases).
Highlighted statistics for all deaths (Appendix H, tables 11 and 13) include the following:
• The mean LOS was 9 days (median = 2 days).
• The mean age was 58 (median = 64).
• The mean ISS was 31 (median = 25).
• Among all death cases, 71% (n = 378) were male.
• Blunt injury was the primary injury type in 87% (n = 464) of deaths, while 9% (n = 49) had a penetrating injury and 4% (n = 19) had a burn injury.
• Cases involving death accounted for 7% of total hospital days (4,016 days).
• Organs were donated by 15% (n = 82) of the cases who died as a result of their injury.
vi. Three cases were observed to have unknown time of death. While these cases were included in the overall
analyses, they were not captured within the in-hospital death or DIE records.
36
Ontario Trauma Registry 2011 Report: Major Injury in Ontario, 2009–2010 Data
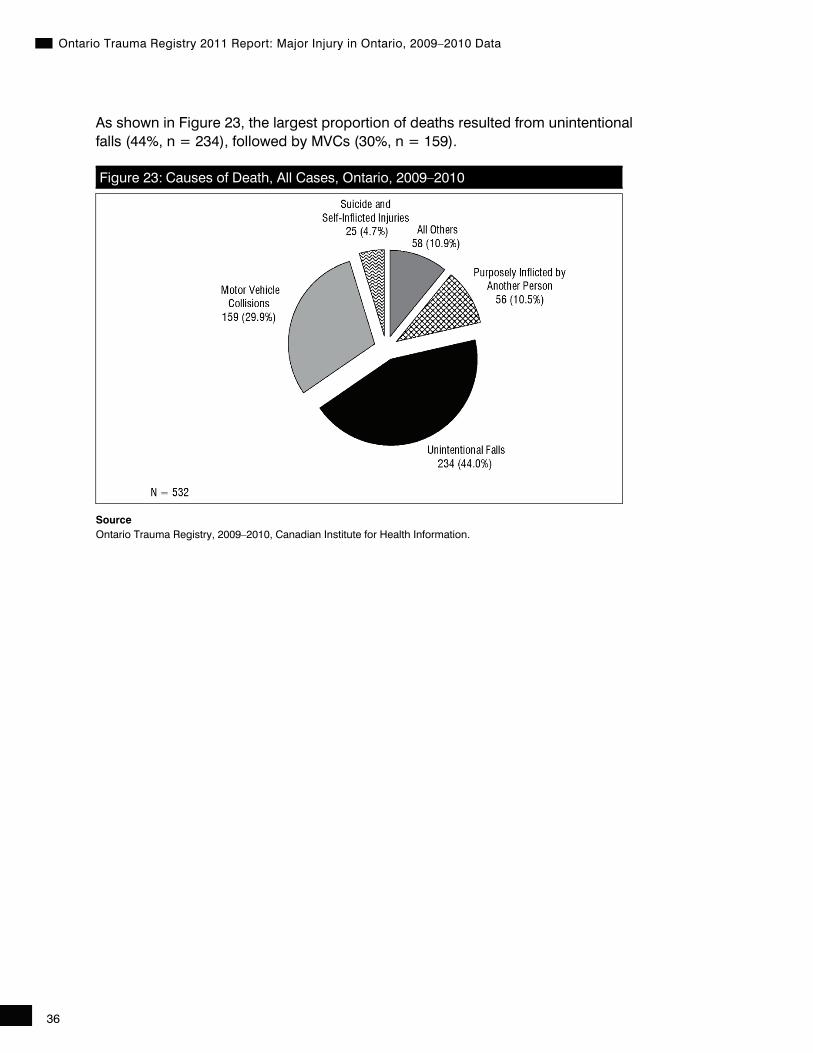
As shown in Figure 23, the largest proportion of deaths resulted from unintentional falls (44%, n = 234), followed by MVCs (30%, n = 159).
Figure 23: Causes of Death, All Cases, Ontario, 2009–2010
Source Ontario Trauma Registry, 2009–2010, Canadian Institute for Health Information.

37
Ontario Trauma Registry 2011 Report: Major Injury in Ontario, 2009–2010 Data
Figure 24 shows the causes of injury for cases who died compared with those who survived, as documented in the 2009–2010 OTR CDS.
Figure 24: All Cases by Outcome and Cause of Injury, Ontario, 2009–2010
Notes * Intentional injuries includes cases of suicide and self-inflicted injury as well as injuries purposely inflicted by another and assault cases. Inclusion criteria for each category can be found in Appendix D.
Source Ontario Trauma Registry, 2009–2010, Canadian Institute for Health Information.
6.4.2 In-Hospital Deaths
In the 2009–2010 OTR CDS, 455 in-hospital deaths were documented. In total, these cases were responsible for 4,016 hospital days (7% of total days). The mean LOS was 9 days (median = 2 days), the mean age was 60 (median = 67) and the mean ISS was 31 (median = 25). More than two-thirds of the in-hospital deaths were male (71%, n = 322).
6.4.3 Died in Emergency
In the 2009–2010 OTR CDS, there were 74 DIEs. Among these cases
• The mean ISS was 34;
• The mean age was 43; and
• Almost three-quarters (72%, n = 53) were male.
38
Ontario Trauma Registry 2011 Report: Major Injury in Ontario, 2009–2010 Data
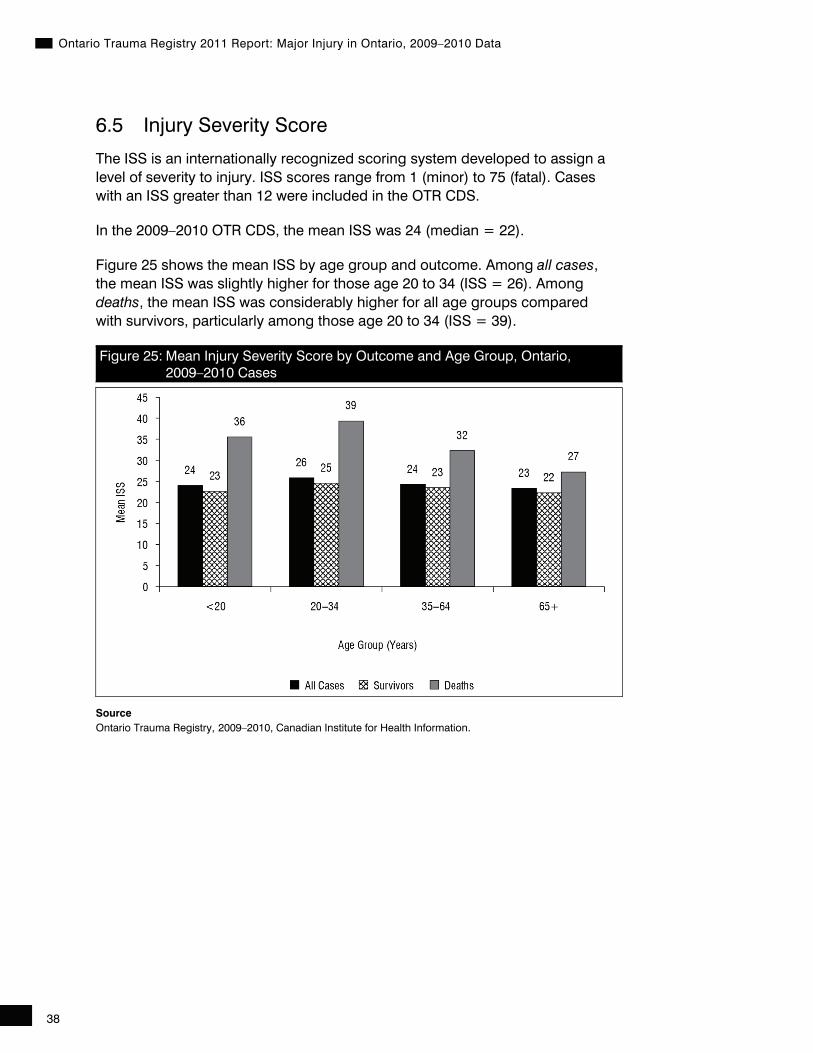
6.5 Injury Severity Score
The ISS is an internationally recognized scoring system developed to assign a level of severity to injury. ISS scores range from 1 (minor) to 75 (fatal). Cases with an ISS greater than 12 were included in the OTR CDS.
In the 2009–2010 OTR CDS, the mean ISS was 24 (median = 22).
Figure 25 shows the mean ISS by age group and outcome. Among all cases, the mean ISS was slightly higher for those age 20 to 34 (ISS = 26). Among deaths, the mean ISS was considerably higher for all age groups compared with survivors, particularly among those age 20 to 34 (ISS = 39).
Figure 25: Mean Injury Severity Score by Outcome and Age Group, Ontario, 2009–2010 Cases
Source Ontario Trauma Registry, 2009–2010, Canadian Institute for Health Information.

39
Ontario Trauma Registry 2011 Report: Major Injury in Ontario, 2009–2010 Data
Figure 26 shows the mean ISS by outcome and cause of injury. Among all cases, survivors and deaths, the highest mean ISS was for MVCs (ISS = 27, 26 and 39, respectively).
Figure 26: Mean Injury Severity Score by Outcome and Cause of Injury, Ontario, 2009–2010 Cases
Notes * Intentional injuries includes cases of suicide and self-inflicted injury as well as injuries purposely inflicted by another and assault cases. Inclusion criteria for each category can be found in Appendix D.
Source Ontario Trauma Registry, 2009–2010, Canadian Institute for Health Information.

40
Ontario Trauma Registry 2011 Report: Major Injury in Ontario, 2009–2010 Data
Figure 27 shows the mean ISS by outcome and type of injury. Among all cases, survivors and deaths, the highest mean ISS was found among cases with burn injuries (ISS = 26, 23 and 38, respectively).
Figure 27: Mean Injury Severity Score by Outcome and Type of Injury, Ontario, 2009–2010 Cases
Source Ontario Trauma Registry, 2009–2010, Canadian Institute for Health Information.
41
Ontario Trauma Registry 2011 Report: Major Injury in Ontario, 2009–2010 Data
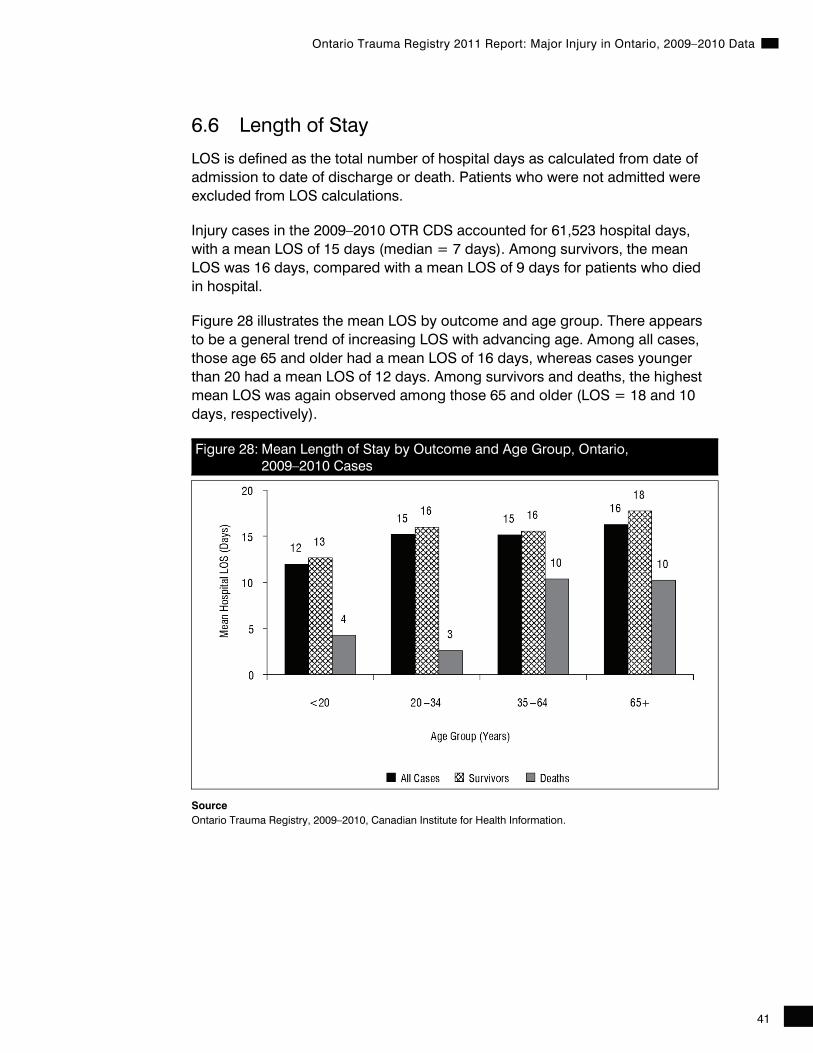
6.6 Length of Stay
LOS is defined as the total number of hospital days as calculated from date of admission to date of discharge or death. Patients who were not admitted were excluded from LOS calculations.
Injury cases in the 2009–2010 OTR CDS accounted for 61,523 hospital days, with a mean LOS of 15 days (median = 7 days). Among survivors, the mean LOS was 16 days, compared with a mean LOS of 9 days for patients who died in hospital.
Figure 28 illustrates the mean LOS by outcome and age group. There appears to be a general trend of increasing LOS with advancing age. Among all cases, those age 65 and older had a mean LOS of 16 days, whereas cases younger than 20 had a mean LOS of 12 days. Among survivors and deaths, the highest mean LOS was again observed among those 65 and older (LOS = 18 and 10 days, respectively).
Figure 28: Mean Length of Stay by Outcome and Age Group, Ontario, 2009–2010 Cases
Source Ontario Trauma Registry, 2009–2010, Canadian Institute for Health Information.
42
Ontario Trauma Registry 2011 Report: Major Injury in Ontario, 2009–2010 Data
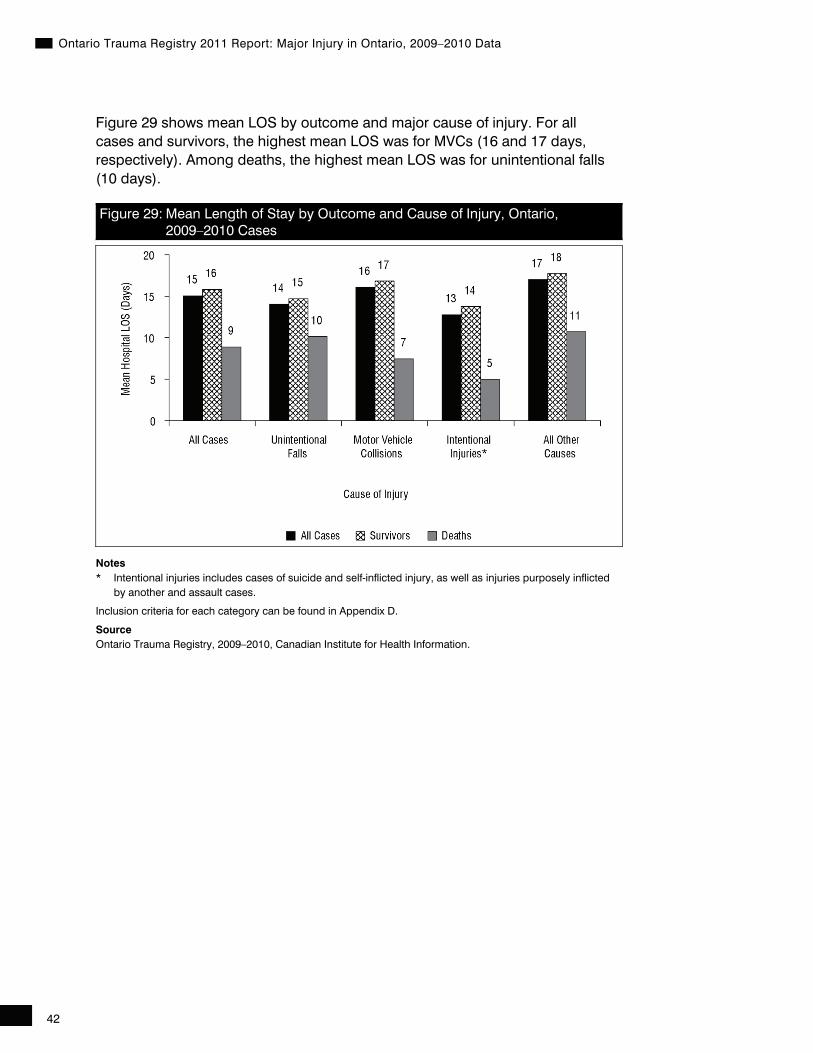
Figure 29 shows mean LOS by outcome and major cause of injury. For all cases and survivors, the highest mean LOS was for MVCs (16 and 17 days, respectively). Among deaths, the highest mean LOS was for unintentional falls (10 days).
Figure 29: Mean Length of Stay by Outcome and Cause of Injury, Ontario, 2009–2010 Cases
Notes * Intentional injuries includes cases of suicide and self-inflicted injury, as well as injuries purposely inflicted by another and assault cases.
Inclusion criteria for each category can be found in Appendix D.
Source Ontario Trauma Registry, 2009–2010, Canadian Institute for Health Information.
43
Ontario Trauma Registry 2011 Report: Major Injury in Ontario, 2009–2010 Data
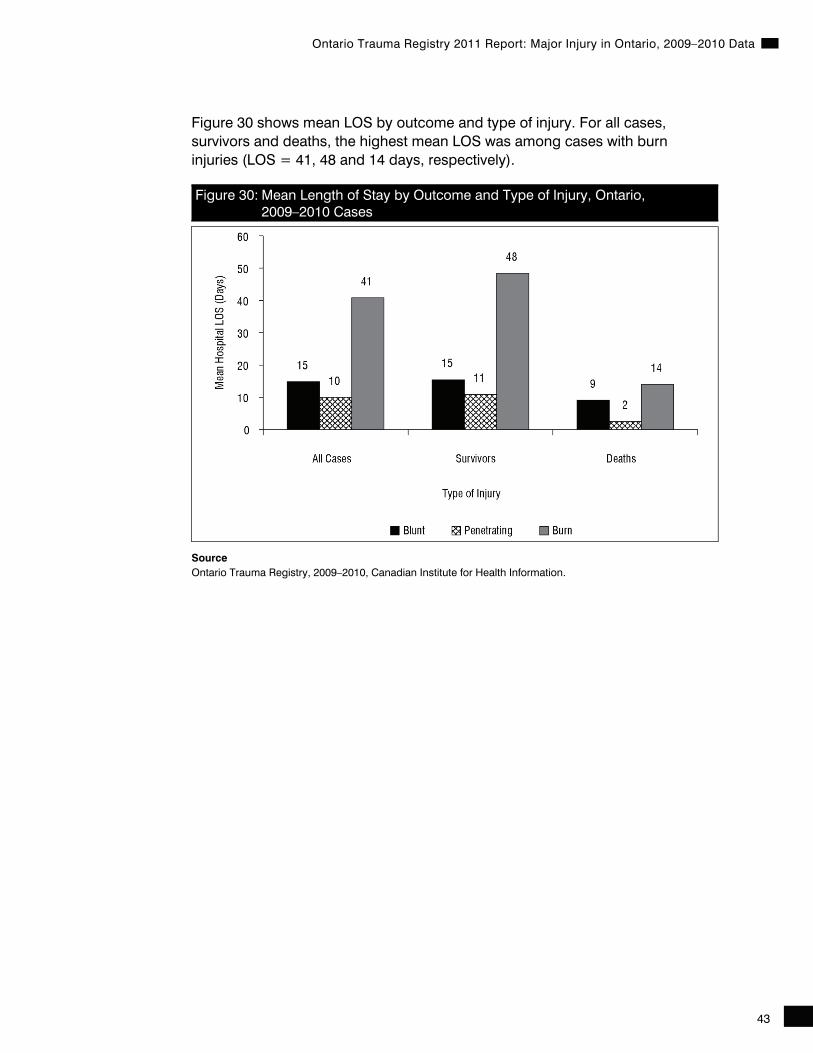
Figure 30 shows mean LOS by outcome and type of injury. For all cases, survivors and deaths, the highest mean LOS was among cases with burn injuries (LOS = 41, 48 and 14 days, respectively).
Figure 30: Mean Length of Stay by Outcome and Type of Injury, Ontario, 2009–2010 Cases
Source Ontario Trauma Registry, 2009–2010, Canadian Institute for Health Information.
44
Ontario Trauma Registry 2011 Report: Major Injury in Ontario, 2009–2010 Data
6.7 Special Care Units
For the purposes of the OTR CDS, special care units (SCUs) include intensive care and observation units with a normal patient-to-nurse ratio of at least 2:1.
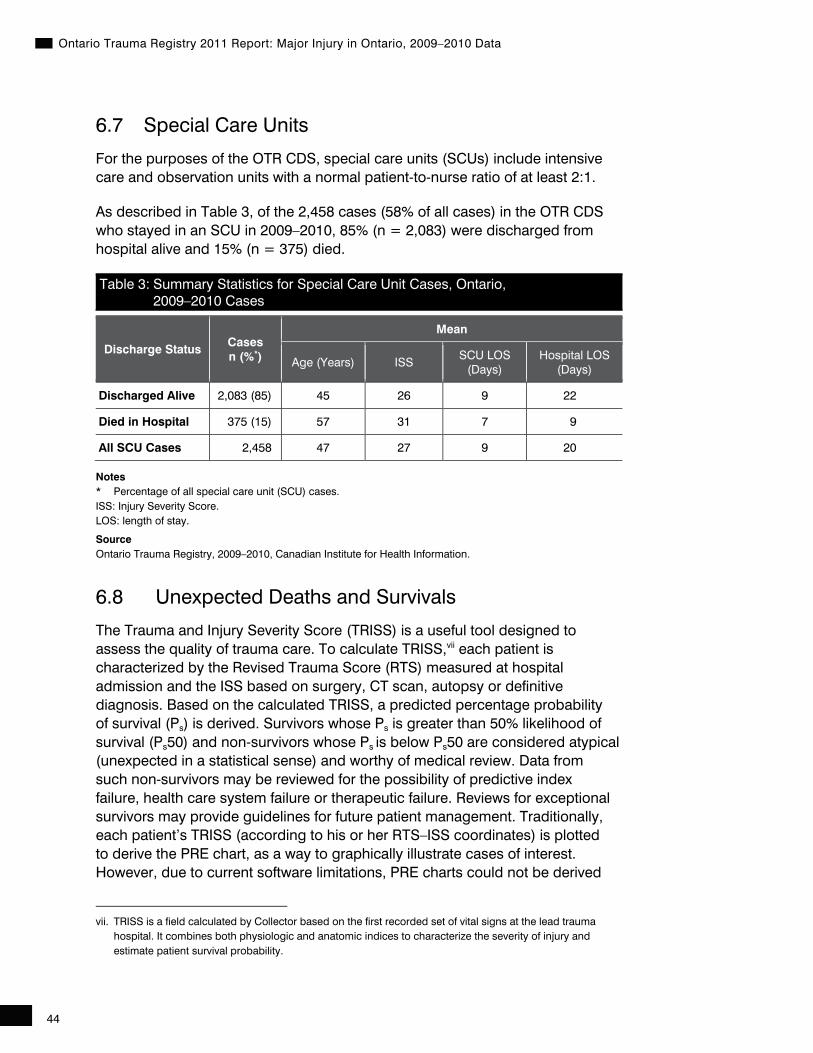
As described in Table 3, of the 2,458 cases (58% of all cases) in the OTR CDS who stayed in an SCU in 2009–2010, 85% (n = 2,083) were discharged from hospital alive and 15% (n = 375) died.
Table 3: Summary Statistics for Special Care Unit Cases, Ontario, 2009–2010 Cases
Discharge Status Cases n (%*)
Mean
Age (Years) ISS SCU LOS
(Days) Hospital LOS
(Days)
Discharged Alive 2,083 (85) 45 26 9 22
Died in Hospital 375 (15) 57 31 7 9
All SCU Cases 2,458 47 27 9 20
Notes * Percentage of all special care unit (SCU) cases. ISS: Injury Severity Score. LOS: length of stay.
Source Ontario Trauma Registry, 2009–2010, Canadian Institute for Health Information.
6.8 Unexpected Deaths and Survivals
The Trauma and Injury Severity Score (TRISS) is a useful tool designed to assess the quality of trauma care. To calculate TRISS,vii each patient is characterized by the Revised Trauma Score (RTS) measured at hospital admission and the ISS based on surgery, CT scan, autopsy or definitive diagnosis. Based on the calculated TRISS, a predicted percentage probability of survival (Ps) is derived. Survivors whose Ps is greater than 50% likelihood of survival (Ps50) and non-survivors whose Ps is below Ps50 are considered atypical (unexpected in a statistical sense) and worthy of medical review. Data from such non-survivors may be reviewed for the possibility of predictive index failure, health care system failure or therapeutic failure. Reviews for exceptional survivors may provide guidelines for future patient management. Traditionally, each patient’s TRISS (according to his or her RTS–ISS coordinates) is plotted to derive the PRE chart, as a way to graphically illustrate cases of interest. However, due to current software limitations, PRE charts could not be derived
vii. TRISS is a field calculated by Collector based on the first recorded set of vital signs at the lead trauma
hospital. It combines both physiologic and anatomic indices to characterize the severity of injury and estimate patient survival probability.
45
Ontario Trauma Registry 2011 Report: Major Injury in Ontario, 2009–2010 Data
as with previous OTR CDS annual reports. Cases of unexpected outcomes as defined by TRISS analyses were, however, provided to allow for continued trend analysis.
Appendix G shows cases of unexpected outcomes as defined by TRISS analyses for adult patients age 15 to 54 and age 55 and older for blunt and penetrating wounds in addition to cases among pediatric patients (younger than 15) overall.
6.8.1 Blunt Injuries: 2005–2006 Through 2009–2010 Cases
As previously indicated, unexpected outcomes analyses are available for five different groups. However, only blunt injuries to adults offer enough cases to provide meaningful comparison across the five years of data since 2005–2006.
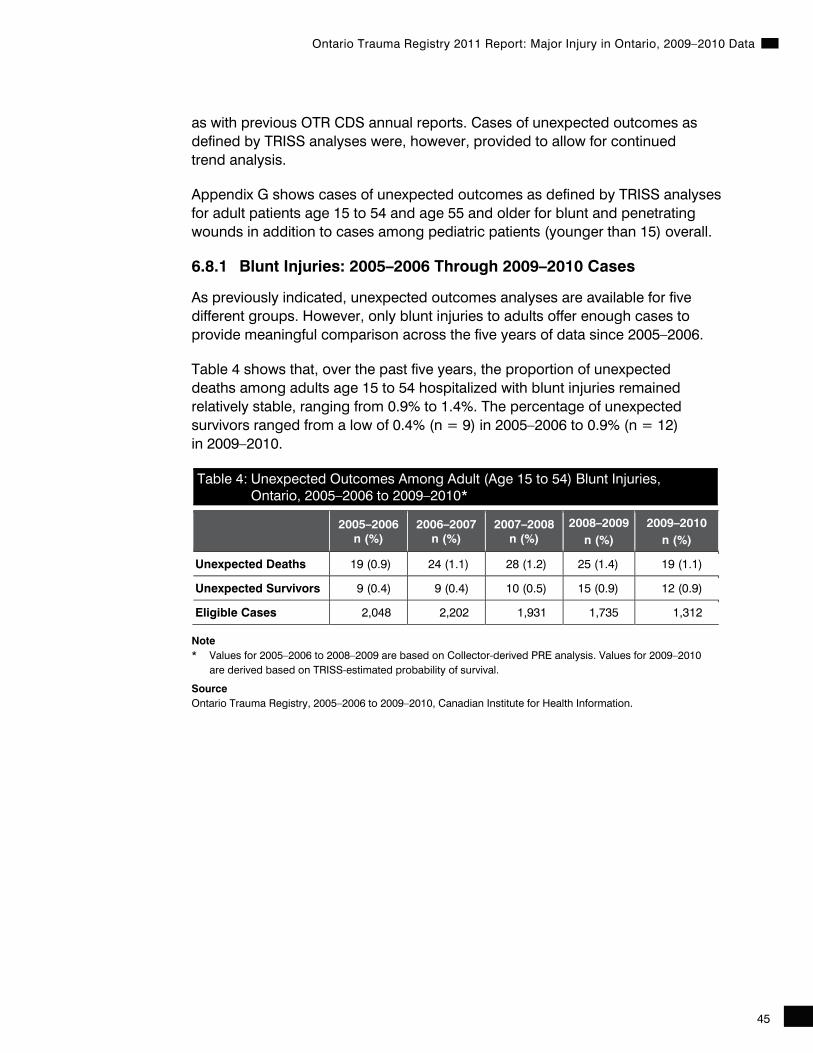
Table 4 shows that, over the past five years, the proportion of unexpected deaths among adults age 15 to 54 hospitalized with blunt injuries remained relatively stable, ranging from 0.9% to 1.4%. The percentage of unexpected survivors ranged from a low of 0.4% (n = 9) in 2005–2006 to 0.9% (n = 12) in 2009–2010.
Table 4: Unexpected Outcomes Among Adult (Age 15 to 54) Blunt Injuries, Ontario, 2005–2006 to 2009–2010*
2005–2006
n (%) 2006–2007
n (%) 2007–2008
n (%) 2008–2009
n (%) 2009–2010
n (%)
Unexpected Deaths 19 (0.9) 24 (1.1) 28 (1.2) 25 (1.4) 19 (1.1)
Unexpected Survivors 9 (0.4) 9 (0.4) 10 (0.5) 15 (0.9) 12 (0.9)
Eligible Cases 2,048 2,202 1,931 1,735 1,312
Note * Values for 2005–2006 to 2008–2009 are based on Collector-derived PRE analysis. Values for 2009–2010 are derived based on TRISS-estimated probability of survival.
Source Ontario Trauma Registry, 2005–2006 to 2009–2010, Canadian Institute for Health Information.

46
Ontario Trauma Registry 2011 Report: Major Injury in Ontario, 2009–2010 Data
Unexpected outcome analyses indicate that the percentage of unexpected deaths among cases age 55 and older fluctuated from a low of 7.1% in 2005–2006 (n = 96) to a high of 10.9% in 2009–2010 (n = 135). Conversely, the proportion of unexpected survivors remained relatively stable, ranging from 1.3% to 1.9%.
Table 5: Unexpected Outcomes Among Adult (Age 55+) Blunt Injuries, Ontario, 2005–2006 to 2009–2010 Cases*
2005–2006
n (%) 2006–2007
n (%) 2007–2008
n (%) 2008–2009
n (%) 2009–2010
n (%)
Unexpected Deaths 102 (7.1) 118 (7.8) 120 (7.5) 132 (8.7) 135 (10.9)
Unexpected Survivors
18 (1.3) 22 (1.5) 19 (1.2) 22 (1.5) 24 (1.9)
Eligible Cases 1,432 1,517 1,608 1,517 1,243
Note * Values for 2005–2006 to 2008–2009 are based on Collector-derived PRE analysis. Values for 2009–2010 are derived based on TRISS-estimated probability of survival.
Source Ontario Trauma Registry, 2005–2006 to 2009–2010, Canadian Institute for Health Information.

47
Ontario Trauma Registry 2011 Report: Major Injury in Ontario, 2009–2010 Data
Appendix A—Definition of Terms
Note: In this report, the terms “accident” and “accidentally” used in the International Classification of Diseases have been replaced with “incident” and “unintentionally.”
Abbreviated Injury Scale The Abbreviated Injury Scale (AIS) was developed to provide researchers with a numeric method of ranking and comparing injuries by severity and to standardize the terminology used to describe injuries. The AIS is a consensus-derived anatomically based system that classifies individual injuries by body region on a six-point ordinal severity scale ranging from AIS 1 (minor) to AIS 6 (currently untreatable).
Acute Care Hospital A hospital in which active treatment is received.
Admission An admission to a participating acute care hospital in Ontario as a result of injury, defined by an appropriate ICD external cause of injury code and an ISS greater than 12. Admissions include hospital deaths. For more information on inclusion criteria for admissions in the Comprehensive Data Set, refer to appendices B and C.
Admission Day The day of the week the patient is admitted to hospital.
Age Groups The age groups used by the OTR for reporting were selected for comparability with other sources of information and to report on specific trends, such as injury in children, young adults and elderly persons. Generally, the age groups reported are younger than 1, 1 to 4, 5 to 9, 10 to 14, 15 to 19, 20 to 24, 25 to 34, 35 to 44, 45 to 54, 55 to 64, 65 to 74, 75 to 84 and older than 85. Age groups were adjusted in Appendix H, Table 17, to match the Ontario Road Safety Annual Report from the Ministry of Transportation.
Aircraft Any device for transporting passengers or goods in the air, including airplanes, balloons, bombers, gliders, parachutes and military aircraft.
Autopsy Refers to a case for which a post-mortem examination or autopsy was completed.

48
Ontario Trauma Registry 2011 Report: Major Injury in Ontario, 2009–2010 Data
Blood Alcohol Concentration A positive blood alcohol concentration (BAC) is greater than or equal to 0.08% (17.4 mmol/L). The Trauma Registry Advisory Committee recommends that BAC be routinely collected on all trauma patients age 10 and older with an ISS greater than 12 who are admitted within 12 hours of the incident.
Blunt Injury Type Injury type reflects the cause of injury (such as a motor vehicle collision or a blow to the head). Blunt injury may include deep lacerations but does not include any injury in which a missile, such as a knife or bullet, enters the body.
Burn Injury Type Isolated burns with an ISS greater than 12 or burns with AIS = 1 are documented as a burn injury. These cases would not be included in a TRISS analysis. A burn injury with another injury AIS greater than 1 should be documented as a blunt or penetrating injury type, depending on the other injury.
Canadian Institute for Health Information The Canadian Institute for Health Information (CIHI) was established in February 1994. This not-for-profit corporation was created by integrating the Hospital Medical Records Institute, the MIS Group and specific health information programs from Health Canada and Statistics Canada.
Case A case in the Comprehensive Data Set is any patient who has an ISS greater than 12 and an appropriate external cause of injury code and who meets one of the following criteria:
• Admitted to a lead trauma hospital; or
• Treated in the emergency department of a lead trauma hospital (not admitted); or
• Died in the emergency department of a lead trauma hospital after treatment was initiated (not admitted).
Chronic Care The level of care required by a person who is chronically ill or has a functional disability (physical or mental), whose acute phase of illness is over, whose vital processes may or may not be stable, whose potential for rehabilitation may be limited and who requires a range of therapeutic services, medical management and/or skilled nursing care plus provision for meeting psychosocial needs. The period of time during which care is required is unpredictable but usually consists of months or years.

49
Ontario Trauma Registry 2011 Report: Major Injury in Ontario, 2009–2010 Data
Collector Specialized software from Digital Innovation, Inc. and Tri-Analytics, Inc. used by participating hospitals to collect pre-hospital, demographic, nature and cause of injury, and follow-up information on severely injured patients. This software was customized for use in Ontario.
Comprehensive Data Set One of three major data sets of the OTR, which includes data on severely injured patients admitted to trauma hospitals in the province. Inclusion in the Comprehensive Data Set is based on injury severity.
Cyclist Any person riding on a pedal cycle or in a sidecar or trailer attached to such a vehicle.
Death Data Set From the Office of the Chief Coroner One of three major data sets of the OTR; it includes data on all injury deaths in the province of Ontario. This data is provided by the Office of the Chief Coroner.
Deaths All deaths occurring in participating hospitals with an ISS greater than 12. Those patients who are dead on arrival are excluded.
Died in Emergency Died in emergency (DIE) is defined as a patient who dies in the emergency department after any active treatment or resuscitation by the trauma team or emergency department physician after the patient enters the emergency department. DIEs may include patients who arrive vital signs absent but for whom treatment or resuscitation had been initiated. Patients who are admitted to hospital and die in the emergency department while waiting for transfer are considered an in-hospital death rather than a DIE.
Direct Admission A direct admission is defined as a patient whose first contact with a hospital is at a participating hospital (not referred).
Discharge Disposition A patient’s discharge disposition is the location to which the patient is discharged or the services arranged for the patient immediately upon discharge from the lead trauma hospital. Discharge disposition is documented as inappropriate for deaths. Menu options for discharge disposition include home, home with support services, another acute care facility, general rehabilitation facility, chronic care facility, nursing home, special rehabilitation facility, foster care/children’s aid and other.

50
Ontario Trauma Registry 2011 Report: Major Injury in Ontario, 2009–2010 Data
Discharged Alive An admitted patient who is discharged from hospital alive, including those patients who sign themselves out against medical advice.
Driver A driver of a motor vehicle is the occupant of the motor vehicle operating it or intending to operate it.
Emergency Department (ED) Bypass ED bypass is defined as a patient who was admitted directly to a service (an ICU or ward bed), bypassing the emergency department.
English-Speaking Refers to patients who are reasonably conversant in the English language and do not require an interpreter.
External Cause of Injury The external cause of injury codes in the ICD coding system allow the classification and analysis of environmental events and circumstances as the cause of injury. External cause of injury codes vary depending on the coding system (for example, unintentional falls are coded as E880 to E888 in the ICD-9 coding system and as W00 to W19 in ICD-10-CA). Please see the description of International Classification of Diseases for an explanation of the various coding systems. All OTR reports are based on the first valid external cause code recorded unless otherwise specified. Collector allows hospitals to document up to three external cause of injury codes. External cause codes that are included in the trauma definition are listed in Appendix B. Note that external cause codes are termed “external causes of morbidity and mortality” (V01 to Y98) in the ICD-10-CA coding system.
Extrication Required Extrication is documented if a patient was trapped and required release from the scene of the incident. Examples include extrication from motor vehicles, dwellings on fire and falls.
General Rehabilitation See the definition for rehabilitation. General rehabilitation involves less-intensive rehabilitation of shorter duration than special rehabilitation.
Homicide Injuries inflicted by another person with intent to injure or kill by any means.

51
Ontario Trauma Registry 2011 Report: Major Injury in Ontario, 2009–2010 Data
International Classification of Diseases The International Classification of Diseases (ICD) is a World Health Organization publication that classifies morbidity and mortality information for statistical purposes, indexing of hospital records by disease and operations, and data storage and retrieval. ICD manuals may be located in hospital health record departments or in public libraries.
ICD-9 The International Classification of Diseases, 9th Revision, is based on the official version of the World Health Organization’s ninth revision.
ICD-9-CM In 1977, a steering committee was convened by the National Centre for Health Statistics to provide advice on the development of a clinical modification of the ICD-9 with increased detail necessary for medical research. ICD-9-CM is totally compatible with ICD-9, meeting the need for comparability of morbidity and mortality statistics at the international level.
ICD-10-CA The International Statistical Classification of Diseases and Related Health Problems, 10th Revision, Canada, is based on the World Health Organization’s ICD-10 and is wholly comparable with that classification. ICD-10 is the official classification used for reporting mortality data in Canada; ICD-10-CA is the national standard for reporting morbidity statistics.
In-Hospital Death A patient who dies after arrival at the participating hospital, excluding those patients who are dead on arrival.
Intracranial Pressure Days Refers to the number of days that intracranial pressure (ICP) is monitored. ICP days include any part of one day up to midnight, including the day the ICP is discontinued (excluding the day ICP is begun). ICP monitoring is used to evaluate a head injury patient’s response to therapy and may also be used as a treatment modality to vent cerebrospinal fluid.
Injured Person An injured person is identified by a subdivision of the external cause of injury codes for all transport external cause codes. Injured persons include drivers, passengers, pedestrians, cyclists and other specified persons.
Injury Resulting From Operations of War An external cause of injury code category used to classify injuries to military personnel and civilians caused by war and civil insurrection and occurring during the time of war and insurrection.

52
Ontario Trauma Registry 2011 Report: Major Injury in Ontario, 2009–2010 Data
Injury Severity Score The Injury Severity Score (ISS) is an internationally recognized scoring system developed to assign a level of severity to injury. ISS scores range from 1 (minor) to 75 (fatal).
Injury Type Refers to the patient’s most serious injury; may be classified as blunt, penetrating or burn. In determining the type of injury, the cause of injury is considered. Also see definitions for penetrating injury type, blunt injury type and burn injury type.
Injury Undetermined Whether Unintentionally or Purposely Inflicted An external cause of injury code category used when, after a thorough investigation by the medical examiner, coroner or other legal authority, it cannot be determined whether the injuries are unintentional, suicidal or intentional.
Intentional Injury Intentional injury refers to injury purposely inflicted by another person or by the patient.
Intubated Refers to patients who are intubated for airway maintenance.
Late Effects Conditions reported as such or occurring as sequelae one year or more after injury. Late effects are excluded from the definition of trauma.
Legal Intervention An external cause of injury code category used to classify injuries inflicted by the police or other law-enforcing agents, including military on duty, in the course of arresting or attempting to arrest lawbreakers, suppressing disturbances, maintaining order and performing other legal actions.
Length of Stay Total number of hospital days as calculated from date of admission to date of discharge or death.
Master Numbering System A system developed for the purpose of bringing together all health facilities and programs under one system of identification. Included are health and health-related units, facilities, clinics, programs and services. Each such organization has been assigned a unique four-digit identifying code. A two-digit alphabetic code is used to identify the type of institution.
Mean A measure of central tendency of a set of observations; the average.

53
Ontario Trauma Registry 2011 Report: Major Injury in Ontario, 2009–2010 Data
Median A measure of central tendency of a set of observations; 50th percentile (the point above and below which 50% of data falls).
Minimum Data Set One of three major data sets of the OTR; it includes data on injury admissions to acute care hospitals in Ontario. Data is downloaded from CIHI’s Discharge Abstract Database.
Month of Admission Reports are generated by the month in which a patient was admitted to hospital rather than discharge date.
Motor Vehicle Any mechanically or electrically powered device not operated on rails upon which any person or property may be transported or drawn upon a highway. Any object such as a trailer, coaster, sled or wagon being towed by a motor vehicle is considered a part of the motor vehicle. This category includes automobiles, buses, fire engines, motorcycles, mopeds or scooters, vans, trucks, construction machinery, farm and industrial machinery, steam rollers, tractors, army tanks, highway graders or similar vehicles on wheels or treads while in transport under their own power.
Motor Vehicle Incident A transport incident involving a motor vehicle. It is defined as a motor vehicle traffic incident or as a motor vehicle non-traffic incident according to whether the incident occurred on a public highway or elsewhere.
Motor Vehicle Non-Traffic Incident Any motor vehicle incident that occurs entirely in any place other than a public highway.
Motor Vehicle Traffic Incident Any motor vehicle incident occurring on a public highway (originating, terminating or involving a vehicle partially on the highway). A motor vehicle incident is assumed to have occurred on the highway unless another place is specified, except in the case of incidents involving only off-road motor vehicles, which are classified as non-traffic incidents unless the contrary is stated.
Motorcycle A two-wheeled motor vehicle having one or two riding saddles and sometimes having a third wheel for the support of a sidecar. The sidecar is considered part of the motorcycle.

54
Ontario Trauma Registry 2011 Report: Major Injury in Ontario, 2009–2010 Data
Nature of Injury Injury diagnosis codes have been divided into the following broad categories of injuries to accommodate the reporting of both ICD-9 and ICD-10-CA codes: superficial, musculoskeletal, burns and corrosion, internal organs, crushing, open wound (including traumatic amputation), blood vessels, nerves and spinal cord, other and unspecified. The specific diagnosis codes that define these categories are found in Appendix E—Nature of Injury Reporting Categories.
Off-Road Motor Vehicle A motor vehicle of special design to enable it to negotiate rough or soft terrain or snow. Examples of special design are high construction, special wheels and tires, driven by treads or supported on a cushion of air. This category includes all-terrain vehicles, army tanks, hovercrafts and snowmobiles.
Operative Procedures Up to 10 operative procedures may be documented for 5 operating room (OR) visits at the primary and secondary hospitals and for 10 OR visits at the participating hospital.
OR Visits per Admission Refers to the number of operating room (OR) encounters for the patient’s admission. Up to 99 OR visits may be documented for each patient. Detailed information is collected on 5 OR visits at the primary and secondary hospitals and 10 OR visits at the participating hospital.
Organ Donations Up to four specific organs or tissue samples may be documented. Participating hospitals may also document if more than four organs or tissue samples were procured.
Other Incidents This category was created from several ICD-10-CA external cause of injury codes. For specific ICD-10-CA codes included in this category, please see the External Cause Groupings document.
Other Road Vehicle Any device, except a motor vehicle, in, on or by which any person or property may be transported on a highway. This category includes pedal cycles, animals carrying persons or goods, animal-drawn vehicles, animals harnessed to conveyances and streetcars.
Outcome Refers to whether the patient lived or died.
Out-of-Province Resident Defined as a patient whose province of residence is not Ontario.
55
Ontario Trauma Registry 2011 Report: Major Injury in Ontario, 2009–2010 Data
Paralytic Agents The purpose of collecting the number of paralytic agents in the Comprehensive Data Set is not to document the number of paralytic agents administered but the number of cases in which the Glasgow Coma Scale score could not be calculated because a paralytic agent was administered. Paralytic agents stop muscular activity and help preserve or increase cerebral venous draining in severe head injury, helping to reduce or keep the intracranial pressure in the normal range.
Participating Hospital One of 11 hospitals (14 sites) in the province that contributes data on severely injured patients to the Comprehensive Data Set using specialized software and dedicated staff.
Patient Days The number of days a patient is hospitalized.
Pedal Cycle Any road transport vehicle operated solely by pedals, including bicycles, pedal cycles and tricycles.
Pedal Cyclist Any person riding on a pedal cycle or in a sidecar attached to such a vehicle. Also see definition for cyclist.
Pedestrian Any person involved in an incident who was not at the time of the incident riding in or on a motor vehicle, railroad train, streetcar, animal-drawn or other vehicle, bicycle or animal. The pedestrian category includes a person changing a tire on a vehicle, in or operating a pedestrian conveyance, making adjustments to the motor of a vehicle or on foot.
Pedestrian Conveyance Any human-powered device by which a pedestrian may move other than by walking or by which a walking person may move another pedestrian, including baby carriages, wagons, ice skates, roller skates, scooters, skateboards, skis, sleds and wheelchairs.
Penetrating Injury Type Refers to an injury caused by a missile entering the body. Missiles include bullets, knives and items such as pieces of sharp glass or metal.
56
Ontario Trauma Registry 2011 Report: Major Injury in Ontario, 2009–2010 Data
Place of Injury The ICD options are used to specify place of injury for all cases in the Comprehensive Data Set. Options include home, farm, mine, industry, recreation, street, public building, residential institution, other and unspecified. A place of injury may be documented for the primary, secondary and tertiary external cause of injury codes.
Pre-Hospital Time Pre-hospital time is calculated based on the incident time to the time the ambulance arrived at the first hospital.
Protective Devices Any devices in use or not in use by the injured patient at the time of the incident. Menu options for protective devices include none, lap and shoulder belt, lap belt only, lap belt only of combined assembly, child safety seat used incorrectly, child safety seat used correctly, air bag deployed, other passive restraint device, helmet, equipment available but not used, no equipment available, use unknown, other safety equipment used, infant seat (less than 20 pounds), child seat (between 20 and 40 pounds), booster seat (greater than 40 pounds), seatbelt NFS and helmet flew off. Up to four menu options may be documented.
Public Highway A public highway or traffic way is the entire width between property lines of every way or place, of which any part is open to the use of the public for purposes of vehicular traffic as a matter of right or custom. This category excludes private driveways, parking lots and roads in airfields, farms, industrial premises, mines, private grounds or quarries.
Railway Incident A transport incident involving a railway train or other railway vehicle operated on rails, whether in motion or not.
Readmission A readmission is an inpatient admission to the same participating hospital related to a previous trauma (ISS greater than 12) within unlimited time.
Rehabilitation That required by a person whose condition is relatively stable but unlikely to be resolved through convalescence or the normal healing process and who requires a specialized rehabilitation program to restore or improve functional ability. The intensity and duration of the type of care is dependent on the nature of the disability and patient progress, but maximum benefits usually can be expected within a period of several months. Also see special rehabilitation and general rehabilitation.
57
Ontario Trauma Registry 2011 Report: Major Injury in Ontario, 2009–2010 Data
Residence Code Unique four-digit numbers were assigned to each municipality and settlement in the province to classify patient residence information. The first two digits represent the county, district or regional municipality in which the place is located. Digits three and four identify municipalities within the county.
Roadway That part of the public highway designed, improved and ordinarily used for vehicular travel. This excludes driveways, parking lots, ramps and roads in farms, airfields, industrial premises, private grounds, mines and quarries.
Scene Time Scene time is calculated based on the time the ambulance arrived at the scene to the time the ambulance left the scene.
Single Year of Age Individual values for ages less than 1 year through 100 years, which may be used rather than age groups.
Small Boat Any watercraft propelled by paddle, oars or a small motor with a passenger capacity of fewer than 10.
Special Care Unit A special care unit (SCU) is any unit where the normal patient-to-nurse ratio is 2:1. Other beds, such as those in the emergency department or recovery room, may be documented as SCU beds if they are used for more than 24 hours as SCU beds. SCUs include surgical intensive care units (ICUs), pediatric ICUs, neuro ICUs, burn ICUs, ICU step-down/observation units or other designated SCUs. Up to five SCU visits may be documented.
Special Rehabilitation See the definition for rehabilitation. Special rehabilitation involves more intensive rehabilitation of longer duration than general rehabilitation.
Suicide Self-inflicted injuries specified as intentional, excluding admissions that result from poisoning.
Survivors Refers to those patients who are discharged alive.
Total Admissions Total number of patients admitted to hospital, excluding those who are dead on arrival, died in emergency and discharged from the emergency department.
Total Patient Days Sum of length of stay for all admissions.

58
Ontario Trauma Registry 2011 Report: Major Injury in Ontario, 2009–2010 Data
Transfers A transferred patient is one whose first contact with a hospital is with a non-participating hospital and who is subsequently transferred to a participating hospital.
Transport Incident Any incident (ICD-9 codes E800 to E848 and ICD-10-CA codes V01 to V99) involving a device designed primarily for, or being used at the time primarily for, conveying persons or goods from one place to another. In classifying incidents which involve more than one kind of transport, the following order of precedence of transport incidents should be used: aircraft and spacecraft, watercraft, motor vehicle, railway, other road vehicles.
Incidents involving agricultural and construction machines, such as tractors, cranes and bulldozers, are regarded as transport incidents only when these vehicles are under their own power on a highway; otherwise, the vehicles are regarded as machinery. Vehicles that can travel on land or water, such as hovercraft and other amphibious vehicles, are regarded as watercraft when on the water, as motor vehicles when on the highway and as off-road vehicles when on land but off the highway.
Trauma Injury resulting from the transfer of energy (for example, kinetic or thermal). See Appendix B for external cause of injury codes used to define trauma.
Trauma Injury Severity Score The Trauma and Injury Severity Score (TRISS) is a calculated score that estimates the probability of survival using Injury Severity Score and Revised Trauma Score.
Trauma Registry Advisory Committee The Trauma Registry Advisory Committee (TRAC) is a multidisciplinary group responsible for guiding the implementation and operation of the OTR.
Ventilator Days The number of days the patient was intubated and mechanically ventilated intermittently or continuously, excluding non-intubated patients on BIPAP and intubated patients on CPAP. Ventilator days include any part of one day up to midnight, including the day the ventilator is discontinued and excluding the day the ventilator is begun. A ventilator day is counted if a ventilated patient is admitted and discharged on the same day or if the ventilation is started and discontinued on the same day. Routine intubation for the operating room is not included.
Watercraft Any device for transporting passengers or goods on the water.

59
Ontario Trauma Registry 2011 Report: Major Injury in Ontario, 2009–2010 Data
Appendix B—Trauma Definition: External Cause of Injury Code Inclusions and Exclusions The definition of trauma as injury resulting from the transfer of energy was approved by the Ontario Trauma Registry Advisory Committee.
The following lists the categories used for trauma reporting purposes based on this definition. “Incident” and “unintentional” have been substituted for the terms “accident” and “accidental” used in the ICD definitions.
A. OTR CDS ICD-10-CA Inclusions
External Cause Code Category Definition V01–V99 Transport incidents V01–V06, V09–V90 Land transport incidents
V91–V94 Water transport incidents
V95–V97 Air and space transport incidents V98–V99 Other and unspecified transport incidents W00–W19 Unintentional falls
W20–W45, W49 Exposure to inanimate mechanical forces
W50–W60, W64 Exposure to animate mechanical forces
W65–W70, W73, W74 Unintentional drowning and submersion
W75–W77, W81, W83, W84 Other unintentional threats to breathing except due to inhalation of gastric contents, food or other objects
W85–W94, W99 Exposure to electric current, radiation and extreme ambient air temperature and pressure
X00–X06, X08, X09 Exposure to smoke, fire and flames X10–X19 Contact with heat and hot substances
X30–X39 Exposure to forces of nature
X50 Overexertion and strenuous or repetitive movements
X52 Prolonged stay in weightless environment
X58, X59 Unintentional exposure to other and unspecified factors
X70–X84 Intentional self-harm, excluding poisoning X86, X91–X99, Y00–Y05, Y07–Y09 Assault, excluding poisoning Y20–Y34 Event of undetermined intent, excluding poisoning Y35, Y36 Legal intervention and operations of war

60
Ontario Trauma Registry 2011 Report: Major Injury in Ontario, 2009–2010 Data
B. OTR CDS ICD-9 Inclusions
External Cause Code Category Definition E800–E807 Railway incidents E810–E819 Motor vehicle traffic incidents E820–E825 Motor vehicle non-traffic incidents E826 Pedal cycles E827–E829 Other road vehicle incidents E830–E838 Water transport incidents E840–E845 Air and space transport incidents E846–E848 Vehicle incidents not elsewhere classifiable E880–E888 Unintentional falls E890–E899 Incidents caused by fire and flame E900–E902, E906–E909 Incidents due to natural and environmental factors E910, E913 Incidents caused by drowning and suffocation E914, E915 Foreign bodies (excluding choking) E916–E928 Other incidents E953–E958 Suicide and self-inflicted injury (excluding poisoning) E960, E961, E963–E968 Homicide and injury purposely inflicted by other persons
(excluding poisoning) E970–E976, E978 Legal intervention E983–E988 Injury undetermined whether unintentionally or
purposely inflicted
E990–E998 Injury resulting from operations of war

61
Ontario Trauma Registry 2011 Report: Major Injury in Ontario, 2009–2010 Data
Trauma Definition: External Cause of Injury Code Exclusions
The following lists the ICD-9 and ICD-10-CA external cause codes that are excluded from the Ontario Trauma Registry based on the definition of trauma.
ICD-10-CA Code Exclusions
Definition ICD-9 Code Exclusions Definition
W78–W80 W78 Inhalation of gastric contents; W79 Inhalation and ingestion of food causing obstruction of respiratory tract; W80 Inhalation and ingestion of other objects causing obstruction of respiratory tract
E911, E912 Inhalation and ingestion of food and other objects causing obstruction
X20–X29 Contact with venomous animals and plants
E905 Venomous animals and plants
X40–X49 Unintentional poisoning and exposure to noxious substances
E850–E858, E860–E869
Poisonings by drugs or gases
X51 Travel and motion E903 Travel and motion
X53, X54, X57, Y06
X53 Lack of food; X54 Lack of water; X57 Unspecified privation; Y06 Neglect and abandonment
E904 Hunger, thirst, exposure, neglect
X60–X69 Intentional self-harm by poisoning E950–E952 Suicide and self-inflicted injury (poisoning)
X85, X87–X90 Assault by poisoning E962 Assault by poisoning
Y10–Y19 Poisoning of undetermined intent E980–E982 Poisoning undetermined whether unintentionally or purposely inflicted
Y40–Y59 Drugs, medicaments and biological substances causing adverse effects in therapeutic use
E930–E949 Drugs, medicinal and biological substances causing adverse effects
Y60–Y69 Misadventures to patients during surgical and medical care
E870–E876 Misadventures
Y70–Y82 Medical devices associated with adverse incidents in diagnostic and therapeutic use
New Category—No ICD-9 Equivalent
Y83, Y84 Surgical and other medical procedures as the cause of abnormal reaction of the patient or of later complication, without mention of misadventure at the time of the procedures
E878, E879 Complications
Y85–Y89 Sequelae of external causes of morbidity and mortality
E929, E959, E969, E977, E989, E999
Late effects
Y90–Y98 Supplementary factors related to causes of morbidity and mortality classified elsewhere
New Category—No ICD-9 Equivalent


63
Ontario Trauma Registry 2011 Report: Major Injury in Ontario, 2009–2010 Data
Appendix C—Definition of Trauma The following points are guidelines for inclusion criteria for the OTR CDS. The inclusion and exclusion criteria for the OTR CDS listed below reflect discussion by the TRAC, the TRAC subcommittee and the OTR CDS Working Group.
Inclusion criteria are effective for patients admitted on and after April 1, 1995.
1. Patients included in the Comprehensive Data Set must have an ISS greater than 12 with an appropriate external cause of injury code as defined by the Minimum Data Set Trauma Patient Definition (attached). In addition to the included external cause of injury codes, patients admitted with the following external cause of injury codes may also be included in the OTR CDS (as of April 1, 1995):
External Cause of Injury Code Exceptions
• Inhalation injury as defined in the AIS Dictionary should be used as a reference when there is documentation of the carboxyhemoglobin level. Inhalation injury should not be used in drowning or hanging cases.
• Ingestion poisoning resulting in a physical injury with an ISS greater than 12 can be included. An example is a perforated esophagus due to chemical ingestion. If the perforated esophagus was due to vomiting, the case would not be included.
• AIS 90 injuries describing length of unconsciousness and level of consciousness (includes response to painful stimuli) found in the Head section of the AIS Dictionary can be used for hypoxic injury, including hanging, strangulation and near drowning. Any documented head injury (hypoxic brain injury, cerebral edema) from the post-mortem report or diagnostic tests (CT scan, X-ray) must be included for these cases. If there is no documented head injury, either from diagnostic tests or a post-mortem examination, level of consciousness cannot be used. As stated in the AIS Dictionary, length of unconsciousness should always be used in preference to level of consciousness. Length of unconsciousness is defined from the first time the patient is known to be unconscious to the time the patient wakes up or is pronounced dead.
2. Patients who died in emergency (DIEs) are included and will be included in reports created centrally. A DIE is defined as a patient who dies in the emergency department after any active treatment or resuscitation by the trauma team or emergency department physician after the patient enters the emergency department. DIEs may include patients who arrive with vital signs absent if treatment or resuscitation had been initiated. Patients who are admitted to hospital and die in the emergency department while waiting for transfer are considered in-hospital deaths rather than DIEs.

64
Ontario Trauma Registry 2011 Report: Major Injury in Ontario, 2009–2010 Data
3. Patients who are dead on arrival (DOA) are excluded. A DOA is defined as a patient who has not had active treatment by the trauma team or emergency department physician and is pronounced dead in the emergency department. The injury must have occurred within one year of hospital admission and be the first admission to the lead trauma hospital. Patients admitted with chronic subdurals are included in the OTR CDS as a new record if the injury occurred within one year and the admission is the first to the lead trauma hospital.
4. The trauma team leader or trauma team need not be activated.
5. Patients may bypass the emergency department and be admitted directly to a service.
6. Patients with an ISS greater than 12 and an appropriate external cause of injury code who are treated in the emergency department at a lead trauma hospital and transferred to another lead trauma hospital for admission should be included in both lead trauma hospitals.
7. These cases will be reported centrally in the lead trauma hospital where the majority of the critical care is given rather than using the longest length of stay.
8. Only cases being given active care should be included. Patients who are admitted to a lead trauma hospital for convalescence or rehabilitation because the facility is closer to home should not be included.
9. If a trauma patient with an ISS less than 12 is admitted to hospital and then is further injured in hospital (ISS less than 12), the case should not be included in either instance. Injuries should not be combined. If the second incident results in an ISS greater than 12 the case should be included; however, the injuries from the first incident should not be included but should be listed as comorbidities if they contribute to the patient’s LOS. The only injuries used for scoring are the ones sustained related to the incident resulting in an ISS greater than 12.
10. A trauma patient (ISS greater than 12) admitted to a lead trauma hospital who is further injured in hospital (ISS greater than 12) should be considered two separate incidents and would require two records in the OTR CDS.

65
Ontario Trauma Registry 2011 Report: Major Injury in Ontario, 2009–2010 Data
General Coding Guidelines
1. Every data element in the OTR CDS should be documented. As of April 1, 1995, blanks are not acceptable except in cases where data elements are skipped by Collector. All menus include unknown and inappropriate as menu selections to facilitate documenting every data element.
Unknown should be used in cases where the information is not documented. Unknown should also be used if there are two conflicting sources of information that cannot be verified or for data elements where the information is expected to be made available but has not arrived at the time the record is closed. In cases where there are conflicting sources of information, the medical director should be consulted.
Inappropriate is used when the information would not be meaningful or appropriate for a specific case. An example is a BAC in a child younger than 10 or occupation in a non-work-related injury.
2. Dates and times should be documented whenever they are known. Many calculations are done in Collector, including pre-hospital time, scene time and length of stay. It is important that all dates and times be entered sequentially for these calculations to be done. Data checks have been built in to alert the user to times that are not sequential. For example, the time the ambulance call is received and the time the ambulance is dispatched (Screen 3.3) must be sequential. If these times are documented as the same on the ambulance call report, the second time should be documented as one second later. A best guess should not be used to maintain the integrity of the data. It is possible to enter “U” in portions of the date and time data elements in Collector when all the information is not available. A data element has been added to Collector to document the approximate date of injury (within one week, within one month, within three months, within one year) when the actual date is not available.
3. Old injuries, such as healing fractures, should not be included. Only injuries that are related to the cause of admission should be documented.
4. When patients are readmitted to a participating hospital with a missed injury, the missed injury should be added to the original list of injuries. If the patient is admitted for the first time to the lead trauma hospital with a missed injury, all injuries relating to the ISS greater than 12 incident should be documented.

67
Ontario Trauma Registry 2011 Report: Major Injury in Ontario, 2009–2010 Data
Appendix D—External Cause of Injury Reporting Categories In the 2009–2010 OTR CDS, external causes of injuries were defined in accordance with the ICD coding system. For the purpose of the summary sections within this report, major causes of injury are classified as cases of
• Motor vehicle collisions (including traffic, non-traffic, and motor vehicle boarding or alighting);
• Unintentional falls;
• Suicides and self-inflicted injuries (excluding poisoning);
• Injuries purposely inflicted by another person; and
• All others.
All other causes encompass cases involving railway incidents, animal riders or occupants of animal-drawn vehicles, other road vehicles, water transport, incident to/on watercraft not causing drowning and submersion, air and space transport, incident involving drowning/submersion, unclassified vehicles, fires and flames, natural and environmental factors, drowning, suffocation, foreign bodies (excluding choking), legal intervention, operations of war, undetermined whether unintentional or purposely inflicted injury, suffocation, cutting and piercing, unintentional firearm injuries, machinery-related injuries, overexertion and strenuous/repetitive movements, struck by or against objects and persons, explosive material, hot substances, electric current, exposure to radiation, natural and environmental factors, injuries resulting from being caught, crushed, jammed or pinched in or between objects and other unspecified causes.
However, tables in Appendix H present results based on each separate external cause of injury. Detailed documentation for each category’s inclusion criteria, according to ICD codes, can be found on the following pages.

68
Ontario Trauma Registry 2011 Report: Major Injury in Ontario, 2009–2010 Data
External Cause Code Groups ICD-10-CA Codes ICD-9 Codes
Motor Vehicle Traffic—Driver
V30.5, V31.5, V32.5, V33.5, V34.5, V35.5, V36.5, V37.5, V38.5, V39.4, V40.5, V41.5, V42.5, V43.5, V44.5, V45.5, V46.5, V47.5, V48.5, V49.4, V50.5, V51.5, V52.5, V53.5, V54.5, V55.5, V56.5, V57.5, V58.5, V59.4, V60.5, V61.5, V62.5, V63.5, V64.5, V65.5, V66.5, V67.5, V68.5, V69.4, V70.5, V71.5, V72.5, V73.5, V74.5, V75.5, V76.5, V77.5, V78.5, V79.4, V83.0, V84.0, V85.0, V86.00, V86.08
E810–E816, E818–E819 (.0)
Motor Vehicle Traffic—Passenger
V30.6, V31.6, V32.6, V33.6, V34.6, V35.6, V36.6, V37.6, V38.6, V39.5, V40.6, V41.6, V42.6, V43.6, V44.6, V45.6, V46.6, V47.6, V48.6, V49.5, V50.6, V51.6, V52.6, V53.6, V54.6, V55.6, V56.6, V57.6, V58.6, V59.5, V60.6, V61.6, V62.6, V63.6, V64.6, V65.6, V66.6, V67.6, V68.6, V69.5, V70.6, V71.6, V72.6, V73.6, V74.6, V75.6, V76.6, V77.6, V78.6, V79.5, V83.1, V84.1, V85.1, V86.10, V86.18
E810–E816, E818, E819 (.1)
Motor Vehicle Traffic—Motorcycle Driver
V20.4, V21.4, V22.4, V23.4, V24.4, V25.4, V26.4, V27.4, V28.4, V29.4
E810–E816, E818, E819 (.2)
Motor Vehicle Traffic—Motorcycle Passenger
V20.5, V21.5, V22.5, V23.5, V24.5, V25.5, V26.5, V27.5, V28.5, V29.5
E810–E816, E818, E819 (.3)
Motor Vehicle Traffic—Pedestrian
V02.1, V02.9, V03.1, V03.9, V04.1, V04.9, V09.2 E810–E816, E818, E819 (.7)
Motor Vehicle Traffic—Pedal Cyclist
V12 (.4, .5, .9), V13 (.4, .5, .9), V14 (.4, .5, .9), V19 (.4, .5, .6)
E810–E816, E818, E819 (.6)
Motor Vehicle Traffic—Other/ Unspecified
V20.9, V21.9, V22.9, V23.9, V24.9, V25.9, V26.9, V27.9, V28.9, V29.6, V29.8, V29.9, V30.7, V30.9, V31.7, V31.9, V32.7, V32.9, V33.7, V33.9, V34.7, V34.9, V35.7, V35.9, V36.7, V36.9, V37.7, V37.9, V38.7, V38.9, V39.6, V39.8, V39.9, V40.7, V40.9, V41.7, V41.9, V42.7, V42.9, V43.7, V43.9, V44.7, V44.9, V45.7, V45.9, V46.7, V46.9, V47.7, V47.9, V48.7, V48.9, V49.6, V49.8, V49.9, V50.7, V50.9, V51.7, V51.9, V52.7, V52.9, V53.7, V53.9, V54.7, V54.9, V55.7, V55.9, V56.7, V56.9, V57.7, V57.9, V58.7, V58.9, V59.6, V59.8, V59.9, V60.7, V60.9, V61.7, V61.9, V62.7, V62.9, V63.7, V63.9, V64.7, V64.9, V65.7, V65.9, V66.7, V66.9, V67.7, V67.9, V68.7, V68.9, V69.6, V69.8, V69.9, V70.7, V70.9, V71.7, V71.9, V72.7, V72.9, V73.7, V73.9, V74.7, V74.9, V75.7, V75.9, V76.7, V76.9, V77.7, V77.9, V78.7, V78.9, V79.6, V79.8, V79.9, V82.1, V83.2, V83.3, V84.2, V84.3, V85.2, V85.3, V86 (.2, .30, .38), V87 (.0, .1, .2, .3, .4, .5, .6, .7, .8), V89.2
E810–E816, E818, E819 (.4, .5, .8, .9)
Motor Vehicle Non-Traffic—Driver
V30.0, V31.0, V32.0, V33.0, V34.0, V35.0, V36.0, V37.0, V38.0, V39.0, V40.0, V41.0, V42.0, V43.0, V44.0, V45.0, V46.0, V47.0, V48.0, V49.0, V50.0, V51.0, V52.0, V53.0, V54.0, V55.0, V56.0, V57.0, V58.0, V59.0, V60.0, V61.0, V62.0, V63.0, V64.0, V65.0, V66.0, V67.0, V68.0, V69.0, V70.0, V71.0, V72.0, V73.0, V74.0, V75.0, V76.0, V77.0, V78.0, V79.0, V83.5, V84.5, V85.5, V86.50, V86.51, V86.58
E820–E823, E825 (.0)
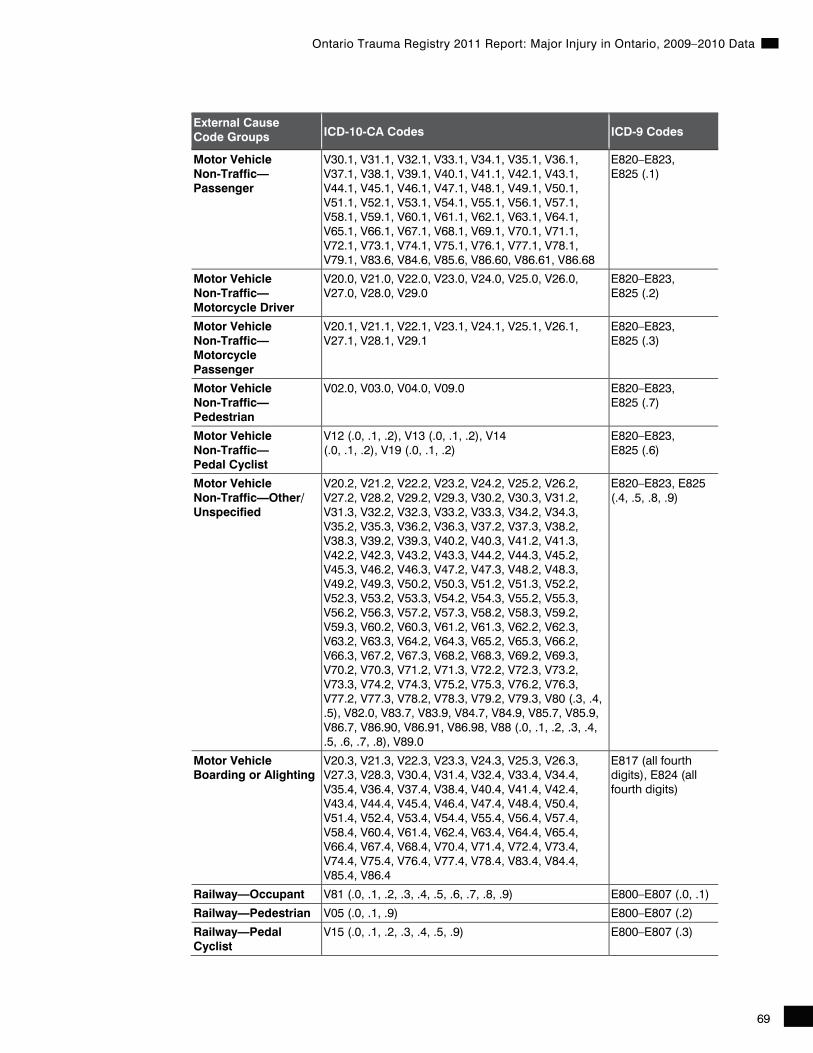
69
Ontario Trauma Registry 2011 Report: Major Injury in Ontario, 2009–2010 Data
External Cause Code Groups ICD-10-CA Codes ICD-9 Codes
Motor Vehicle Non-Traffic—Passenger
V30.1, V31.1, V32.1, V33.1, V34.1, V35.1, V36.1, V37.1, V38.1, V39.1, V40.1, V41.1, V42.1, V43.1, V44.1, V45.1, V46.1, V47.1, V48.1, V49.1, V50.1, V51.1, V52.1, V53.1, V54.1, V55.1, V56.1, V57.1, V58.1, V59.1, V60.1, V61.1, V62.1, V63.1, V64.1, V65.1, V66.1, V67.1, V68.1, V69.1, V70.1, V71.1, V72.1, V73.1, V74.1, V75.1, V76.1, V77.1, V78.1, V79.1, V83.6, V84.6, V85.6, V86.60, V86.61, V86.68
E820–E823, E825 (.1)
Motor Vehicle Non-Traffic—Motorcycle Driver
V20.0, V21.0, V22.0, V23.0, V24.0, V25.0, V26.0, V27.0, V28.0, V29.0
E820–E823, E825 (.2)
Motor Vehicle Non-Traffic—Motorcycle Passenger
V20.1, V21.1, V22.1, V23.1, V24.1, V25.1, V26.1, V27.1, V28.1, V29.1
E820–E823, E825 (.3)
Motor Vehicle Non-Traffic—Pedestrian
V02.0, V03.0, V04.0, V09.0 E820–E823, E825 (.7)
Motor Vehicle Non-Traffic— Pedal Cyclist
V12 (.0, .1, .2), V13 (.0, .1, .2), V14 (.0, .1, .2), V19 (.0, .1, .2)
E820–E823, E825 (.6)
Motor Vehicle Non-Traffic—Other/ Unspecified
V20.2, V21.2, V22.2, V23.2, V24.2, V25.2, V26.2, V27.2, V28.2, V29.2, V29.3, V30.2, V30.3, V31.2, V31.3, V32.2, V32.3, V33.2, V33.3, V34.2, V34.3, V35.2, V35.3, V36.2, V36.3, V37.2, V37.3, V38.2, V38.3, V39.2, V39.3, V40.2, V40.3, V41.2, V41.3, V42.2, V42.3, V43.2, V43.3, V44.2, V44.3, V45.2, V45.3, V46.2, V46.3, V47.2, V47.3, V48.2, V48.3, V49.2, V49.3, V50.2, V50.3, V51.2, V51.3, V52.2, V52.3, V53.2, V53.3, V54.2, V54.3, V55.2, V55.3, V56.2, V56.3, V57.2, V57.3, V58.2, V58.3, V59.2, V59.3, V60.2, V60.3, V61.2, V61.3, V62.2, V62.3, V63.2, V63.3, V64.2, V64.3, V65.2, V65.3, V66.2, V66.3, V67.2, V67.3, V68.2, V68.3, V69.2, V69.3, V70.2, V70.3, V71.2, V71.3, V72.2, V72.3, V73.2, V73.3, V74.2, V74.3, V75.2, V75.3, V76.2, V76.3, V77.2, V77.3, V78.2, V78.3, V79.2, V79.3, V80 (.3, .4, .5), V82.0, V83.7, V83.9, V84.7, V84.9, V85.7, V85.9, V86.7, V86.90, V86.91, V86.98, V88 (.0, .1, .2, .3, .4, .5, .6, .7, .8), V89.0
E820–E823, E825 (.4, .5, .8, .9)
Motor Vehicle Boarding or Alighting
V20.3, V21.3, V22.3, V23.3, V24.3, V25.3, V26.3, V27.3, V28.3, V30.4, V31.4, V32.4, V33.4, V34.4, V35.4, V36.4, V37.4, V38.4, V40.4, V41.4, V42.4, V43.4, V44.4, V45.4, V46.4, V47.4, V48.4, V50.4, V51.4, V52.4, V53.4, V54.4, V55.4, V56.4, V57.4, V58.4, V60.4, V61.4, V62.4, V63.4, V64.4, V65.4, V66.4, V67.4, V68.4, V70.4, V71.4, V72.4, V73.4, V74.4, V75.4, V76.4, V77.4, V78.4, V83.4, V84.4, V85.4, V86.4
E817 (all fourth digits), E824 (all fourth digits)
Railway—Occupant V81 (.0, .1, .2, .3, .4, .5, .6, .7, .8, .9) E800–E807 (.0, .1)
Railway—Pedestrian V05 (.0, .1, .9) E800–E807 (.2)
Railway—Pedal Cyclist
V15 (.0, .1, .2, .3, .4, .5, .9) E800–E807 (.3)

70
Ontario Trauma Registry 2011 Report: Major Injury in Ontario, 2009–2010 Data
External Cause Code Groups ICD-10-CA Codes ICD-9 Codes
Railway—Other V80.6 E800–E807 (.8, .9)
Other Road Vehicle—Pedestrian
V01 (.0, .1, .9), V06 (.0, .1, .9), V09.1, V09.3, V09.9 E826–E829 (.0)
Other Road Vehicle—Pedal Cyclist
V10 (.0, .1, .2, .3, .4, .5, .9), V11 (.0, .1, .2, .3, .4, .5, .9), V12.3, V13.3, V14.3, V16 (.0, .1, .2, .3, .4, .5, .9), V17 (.0, .1, .2, .3, .4, .5, .9), V18 (.0, .1, .2, .3, .4, .5, .9), V19 (.3, .8, .9)
E826–E829 (.1)
Other Road Vehicle—Animal Rider/ Occupant of Animal-Drawn Vehicle
V80.0, V80.1, V80.2, V80.7, V80.8, V80.9 E826–E829 (.2, .3)
Other Road Vehicle—Occupant of Streetcar
V82 (.2, .3, .4, .5, .6, .7, .8, .9) E826–E829 (.4)
Other Road Vehicle—Other
V87.9, V88.9, V89 (.1, .3) E826–E829 (.8, .9)
Water Transport—Involving Drowning/ Submersion
V90 (.0, .1, .2, .3, .4, .5, .6, .7, .8, .9), V92 (.0, .1, .2, .3, .4, .5, .6, .7, .8, .9)
E830, E832 (.0, .1, .2, .3, .4, .5, .6, .8, .9)
Water Transport—Incident to/on Watercraft Not Causing Drowning and Submersion
V91 (.0, .1, .2, .3, .4, .5, .6, .7, .8, .9), V93 (.0, .1, .2, .3, .4, .5, .6, .7, .8, .9)
E831, E833, E834 to E837 (.0, .1, .2, .3, .4, .5, .6, .8, .9)
Water Transport—Other/Unspecified
V94 (.0, .1, .2, .3, .4, .5, .6, .7, .8, .9) E838 (.0, .1, .2, .3, .4, .5, .6, .8, .9)
Air and Space Transport
V95 (.0, .1, .2, .3, .4, .8, .9), V96 (.0, .1, .2, .8, .9), V97 (.0, .1, .2, .3, .8)
E840–E845 (.0, .1, .2, .3, .4, .5, .6, .7, .8, .9)
Vehicle Incidents Not Elsewhere Classified
V89.9, V98, V99 E846–E848
Unintentional Falls—Slipping, Tripping and Stumbling
W01 E885
Unintentional Falls—Collision With/Pushed by Another Person
W03 E886
Unintentional Falls— Fall on/From Stairs and Steps
W10 E880
Unintentional Falls— Fall on/From Ladder or Scaffolding
W11, W12 E881
Unintentional Falls— Fall From, Out of or Through Building or Structure
W13 E882
Unintentional Falls—Other Fall From One Level to Another
W06–W09, W14–W17 E883, E884
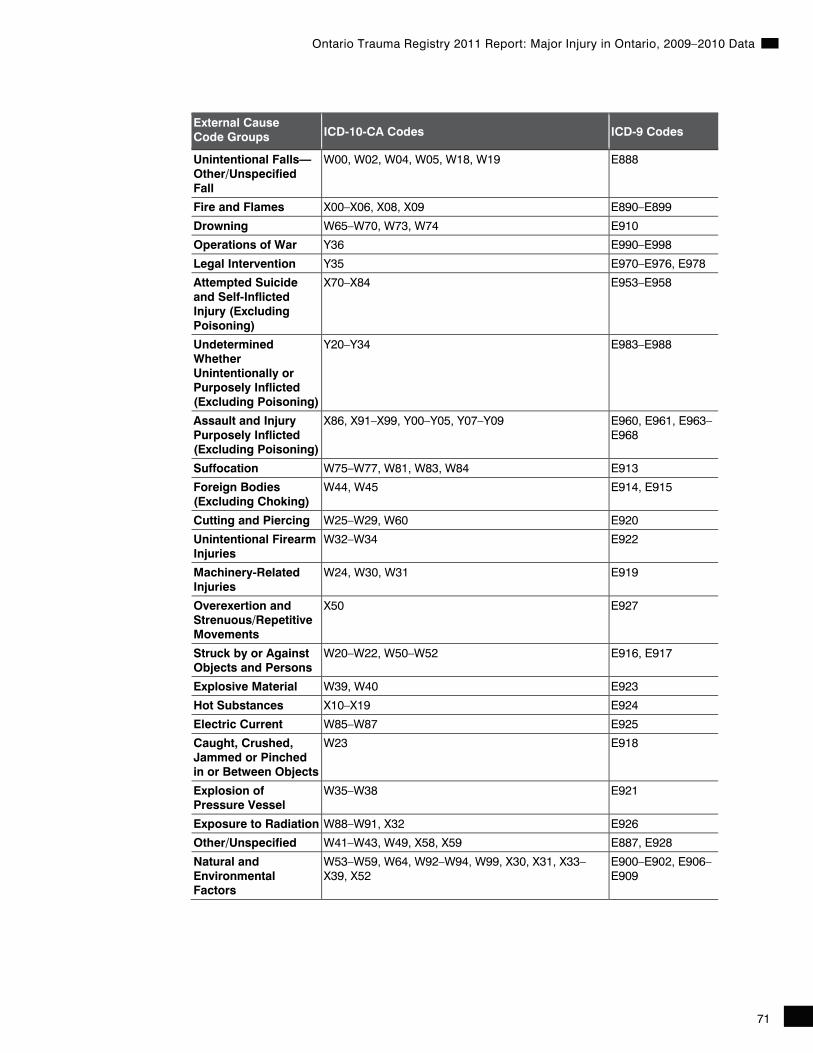
71
Ontario Trauma Registry 2011 Report: Major Injury in Ontario, 2009–2010 Data
External Cause Code Groups ICD-10-CA Codes ICD-9 Codes
Unintentional Falls—Other/Unspecified Fall
W00, W02, W04, W05, W18, W19 E888
Fire and Flames X00–X06, X08, X09 E890–E899
Drowning W65–W70, W73, W74 E910
Operations of War Y36 E990–E998
Legal Intervention Y35 E970–E976, E978
Attempted Suicide and Self-Inflicted Injury (Excluding Poisoning)
X70–X84 E953–E958
Undetermined Whether Unintentionally or Purposely Inflicted (Excluding Poisoning)
Y20–Y34 E983–E988
Assault and Injury Purposely Inflicted (Excluding Poisoning)
X86, X91–X99, Y00–Y05, Y07–Y09 E960, E961, E963–E968
Suffocation W75–W77, W81, W83, W84 E913
Foreign Bodies (Excluding Choking)
W44, W45 E914, E915
Cutting and Piercing W25–W29, W60 E920
Unintentional Firearm Injuries
W32–W34 E922
Machinery-Related Injuries
W24, W30, W31 E919
Overexertion and Strenuous/Repetitive Movements
X50 E927
Struck by or Against Objects and Persons
W20–W22, W50–W52 E916, E917
Explosive Material W39, W40 E923
Hot Substances X10–X19 E924
Electric Current W85–W87 E925
Caught, Crushed, Jammed or Pinched in or Between Objects
W23 E918
Explosion of Pressure Vessel
W35–W38 E921
Exposure to Radiation W88–W91, X32 E926
Other/Unspecified W41–W43, W49, X58, X59 E887, E928
Natural and Environmental Factors
W53–W59, W64, W92–W94, W99, X30, X31, X33–X39, X52
E900–E902, E906–E909


73
Ontario Trauma Registry 2011 Report: Major Injury in Ontario, 2009–2010 Data
Appendix E—Nature of Injury Reporting Categories
Description ICD-10 Code Range ICD-9 Code Range
Superficial S00, S05.0, S05.1, S05.8, S05.9, S10, S20, S30, S40, S50, S60, S70, S80, S90, T00, T09.0, T11.0, T13.0, T14.0
910–924
Musculoskeletal S02, S12, S22, S32, S42, S52, S62, S72, S82, S92, T02, T08, T10, T12, T14.2, S03, S13, S23, S33, S43, S53, S63, S73, S83, S93, T03, T11.2, T13.2, T14.3, S09.10, S09.18, S16, S29.00, S29.08, S39.00, S39.08, S46, S56, S66, S76, S86, S96, T06.4, T09.5, T11.5, T13.5, T14.6
800–848
Burns and Corrosion T20–T32 940–949
Internal Organ S06, S09.7, S09.8, S09.9, S26, S27, S36, S37, S39.6, T06.5
850–854, 860–869
Crushing S07, S17, S28.0, S38.0, S38.1, S47, S57, S67, S77, S87, S97, T04
925–929
Open Wound, Including Traumatic Amputation
S01, S05.2–S05.7, S09.2, S11, S21, S31, S41, S51, S61, S71, S81, S91, T01, T09.1, T11.1, T13.1, T14.1, S08, S18, S28.1, S38.2, S38.3, S48, S58, S68, S78, S88, S98, T05, T11.6, T13.6, T14.7
870–887, 890–897
Blood Vessels S09.0, S15, S25, S35, S45, S55, S65, S75, S85, S95, T06.3, T11.4, T13.4, T14.5
900–904
Nerves and Spinal Cord
S04, S14, S24, S34, S44, S54, S64, S74, S84, S94, T06.0, T06.1, T06.2, T11.3, T13.3, T14.4
950–957
Other and Unspecified
S19, S29.7, S29.8, S29.9, S39.7, S39.8, S39.9, S49, S59, S69, S79, S89, S99, T06.8, T07, T09.8, T09.9, T11.8, T11.9, T13.8, T13.9, T14.8, T14.9, T15, T16, T18, T19, T33, T34, T35, T66, T67, T68, T69, T70, T71, T73 (excludes T73.0, T73.1), T75 (excludes T75.3)
930–939, 959, 990–994 (excludes 933.1, 994.2, 994.3, 994.6)


75
Ontario Trauma Registry 2011 Report: Major Injury in Ontario, 2009–2010 Data
Appendix F—Comprehensive Data Set Data Elements “Restricted” in the Comments column means that the specific data element is unavailable to researchers.
Data Element—Group/Single Data Element—Single Comments
Accident Number
ACS Filters
Admission Date
Admitting Service
Age
Age Units
AIS Code
AIS Version
ALC Days: Number of, Reasons for, Form Completed, Date Ready
BAC (mmol/L) Primary Hospital Secondary Hospital Lead Trauma Hospital
Campus Number
Cause of Injury: Specify
Chart Number Restricted
Collision Detail Comorbidities Primary Impact Secondary Impact
Complications
Coroner Notified?
CT Scan Location Primary Hospital Secondary Hospital Lead Trauma Hospital
Date of Arrival Primary Hospital Secondary Hospital Lead Trauma Hospital Lead Trauma Hospital ED
Date of Birth
Date of Departure Primary Hospital Secondary Hospital Lead Trauma Hospital ED

76
Ontario Trauma Registry 2011 Report: Major Injury in Ontario, 2009–2010 Data
Data Element—Group/Single Data Element—Single Comments
Dates: Scene Date Call Received Date Dispatched Date Arrived at Scene Date Arrived at Patient Date Departed From Scene
Direct Admission to Service (Bypass ED)
Disposition
Disposition: Other
Distance Ejected (in Metres)
External Cause of Injury Codes (ICD-9-CM)
Primary, Secondary, Tertiary, Sports/Recreational
External Cause Codes (ICD-10-CA)
ED Physician (Lead Trauma Hospital) Restricted
Ejected From Vehicle
Extrication Required?
Extrication Time
Follow-Up: Admissions Related to Injury in Six Months Post-Discharge?
Follow-Up: Contact
Follow-Up: Date
Follow-Up: Hospital Admitted To
Follow-Up: Level of Employment
Follow-Up: Level of Study
Follow-Up: Percentage of Previous Income
Follow-Up: Therapy Received After Discharge?
Follow-Up: Therapy Type (Other)
Follow-Up: Therapy Type
Geocode of Incident Location
Glasgow Coma Scale Scene, Primary Hospital, Secondary Hospital, Lead Trauma Hospital Eye Opening Motor Response Verbal Response Total GCS
Health Number (Ontario) Restricted
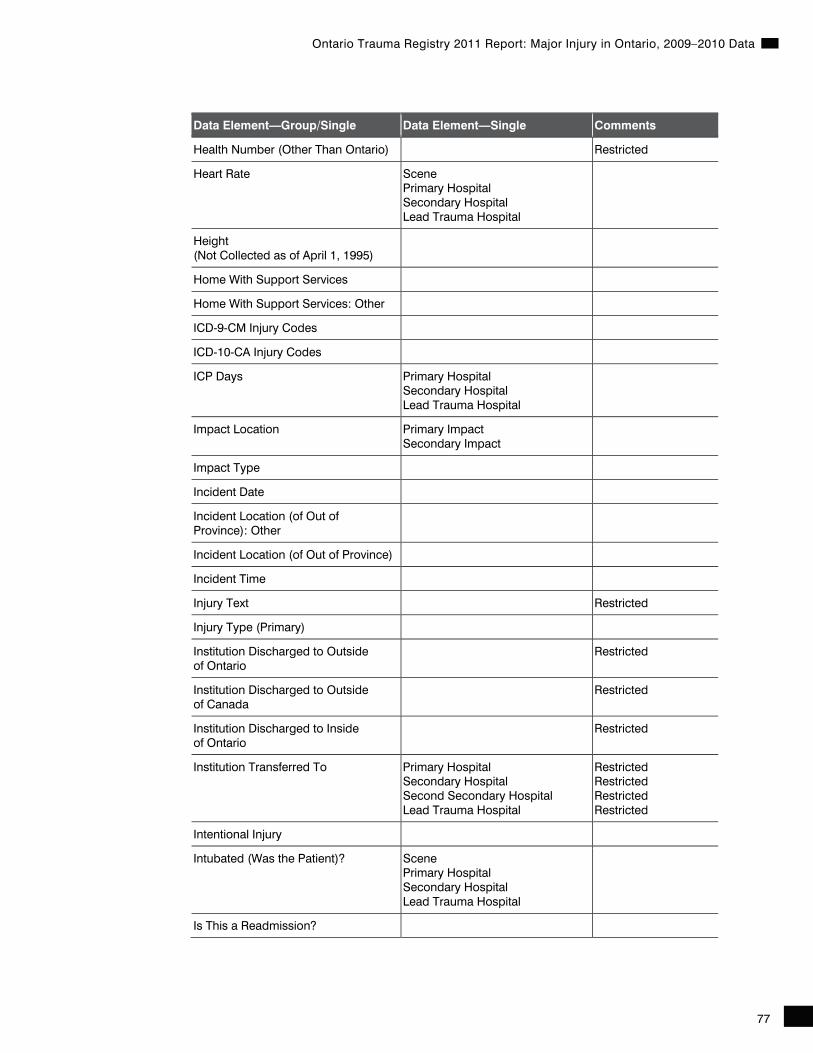
77
Ontario Trauma Registry 2011 Report: Major Injury in Ontario, 2009–2010 Data
Data Element—Group/Single Data Element—Single Comments
Health Number (Other Than Ontario) Restricted
Heart Rate Scene Primary Hospital Secondary Hospital Lead Trauma Hospital
Height (Not Collected as of April 1, 1995)
Home With Support Services
Home With Support Services: Other
ICD-9-CM Injury Codes
ICD-10-CA Injury Codes
ICP Days Primary Hospital Secondary Hospital Lead Trauma Hospital
Impact Location Primary Impact Secondary Impact
Impact Type
Incident Date
Incident Location (of Out of Province): Other
Incident Location (of Out of Province)
Incident Time
Injury Text Restricted
Injury Type (Primary)
Institution Discharged to Outside of Ontario
Restricted
Institution Discharged to Outside of Canada
Restricted
Institution Discharged to Inside of Ontario
Restricted
Institution Transferred To Primary Hospital Secondary Hospital Second Secondary Hospital Lead Trauma Hospital
Restricted Restricted Restricted Restricted
Intentional Injury
Intubated (Was the Patient)? Scene Primary Hospital Secondary Hospital Lead Trauma Hospital
Is This a Readmission?
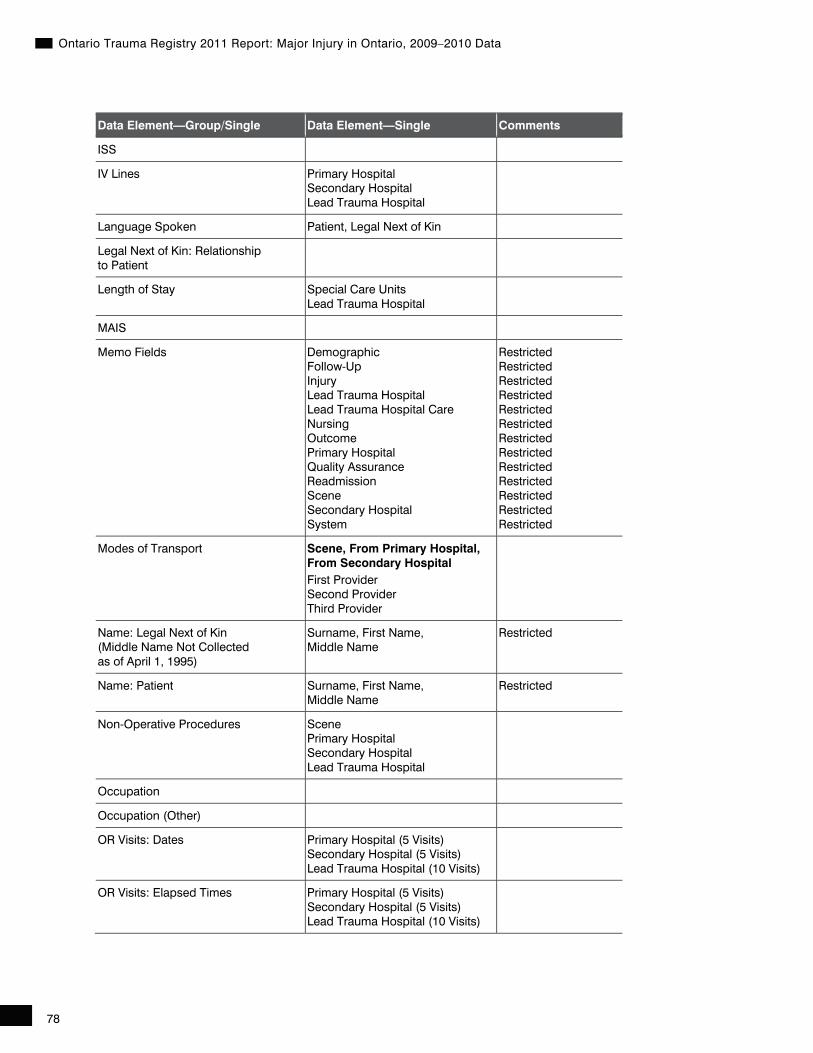
78
Ontario Trauma Registry 2011 Report: Major Injury in Ontario, 2009–2010 Data
Data Element—Group/Single Data Element—Single Comments
ISS
IV Lines Primary Hospital Secondary Hospital Lead Trauma Hospital
Language Spoken Patient, Legal Next of Kin
Legal Next of Kin: Relationship to Patient
Length of Stay Special Care Units Lead Trauma Hospital
MAIS
Memo Fields Demographic Follow-Up Injury Lead Trauma Hospital Lead Trauma Hospital Care Nursing Outcome Primary Hospital Quality Assurance Readmission Scene Secondary Hospital System
Restricted Restricted Restricted Restricted Restricted Restricted Restricted Restricted Restricted Restricted Restricted Restricted Restricted
Modes of Transport Scene, From Primary Hospital, From Secondary Hospital First Provider Second Provider Third Provider
Name: Legal Next of Kin (Middle Name Not Collected as of April 1, 1995)
Surname, First Name, Middle Name
Restricted
Name: Patient Surname, First Name, Middle Name
Restricted
Non-Operative Procedures Scene Primary Hospital Secondary Hospital Lead Trauma Hospital
Occupation
Occupation (Other)
OR Visits: Dates Primary Hospital (5 Visits) Secondary Hospital (5 Visits) Lead Trauma Hospital (10 Visits)
OR Visits: Elapsed Times Primary Hospital (5 Visits) Secondary Hospital (5 Visits) Lead Trauma Hospital (10 Visits)
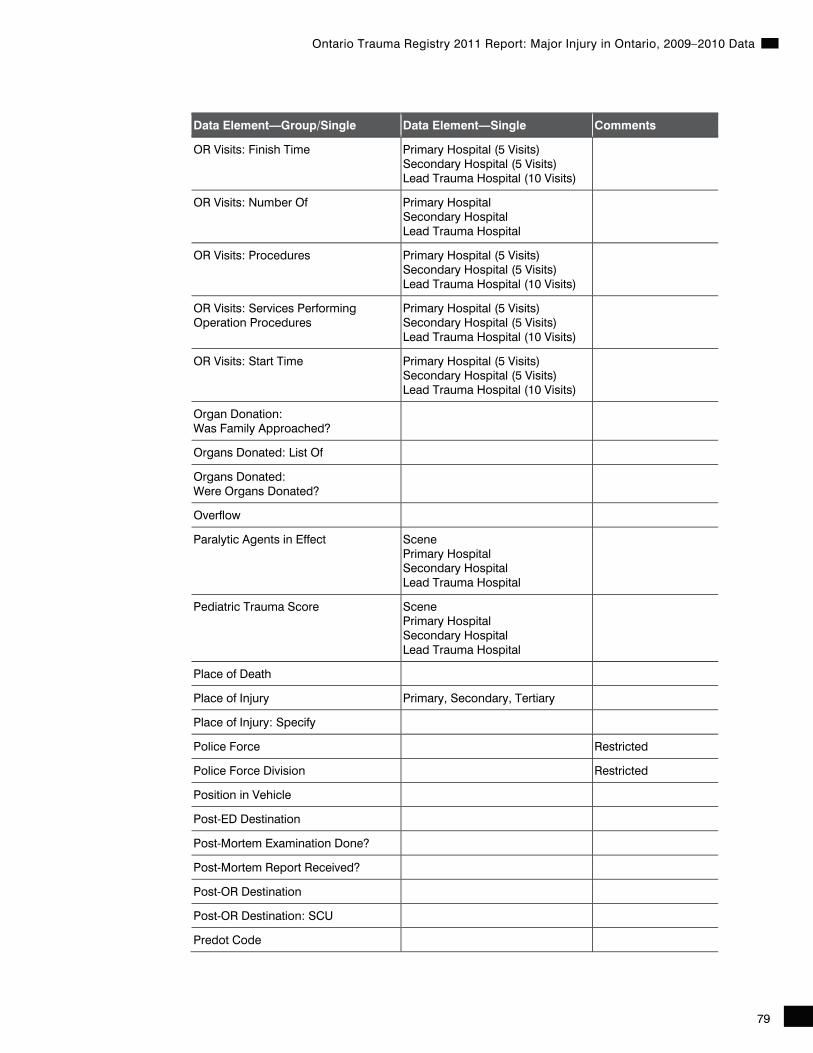
79
Ontario Trauma Registry 2011 Report: Major Injury in Ontario, 2009–2010 Data
Data Element—Group/Single Data Element—Single Comments
OR Visits: Finish Time Primary Hospital (5 Visits) Secondary Hospital (5 Visits) Lead Trauma Hospital (10 Visits)
OR Visits: Number Of Primary Hospital Secondary Hospital Lead Trauma Hospital
OR Visits: Procedures Primary Hospital (5 Visits) Secondary Hospital (5 Visits) Lead Trauma Hospital (10 Visits)
OR Visits: Services Performing Operation Procedures
Primary Hospital (5 Visits) Secondary Hospital (5 Visits) Lead Trauma Hospital (10 Visits)
OR Visits: Start Time Primary Hospital (5 Visits) Secondary Hospital (5 Visits) Lead Trauma Hospital (10 Visits)
Organ Donation: Was Family Approached?
Organs Donated: List Of
Organs Donated: Were Organs Donated?
Overflow
Paralytic Agents in Effect Scene Primary Hospital Secondary Hospital Lead Trauma Hospital
Pediatric Trauma Score Scene Primary Hospital Secondary Hospital Lead Trauma Hospital
Place of Death
Place of Injury Primary, Secondary, Tertiary
Place of Injury: Specify
Police Force Restricted
Police Force Division Restricted
Position in Vehicle
Post-ED Destination
Post-Mortem Examination Done?
Post-Mortem Report Received?
Post-OR Destination
Post-OR Destination: SCU
Predot Code

80
Ontario Trauma Registry 2011 Report: Major Injury in Ontario, 2009–2010 Data
Data Element—Group/Single Data Element—Single Comments
Pre-Hospital Number First, Second and Third Provider From Scene From Primary Hospital From Secondary Hospital
Pre-Hospital Time: Total
Protective Devices
Protective Devices (Other)
Qualified Personnel (Number of) First, Second and Third Provider From Scene From Primary Hospital From Secondary Hospital
RANCHOS at Discharge
Readmission Number of Readmissions
Referring Physician Primary Hospital Secondary Hospital
Restricted
Residence Code
Residence: Province Of
Respiration Rate (Unassisted) Scene Primary Hospital Secondary Hospital Lead Trauma Hospital
Revised Trauma Score: Total Scene Primary Hospital Secondary Hospital Lead Trauma Hospital
Runsheet Available First, Second and Third Provider From Scene From Primary Hospital From Secondary Hospital
Scene Time: Total
Separation Date, Time, Status
Service Transfers Type of Service, Date Admitted, Date Discharged, Length of Stay Up to Six Service Transfers
Sex
Special Care Units Type of Special Care Unit, Date Admitted, Date Discharged, Length of Stay Up to Five SCUs
Systolic Blood Pressure Scene Primary Hospital Secondary Hospital Lead Trauma Hospital
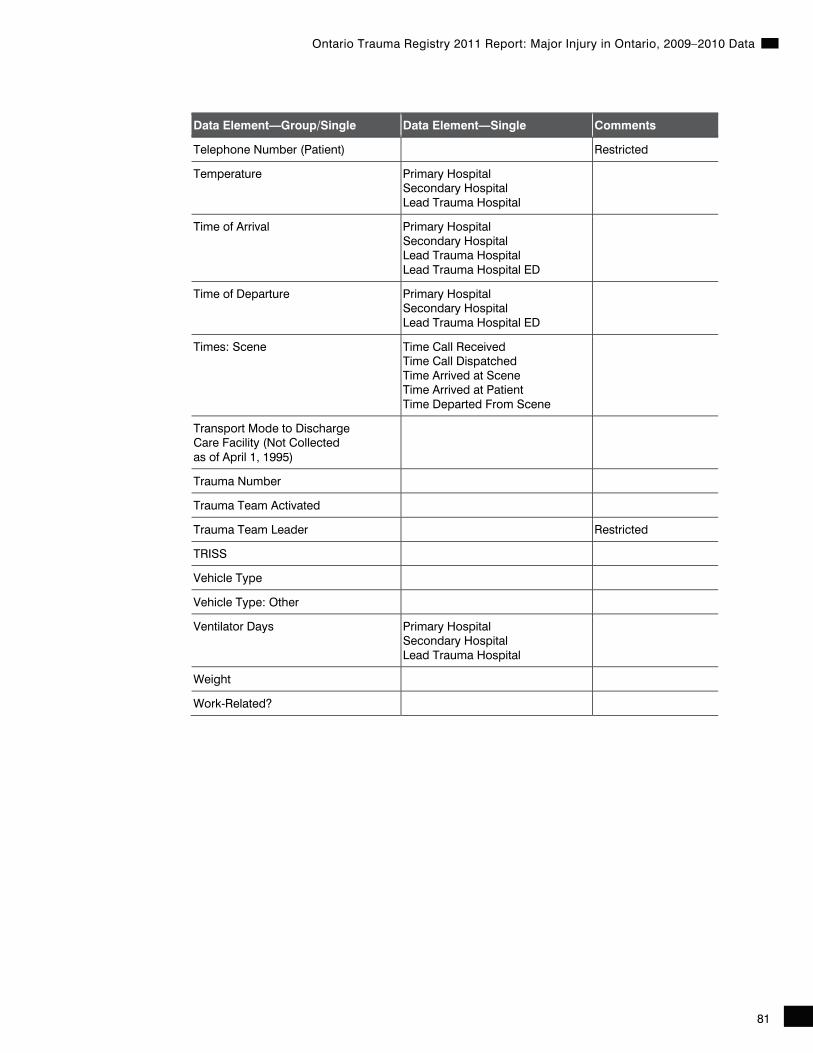
81
Ontario Trauma Registry 2011 Report: Major Injury in Ontario, 2009–2010 Data
Data Element—Group/Single Data Element—Single Comments
Telephone Number (Patient) Restricted
Temperature Primary Hospital Secondary Hospital Lead Trauma Hospital
Time of Arrival Primary Hospital Secondary Hospital Lead Trauma Hospital Lead Trauma Hospital ED
Time of Departure Primary Hospital Secondary Hospital Lead Trauma Hospital ED
Times: Scene Time Call Received Time Call Dispatched Time Arrived at Scene Time Arrived at Patient Time Departed From Scene
Transport Mode to Discharge Care Facility (Not Collected as of April 1, 1995)
Trauma Number
Trauma Team Activated
Trauma Team Leader Restricted
TRISS
Vehicle Type
Vehicle Type: Other
Ventilator Days Primary Hospital Secondary Hospital Lead Trauma Hospital
Weight
Work-Related?

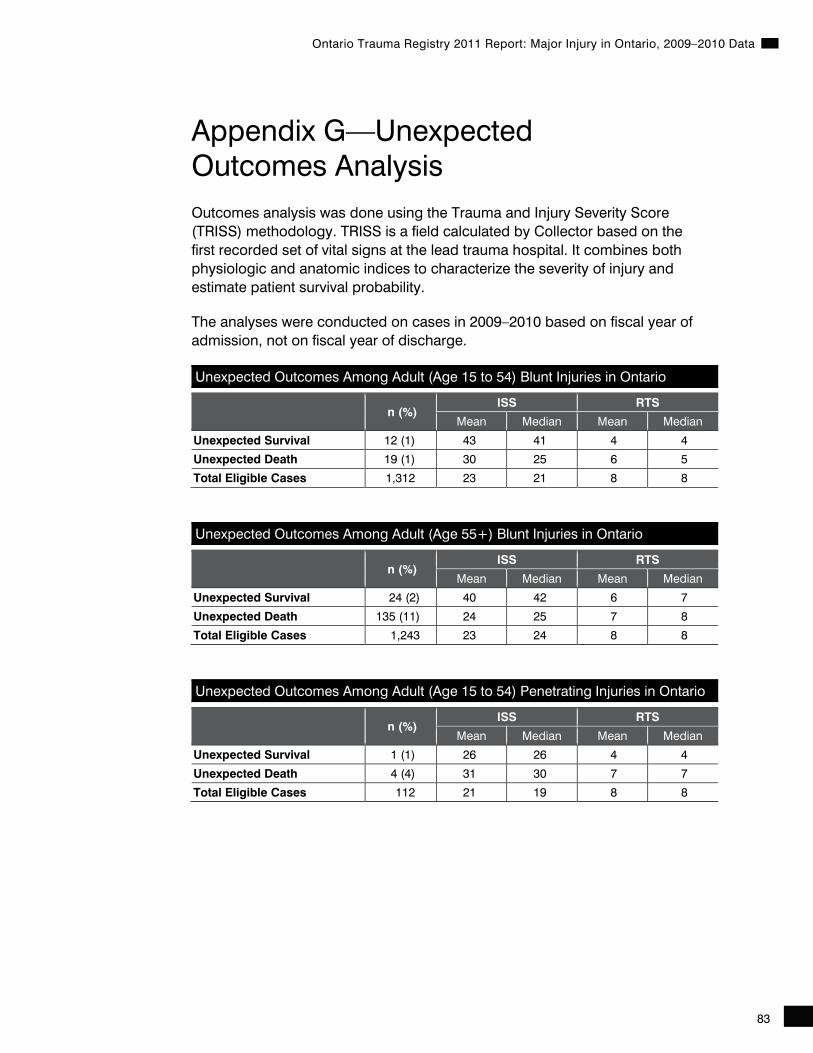
83
Ontario Trauma Registry 2011 Report: Major Injury in Ontario, 2009–2010 Data
Appendix G—Unexpected Outcomes Analysis Outcomes analysis was done using the Trauma and Injury Severity Score (TRISS) methodology. TRISS is a field calculated by Collector based on the first recorded set of vital signs at the lead trauma hospital. It combines both physiologic and anatomic indices to characterize the severity of injury and estimate patient survival probability.
The analyses were conducted on cases in 2009–2010 based on fiscal year of admission, not on fiscal year of discharge.
Unexpected Outcomes Among Adult (Age 15 to 54) Blunt Injuries in Ontario
n (%)
ISS RTS
Mean Median Mean Median
Unexpected Survival 12 (1) 43 41 4 4
Unexpected Death 19 (1) 30 25 6 5
Total Eligible Cases 1,312 23 21 8 8
Unexpected Outcomes Among Adult (Age 55+) Blunt Injuries in Ontario
n (%)
ISS RTS
Mean Median Mean Median
Unexpected Survival 24 (2) 40 42 6 7
Unexpected Death 135 (11) 24 25 7 8
Total Eligible Cases 1,243 23 24 8 8
Unexpected Outcomes Among Adult (Age 15 to 54) Penetrating Injuries in Ontario
n (%)
ISS RTS
Mean Median Mean Median
Unexpected Survival 1 (1) 26 26 4 4
Unexpected Death 4 (4) 31 30 7 7
Total Eligible Cases 112 21 19 8 8
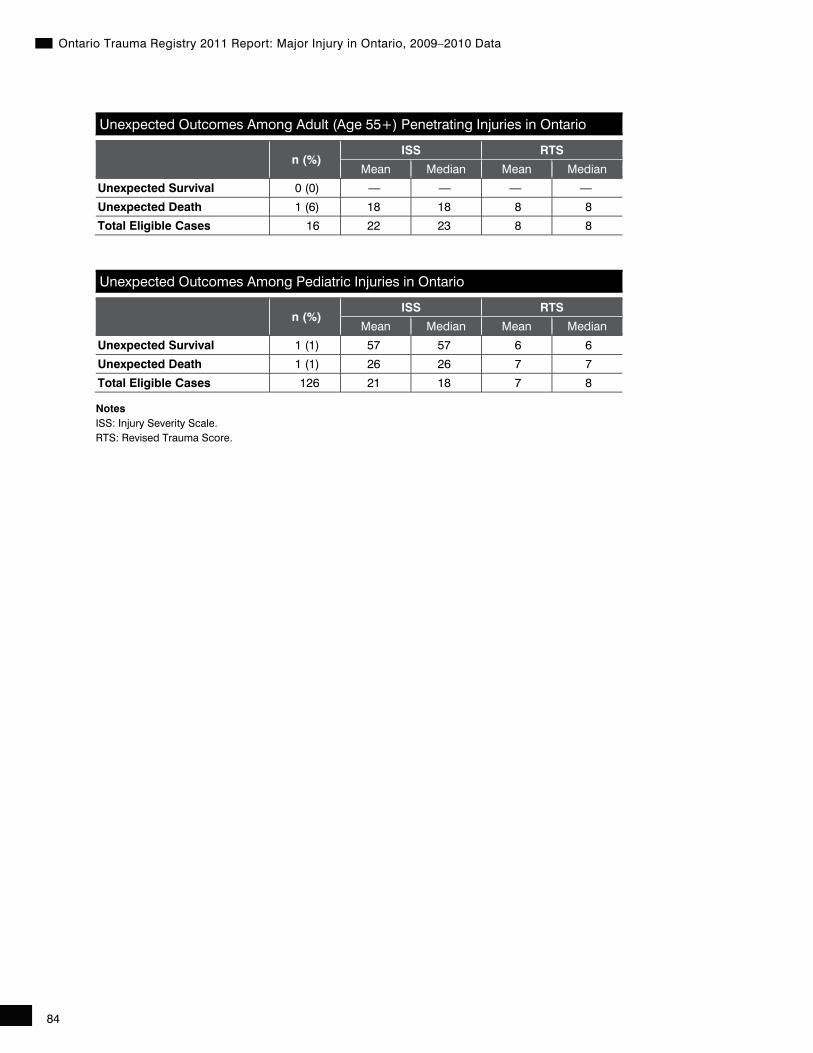
84
Ontario Trauma Registry 2011 Report: Major Injury in Ontario, 2009–2010 Data
Unexpected Outcomes Among Adult (Age 55+) Penetrating Injuries in Ontario
n (%)
ISS RTS
Mean Median Mean Median
Unexpected Survival 0 (0) — — — —
Unexpected Death 1 (6) 18 18 8 8
Total Eligible Cases 16 22 23 8 8
Unexpected Outcomes Among Pediatric Injuries in Ontario
n (%)
ISS RTS
Mean Median Mean Median
Unexpected Survival 1 (1) 57 57 6 6
Unexpected Death 1 (1) 26 26 7 7
Total Eligible Cases 126 21 18 7 8
Notes ISS: Injury Severity Scale. RTS: Revised Trauma Score.
85
Ontario Trauma Registry 2011 Report: Major Injury in Ontario, 2009–2010 Data
Appendix H—2009–2010 Data Tables
Table 1 Trend Analysis Report, 2005–2006 to 2009–2010 Cases .................... 86
Table 2 Patient Days, Mean and Median Length of Stay by Sex and Age, 2009–2010 .................................................................................... 88
Table 3 Patient Days, Mean and Median Length of Stay by Sex and Age for In-Hospital ....................................................................................... 89
Table 4 Denominators by Institution Code, 2009–2010 Cases ........................ 90
Table 5 Demographics by Institution Code, 2009–2010 Cases ....................... 91
Table 6 Injury Severity Score and Glasgow Coma Scale Score by Institution Code, 2009–2010 Cases ..................................................... 92
Table 7 Type and Place of Injury by Institution Code, 2009–2010 Cases ........ 93
Table 8 External Cause of Injury by Institution Code, 2009–2010 Cases ........ 94
Table 9 Scene Information by Institution Code, 2009–2010 Cases ................. 96
Table 10 Participating Hospital Care, 2009–2010 Cases ................................... 97
Table 11 Deaths by Institution Code, 2009–2010 Cases .................................... 99
Table 12 Outcome Scores by Institution Code, 2009–2010 Cases ................. 100
Table 13 Total Injuries and Deaths by External Causes of Injury and Sex, 2009–2010 .......................................................................................... 101
Table 14 Injury Case Summary by External Causes of Injury and Sex, 2009–2010 Cases ............................................................................... 104
Table 15 External Causes of Injury by Age Group, 2009–2010 Cases ............ 107
Table 16 External Causes of Injury* by Age Group for Falls, 2009–2010 Cases .. 110
Table 17 External Causes of Injury by Age Group for Traffic, Non-Traffic and Other Road Vehicle Incidents, 2009–2010 Cases ...................... 112
Table 18 Total Injuries and Injury Type by Five-Year Age Groups, 2009–2010 Cases ............................................................................... 113
Table 19 Sports and Recreational Activity Injuries by External Causes of Injury, 2009–2010 Cases .................................................................... 114
Table 20 Sports and Recreational Activity Injuries by External Causes of Injury Among Cases Younger Than Age 20, 2009–2010 Cases ....... 116
Table 21 Sports and Recreational Activity Injuries by External Causes of Injury Among Cases Age 20 to 34, 2009–2010 Cases ...................... 117
Table 22 Sports and Recreational Activity Injuries by External Causes of Injury Among Cases Age 35 to 64, 2009–2010 Cases ...................... 118
Table 23 Sports and Recreational Activity Injuries by External Causes of Injury Among Cases Age 65 and Older, 2009–2010 Cases .............. 119
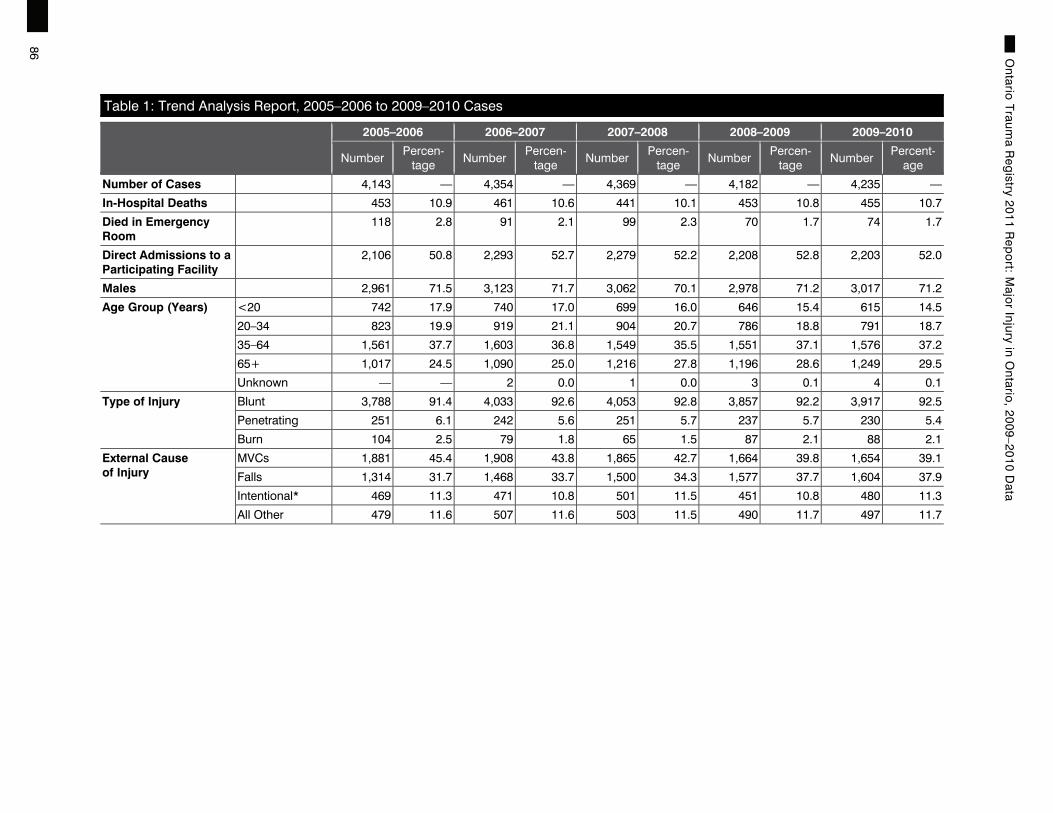
86 Ontario
Trauma R
egistry 2011 R
epo
rt: Majo
r Injury in O
ntario
, 2009–2010 Data
Table 1: Trend Analysis Report, 2005–2006 to 2009–2010 Cases
2005–2006 2006–2007 2007–2008 2008–2009 2009–2010
Number Percen-
tage Number
Percen-tage
Number Percen-
tage Number
Percen-tage
Number Percent-
age
Number of Cases 4,143 — 4,354 — 4,369 — 4,182 — 4,235 —
In-Hospital Deaths 453 10.9 461 10.6 441 10.1 453 10.8 455 10.7
Died in Emergency Room
118 2.8 91 2.1 99 2.3 70 1.7 74 1.7
Direct Admissions to a Participating Facility
2,106 50.8 2,293 52.7 2,279 52.2 2,208 52.8 2,203 52.0
Males 2,961 71.5 3,123 71.7 3,062 70.1 2,978 71.2 3,017 71.2
Age Group (Years) <20 742 17.9 740 17.0 699 16.0 646 15.4 615 14.5
20–34 823 19.9 919 21.1 904 20.7 786 18.8 791 18.7
35–64 1,561 37.7 1,603 36.8 1,549 35.5 1,551 37.1 1,576 37.2
65+ 1,017 24.5 1,090 25.0 1,216 27.8 1,196 28.6 1,249 29.5
Unknown — — 2 0.0 1 0.0 3 0.1 4 0.1
Type of Injury Blunt 3,788 91.4 4,033 92.6 4,053 92.8 3,857 92.2 3,917 92.5
Penetrating 251 6.1 242 5.6 251 5.7 237 5.7 230 5.4
Burn 104 2.5 79 1.8 65 1.5 87 2.1 88 2.1
External Cause of Injury
MVCs 1,881 45.4 1,908 43.8 1,865 42.7 1,664 39.8 1,654 39.1
Falls 1,314 31.7 1,468 33.7 1,500 34.3 1,577 37.7 1,604 37.9
Intentional* 469 11.3 471 10.8 501 11.5 451 10.8 480 11.3
All Other 479 11.6 507 11.6 503 11.5 490 11.7 497 11.7

87
Ontario
Trauma R
egistry 2011 R
epo
rt: Majo
r Injury in O
ntario
, 2009–2010 Data
Table 1: Trend Analysis Report, 2005–2006 to 2009–2010 Cases (cont’d)
2005–2006 2006–2007 2007–2008 2008–2009 2009–2010
Number Percen-
tage Number
Percen-tage
Number Percen-
tage Number
Percen-tage
Number Percen-
tage
Discharge Disposition Deaths 572 13.8 555 12.7 541 12.4 523 12.5 532 12.6
Home (Without Support Services)
1,660 40.1 1,716 39.4 1,852 42.4 1,774 42.4 1,792 42.3
Home (With Support Services)
471 11.4 470 10.8 391 8.9 380 9.1 344 8.1
Other Acute Care Facility
592 14.3 669 15.4 684 15.7 651 15.6 627 14.8
General Rehab 312 7.5 353 8.1 359 8.2 304 7.3 357 8.4
Chronic Care 44 1.1 53 1.2 40 0.9 46 1.1 44 1.0
Nursing Home 94 2.3 84 1.9 64 1.5 64 1.5 77 1.8
Special Rehab 254 6.1 328 7.5 296 6.8 310 7.4 291 6.9
Foster Care 17 0.4 13 0.3 9 0.2 9 0.2 13 0.3
Other 127 3.1 112 2.6 131 3.0 119 2.8 148 3.5
Unknown — — 1 0.0 2 0.0 2 0.0 10 0.2
Injury Severity Score (ISS)
Mean 25 — 24 — 24 — 24 — 24 —
SD 10 — 10 — 10 — 10 — 10 —
Median 22 — 22 — 22 — 24 — 22 —
Age (Years) Mean 45 — 45 — 46 — 47 — 48 —
SD 24 — 24 — 24 — 25 — 24 —
Median 44 — 44 — 45 — 48 — 49 —
Length of Stay (Days) Mean 15 — 15 — 15 — 15 — 15 —
SD 21 — 22 — 22 — 23 — 26 —
Median 8 — 8 — 8 — 8 — 7 —
Notes MVCs: motor vehicle collisions. SD: standard deviation. Intentional injury includes suicide, excluding poisoning (ICD-10-CA X70 to X84), and injury purposely inflicted by other person (ICD-10-CA X86, X91 to X99, Y00 to Y05 and Y07 to Y09).
Source Ontario Trauma Registry Comprehensive Data Set, 2005–2006 to 2009–2010, Canadian Institute for Health Information.

88 Ontario
Trauma R
egistry 2011 R
epo
rt: Majo
r Injury in O
ntario
, 2009–2010 Data
Table 2: Patient Days, Mean and Median Length of Stay by Sex and Age, 2009–2010 Cases
<1 1–4 5–9 10–14 15–19 20–24 25–34 35–44 45–54 55–64 65–74 75–84 85+ Unknown Total
Number of Cases
Females Count 24 23 23 25 87 70 82 114 154 123 125 218 149 1 1,218
Percentage 2.0 1.9 1.9 2.1 7.1 5.7 6.7 9.4 12.6 10.1 10.3 17.9 12.2 0.1 100
Males Count 30 41 36 84 242 259 380 354 451 380 285 350 122 3 3,017
Percentage 1.0 1.4 1.2 2.8 8.0 8.6 12.6 11.7 14.9 12.6 9.4 11.6 4.0 0.1 100
Total Count 54 64 59 109 329 329 462 468 605 503 410 568 271 4 4,235
Percentage 1.3 1.5 1.4 2.6 7.8 7.8 10.9 11.1 14.3 11.9 9.7 13.4 6.4 0.1 100
Length of Hospital Stay (Days)
Females Number 84 247 193 511 935 1,209 977 2,365 2,001 2,073 1,647 3,307 2,296 N/A 17,845
Percentage* 0.5 1.4 1.1 2.9 5.2 6.8 5.5 13.3 11.2 11.6 9.2 18.5 12.9 N/A 100
Mean 3.5 10.7 8.4 23.2 11.5 17.8 12.4 21.1 13.3 17.4 13.4 15.5 15.8 N/A 15
SD 4.1 15.7 13.6 58.9 13.0 37.3 12.9 40.6 13.2 30.7 13.7 18.3 19.1 N/A 24
Median 2.0 3.0 5.0 6.5 7.0 8.0 8.0 11.5 10.0 9.0 8.0 9.0 9.0 N/A 8
Males Number 360 478 567 635 3,025 4,075 5,235 4,616 6,955 5,129 5,757 4,749 2,096 1 43,678
Percentage* 0.8 1.1 1.3 1.5 6.9 9.3 12.0 10.6 15.9 11.7 13.2 10.9 4.8 0.0 100
Mean 12.4 12.3 15.8 8.0 13.1 16.6 14.4 13.7 15.8 13.9 20.6 13.9 17.8 1.0 15
SD 15.0 25.5 30.5 12.0 25.8 49.0 21.4 17.1 21.6 21.8 39.4 18.0 24.7 N/A 27
Median 6.0 4.0 4.5 4.0 6.0 7.0 8.0 7.0 8.0 7.0 9.0 7.0 8.5 1.0 7
Total Number 444 725 760 1,146 3,960 5,284 6,212 6,981 8,956 7,202 7,404 8,056 4,392 1 61,523
Percentage* 0.7 1.2 1.2 1.9 6.4 8.6 10.1 11.3 14.6 11.7 12.0 13.1 7.1 0.0 100
Mean 8.4 11.7 12.9 11.3 12.7 16.8 14.0 15.5 15.2 14.7 18.4 14.5 16.7 1.0 15
SD 12.2 22.3 25.4 29.7 23.2 46.7 20.2 25.3 19.8 24.3 33.8 18.1 21.8 N/A 26
Median 4.0 3.5 5.0 5.0 6.0 7.0 8.0 8.0 9.0 7.0 9.0 8.0 9.0 1.0 7
Notes * Percentage calculated within sex. SD: standard deviation. N/A: not applicable.
Source Ontario Trauma Registry Comprehensive Data Set, 2009–2010, Canadian Institute for Health Information.
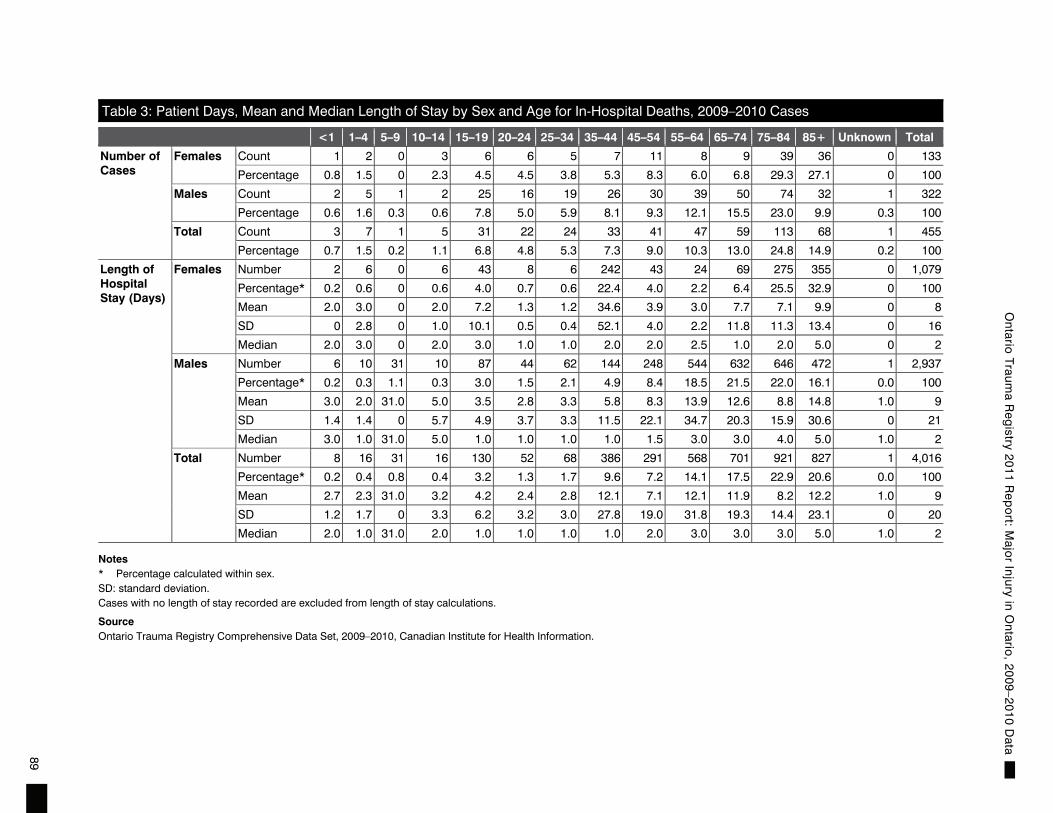
89
Ontario
Trauma R
egistry 2011 R
epo
rt: Majo
r Injury in O
ntario
, 2009–2010 Data
Table 3: Patient Days, Mean and Median Length of Stay by Sex and Age for In-Hospital Deaths, 2009–2010 Cases
<1 1–4 5–9 10–14 15–19 20–24 25–34 35–44 45–54 55–64 65–74 75–84 85+ Unknown Total
Number of Cases
Females Count 1 2 0 3 6 6 5 7 11 8 9 39 36 0 133
Percentage 0.8 1.5 0 2.3 4.5 4.5 3.8 5.3 8.3 6.0 6.8 29.3 27.1 0 100
Males Count 2 5 1 2 25 16 19 26 30 39 50 74 32 1 322
Percentage 0.6 1.6 0.3 0.6 7.8 5.0 5.9 8.1 9.3 12.1 15.5 23.0 9.9 0.3 100
Total Count 3 7 1 5 31 22 24 33 41 47 59 113 68 1 455
Percentage 0.7 1.5 0.2 1.1 6.8 4.8 5.3 7.3 9.0 10.3 13.0 24.8 14.9 0.2 100
Length of Hospital Stay (Days)
Females Number 2 6 0 6 43 8 6 242 43 24 69 275 355 0 1,079
Percentage* 0.2 0.6 0 0.6 4.0 0.7 0.6 22.4 4.0 2.2 6.4 25.5 32.9 0 100
Mean 2.0 3.0 0 2.0 7.2 1.3 1.2 34.6 3.9 3.0 7.7 7.1 9.9 0 8
SD 0 2.8 0 1.0 10.1 0.5 0.4 52.1 4.0 2.2 11.8 11.3 13.4 0 16
Median 2.0 3.0 0 2.0 3.0 1.0 1.0 2.0 2.0 2.5 1.0 2.0 5.0 0 2
Males Number 6 10 31 10 87 44 62 144 248 544 632 646 472 1 2,937
Percentage* 0.2 0.3 1.1 0.3 3.0 1.5 2.1 4.9 8.4 18.5 21.5 22.0 16.1 0.0 100
Mean 3.0 2.0 31.0 5.0 3.5 2.8 3.3 5.8 8.3 13.9 12.6 8.8 14.8 1.0 9
SD 1.4 1.4 0 5.7 4.9 3.7 3.3 11.5 22.1 34.7 20.3 15.9 30.6 0 21
Median 3.0 1.0 31.0 5.0 1.0 1.0 1.0 1.0 1.5 3.0 3.0 4.0 5.0 1.0 2
Total Number 8 16 31 16 130 52 68 386 291 568 701 921 827 1 4,016
Percentage* 0.2 0.4 0.8 0.4 3.2 1.3 1.7 9.6 7.2 14.1 17.5 22.9 20.6 0.0 100
Mean 2.7 2.3 31.0 3.2 4.2 2.4 2.8 12.1 7.1 12.1 11.9 8.2 12.2 1.0 9
SD 1.2 1.7 0 3.3 6.2 3.2 3.0 27.8 19.0 31.8 19.3 14.4 23.1 0 20
Median 2.0 1.0 31.0 2.0 1.0 1.0 1.0 1.0 2.0 3.0 3.0 3.0 5.0 1.0 2
Notes * Percentage calculated within sex. SD: standard deviation. Cases with no length of stay recorded are excluded from length of stay calculations.
Source Ontario Trauma Registry Comprehensive Data Set, 2009–2010, Canadian Institute for Health Information.

90 Ontario
Trauma R
egistry 2011 R
epo
rt: Majo
r Injury in O
ntario
, 2009–2010 Data
Table 4: Denominators by Institution Code, 2009–2010 Cases
Institution Code
A B C D E F G H I J K L M N Total
Number of Cases 133 700 401 60 68 555 239 150 68 217 826 185 582 51 4,235
Number of Cases Discharged Alive 114 603 353 42 60 465 200 145 65 192 729 163 524 48 3,703
Number of Deaths* 19 97 48 18 8 90 39 5 3 25 97 22 58 3 532
Number Who Died in Emergency Room 2 20 2 1 1 9 2 0 0 7 23 5 2 0 74
Number of Pediatric Cases (Age <18) 9 18 1 0 68 18 23 150 68 7 18 12 3 51 446
Number of Cases Age >10† 130 698 400 59 35 555 233 58 42 215 826 182 581 21 4,035
Number of Cases Age <20 13 42 26 0 68 39 33 150 68 14 65 16 30 51 615
Number of Cases Age 20–64 81 427 271 25 0 345 131 0 0 106 558 113 310 0 2,367
Number of Cases Age 65+ 39 229 104 34 0 171 75 0 0 97 203 56 241 0 1,249
Notes * The total number of deaths reported includes in-hospital deaths and deaths in the emergency department. Deaths occurring at the scene are excluded. † Number of cases older than age 10 can be used for BAC calculation. BAC: blood alcohol concentration. This table provides denominators to allow calculation of percentages.
Source Ontario Trauma Registry Comprehensive Data Set, 2009–2010, Canadian Institute for Health Information.
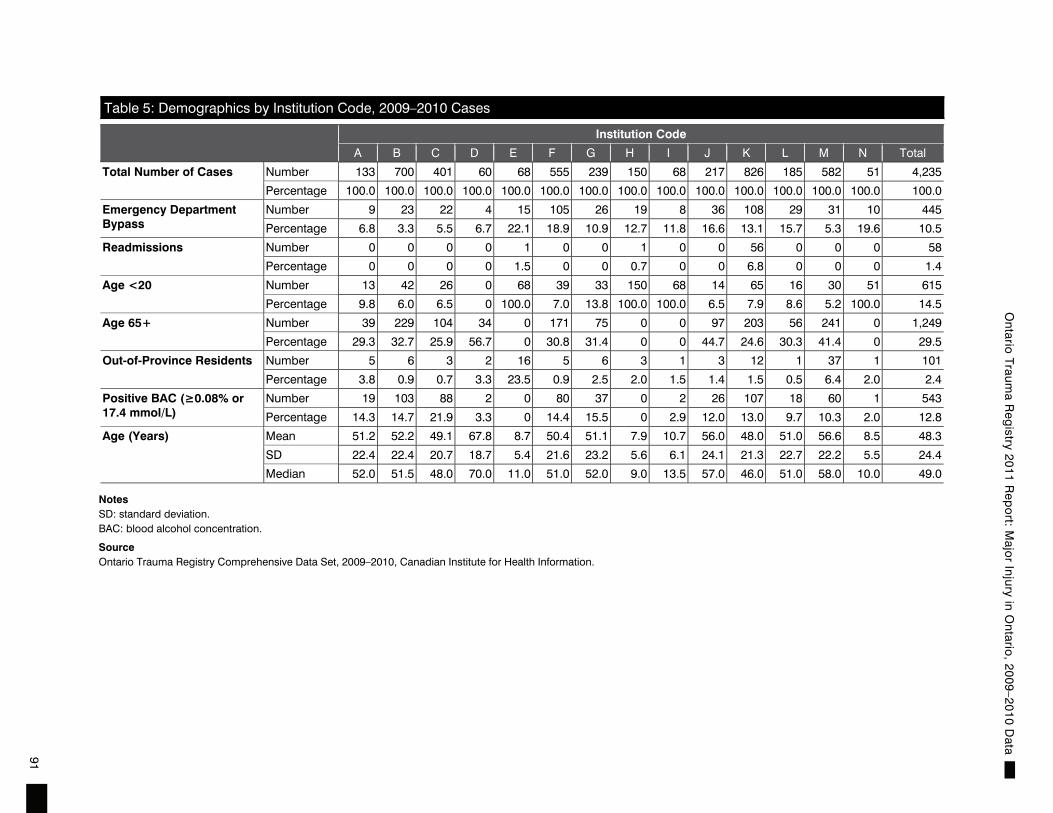
91
Ontario
Trauma R
egistry 2011 R
epo
rt: Majo
r Injury in O
ntario
, 2009–2010 Data
Table 5: Demographics by Institution Code, 2009–2010 Cases
Institution Code
A B C D E F G H I J K L M N Total
Total Number of Cases Number 133 700 401 60 68 555 239 150 68 217 826 185 582 51 4,235
Percentage 100.0 100.0 100.0 100.0 100.0 100.0 100.0 100.0 100.0 100.0 100.0 100.0 100.0 100.0 100.0
Emergency Department Bypass
Number 9 23 22 4 15 105 26 19 8 36 108 29 31 10 445
Percentage 6.8 3.3 5.5 6.7 22.1 18.9 10.9 12.7 11.8 16.6 13.1 15.7 5.3 19.6 10.5
Readmissions Number 0 0 0 0 1 0 0 1 0 0 56 0 0 0 58
Percentage 0 0 0 0 1.5 0 0 0.7 0 0 6.8 0 0 0 1.4
Age <20 Number 13 42 26 0 68 39 33 150 68 14 65 16 30 51 615
Percentage 9.8 6.0 6.5 0 100.0 7.0 13.8 100.0 100.0 6.5 7.9 8.6 5.2 100.0 14.5
Age 65+ Number 39 229 104 34 0 171 75 0 0 97 203 56 241 0 1,249
Percentage 29.3 32.7 25.9 56.7 0 30.8 31.4 0 0 44.7 24.6 30.3 41.4 0 29.5
Out-of-Province Residents Number 5 6 3 2 16 5 6 3 1 3 12 1 37 1 101
Percentage 3.8 0.9 0.7 3.3 23.5 0.9 2.5 2.0 1.5 1.4 1.5 0.5 6.4 2.0 2.4
Positive BAC (≥0.08% or 17.4 mmol/L)
Number 19 103 88 2 0 80 37 0 2 26 107 18 60 1 543
Percentage 14.3 14.7 21.9 3.3 0 14.4 15.5 0 2.9 12.0 13.0 9.7 10.3 2.0 12.8
Age (Years) Mean 51.2 52.2 49.1 67.8 8.7 50.4 51.1 7.9 10.7 56.0 48.0 51.0 56.6 8.5 48.3
SD 22.4 22.4 20.7 18.7 5.4 21.6 23.2 5.6 6.1 24.1 21.3 22.7 22.2 5.5 24.4
Median 52.0 51.5 48.0 70.0 11.0 51.0 52.0 9.0 13.5 57.0 46.0 51.0 58.0 10.0 49.0
Notes SD: standard deviation. BAC: blood alcohol concentration.
Source Ontario Trauma Registry Comprehensive Data Set, 2009–2010, Canadian Institute for Health Information.

92 Ontario
Trauma R
egistry 2011 R
epo
rt: Majo
r Injury in O
ntario
, 2009–2010 Data
Table 6: Injury Severity Score and Glasgow Coma Scale Score by Institution Code, 2009–2010 Cases
Institution Code
A B C D E F G H I J K L M N Total
ISS—All Cases Mean 22.6 25.7 25.1 19.9 23.8 23.2 25.7 21.2 21.5 22.4 26.3 22.4 22.5 23.1 24.2
SD 9.4 10.9 10.8 9.3 11.0 9.0 10.1 7.1 9.1 8.8 10.5 8.0 8.4 8.6 9.9
Median 21.0 25.0 22.0 17.0 20.5 22.0 25.0 17.0 16.0 20.0 25.0 22.0 20.0 21.0 22.0
ISS—Survivors Mean 21.4 24.5 24.1 17.2 22.6 22.2 24.4 20.9 21.4 21.6 25.1 21.9 21.9 22.3 23.2
SD 7.3 9.4 9.7 4.6 9.3 7.5 8.8 6.9 9.2 7.8 9.5 7.6 8.1 7.7 8.8
Median 18.0 25.0 21.0 16.0 20.0 20.0 25.0 17.0 16.0 18.0 24.0 20.0 20.0 20.0 21.0
ISS—Deaths Mean 30.0 32.6 33.0 26.2 33.5 28.6 32.2 30.8 24.7 29.0 34.8 26.8 28.0 36.3 31.1
SD 15.9 15.6 15.0 13.8 17.1 13.0 13.2 8.8 8.5 12.6 13.8 9.3 9.5 12.7 13.7
Median 25.0 25.0 26.0 25.0 26.5 25.0 26.0 25.0 25.0 25.0 33.0 25.0 25.0 34.0 25.0
GCS Score Mean 13.0 13.4 13.4 14.1 13.4 13.6 13.8 14.4 14.3 12.9 13.8 13.6 13.6 13.5 13.6
SD 3.5 3.1 3.3 2.5 3.1 2.9 2.6 1.9 1.5 3.8 3.0 2.9 2.9 2.9 3.0
Median 15.0 15.0 15.0 15.0 15.0 15.0 15.0 15.0 15.0 15.0 15.0 15.0 15.0 15.0 15.0
GCS Score Incomplete Due to Use of Paralytic Agents
Number 7.0 18.0 38.0 2.0 9.0 9.0 18.0 23.0 5.0 11.0 0 15.0 40.0 2.0 197.0
Percentage 5.3 2.6 9.5 3.3 13.2 1.6 7.5 15.3 7.4 5.1 0 8.1 6.9 3.9 4.7
Notes SD: standard deviation. ISS: Injury Severity Score. GCS: Glasgow Coma Scale.
Source Ontario Trauma Registry Comprehensive Data Set, 2009–2010, Canadian Institute for Health Information.
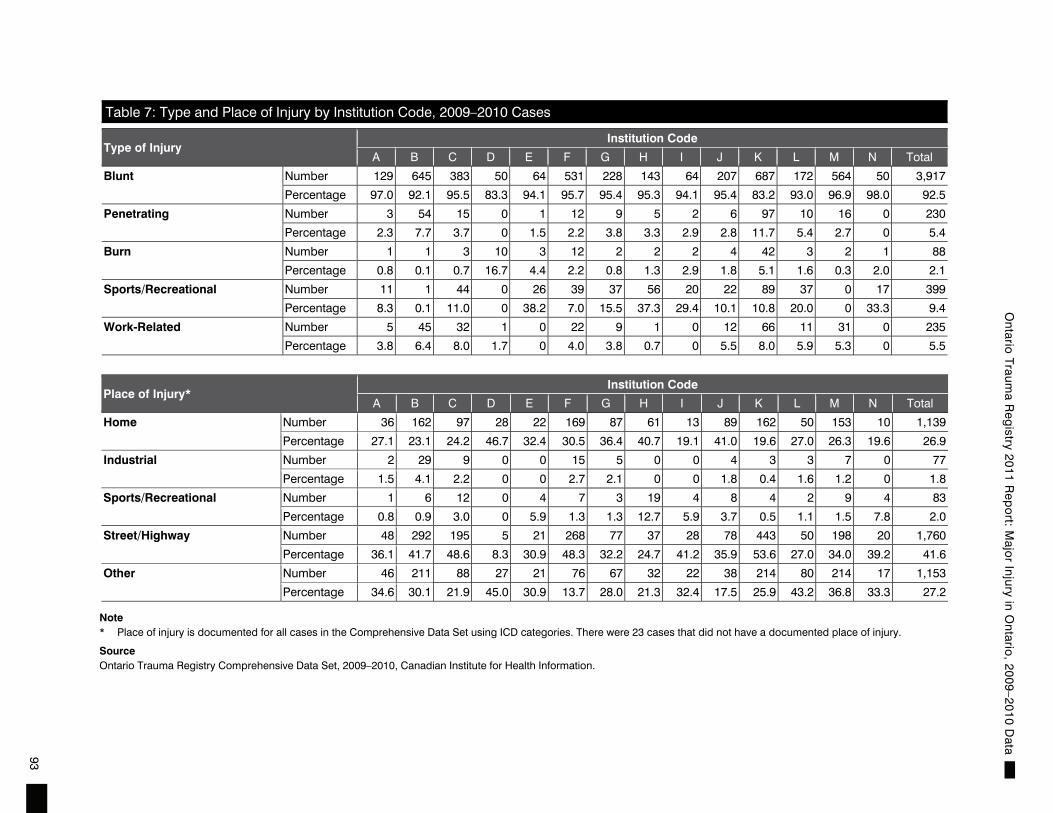
93
Ontario
Trauma R
egistry 2011 R
epo
rt: Majo
r Injury in O
ntario
, 2009–2010 Data
Table 7: Type and Place of Injury by Institution Code, 2009–2010 Cases
Type of Injury Institution Code
A B C D E F G H I J K L M N Total
Blunt Number 129 645 383 50 64 531 228 143 64 207 687 172 564 50 3,917
Percentage 97.0 92.1 95.5 83.3 94.1 95.7 95.4 95.3 94.1 95.4 83.2 93.0 96.9 98.0 92.5
Penetrating Number 3 54 15 0 1 12 9 5 2 6 97 10 16 0 230
Percentage 2.3 7.7 3.7 0 1.5 2.2 3.8 3.3 2.9 2.8 11.7 5.4 2.7 0 5.4
Burn Number 1 1 3 10 3 12 2 2 2 4 42 3 2 1 88
Percentage 0.8 0.1 0.7 16.7 4.4 2.2 0.8 1.3 2.9 1.8 5.1 1.6 0.3 2.0 2.1
Sports/Recreational Number 11 1 44 0 26 39 37 56 20 22 89 37 0 17 399
Percentage 8.3 0.1 11.0 0 38.2 7.0 15.5 37.3 29.4 10.1 10.8 20.0 0 33.3 9.4
Work-Related Number 5 45 32 1 0 22 9 1 0 12 66 11 31 0 235
Percentage 3.8 6.4 8.0 1.7 0 4.0 3.8 0.7 0 5.5 8.0 5.9 5.3 0 5.5
Place of Injury* Institution Code
A B C D E F G H I J K L M N Total
Home Number 36 162 97 28 22 169 87 61 13 89 162 50 153 10 1,139
Percentage 27.1 23.1 24.2 46.7 32.4 30.5 36.4 40.7 19.1 41.0 19.6 27.0 26.3 19.6 26.9
Industrial Number 2 29 9 0 0 15 5 0 0 4 3 3 7 0 77
Percentage 1.5 4.1 2.2 0 0 2.7 2.1 0 0 1.8 0.4 1.6 1.2 0 1.8
Sports/Recreational Number 1 6 12 0 4 7 3 19 4 8 4 2 9 4 83
Percentage 0.8 0.9 3.0 0 5.9 1.3 1.3 12.7 5.9 3.7 0.5 1.1 1.5 7.8 2.0
Street/Highway Number 48 292 195 5 21 268 77 37 28 78 443 50 198 20 1,760
Percentage 36.1 41.7 48.6 8.3 30.9 48.3 32.2 24.7 41.2 35.9 53.6 27.0 34.0 39.2 41.6
Other Number 46 211 88 27 21 76 67 32 22 38 214 80 214 17 1,153
Percentage 34.6 30.1 21.9 45.0 30.9 13.7 28.0 21.3 32.4 17.5 25.9 43.2 36.8 33.3 27.2
Note * Place of injury is documented for all cases in the Comprehensive Data Set using ICD categories. There were 23 cases that did not have a documented place of injury.
Source Ontario Trauma Registry Comprehensive Data Set, 2009–2010, Canadian Institute for Health Information.

94 Ontario
Trauma R
egistry 2011 R
epo
rt: Majo
r Injury in O
ntario
, 2009–2010 Data
Table 8: External Cause of Injury by Institution Code, 2009–2010 Cases
Institution Code
A B C D E F G H I J K L M N Total
Unintentional Falls Survivors Number 42 255 103 31 16 159 74 63 13 95 206 60 239 14 1,370
Percentage 31.6 36.4 25.7 51.7 23.5 28.6 31.0 42.0 19.1 43.8 24.9 32.4 41.1 27.5 32.3
Deaths Number 11 45 19 12 1 41 17 1 0 15 25 8 39 0 234
Percentage 8.3 6.4 4.7 20.0 1.5 7.4 7.1 0.7 0 6.9 3.0 4.3 6.7 0 5.5
All Number 53 300 122 43 17 200 91 64 13 110 231 68 278 14 1,604
Percentage 39.8 42.9 30.4 71.7 25.0 36.0 38.1 42.7 19.1 50.7 28.0 36.8 47.8 27.5 37.9
Motor Vehicle Traffic Survivors Number 34 183 145 2 20 201 66 32 23 45 316 34 154 15 1,270
Percentage 25.6 26.1 36.2 3.3 29.4 36.2 27.6 21.3 33.8 20.7 38.3 18.4 26.5 29.4 30.0
Deaths Number 1 25 22 0 0 29 9 1 1 5 34 8 10 2 147
Percentage 0.8 3.6 5.5 0 0 5.2 3.8 0.7 1.5 2.3 4.1 4.3 1.7 3.9 3.5
All Number 35 208 167 2 20 230 75 33 24 50 350 42 164 17 1,417
Percentage 26.3 29.7 41.6 3.3 29.4 41.4 31.4 22.0 35.3 23.0 42.4 22.7 28.2 33.3 33.5
Motor Vehicle Non-Traffic Survivors Number 7 21 26 1 9 16 22 7 6 9 23 30 39 5 221
Percentage 5.3 3.0 6.5 1.7 13.2 2.9 9.2 4.7 8.8 4.1 2.8 16.2 6.7 9.8 5.2
Deaths Number 2 2 1 0 0 3 2 0 0 0 1 1 0 0 12
Percentage 1.5 0.3 0.2 0 0 0.5 0.8 0 0 0 0.1 0.5 0 0 0.3
All Number 9 23 27 1 9 19 24 7 6 9 24 31 39 5 233
Percentage 6.8 3.3 6.7 1.7 13.2 3.4 10.0 4.7 8.8 4.1 2.9 16.8 6.7 9.8 5.5
Assault and Injury Purposely Inflicted (Excluding Poisoning)
Survivors Number 16 69 30 0 3 38 6 10 5 24 83 10 37 4 335
Percentage 12.0 9.9 7.5 0 4.4 6.8 2.5 6.7 7.4 11.1 10.0 5.4 6.4 7.8 7.9
Deaths Number 1 13 3 0 2 5 2 0 2 3 19 2 4 0 56
Percentage 0.8 1.9 0.7 0 2.9 0.9 0.8 0 2.9 1.4 2.3 1.1 0.7 0 1.3
All Number 17 82 33 0 5 43 8 10 7 27 102 12 41 4 391
Percentage 12.8 11.7 8.2 0 7.4 7.7 3.3 6.7 10.3 12.4 12.3 6.5 7.0 7.8 9.2
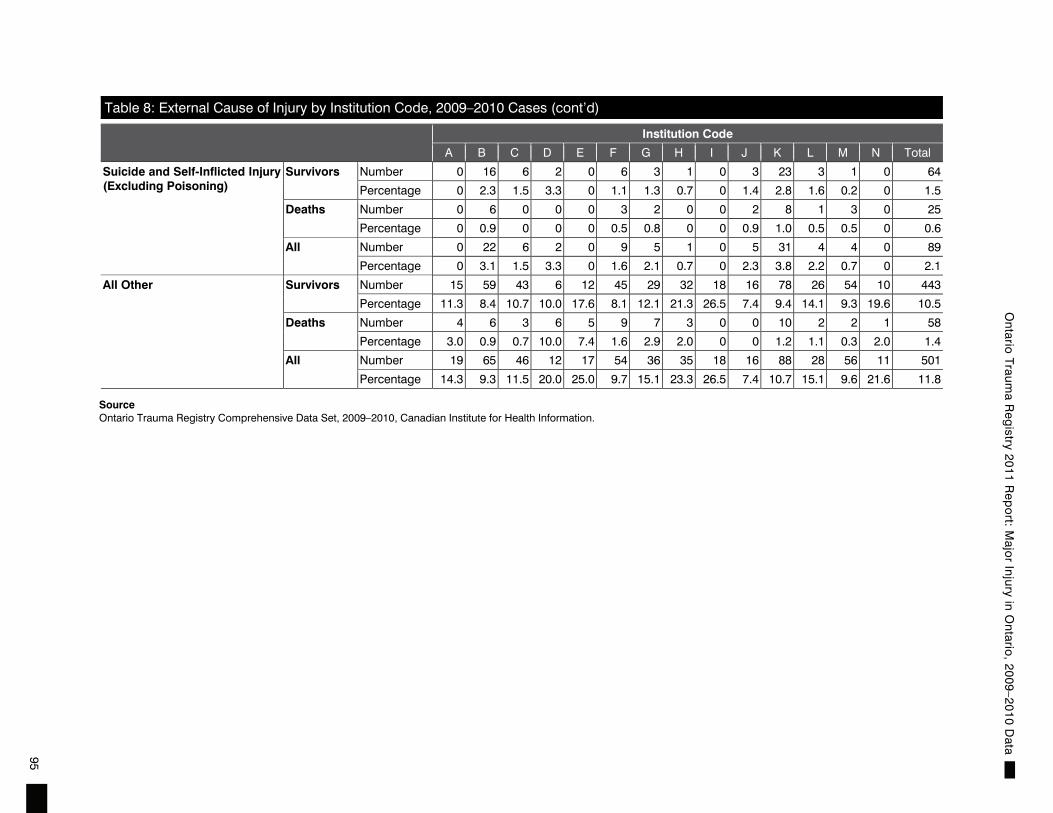
95
Ontario
Trauma R
egistry 2011 R
epo
rt: Majo
r Injury in O
ntario
, 2009–2010 Data
Table 8: External Cause of Injury by Institution Code, 2009–2010 Cases (cont’d)
Institution Code
A B C D E F G H I J K L M N Total
Suicide and Self-Inflicted Injury (Excluding Poisoning)
Survivors Number 0 16 6 2 0 6 3 1 0 3 23 3 1 0 64
Percentage 0 2.3 1.5 3.3 0 1.1 1.3 0.7 0 1.4 2.8 1.6 0.2 0 1.5
Deaths Number 0 6 0 0 0 3 2 0 0 2 8 1 3 0 25
Percentage 0 0.9 0 0 0 0.5 0.8 0 0 0.9 1.0 0.5 0.5 0 0.6
All Number 0 22 6 2 0 9 5 1 0 5 31 4 4 0 89
Percentage 0 3.1 1.5 3.3 0 1.6 2.1 0.7 0 2.3 3.8 2.2 0.7 0 2.1
All Other Survivors Number 15 59 43 6 12 45 29 32 18 16 78 26 54 10 443
Percentage 11.3 8.4 10.7 10.0 17.6 8.1 12.1 21.3 26.5 7.4 9.4 14.1 9.3 19.6 10.5
Deaths Number 4 6 3 6 5 9 7 3 0 0 10 2 2 1 58
Percentage 3.0 0.9 0.7 10.0 7.4 1.6 2.9 2.0 0 0 1.2 1.1 0.3 2.0 1.4
All Number 19 65 46 12 17 54 36 35 18 16 88 28 56 11 501
Percentage 14.3 9.3 11.5 20.0 25.0 9.7 15.1 23.3 26.5 7.4 10.7 15.1 9.6 21.6 11.8
Source Ontario Trauma Registry Comprehensive Data Set, 2009–2010, Canadian Institute for Health Information.

96 Ontario
Trauma R
egistry 2011 R
epo
rt: Majo
r Injury in O
ntario
, 2009–2010 Data
Table 9: Scene Information by Institution Code, 2009–2010 Cases
Institution Code
A B C D E F G H I† J K L M N Total
Pre-Hospital Time (Minutes) (95th Percentile)*
Mean 118.7 77.8 66.0 87.8 82.2 64.1 93.8 96.4 79.4 79.3 73.8 94.3 76.0 99.5 78.3
SD 162.3 105.8 78.3 102.7 84.2 72.0 102.0 125.8 89.9 103.1 93.2 69.2 98.5 115.0 97.5
Median 61.0 50.0 49.0 53.0 56.0 51.0 64.5 46.0 45.0 54.0 50.0 74.0 51.0 56.0 52.0
Scene Time (Minutes) Mean 21.7 18.0 17.2 21.9 17.8 20.3 21.3 15.2 21.2 18.9 19.1 21.8 21.1 18.4 19.4
SD 20.0 8.4 8.9 9.0 13.2 10.8 11.1 6.1 18.3 9.6 14.0 10.4 13.5 8.8 11.7
Median 16.0 17.0 16.0 20.0 13.0 18.5 19.0 14.0 15.0 17.0 17.0 20.0 19.0 15.0 17.0
Admissions With Scene Time Greater Than 1 Hour
Number 4.0 0.0 1.0 0.0 0.0 4.0 3.0 0.0 1.0 1.0 4.0 1.0 2.0 0.0 21.0
Percentage 5.1 0.0 0.3 0.0 0.0 1.5 1.8 0.0 7.7 0.6 1.1 1.0 0.6 0.0 1.0
Admissions With Extrication Required
Number 37.0 80.0 87.0 10.0 2.0 70.0 22.0 4.0 8.0 17.0 41.0 65.0 82.0 4.0 529.0
Percentage 27.8 11.4 21.7 16.7 2.9 12.6 9.2 2.7 11.9 7.8 5.0 35.1 14.1 7.8 12.5
Notes * The 95th percentile is used for pre-hospital time calculations to exclude those who are not transported directly from the scene and therefore have long pre-hospital times (that is, days or weeks). Of the 2,457 cases with pre-hospital times in 2009–2010, 122 (5%) had times greater than 848 minutes. † One case was removed from the analysis as a result of data error. SD: standard deviation.
Source Ontario Trauma Registry Comprehensive Data Set, 2009–2010, Canadian Institute for Health Information.

97
Ontario
Trauma R
egistry 2011 R
epo
rt: Majo
r Injury in O
ntario
, 2009–2010 Data
Table 10: Participating Hospital Care, 2009–2010 Cases
Institution Code
A B C D E F G H I J K L M N Total
Length of Hospital Stay (Days) All Cases—Mean
14.0 13.3 11.1 13.2 22.9 13.9 16.9 9.2 12.4 14.3 19.7 13.2 16.2 10.9 15.0
All Cases—SD 16.1 29.3 15.1 16.6 50.5 18.1 23.7 15.7 19.0 29.8 33.5 25.6 23.4 17.0 26.0
All Cases—Median
8.0 7.0 6.0 6.0 6.0 8.0 9.0 4.5 5.0 8.0 10.0 6.0 8.0 4.0 7.0
Survivors—Mean
15.2 14.0 11.7 14.9 24.4 14.5 18.3 9.5 12.9 15.3 20.4 14.0 17.0 11.4 15.8
Survivors—SD 16.8 30.8 15.5 17.5 52.8 16.4 24.5 15.9 19.3 31.1 33.4 26.8 24.1 17.4 26.7
Survivors—Median
9.0 7.0 6.0 7.0 6.0 8.0 10.0 5.0 5.0 8.0 10.0 7.0 9.0 4.0 8.0
Deaths—Mean 5.8 7.6 6.9 8.9 8.7 10.6 9.5 1.0 1.3 4.7 12.6 6.2 8.9 2.3 8.9
Deaths—SD 6.9 10.8 10.1 13.7 11.3 25.5 16.6 0.0 0.6 4.6 33.4 6.2 13.2 2.3 19.6
Deaths—Median 2.0 2.0 3.5 3.0 4.0 2.0 2.0 1.0 1.0 2.0 1.0 4.5 4.0 1.0 2.0
Length of SCU Stay (Days) All Cases—Mean
7.2 7.4 7.7 5.0 7.7 9.3 8.6 4.7 7.5 4.9 12.6 6.1 10.6 6.9 9.0
All Cases—SD 8.4 16.9 10.5 8.9 8.7 12.8 13.7 9.1 10.4 6.9 26.4 6.7 13.1 9.5 16.6
All Cases—Median
3.0 2.0 4.0 1.0 4.0 5.0 3.0 2.0 2.0 2.0 4.0 3.0 6.0 4.0 4.0
Survivors—Mean
7.9 7.8 7.7 5.3 7.9 9.9 9.4 5.1 8.0 5.0 12.8 6.4 11.4 7.3 9.5
Survivors—SD 9.1 18.2 10.5 9.2 8.8 13.0 14.1 9.4 10.7 7.1 26.0 7.0 13.6 9.8 16.9
Survivors—Median
3.0 3.0 4.0 2.5 4.0 6.0 4.0 2.0 2.0 2.0 5.0 3.5 6.0 4.0 4.0
Deaths—Mean 4.6 5.6 7.3 4.7 7.3 7.2 6.0 1.0 1.3 3.7 11.1 4.4 5.2 2.3 6.7
Deaths—SD 4.6 7.4 10.5 9.2 9.1 12.2 12.2 0.0 0.6 4.5 29.6 4.4 5.9 2.3 14.7
Deaths—Median 3.0 2.0 3.0 1.0 4.0 2.0 2.0 1.0 1.0 2.0 1.0 2.5 3.0 1.0 2.0
Length of Stay 3+ Days Number 116.0 564.0 303.0 41.0 53.0 444.0 190.0 108.0 57.0 164.0 668.0 134.0 495.0 35.0 3,372.0
Percentage 87.2 80.6 75.6 68.3 77.9 80.0 79.5 72.0 83.8 75.6 80.9 72.4 85.1 68.6 79.6
Number of OR Visits per Case Mean 1.3 1.5 1.5 1.1 2.9 1.4 1.4 1.9 1.2 1.2 1.7 1.3 1.4 1.1 1.5
SD 0.7 1.0 1.0 0.4 6.0 1.0 1.1 1.7 0.4 0.4 1.7 0.7 0.9 0.3 1.4
Median 1.0 1.0 1.0 1.0 1.0 1.0 1.0 1.0 1.0 1.0 1.0 1.0 1.0 1.0 1.0

98 Ontario
Trauma R
egistry 2011 R
epo
rt: Majo
r Injury in O
ntario
, 2009–2010 Data
Table 10: Participating Hospital Care, 2009–2010 Cases (cont’d)
Institution Code
A B C D E F G H I J K L M N Total
Cases With Intracranial Pressure Monitoring Days >0
Number 6.0 63.0 3.0 0.0 9.0 13.0 0.0 4.0 0.0 17.0 30.0 2.0 14.0 2.0 163.0
Percentage 4.5 9.0 0.7 0.0 13.2 2.3 0.0 2.7 0.0 7.8 3.6 1.1 2.4 3.9 3.8
Intracranial Pressure Monitoring Days
Mean 4.7 4.2 12.3 0.0 3.8 6.8 0.0 3.0 0.0 4.6 5.0 7.0 6.9 5.5 5.0
SD 2.3 3.5 9.6 0.0 2.3 5.0 0.0 1.8 0.0 3.9 7.5 7.1 5.6 0.7 5.0
Median 4.5 3.0 14.0 0.0 4.0 6.0 0.0 3.0 0.0 3.0 2.5 7.0 5.0 5.5 3.0
Cases With Ventilation Days >0 Number 34.0 288.0 133.0 10.0 26.0 215.0 80.0 46.0 2.0 45.0 315.0 48.0 122.0 12.0 1,376.0
Percentage 25.6 41.1 33.2 16.7 38.2 38.7 33.5 30.7 2.9 20.7 38.1 25.9 21.0 23.5 32.5
Ventilation Days Mean 5.6 7.7 7.0 1.3 5.7 8.0 7.2 3.4 1.0 6.0 9.7 2.3 3.7 5.0 7.2
SD 6.1 18.8 8.2 0.5 4.9 10.0 14.4 8.1 0.0 7.8 20.1 2.0 3.8 6.4 14.5
Median 2.0 2.0 5.0 1.0 4.0 5.0 3.0 1.0 1.0 2.0 2.0 1.0 2.0 3.5 2.0
Notes SCU: special care unit. OR: operating room. SD: standard deviation.
Source Ontario Trauma Registry Comprehensive Data Set, 2009–2010, Canadian Institute for Health Information.
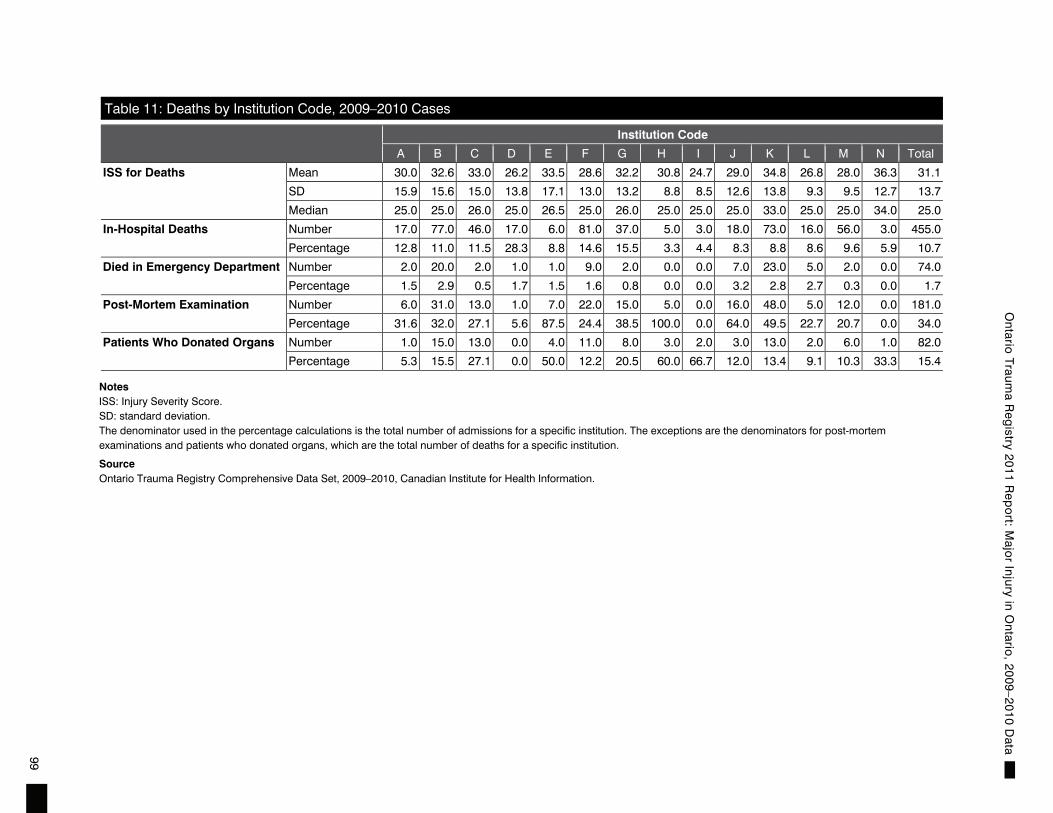
99
Ontario
Trauma R
egistry 2011 R
epo
rt: Majo
r Injury in O
ntario
, 2009–2010 Data
Table 11: Deaths by Institution Code, 2009–2010 Cases
Institution Code
A B C D E F G H I J K L M N Total
ISS for Deaths Mean 30.0 32.6 33.0 26.2 33.5 28.6 32.2 30.8 24.7 29.0 34.8 26.8 28.0 36.3 31.1
SD 15.9 15.6 15.0 13.8 17.1 13.0 13.2 8.8 8.5 12.6 13.8 9.3 9.5 12.7 13.7
Median 25.0 25.0 26.0 25.0 26.5 25.0 26.0 25.0 25.0 25.0 33.0 25.0 25.0 34.0 25.0
In-Hospital Deaths Number 17.0 77.0 46.0 17.0 6.0 81.0 37.0 5.0 3.0 18.0 73.0 16.0 56.0 3.0 455.0
Percentage 12.8 11.0 11.5 28.3 8.8 14.6 15.5 3.3 4.4 8.3 8.8 8.6 9.6 5.9 10.7
Died in Emergency Department Number 2.0 20.0 2.0 1.0 1.0 9.0 2.0 0.0 0.0 7.0 23.0 5.0 2.0 0.0 74.0
Percentage 1.5 2.9 0.5 1.7 1.5 1.6 0.8 0.0 0.0 3.2 2.8 2.7 0.3 0.0 1.7
Post-Mortem Examination Number 6.0 31.0 13.0 1.0 7.0 22.0 15.0 5.0 0.0 16.0 48.0 5.0 12.0 0.0 181.0
Percentage 31.6 32.0 27.1 5.6 87.5 24.4 38.5 100.0 0.0 64.0 49.5 22.7 20.7 0.0 34.0
Patients Who Donated Organs Number 1.0 15.0 13.0 0.0 4.0 11.0 8.0 3.0 2.0 3.0 13.0 2.0 6.0 1.0 82.0
Percentage 5.3 15.5 27.1 0.0 50.0 12.2 20.5 60.0 66.7 12.0 13.4 9.1 10.3 33.3 15.4
Notes ISS: Injury Severity Score. SD: standard deviation. The denominator used in the percentage calculations is the total number of admissions for a specific institution. The exceptions are the denominators for post-mortem examinations and patients who donated organs, which are the total number of deaths for a specific institution.
Source Ontario Trauma Registry Comprehensive Data Set, 2009–2010, Canadian Institute for Health Information.
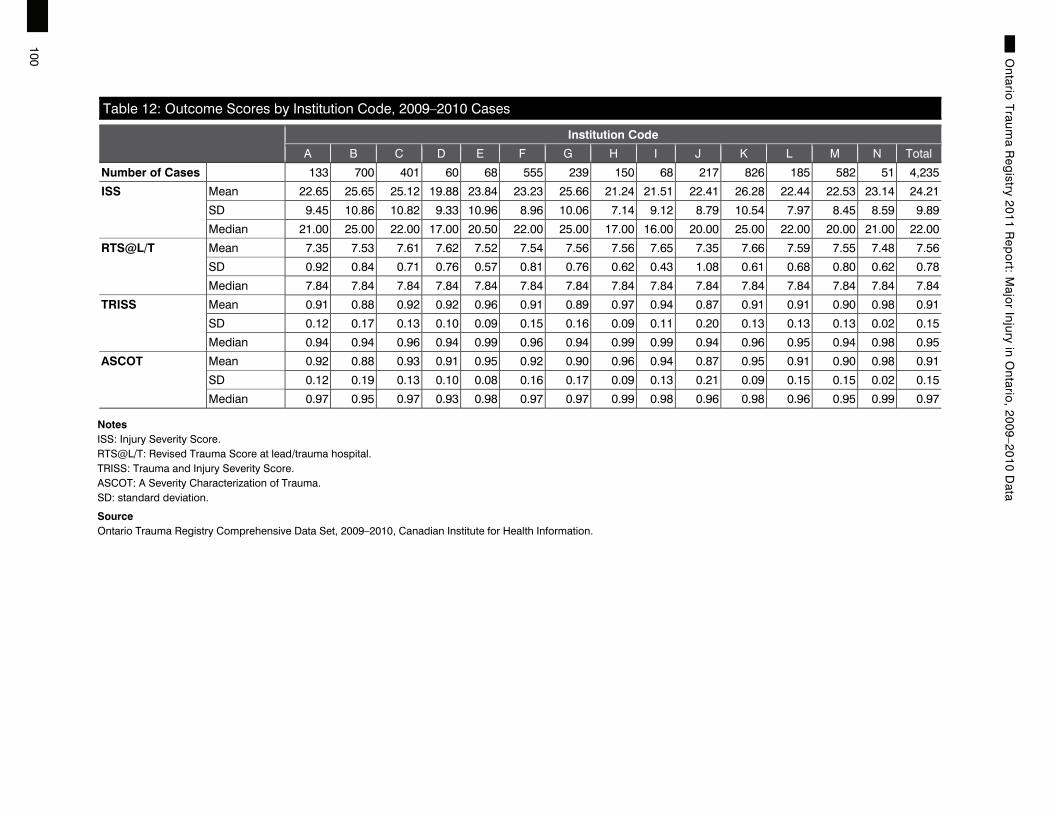
100
Ontario
Trauma R
egistry 2011 R
epo
rt: Majo
r Injury in O
ntario
, 2009–2010 Data
Table 12: Outcome Scores by Institution Code, 2009–2010 Cases
Institution Code
A B C D E F G H I J K L M N Total
Number of Cases 133 700 401 60 68 555 239 150 68 217 826 185 582 51 4,235
ISS Mean 22.65 25.65 25.12 19.88 23.84 23.23 25.66 21.24 21.51 22.41 26.28 22.44 22.53 23.14 24.21
SD 9.45 10.86 10.82 9.33 10.96 8.96 10.06 7.14 9.12 8.79 10.54 7.97 8.45 8.59 9.89
Median 21.00 25.00 22.00 17.00 20.50 22.00 25.00 17.00 16.00 20.00 25.00 22.00 20.00 21.00 22.00
RTS@L/T Mean 7.35 7.53 7.61 7.62 7.52 7.54 7.56 7.56 7.65 7.35 7.66 7.59 7.55 7.48 7.56
SD 0.92 0.84 0.71 0.76 0.57 0.81 0.76 0.62 0.43 1.08 0.61 0.68 0.80 0.62 0.78
Median 7.84 7.84 7.84 7.84 7.84 7.84 7.84 7.84 7.84 7.84 7.84 7.84 7.84 7.84 7.84
TRISS Mean 0.91 0.88 0.92 0.92 0.96 0.91 0.89 0.97 0.94 0.87 0.91 0.91 0.90 0.98 0.91
SD 0.12 0.17 0.13 0.10 0.09 0.15 0.16 0.09 0.11 0.20 0.13 0.13 0.13 0.02 0.15
Median 0.94 0.94 0.96 0.94 0.99 0.96 0.94 0.99 0.99 0.94 0.96 0.95 0.94 0.98 0.95
ASCOT Mean 0.92 0.88 0.93 0.91 0.95 0.92 0.90 0.96 0.94 0.87 0.95 0.91 0.90 0.98 0.91
SD 0.12 0.19 0.13 0.10 0.08 0.16 0.17 0.09 0.13 0.21 0.09 0.15 0.15 0.02 0.15
Median 0.97 0.95 0.97 0.93 0.98 0.97 0.97 0.99 0.98 0.96 0.98 0.96 0.95 0.99 0.97
Notes ISS: Injury Severity Score. RTS@L/T: Revised Trauma Score at lead/trauma hospital. TRISS: Trauma and Injury Severity Score. ASCOT: A Severity Characterization of Trauma. SD: standard deviation.
Source Ontario Trauma Registry Comprehensive Data Set, 2009–2010, Canadian Institute for Health Information.
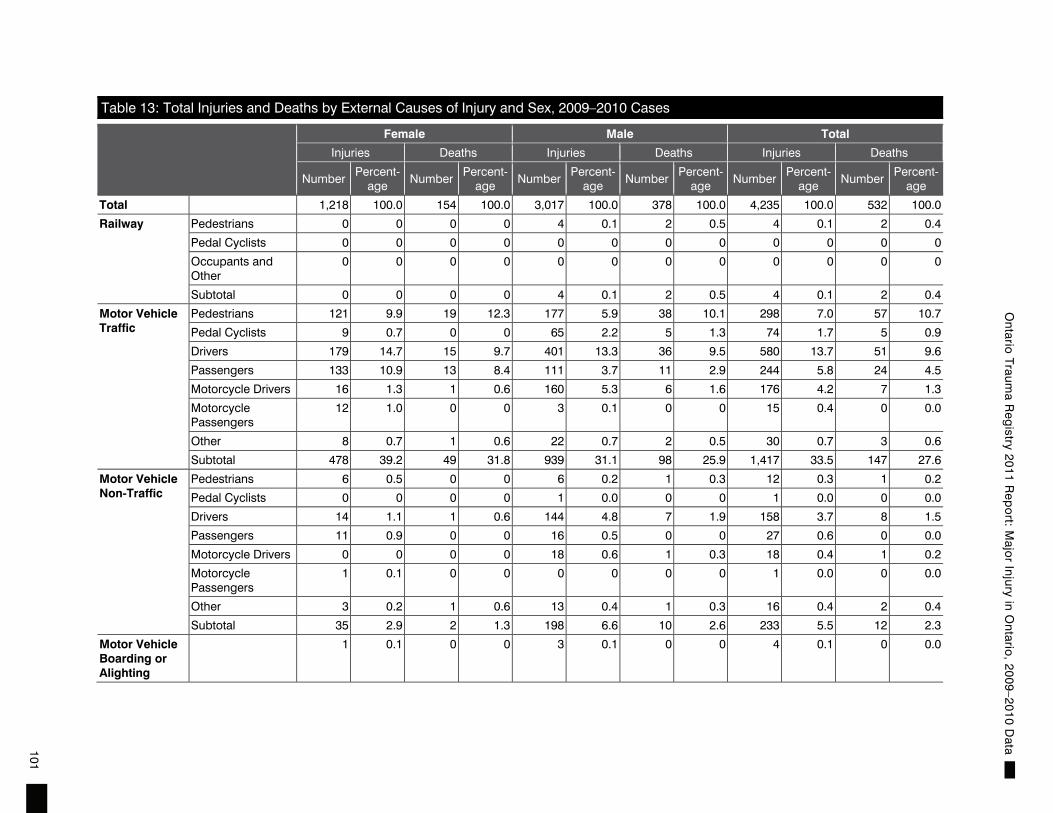
101
Ontario
Trauma R
egistry 2011 R
epo
rt: Majo
r Injury in O
ntario
, 2009–2010 Data
Table 13: Total Injuries and Deaths by External Causes of Injury and Sex, 2009–2010 Cases
Female Male Total
Injuries Deaths Injuries Deaths Injuries Deaths
Number Percent-
age Number
Percent-age
Number Percent-
age Number
Percent-age
Number Percent-
age Number
Percent-age
Total 1,218 100.0 154 100.0 3,017 100.0 378 100.0 4,235 100.0 532 100.0
Railway Pedestrians 0 0 0 0 4 0.1 2 0.5 4 0.1 2 0.4
Pedal Cyclists 0 0 0 0 0 0 0 0 0 0 0 0
Occupants and Other
0 0 0 0 0 0 0 0 0 0 0 0
Subtotal 0 0 0 0 4 0.1 2 0.5 4 0.1 2 0.4
Motor Vehicle Traffic
Pedestrians 121 9.9 19 12.3 177 5.9 38 10.1 298 7.0 57 10.7
Pedal Cyclists 9 0.7 0 0 65 2.2 5 1.3 74 1.7 5 0.9
Drivers 179 14.7 15 9.7 401 13.3 36 9.5 580 13.7 51 9.6
Passengers 133 10.9 13 8.4 111 3.7 11 2.9 244 5.8 24 4.5
Motorcycle Drivers 16 1.3 1 0.6 160 5.3 6 1.6 176 4.2 7 1.3
Motorcycle Passengers
12 1.0 0 0 3 0.1 0 0 15 0.4 0 0.0
Other 8 0.7 1 0.6 22 0.7 2 0.5 30 0.7 3 0.6
Subtotal 478 39.2 49 31.8 939 31.1 98 25.9 1,417 33.5 147 27.6
Motor Vehicle Non-Traffic
Pedestrians 6 0.5 0 0 6 0.2 1 0.3 12 0.3 1 0.2
Pedal Cyclists 0 0 0 0 1 0.0 0 0 1 0.0 0 0.0
Drivers 14 1.1 1 0.6 144 4.8 7 1.9 158 3.7 8 1.5
Passengers 11 0.9 0 0 16 0.5 0 0 27 0.6 0 0.0
Motorcycle Drivers 0 0 0 0 18 0.6 1 0.3 18 0.4 1 0.2
Motorcycle Passengers
1 0.1 0 0 0 0 0 0 1 0.0 0 0.0
Other 3 0.2 1 0.6 13 0.4 1 0.3 16 0.4 2 0.4
Subtotal 35 2.9 2 1.3 198 6.6 10 2.6 233 5.5 12 2.3
Motor Vehicle Boarding or Alighting
1 0.1 0 0 3 0.1 0 0 4 0.1 0 0.0

102
Ontario
Trauma R
egistry 2011 R
epo
rt: Majo
r Injury in O
ntario
, 2009–2010 Data
Table 13: Total Injuries and Deaths by External Causes of Injury and Sex, 2009–2010 Cases (cont’d)
Female Male Total
Injuries Deaths Injuries Deaths Injuries Deaths
Number Percent-
age Number Percent-
age Number Percent-
age Number Percent-
age Number Percent-
age Number Percent-
age
Other Road Vehicle
Pedestrians 4 0.3 1 0.6 6 0.2 1 0.3 10 0.2 2 0.4
Pedal Cyclists 15 1.2 0 0 60 2.0 4 1.1 75 1.8 4 0.8
Other 17 1.4 1 0.6 13 0.4 2 0.5 30 0.7 3 0.6
Subtotal 36 3.0 2 1.3 79 2.6 7 1.9 115 2.7 9 1.7
Water Transport
5 0.4 0 0 9 0.3 1 0.3 14 0.3 1 0.2
Air and Space Transport
0 0 0 0 5 0.2 1 0.3 5 0.1 1 0.2
Vehicle Incidents Not Elsewhere Classified
0 0 0 0 2 0.1 0 0 2 0.0 0 0.0
Unintentional Falls
539 44.3 76 49.4 1,065 35.3 158 41.8 1,604 37.9 234 44.0
Fire and Flames
11 0.9 4 2.6 51 1.7 11 2.9 62 1.5 15 2.8
Natural and Environmental Factors
4 0.3 1 0.6 16 0.5 1 0.3 20 0.5 2 0.4
Drowning 4 0.3 4 2.6 5 0.2 4 1.1 9 0.2 8 1.5
Suffocation 0 0 0 0 1 0.0 1 0.3 1 0.0 1 0.2
Foreign Bodies (Excluding Choking)
0 0 0 0 0 0 0 0 0 0 0 0
Suicide and Self-Inflicted Injury (Excluding Poisoning)
30 2.5 8 5.2 59 2.0 17 4.5 89 2.1 25 4.7

103
Ontario
Trauma R
egistry 2011 R
epo
rt: Majo
r Injury in O
ntario
, 2009–2010 Data
Table 13: Total Injuries and Deaths by External Causes of Injury and Sex, 2009–2010 Cases (cont’d)
Female Male Total
Injuries Deaths Injuries Deaths Injuries Deaths
Number Percent-
age Number Percent-
age Number Percent-
age Number Percent-
age Number Percent-
age Number Percent-
age
Assault and Injury Purposely Inflicted
35 2.9 4 2.6 356 11.8 52 13.8 391 9.2 56 10.5
Legal Intervention
0 0 0 0 5 0.2 1 0.3 5 0.1 1 0.2
Undetermined Whether Unintentionally or Purposely Inflicted
5 0.4 0 0 12 0.4 0 0 17 0.4 0 0.0
Operations of War
1 0.1 0 0 4 0.1 0 0 5 0.1 0 0.0
Other Incidents 34 2.8 4 2.6 204 6.8 14 3.7 238 5.6 18 3.4
All Other 0 0 0 0 0 0 0 0 0 0 0 0
Source Ontario Trauma Registry Comprehensive Data Set, 2009–2010, Canadian Institute for Health Information.

104
Ontario
Trauma R
egistry 2011 R
epo
rt: Majo
r Injury in O
ntario
, 2009–2010 Data
Table 14: Injury Case Summary by External Causes of Injury and Sex, 2009–2010 Cases
Female Male Total
Mean Median SD Mean Median SD Mean Median SD
Age ISS LOS LOS LOS Age ISS LOS LOS LOS Age ISS LOS LOS LOS
Total 53.2 24.2 15.1 8.0 24.0 46.3 24.2 15.0 7.0 26.8 48.3 24.2 15.0 7.0 26.0
Railway Pedestrians 0 0 0 0 0 45.0 38.3 10.0 5.0 12.3 45.0 38.3 10.0 5.0 12.3
Pedal Cyclists 0 0 0 0 0 0 0 0 0 0 0 0 0 0 0
Occupants and Other 0 0 0 0 0 0 0 0 0 0 0 0 0 0 0
Subtotal 0 0 0 0 0 45.0 38.3 10.0 5.0 12.3 45.0 38.3 10.0 5.0 12.3
Motor Vehicle Traffic
Pedestrians 45.9 28.8 23.4 11.0 40.2 43.0 27.8 17.6 8.0 25.6 44.2 28.2 20.0 9.0 32.5
Pedal Cyclists 29.3 25.4 15.0 11.0 15.2 36.0 25.4 16.8 8.0 20.1 35.2 25.4 16.5 8.0 19.5
Drivers 45.4 27.4 14.9 10.0 15.0 41.7 27.7 17.2 9.0 29.0 42.9 27.6 16.5 9.0 25.5
Passengers 41.1 26.7 12.6 8.0 13.1 31.2 27.9 18.1 8.5 29.9 36.6 27.2 15.1 8.0 22.6
Motorcycle Drivers 45.2 24.8 36.4 11.0 89.9 42.8 26.7 14.9 9.5 15.8 43.0 26.5 16.9 10.0 31.1
Motorcycle Passengers 38.3 25.0 21.8 17.0 22.9 33.0 22.3 10.3 8.0 6.8 37.3 24.5 19.5 15.0 21.0
Other 58.8 22.6 11.0 11.0 8.1 44.0 23.5 7.4 3.5 8.6 48.0 23.2 8.3 4.5 8.5
Subtotal 44.1 27.3 17.2 10.0 29.0 40.5 27.3 16.7 9.0 25.7 41.7 27.3 16.9 9.0 26.9
Motor Vehicle Non-Traffic
Pedestrians 17.3 25.0 13.7 8.5 13.2 34.0 36.3 8.0 8.5 4.2 25.7 30.7 10.8 8.5 9.8
Pedal Cyclists 0 0 0 0 0 25.0 26.0 1.0 1.0 0 25.0 26.0 1.0 1.0 0
Drivers 36.9 31.0 14.2 14.5 9.5 37.9 23.1 11.2 7.0 13.3 37.8 23.8 11.4 7.0 13.1
Passengers 25.5 25.6 9.2 6.5 8.0 34.2 20.0 10.9 6.0 16.5 30.6 22.3 10.2 6.0 13.7
Motorcycle Drivers 0 0 0 0 0 30.9 23.1 8.6 6.5 7.5 30.9 23.1 8.6 6.5 7.5
Motorcycle Passengers 54.0 36.0 13.0 13.0 0 0 0 0 0 0 54.0 36.0 13.0 13.0 0
Other 39.7 24.7 18.7 5.0 27.2 44.3 23.8 11.8 7.0 15.4 43.4 23.9 13.1 6.0 17.2
Subtotal 30.7 27.9 12.9 9.5 11.6 37.2 23.3 10.8 7.0 13.1 36.2 24.0 11.1 7.0 12.9
Motor Vehicle Boarding or Alighting
37.0 18.0 6.0 6.0 0 33.0 25.3 14.3 18.0 8.1 34.0 23.5 12.3 12.0 7.8
Other Road Vehicle
Pedestrians 45.0 25.8 8.5 7.0 7.5 44.3 22.3 10.2 7.5 11.4 44.6 23.7 9.5 7.0 9.6
Pedal Cyclists 46.6 22.5 4.9 3.0 4.4 48.0 20.7 11.1 4.0 18.8 47.7 21.0 9.8 4.0 17.1
Other 32.8 24.1 8.8 7.0 6.9 51.1 26.8 8.9 5.5 8.8 40.7 25.3 8.9 7.0 7.6
Subtotal 39.9 23.6 7.2 5.0 6.2 48.2 21.8 10.7 4.0 17.0 45.6 22.4 9.6 4.5 14.5

105
Ontario
Trauma R
egistry 2011 R
epo
rt: Majo
r Injury in O
ntario
, 2009–2010 Data
Table 14: Injury Case Summary by External Causes of Injury and Sex, 2009–2010 Cases (cont’d)
Female Male Total
Mean Median SD Mean Median SD Mean Median SD
Age ISS LOS LOS LOS Age ISS LOS LOS LOS Age ISS LOS LOS LOS
Water Transport 34.4 17.2 16.6 7.0 16.0 42.6 27.8 5.9 4.0 5.3 39.6 24.0 9.7 5.5 11.1
Air and Space Transport
0 0 0 0 0 34.2 27.2 13.4 12.0 7.0 34.2 27.2 13.4 12.0 7.0
Vehicle Incidents Not Elsewhere Classified
0 0 0 0 0 30.5 14.5 7.0 7.0 4.2 30.5 14.5 7.0 7.0 4.2
Unintentional Falls
66.8 21.3 12.1 7.0 14.4 59.6 22.5 15.0 7.0 30.6 62.0 22.1 14.0 7.0 26.3
Fire and Flames 50.7 25.4 60.2 51.0 87.5 43.7 25.7 44.8 22.0 59.7 44.9 25.6 47.2 22.5 64.1
Natural and Environmental Factors
44.5 22.3 10.8 11.5 8.7 45.8 26.9 15.8 10.0 17.6 45.5 26.0 14.8 10.0 16.2
Drowning 35.3 27.5 1.8 1.5 1.0 4.8 30.2 10.8 1.0 19.5 18.4 29.0 6.3 1.0 13.7
Suffocation 0 0 0 0 0 55.0 25.0 0 0 0 55.0 25.0 0 0 0
Foreign Bodies (Excluding Choking)
0 0 0 0 0 0 0 0 0 0 0 0 0 0 0
Suicide and Self-Inflicted Injury (Excluding Poisoning)
42.5 29.2 27.5 16.5 33.5 47.7 25.0 17.9 8.0 24.5 46.0 26.4 21.1 10.0 28.0
Assault and Injury Purposely Inflicted
36.3 22.5 20.5 13.0 32.1 31.2 22.7 9.8 5.0 16.0 31.6 22.7 10.8 5.0 18.2
Legal Intervention
0 0 0 0 0 35.6 21.2 22.0 17.5 18.9 35.6 21.2 22.0 17.5 18.9
Undetermined Whether Unintentionally or Purposely Inflicted
28.7 21.4 12.4 6.0 12.5 22.8 24.8 17.7 8.0 21.3 24.5 23.8 16.1 7.0 18.7
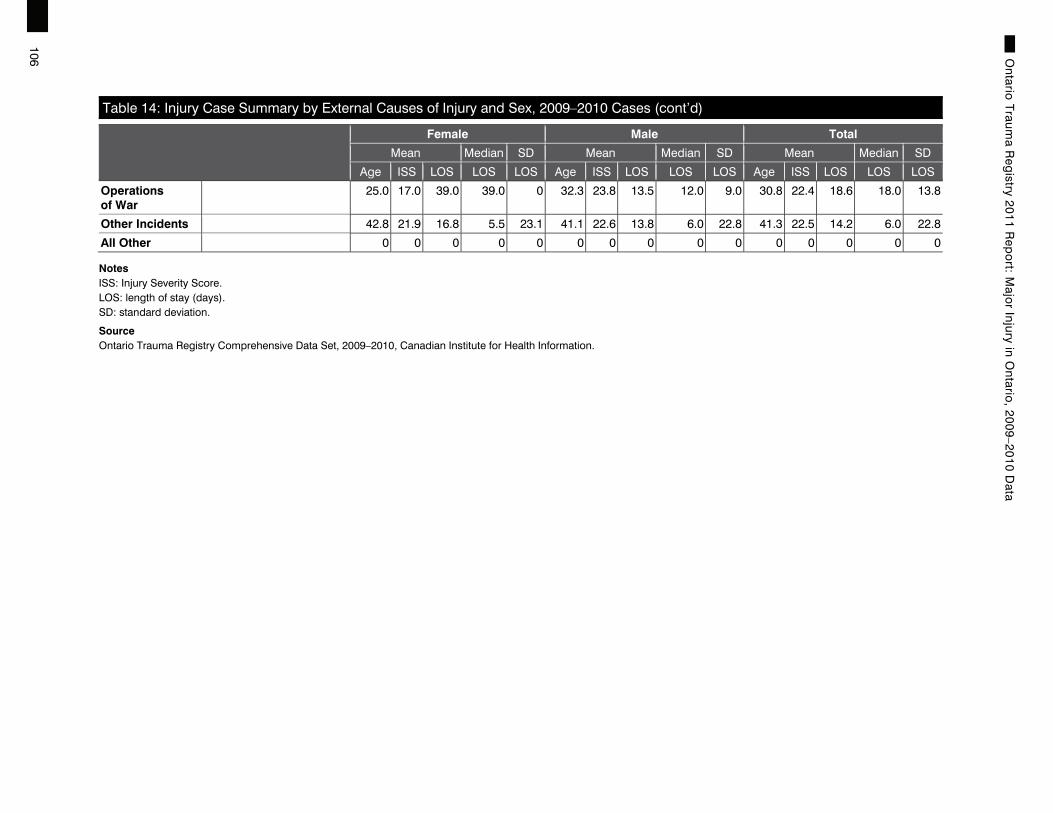
106
Ontario
Trauma R
egistry 2011 R
epo
rt: Majo
r Injury in O
ntario
, 2009–2010 Data
Table 14: Injury Case Summary by External Causes of Injury and Sex, 2009–2010 Cases (cont’d)
Female Male Total
Mean Median SD Mean Median SD Mean Median SD
Age ISS LOS LOS LOS Age ISS LOS LOS LOS Age ISS LOS LOS LOS
Operations of War
25.0 17.0 39.0 39.0 0 32.3 23.8 13.5 12.0 9.0 30.8 22.4 18.6 18.0 13.8
Other Incidents 42.8 21.9 16.8 5.5 23.1 41.1 22.6 13.8 6.0 22.8 41.3 22.5 14.2 6.0 22.8
All Other 0 0 0 0 0 0 0 0 0 0 0 0 0 0 0
Notes ISS: Injury Severity Score. LOS: length of stay (days). SD: standard deviation.
Source Ontario Trauma Registry Comprehensive Data Set, 2009–2010, Canadian Institute for Health Information.

107
Ontario
Trauma R
egistry 2011 R
epo
rt: Majo
r Injury in O
ntario
, 2009–2010 Data
Table 15: External Causes of Injury by Age Group, 2009–2010 Cases
<1 1–4 5–9 10–14 15–19 20–24 25–34 35–44 45–54 55–64 65–74 75–84 85+ Unknown Total Percent-
age
Number of Cases 54 64 59 109 329 329 462 468 605 503 410 568 271 4 4,235 100
Percentage of Cases 1.3 1.5 1.4 2.6 7.8 7.8 10.9 11.1 14.3 11.9 9.7 13.4 6.4 0.1 100 0
Railway Pedestrians 0 0 0 0 0 1 0 2 0 0 0 1 0 0 4 0.1
Pedal Cyclists 0 0 0 0 0 0 0 0 0 0 0 0 0 0 0 0
Occupants and Other
0 0 0 0 0 0 0 0 0 0 0 0 0 0 0 0
Subtotal 0 0 0 0 0 1 0 2 0 0 0 1 0 0 4 0.1
Motor Vehicle Traffic Pedestrians 1 5 5 20 35 21 35 36 34 29 21 39 17 0 298 7
Pedal Cyclists 0 0 4 9 9 5 11 13 10 6 4 2 0 1 74 1.7
Drivers 0 0 0 4 67 68 94 95 83 73 41 43 12 0 580 13.7
Passengers 3 5 5 2 54 39 33 21 25 19 12 16 10 0 244 5.8
Motorcycle Drivers 0 0 0 0 10 17 23 30 57 32 7 0 0 0 176 4.2
Motorcycle Passengers
0 0 0 1 1 3 2 2 4 2 0 0 0 0 15 0.4
Other 0 0 0 0 4 5 2 2 4 3 7 3 0 0 30 0.7
Subtotal 4 10 14 36 180 158 200 199 217 164 92 103 39 1 1,417 33.5
Motor Vehicle Non-Traffic
Pedestrians 0 3 1 0 2 1 0 3 1 0 0 1 0 0 12 0.3
Pedal Cyclists 0 0 0 0 0 0 1 0 0 0 0 0 0 0 1 0
Drivers 0 0 2 5 17 17 32 30 28 17 7 2 1 0 158 3.7
Passengers 0 2 2 2 3 3 2 6 3 4 0 0 0 0 27 0.6
Motorcycle Drivers 0 0 0 2 3 4 1 4 4 0 0 0 0 0 18 0.4
Motorcycle Passengers
0 0 0 0 0 0 0 0 1 0 0 0 0 0 1 0
Other 0 0 0 1 3 1 0 3 4 2 1 0 1 0 16 0.4
Subtotal 0 5 5 10 28 26 36 46 41 23 8 3 2 0 233 5.5
Motor Vehicle Boarding or Alighting
0 0 0 0 0 2 0 1 0 1 0 0 0 0 4 0.1

108
Ontario
Trauma R
egistry 2011 R
epo
rt: Majo
r Injury in O
ntario
, 2009–2010 Data
Table 15: External Causes of Injury by Age Group, 2009–2010 Cases (cont’d)
<1 1–4 5–9 10–14 15–19 20–24 25–34 35–44 45–54 55–64 65–74 75–84 85+ Unknown Total Percent-
age
Other Road Vehicle Pedestrians 0 0 0 0 1 1 1 1 3 1 1 1 0 0 10 0.2
Pedal Cyclists 0 0 1 8 3 4 2 10 19 10 8 9 1 0 75 1.8
Other 0 0 0 3 3 1 4 4 9 3 2 1 0 0 30 0.7
Subtotal 0 0 1 11 7 6 7 15 31 14 11 11 1 0 115 2.7
Water Transport 0 1 0 0 2 0 4 1 1 4 1 0 0 0 14 0.3
Air and Space Transport
0 0 0 0 1 1 1 0 2 0 0 0 0 0 5 0.1
Vehicle Incidents Not Elsewhere Classified
0 0 1 0 0 0 0 0 1 0 0 0 0 0 2 0
Unintentional Falls 31 25 24 22 32 32 68 73 192 218 249 418 220 0 1,604 37.9
Fire and Flames 0 1 2 3 1 6 4 13 9 11 5 6 0 1 62 1.5
Natural and Environmental Factors
0 0 3 1 1 0 2 2 2 3 3 2 1 0 20 0.5
Drowning 0 4 0 2 1 0 0 1 0 0 1 0 0 0 9 0.2
Suffocation 0 0 0 0 0 0 0 0 0 1 0 0 0 0 1 0
Foreign Bodies (Excluding Choking)
0 0 0 0 0 0 0 0 0 0 0 0 0 0 0 0
Suicide and Self-Inflicted Injury (Excluding Poisoning)
0 1 0 0 5 7 14 21 11 14 8 4 4 0 89 2.1
Assault and Injury Purposely Inflicted
14 6 1 0 52 82 86 57 60 21 8 2 0 2 391 9.2
Legal Intervention 0 0 0 0 0 0 2 3 0 0 0 0 0 0 5 0.1
Undetermined Whether Unintentionally or Purposely Inflicted
3 4 0 1 0 0 3 2 2 2 0 0 0 0 17 0.4

109
Ontario
Trauma R
egistry 2011 R
epo
rt: Majo
r Injury in O
ntario
, 2009–2010 Data
Table 15: External Causes of Injury by Age Group, 2009–2010 Cases (cont’d)
<1 1–4 5–9 10–14 15–19 20–24 25–34 35–44 45–54 55–64 65–74 75–84 85+ Unknown Total Percent-
age
Operations of War 0 0 0 0 0 0 4 1 0 0 0 0 0 0 5 0.1
Other Incidents 2 7 8 23 19 8 31 31 36 27 24 18 4 0 238 5.6
All Other 0 0 0 0 0 0 0 0 0 0 0 0 0 0 0 0
Source Ontario Trauma Registry Comprehensive Data Set, 2009–2010, Canadian Institute for Health Information.

110
Ontario
Trauma R
egistry 2011 R
epo
rt: Majo
r Injury in O
ntario
, 2009–2010 Data
Table 16: External Causes of Injury* by Age Group for Falls, 2009–2010 Cases
<1 1–4 5–9 10–14 15–19 20–24 25–34 35–44 45–54 55–64 65–74 75–84 85+ Total
Percent-age
Number of Cases 31 25 24 22 32 32 68 73 192 218 249 418 220 1,604 100
Percentage of Cases 1.9 1.6 1.5 1.4 2 2 4.2 4.6 12 13.6 15.5 26.1 13.7 100 0
W00 Involving Ice and Snow 0 0 0 0 0 0 0 2 1 6 6 4 1 20 1.2
W01 Slipping, Tripping and Stumbling
0 2 5 3 2 2 5 11 24 42 44 123 74 337 21
W02 Involving Skates, Skis, Sport Boards and Rollerblades
Ice Skates 0 0 0 0 1 0 1 0 2 3 1 0 0 8 0.5
Skis 0 0 0 2 0 0 0 0 1 2 1 1 0 7 0.4
Skateboards 0 0 0 1 4 1 1 0 0 0 0 0 1 8 0.5
Snowboards 0 0 0 1 0 1 0 0 1 0 0 0 0 3 0.2
Other Specified 0 0 0 0 0 0 1 1 0 0 0 0 0 2 0.1
Subtotal 0 0 0 4 5 2 3 1 4 5 2 1 1 28 1.7
W03 Collision With/Pushing by Another Person
0 2 1 0 0 0 3 0 0 0 0 0 0 6 0.4
W04 While Being Carried or Supported by Other Persons
16 2 1 0 0 0 0 0 0 0 0 0 0 19 1.2
W05 Involving Wheelchair and Other Types of Walking Devices
0 0 0 0 1 1 0 0 2 0 2 1 11 18 1.1
W06 Involving Bed 2 3 0 0 0 1 0 1 4 4 5 7 11 38 2.4
W07 Involving Chair 2 2 0 0 1 0 0 0 1 3 2 2 7 20 1.2
W08 Involving Other Furniture
6 0 1 0 0 0 0 0 2 0 0 2 1 12 0.7
W09 Playground Equipment 0 1 1 0 0 0 0 0 0 0 0 0 0 2 0.1
W10 On/From Stairs/Steps 0 4 5 1 5 4 15 13 52 63 74 87 30 353 22
W11 On/From Ladder 0 0 1 0 2 1 6 13 22 35 21 12 3 116 7.2
W12 On/From Scaffolding 0 0 0 0 0 1 2 2 3 5 3 0 0 16 1
W13 From, Out of or Through Building or Structure
0 5 2 5 5 9 24 16 28 10 9 5 0 118 7.4
W14 From Tree 0 0 3 1 2 1 0 2 9 1 4 1 2 26 1.6
W15 From Cliff 0 0 0 0 1 2 0 1 2 0 1 0 0 7 0.4

111
Ontario
Trauma R
egistry 2011 R
epo
rt: Majo
r Injury in O
ntario
, 2009–2010 Data
Table 16: External Causes of Injury* by Age Group for Falls, 2009–2010 Cases (cont’d)
<1 1–4 5–9 10–14 15–19 20–24 25–34 35–44 45–54 55–64 65–74 75–84 85+ Total Percent-
age
W16 Diving/Jumping Into Water
0 0 1 1 1 3 1 2 1 0 0 0 0 10 0.6
W17 Other Fall From One Level to Another
3 3 0 6 4 4 3 1 7 10 10 9 2 62 3.9
W18 Other Fall on Same Level
2 0 2 0 3 1 5 6 17 19 33 76 42 206 12.8
W19 Unspecified Fall 0 1 1 1 0 0 1 2 13 15 33 88 35 190 11.8
Note * Only cases with ICD-10-CA external cause of injury codes are included (ICD-10-CA W00 to W19).
Source Ontario Trauma Registry Comprehensive Data Set, 2009–2010, Canadian Institute for Health Information.
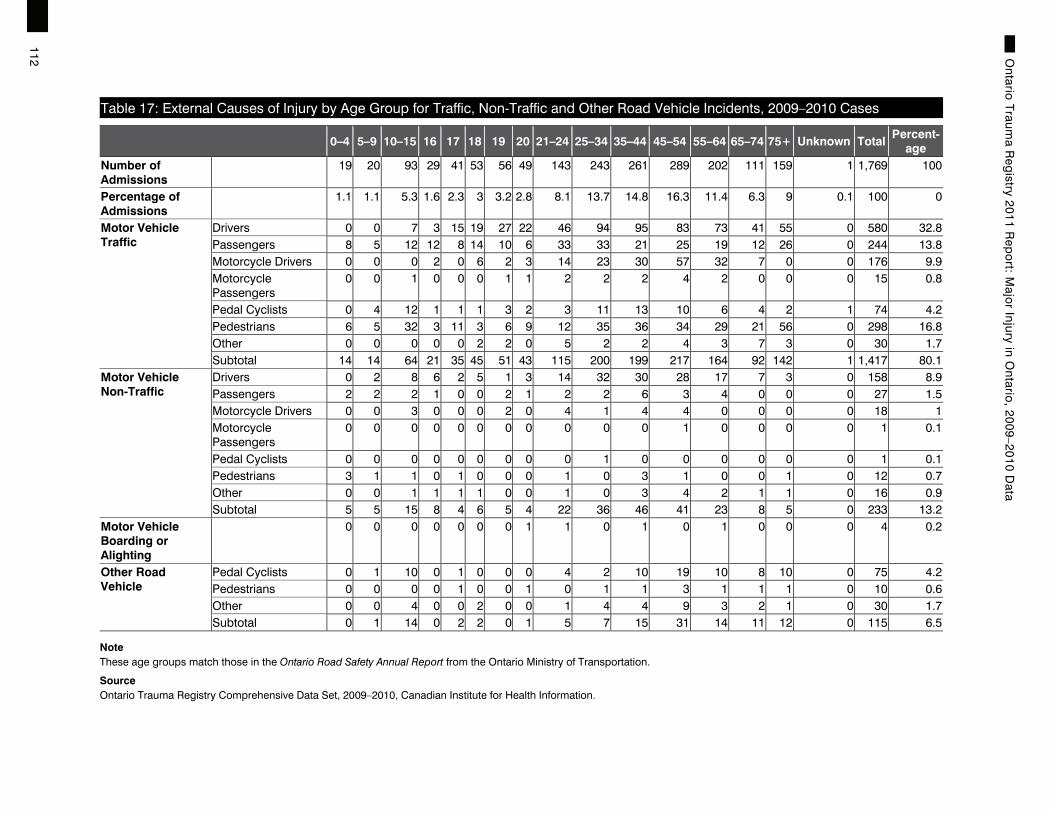
112
Ontario
Trauma R
egistry 2011 R
epo
rt: Majo
r Injury in O
ntario
, 2009–2010 Data
Table 17: External Causes of Injury by Age Group for Traffic, Non-Traffic and Other Road Vehicle Incidents, 2009–2010 Cases
0–4 5–9 10–15 16 17 18 19 20 21–24 25–34 35–44 45–54 55–64 65–74 75+ Unknown Total Percent-
age Number of Admissions
19 20 93 29 41 53 56 49 143 243 261 289 202 111 159 1 1,769 100
Percentage of Admissions
1.1 1.1 5.3 1.6 2.3 3 3.2 2.8 8.1 13.7 14.8 16.3 11.4 6.3 9 0.1 100 0
Motor Vehicle Traffic
Drivers 0 0 7 3 15 19 27 22 46 94 95 83 73 41 55 0 580 32.8 Passengers 8 5 12 12 8 14 10 6 33 33 21 25 19 12 26 0 244 13.8 Motorcycle Drivers 0 0 0 2 0 6 2 3 14 23 30 57 32 7 0 0 176 9.9 Motorcycle Passengers
0 0 1 0 0 0 1 1 2 2 2 4 2 0 0 0 15 0.8
Pedal Cyclists 0 4 12 1 1 1 3 2 3 11 13 10 6 4 2 1 74 4.2 Pedestrians 6 5 32 3 11 3 6 9 12 35 36 34 29 21 56 0 298 16.8 Other 0 0 0 0 0 2 2 0 5 2 2 4 3 7 3 0 30 1.7 Subtotal 14 14 64 21 35 45 51 43 115 200 199 217 164 92 142 1 1,417 80.1
Motor Vehicle Non-Traffic
Drivers 0 2 8 6 2 5 1 3 14 32 30 28 17 7 3 0 158 8.9 Passengers 2 2 2 1 0 0 2 1 2 2 6 3 4 0 0 0 27 1.5 Motorcycle Drivers 0 0 3 0 0 0 2 0 4 1 4 4 0 0 0 0 18 1 Motorcycle Passengers
0 0 0 0 0 0 0 0 0 0 0 1 0 0 0 0 1 0.1
Pedal Cyclists 0 0 0 0 0 0 0 0 0 1 0 0 0 0 0 0 1 0.1 Pedestrians 3 1 1 0 1 0 0 0 1 0 3 1 0 0 1 0 12 0.7 Other 0 0 1 1 1 1 0 0 1 0 3 4 2 1 1 0 16 0.9 Subtotal 5 5 15 8 4 6 5 4 22 36 46 41 23 8 5 0 233 13.2
Motor Vehicle Boarding or Alighting
0 0 0 0 0 0 0 1 1 0 1 0 1 0 0 0 4 0.2
Other Road Vehicle
Pedal Cyclists 0 1 10 0 1 0 0 0 4 2 10 19 10 8 10 0 75 4.2 Pedestrians 0 0 0 0 1 0 0 1 0 1 1 3 1 1 1 0 10 0.6 Other 0 0 4 0 0 2 0 0 1 4 4 9 3 2 1 0 30 1.7 Subtotal 0 1 14 0 2 2 0 1 5 7 15 31 14 11 12 0 115 6.5
Note These age groups match those in the Ontario Road Safety Annual Report from the Ontario Ministry of Transportation.
Source Ontario Trauma Registry Comprehensive Data Set, 2009–2010, Canadian Institute for Health Information.

113
Ontario
Trauma R
egistry 2011 R
epo
rt: Majo
r Injury in O
ntario
, 2009–2010 Data
Table 18: Total Injuries and Injury Type by Five-Year Age Groups, 2009–2010 Cases
<1 1–4 5–9 10–14 15–19 20–24 25–34 35–44 45–54 55–64 65–74 75–84 85+ Unknown Total
Percen-tage†
Total* 118 106 123 231 776 885 1,222 1,183 1,457 1,122 848 1,058 507 5 9,641 N/A
Percentage of Total† 2.8 2.5 2.9 5.5 18.3 20.9 28.9 27.9 34.4 26.5 20 25 12 0.1 N/A N/A
Superficial 29 21 22 41 99 121 150 166 195 141 110 137 64 1 1,297 30.6
Musculoskeletal 38 30 38 67 228 265 372 387 469 373 254 271 132 0 2,924 69
Burns and Corrosion 0 2 2 7 6 10 13 27 20 12 5 10 0 1 115 2.7
Internal Organ 48 43 49 84 272 289 381 366 487 403 342 501 238 2 3,505 82.8
Crushing 0 0 0 1 1 3 2 2 3 2 2 0 0 0 16 0.4
Open Wound, Including Traumatic Amputation
0 5 8 25 117 127 192 154 178 110 82 99 58 1 1,156 27.3
Blood Vessels 0 0 3 1 32 28 48 28 30 27 15 12 7 0 231 5.5
Nerves and Spinal Cord 3 1 1 3 14 38 50 41 58 47 30 24 5 0 315 7.4
Other and Unspecified 0 4 0 2 7 4 14 12 17 7 8 4 3 0 82 1.9
Notes * Total refers to the total number of injury types. † The denominator for the percentage calculations is the total number of cases for the year. N/A: not applicable. If an admission has injuries that fall into several of the injury types, each type will be counted once. However, if a case has several injuries that all fall into one type, the case will be counted once.
Source Ontario Trauma Registry Comprehensive Data Set, 2009–2010, Canadian Institute for Health Information.

114
Ontario
Trauma R
egistry 2011 R
epo
rt: Majo
r Injury in O
ntario
, 2009–2010 Data
Table 19: Sports and Recreational Activity Injuries by External Causes of Injury, 2009–2010 Cases
Type of Sport and Recreational Activity
External Causes of Injury
All Others Falls MVCs All
Number of Cases Number of Cases Number of Cases Number of Cases
ATV 0 0 79 79
All Other 21 17 3 41
Cycling 49 0 41 90
Dirt Biking/Mini Biking/Motocross 0 0 36 36
Football 4 0 0 4
Hockey—Ice 12 1 0 13
Hockey—Other 1 0 0 1
Horseback Riding 19 1 2 22
Hunting/Shooting 2 0 0 2
Jogging/Running 0 1 0 1
Motorized Water Sports 7 0 0 7
Non-Motorized Water Sports 0 2 0 2
Play—Not Specified 5 8 0 13
Playground Equipment 0 2 0 2
Skateboarding 1 4 2 7
Skating—Ice 0 6 0 6
Skating—Inline/Roller 0 0 1 1
Skiing—Downhill 7 2 0 9
Snowboarding 0 3 0 3
Snowmobiling 0 0 40 40
Soccer 1 2 0 3
Swimming—Open Water 1 0 0 1
Swimming—Pool/Wading Pool/Unspecified 4 2 0 6

115
Ontario
Trauma R
egistry 2011 R
epo
rt: Majo
r Injury in O
ntario
, 2009–2010 Data
Table 19: Sports and Recreational Activity Injuries by External Causes of Injury, 2009–2010 Cases (cont’d)
Type of Sport and Recreational Activity
External Causes of Injury
All Others Falls MVCs All
Number of Cases Number of Cases Number of Cases Number of Cases
Tobogganing/Sledding/Snow Tubing (Not Towed) 9 0 0 9
Walking (for Exercise) 0 1 0 1
Total 143 52 204 399
Notes MVCs: motor vehicle collisions. ATV: all-terrain vehicle.
Source Ontario Trauma Registry Comprehensive Data Set, 2009–2010, Canadian Institute for Health Information.

116
Ontario
Trauma R
egistry 2011 R
epo
rt: Majo
r Injury in O
ntario
, 2009–2010 Data
Table 20: Sports and Recreational Activity Injuries by External Causes of Injury Among Cases Younger Than Age 20, 2009–2010 Cases
Type of Sport and Recreational Activity
External Causes of Injury
All Others Falls MVCs All
Number of Cases Number of Cases Number of Cases Number of Cases
ATV 0 0 22 22
All Other 11 7 1 19
Cycling 12 0 17 29
Dirt Biking/Mini Biking/Motocross 0 0 14 14
Football 4 0 0 4
Hockey—Ice 8 1 0 9
Hockey—Other 1 0 0 1
Horseback Riding 5 1 2 8
Hunting/Shooting 1 0 0 1
Jogging/Running 0 1 0 1
Motorized Water Sports 2 0 0 2
Play—Not Specified 5 7 0 12
Playground Equipment 0 2 0 2
Skateboarding 1 4 2 7
Skating—Inline/Roller 0 0 1 1
Skiing—Downhill 5 1 0 6
Snowboarding 0 1 0 1
Snowmobiling 0 0 6 6
Soccer 0 1 0 1
Swimming—Pool/Wading Pool/Unspecified 3 1 0 4
Tobogganing/Sledding/Snow Tubing (Not Towed) 7 0 0 7
Total 65 27 65 157
Notes MVCs: motor vehicle collisions. ATV: all-terrain vehicle.
Source Ontario Trauma Registry Comprehensive Data Set, 2009–2010, Canadian Institute for Health Information.

117
Ontario
Trauma R
egistry 2011 R
epo
rt: Majo
r Injury in O
ntario
, 2009–2010 Data
Table 21: Sports and Recreational Activity Injuries by External Causes of Injury Among Cases Age 20 to 34, 2009–2010 Cases
Type of Sport and Recreational Activity
External Causes of Injury
All Others Falls MVCs All
Number of Cases Number of Cases Number of Cases Number of Cases
ATV 0 0 17 17
All Other 4 5 0 9
Cycling 5 0 9 14
Dirt Biking/Mini Biking/Motocross 0 0 11 11
Hockey—Ice 2 0 0 2
Horseback Riding 4 0 0 4
Motorized Water Sports 1 0 0 1
Skating—Ice 0 1 0 1
Snowboarding 0 1 0 1
Snowmobiling 0 0 17 17
Soccer 0 1 0 1
Swimming—Pool/Wading Pool/Unspecified 0 1 0 1
Tobogganing/Sledding/Snow Tubing (Not Towed) 2 0 0 2
Walking (for Exercise) 0 1 0 1
Total 18 10 54 82
Notes MVCs: motor vehicle collisions. ATV: all-terrain vehicle.
Source Ontario Trauma Registry Comprehensive Data Set, 2009–2010, Canadian Institute for Health Information.

118
Ontario
Trauma R
egistry 2011 R
epo
rt: Majo
r Injury in O
ntario
, 2009–2010 Data
Table 22: Sports and Recreational Activity Injuries by External Causes of Injury Among Cases Age 35 to 64, 2009–2010 Cases
Type of Sport and Recreational Activity
External Causes of Injury
All Others Falls MVCs All
Number of Cases Number of Cases Number of Cases Number of Cases
Total 45 11 77 133
ATV 0 0 36 36
Cycling 21 0 12 33
Snowmobiling 0 0 17 17
Dirt Biking/Mini Biking/Motocross 0 0 11 11
All Other 6 3 1 10
Horseback Riding 8 0 0 8
Motorized Water Sports 4 0 0 4
Skating—Ice 0 4 0 4
Hockey—Ice 2 0 0 2
Non-Motorized Water Sports 0 2 0 2
Hunting/Shooting 1 0 0 1
Play—Not Specified 0 1 0 1
Skiing—Downhill 1 0 0 1
Snowboarding 0 1 0 1
Soccer 1 0 0 1
Swimming—Pool/Wading Pool/Unspecified 1 0 0 1
Notes MVCs: motor vehicle collisions. ATV: all-terrain vehicle.
Source Ontario Trauma Registry Comprehensive Data Set, 2009–2010, Canadian Institute for Health Information.
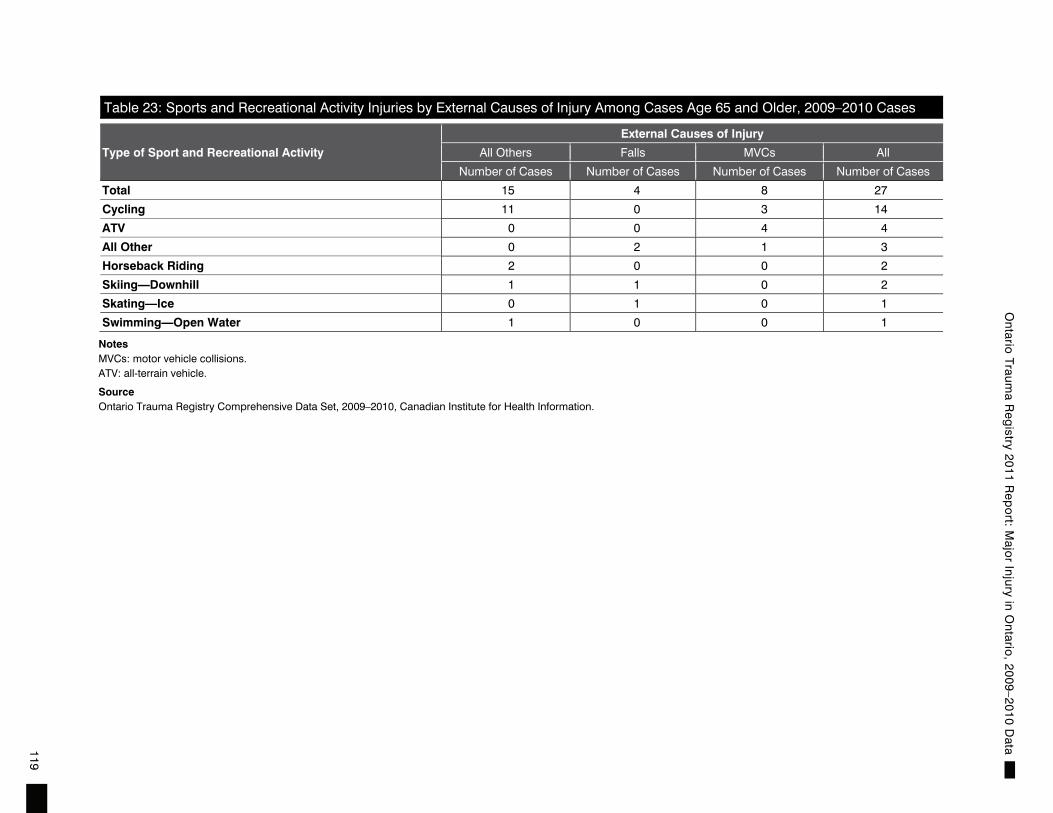
119
Ontario
Trauma R
egistry 2011 R
epo
rt: Majo
r Injury in O
ntario
, 2009–2010 Data
Table 23: Sports and Recreational Activity Injuries by External Causes of Injury Among Cases Age 65 and Older, 2009–2010 Cases
Type of Sport and Recreational Activity
External Causes of Injury
All Others Falls MVCs All
Number of Cases Number of Cases Number of Cases Number of Cases
Total 15 4 8 27
Cycling 11 0 3 14
ATV 0 0 4 4
All Other 0 2 1 3
Horseback Riding 2 0 0 2
Skiing—Downhill 1 1 0 2
Skating—Ice 0 1 0 1
Swimming—Open Water 1 0 0 1
Notes MVCs: motor vehicle collisions. ATV: all-terrain vehicle.
Source Ontario Trauma Registry Comprehensive Data Set, 2009–2010, Canadian Institute for Health Information.


121
Ontario Trauma Registry 2011 Report: Major Injury in Ontario, 2009–2010 Data
References 1. C. R. Boyd, M. A. Tolson and W. S. Copes, “Evaluating Trauma Care:
The TRISS Method,” The Journal of Trauma 27, 4 (1987): p. 370.
2. H. R. Champion et al., “The Major Trauma Outcome Study: Establishing National Norms for Trauma Care,” The Journal of Trauma 30, 11 (1990): p. 1356.

All rights reserved.
No part of this publication may be reproduced or transmitted in any form or by any
means, electronic or mechanical, including photocopying and recording, or by any
information storage and retrieval system now known or to be invented, without the
prior permission in writing from the owner of the copyright, except by a reviewer
who wishes to quote brief passages in connection with a review written for inclusion
in a magazine, newspaper or broadcast.
Requests for permission should be addressed to:
Canadian Institute for Health Information
495 Richmond Road, Suite 600
Ottawa, Ontario K2A 4H6
Phone: 613-241-7860
Fax: 613-241-8120
www.cihi.ca
ISBN 978-1-55465-827-5 (PDF)
© 2011 Canadian Institute for Health Information
How to cite this document:
Canadian Institute for Health Information, Ontario Trauma Registry 2011
Report: Major Injury in Ontario, 2009–2010 Data (Ottawa, Ont.: CIHI, 2011).
Cette publication est aussi disponible en français sous le titre Rapport de 2011
du Registre ontarien des traumatismes : Blessures graves en Ontario (données de
2009-2010).
ISBN 978-1-55465-860-2 (PDF)

Talk to UsCIHI Ottawa495 Richmond Road, Suite 600Ottawa, Ontario K2A 4H6Phone: 613-241-7860
CIHI Toronto4110 Yonge Street, Suite 300Toronto, Ontario M2P 2B7Phone: 416-481-2002
CIHI Victoria 880 Douglas Street, Suite 600 Victoria, British Columbia V8W 2B7 Phone: 250-220-4100
CIHI Montréal1010 Sherbrooke Street West, Suite 300Montréal, Quebec H3A 2R7Phone: 514-842-2226
CIHI St. John’s140 Water Street, Suite 701St. John’s, Newfoundland and Labrador A1C 6H6Phone: 709-576-7006
www.cihi.caMarch 2011