open data institute / whitepaper odi-wp-2017-002 how … · berners-lee and sir nigel shadbolt....
TRANSCRIPT

Open Data Institute / Whitepaper ODI-WP-2017-002
Fiona Smith, Emma Martinho-Truswell, Oliver Rice, Jessica WeereratneOpen Data Institute for Bernard van Leer Foundation
How dashboards can help cities improve early childhood development


Contents
Open Data Institute 2017 / Whitepaper How dashboards can help cities improve early childhood development 3
04 About
05 Foreword
06 Executive summary
07 High-level recommendations
08 Introduction
09 Understanding and monitoring early child development
The importance of child-friendly cities 09
City challenges: gathering and sharing the data 10
Importance of indicators 10
13 How a dashboard can help
Refining data and prioritising key areas 13
Case study: How to find where to target services in Istanbul, without having all the data 14
Increasing collaboration and overcoming silos 15
Case study: Overcoming silos across the New Zealand Government 16
Informing investment and planning decisions 17
Strengthening the voice of children and communities 18
Communicating information to the public 18
Case study: Engaging the community in Rio de Janeiro, Brazil 19
21 How to build an effective dashboard
When to use a dashboard 21
Building a strong strategy 21
Understanding audience and users 21
Selecting indicators 22
Dashboard design and maintenance 24
Strong leadership, culture change and literacy 24
Policy and privacy 25
27 Risks and challenges
The limits of ‘deliverology’ 27
Mismatched priorities and protocols 27
Inequality in resources 27
29 Methodology
30 Key informants and dashboards
32 Bibliography

Open Data Institute 2017 / Whitepaper How dashboards can help cities improve early childhood development 4
About
This report was commissioned by the Bernard van Leer Foundation and produced by the Open Data Institute and Oxford Insights
About the ODI
ODI works to build a strong, fair and sustainable data economy by helping governments and businesses around the world get data to people who need it. It is independent, nonprofit and nonpartisan, founded in 2012 by Sir Tim Berners-Lee and Sir Nigel Shadbolt. From its headquarters in London and via its global network of startups, members and nodes, the ODI offers training, research and strategic advice for organisations looking to explore the possibilities of data.
About Oxford Insights
Oxford Insights advises organisations on strategic, cultural and leadership opportunities from digital transformation and artificial intelligence. Oxford Insights combines new thinking on technology and leadership with experience getting things done in government. Its research, advice and pilot projects help organisations adopt innovative approaches in practical ways to increase their impact.
About the Bernard van Leer Foundation
The Bernard van Leer Foundation believes that giving all children a good start in life is both the right thing to do and the best way to build healthy, prosperous and creative societies.
It is a private foundation focused on developing and sharing knowledge about what works in early childhood development. It provides financial support and expertise to partners in government, civil society and business to help test and scale effective services for young children and families.
Authors: Fiona Smith, Emma Martinho-Truswell, Oliver Rice, Jessica Weereratne
Contributors: Charlotte Fleming Editing: Anna Scott and Charlotte Fleming
Design and art direction: Adrian Philpott / PHILPOTT design Illustration: Ian Dutnall

Open Data Institute 2017 / Whitepaper How dashboards can help cities improve early childhood development 5
Foreword
The Bernard van Leer Foundation’s Urban95 initiative supports city leaders, planners, managers and innovators to ask: if you could experience the city from 95cm the height of a 3-year-old what would you do differently?
Good data is fundamental to targeting resources effectively and facilitating collaboration. But the decisions that affect the wellbeing of young children tend to be split across multiple departments of a city government and typically none of these departments have easy access to all the different data they need.
Yet cities often have much more data than they realise about the issues that most affect young children and their families: the location and use of healthcare, childcare and preschool services; availability of public transport, bike paths and walking routes; air and water quality; rates of poverty, crime and malnutrition.
Cities can benefit greatly from bringing that data together in one place, linking it to neighbourhood-level data on where young children and their caregivers live, and making it available across departments. This can be a starting point to promote effective collaboration across city departments and between city authorities, NGOs and informal neighbourhood-led initiatives and perhaps even foster better integration between national and local data.
We are grateful to the Open Data Institute for their important work to explore ways in which data dashboards can guide city leaders and their teams to make better policy decisions for young children. As a next step, we will be working with ODI to develop a set of guiding questions that cities can use to get started. We hope this will help cities to ensure their youngest residents get off to the best possible start in life.
— Cecilia Vaca Jones, Programme Director Patrin Watanatada, Knowledge for Policy Director Bernard van Leer Foundation
Imag
e: R
anja
n K.
Pan
da /
Bern
ard
van
Leer
Fou
ndat
ion

Open Data Institute 2017 / Whitepaper How dashboards can help cities improve early childhood development 6
Executive summary
As more children are growing up in cities than ever before, cities are investigating new ways to become more child-friendly, and to measure their progress towards this goal. Data dashboards are one tool that can help a city set policy priorities, monitor progress, encourage collaboration, inform decisions, increase accountability, and strengthen the voices of children. This report considers when dashboards are useful, how they work, and what makes them more effective in promoting child-friendly cities.
Data dashboards seek to translate complex data into a clear narrative: commanding attention and directing decisions
This report explores how data dashboards could help guide city leaders and their teams to make better policy decisions about early childhood development (ECD).
Based on interviews with experts and practitioners in early childhood development, cities, and national government data teams, we outline the conditions that need to be considered when creating and designing an effective data dashboard.
Building an effective dashboard is not without challenges. Significant inequalities in resources exist between cities and regions, making it harder to collect and process data. However, cities such as Teresina in Brazil and Istanbul in Turkey are finding innovative ways of overcoming these challenges, via proxy indicators or new partnerships.
Through a range of case studies, we identify the problems and solutions faced when creating a good dashboard, at the practical and strategic levels. We hope that this report can help cities to develop targeted dashboards that can help them implement better policies for children.
While dashboards are not always the right tool, we found they can become indispensible in the effort of transforming early child development if carefully designed to suit a team’s needs, strategy and resources.
Imag
e: O
ded
Antm
an /
Bern
ard
van
Leer
Fou
ndat
ion
Open Data Institute 2017 / Whitepaper How dashboards can help cities improve early childhood development 7
High-level recommendations
Strategy1. Determine the purpose of collecting, aggregating
and displaying data consistent with your organisation’s strategy
2. Decide whether to use a dashboard to display data
3. Work out the ideal audience for the dashboard, and possible risks of sharing data
4. Decide whether access to the dashboard will be open, shared or closed
Indicators5. Use an inclusive process to decide which indicators to
include on the dashboard, as a way to refine strategy, focus attention and win broad support
6. Choose a small number of indicators
7. Set a target or a goal for the indicators in the dashboard
Dashboard design and maintenance8. Develop a dashboard that is:
a. Intuitive, with overall meaning that can be understood at first glance in ten seconds by a new user
b. Interactive, to enable the audience to learn more about important components, such as variations between geographic locations
9. Wherever possible, help users to put information in context, for example by using images or an explanation that appears when users roll over an indicator
10. Minimise manual work required to create or update the dashboard
11. Create a system that is consistent with other departmental or city-wide data management systems, including using the same data format
Leadership, culture and data literacy12. Ensure the team understands where data comes from,
what it means, and how their decisions and actions might influence indicators
13. Support a culture of learning, and encourage the team to see movements in indicators as opportunities to do things better
14. Encourage leaders to refer to the dashboard often as part of the organisation’s broader strategy
Policy and privacy15. Develop dashboards in line with relevant privacy laws,
along with supporting guidance/principles for staff in how to handle personal data
16. Publish guidelines about how data is collected and used, and ensure participants give informed consent
17. Modify dashboards to overcome privacy concerns, for example use aggregated data for a public-facing version of the dashboard

Open Data Institute 2017 / Whitepaper How dashboards can help cities improve early childhood development 8
Designing a data dashboard
There is no ‘one size fits all’ approach to designing a data dashboard. The choice of indicators and the design used to communicate them will differ based on objectives, the type of data collected and the intended audience and its needs.
For example, a dashboard intended to help inform the general public will need to take into account different levels of comprehension and technical literacy. When used internally to indicate the progress of a team against a specific objective, for example the design and language used on the dashboard might need to be different again.
Similarly, if indicators used are likely to demonstrate changes over a short period of time, then a dashboard might need to compare data that is collected frequently and regularly, making a ‘live’, reactive tool. In other circumstances where public policy might take longer for results and changes to become apparent, for example the dashboard might compare indicators from year to year.
As with any collection and distribution of data, the sensitivity of information being shared will also be considered. A dashboard that anyone can access, for example, should only publish data that has been published openly, with a licence that makes clear that anyone can access, use or share it. The narrower the audience and access to the dashboard, the fewer restrictions exist around the sensitivity of the data used.
Although dashboards are particularly effective when making public the indicators and outcomes of a project or initiative, this is not their only use. When used internally by an organisation, government or team, a dashboard can be an effective way of motivating and measuring progress. The process of developing a dashboard will frequently prove as useful for identifying priorities, clarifying needs and improving the collection of data, as the dashboards themselves.
A data dashboard is a tool for collating and sharing data in an accessible format.
What is a data dashboard?A dashboard can be used to draw attention to a need for change, assess progress, promote learning and accountability, and communicate information to a broad audience.
At its simplest, a dashboard could represent data numerically, for example, showing the number of road accidents in the past month in a particular region. More complex dashboards may combine maps, live-feeds, heat graphs, stories, alerts, and word clouds to provide further context.
The measures displayed on the dashboard (known as ‘indicators’) are selected to track the progress or impact of a particular problem or intervention over time. This allows teams to make comparisons at different intervals or locations to highlight where there are similarities, differences and movement.
Introduction

Open Data Institute 2017 / Whitepaper How dashboards can help cities improve early childhood development 9
Understanding and monitoring early child development
A child’s earliest experiences have huge consequences for how their motor, cognitive, linguistic and socio-emotional skills develop.
The network of services available to children and their caregivers, and the quality of the built environment within which they live, shape early experiences. The ambitious targets for 2030 as laid out in the SDGs, recognise that the impacts of early experience extend beyond the individual, and will have an impact on global development in general.[4]
The importance of child-friendly citiesAs more of the world’s children are growing up in cities than ever before,[5] BvLF is working with city governments around the world to find new and scalable ways to make cities child-friendly, as part of its Urban95 programme.[6] The ‘95’ refers to 95 centimetres the World Health Organization’s figure for the average height of a healthy three-year-old and invites us to think about the city from this perspective. A child-friendly city will have green spaces for children to explore, mobility to enable parents and caregivers to travel with children, and programmes that support parents and other caregivers to raise healthy and happy children.
Decisions made by city governments, urban planners and service providers can therefore have a big impact on the development of the children that live in their city. These decisions depend on accurate and timely data to help find, for example, where to strategically build playgrounds so they are easier to access, or where there are major gaps in services in order to prioritise investment.
Improvements in technology have made it easier to collect and process data. Better sensors and devices for data collection, cheaper data storage and increasingly sophisticated data analysis tools allow data to be used to make a decision, track progress, or evaluate or justify a policy.
How dashboards can help cities to improve early childhood developmentGovernments are recognising that metrics used to evaluate their performance are important.
The launch of the UN Sustainable Development Goals (SDGs) [1] and the development of other global indexes comparing country-by-country performance – including the Child Development Index (Save the Children)[2] and the Child Protection Index (World Vision)[3] – have inspired more governments make progress in improving child wellbeing and development.
As part of its mission to develop and share knowledge about what works in early childhood development, the Bernard van Leer Foundation (BvLF) asked the Open Data Institute (ODI) to explore how data dashboards could help guide better policy decisions for city leaders and their teams.
Using case studies and evidence drawn from interviews with a range of stakeholders working with data at the city level, this report examines how constructing a dashboard can help governments and teams to refine data, prioritise key areas and clearly communicate change to the public. Although not all stakeholders interviewed were focused specifically on early childhood policy, we were keen to understand what lessons might be replicable from innovative sectors and cities. This report therefore reviews how best to build effective dashboards and ensure they are being used to achieve optimum results, as well as their potential benefits for cities addressing early child development.
Governments are recognising that metrics used to evaluate their performance are important.
Our study found that data dashboards enabled cities to become more evidence-based when designing, implementing and monitoring early childhood policies, ultimately leading to better development outcomes for children. A well-designed dashboard – one that is simple, relevant and intuitive, populated with good and reliable data, and managed by a data literate team with a culture of learning – is shown to be an effective tool when part of a broader strategy that uses data to help guide decisions on early-childhood policy.
As well as being used publicly to help a city update its citizens on its progress, dashboards can have help to motivate teams, providing a way to compare progress and performance, and drive quality improvements and efficiencies. Choosing specific indicators helps set targets, determine what data to collect, and ultimately monitor and analyse progress.
1 See: https://sustainabledevelopment.un.org/sdgs.2 See: https://resourcecentre.savethechildren.net/node/6547/pdf/6547.pdf.3 See: http://www.wvi.org/armenia/article/child-protection-index.4 See: https://sustainabledevelopment.un.org/sdgs.5 UNICEF (2016), ‘State of the World’s Children 2016: a fair chance for every child’, https://www.unicef.org/publications/files/UNICEF_SOWC_2016.pdf.6 Urban95 is BvLF’s strategy to work with urban planners, architects, engineers and city managers to incorporate a focus on early childhood development into the planning and management of cities. Learn more at www.bernardvanleer.org/urban95.

Open Data Institute 2017 / Whitepaper How dashboards can help cities improve early childhood development 10
Importance of indicatorsAn ‘indicator’ refers to each particular measurement selected for use on a dashboard. As the term implies, the data is selected for its ability to show or illustrate the situation in the context of a region, time period or demographic. Where indicators are kept the same and demographics or time periods are changed, the dashboard is able to further illuminate the significance of that data.
Identifying appropriate indicators allows a dashboard to highlight areas of concern, measure and monitor progress by facilitating the setting of targets, and present the results of data collection in manageable and understandable formats. In this way, governments and cities have been able to use data to target policy and funding.
In relation to early child development, indicators typically fall into two categories:[8]
1. Measures at an individual level, which are most commonly development milestones assessed through interactions with individual children, e.g. age of acquiring the ability to identify patterns and recognise numbers.
2. Measures at a group or population level, which are more likely to be those used as a proxy for measuring child wellbeing or development, e.g. rates of vaccination coverage across a city; number of children regularly attending school. These ‘proxy’ indicators also address the presence of less targeted services and aspects of the urban environment, e.g accessibility of train stations. There is a growing trend to look at developmental milestones at a population level, e.g. Offord Centre’s Early Development Instrument,[9] Harvard’s Caregiver Reported Early Childhood Development Index[10] and Save the Children’s International Development and Early Learning Assessment.[11]
Individual-level and population-level indicators have different purposes. Individual level is often used diagnostically to understand problems and how to address them. Population level can help inform system-level decision making.
Because of the nature of data collection, indicators that measure data at an individual level is only likely to be accessible internally, through services already being provided. Where they are shared or made accessible to a wider audience, it is critical that data about individuals needs to be anonymised or aggregated.
A wide range of frameworks have been developed by child development experts and international non-government organisations to help guide decision-makers when selecting indicators. For instance, in the course of the Urban95 initiative, BvLF identified a number of metrics that measure aspects of a city that affect a young child’s development. Similarly, Unicef, the World Health Organization, the United Nations (Every Woman Every Child) and the Global Partnership for Education have developed indicator frameworks covering different aspects of ECD.
While in no way exhaustive, the table below illustrates common indicators that have already been considered by international ECD experts.[12] These give a sense of the type of data that might be relevant when targeting interventions and improving impact.
City challenges: gathering and sharing the dataSince the late 1990s, the different sectors of services working with children have built up core skills in database management, record keeping and statistical analysis of large administrative databases.[7] This has been in response both to increasing awareness of monitoring and evaluation’s benefits, and of data and the technology to collect it. The SDGs, associated global indexes, and a general movement to improve the monitoring and evaluation of relevant groups have encouraged those engaged with child development to gather significant quantities of data: birth weight, mortality, vaccinations, school attendance, exposure to violence and so on.
Data complexity
In addition to data directly related to ECD, data is also needed about other elements of child development. Therefore, it is not only the volume but the complexity of data that poses a particular challenge. Factors that may not seem obviously related to child development can have a significant impact on a child’s progress in later life, such as access to green space and good public transportation.
Monitoring a city’s design, mobility and accessibility features can be hugely important. Efficient public transport systems can make it easier and cheaper for caregivers of young children to visit early childhood services. Avoiding poor sanitation will decrease the likelihood of childhood illness, which can cause childhood mortality, stunt growth and limit children’s ability to go to school, play and learn through play.
Data sharing
To address challenges, governments and cities will need to share information across departments. One approach that has been successfully used by cities has been building multiagency integrated data systems as a way of pooling records from multiple agencies, and allowing them to be retrieved for analysis on an ongoing basis. However, combining records in this way is not yet the norm and so a lot of useful information for decision making still remains trapped in outdated systems, or isolated in silos. Dashboards are one way of identifying and drawing out this information, and ultimately promoting interactions between departments.
7 Coultin, C., Goerge, R., Putnam-Hornstein, E. and de Haan, B. (2015), ‘Harnessing big data for social good: a grand challenge for social work’, http://aaswsw.org/wp-content/uploads/2015/12/WP11-with-cover.pdf.8 Bernard van Leer Foundation (forthcoming 2017), ‘Measuring Early Childhood Development: Indicators of child development 0-5yrs’.9 See: https://edi.offordcentre.com.10 See: https://sites.sph.harvard.edu/credi.11 See: https://idela-network.org.12 Table informed by Bernard van Leer Foundation (forthcoming 2017), ‘Measuring early childhood development: Indicators of child development 0-5yrs’; Pia Rebello Britto (2015), ‘Why is ECD the bona fide foundation for the SDGs’, presentation for Unicef Connect; Vanessa Cavallera et al (2016), ‘WHO early child development indicators project’ presentation 9 November 2016, Geneva.

Open Data Institute 2017 / Whitepaper How dashboards can help cities improve early childhood development 11
Common indicators and data to measure progress
Area Significance to ECD Sample indicators to measure progress
Poverty[13] Families living in poverty are less likely to be able to afford the indirect costs of schooling, even when education is available for free. Transport, uniforms and supplies will often create a barrier to sending children to school. There is also a likelihood that children will be required to stay at home to assist in the household or family businesses.
% of children (0-5) and their families living on less than US$1.90 per day (purchasing power parity), by neighbourhood
Nutrition[14] Stunting, or low height-for-age, is caused by long-term insufficient nutrient intake and/or frequent infections. The prevalence of stunting in a population measures how many children are not growing well due to chronically poor nutrient intake. Stunted children are at risk of impaired brain development, lower IQ, weakened immune systems and serious health complications like diabetes and cancer later in life. Economists estimate that stunting can reduce a country’s GDP by as much as 12%.
% of children under age 5 who fall below the median height for age of the WHO standard, by neighbourhood
Access to health services[15]
Access to health services can lead to benefits such as lower incidence of disease.
As a proxy indicator, children who are getting immunised as recommended are likely to be those who are taken regularly to appropriate health services for checkups. This can demonstrate the existence and accessibility of those services and indicate a culture of following health-care advice.
% of children age 12-23 months who received all vaccinations recommended in the national immunization schedule by their first birthday, by neighbourhood
Education[16] Use of early education interventions such as nurseries and preschool demonstrate city provisions for ECD and a culture promoting the importance of education from a young age. Children enrolled early will be more likely to continue to education in later years.
Total enrollment rate in early childhood care or education, by neighbourhood
Public spaces[17]
The provision of safe urban spaces with natural features, such as parks and other green spaces, demonstrates a city’s understanding of how children need space to learn outside a school environment, be active and meet other children, and safely play and explore their environment. The extent to which spaces are actually used by families with young children is also important.
Average distance/time to travel on foot to a park or open space suitable for young children to play, by neighbourhood
13 SDG 1, see: http://www.un.org/sustainabledevelopment/sustainable-development-goals, BvLF (2017).14 SDG 2, BvLF (2017).15 SDG 3, BvLF (2017).16 SDG 4, BvLF (2017).17 SDG 11, BvLF (2017).

Open Data Institute 2017 / Whitepaper How dashboards can help cities improve early childhood development 12
Area Significance to ECD Sample indicators to measure progress
Protection from violence[18]
Physical punishment and psychological aggression is extremely disruptive to child development in the first years of life, and affects a child’s ability to trust and resolve conflicts in a non-violent way. Violence (and other adverse early experiences) can affect physical and mental health and learning ability.
% of children who experienced psychological aggression or physical punishment during the last month, by neighbourhood
Mobility[19] Ease and affordability for caregivers of young children to navigate their communities and physically access services such as healthcare, childcare, kindergarten and parks increases the likelihood of use.
% of families with pregnant women and children under 5 who can and/or do use accessible rapid transit, by neighbourhood
Water and sanitation[20]
Access to clean drinking water, latrines, and water alongside good hygiene practices, helps to reduce the spread of infectious disease and improve children’s nutritional status by increasing what children can safely eat.
% of households with a specific place for hand-washing where water and soap or other cleansing agents are present, by neighbourhood
Quality of childcare and learning[21]
The quality of services and experience of their interactions affects opportunities for children to develop to their full potential.
% child-staff ratios within individual childcare centres or kindergartens, where access to staff members can increase quality of education for children
Housing[22] The home is where young children spend most of their time in their early years. There should be enough space in homes for family members, with access to safe drinking water and reliable energy sources.
% of family-sized units in a multiple-unit dwelling or neighborhood
The precise combination of indicators for which data is collected and monitored depends on a city’s priorities. A data dashboard can be helpful, not only as a presentation of those indicators, but in identifying the priorities needed to select them. By mapping regions based on the indicators above, for example, it would be possible to establish trends, averages and the areas in need of interventions, and also where to monitor change and improvement.
18 SDG 16, BvLF (2017).19 BvLF (2017).20 BvLF (2017).21 BvLF (2017).22 BvLF (2017).

Open Data Institute 2017 / Whitepaper How dashboards can help cities improve early childhood development 13
Refining data and prioritising key areasBefore it is possible to begin collecting new data or monitoring progress, it is necessary to establish a purpose and strategy for the dashboard. Deciding its purpose and goals can be a useful process to help focus team priorities, and establish a starting point for data collection.
While still in the early stages of development, the city of Teresina in Brazil is building the Observatory of the Sustainable Development of Teresina (2030), which will allow citizens to view and compare the performance of core public services via an online dashboard. The process of choosing metrics and compiling data has already helped planners to identify areas where services and infrastructure most need improving, according to the priorities of the city.
This process was largely about compromising between what they wanted and what was already available. For example, they made use of local, regional and nationally collected statistics about the city, but they also made use of two mobile applications to collect new data: Waze[23] allows citizens to report road related problems to authorities, and in return also receive updates on traffic and road works; another, Colab,[24] has been adapted for use when consulting citizens, so that if the city has a new plan or proposal, citizens can read about it and give feedback about it through the app.
Sao Paulo’s Department for Education’s Information and Data Coordination team use open-source tools to extract, query, use and transform data in an automated process. Sourcing reliable, good quality, useful data was the team’s initial strategic aim. Now that their production process is in place, they are using the dashboard to help them spot and address problems.
In the course of selecting appropriate indicators, teams should identify what data they already hold, and what additional data might be able to tell them. It is often possible to use data that might not appear to be directly linked to the problems being measured. A measure like this is known as a ‘proxy’ measure.
As well as establishing and clarifying the parameters of further data collection, dashboards and their preparation can serve to create buy-in and build engagement with end-users.
Dashboards can help make and demonstrate progress towards goals.
Data dashboards are increasingly being used by city governments as a way to encourage, measure and demonstrate progress towards social and economic goals.
As with any data tool, the level of impact a data dashboard can have is strongly predicated on a range of factors. These include having an overall data strategy with a clear problem definition, selecting the right indicators, and ensuring access to the data needed. Understanding users and audience, and getting buy-in from senior leaders and team members, also increases impact.
The process of developing a dashboard can itself enable governments and organisations to refine the data that they hold, streamline data collection and break down the silos that inevitably exist between departments and areas of focus.
How a dashboard can help
23 See: https://www.waze.com.24 See: https://www.colab.re/gov.

Open Data Institute 2017 / Whitepaper How dashboards can help cities improve early childhood development 14
Case study: How to find where to target services in Istanbul, without having all the data
Figure 1: Urban95’s map of Istanbul’s distribution of poverty. Dark blue areas point to areas with the lowest real-estate valuation and the highest density of children under four.
The Bernard van Leer Foundation’s Urban95 project worked with district municipalities in Istanbul to decide how to better target funding for services, in particular for children under four.
Urban95 works with cities to identify which neighbourhoods are home to the most vulnerable children and caregivers. Alongside Professor Guvenc at the Istanbul Studies Centre of Kadir Has University and the Turkish Economic and Social Studies Foundation, BvLF mapped Istanbul’s distribution of poverty in order to help officials decide where to target spending.
Mapping children’s socio-economic status
The team were unable to find economic data broken down against population. They therefore used real-estate valuations as a proxy indicator for income levels in neighbourhoods and districts. They chose this because it is used by district municipalities to calculate tax revenue and a major assessment takes place every five years, making it likely to be a sustainable, up to date and accurate data source. Weighting exercises were carried out to remove outliers, allowing neighbourhoods to be categorised into having ‘above average’, ‘average’ and ‘below average’ property prices.
The dataset was then combined with density distribution of zero to four-year-olds across the same area, allowing the team to generate a map of the socio-economic status of this cohort of children across Istanbul. Age density data by neighborhood is collected by the National Statistics Institute of Turkey and is accessible to public.
Making the map accessible to officials
The team prioritised making this map accessible to officials, who found it hard to interpret data. They chose colours and design features that they thought would be appealing, rather than relying on those automatically generated by the software developed by Professor Guvenc.
The team worked with officials across municipalities to ensure the project outcomes were accepted and reliable. Data visualisations and maps were shown to staff to see whether they aligned with their experience. They also showed users what data they had collected. As a result, when shown the maps, officials were supportive and acknowledged that they aligned with their own experience.
Creating the map: challenges
A lack of data infrastructure meant the team had to develop base maps to make the data legible. However, according to Professor Guvenc, this process gave his team ‘invaluable skills and insights’. Static maps of greater Istanbul and each 39 district municipalities based on neighbourhoods were prepared and presented in January 2017. Since then, the Turkish Economic and Social Studies Foundation has collected data on district municipalities’ social services to align with these maps. The objective is to help decision makers better plan and target their communities with resources and services, such as parks, playgrounds, service centers and social welfare.
The launch of a website containing these interactive maps is planned for November 2017, with a view that over time they will be integrated into the policy decision-making cycle as a valuable source of information for officials.
Open Data Institute 2017 / Whitepaper How dashboards can help cities improve early childhood development 15
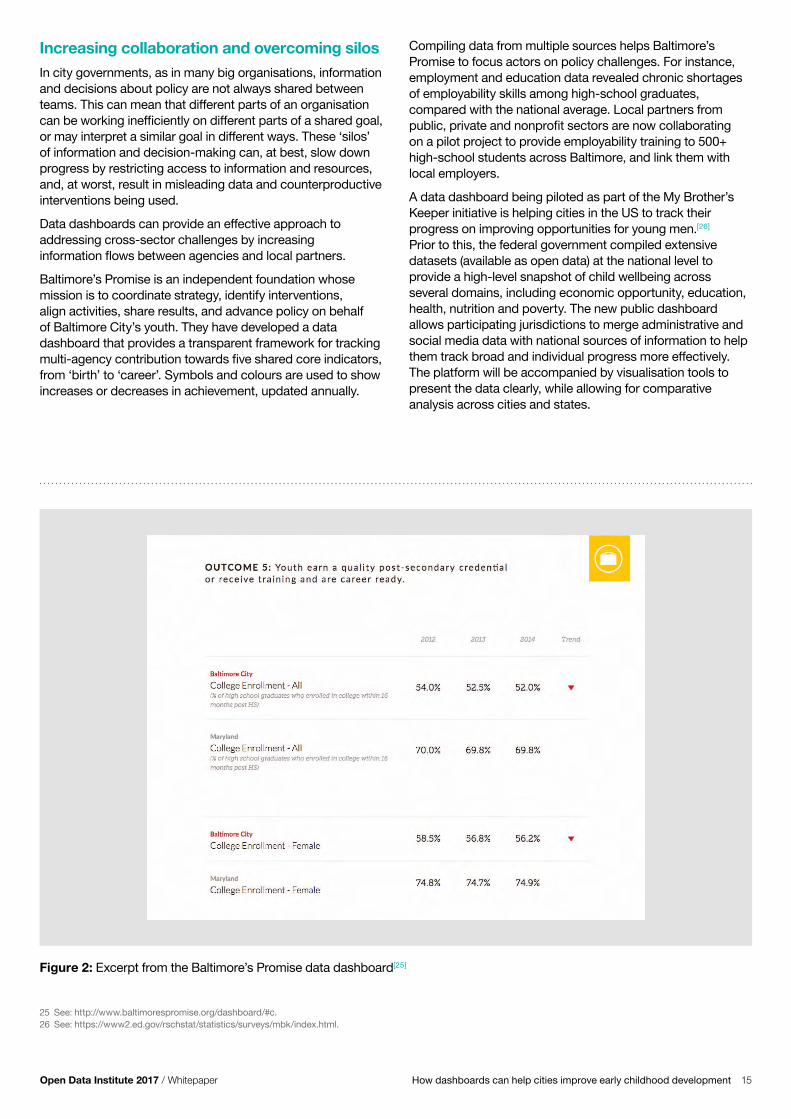
Compiling data from multiple sources helps Baltimore’s Promise to focus actors on policy challenges. For instance, employment and education data revealed chronic shortages of employability skills among high-school graduates, compared with the national average. Local partners from public, private and nonprofit sectors are now collaborating on a pilot project to provide employability training to 500+ high-school students across Baltimore, and link them with local employers.
A data dashboard being piloted as part of the My Brother’s Keeper initiative is helping cities in the US to track their progress on improving opportunities for young men.[26] Prior to this, the federal government compiled extensive datasets (available as open data) at the national level to provide a high-level snapshot of child wellbeing across several domains, including economic opportunity, education, health, nutrition and poverty. The new public dashboard allows participating jurisdictions to merge administrative and social media data with national sources of information to help them track broad and individual progress more effectively. The platform will be accompanied by visualisation tools to present the data clearly, while allowing for comparative analysis across cities and states.
Increasing collaboration and overcoming silos In city governments, as in many big organisations, information and decisions about policy are not always shared between teams. This can mean that different parts of an organisation can be working inefficiently on different parts of a shared goal, or may interpret a similar goal in different ways. These ‘silos’ of information and decision-making can, at best, slow down progress by restricting access to information and resources, and, at worst, result in misleading data and counterproductive interventions being used.
Data dashboards can provide an effective approach to addressing cross-sector challenges by increasing information flows between agencies and local partners.
Baltimore’s Promise is an independent foundation whose mission is to coordinate strategy, identify interventions, align activities, share results, and advance policy on behalf of Baltimore City’s youth. They have developed a data dashboard that provides a transparent framework for tracking multi-agency contribution towards five shared core indicators, from ‘birth’ to ‘career’. Symbols and colours are used to show increases or decreases in achievement, updated annually.
Figure 2: Excerpt from the Baltimore’s Promise data dashboard[25]
25 See: http://www.baltimorespromise.org/dashboard/#c.26 See: https://www2.ed.gov/rschstat/statistics/surveys/mbk/index.html.

Open Data Institute 2017 / Whitepaper How dashboards can help cities improve early childhood development 16
Case study: Overcoming silos across the New Zealand Government
Figure 3: New Zealand’s Better Public Services dashboard.[27]
The New Zealand State Service Commission’s Better Public Services Reform initiative was created in 2012 to address the challenge of developing and delivering policies that fell across multiple departments.[28] Their dashboard is helping to break down silos between government agencies working to address child wellbeing, and ensure they are using resources most efficiently in the context of financial constraints.
“Each agency was trying to provide their own services without adequately coordinating with each other.”
Ross Boyd, Results Coordinator for BPS
Agreeing priority areas and boosting accountability
As with any reform movement, one of the main factors for success was having a clear idea of the impact they wanted to achieve. After a consultation process – which included discussions between government departments and cabinet members, helping to focus target areas – the New Zealand government chose 10 priority areas to measure progress against. These covered a range of issues, from the rate of vaccinations in children, to the number of people receiving welfare payments. This early buy-in from agencies helped create a shared commitment and feeling of accountability across government.
This feeling of accountability was heightened by the government making the priorities and progress public. The government publicly assigned a responsible minister to each of the priorities and this unusual step was a strong indication of how serious they were about improving outcomes in these areas.
The resulting national-level dashboard monitors the progress of these 10 priorities, and so helps to focus reform initiatives around specific objectives.
Making the data accessible
Six-monthly reports are released, which include a three-page dashboard and one-page snapshot. Colourful traffic lights used to indicate progress reports and graphs and explanatory text were used make the dashboard accessible to the general population. The supporting text also focused on trends – rather than an in-depth analysis of the data – to explain the context of the data and demonstrate transparency. By 2013, departments were also sharing short videos that updated viewers on progress and innovations.
This example shows how public interest can be harnessed to drive public sector effort on social policy priorities, namely increasing participation in early childhood education and increasing the infant immunisation rate. Incidence of rheumatic fever was used a proxy measure for poverty and for access to health services and appropriate housing. Since the dashboard was introduced, identified cases of rheumatic fever have lowered by 23%,[29] demonstrating the effect of helping agencies to deliver integrated support, including social housing for vulnerable children and their families.
By using the data and dashboard to shape constructive debates across the wider government, it was possible to maintain engagement and, in turn, the delivery of positive outcomes.
An IBM Center for the Business of Government report examining the progress that New Zealand has made since 2012 also found that better results were seen in areas where agencies had built ‘trusting relationships with each other’.[30] Even though some targets were not met, there were significant improvements in all of the priorities. One of the key successes was the drop in infants not receiving vaccinations, which fell by two-thirds.

Open Data Institute 2017 / Whitepaper How dashboards can help cities improve early childhood development 17
Strengthening the voice of children and
Informing investment and planning decisionsA dashboard can help to identify problems quickly by displaying highly visual indicators that easily illustrate areas for improvement, at a glance. Dashboards can therefore offer clarity around where to invest resources and help planners to understand return on investment.
In Ontario, Canada, the Child Wellbeing Dashboard for the Waterloo region has been used to inform region-wide expansion plans for early childhood centres.[31] The working group behind transformation plans are relying extensively on the dashboard, which displays results geographically by neighbourhood, on key child wellbeing indicators across the domains of fundamental needs, relationships, health and learning.
The dashboard provides a detailed view of where programmes and services for children already exist, and where they are situated in relation to other services, such as how many preschools are within a 5km radius of a library. Proposals for new early childhood centres are being drawn up based on where the dashboard shows that services are most needed, alongside additional consultation processes.
The US State of Minnesota uses a specially-designed child welfare dashboard to provide information to county and tribal decision-makers on service performance and child development outcomes across state and federal targets.[32] The dashboard helped to reveal specific locations that were performing below-average in response to a federal audit of children’s services, which led to the state developing a targeted plan to improve results. The dashboard which is openly available to the public also plays an important education and accountability role as citizens can monitor progress and understand statewide trends.
Figure 5: The US State of Minnesota’s child welfare dashboard[34]
Figure 4: Region of Waterloo Child Wellbeing Dashboard, relationships component[33]
Relationships with Family and Community: Social Cohesion Index
27 See: http://www.ssc.govt.nz/bps-snapshot.28 See: http://www.ssc.govt.nz/better-public-services.29 For 2009 2016, decrease in first episode rheumatic fever hospilisations, see: http://www.ssc.govt.nz/bps-supporting-vulnerable-children#rheumatic. 30 Scott and Boyd (2017), ‘Interagency Performance Targets A Case Study of New Zealand’s Results Programme’, http://www.businessofgovernment.org/sites/default/files/Interagency%20Performance%20Targets.pdf.31 See: http://communityservices.regionofwaterloo.ca/en/childrensServices/child-wellbeing-dashboard-home.asp.32 See: http://www.dhs.state.mn.us/main/idcplg?IdcService=GET_DYNAMIC_CONVERSION&RevisionSelectionMethod=LatestReleased&dDocName =dhs16_148137.33 See: http://communityservices.regionofwaterloo.ca/en/childrensServices/child-wellbeing-relationships.asp.34 The State Measures Dashboard is an interactive dashboard embedded into the Child Welfare Dashboard website. The dashboard allows you to filter by agency and by indicators via the drop-down boxes. Figure 5 was created by selecting ‘Trends over time’, Agency: Hubbard, and Performance measure: 1(c) 5 day response: Family Assessment. See: https://mn.gov/dhs/partners-and-providers/news-initiatives-reports-workgroups/child-protection-foster-care-adoption/child-welfare-data-dashboard.

Open Data Institute 2017 / Whitepaper How dashboards can help cities improve early childhood development 18
Communicating information to the publicBy making data clear and simple to understand, dashboards can be an excellent tool for communicating to an audience that may not have expertise to interpret other forms of data. This allows stories of improvement and successes to be shared easily. Also, by giving external audiences access to metrics and targets, it can help hold governments and organisations to account.
By increasing transparency and social accountability, dashboards can motivate improvements in necessary areas. They can also provide an important opportunity for engaging public interest in the functions and actions of local government, further motivating public authorities to improve their performance.
Strengthening the voice of children and communitiesWhen ECD data is taken directly from interaction with children and their caregivers, their voices will be amplified by the clarity and influence of a well-designed dashboard. It can help to ensure that the beneficiaries’ needs are heard by service designers. The process of collecting data directly from interaction with beneficiaries, when managed in a sensitive and responsible way, can also help to strengthen social care relationships.
The Mind of My Own (MOMO) mobile phone application in the UK provides a safe way for young people to express their views, wishes and feelings about care services.[35] It is offered in a child-friendly format and outside of the more formal structure of care-visits. Children’s input is fed back to social care organisations via a secure interface. Children’s collective views can be aggregated and fed into performance-review reports or thematic data charts tagged by area, while care workers can also access individual responses by logging into personalised accounts. Since it was introduced in 2014, the MOMO app has been embraced by local government authorities in the UK,[36] who see it as a way of allowing children to have a greater say in transforming their care.
When combining interactive features such as citizen reporting mechanisms, data dashboards can also provide decision-makers with real-time and actionable insights. For instance, the illegal dumping data platform, an initiative by Open Data Kosovo and the Deputy Mayor of Gjakova, engaged 30 youth volunteers to collect and digitise data about the location of illegal waste disposal, which was then published on a custom-built GIS platform. Environmental pollution had been identified by citizen groups as a significant local issue. The mapping exercise revealed 686 illegal dumping sites, and resulted in over 75% sites being cleaned up by the city of Gjakova.[37]
Local authorities in Israel are using dashboards driven by citizen input already in the public domain to inform infrastructure improvements. ZenCity dashboards use algorithms to analyse citizen feedback, sentiment and discussion trends across communication platforms such as social media, municipal hotlines and other relevant databases.[38] City planners have been able to make repairs to particularly poor sidewalks based on the location of citizen complaints, and develop a more strategic approach to improving urban infrastructure.
35 See: http://mindofmyown.org.uk.36 Including Surrey, Derbyshire, West Sussex, Northern Ireland, Northumberland, Reading and South East London.37 See: http://opendatakosovo.org/projects/2017/07/28/gjakova-illegal-dumps.html.38 See: https://zencity.io.

Open Data Institute 2017 / Whitepaper How dashboards can help cities improve early childhood development 19
Case study: Engaging the community in Rio de Janeiro, Brazil
Figure 6: A sample screenshot from the Child Security Index website[39]
In 2017, a little over a year after it hosted the Summer Olympics, the high incidence of violence remains a major challenge in Rio de Janeiro.[40] The effects of violence are often felt disproportionately by children, whether they are victims or observers, in their homes or on the streets and the parks where they play.
The Igarapé Institute, an NGO based in Rio de Janeiro, has been working with partners in cities across Brazil to learn more about how children experience and perceive violence.[41] Their Child Security Index (CSI) project captures and tracks the impact of violence on children in Brazil, from the children’s perspective. The CSI is an open-source app that runs on smartphones.[42] It asks children to rate how they feel about their security at home, in the streets and in schools. It has been designed to be used by government officials, private sector entities and NGOs to help them shape and prioritise policies.
Instead of using technocratic language, Igarapé ask children questions in words they understand. They are asked to agree or disagree (on a 3-point scale) with statements such as “I feel safe at home”, “I consider it wrong to beat someone”, and “I trust the police”. Working closely with early childhood experts, the survey asked 30 standard questions, and an additional five questions that local partners could adapt to their region.
To draw attention to the scale and scope of the problem, Igarapé knew they needed to present huge volumes of complex data in a way that would help policymakers understand quickly and act thoughtfully. They designed a dashboard that a city official could get to grips in less than 10 seconds.
“No one reads reports but they pay attention to dashboards.”
Renata Avelar Giannini, Senior Researcher
continued ...
39 See: https://igarape.org.br/en/apps/child-security-index.40 See: http://www.smh.com.au/world/brazils-army-called-to-quell-violence-in-rio-de-janeiro-20170804-gxpxlj.html.41 See: https://igarape.org.br/en.42 Bernard van Leer Foundation (2015), ‘A mobile app to measure how children experience violence’, https://bernardvanleer.org/blog/mobile-app-measure-children-experience-violence.
Open Data Institute 2017 / Whitepaper How dashboards can help cities improve early childhood development 20
Case study: Engaging the community in Rio de Janeiro, Brazil
The dashboard allows users to filter by age, gender, location and so on, depending on their interests. Users can then see whether a specific age or gender perceive safety differently, and drill down further into the supporting data for each question. The results are used to create a ‘heat map’ that shows levels of insecurity based on children’s perception.
Prioritising design and usability
Three pilots were run in order to finalise design and fix bugs. Throughout this process, the team focused on making the dashboard simple and beautiful, applying the ‘10-second rule’ to ensure users would find what they needed quickly enough (as explained further in the ‘Dashboard maintenance and design’ section). The team said that they had received positive reactions to the dashboard from users. The Igrarapé Institute has also provided training to users to ensure that they can understand and interpret the findings captured in the dashboard.
Senior decision-makers, including politicians, have been fascinated by the dashboard, which has helped generate buy-in for the programme. Some even wanted to roll the CSI out across the country, however were persuaded that running pilot programmes first would be the best approach.
The project found that dashboards were an effective way of communicating with users as they presented data and findings in a clear and compelling way. It has also catalysed cultural change within some city departments, to shift from paper-based data collection to using mobile devices to collect and manage data. One partner changed their review systems to incorporate a mobile platform in other work.
The CSI has now been rolled out across 14 cities in Brazil, with 3,500 children and caregivers interviewed. There are now plans to expand to North America and the Caribbean. A decision was taken to originally run pilots in three cities. This allowed for errors and bugs to be fixed, for challenges around keeping information up to date to be identified, and the ability to provide guidance on the limitations and caveats attached to the sources of data used. Any personal data collected is encrypted to protect participants’ privacy.[43]
The dashboard is not currently publicly available, however once issues around confidentiality are overcome, the team intends to make the dashboards open to the public. This will help promote its goals of making children’s voices heard in policy-making.[44]
43 Igarapé Institute (2014), ‘Explaining the Child Security Index’, https://igarape.org.br/wp-content/uploads/en/2014/04/CSI.FAQs_ENG.pdf.44 For more on the Child Security Index, see Moestue, Katherine Aguirre and Renata Giannini (2015), ‘When kids call the shots: testing a Child Security Index in Recife, Brazil’, https://igarape.org.br/wp-content/uploads/2015/12/AE-18_CSI-Recife_EN-27-11_2.pdf.

Open Data Institute 2017 / Whitepaper How dashboards can help cities improve early childhood development 21
� There is significant senior buy-in and interest in the dashboard
� The expense and logistics of further training has been fully considered and deemed appropriate
� Your organisation’s strategy is clear, fixed and well-developed.
Building a strong strategyEarly-stage investment can have high pay-offs when planning a dashboard. A clear strategy will map out a dashboard’s key stakeholders, its stages of production, maintenance and use. In order to map out a strategy, it is important to have a clear idea of the role of the dashboard in your organisation, and its purpose from the beginning.
Dashboard goals
A clear goal will allow your team to create an effective strategy, which will in turn ensure that data collection and aggregation into a dashboard remains efficient and effective.
A dashboard’s goal might be to:
� Motivate a team towards achieving certain targets
� Keep track of progress towards a goal
� Provide early opportunities to adjust policy settings
� Encourage comparison between regions or over time
� Keep the public informed.
The purpose of the dashboard will determine its intended audience and guide the choice of indicators, the selection and collection of data and the design. Everyone working on the dashboard should understand its purpose. This should be a priority when weighing decisions and compromises that need to be made when distilling complex information into a simple format.
There are important factors to consider when planning a dashboard.
Based on interviews and the ODI’s experience advising organisations and governments internationally, we understand the need to have a clear theory of change, and strategy to help determine indicators that are important, as crucial factors to consider when developing a dashboard.
With this in mind, this section looks at how cities can build effective dashboards, and more specifically what factors need to be considered when building a dashboard that focuses on early childhood development needs.
When to use a dashboardDashboards are most effective when:
� You have a clear organisation-wide target that can be measured either using a clear indicator (such as percentage of children attending preschool) or a good proxy (such as an increase in average birth weights as a proxy for newborns’ health)
� Your organisation is data-minded, in that the people within it are used to working with numbers
� Your organisation and staff are comfortable working with and towards targets
� Common indicators are available to assess progress and make effective comparisons
� Your organisation has decided to make its progress towards a goal public
� Your organisation is able to collect relevant data: there is sufficient data available and you have the resources to collect it
� The trends you are measuring cover a manageable period of time (such an annual average birth rate) and do not have a very long lag between collection of datasets (such as testing the impact of pre-school quality on high-school completion rates)
� Resources have been allocated to maintain the dashboard over time
How to build an effective dashboard

Open Data Institute 2017 / Whitepaper How dashboards can help cities improve early childhood development 22
IDS allow government agencies to integrate various databases which can break down silos and inform decision makers. Therefore, a closed dashboard requires an excellent data infrastructure, data encryption and security, and a strong understanding of the nature and significance of the data being collected by subjects, collectors and users.
Shared dashboards
A shared dashboard can be a useful compromise when data is considered too private or sensitive to be open to the general public, but necessary to be more generally available within a group or organisation. It offers many of the same organisational benefits including directing team attention towards agreed goals and enabling comparisons by allowing organisations to share more sensitive data with a predetermined group (whether internal or external). The Ingrapé Institute’s Child Security Index in Brazil, for example, shares a more detailed dashboard with a small group of stakeholders most concerned with child protection, and will isolate salient and interesting numbers for their public communications.
Selecting indicatorsCities should select a manageable number of high-impact and intermediate-level indicators that can:
� Be understood easily by target audience
� Convey as large a picture as possible in these simple terms
� Be measured using numbers, where possible
� Be updated regularly in keeping with the intention of the dashboard
� Each have a clear definition, showing how the indicator has been developed or constructed
� Enable comparison, where this is desired, such as between regions or show change over time[45]
Then set a target or direction for every indicator in the dashboard.
Where possible, it can be helpful to look for data that is currently available, or that is already being collected either by the organisation or by a third party. For example, GRADE, a research group operating in Lima, Peru have adopted the Urban95 indicators and are collaborating with other institutes in the region to find ways to measure progress towards a common set of goals with data available at the local level. Shared goals like these enable GRADE to compare progress against other cities or regions, learning from other policies or approaches.
Understanding audience and usersIt is important to identify and understand a dashboard’s audience. Choosing the purpose of the dashboard will help define its audience, however, it is useful to consider what other potential groups might be able to make use of the dashboard when establishing its strategy.
A dashboard that is used to communicate with the public, for example, may need to have a more simplified design that can be understood by people without specialised expertise. A dashboard being used to motivate a team internally need not be as accessible, but must be straightforward enough to regularly incorporate into a normal working day.
Interviews with target audience can help understand their needs and how to build a dashboard that works for them. The nature of the audience will also determine whether the dashboard, and therefore the data, will be open, shared or closed.
Open dashboards
An open dashboard is one that anyone can access, often through a public website. Open dashboards are particularly effective as communication devices and tools for public engagement: a city can keep citizens informed of progress and enable them to ask better-informed questions about their government. An open dashboard will also allow a city to make comparisons with other cities that are making use of open data. The data that is collected and used for an open dashboard should be explicitly licensed so anyone can access, use or share the data it contains.
For use in an open dashboard, data is generally aggregated and, where necessary, anonymised to protect privacy. This can create limitations on what data and what details can be included, and so it is important to consider the implications of making a dashboard open as part of your initial planning process.
Closed dashboards
A closed dashboard is one that is narrowly shared, restricting access to a minimum. When developing integrated data systems (IDS) which bring together administrative data from many sources into a single place cities must consider the sensitivity of the information being collected.
This might include data on juvenile justice, homelessness and health, and where data concerns individual children: their health records, care visits and school attendance.
45 Ross Boyd, Results Coordinator for Better Public Services, State Services Commission, New Zealand, interviewed 13/8/2017.46 See: https://igarape.org.br/wp-content/uploads/2016/08/campanha-face-EN3_Page_01.jpg.

Open Data Institute 2017 / Whitepaper How dashboards can help cities improve early childhood development 23
Figure 7: A screenshot from the Ingrapé Institute’s Child Security Index website.[46]
Figure 8: Types of dashboard and examples.
Types of dashboards and examples
Dashboards about individual citizens
e.g. Integrated case management
Organisational or team-based dashboard Public dashboard
Access Very limited access (need to know only)
as identifiable personal data collected in one place
Shared and used broadly within team or organisation but not publicly available
e.g. not accessible by citizens
Open for anyone inside or outside the organisation to
access, use and share. Ideally interactive, with opportunities
to learn more
Individual case records (case-worker notes, etc) for child
protection services; combining medical data with welfare records
and educational attainment
Internal performance indicators e.g. number of
claims processed. Exploratory data to spot trends or
opportunities
Population statistics. Progress towards public targets.
Development indicators. Anonymised or aggregated
social or economic data
Centralise information to improve quality of interventions for individuals but with privacy
protections
Drive collaboration.Target an organisation’s focus
and set goals.Learn from trends
Public accountability. Motivating performance
improvement.Inviting collaboration
Examples of data types
Purpose

Open Data Institute 2017 / Whitepaper How dashboards can help cities improve early childhood development 24
For these reasons:
A city should adopt a common approach to indicators and consistency in data standards across agencies to support the operation of its dashboard
Data collection and quality
Depending on the target dashboard user, collecting data need not require many resources. If the intended users of the dashboard are caregivers or caseworkers, for example, they might already enter key data points from case visits and reports into an internal system on a regular basis.
In Minnesota, the state’s Data Child Welfare Unit relies on care workers across 87 counties and 17 tribes to input case data in county servers. The state government uses this data to create dashboards in order to help support and coordinate services. The dashboards are used, in turn, by the same care workers who collected the data, establishing useful feedback loops.[50]
Data needs to be in the correct format. Significant effort and resources can be required to extract, clean and structure data so it is machine-readable. Ideally, data would be made available by agencies in machine readable format, but in reality data dashboard teams can spend a lot of time extracting data from PDFs or modifying data, such as maps, to make them more legible (which might have an error percentage due to processing). Here, automating processes to collect data in the preferred format can be helpful.
Eyal Feder, Director of ZenCity in Israel, recommends that it be a formal part of someone’s job to ensure data is uploaded in the right format. Using digital collection tools like tablets can also make the process of data collection and formatting more straightforward, as has been the case with the Child Security Index in Rio de Janeiro.
The data that feeds into a dashboard is defined by its indicators, so it is critical that they are informed by consultation with users and support the overall dashboard strategy. Be inclusive when selecting indicators, as this will encourage engagement with the project, and maximise the chances of creating a truly valuable dashboard. Employing a problem-focused approach can also help in selecting which indicators and what data to collect and maintain.[47] This involves starting off by clarifying which problem the organisation is trying to solve, and determining the datasets accordingly.
Choosing the right data
Indicators might be chosen to be specific to local challenges, track contribution towards meeting wider national or international commitments (such as the Sustainable Development Goals), or encourage comparison with other cities. If no data exists to feed into a desired indicator, a city can either start collecting new data or choose a suitable proxy indicator (that is, an indicator that tends to move in the same direction as the impact a city is trying to measure, such as birth weights as a proxy indicator for the health of a baby).
When choosing data, it is important to keep in mind that it can be difficult to measure some aspects of child behaviour and then get access to desired datasets from the multiple agencies involved. Some indicators may not be available at the local level, or may be aggregated at the city level, making it harder to isolate geographic regions in need. Where proxy indicators are being selected, be sure that inferences or correlations are being made responsibly.
There is a risk of standardising the indicators too much, so decision makers do not know what the figures represent. According to our interviews, in Boston, the release of health census data looked like a treasure trove, but was based on model estimates which took municipality data and made inferences at the district and city level, based on demographics.
Lack of data interoperability and standardisation between agencies or municipalities can create substantial work and cost. According to our interviews, in the Boston area, there are about 100 municipalities producing their own data on local services, such as waste collection using different ontologies. This creates problems when trying to combine data points across the city level. In contrast, other cities with strong central management such as London[48] and New York City[49] have been able to enforce common standards to facilitate easier data sharing.
47 The Open Data Institute (2015), ‘Supporting sustainable development with open data’, https://theodi.org/supporting-sustainable-development-with-open-data.48 See https://data.london.gov.uk/about/data-quality-standards.49 See: https://www1.nyc.gov/site/doitt/initiatives/open-data.page.50 The Minnesota Department of Human Services (2017) ‘Child Welfare Data Dashboard’, https://mn.gov/dhs/partners-and-providers/news-initiatives-reports-workgroups/child-protection-foster-care-adoption/child-welfare-data-dashboard.

Open Data Institute 2017 / Whitepaper How dashboards can help cities improve early childhood development 25
The Department of Human Services, Minnesota, for example, ensures as a standard that their dashboards are downloadable in a spreadsheet that can be read through a screen reader, to make them accessible to the visually impaired.[51] Depending on the community being approached, Richard Gevers, CEO of Durban Open Data, South Africa, ensures that dashboards are printed off on paper in the local language, using basic graphs and absolute numbers, which can be pinned up on a community noticeboard and explained further through consultations. Professor Rob Kitchin, a central member behind the Dublin Dashboard, is exploring ways to ensure the dashboard is as accessible on mobile phones as on desktops, for those with specific technological access or preferences.
Strong leadership, culture change and literacyTo create impact, dashboards need a clear accompanying vision, high-level leadership support, integration into regular workflows and processes, and a team that understands how to use the dashboard and what it means for their work.
Steps to achieve this include:
� Ensuring the team understands where data comes from, what it means, and how their decisions and actions might influence indicators
� Supporting a culture of learning, and encouraging the team to see movements in indicators as opportunities to do things better
� Encouraging leaders to refer to the dashboard often as part of the organisation’s broader strategy.
The dashboard initiative in Rio De Janeiro benefited from having political buy-in during the early days of the pilot, while in Bogota, the city mayor is actively involved in the project. In Israel, having city managers on board has helped drive the uptake of city dashboards, and assisted in getting cooperation from different departments contributing data. A lack of central political support can make coordination more difficult across departments, especially where data comes from a range of sources.
A dashboard should come with thoughtful integration into an organisation’s workflows and processes, to ensure its impact is maximised. It is useful to stress that the dashboard is not the goal itself, but an enabler for achieving change. The State Services Commission in New Zealand had the backing of the Prime Minister to introduce the Better Public Services results dashboard, positioned as a mechanism for driving more effective social policies and reducing silos across government. Rather than seen as an additional expense or add-on activity, the dashboard was adopted to help improve coordination to achieve targets.
Including a dashboard in day-to-day organisational activities also helps ensure it remains useful, even after the departure of individuals that originally built or championed it.
Dashboard design and maintenanceAn effective dashboard is one that is designed simply and is intuitive to its user. Depending on the users identified in a dashboard’s strategy, this can vary greatly from a complex analytical dashboard, for those with a strong grasp of data analysis, to simple stylisations that anyone without any data training could understand at a glance. Being able to produce a simple narrative that the user can follow is central to a dashboard’s effectiveness.
As such, it is helpful to consider the following when designing a dashboard and the interface required to maintain it:
� Minimise manual work required to create or update dashboard, automatising data processes wherever possible
� Develop a dashboard that is intuitive, with overall meaning that can be understood easily and at first glance
� Make it interactive to enable the audience to learn more about variations in the data, based on region or demographic
� Help users to put information into context by using images or explanations that are easy to access and understand.
Igarape in Rio de Janeiro designs its dashboards according to the ‘10-second rule’. The idea behind this is that if a user cannot understand what the dashboard is telling them after 10 seconds, there is a problem with the dashboard. They focus on design, stressing that an effective dashboard should be visually appealing and attention-grabbing. However, it is equally important to resist the use of over-stylised graphics and displays. Familiar formats, where the user may have encountered data before, can help in making use of any technological intuition they may have.
Effective dashboard design balances being impressive with good communication
An important part of the dashboard design process is being responsive to those who view the dashboard. The dashboard should adapt to preferences, either at the start of the process, with the use of pilot dashboard features, or iterative processes that allow for design, review and adjustment. Once launched, it can be useful to have a feedback facility where people’s queries can be answered, with question-trends leading to adjustments to the dashboard.
51 See: https://mn.gov/dhs/partners-and-providers/news-initiatives-reports-workgroups/child-protection-foster-care-adoption/child-welfare-data-dashboard.

Open Data Institute 2017 / Whitepaper How dashboards can help cities improve early childhood development 26
Policy and privacyWhen preparing to introduce a dashboard, the team needs to carefully consider data protection legislation and privacy considerations. These considerations, and the legislation that governs them, are very specific and differ between countries. All contracts dealing with information systems and dashboards should also consider the protection of data and data security. There can be difficulties tracing data ownership and control, especially where data from different sources is being combined to produce a new application. Where a dashboard is being managed by a private institution, the team should also consider who owns the source code.
A supportive legal and policy framework, combined with shared priorities and objectives, is helpful to motivate stakeholders to collaborate, and provide staff with the support needed to maintain and run a dashboard.
This will include:
� Developing dashboards in line with relevant privacy laws, along with supporting guidance and principles for staff in how to handle personal data.
� Publishing guidelines about how data is collected and used, and ensuring participants give informed consent
� Modifying any dashboard to overcome privacy concerns, for example, using aggregated data for a public-facing version of your dashboard.
� There is a particularly strong culture amongst social workers of safeguarding and carefully handling client data. This can be viewed as a huge asset when it comes to maintaining trust in public services and upholding privacy for individuals. On the other hand, ring-fencing data might prevent bigger-picture insights and debate about care outcomes for children. These considerations are crucial at every stage, particularly when deciding whether to adopt an open, shared or closed dashboard.
Sometimes a data sharing agreement needs to be negotiated in advance to the funding being agreed, as was the case with HHS-Connect system, a system for data integration used in New York City.[52] HHS-Connect required a high level of political support from the Deputy Mayor who instituted a governance structure involving the citywide IT department, agency chiefs and legal counsel. A legal liaison group was charged with developing an ‘inter-agency data sharing agreement’, which defined the legal framework including terms and conditions under which agencies would share data through the HHS-Connect applications.
A data sharing agreement may be necessary to help manage the use of data that cannot be published openly. In New York City, ‘StreetSmart’, a real-time data management system for frontline caseworkers to manage homeless services, is being piloted in 2017.[53] Setting up StreetSmart required a data sharing framework that offered service providers and city agencies access to information while ensuring privacy of clients’ personal information. Before its introduction, there was no integrated system for getting this data to the relevant actors in a safe and secure way.
One of the biggest hurdles reported in our research was that of culture change. Cultural barriers around willingness to share with other colleagues and agencies, often compounded by vertical hierarchies within organisations, can hamper a dashboard’s efforts. Some interviewees reported a lack of ‘partnership spirit’ between agencies or a sense of competition which made them less willing to release data. Municipalities within Istanbul were reportedly reluctant to release local school performance data in case of reputational damage.
In this situation, building up relationships of trust through frequent engagement can help overcome fears around data sharing. In Sao Paolo, the Sustainable Cities team worked with the local administration over a long period of time to build up a network of contacts and promote a culture of data sharing.
In addition to a culture of sharing, several respondents referred to the importance of having an evidence-driven outlook; an openness to finding and learning from the data, and not wholly relying on anecdote or experience. This requires a degree of analytical skills to make sense of data and then make decisions based on the interpretation. Social workers and frontline service delivery agents also need basic knowledge of data science and digital applications to communicate with to developers to drive improvements and innovation in the use of data in their field.
As with service providers or case workers, the data collector and the dashboard user may be the same person, strengthening the ownership and use of the dashboard on a regular basis. Making sure that those using the dashboard understand where the data comes from and its value to them can make the dashboard more sustainable and ingrain evidence-based culture in the workplace.
However, several respondents reported that this approach can seem ‘abstract and alienating’ to staff working on the frontline who may consider themselves to be more relational than analytical, more interested in the reality than the data. According to 360 Giving and Barnados, data literacy within child welfare charities is often low or concentrated in only a few staff members, which can make wider dashboard adoption challenging. Similarly, data literacy at the local level was noted as a barrier within counties and tribes in Minnesota.
Shannon McIntyre, of the Children and Youth Planning Table in Waterloo region Canada, recommends building the ‘culture of data’ incrementally, starting with data analysts so they understand the dashboard narrative and will become internal champions, then expand to the broader team. Data literacy can be supported by making dashboards more exploratory with the use of labels, interactive elements, comments and explaining the significance of results through stories.
52 See: http://datasmart.ash.harvard.edu/news/article/new-york-citys-hhs-connect-501.53 See: http://streetsmart.org.uk.

Open Data Institute 2017 / Whitepaper How dashboards can help cities improve early childhood development 27
A rigorous framework at the institutional level is required to balance privacy protection and the public interest with ethical considerations. Some respondents from Europe mentioned the General Data Protection Regulation (GDPR), which comes into effect in UK and Europe from May 2018, as a promising model for strengthening rights of individuals to be informed about how their personal data is being used.[59] The GDPR contains specific provisions to enhance protection of children’s personal data. For instance, it restricts the age at which subjects can give consent (16 by default), promotes use of clear, child-friendly language in privacy notices and regulates the way online services (such as online shops) obtain children’s consent. Depending on the amount of personal data an organisation holds, they may also have to carry out Data Protection Impact Assessments (DPIAs).
Emerging technological solutions and anonymisation techniques can also help ensure data being collected is maintained safely. For example, the My Brother’s Keeper dashboard encrypts sensitive data using a ‘one-way hash’ that ensures data cannot be reverse-engineered to source individual details.[60] Where pieces of data need not be connected with an individual, data anonymisation can ensure that lessons can be learned without identifying children. More simply still, aggregating data to the neighbourhood level can help to ensure that the privacy of children and their families is protected. The variety of options helps to demonstrate the importance of being very clear on dashboard audience and purpose, in order to make decisions about the most appropriate use of personal data.
For more on privacy and sharing of personal data, see the ODI’s guide on openness principles for organisations handling personal data.[61]
This suggests the need for a public dialogue across the city and child services/social work sector about how to build and maintain a robust data infrastructure,[54] including the development of personal data principles which give users and the community confidence around how data is being collected and used.[55] Organisations and agencies working with sensitive data relating to children also need help to understand the value of their data, and how it can be safely shared through techniques such as anonymisation, aggregation and other emerging technology. For example, the UK Department of Education is exploring providing access to sensitive pupil data via a privacy preserving query interface.[56]
Even if the law permits data to be shared for research or learning purposes, agencies are often reluctant to share their records for fear of misuse or concerns about quality. There may also be ethical issues around potentially misusing data, especially through ‘big’ data analytic techniques. Traditional methods of informed consent may be impractical with techniques such as data mining, predictive modeling and simulation. Other objections including inadvertent statistical discrimination by only focusing on subjects that leave a digital footprint, classifying some neighbourhoods in unflattering ways, incorrectly classifying individuals altogether or potentially targeting vulnerable consumers through push marketing.[57]
Staff with access to data about children must therefore carefully consider the ethics of using data for purposes that individuals may not be aware of at the time of providing personal information. It is important to remember that data must be interpreted within the context of other information and based on a good understanding of the factors behind the data collection process. The ODI’s Data Ethics Canvas offers an approach for organisations to identify and manage these sorts of data ethics considerations.[58]
54 The Open Data Institute (2016) ‘What is data infrastructure?’, https://theodi.org/what-is-data-infrastructure.55 The Open Data Institute (2016) ‘Openness principles for organisations handling open data’, https://theodi.org/guides/openness-principles-for-organisations-handling-personal-data.56 UK Government Digital Marketplace (2017) National Pupil Database Privacy Controlling API – Alpha, https://www.digitalmarketplace.service.gov.uk/digital-outcomes-and-specialists/opportunities/4732.57 American Academy of Social Work and Social Welfare (2015), ‘Harnessing big data for social good: a grand challenge for social work’, http://aaswsw.org/wp-content/uploads/2015/12/WP11-with-cover.pdf.58 The Open Data Institute (2017) ‘The Data Ethics Canvas’, https://theodi.org/the-data-ethics-canvas.59 Information Commissioner’s Office (2017) ‘Overview of the General Data Protection Regulation (GDPR)’, https://ico.org.uk/for-organisations/data-protection-reform/overview-of-the-gdpr.60 See: http://bmafunders.org/toolkit/my-brothers-keeper-data-dashboard.61 The Open Data Institute (2016) ‘Openness principles for organisations handling open data’, https://theodi.org/guides/openness-principles-for-organisations-handling-personal-data.

Open Data Institute 2017 / Whitepaper How dashboards can help cities improve early childhood development 28
need not mean creating multiple platforms: one adaptable platform is more efficient and achievable.
In other scenarios, tensions can arise between agencies contributing data to the dashboard with different ‘street level’ protocols for collecting and handling data. For instance, in Sao Paolo, different street level protocols by Education, Health and Social Assistance created challenges around harmonising their approach to early child welfare. No one agency has the authority to authorise an integrated approach or change protocols; this would need to come from a stronger central stakeholder.
In this scenario, it may be necessary to convene an interagency working group to discuss key matters such as roles and responsibilities, data sharing protocol, and use of common standards, formats and vocabularies. For instance, in NYC, an interagency group for HHS-Connect was convened by the Deputy Mayor to ensure that the policy and technology were in sync while breaking agencies out of their silos. In New Zealand, the dashboard leader with backing from the Prime Minister provided standardised templates for agencies to submit their data with, to ensure it was in a common format. This suggests the need for governance or coordination mechanisms to enable ongoing discussion between subject matter and technical experts.
Inequality in resourcesDashboards require investments in technology, human resources and data-collection systems in order to thrive. It is important to remember that small to medium-sized cities may not have the same level of resources as larger cities who might set up dedicated data teams or introduce sophisticated technology. We found a range of creative tactics from collaborative data collection and maintenance models, ‘renting’ staff from third parties such as universities to fill gaps, and introducing automated design features.
Costs: time and money
A significant cost outlay can be building the dashboard itself. This involves the monetary cost and time to build a new system, some type of software (customised or open source), security needs, and then ongoing maintenance. Several respondents agreed that while the original dashboard design can be expensive, the cost of management and maintenance over time is less so, and worth the initial outlay. This is what can make a dashboard sustainable.
The limits of ‘deliverology’Several respondents warned that an overly technocratic approach can focus on outputs at the expense of celebrating persistence and interim progress. A focus on targets gives political leaders and government officials clear goals, with progress updates to help them achieve them. But even well-chosen indicators will rarely tell the whole story, and there is often a gap between indicators on a dashboard and the long-term impact a government is seeking.
Dashboard risks can arise from the same factors that help make them useful. A dashboard commands attention and directs decisions but a leader may come to feel it is commanding the wrong kind of attention. Politicising indicators can make it more likely that statistics are tweaked, or that a dashboard is hidden from view: reducing the opportunities to learn from the trends it shows.
Deliverology often incorporates a strong role for targets. Though Ministers pushed for the inclusion of targets in the Better Public Services Dashboard in New Zealand, this is actively balanced by an approach that focuses on change relative to a baseline in order to celebrate progress. As results coordinator Ross Boyd points out, ‘it’s not about name and shame’ when failing to meet targets set, but ‘name and fame’ when tangible progress has been made.
Mismatched priorities and protocolsOccasionally there is tension between experts involved in designing a dashboard, and elected officials with power to make decisions to alter a course of action, based on what the data is saying. Often these groups of stakeholders are looking for slightly different things from a dashboard and it can be difficult to accommodate all motivations. We heard several examples where the data painted a picture that challenged policy announcements and became a political ‘inconvenience’. As urban scientist and co-director of the Boston Area Research Initiative, Dan O’Brien, commented: ‘policymakers need utility; academics need novelty’.
Dublin Dashboard are managing the issue of competing user needs by considering developing unique user profiles. Depending on the type of user you are (city planner, analyst or policymaker, for example), you will see a specific view of the dashboard. It is also possible to customise the dashboard so it only displays data you are interested in. Linda Gibbs, former Deputy Mayor of NYC, argues that catering to multiple users
Risks and challenges

Open Data Institute 2017 / Whitepaper How dashboards can help cities improve early childhood development 29
People power and skills
Dashboards need person-power, especially during the design and set-up phase, to drive efforts and spread capacity across contributing agencies and teams. The dashboard initiative in Sao Paulo, for example, comprised a 16-strong data team within the Department of Education (not including the general city IT team), which made it easy to spread internal awareness and capacity throughout managers within the department. In Dublin, a permanent team of 10 work across four workstreams to manage the data dashboard, contributing to data quality, standards, analytics, training and education. They team also runs ‘data days’ to boost the data literacy of public service employees and ability to apply the dashboard to their work.
However, not all cities we surveyed had the luxury of a large team. Faced with a shortage of expertise, the City of Teresina in Brazil is developing strong links with local and international universities to help fill the gap. The team behind the dashboard have attracted pilot funding to launch their initiative and set up their own lab space, however they currently lack internal data skills, have limited equipment and poor internet. By building partnerships with the universities, the team hope to bridge these needs in the short-term while transferring skills over time so their work is sustainable.
Data collection
Another resourcing consideration is the data collection process itself. For instance, data collection for a dashboard via household surveys requires door-to-door visits which can be very costly. The Igarape team in Rio is experimenting with data collection via schools, where teachers will be equipped to use tablets, which is less draining on resources. In Ontario, Canada, the Province similarly collect data via teacher-completed surveys to understand child vulnerability patterns.
Building in automated processes where possible can help to save money on data collection over time. As Marcelo Cabral from the Information and Data Coordination of the Education Department, Sao Paulo, observed, this can represent a technological challenge ‘but once you’ve managed to get over this hurdle and move to an automated extraction of data, it is less of an ongoing challenge’. Eyal Feder of ZenCity agrees, warning that ‘if it’s not an automated process, it won’t work well over time’ due to neglect or staff turnover.
In response, Feder suggests introducing as much ‘plug and play’ into the design as possible. An option for resource-constrained teams is drawing on the range of existing off-the-shelf or open source platforms and tools for publishing metrics (such as the ODI’s Bothan),[62] tools for cleaning or formatting data (such as the ODI’s CSV Lint),[63] and open data portals (such as CKAN)[64] which allow teams to produce an instant dashboard, or customise from scratch.
62 See: https://bothan.io.63 See: https://csvlint.io.64 See: https://ckan.org.

Open Data Institute 2017 / Whitepaper How dashboards can help cities improve early childhood development 30
Methodology
We used a ‘theory of change’ approach[65] to guide our investigation based on preliminary desk research and consultation with BvLF experts. This involved working backwards from the long-term goal of better early childhood outcomes in cities, and identifying the components (and underlying attributes) required in order that a dashboard can help create change.
Our working hypothesis was that data dashboards enable cities to become more evidence-based when designing, implementing and monitoring early childhood policies, which ultimately leads to better development outcomes for children (summarised in the theory of change diagram below). This can be achieved by a well-designed dashboard simple, relevant and intuitive populated with good data, managed by a motivated and able team, and as part of a broader strategy that is using data to help guide decisions on early-childhood policy.
Several attributes (or assumptions) are necessary conditions for a dashboard to achieve its objectives. Of these, perhaps the most important is culture. In the ODI’s experience, an organisation’s transformation towards greater maturity in data use is usually more about processes of social and cultural change than technology. Tools like data dashboards are only effective when the teams that design, produce and act on them see them as part of a bigger process. Teams should feel invested in what is being measured, understand what the numbers on a dashboard mean, and be interested in how different approaches might lead to better indicators (or when, a change in indicators is due to external factors, and does not signal an urgent need for policy change).
Figure 9: Urban Data Dashboard – Theory of Change.
Components
AttributesResources, Culture and data literacy, Political motivation, Agency and authority,Targets and priorities, Data feasibility
DashboardDesignIntuitive designAccessibleVisual
Data InputsAccurateTimely & updatedStandardisedEasy to collectand report
DashboardManagementEngaged staffEquipped staffGood leadership
StrategyClear targetsStrong narrativeData addressesproblemLearning culture
Outcomes Impact
Urban Data Dashboard: Theory of change
Better decisions
Better processes
Better performancemanagement
Improved wellbeing for children (0-5) dueto better design and implementation of policies at the city level
Increased awarenessand knowledge
Increased efficiency
65 NESTA (2017), ‘Theory of change’, http://www.nesta.org.uk/resources/theory-change.

Open Data Institute 2017 / Whitepaper How dashboards can help cities improve early childhood development 31
We sought to test our hypothesis and supporting assumptions in the course of our interviews and case studies. To explore these issues, we conducted 19 interviews with a range of stakeholders working with data and/or early childhood policy at the city level. Although not all stakeholders were focused specifically on early childhood policy, we were interested to understand what lessons might be replicable from innovative sectors and cities.
However, we note several limitations to our research. The relatively small sample size and wide variations in local conditions mean our findings are not exhaustive or applicable to every context. Critically evaluating indicator frameworks or the relative effectiveness of dashboards in comparison to other tools was also outside the scope of this research.
We note that dashboards are not always the most useful data tool for a city seeking to improve early childhood outcomes. Instead, dashboards are likely to be most helpful, for example, where a city is tracking a clear goal, with measurable outcomes or good proxies that can be updated often, and to help inform a team that has good data literacy and is target-driven.

Open Data Institute 2017 / Whitepaper How dashboards can help cities improve early childhood development 32
Key informants and dashboards
During this research we spoke with 19 key informants across 17 cities in 11 countries spread across six continents. Each interview lasted approximately 45 minutes on average.
We interviewed:
� 10 key informants who work on data to support child wellbeing services
� Two academics specialising in urban dashboards
� Seven key informants who pioneered the use of data dashboards in their city or country
Dashboards and initiatives
Name Position Associated dashboard or initiative City Country
Gabriela Uchoa and and Flavia Maia
Head of Agenda 2030, City Hall of Teresina; and PhD researcher
Agenda 2030 Teresina Teresina Brazil
Armend Vokshi Deputy Mayor of Gjakova Municipality, Kosovo
Gjakova data portal Gjakova Kosovo
Marcelo Cabral Information and Data Coordination of the Education Department, Sao Paolo
n/a Sao Paolo Brazil
Martin Benavides Chief Policy Officer, GRADE n/a Lima Peru
Eyal Feder Director, ZenCity ZenCity Tel Aviv Israel
Bruno Siqueira and Renata Avelar Giannini
System Engineer; and Senior Researcher, IGARAPE Institute
IGARAPE Child Security Index (internal, not shared)
Rio de Jeneiro Brazil
Prof. Murat Guvenc Director, Istanbul Studies Center, Kadir University
Urban 95 city website coming late 2017
Istanbul Turkey
Richard Gevers Founder, Open Data Durban South African cities network
Durban South Africa
Rob Kitchin Professor, Maynooth University Dublin Dashboard Dublin Ireland

Open Data Institute 2017 / Whitepaper How dashboards can help cities improve early childhood development 33
Name Position Associated dashboard or initiative City Country
Linda Gibbs New York City Deputy Mayor of Health and Human Services from 2005-2013
HHS Connect; My Brother’s Keeper data dashboard
New York USA
Jason Caplin Chief Data Officer, Bernardos Internal dashboard, not shared
London UK
Jill Thorburn and Yvonne Anderson
Director, Head Trainer and Safeguarding Lead; Director, Head of Product and Governance Lead, Mind of My Own
Mind of my own (MOMO) Multiple cities, UK
UK
Mor Rubinstein Data Lab and Learning Manager, 360 Giving
Grantnav London UK
Ross Boyd Results Coordinator for Better Public Services, State services Commission, New Zealand
Better Public Services snapshot
Wellington New Zealand
Shannon McIntyre Social Planning Associate for the Children’s Planning Table, Waterloo Region
Child wellbeing dashboard for Waterloo region
Waterloo Canada
Josh Morgan and Janelle Gendrano
Director of Data Communications, and Senior Director of Programs, Baltimore’s Promise
Baltimore Promise data dashboard
Baltimore USA
Nikki Kovan Supervisor of research and evaluation at Minnesota Department of Human Services
Child welfare dashboard, Minnesota Department of Human Services
Minnesota USA
Daniel O’Brien Assistant Professor of Public Policy and Urban Affairs and Criminology and Criminal Justice Northeastern University; Co-Director, Boston Area Research Initiative
Boston mayor’s dashboard (internal, not shared); CityScore Boston
Boston USA
Clara Meyer Cabral Indicator Coordinator, Sustainable Cities, Rede Nosa
Urban 95 city, website to be launched late 2017
Sao Paulo Brazil
Open Data Institute 2017 / Whitepaper How dashboards can help cities improve early childhood development 34
Bibliography
American Academy of Social Work and Social Welfare (2015), ‘Harnessing big data for social good: a grand challenge for social work’, http://aaswsw.org/wp-content/uploads/2015/12/WP11-with-cover.pdf
Bernard van Leer Foundation (forthcoming 2017), ‘Measuring Early Childhood Development: Indicators of child development 0-5yrs’
Bernard van Leer Foundation (2015), ‘A mobile app to measure how children experience violence’. https://bernardvanleer.org/blog/mobile-app-measure-children-experience-violence
Coultin, C., Goerge, R., Putnam-Hornstein, E. and de Haan, B. (2015), ‘Harnessing big data for social good: a grand challenge for social work’, http://aaswsw.org/wp-content/uploads/2015/12/WP11-with-cover.pdf
Igarapé Institute (2014), ‘Explaining the Child Security Index’, https://igarape.org.br/wp-content/uploads/en/2014/04/CSI.FAQs_ENG.pdf
Information Commissioner’s Office (2017) ‘Overview of the General Data Protection Regulation (GDPR)’, https://ico.org.uk/for-organisations/data-protection-reform/overview-of-the-gdpr
Moestue, Helen, Aguirre, Katherine and Giannini, Renata (2015), ‘When kids call the shots: Testing a Child Security Index in Recife, Brazil’, https://igarape.org.br/wp-content/uploads/2015/12/AE-18_CSI-Recife_EN-27-11_2.pdf
NESTA (2017), ‘Theory of change’, http://www.nesta.org.uk/resources/theory-change
Scott and Boyd (2017), ‘Interagency Performance Targets A Case Study of New Zealand’s Results Programme’. http://www.businessofgovernment.org/sites/default/files/Interagency%20Performance%20Targets.pdf
The Open Data Institute (2016) ‘Openness principles for organisations handling open data’, https://theodi.org/guides/openness-principles-for-organisations-handling-personal-data
The Open Data Institute (2017) ‘The Data Ethics Canvas’, https://theodi.org/the-data-ethics-canvas
The Open Data Institute (2016) ‘What is data infrastructure?’, https://theodi.org/what-is-data-infrastructure
The Open Data Institute (2015), ‘Supporting sustainable development with open data’, https://theodi.org/supporting-sustainable-development-with-open-data
UNICEF (2016), ‘State of the World’s Children 2016: a fair chance for every child’, https://www.unicef.org/publications/files/UNICEF_SOWC_2016.pdf
United Nations (2015), Sustainable Development Goals. http://www.un.org/sustainabledevelopment/sustainable-development-goals
United Nations Children’s Fund (UNICEF) (2016), State of the World’s Children 2016: a fair chance for every child. https://www.unicef.org/publications/files/UNICEF_SOWC_2016.pdf

Get in touchtheodi.org | @[email protected] Data Institute, 65 Clifton Street, London EC2A 4JE
