open source tools for monitoring the mpls nodes - idrbt goyal_open source... · open source tools...
TRANSCRIPT

IDRBT
2012
Open Source Tools for
Monitoring the MPLS
Nodes ZENOSS – Transforming IT Operations
Shubham Goyal
C A S T L E H I L L S , R O A D N O . 1 , M A S A B T A N K , H Y D E R A B A D - 5 0 0 0 5 7 .
IIIT – Hyderabad
Project Guide: Dr. N.P.Dhavale DGM, INFINET Department
IDRBT
www.idrbt.ac.in

IDRBT Page 2
Contents
Certificate 3
Acknowledgement 4
Introduction 5
Network Architecture 6
What to Monitor and Why!! 7
What to Look in a Network Monitoring Application 9
IDRBT Network 10
MPLS 11
IDRBT MPLS Architecture 11
Open Source Networking Tools 13
Licensed Networking Tools 13
Zenoss Open Source IT Monitoring 14
Zenoss Features 14
Zenoss Installation Procedure – On Ubuntu 14
Getting Started With Zenoss 16
Conclusion 22
References 23

IDRBT Page 3
CERTIFICATE
This is to certify that project report titled Open Source Networking Tools for monitoring the MPLS nodes submitted by Shubham Goyal of B.Tech. 3rd year, Dept. of Computer Science & Engineering, IIIT-Hyderabad, is record of a bonafide work carried out by him under my guidance during the period 15th May 2012 to 14th July 2012 at Institute of Development and Research in Banking Technology, Hyderabad. The project work is a research study, which has been successfully completed as per the set objectives. In this project assigned to Mr. Shubham Goyal, he has done excellent work. We wish him all the best for the near endeavors. Dr. N.P. Dhavale DGM, Infinet office IDRBT, Hyderabad
IDRBT Page 4
ACKNOWLEDGEMENT
I would like to express my sincere gratitude to the Institute for Development and
Research in Banking Technology (IDRBT) and particularly Dr.N.P.Dhavale, (DGM,
INFINET and Services) who was my guide in this project. This opportunity of
learning all the nuances of network and system monitoring applications was a
boon to me as one rarely gets such exposure. I would not hesitate to add that this
internship in IDRBT has added a different facet to my life as this is a unique
organization being a combination of academics, research, technology,
communication services, crucial applications, etc., and at the same time
performing roles as an arm of regulation, spread of technology, facilitator for
implementing technology in banking and non-banking systems, playing a role of
an NGO (without being one) and many more varied activities.
I am extremely grateful to Dr.N.P.Dhavale for his advice, innovative suggestions
and supervision. I am thankful to the staff of INFINET department at IDRBT for
helping me to get familiar with the applications. I am thankful for IDRBT for
providing such an amazing platform for students to work in real application
oriented research. I am very thankful to Ms. Anuraddha Madam and Shri Shrihari
Sir with whom I worked throughout my intern at IDRBT and the project was
possible only with their cooperation. I am very thankful to Ms. Anuraddha Madam
and Shri Shrihari Sir with whom I worked throughout my intern at IDRBT and the
project was possible only with their cooperation.
Shubham Goyal Project Trainee Department of INFINET IDRBT, Hyderabad

IDRBT Page 5
Introduction
Networking as we see today has constantly evolved from merely just two
computers connected through a wire to a broader platform of Internet which
acclaims to connect one part of the world to the other. As a result modern
computer networks tend to be large heterogeneous collections of computers,
switches, routers and a large assortment of other devices. As networks get larger
and faster, the job of monitoring and managing them gets more complex.
Network downtime now costs significant amounts of money so it is important
that network and system managers are aware of everything that is happening on
the networks for which they are responsible. This is accomplished by using some
form of tool to gather, analyze and represent information about a computer
network therefore, in general, network monitoring involves a set of tools to aid
people to monitor and maintain computer networks.
Network management is a broad functional area incorporating device monitoring,
application management, security, ongoing maintenance, service levels,
troubleshooting, planning, and other tasks – ideally all coordinated and overseen
by an experienced and reliable network administrator. Yet even the most
knowledgeable and capable network administrator is only as good as the network
information that is visible, and that he or she can manage and act on.
Administrators need to know what’s happening on their networks at all times,
including real-time and historical information on usage, performance, and status
of every device, application, and all data on the network. This is the domain of
network monitoring, the most critical function of network management. The only
way to know if everything on our network is operating as it should is to monitor it
continuously.
IDRBT Page 6
Network Architecture
Today’s networks can be astounding in their complexity. Routers, switches, and hubs link the multitude of workstations to critical applications on myriad servers and to the Internet. In addition, there are numerous security and communications utilities and applications installed, including firewalls, virtual private networks (VPNs), and spam and virus filters. These technologies span all verticals and companies of all sizes. Network management, therefore, is not confined to only certain industries or solely to large, public companies. Understanding the composition and complexity of our network, and having the capacity to be informed of how all the individual elements are performing at any given time, is a key success factor in maintaining the performance and integrity of the network – and often of the business – as a whole. There are potentially thousands of data points to monitor on a network, and it is critical to be able to access meaningful, accurate, and current information at any given time. Network administrators need to feel confident that they know what’s happening on their network from end to end at any given point in time. It is critical to “know our network” at all times. A network is no longer a monolithic structure. It includes the Internet, local area networks (LANs), wide area networks (WANs), virtual LANS (VLANS), wireless networks, and all of the devices, servers, and applications that run on them. Whatever enables users to access and share information, utilize applications, and communicate with each other and with the outside world – either through voice, data, or images – is, in essence, our network. A network typically has both internal and external users, including employees, customers, partners, and other stakeholders. Suboptimal network performance affects companies in different ways, depending on the type of user. For example, if employees can’t access the applications and information they need to do their jobs, it means lost productivity and missed deadlines. When customers can’t complete transactions online, it means lost revenues and damaged reputation. And when strategic partners can’t collaborate or communicate with the company, it harms the relationship and affects their bottom line. Even stakeholders such as investors and analysts who can’t get the information they need will also look unfavorably at our company, leading to low stock prices and loss of shareholder value.
IDRBT Page 7
The fact is, though, that networks are so complex that something will go wrong. Every component in the network represents a potential point of failure. That’s why it’s essential to implement redundancy and/or a failover strategy in order to minimize downtime. This way, if a server or router fails, another one waiting idly until needed can automatically come online to mitigate the impact of the failed equipment. Of course, not every problem can be addressed quite so proactively before any warning signs are apparent. However, if we can monitor network performance proactively in real time, we can identify problems before they become emergencies. An overloaded server, for example, can be replaced before it crashes – but only if we know that its utilization rate is increasing to such an extent that a crash is all but imminent. With network monitoring, we should know the status of everything on our network without having to watch it personally, and be able to take the timely action needed to minimize and, when necessary, quickly correct problems.
What to Monitor and Why!!
For something as mission-critical as our network, it’s important to have the right information at the right time. Of primary importance is to capture status information about current network devices (e.g., routers and switches) and critical network servers. A network administrator also needs to know that essential services (e.g., email, website, and file transfer services) are consistently available. The following table contains a representative list of some of the key types of network status information we need to know every minute of every day – and why?

IDRBT Page 8
What to monitor? Why to monitor?
Availability of network devices (such as switches, routers, servers, etc.).
The plumbing of a network keeps the network running
Availability of all critical services on our network.
The whole network doesn’t have to be down to have a negative impact; loss of email, HTTP, or FTP server availability for even just one hour can shut a business down.
Amount of disk space in use on our key servers
Applications require disk capacity. It’s also important to be aware of any anomalous behavior in disk capacity, which can indicate a problem with a specific application or system
Percentage of our routers’ maximum throughput utilized on average.
If we anticipate when we need to upgrade before we feel the pain of needing to upgrade, we’ll minimize disruption to our business
Average memory and processor utilization of our key CPUs/servers.
If we wait until memory is used up, users will never let we forget it
Function of firewalls, antivirus protection, update servers, and spyware/malware defenses.
There’s a difference between having security, and having security that’s working.
Availability of all network devices. Most networks are a combination of heterogeneous devices; we need to be able to monitor Windows, Linux, UNIX, and other types of servers, workstations, and printers.
When there are issues, we should be alerted immediately, either through audio alerts, on-screen displays, or emails automatically generated by the network monitoring solution. The sooner we know what is going on – and the more complete the information included with the alert – the sooner we can take corrective action. Alerts should announce not only when a problem has occurred (or a threshold is being approached), but also whenever a new application or piece of equipment is brought online. They should contain information about the device, the issue, and the event that triggered the notification.
IDRBT Page 9
At the same time, it’s important to generate only meaningful alerts and to minimize the number of alerts stemming from the same problem or event on the network. For example, we want the flexibility to configure the monitoring solution so that it doesn’t alert when scheduled maintenance downtime is initiated. And if availability of many devices is constrained because of a problem with a router or switch, eliminating dependent alerts enables the administrator to more effectively and efficiently diagnose the actual problem. Suppressing these dependencies decreases the information we have to assimilate and increases overall confidence in the alerts we do receive.
What to Look in a Network Monitoring Application
To really know our network, we need a network monitoring solution that can tell us what we need to know – in real time and from anywhere, anytime. For businesses of all sizes, we also need a solution that’s easy to use, quick to deploy, and offers low total cost of ownership – yet also delivers all the features we need. We need a solution with comprehensive capabilities and the same reliability we expect from our network. If we want our network running at high availability, we need a proven solution that we can depend on as well. Remember, we’re monitoring a lot of network components and we’re collecting a lot of information. In order to see things clearly and quickly, we need a solution that displays this data – including a network map, report data, alerts, historical information, problem areas, and other useful information – as a network operating center (NOC) dashboard. As discussed earlier, alerts are important. However, they are like alarm clocks – we want them to go off when we need them to, not when we don’t. For example, just as we don’t want our alarm to go off on Saturday morning, we don’t want our network monitoring solution to alert us during planned service periods. We want to be able to program our weekly maintenance schedule into the system so it can distinguish between planned and unplanned downtime.

IDRBT Page 10
Networks have to run 24/7 regardless of what hours our employees work. And while our network generally stays in one location, our employees sometimes travel. Regardless, we need to be able to access our network monitoring solution anywhere, anytime. For that matter, different people will need to access the system for different reasons, and not everyone should be able to access the same level of information. We need a solution that affords role-based views, that assigns levels of permissions based on the user’s function in the organization. This not only makes the user more productive, it also adds an important layer of security around the information. Finally, we should look for a solution that supports multiple methods of monitoring devices. SNMP (Simple Network Management Protocol) is a flexible technology that lets we manage and monitor network performance devices, troubleshoot problems, and better prepare for future network growth. Many network devices support SNMP, making it easy to monitor them using a solution that supports SNMP.
IDRBT Network
IDRBT (Institute for Development and Research in Banking Technology) started INFINET (Indian Financial Network). INFINET is the communication backbone for the Indian Banking and Financial Sector. It is a Closed User Group Network for the exclusive use of member banks and financial institutions and is the communication backbone for the National Payments System, which caters mainly to inter-bank applications like RTGS, Delivery Vs Payment, Government Transactions, Automatic Clearing House, etc. The network is a hybrid one of terrestrial leased lines and VSATs (Very Small Aperture Terminal) was the main communication backbone for inter-bank requirements. Over the years, with the decline in prices of leased lines, the reliance on VSATs for running applications declined. The VSAT technology also matured over the years with the increase in the size of the market and the number of private VSAT operators. The terrestrial leased line market also underwent significant change with the introduction of MPLS / VPN service being offered by many service providers. Further, as the technology had matured, the
IDRBT Page 11
need for IDRBT to play a role of intermediary between the banks and the commercial VSAT operators also diminished. With the availability of better and more reliable technology in the form of Multi-Protocol Label Switching (MPLS), IDRBT decided to migrate the INFINET backbone to MPLS. The IP VPN MPLS network is an improvement over the Leased Line Network. The Leased Line Network is less scalable and since it is a partial mesh network, adding a new site to the network is difficult. Up gradation of bandwidth too is a time consuming and cumbersome process. Packet switching has disadvantages when compared to MPLS and the quality of service for applications too is not of a high standard.
MPLS (Multi Protocol Label Switching)
The MPLS is a combination of packet forwarding and label switching through a network. It is an integration of high speed layer-2 switching with layer-3 routing using label switching. It improves efficient use of resources and enhances performance of the network. MPLS also enables easy to implement Quality of Service and Class of Service based on application needs. Moreover, implementation of IPSec tunnels (secure tunnels between which data is encrypted) between CPE (Customer Premises Equipment i.e. router) to CPE is easy. When an unlabeled packet enters the ingress router and needs to be passed on to an MPLS tunnel, the router first determines the forwarding equivalence class (FEC) the packet should be in, and then inserts one or more labels in the packet's newly-created MPLS header. The packet is then passed on to the next hop router for this tunnel.
IDRBT MPLS Architecture The INFINET MPLS Architecture is uniquely designed to provide high-level redundancy. Its salient features are full meshed communications at all locations (backbone); two service providers to enable high speed fault tolerance; a VPN

IDRBT Page 12
between two locations could be across service providers; all VPNs between CPEs will be encrypted; and availability of Quality of Service and Traffic Engineering on
Fig.- Basic operation of MPLS network at IDRBT
the last mile as well. The INFINET MPLS network provides the performance characteristics of layer-2 networks and the connectivity and network services of layer-3 networks, improved scalability and easy up gradation of bandwidth through a configuration change at the provider-end and the time involved in upgrading the link is less. The INFINET MPLS network provides for low latency since it involves minimal processing time at the router. The present SLA is for latency of not over 100ms. The architecture changes are underway to bring it to below 50 ms and even better for latency sensitive payment system applications as per user requirements.
IDRBT Page 13
The problem
IDRBT while hosting the INFINET has to take care of the communication backbone of the interbank transfer and other activities. As a result they need to constantly need to monitor over the entire RBI locations all across the country and if for any link going down, need to report the network administrator about it and take necessary actions. This call for the use of a network monitoring tool quite robust and stable which can counter over these problems and comes with the worthwhile result.
The Approach
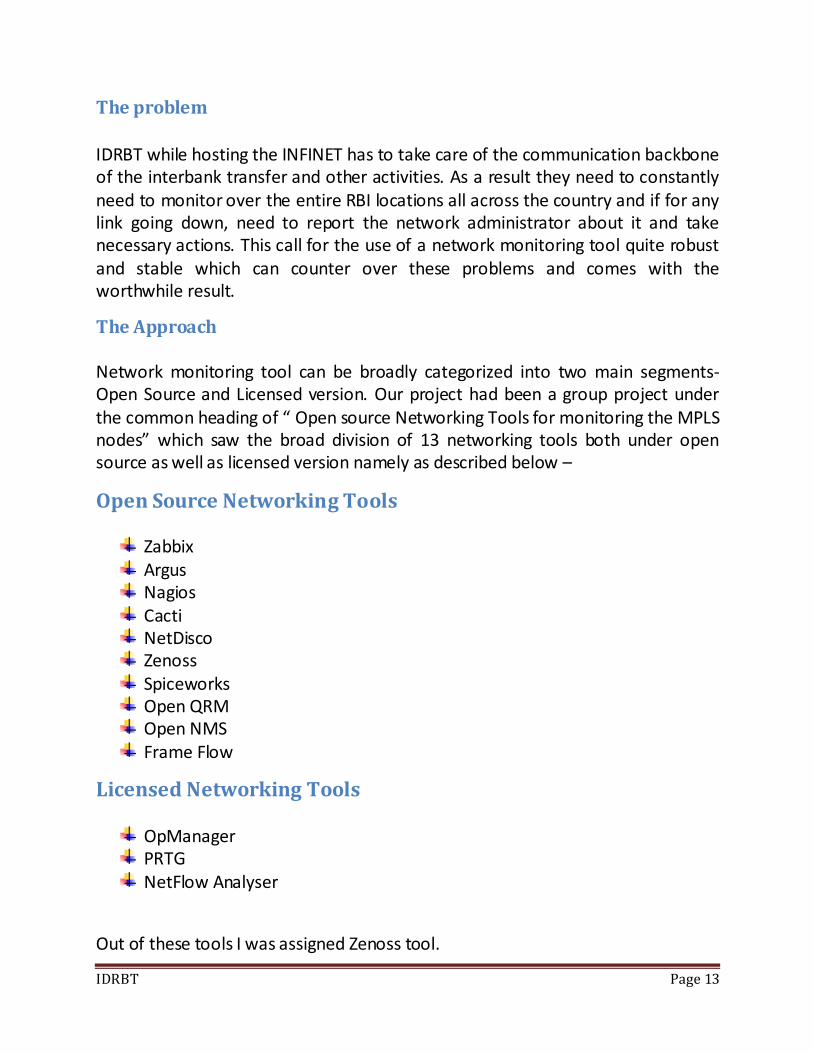
Network monitoring tool can be broadly categorized into two main segments-Open Source and Licensed version. Our project had been a group project under the common heading of “ Open source Networking Tools for monitoring the MPLS nodes” which saw the broad division of 13 networking tools both under open source as well as licensed version namely as described below –
Open Source Networking Tools
Zabbix Argus Nagios Cacti NetDisco Zenoss Spiceworks Open QRM Open NMS Frame Flow
Licensed Networking Tools
OpManager PRTG NetFlow Analyser
Out of these tools I was assigned Zenoss tool.

IDRBT Page 14
ZENOSS – Open Source IT Monitoring
Zenoss is a network and systems management application written in Python. It
provides a web interface that allows system administrators to monitor availability,
configuration, performance, and events. It uses Zope application server, MySQL
database and Net-SNMP monitoring protocol.
Zenoss Features
Alerting and Automatic Remediation
System Log Monitoring and Event Management
Automated Inventory Discovery
Alerting via Email and SNMP
User-friendly Web Interface
Higher hardware requirements.
Critical disk write speed for large scale Zenoss installation.
Erratic and Buggy.
Does not give Packet loss, RTT, Latency, Link Utilization.
Zenoss Installation Procedure – On Ubuntu
Minimum system requirements for installing the Zenoss appliance are:
2GB RAM
20 GB free disk space
Procedure
Go to http://community.zenoss.org/community/download .
Either fill your details and click on Register & Download (Recommended) or
click directly on skip registration, go straight to download >>

IDRBT Page 15
Scroll Down to Native Stacks (Debian/Ubuntu) and download the
Standalone Deb by clicking on it under the 64bit or 32bit sections according
to your OS.
Open the Command Prompt (Terminal) and go to the Downloads directory.
There you will find the file zenoss_stack_*.*.*_x**.deb file.
Run the command dpkg --install zenoss_stack_*.*.*_x**.deb.
Let the above command to complete. It will take some time.
Then run /etc/init.d/zenoss-stack start from the command prompt.
Go to http://localhost:8080/ and you should see the Zenoss login screen
like below.
On the software installed on IDRBT server, Username and password has
been set to admin and idrbt@123 respectively.
If you have opened it first time after installation, you will see a setup wizard
instead of login window like the one given below. Using this wizard, you
will:
Change the admin password
Set up an initial user
Add some devices to the system
IDRBT Page 16
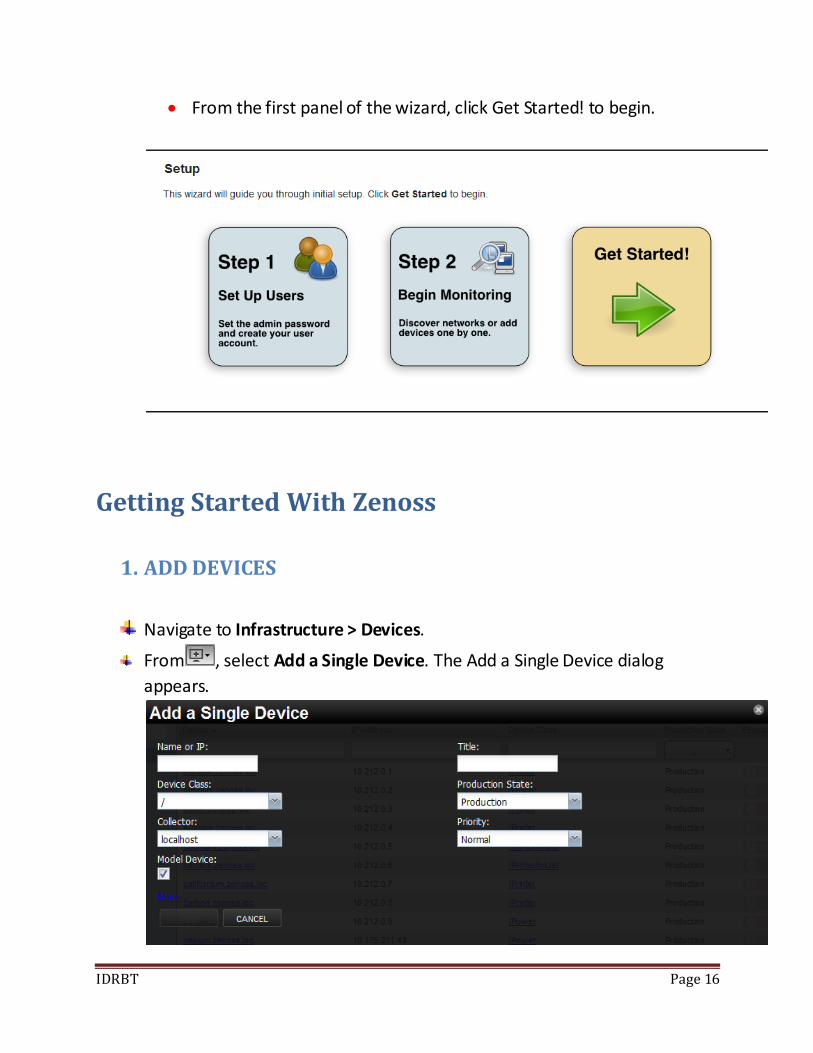
From the first panel of the wizard, click Get Started! to begin.
Getting Started With Zenoss
1. ADD DEVICES
Navigate to Infrastructure > Devices.
From , select Add a Single Device. The Add a Single Device dialog
appears.

IDRBT Page 17
In the dialog, click more to display all available fields and selections.
Enter the following information or make selections in the dialog:
Name or IP - Enter the fully qualified domain name or IP address of a
device on your network.
Device Class - For a Windows server, select /Server/Windows/WMI.
For a Linux server, select /Server/SSH/Linux.
SNMP Community - Enter the SNMP community string for this
device. (Setting SNMP community strings globally is discussed later in
this guide, in the section titled "Setting SNMP Community Strings
Globally.")
Click Add.
Zenoss discovers the device, adds it to the list of devices, and then gathers
additional details about the device to create the device model.
2. View Device Status
Navigate to Infrastructure > Devices.
The device list appears.
In the search area at the top of the Device column, type part or the entire
device name.
The system filters the list to display only those names that match the
characters you enter.
Click the device name.
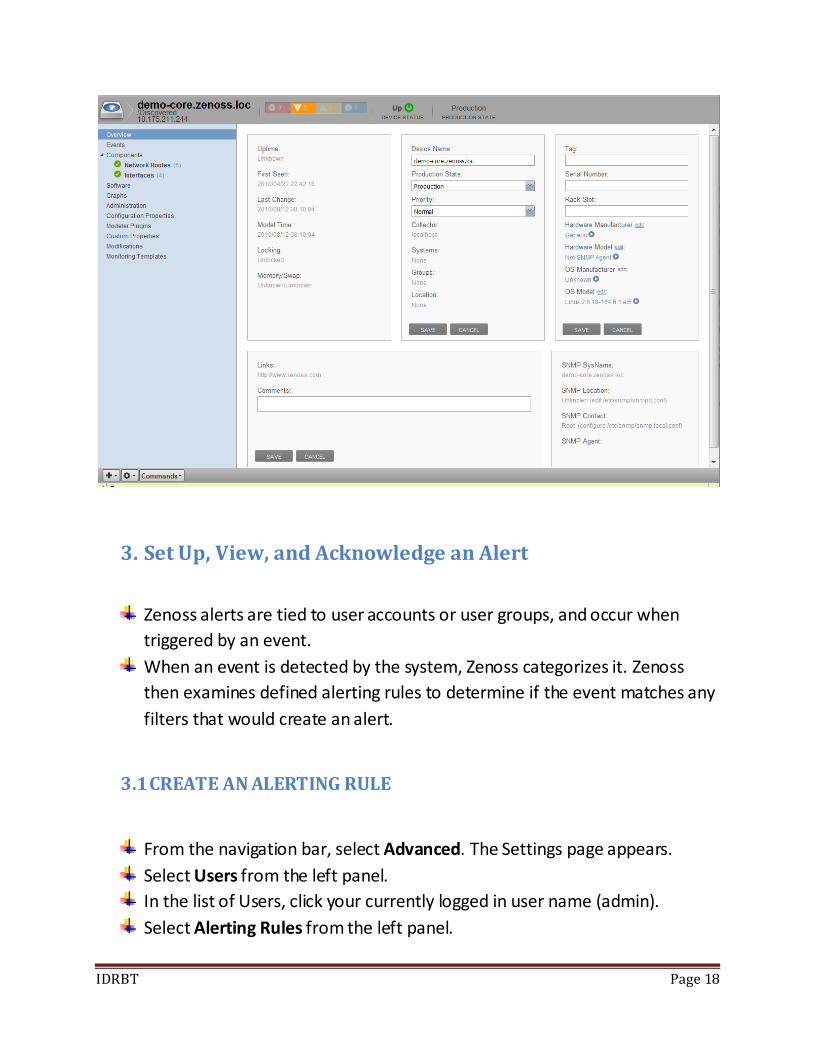
The device overview appears like fig. on the next page. From here, you can
view basic information about the device, or make a selection from the left
panel to see more detailed information.
IDRBT Page 18
3. Set Up, View, and Acknowledge an Alert
Zenoss alerts are tied to user accounts or user groups, and occur when
triggered by an event.
When an event is detected by the system, Zenoss categorizes it. Zenoss
then examines defined alerting rules to determine if the event matches any
filters that would create an alert.
3.1 CREATE AN ALERTING RULE
From the navigation bar, select Advanced. The Settings page appears.
Select Users from the left panel.
In the list of Users, click your currently logged in user name (admin).
Select Alerting Rules from the left panel.
IDRBT Page 19
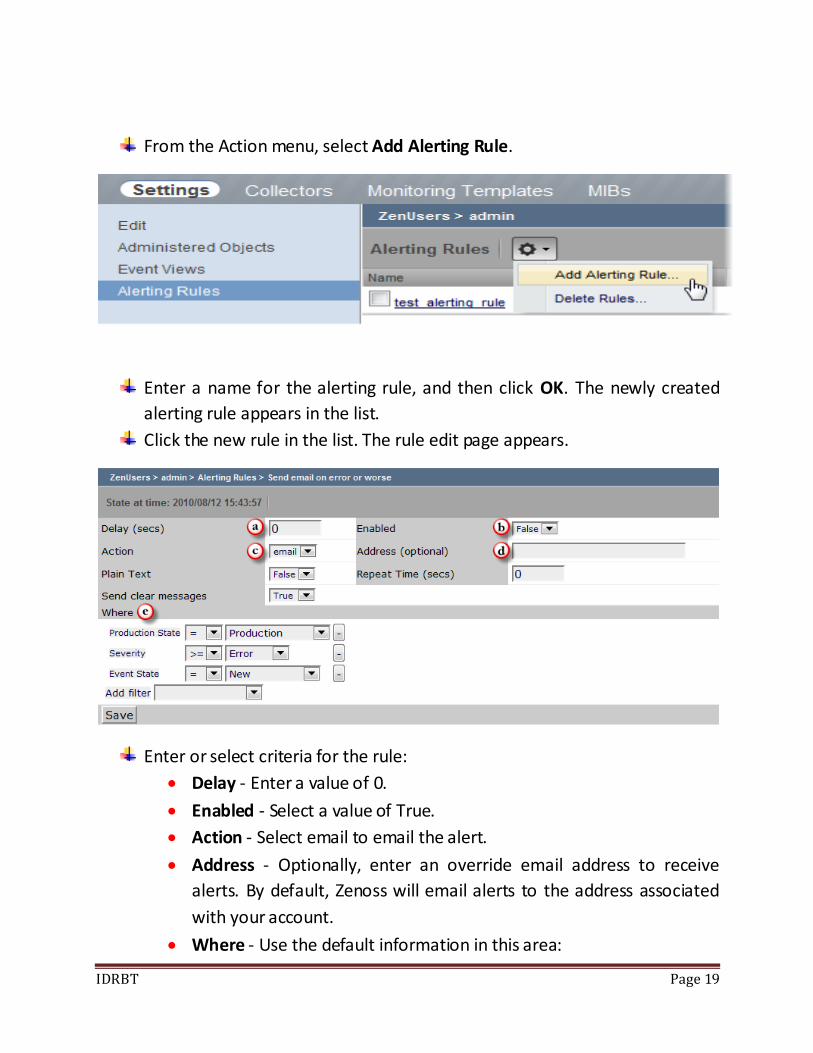
From the Action menu, select Add Alerting Rule.
Enter a name for the alerting rule, and then click OK. The newly created
alerting rule appears in the list.
Click the new rule in the list. The rule edit page appears.
Enter or select criteria for the rule:
Delay - Enter a value of 0.
Enabled - Select a value of True.
Action - Select email to email the alert.
Address - Optionally, enter an override email address to receive
alerts. By default, Zenoss will email alerts to the address associated
with your account.
Where - Use the default information in this area:
IDRBT Page 20
Production State = Production - This rule applies only to
devices in "Production." A device in any other state will not
trigger an alert.
Severity >= Error - This rule applies only to events of severity
"Error" or worse.
Event State = New - This rule applies only to new events.
Click Save.
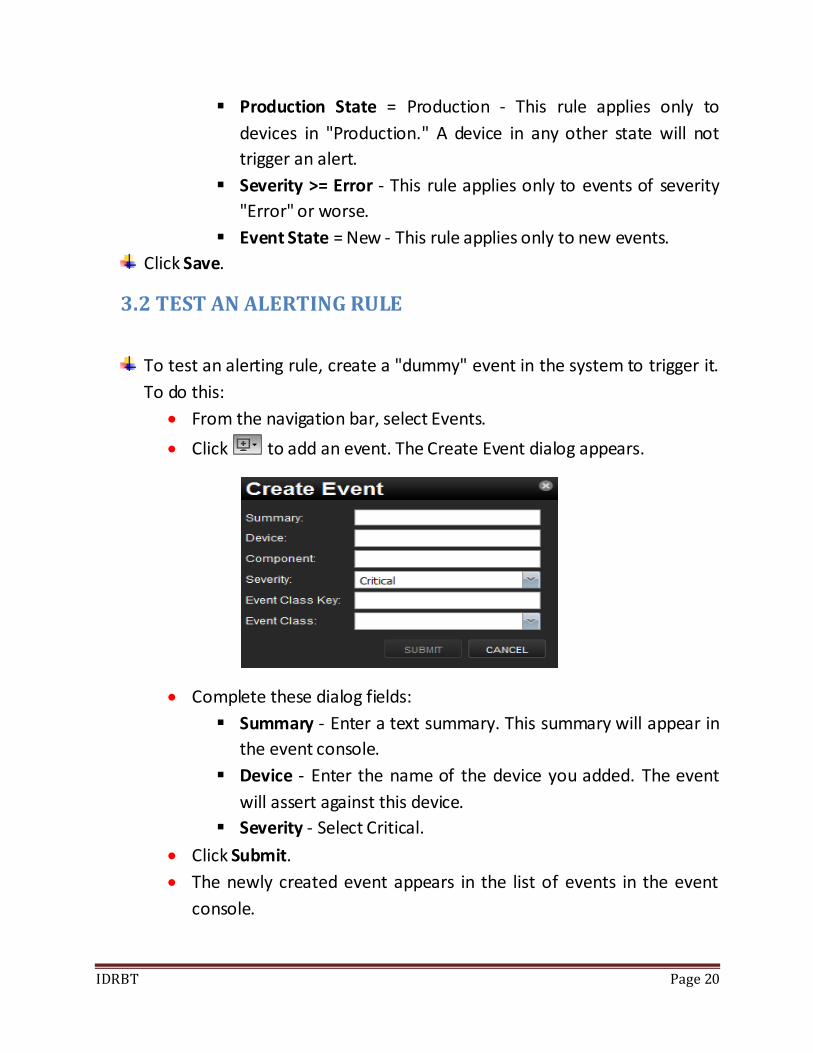
3.2 TEST AN ALERTING RULE
To test an alerting rule, create a "dummy" event in the system to trigger it.
To do this:
From the navigation bar, select Events.
Click to add an event. The Create Event dialog appears.
Complete these dialog fields:
Summary - Enter a text summary. This summary will appear in
the event console.
Device - Enter the name of the device you added. The event
will assert against this device.
Severity - Select Critical.
Click Submit.
The newly created event appears in the list of events in the event
console.
IDRBT Page 21
3.3 VIEW THE ALERT EMAIL
You must set up email before you can view email alerts. See the section
titled Managing Zenoss Users for more information.
Check your email (either the address associated with your account, or the
additional address you specified) to see notification of the event triggered
by the alerting rule.
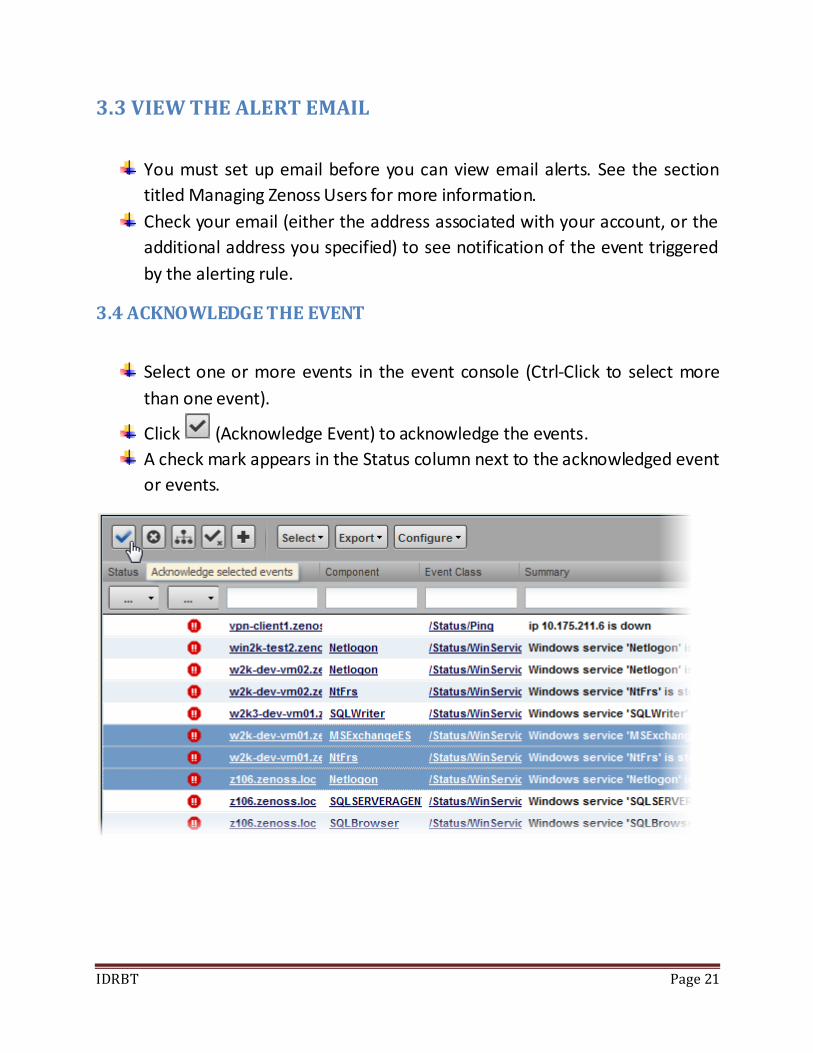
3.4 ACKNOWLEDGE THE EVENT
Select one or more events in the event console (Ctrl-Click to select more
than one event).
Click (Acknowledge Event) to acknowledge the events.
A check mark appears in the Status column next to the acknowledged event
or events.

IDRBT Page 22
Conclusion
Since our project was group project we came to conclusion that none of the tool
was perfectly suitable for the given set of parameters. So the entire group sat
together and discussed the pros and cons of each tool and came to the final result
of integrating the four best networking tools over the servers of IDRBT.
The Comparison of different tools is summarized in the following table –
IDRBT Page 23
Zenoss is good but not the best tool for Network Monitoring. We have not
included it in final list of recommended tools.
Based on the Comparison chart, the Selected tools are:-
Zabbix
openNMS
Spiceworks
Nagios
All the tools are successfully installed in the INFINET servers and the real time
monitoring of the network has started.
References
Zenoss Product Guides
http://community.zenoss.org/community/documentation
Zenoss Wiki
http://community.zenoss.org/community/documentation/wiki
Zenoss FAQ
http://community.zenoss.org/docs/DOC-2445
Zenoss User Forums
http://community.zenoss.org/community/forums
Zenoss Blog
http://community.zenoss.org/blogs/zenossblog