operating instructions em34-3 data logging system … · signed for the allegro cx field computer...
TRANSCRIPT

EM34-3
1745 Meyerside Drive, Mississauga, Ontario, Canada L5T 1C6Tel: (905) 670 9580 Fax: (905) 670 9204
E-mail: [email protected]
Geonics Limited
July, 2005
Version 1.00
EM34-3 DATA LOGGING SYSTEMFOR FIELD COMPUTER Allegro CX Field PC
OPERATING INSTRUCTIONS


Table of Contents
1. Introduction ................................................................................................ 1 1.1 Program Requirements ......................................................................... 2 1.2 Installing EM34-3................................................................................ 2 1.3 Data Files Transfer ............................................................................... 2 1.4 Running EM34-3 Program.................................................................... 3 1.5 Main Menu......................................................................................... 3
Short description of Main Screen options ...............................................................4
2. Survey Setup ............................................................................................... 5
3. Logger Setup............................................................................................... 9
4. Set Port for GPS......................................................................................... 11 4.1 Monitoring GPS Receiver Output ........................................................ 13
5. Display Options ........................................................................................ 15
6. Logging Data ............................................................................................ 17 6.1 Monitoring Mode .............................................................................. 17
Description of Monitoring Mode options..............................................................19 6.2 Stand By Mode.................................................................................. 20 6.3 Logging Mode................................................................................... 21 6.4 Stand By Mode Field Options ............................................................. 22
7. View Data Files........................................................................................... 27
Appendix A ....................................................................................................... 31 A.1 Description of Data File in EM34-3 Allegro CX Format ......................... 31 A.2 Example of File in EM34-3 (Allegro CX) Format.................................... 34
Appendix B ....................................................................................................... 35 B.1 Using the EM34-3 with a GPS Receiver ............................................... 35 B.2 Description of GGA and GSA Data Messages...................................... 36


1EM34-3 Data Logging System (DAS70-CX)
1. IntroductionThe Geonics EM34-3 Data Logging System (DAS70-CX) consists of a field computer Allegro CX, data acquisition program EM34-3, and associated cable to connect the Allegro CX to the Geonics EM34-3 instrument (any EM34-3 model equipped with RT module). The program EM34-3 is de-signed for the Allegro CX field computer and its MS Windows CE.NET V4.2 operating system.
Program EM34-3 acquires and records survey data from the EM34-3 system, under the control of the operator. It also records various field information such as survey line number (line name), starting station, increment, comments, etc. Readings are displayed in real time in mS/m or ppt in graphic and numeric mode. In addition, the program allows you to monitor the instrument output while data are not recorded. The EM34-3 also continuously monitors the EM34-3 measured component (Conductivity), dipole mode (Vertical or Horizontal), coils separation (10, 20 or 40 m), instru-ment scale (10, 100 or 1000), state of fiducial marker, as well as GPS signal quality parameters (if connected to the system) without leaving the program.
The program allows the user to set the EM34-3 into a specific instrument mode of operation: AUTO, Wheel, or Manual modes. In AUTO mode readings can be automatically recorded in desired time intervals. In Wheel mode readings are triggered by a counter installed at the wheel assembly, and in MANUAL mode readings are triggered manually by the operator. In AUTO and Wheel modes the program can record one combination of the EM34-3 dipole mode (Vertical or Horizontal) and coil separation (10 m, 20 m, or 40 m) per station. In Manual mode any combination (up to maximum 6) of dipole modes and separations can be taken at each station, and data can be averaged at up to 100 samples per reading.
The EM34-3 will accept NMEA-0183 compatible data from a GPS receiver directly connected to an Allegro field computer. GPS data which are embedded in the EM34-3 data file can be processed later in the Geonics DAT34W program. The connected GPS must be able to stream NMEA-0183 compatible messages. The EM34-3 uses two NMEA messages GGA and GSA. While message GGA is mandatory, the GSA string is used only to provide information related to the GPS signal quality during data collection.
The EM34-3 program records data together with a time stamp at each station. Data files created with this program can be used to position a survey according to locations recorded separately by a Global Positioning System (GPS). However direct GPS interface described above is highly recom-mended as much more accurate and simpler (for data processing) method of GPS positioning.
Survey setup parameters are saved in a file, therefore they can be automatically used during subse-quent data collection sessions.
The program has an option that allows you to view data files. Data files are saved to the programs current data directory by default. Data file names, which can be set by the program based on the computer clock or user specified, have extension names R34. Files can be transferred to a PC com-puter using a memory card, or by a serial or USB port using the MS ActiveSync program.
Over 1,000,000 readings can be collected in the Allegro field computer with a standard memory of 64 Mb. The maximum speed of data collection is approximately 11 readings per second assuming 1 Hz (or less) GPS input. In graphic display mode, a profile containing the last 135 data readings is displayed for each component.

2 Geonics Limited 3EM34-3 Data Logging System (DAS70-CX)
1.1 Program Requirements To successfully use this software, you will need :
ComputerField computer Allegro CXInstalled MS ActiveSync software (Version 3.50 or later) in desktop PC, or alternatively PCMCIA memory card to transfer files.
Geonics EM34-3The EM34-3 instrument (any EM34-3 model with RT modification) with associated cables.
The EM34-3 program for Allegro CX is stored on DAT34W CD disk. All necessary initial files (with extension names .INI) as well as data folder (DATA34) are created in your field computer after the program is run for the first time. Check that the file EM34-3.EXE is included in AllegroCX directory on the CD disk.
1.2 Installing EM34-3While using the Allegro CX the EM34-3.exe file should be transferred from a desktop PC using MS ActiveSync software and USB or serial cable provided by manufacturer. Optionally the program can be transferred to an Allegro using the PC memory card.
It is recommended that the program be placed in non-volatile solid state storage. This memory is represented in the Allegro by the C_Drive icon. In the My Computer on the Allegro, double-tap on C_Drive icon, then folder C_Program Files will appear. The EM34-3 program can be placed in C_Program Files. Folders for data files should be also created in C_Drive, which is a safe area to store data. The program creates folder DATA34 which is the default folder for EM34-3 files.
For more information about data storage options, refer to Chapter 3 of the Allegro CX manual.
1.3 Data Files TransferData files are saved in the Allegro with extension R34-3. Transfer of files to desktop PC can be performed with MS ActiveSync or by PC memory card. Data files with extension R34 are binary raw data files. These files have to be converted to DAT34W format with extension G34 (option "Convert Files" in DAT34W). Then they can be loaded and processed in the DAT34W program.
2 Geonics Limited 3EM34-3 Data Logging System (DAS70-CX)
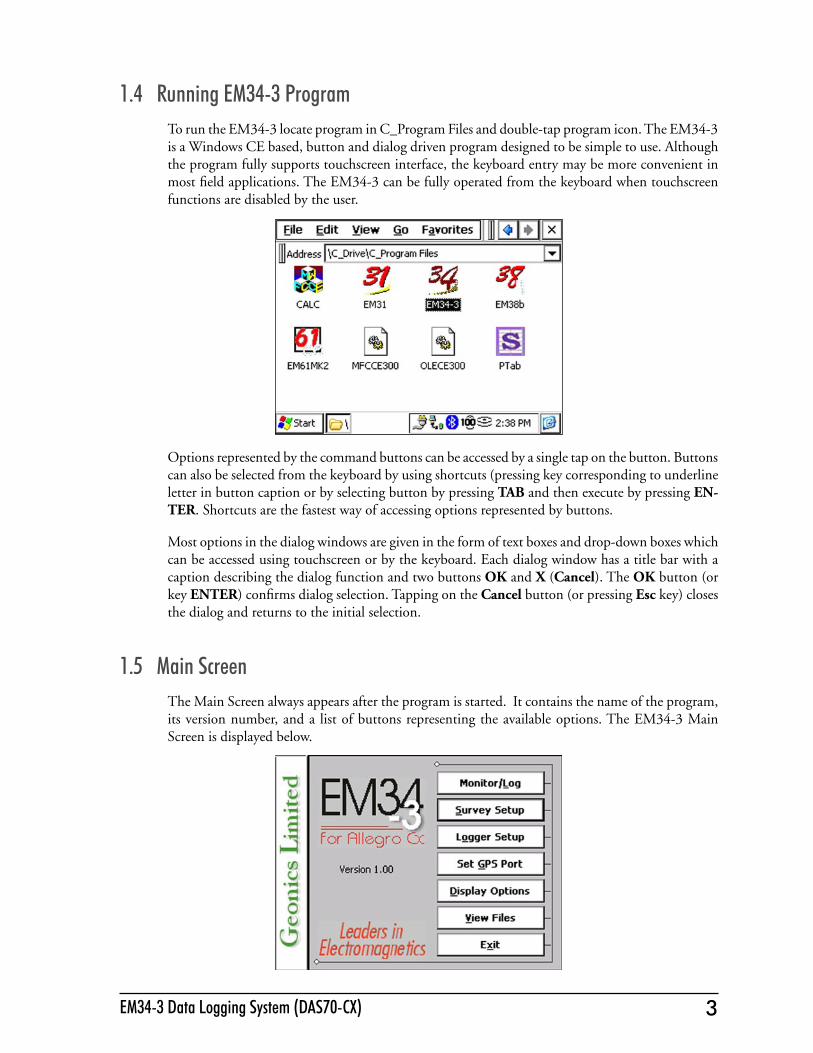
1.4 Running EM34-3 ProgramTo run the EM34-3 locate program in C_Program Files and double-tap program icon. The EM34-3 is a Windows CE based, button and dialog driven program designed to be simple to use. Although the program fully supports touchscreen interface, the keyboard entry may be more convenient in most field applications. The EM34-3 can be fully operated from the keyboard when touchscreen functions are disabled by the user.
Options represented by the command buttons can be accessed by a single tap on the button. Buttons can also be selected from the keyboard by using shortcuts (pressing key corresponding to underline letter in button caption or by selecting button by pressing TAB and then execute by pressing EN-TER. Shortcuts are the fastest way of accessing options represented by buttons.
Most options in the dialog windows are given in the form of text boxes and drop-down boxes which can be accessed using touchscreen or by the keyboard. Each dialog window has a title bar with a caption describing the dialog function and two buttons OK and X (Cancel). The OK button (or key ENTER) confirms dialog selection. Tapping on the Cancel button (or pressing Esc key) closes the dialog and returns to the initial selection.
1.5 Main ScreenThe Main Screen always appears after the program is started. It contains the name of the program, its version number, and a list of buttons representing the available options. The EM34-3 Main Screen is displayed below.

4 Geonics Limited
These options are selected by using tapping buttons, or from keyboard using TAB/ENTER or shortcuts indicated by underline label characters. In case of Main Screen buttons the Down and Up arrow keys and <ENTER> can be used as well.
Short description for each of the options follows.
Short description of Main Screen options
Monitor/Log This option allows to monitor and log the EM34-3 output. Monitor/Log screen starts always in Monitor mode, and then after a data file is created Logging mode is available. Monitor mode provides initial inspection of the range of the instrument readings at the particular site, monitoring the instrument performance, and quick inspection of the instru-ment settings.
Survey SetupThe Survey Setup dialog will be displayed. All survey settings (survey line name, increments, etc.) can be specified in this dialog.
Logger SetupDialog window that is associated with this option is used to set the instrument type, serial port number, and type of pause key.
Set GPS PortThe GPS Port Setup dialog allows to disable and enable GPS data acquisition. This op-tion is also used to set the serial port number used for GPS input and to specify necessary serial port communication settings. GPS monitoring window can be accessed from this dialog as well.
Display OptionsThe dialog which will allow you to specify colour and thickness of profile lines will appear. This dialog provides also choice of gid lines for Conductivity or Inphase scale.
View FilesThis option allows to review data files saved in Allegro.
ExitThis option will terminate the program execution.
5EM34-3 Data Logging System (DAS70-CX)
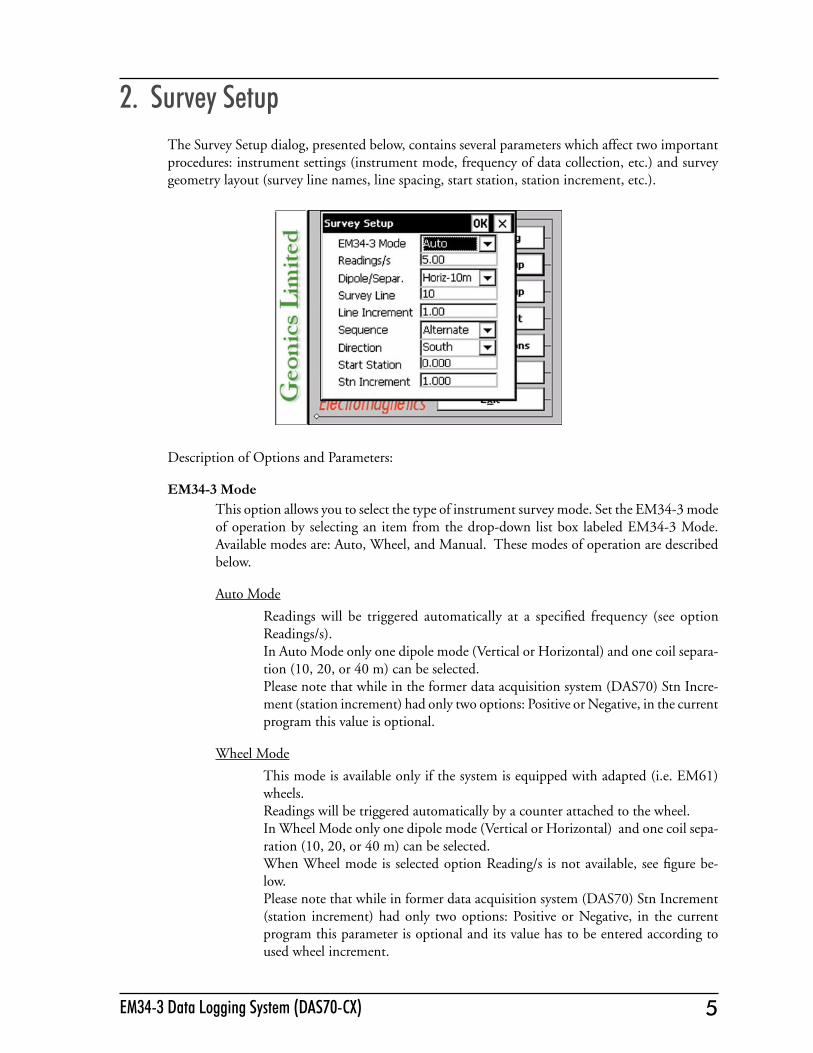
2. Survey SetupThe Survey Setup dialog, presented below, contains several parameters which affect two important procedures: instrument settings (instrument mode, frequency of data collection, etc.) and survey geometry layout (survey line names, line spacing, start station, station increment, etc.).
Description of Options and Parameters:
EM34-3 ModeThis option allows you to select the type of instrument survey mode. Set the EM34-3 mode of operation by selecting an item from the drop-down list box labeled EM34-3 Mode. Available modes are: Auto, Wheel, and Manual. These modes of operation are described below.
Auto Mode
Readings will be triggered automatically at a specified frequency (see option Readings/s). In Auto Mode only one dipole mode (Vertical or Horizontal) and one coil separa-tion (10, 20, or 40 m) can be selected.Please note that while in the former data acquisition system (DAS70) Stn Incre-ment (station increment) had only two options: Positive or Negative, in the current program this value is optional.
Wheel Mode
This mode is available only if the system is equipped with adapted (i.e. EM61) wheels. Readings will be triggered automatically by a counter attached to the wheel.In Wheel Mode only one dipole mode (Vertical or Horizontal) and one coil sepa-ration (10, 20, or 40 m) can be selected.When Wheel mode is selected option Reading/s is not available, see figure be-low. Please note that while in former data acquisition system (DAS70) Stn Increment (station increment) had only two options: Positive or Negative, in the current program this parameter is optional and its value has to be entered according to used wheel increment.

6 Geonics Limited 7EM34-3 Data Logging System (DAS70-CX)
Manual Mode
Readings will be taken only while the manual trigger (switch on the instrument console) is pressed.In Manual Mode any number from 1 to 6 of configurations of dipole modes (Vertical and Horizontal) and coil separations (10, 20 or 40 m) can be selected and measured at one station.Please note that when Manual mode is selected options the option Reading/s changes to option labeled Samples/Rdg.
In this mode any value can be entered for the station increment (Stn Incr) pa-rameter.
Readings/sWhen this option is available (only in Auto mode) activate text box by tapping or using TAB key and then enter desired value.This parameter describes number of readings per second that will be taken. Any number larger than zero can be entered, however the EM34-3 fixed frequency of data output is 11 readings per second. Therefore any entered value is rounded to the nearest possible base frequency of the instrument, i.e. user specified frequency of 10 readings/s will result in ef-fective data acquisition rate of 11 readings/s (every reading is logged), 6 readings/s will cause program to log at a rate of 5.5 readings/s (every second reading from instrument output is logged), etc. At slower rates the difference between specified and effective frequencies is negligible.

6 Geonics Limited 7EM34-3 Data Logging System (DAS70-CX)
Samples/Rdg (Samples per Reading)When this option is highlighted the editor is activated and you can enter desired value. The editor accepts only numerical positive values.
This parameter describes number of readings that will be taken after the trigger switch is pressed. At the end of sampling time the logger will beep and an average value will be writ-ten in to the file and plotted on the screen. During the sampling period interval data are measured at approximately 10 readings per second. For example by specifying 10 samples, 1 second will be used at each station. The maximal sampling is 100 readings which cor-responds to approximately 10 seconds at each station.This option could be used to improve quality of data in areas of high industrial noise, especially if the ground conductivity is relatively low (small response signal).In cases when multiple sampling is not required (good signal to noise ratio) enter the value 1 and 1 reading per station will be taken.This parameter is displayed only when the Manual Mode was selected.
ConfigurationTapping on the down arrow next to the text box opens a drop-down box showing the available settings, or when the keyboard is used activate the text box and then by using up or down arrow keys select one of six available items which depend on EM34-3 Mode selected.When Auto and Wheel mode was selected one of six instrument configurations are available: Ver - 10 m, Ver - 20 m, or Ver - 40 m, Hor - 10 m, Hor -20 m, Hor - 40 m.If Manual mode was selected six settings are available as well: 1, 2, 3, 4, 5, or 6. In this case the selected number describes number of different instrument configurations to be taken at each station. Readings at each station can be taken in any order, however care should be taken to collect desired type and number of configurations at each station.
Survey Line (survey line name)Activate text box by tapping or using TAB key and then enter desired name (number) for the survey line.This is a user’s tag number/name for the profile line. The length of the name can not exceed 8 characters. The line name is usually used as a coordinate perpendicular to the survey lines direction. For example, when survey lines are laid out along W-E direction stations describe W-E coordinate, while Line names may describe S-N (vertical on a map) coordinate.

8 Geonics Limited
Line Incr. (survey line name)Activate text box by tapping or using TAB key and then enter desired for the survey line increment.This parameter specifies the distance by which survey lines will be separated. This setting will be used to determine number (name) of the next survey line.
SequenceTapping on the down arrow next to the text box opens a drop-down box showing the avail-able settings, or when the keyboard is used activate the text box and then by using up or down arrow keys select one of two available items: Alternate and One Way.Alternate is used when neighboring lines are surveyed in the opposite direction, which is the most common procedure during field surveys. One Way is used when each survey line is traversed in the same direction.The choice of this parameter will affect the default start station, a signature of the station increment, and line direction when parameters for the next survey lines is determined.
DirectionTapping on the down arrow next to the text box opens a drop-down box showing the avail-able options, or when the keyboard is used activate the text box and then by using up or down arrow keys select one of four available settings: East, West, South, and North.This parameter indicates the heading of the survey line.
Start Station (start station of a survey line)Activate text box by tapping or using TAB key and then enter the desired value for the start station.This parameter specifies the starting station number for the selected survey line. This value is used in conjunction with Station Increment to calculate the current station number for display purposes.
Stn Increment (station increment)Activate text box by tapping or using TAB key and then enter the desired value for the station increment.This parameter specifies the station increment for the selected survey line. This value is used in conjunction with Start Station to calculate the current station number for display purposes.
After all the parameters in the Survey Setup dialog are updated tap the button OK or press ENTER key to accept the displayed settings. The program will return to the Main Screen. Updated settings will be written to the initial file and they will be given as default parameters in the subsequent Survey Setup dialog.
To return to original settings (state before this dialog was selected) tap Cancel (X) button or press Esc key. All parameters will be reset to initial settings and the program will return to the Main Screen.

9EM34-3 Data Logging System (DAS70-CX)
3. Logger SetupThis option allows you to specify used type of the instrument and set several parameters in the log-ger. The Logger Setup dialog is presented below.
Description of Parameters:
EM34-3 PortThe number of serial port that is assigned to the EM34-3. Available selections: COM1, COM2, COM3, and COM4. The program default is COM1. Communication parameters for the selected serial port are set by the program, since the EM34-3 operates at fixed set-tings: Baud Rate (9600), Parity (N), Data Bits (8), and Bit Stop (1).This port must be different than the port specified in the Set Port for GPS option (see chapter), otherwise a message will be displayed and ports will have to be reassigned.Select port number in the drop-down list box (see Figure below).
UnitsTwo selections are available: Meters or Feet.

10 Geonics Limited
AudioTwo selections are available: Yes or No. The audible click will be generated at each reading when this option is enabled. At fast rate (11 readings/s) the sound may appear not uniform, however this does not affect quality of data acquisition.
Pause keyFour selections are available: any key, Space Bar, Enter, and P This feature is used to pause data recording during logging session. Default setting any key can be changed to one of the three specific keys for field conditions where a logger key can be accidentally pushed causing unwanted stop of data logging.
After all the parameters in the Logger Setup dialog are updated tap the button OK or press ENTER key to accept the displayed settings. The program will return to the Main Screen. Updated settings will be written to the initial file and they will be given as default parameters in the subsequent Log-ger Setup dialog.
To return to original settings (state before this dialog was selected) tap Cancel (X) button or press Esc key. All parameters will be reset to initial settings and the program will return to the Main Screen.
11EM34-3 Data Logging System (DAS70-CX)
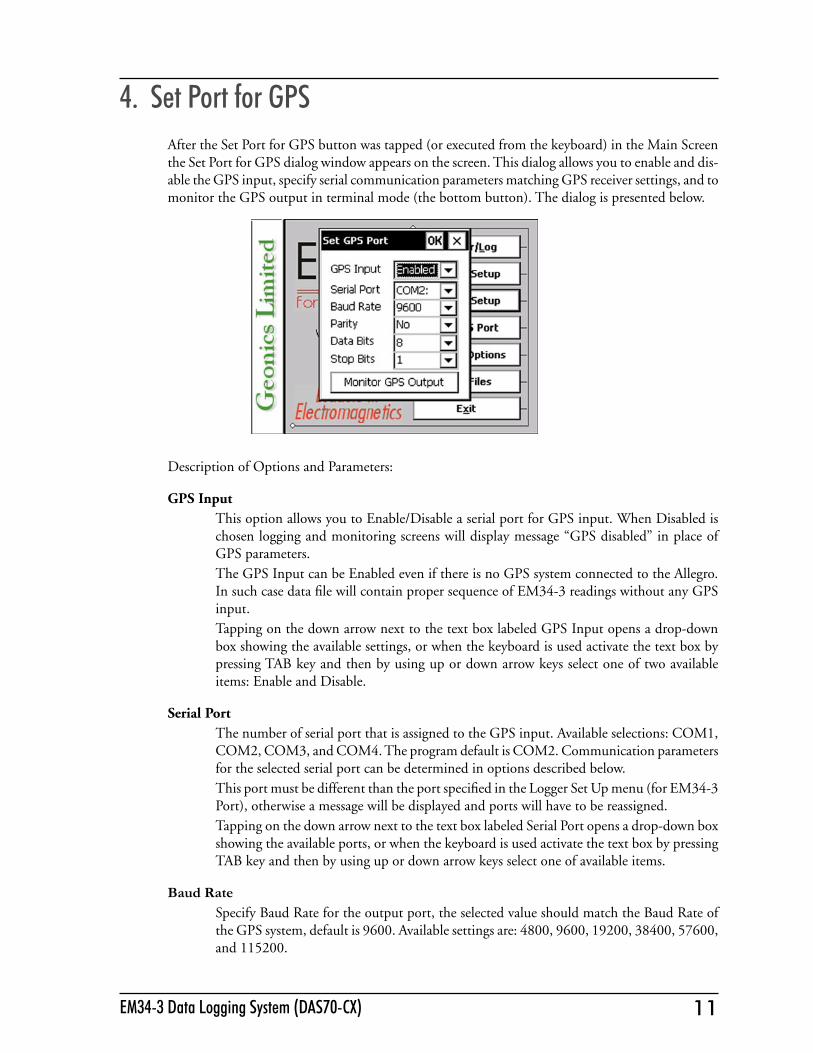
4. Set Port for GPSAfter the Set Port for GPS button was tapped (or executed from the keyboard) in the Main Screen the Set Port for GPS dialog window appears on the screen. This dialog allows you to enable and dis-able the GPS input, specify serial communication parameters matching GPS receiver settings, and to monitor the GPS output in terminal mode (the bottom button). The dialog is presented below.
Description of Options and Parameters:
GPS InputThis option allows you to Enable/Disable a serial port for GPS input. When Disabled is chosen logging and monitoring screens will display message “GPS disabled” in place of GPS parameters.The GPS Input can be Enabled even if there is no GPS system connected to the Allegro. In such case data file will contain proper sequence of EM34-3 readings without any GPS input.Tapping on the down arrow next to the text box labeled GPS Input opens a drop-down box showing the available settings, or when the keyboard is used activate the text box by pressing TAB key and then by using up or down arrow keys select one of two available items: Enable and Disable.
Serial PortThe number of serial port that is assigned to the GPS input. Available selections: COM1, COM2, COM3, and COM4. The program default is COM2. Communication parameters for the selected serial port can be determined in options described below. This port must be different than the port specified in the Logger Set Up menu (for EM34-3 Port), otherwise a message will be displayed and ports will have to be reassigned.Tapping on the down arrow next to the text box labeled Serial Port opens a drop-down box showing the available ports, or when the keyboard is used activate the text box by pressing TAB key and then by using up or down arrow keys select one of available items.
Baud RateSpecify Baud Rate for the output port, the selected value should match the Baud Rate of the GPS system, default is 9600. Available settings are: 4800, 9600, 19200, 38400, 57600, and 115200.
12 Geonics Limited 13EM34-3 Data Logging System (DAS70-CX)
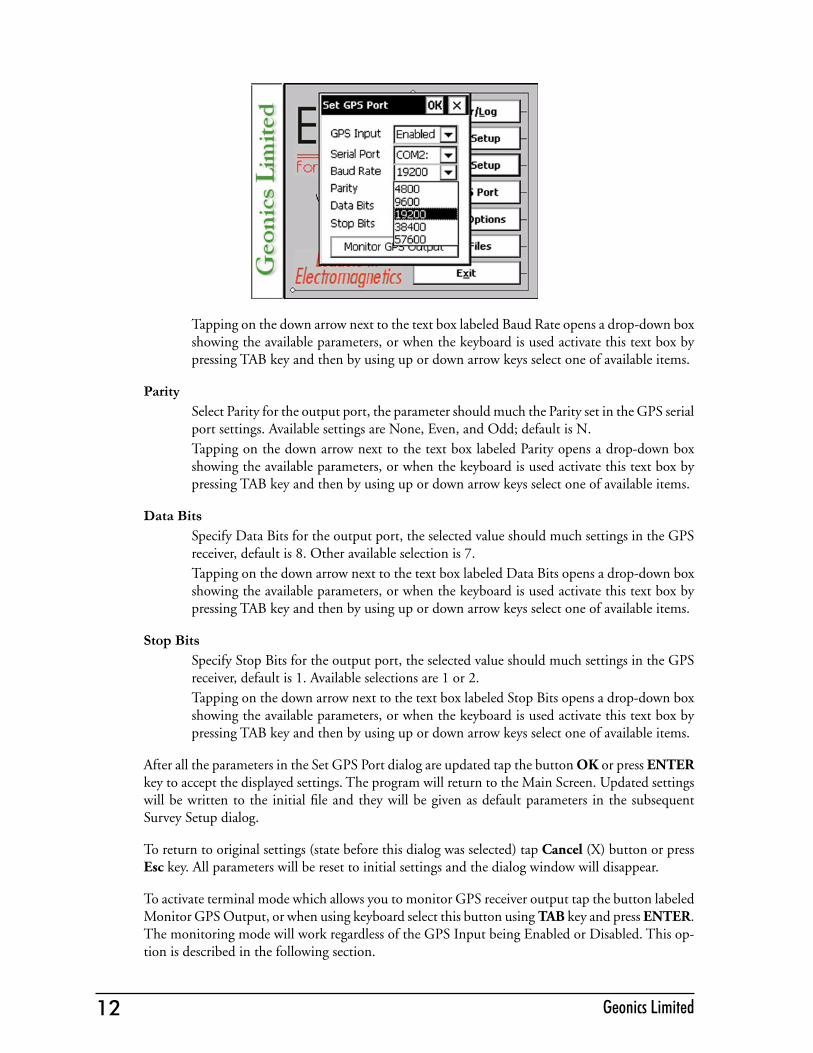
Tapping on the down arrow next to the text box labeled Baud Rate opens a drop-down box showing the available parameters, or when the keyboard is used activate this text box by pressing TAB key and then by using up or down arrow keys select one of available items.
ParitySelect Parity for the output port, the parameter should much the Parity set in the GPS serial port settings. Available settings are None, Even, and Odd; default is N.Tapping on the down arrow next to the text box labeled Parity opens a drop-down box showing the available parameters, or when the keyboard is used activate this text box by pressing TAB key and then by using up or down arrow keys select one of available items.
Data BitsSpecify Data Bits for the output port, the selected value should much settings in the GPS receiver, default is 8. Other available selection is 7.Tapping on the down arrow next to the text box labeled Data Bits opens a drop-down box showing the available parameters, or when the keyboard is used activate this text box by pressing TAB key and then by using up or down arrow keys select one of available items.
Stop BitsSpecify Stop Bits for the output port, the selected value should much settings in the GPS receiver, default is 1. Available selections are 1 or 2.Tapping on the down arrow next to the text box labeled Stop Bits opens a drop-down box showing the available parameters, or when the keyboard is used activate this text box by pressing TAB key and then by using up or down arrow keys select one of available items.
After all the parameters in the Set GPS Port dialog are updated tap the button OK or press ENTER key to accept the displayed settings. The program will return to the Main Screen. Updated settings will be written to the initial file and they will be given as default parameters in the subsequent Survey Setup dialog.
To return to original settings (state before this dialog was selected) tap Cancel (X) button or press Esc key. All parameters will be reset to initial settings and the dialog window will disappear.
To activate terminal mode which allows you to monitor GPS receiver output tap the button labeled Monitor GPS Output, or when using keyboard select this button using TAB key and press ENTER. The monitoring mode will work regardless of the GPS Input being Enabled or Disabled. This op-tion is described in the following section.
12 Geonics Limited 13EM34-3 Data Logging System (DAS70-CX)
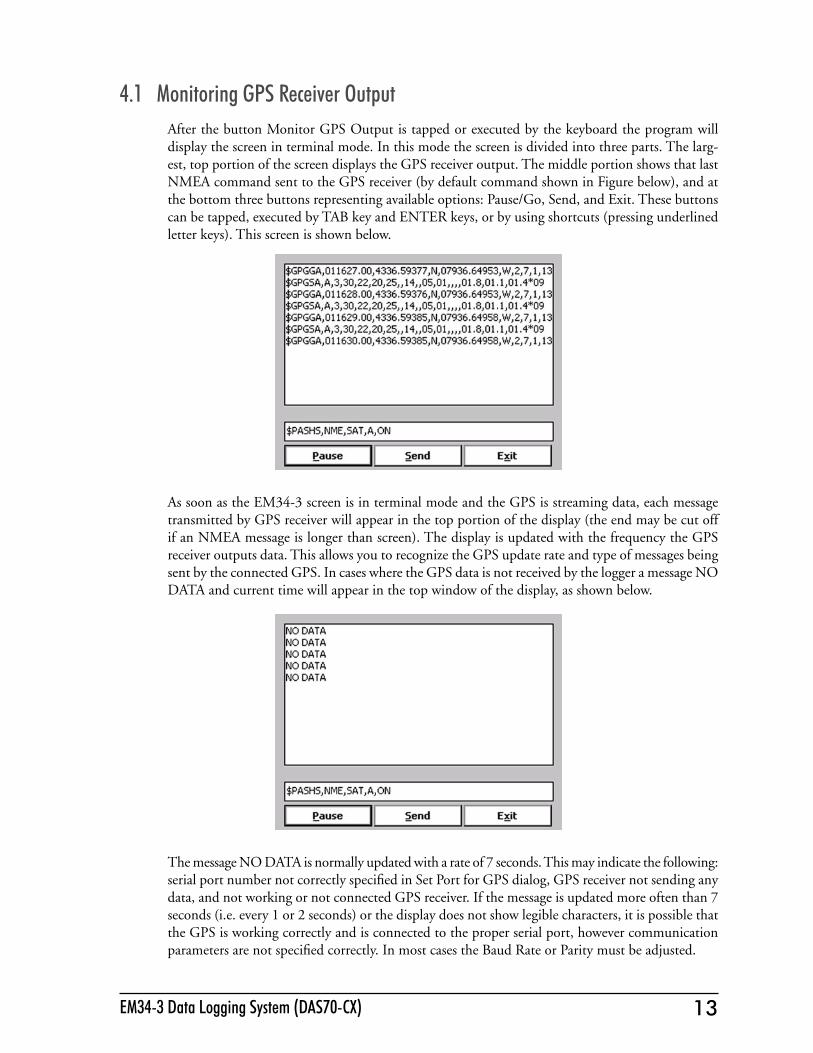
4.1 Monitoring GPS Receiver OutputAfter the button Monitor GPS Output is tapped or executed by the keyboard the program will display the screen in terminal mode. In this mode the screen is divided into three parts. The larg-est, top portion of the screen displays the GPS receiver output. The middle portion shows that last NMEA command sent to the GPS receiver (by default command shown in Figure below), and at the bottom three buttons representing available options: Pause/Go, Send, and Exit. These buttons can be tapped, executed by TAB key and ENTER keys, or by using shortcuts (pressing underlined letter keys). This screen is shown below.
As soon as the EM34-3 screen is in terminal mode and the GPS is streaming data, each message transmitted by GPS receiver will appear in the top portion of the display (the end may be cut off if an NMEA message is longer than screen). The display is updated with the frequency the GPS receiver outputs data. This allows you to recognize the GPS update rate and type of messages being sent by the connected GPS. In cases where the GPS data is not received by the logger a message NO DATA and current time will appear in the top window of the display, as shown below.
The message NO DATA is normally updated with a rate of 7 seconds. This may indicate the following: serial port number not correctly specified in Set Port for GPS dialog, GPS receiver not sending any data, and not working or not connected GPS receiver. If the message is updated more often than 7 seconds (i.e. every 1 or 2 seconds) or the display does not show legible characters, it is possible that the GPS is working correctly and is connected to the proper serial port, however communication parameters are not specified correctly. In most cases the Baud Rate or Parity must be adjusted.
14 Geonics Limited
The NO DATA message may also appear if the GPS data are received correctly, but the GPS receiver was set to send data with a time interval longer than 7 seconds. In this case the NO DATA mes-sage will be displayed in between GPS messages. This indicates that the GPS is working correctly, however the operator should consider adjustment of the GPS receiver output update rate. Most high resolution geophysical surveys require positioning update of 1 or 2 seconds, and a 5 seconds interval can be used only when the survey is carried out at an even pace and along relatively straight survey lines.
The monitoring display can be stopped any time by using button labeled Pause. At that time scrolling of the GPS output will be stopped, and the button will be labeled Go. The next tap (or keyboard action) on this button will activate receiving and display of GPS data.
The button labeled Send allows you to send a NMEA command to the GPS receiver. It is preferable if the GPS receiver parameters are set using the GPS manufacturer software or controller (GPS logger or panel keys). However, when the operator is familiar with NMEA protocol and structure of commands for a given GPS system, this function can be very convenient and useful when the update rate and enabling or disabling messages in the data stream is required.
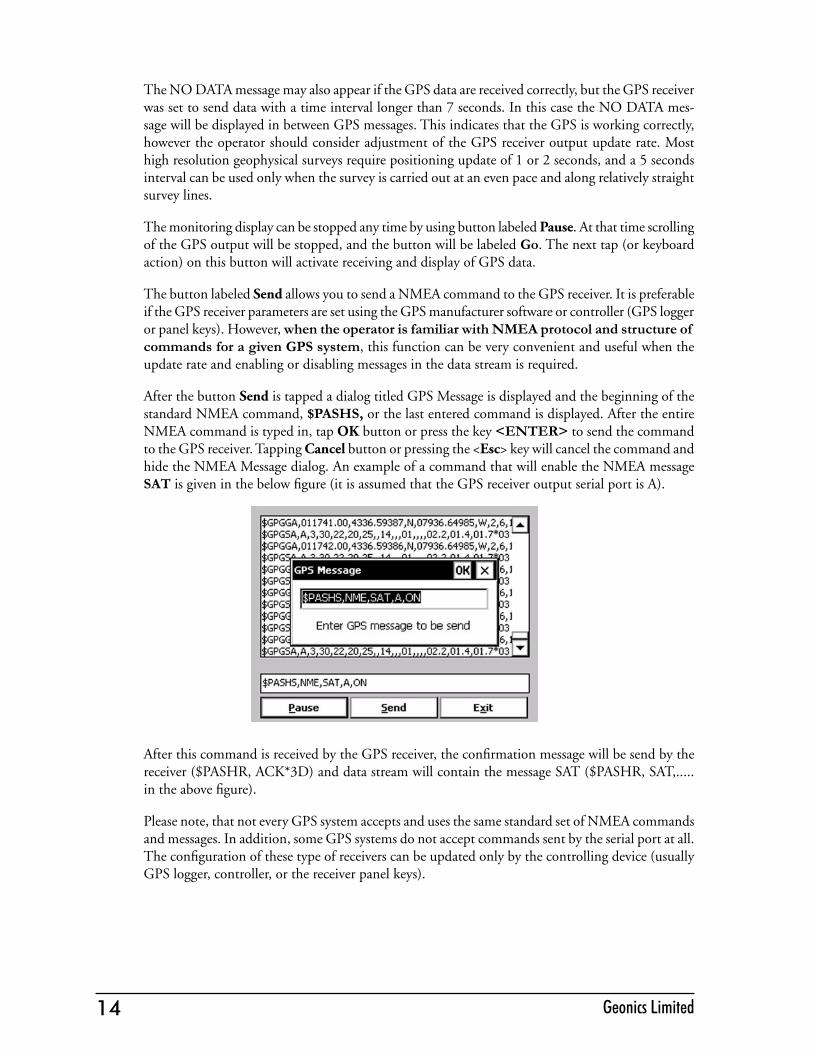
After the button Send is tapped a dialog titled GPS Message is displayed and the beginning of the standard NMEA command, $PASHS, or the last entered command is displayed. After the entire NMEA command is typed in, tap OK button or press the key <ENTER> to send the command to the GPS receiver. Tapping Cancel button or pressing the <Esc> key will cancel the command and hide the NMEA Message dialog. An example of a command that will enable the NMEA message SAT is given in the below figure (it is assumed that the GPS receiver output serial port is A).
After this command is received by the GPS receiver, the confirmation message will be send by the receiver ($PASHR, ACK*3D) and data stream will contain the message SAT ($PASHR, SAT,..... in the above figure).
Please note, that not every GPS system accepts and uses the same standard set of NMEA commands and messages. In addition, some GPS systems do not accept commands sent by the serial port at all. The configuration of these type of receivers can be updated only by the controlling device (usually GPS logger, controller, or the receiver panel keys).
15EM34-3 Data Logging System (DAS70-CX)
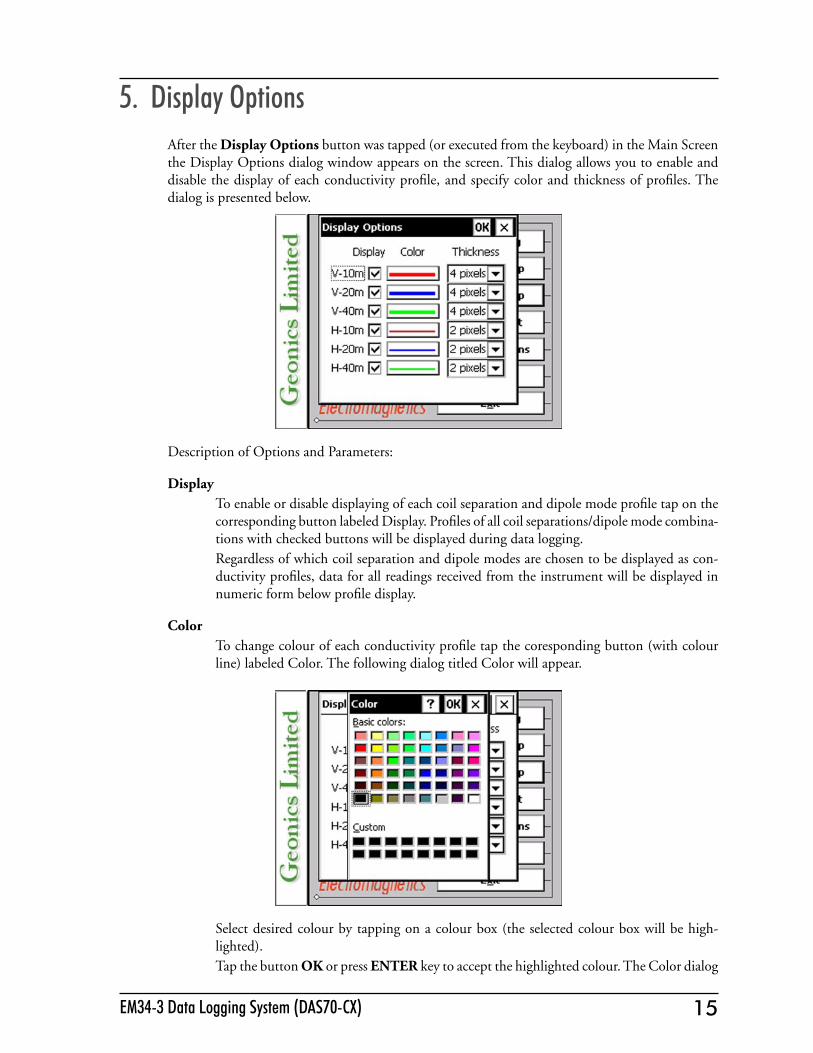
5. Display OptionsAfter the Display Options button was tapped (or executed from the keyboard) in the Main Screen the Display Options dialog window appears on the screen. This dialog allows you to enable and disable the display of each conductivity profile, and specify color and thickness of profiles. The dialog is presented below.
Description of Options and Parameters:
DisplayTo enable or disable displaying of each coil separation and dipole mode profile tap on the corresponding button labeled Display. Profiles of all coil separations/dipole mode combina-tions with checked buttons will be displayed during data logging.Regardless of which coil separation and dipole modes are chosen to be displayed as con-ductivity profiles, data for all readings received from the instrument will be displayed in numeric form below profile display.
ColorTo change colour of each conductivity profile tap the coresponding button (with colour line) labeled Color. The following dialog titled Color will appear.
Select desired colour by tapping on a colour box (the selected colour box will be high-lighted). Tap the button OK or press ENTER key to accept the highlighted colour. The Color dialog

16 Geonics Limited
will disappear and the colour of the appropriate channel button will updated. To cancel colour selection tap Cancel (X) button or press Esc key.
ThicknessSpecify thickness of a profile for a desired channel by using one of four drop-down boxes labeled thickness. Thickness of a profile curve is expressed in pixels. Available settings are: 1, 2, 3, or 4 pixels.Tapping on the down arrow next to the text box (labeled by number of pixels) opens a drop-down box showing available selection (see Figure below). Select thickness by tapping on the desired selection. If keyboard is used activate text box by pressing TAB key (till the box is highlighted) and then by using up or down arrow keys select one of available items.
Grid lines will be displayed be displayed (as thin grey lines) for conductivity scale. Minimum and maximum values for the conductivity are displayed as numerals at the bottom and top right corners of the display. See figure below where grid lines are shown.
After all the parameters in the Display Options dialog are updated tap button OK or press ENTER key to accept the displayed settings. The program will return to the Main Screen. Updated settings will be written to the initial file and they will be given as default parameters in the subsequent Survey Setup dialog.
To return to original settings (state before this dialog was selected) tap Cancel (X) button or press Esc key. All parameters will be reset to initial settings and the dialog window will disappear.
17EM34-3 Data Logging System (DAS70-CX)
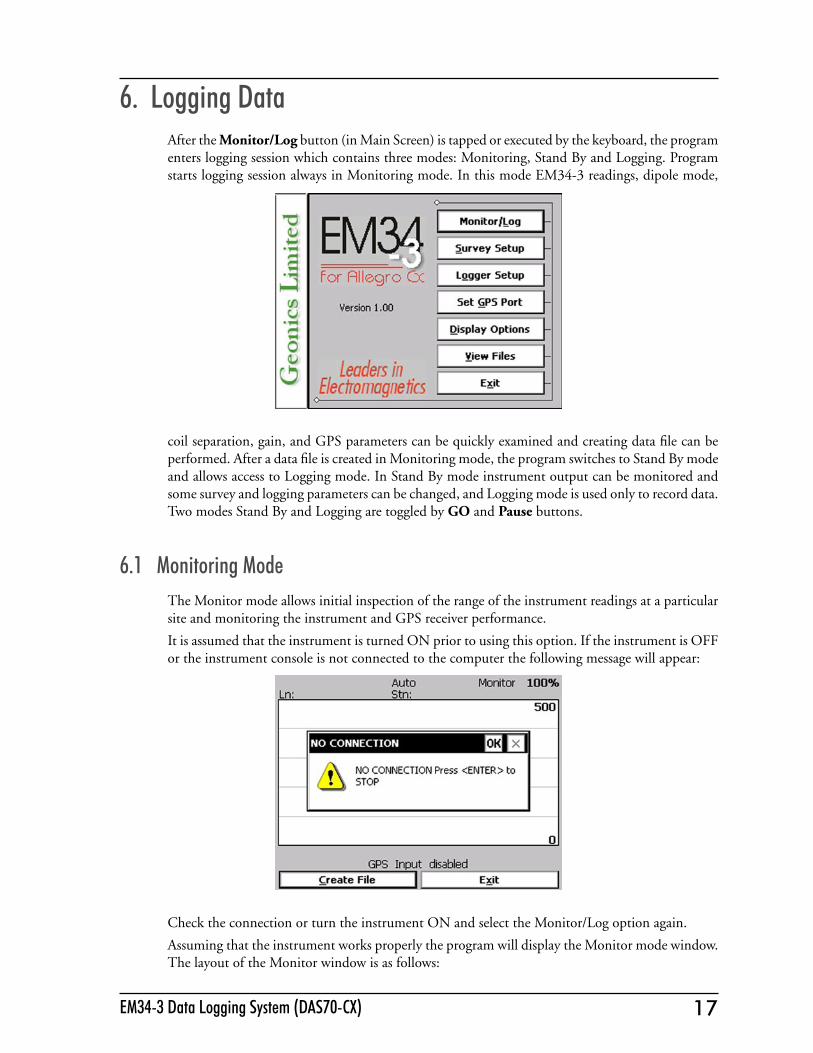
6. Logging DataAfter the Monitor/Log button (in Main Screen) is tapped or executed by the keyboard, the program enters logging session which contains three modes: Monitoring, Stand By and Logging. Program starts logging session always in Monitoring mode. In this mode EM34-3 readings, dipole mode,
coil separation, gain, and GPS parameters can be quickly examined and creating data file can be performed. After a data file is created in Monitoring mode, the program switches to Stand By mode and allows access to Logging mode. In Stand By mode instrument output can be monitored and some survey and logging parameters can be changed, and Logging mode is used only to record data. Two modes Stand By and Logging are toggled by GO and Pause buttons.
6.1 Monitoring ModeThe Monitor mode allows initial inspection of the range of the instrument readings at a particular site and monitoring the instrument and GPS receiver performance.
It is assumed that the instrument is turned ON prior to using this option. If the instrument is OFF or the instrument console is not connected to the computer the following message will appear:
Check the connection or turn the instrument ON and select the Monitor/Log option again.
Assuming that the instrument works properly the program will display the Monitor mode window. The layout of the Monitor window is as follows:
18 Geonics Limited 19EM34-3 Data Logging System (DAS70-CX)
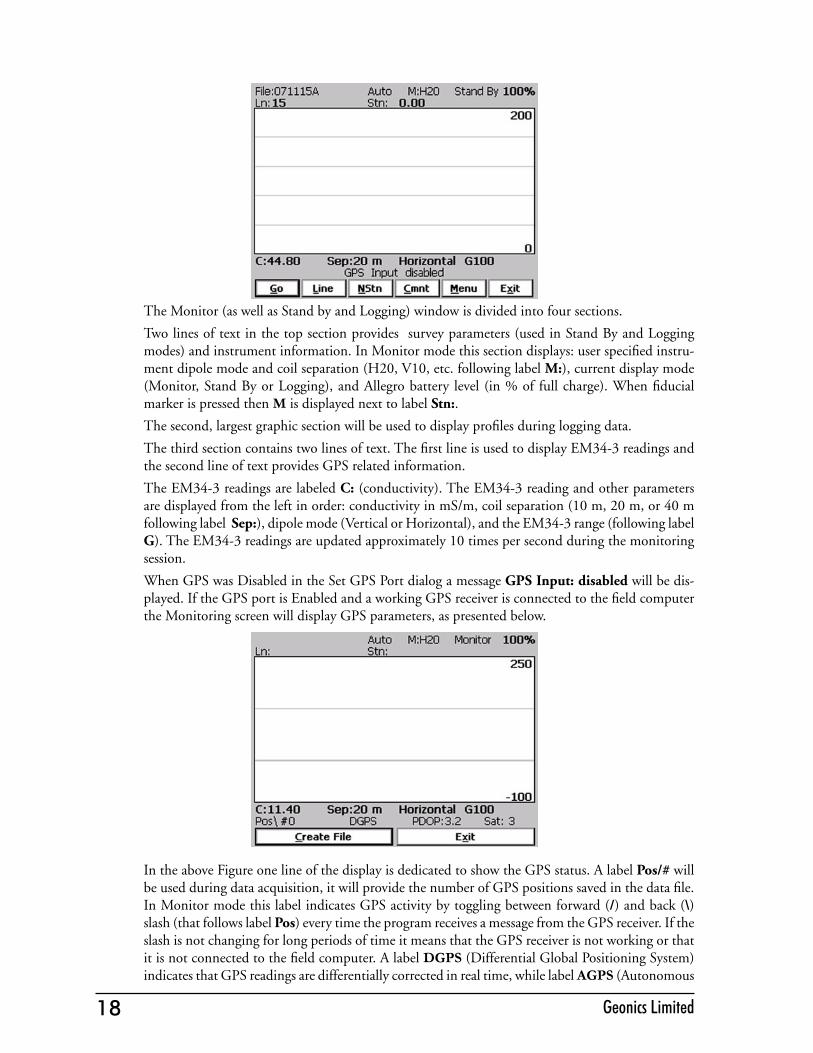
The Monitor (as well as Stand by and Logging) window is divided into four sections.
Two lines of text in the top section provides survey parameters (used in Stand By and Logging modes) and instrument information. In Monitor mode this section displays: user specified instru-ment dipole mode and coil separation (H20, V10, etc. following label M:), current display mode (Monitor, Stand By or Logging), and Allegro battery level (in % of full charge). When fiducial marker is pressed then M is displayed next to label Stn:.
The second, largest graphic section will be used to display profiles during logging data.
The third section contains two lines of text. The first line is used to display EM34-3 readings and the second line of text provides GPS related information.
The EM34-3 readings are labeled C: (conductivity). The EM34-3 reading and other parameters are displayed from the left in order: conductivity in mS/m, coil separation (10 m, 20 m, or 40 m following label Sep:), dipole mode (Vertical or Horizontal), and the EM34-3 range (following label G). The EM34-3 readings are updated approximately 10 times per second during the monitoring session.
When GPS was Disabled in the Set GPS Port dialog a message GPS Input: disabled will be dis-played. If the GPS port is Enabled and a working GPS receiver is connected to the field computer the Monitoring screen will display GPS parameters, as presented below.
In the above Figure one line of the display is dedicated to show the GPS status. A label Pos/# will be used during data acquisition, it will provide the number of GPS positions saved in the data file. In Monitor mode this label indicates GPS activity by toggling between forward (/) and back (\) slash (that follows label Pos) every time the program receives a message from the GPS receiver. If the slash is not changing for long periods of time it means that the GPS receiver is not working or that it is not connected to the field computer. A label DGPS (Differential Global Positioning System) indicates that GPS readings are differentially corrected in real time, while label AGPS (Autonomous
18 Geonics Limited 19EM34-3 Data Logging System (DAS70-CX)
Global Positioning System) indicates lack of differential correction. The next label PDOP with a value varying between 0 and 99.9 represents an index called Position Dilution of Precision (PDOP). This value is available only when messages both, GGA and GSA are received from GPS. The last label Sat and following number shows number of currently tracked satellites. Refer to section 9 (Set Port for GPS), Appendix A, and to GPS manuals for more information about GPS parameters.
The fourth section of the Monitor window lists the program functions available directly in the Monitor mode given at the bottom of the screen in form of buttons. Available options are as fol-lows: Create File (create data file) and Exit (exits the Monitor mode and returns program to Main Screen.
Description of Monitoring Mode Options
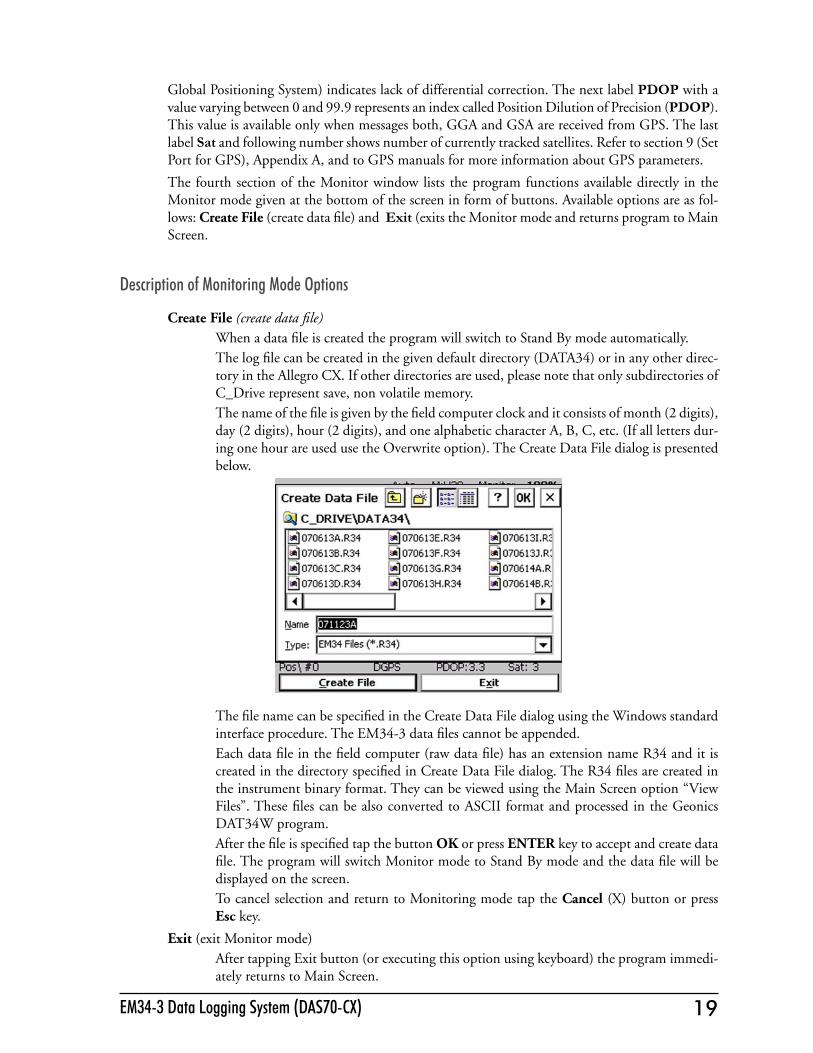
Create File (create data file)When a data file is created the program will switch to Stand By mode automatically. The log file can be created in the given default directory (DATA34) or in any other direc-tory in the Allegro CX. If other directories are used, please note that only subdirectories of C_Drive represent save, non volatile memory. The name of the file is given by the field computer clock and it consists of month (2 digits), day (2 digits), hour (2 digits), and one alphabetic character A, B, C, etc. (If all letters dur-ing one hour are used use the Overwrite option). The Create Data File dialog is presented below.
The file name can be specified in the Create Data File dialog using the Windows standard interface procedure. The EM34-3 data files cannot be appended. Each data file in the field computer (raw data file) has an extension name R34 and it is created in the directory specified in Create Data File dialog. The R34 files are created in the instrument binary format. They can be viewed using the Main Screen option “View Files”. These files can be also converted to ASCII format and processed in the Geonics DAT34W program. After the file is specified tap the button OK or press ENTER key to accept and create data file. The program will switch Monitor mode to Stand By mode and the data file will be displayed on the screen. To cancel selection and return to Monitoring mode tap the Cancel (X) button or press Esc key.
Exit (exit Monitor mode)After tapping Exit button (or executing this option using keyboard) the program immedi-ately returns to Main Screen.

20 Geonics Limited 21EM34-3 Data Logging System (DAS70-CX)
6.2 Stand By ModeAfter data file is created in Monitoring mode the program automatically switches logging window to Stand By mode. This windows is similar to Monitor mode however it contains survey parameters (file name, survey line name, etc.) and different set of options represented by buttons displayed at the bottom of the screen. The logging window in Stand By mode in initial state (before any data is recorded) is presented below.
The main portion of the screen is occupied by the plot area which displays profiles (see Figure below which shows Stand By mode after some data were collected). Scale for conductivity is labeled at the top and bottom (on the right) of the plot window. The amplitude scale is divided by three to five grey grid lines. In the case where the amplitude scale starts with a negative value, then the grid line corresponding to zero is always plotted as a thicker line.
Readings for conductivity and Inphase are shown in numeric form below the plot area. Values of readings and measured parameters are displayed in the following order (from the left): conductivity labeled C:, current coil separation Sep:, dipole mode (Vertical or Horizontal) and EM34-3 cur-rently set range (labeled G). EM34-3 readings (in numeric form) are updated in Stand By mode approximately 10 times per second. Profiles in the plot area are updated only during Logging mode when data are actually saved in the data file.

20 Geonics Limited 21EM34-3 Data Logging System (DAS70-CX)
A section of the window at the top of the screen contains two lines of text displaying survey and instrument related parameters. These are (from top left): current data file name (labeled File:), survey mode (Auto, Wheel or Manual), user selected instrument coil separation and mode dipole mode in Auto or Wheel mode (following label M:) or number of configurations at each station (following label Rdgs:) if Manual mode was selected, logging mode Stand By or Logging, and Allegro internal battery level (in % of full charge, not labeled), current survey line (labeled Ln:), current station (labeled Stn:). When fiducial marker is active a label M is displayed between station label and station value.
In the Stand By mode the station number will not change. Stations in the EM34-3 program are incremented by station increment value after each reading is written to the data file.
One line of the display is dedicated to showing the GPS status. A number following the label Pos/# provides the number of GPS positions saved in the current data file. In Stand By mode the number of positions is not incremented (it is updated only when GPS position is written to the file). However this label indicates GPS activity by toggling between forward (/) and back (\) slash (that follows label Pos) every time the program receives a message from GPS receiver. If the slash is not changing for long periods of time (larger than GPS receiver update rate) it means that the GPS receiver is not working or that it is not connected to the field computer. A label DGPS (Differential Global Positioning System) indicates that GPS readings are differentially corrected in real time, while label AGPS (Autonomous Global Positioning System) indicates lack of differential correction. The next label PDOP with a value varying between 0 and 99.9 represents an index called Position Dilution of Precision (PDOP). This value is available only when messages both, GGA and GSA are received from GPS. The last label Sat and following number shows number of currently tracked satellites. Refer to section 4 (Set Port for GPS), Appendix A, and to GPS manuals for more information about GPS parameters.
Several available field options are listed at the bottom (in form of buttons) of the Stand By mode window. They will be described in the following section 6.4.
6.3 Logging ModeThe Logging mode is enabled by tapping on the GO button or pressing the shortcut key G (or the <ENTER> key if button GO is highlighted) in Stand By mode. After this button is pressed the list of buttons at bottom of the screen will be replaced by one "Pause" button, label Stand By will be replaced by label Logging (at the top of the display) and data will be logged in the mode corre-sponding to the selected EM34-3 mode in the Survey Setup menu. All labels and parameters (with the exception of buttons representing Stand By mode options) are the same as in Stand By mode and they are described in the preceding section 6.2. The screen in Logging mode is presented below.

22 Geonics Limited 23EM34-3 Data Logging System (DAS70-CX)
After the screen changes to Logging mode the current station (label Stn:) is updated according to the station interval. Similarly, if GPS Input was enabled, total number of GPS positions (label Pos) in the data file is incremented every time (usually once a second) GPS position is written to the file. Profile curves (for channels selected in Display Options window) are updated after each reading is written to the data file.
There is only one option available in the Logging mode - pause logging. After a Pause button is tapped or Pause key (any key or other Pause Key selected in Logger Setup window) is pressed the recording is stopped and the Logging mode returns to the Stand By mode. In Stand By mode the EM34-3 data will be displayed with the update rate approximately 10 readings per second, however data will not be saved in the log file and profile curves will be not updated.
Exit from the logging session and access to field options are available only from the logging window in Stand By mode.
6.4 Stand By Mode Field OptionsSeveral field options are available while the Logging window is in the Stand By mode. More frequently used options can be accessed directly from command buttons and others can be used from pop up menu activated by button Menu (displayed below). Command buttons can be used by tapping on the desired button, or from the keyboard by pressing one of the shortcut keys (underlined characters on button labels) or by navigating using <TAB> key (sets button as a default button - default button is highlighted) and pressing <ENTER> key.
Options listed in the menu can be accessed directly (without displaying pop up menu from Menu button) by using keyboard shortcuts, i.e. pressing key S will display Scale dialog. While menu is displayed options can be selected by tapping on the appropriate proper option, or from the keyboard by pressing the shortcut keys or by navigating using <Up> and <Down> arrow keys and executing by <ENTER>
GO (start data logging)Tap on the GO button, or while using the keyboard press shortcut key <G> or if the button is a default button (highlighted) press <ENTER>. The logging window in Stand By mode will change to Logging mode and logging data starts immediately.

22 Geonics Limited 23EM34-3 Data Logging System (DAS70-CX)
Line (New Survey Line)The New Line dialog is displayed (see Figure below). Selecting this option allows the operator to enter a new survey line number (name) and associated line parameters (Line Increment, Line Sequence, Direction, Start Station, and Station Increment). The new line number and associated parameters are prompted by the program based on parameters specified in the Survey Setup menu.
At the top of the dialog the last survey line name and the last logged station are displayed. Default name for the new line is given based on the Line Increment parameter. The default Start Station, direction of the Station Increment, and Direction are determined based on Sequence selection. All these parameters can be overwritten by the user as described in the Survey Setup menu description (chapter 2).After all the parameters in the New Line dialog are updated tap the button OK or press ENTER key to accept the displayed settings. The program will return to the Logging window in Stand By mode. Survey line (Ln:) name and current station (Stn:) value will be updated and profile curves plot for former survey line will disappear. To return to Stand By mode and current survey line settings (state before this dialog was selected) tap Cancel (X) button or press Esc key, the dialog window will disappear.
NStn (New Station)Selecting this option allows the operator to enter a new station number (within the same survey line). The New Station dialog is displayed.
Start and Current station are displayed at the top of the dialog. The New Station can be entered in the provided edit box labeled New Station.

24 Geonics Limited 25EM34-3 Data Logging System (DAS70-CX)
Tap the button OK or press ENTER key to accept the new value. The program will return to the Logging window in Stand By mode. Current station (Stn:) value will be updated and after data logging is activated the profile curves will have a small gap (two pixels) showing the new station entry (see Figure below).
To return to Stand By mode and current survey line settings (state before this dialog was selected) tap Cancel (X) button or press Esc key, the dialog window will disappear and measurements can be continued.
Cmnt (Comment)
Selecting this option allows the operator to enter a comment at any point of the survey. A maximum of 11 characters can be entered as a comment. The Enter Comment dialog is displayed.
Tap the button OK or press ENTER key to accept the comment entered in a text box of the dialog. The text of the comment is saved in the file with a corresponding time stamp and the program will return to the Logging window in Stand By mode. To ignore an entry and return to Stand By mode tap Cancel (X) button or press Esc key, the dialog window will disappear and measurements can be continued.

24 Geonics Limited 25EM34-3 Data Logging System (DAS70-CX)
Scale (New Scale for Profile Plot)Selecting New Scale option allows the operator to enter new scale parameters for the profile plot for each component. This option is available only from pop up menu (accessible from Menu button) or directly from keyboard by using shortcut key <S>.
The Enter Scale dialog will be displayed. It contains two text boxes for Minimum and Maximum values of a new scale for profile plot of conductivity. Current settings (minimum and maximum values) for the scale are displayed in the bottom right and top right corners of the plot area.
After minimum and maximum values are specified tap the button OK or press ENTER key to accept new values and the profile plot area will be redrawn (see Figure below).

26 Geonics Limited
To ignore an entry and return to Stand By mode tap the Cancel (X) button or press Esc key, the dialog window will disappear and measurements can be continued.
Display Options (new options for profile plot display)This option is available only from pop up menu (accessible from Menu button) or directly from keyboard by using shortcut key <D>. After the Display Options item was selected in the pop up menu the Display Options dialog window appears on the screen. This dialog allows you to enable and disable the display of each channel profile, specify color and thickness of profiles, and select linear or compressed amplitude for profiles. The dialog is presented below.
Please refer to chapter 5 where this dialog and its parameters are described in detail.Tap the button OK or press ENTER key to accept updated display parameters. The dialog will disappear and profile plot area will be redrawn in Stand By mode. To return to Stand By mode and current display options (state before this dialog was selected) tap Cancel (X) button or press Esc key, the dialog window will disappear.
Exit (exit data logging)During data collection (in Stand By mode) a confirmation message will be displayed (there is no such message if Exit is performed in Monitoring mode) before program exits logging window.
After above message is confirmed the program stops logging, closes data file and returns to Main Screen.

27EM34-3 Data Logging System (DAS70-CX)
7. View Data FilesThis option allows you to view recorded data files. After the View Files button is tapped (or executed from the keyboard) in the Main Screen the View Data Files window will be displayed.
To open the data file tap the button labeled File or execute this option using the keyboard (navigate to the button by pressing TAB key and when highlighted press ENTER key, or use shortcut - press key F). The Open Data File dialog is presented below.
The file name can be selected in the Open Data File dialog using the Windows standard interface procedure. After the file is selected (highlighted) tap the button OK or press ENTER key to accept and display data file (to cancel selection tap Cancel (X) button or press Esc key). After the file is opened readings taken at the beginning of the first survey line in the file are displayed, as shown below.
28 Geonics Limited 29EM34-3 Data Logging System (DAS70-CX)
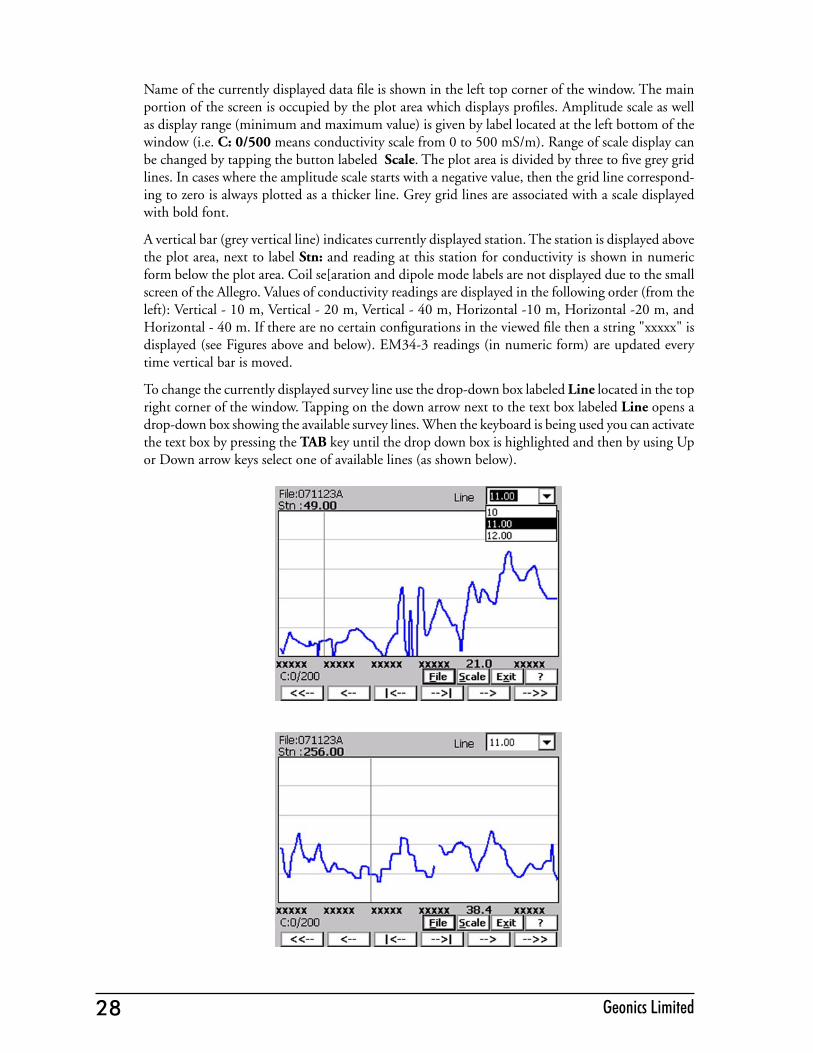
Name of the currently displayed data file is shown in the left top corner of the window. The main portion of the screen is occupied by the plot area which displays profiles. Amplitude scale as well as display range (minimum and maximum value) is given by label located at the left bottom of the window (i.e. C: 0/500 means conductivity scale from 0 to 500 mS/m). Range of scale display can be changed by tapping the button labeled Scale. The plot area is divided by three to five grey grid lines. In cases where the amplitude scale starts with a negative value, then the grid line correspond-ing to zero is always plotted as a thicker line. Grey grid lines are associated with a scale displayed with bold font.
A vertical bar (grey vertical line) indicates currently displayed station. The station is displayed above the plot area, next to label Stn: and reading at this station for conductivity is shown in numeric form below the plot area. Coil se[aration and dipole mode labels are not displayed due to the small screen of the Allegro. Values of conductivity readings are displayed in the following order (from the left): Vertical - 10 m, Vertical - 20 m, Vertical - 40 m, Horizontal -10 m, Horizontal -20 m, and Horizontal - 40 m. If there are no certain configurations in the viewed file then a string "xxxxx" is displayed (see Figures above and below). EM34-3 readings (in numeric form) are updated every time vertical bar is moved.
To change the currently displayed survey line use the drop-down box labeled Line located in the top right corner of the window. Tapping on the down arrow next to the text box labeled Line opens a drop-down box showing the available survey lines. When the keyboard is being used you can activate the text box by pressing the TAB key until the drop down box is highlighted and then by using Up or Down arrow keys select one of available lines (as shown below).
28 Geonics Limited 29EM34-3 Data Logging System (DAS70-CX)
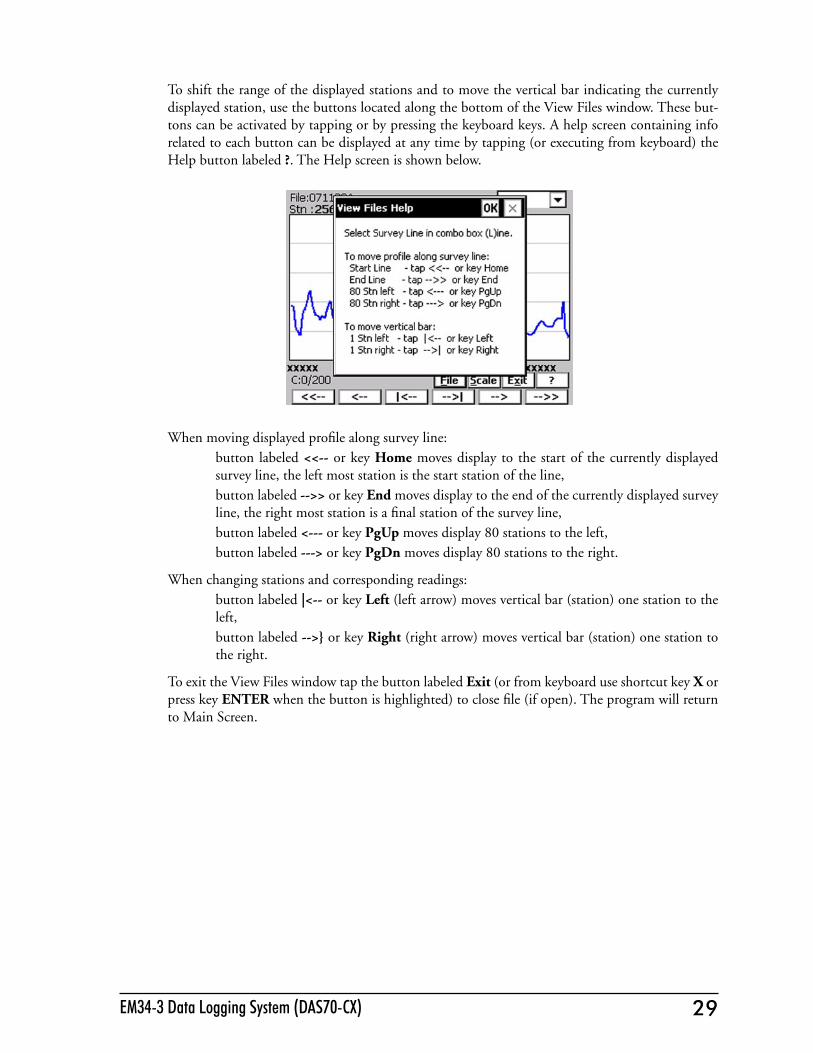
To shift the range of the displayed stations and to move the vertical bar indicating the currently displayed station, use the buttons located along the bottom of the View Files window. These but-tons can be activated by tapping or by pressing the keyboard keys. A help screen containing info related to each button can be displayed at any time by tapping (or executing from keyboard) the Help button labeled ?. The Help screen is shown below.
When moving displayed profile along survey line:button labeled <<-- or key Home moves display to the start of the currently displayed survey line, the left most station is the start station of the line,button labeled -->> or key End moves display to the end of the currently displayed survey line, the right most station is a final station of the survey line,button labeled <--- or key PgUp moves display 80 stations to the left,button labeled ---> or key PgDn moves display 80 stations to the right.
When changing stations and corresponding readings:button labeled |<-- or key Left (left arrow) moves vertical bar (station) one station to the left,button labeled -->} or key Right (right arrow) moves vertical bar (station) one station to the right.
To exit the View Files window tap the button labeled Exit (or from keyboard use shortcut key X or press key ENTER when the button is highlighted) to close file (if open). The program will return to Main Screen.


31EM34-3 Data Logging System (DAS70-CX)
Appendix A
A.1 Description of Data File in EM34-3 Allegro CX FormatEach record contains 24 characters, including line feed at the end of each record.Header of the file (contains two records starting with characters E and H)
EM34-3 - identification of program fileW100 - version number (1.00, W - indicates file created by Windows CE program)Survey Type - GPS (if GPS Input Enabled) or GRD (grid)UT - unit type (0 = meters, 1 = feet) ID - Configuration (dipole mode and coil separation) Auto/Wheel mode: ( 0 = V&10m, 1 = V&20m, 2 =V& 40m, 3 = H&10m, 4 = H&20m, 5 = H&40m) Manual mode: value (ID+1) describes number of instrument configurations at each stationIM - EM34-3 survey mode (0 =Auto, 1 =Wheel, and 2 =Manual)IC - EM34-3 component (not used, always =2)File Name - file name, maximum 8 charactersTime/Wheel/Samples - this field depends on EM34-3 survey mode Auto Mode - Time Increment in seconds Wheel Mode - Wheel Increment (user units, see IT) Manual Mode - Samples/Reading10 - Line Feed character
Header at the start of survey line (four records starting with L, B, A, Z)
Line Name - Line Name, maximum 8 characters Start Station - Start Station for the Line, format F11.2 Dir - Direction of the Line (E, W, N, or S) Station Inc. - Station Increment, format F11.3 Date - Date when Line was created, format DD-MM-YYYY Time - Real Time when Line was created, format HH:MM:SS 10 - Line Feed character
1 2 3 4 5 6 7 8 9 10 11 12 13 14 15 16 17 18 19 20 21
10
22
L
B Start Station (Format F11.2) 10
23 24
A Dir Station Increment (Format F11.2) 10
Z D D M M Y Y Y Y H H : M M : S S 10
Line Name (8 characters)
1 2 3 4 5 6 7 8 9 10 11 12 13 14 15 16 17 18 19 20 21
M 3 4 W 1 0 UT0 ID IM 10
22
E Survey Type
H File Name Time/Wheel/Samples 10
23 24
IC

32 Geonics Limited 33EM34-3 Data Logging System (DAS70-CX)
Timer Relation
Indicates relation between computer clock and the program timer. This record links timer in milliseconds and computer time (local time) in format HH:MM:SS.sss. This record is written to the file each time a new new line is entered.
Reading
I - indicator T, 2, 3, 4, 5, or 6 T - First reading at the station (default for Auto/Wheel mode) 2 - second reading at station (possibble only in Manual mode) 3 - third reading at station (possibble only in Manual mode) 4 - fourth reading at station (possibble only in Manual mode) 5 - fifth reading at station (possibble only in Manual mode) 6 - sixth reading at station (possibble only in Manual mode)Gn - information byte, one character parameter, the ASCII number of this character indicates following:
Range 3 and Range 2 represent sensitivity (gain) as follows
Multiply Reading by above factors to obtain Conductivity in mS/m. Sep 3 and Sep 2 represent coil separations as follows:
Separation Sep 2 Sep 310 m20 m40 m
001
101
* Computer Time (Format HH:MM:SS.sss) 10Time Stamp in ms (10 digits)1 2 3 4 5 6 7 8 9 10 11 12 13 14 15 16 17 18 19 20 21 22 23 24
I Gn not used Time Stamp in ms (10 digits) 10Reading
1 2 3 4 5 6 7 8 9 10 11 12 13 14 15 16 17 18 19 20 21 22 23 24
Bit Decimal Value and Meaning76
5
43210
12864
32
168421
= 1 not used Marker = 1 trigger pressed = 0 otherwise Mode = 1 Horizontal = 0 Vertical Sep 3 Sep 2 Range 3 Range 2 = 0 not used
Sensitivity Range 2 Range 3100010010
101
110
Multiplication FactorsConductivity -0.25Conductivity -0.025Conductivity -0.0025

32 Geonics Limited 33EM34-3 Data Logging System (DAS70-CX)
Reading - five character field containing instrument output. includes sign (+ or -) and four digitsTime - time stamp of the reading in milliseconds, this is time elapsed from the
last Windows start (resets every 49.7 days). The time in milliseconds can be linked with the computer local time by using Times in line started by * (see Timer Relation).
10 - Line Feed character
Comment
New Station
GPS Data Message Records
Each GPS record (GGA Message) is broken in to several 22 characters strings and placed in the EM34-3 data file which contains 24 characters records, including one character indicator and line feed at the end of each record. The GPS sequence starts at the line which contains character @ as the first character, then records that contain continuation of the same message start with character #. The GPS sequence ends with a line starting with the character !. The last line contains logger time stamp in milliseconds for given GPS reading. A sample of the GPS message written in EM34-3 format is given below.
The GPS sequence may contain 4 to 6 records. Component of the GGA message may differ in length, however they are placed in the same number of columns. Refer to Appendix B (section B.2) for definition of each component of GGA data message.
C Comment (maximum 11 characters) 10Time Stamp in ms (10 digits)1 2 3 4 5 6 7 8 9 10 11 12 13 14 15 16 17 18 19 20 21 22 23 24
S New Station (Format 11.2) 10Time Stamp in ms (10 digits)1 2 3 4 5 6 7 8 9 10 11 12 13 14 15 16 17 18 19 20 21 22 23 24
1 2 3 4 5 6 7 8 9 10 11 12 13 14 15 16 17 18 19 20 21 22
@ $ ,AGG h m m s s . s s ,h d d m 10G P
#
m
mmmm , , d d d m m . ms m m m 10
.
m
#
m
q,n
,
q p p . p , s a a, a a a 10
, s
#
.
+
,u,
x x x . x , M , sx s s , 10
a a
!
a CRcc* LF
10
a a
Time Stamp in milliseconds
23 24

34 Geonics Limited
A.2 Example of Data File in EM34-3 (Allegro CX) FormatThe EM34-3 data file records are written in binary format, therefore the file may have different shape when displayed or printed, depending on particular video or pronter settings.
EM34 W100GRD0222 H 071116B 2 L15 B 0.00 AS 10.000 Z11072005 16:18:26 *16:18:26.000 64776400Tä-2111+1540 648167792ü-2455+1762 648180983ô-0814+0315 64841624Tä-1053+0486 648424652ü-1318+0682 648434953ô-1771+1025 64845182Tä-2038+1229 648462162ü-2251+1361 648471573ô-2664+2278 64878867Tä-0695-0630 648889482ü+0145+0390 6490785631⁄4-4878+3454 64916343Tô-6435+4638 649223702ä-6715+4838 649233113ü-7026+5093 64924347Tô-2028+0401 649339672ä+1238-1613 649348103ü-0455-0202 64949955Tô-0872+0125 649516382ä-1030+0266 649524793ü-1201+0386 64953415Tô-1559+0619 649549122ä-1813+0796 649558503ü-2099+1002 64956882Tô-2499+1307 649583872ä-2752+1518 649595183ü-2933+1654 64960555Tô-3356+1965 649624432ä-3647+2190 649635783ü-3862+2385 64964525Tô-4133+2617 649656602ä-4442+2861 649668813ü-4666+3048 64967822Tô-5071+3352 649693312ä-5344+3540 649702753ü-5649+3749 64971314Tô-6016+4002 649725452ä-6324+4215 649735813ü-6589+4405 64974520Tô-6965+4673 649758362ä-7255+4880 649768723ü-7505+5068 64977815Tô-7826+5295 649789482ä-8110+5488 649798943ü-0211+0364 64989435Tô+1244+0173 649930832ä+0879+0403 649939233ü+0614+0596 64994763Tô-0105+1156 649974692ä-0363+1347 649984053ü-0597+1520 64999249Tô-0945+1782 650004682ä-1243+2013 65001502.......................

35EM34-3 Data Logging System (DAS70-CX)
Appendix B
B.1 Using the EM34-3 with a GPS ReceiverThe EM34-3 program accepts input from GPS receiver that stream NMEA-0183 compatible data through their output port. The program uses two NMEA messages: GGA and GSA. The entire GGA message is used later by the DAT34W program, while the GSA message is used only to display PDOP index on the logger screen.
The GPS system means (control device, receiver panel, or manufacturer software) must be used to set GPS receiver communication parameters, to specify frequency of GPS output, and number and type of NMEA messages sent by the GPS system output port. Any GPS system can send various NMEA messages. It is important to select only two messages (GGA and GSA) that are actu-ally used by EM34-3. The program will accept any GPS string sent by the GPS receiver, however it uses time to process GPS data that is not being used. Therefore, selecting a larger number of NMEA messages for GPS output will result in slower data acquisition of EM34-3. Normally, the EM34-3 running in Allegro CX logger uses less than 100 ms to process and record GPS data from two NMEA messages, GGA and GSA.
Only message GGA is necessary to position EM34-3 data. If message GSA is not available in a particular system, the EM34-3 will function and record position data based on GGA message. Lack of GSA message will result in PDOP index displayed as Not Available (N/A) on the logger display. Using message GGA alone will also result in slightly faster operation of the program. The speed can be further improved by setting higher Baud Rate (if it is supported by the employed GPS receiver) in Set GPS Port menu.
The EM34-3 dedicates one line of the display to show GPS status. A label DGPS (Differential Global Positioning System) that GPS readings are differentially corrected in real time Label AGPS (Autonomous Global Positioning System) indicates lack of differential correction. On the right side of the POS a label a slash character is displayed. This slash alternates between forward and back slash with the frequency of GPS update rate (usually 1 second intervals). If the slash is not moving for longer period of time it means that GPS system is not working or that it is not connected to the field computer. Number of recorded GPS positions are displayed on the right side of the alternat-ing slash following # sign. This number is updated only in the logging mode, when the data are recorded. (In Stand By mode or during Monitoring only the alternating slash, and updated values of PDOP and number of tracked satellites, indicate presence of GPS input).
Two more GPS parameters are displayed on the logger screen. These are index PDOP shown by label PDOP and number of tracked satellites represented by label Sat. The index called PDOP (Position Dilution of Precision) measures the strength of satellite coverage for a given area. PDOP is affected by the number of satellites visible and their relative positions in the sky. The smaller the number of PDOP the stronger the satellite coverage is. When there are more than 5 satellites widely spaced visible, the PDOP is 4 or less. However, when there are less satellites visible, or they are unevenly spaced in the sky, PDOP values can be 6 or higher. In most cases, the PDOP in an open sky is less than 3, and most accuracies given for many GPS systems are given for this norm. Refer to GPS documentation and literature for more information related to error sources of GPS positioning.

36 Geonics Limited
B.2 Description of GGA and GSA Data Messages
GGA Data Message
The GGA message contains the GPS position information and it is the most widely used NMEA data message. This message takes the following form:
$GPGGA,hhmmss.ss,ddmm.mmmmm,s,dddmm.mmmmm,s,n,qq,pp.p,saaaaa.aa,u,+xxxx.x,M,sss,aaaa*cc<CR><LF>
Definition of GGA message component:
hhmmss.ss UTC time in hours, minutes, seconds of the GPS positionddmm.mmmmm Latitude in degrees, minutes, and decimal minutess s=N or s=S, for North and South latitudedddmm.mmmmm Longitude in degrees, minutes, and decimal minutess s=E or s=W, for East and West longituden Quality indicator, 0 = no position, 1 = raw, no differentially corrected position, 2 = differentially corrected position, 9 = position computed using almanac informationqq Number of satellites used in position computationpp.p HDOP = 0.0 to 99.9saaaaa.aa Antenna altitudeu Altitude units, M=meters +xxxx.x Geoidal separation (requires geoidal height option)M Geoidal separation units, M = meterssss Age of differential corrections in secondsaaaa Base station identification*cc Checksum<CR><LF> Carriage return and Line feed
GSA Data Message
The GSA message contains active satellites and PDOP value. The GSA message is given in the following form:
$GPGSA,c1,d1,d2,d3,d4,d5,d6,d7,d8,d9,d10,d11,d12,d13,f1,f2,f3*cc<CR><LF>
Definition of GSA message components:
c1 Mode, M = manual, A = automaticd1 Mode, 2 = 2D, 3 = 3Dd2-d13 Satellites used in position computation (range 0 to 32)f1 PDOP (range 0 to 99.9)f2 HDOP (range 0 to 99.9)f3 VDOP (range 0 to 99.9)*cc Checksum<CR><LF> Carriage return and Line Feed