operational audit on accounts receivable (a case …
TRANSCRIPT

OPERATIONAL AUDIT ON ACCOUNTS RECEIVABLE
(A Case Study of PT Yamazaki Indonesia)
SKRIPSI
Presented in partial fulfillment of the requirements for
The Bachelor’s Degree in Accounting
By
Jose Bonifacio Pakpahan
008201500012
FACULTY OF BUSINESS
ACCOUNTING STUDY PROGRAM
PRESIDENT UNIVERSITY
CIKARANG, BEKASI
2019
ii
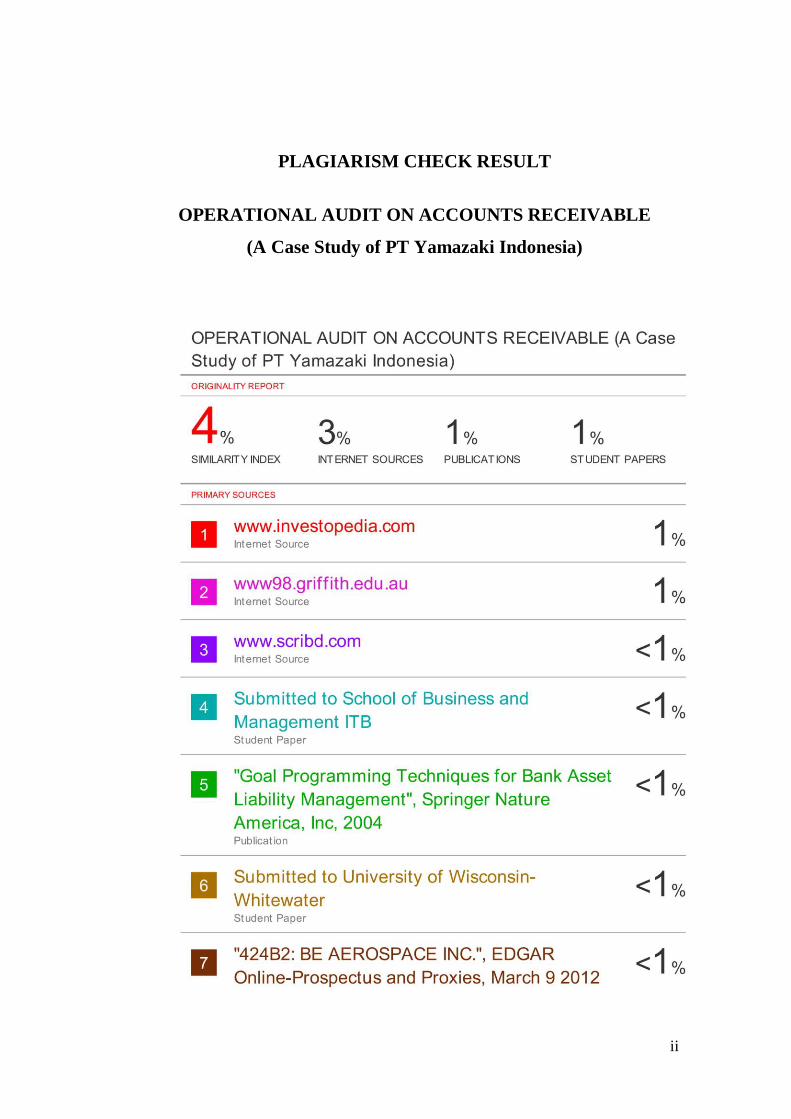
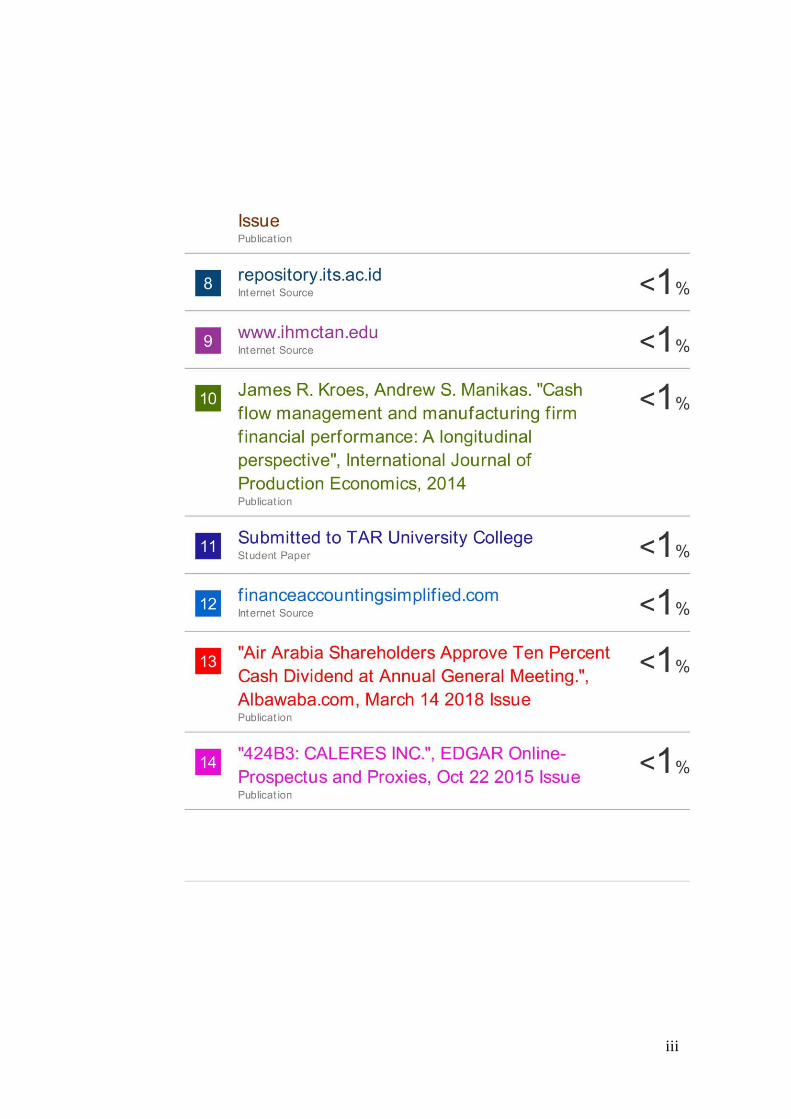
PLAGIARISM CHECK RESULT
OPERATIONAL AUDIT ON ACCOUNTS RECEIVABLE
(A Case Study of PT Yamazaki Indonesia)
iii

iv
v
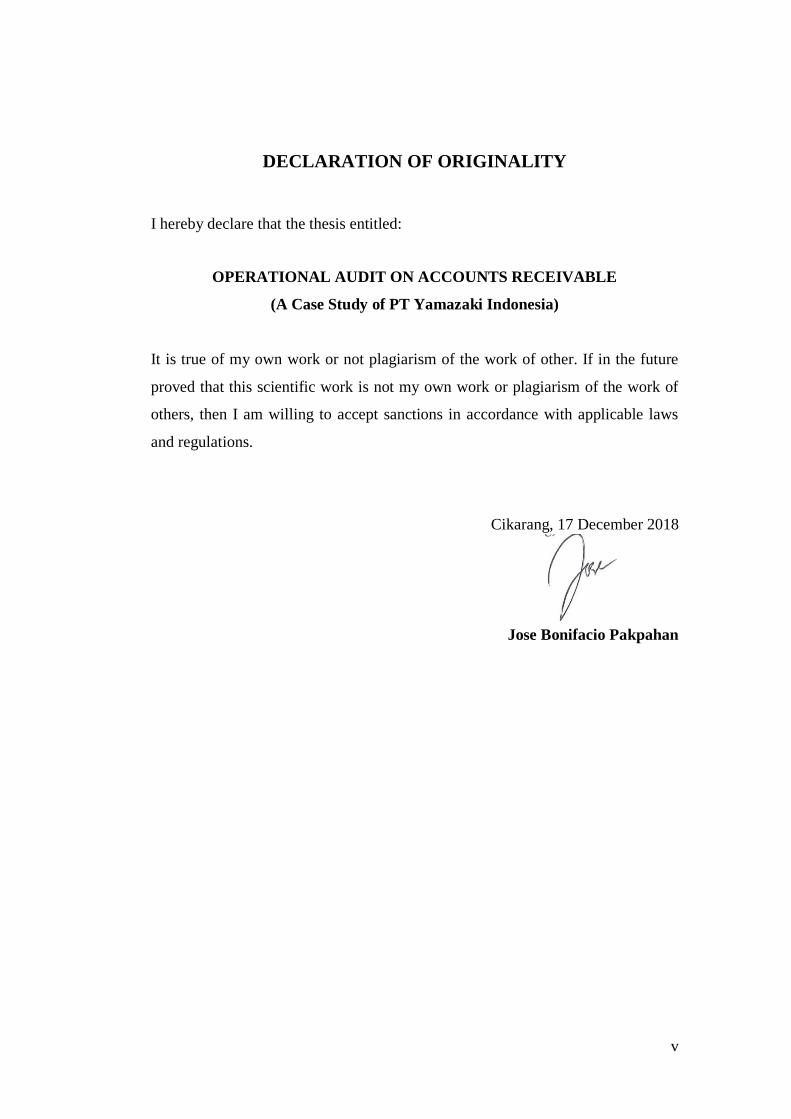
DECLARATION OF ORIGINALITY
I hereby declare that the thesis entitled:
OPERATIONAL AUDIT ON ACCOUNTS RECEIVABLE
(A Case Study of PT Yamazaki Indonesia)
It is true of my own work or not plagiarism of the work of other. If in the future
proved that this scientific work is not my own work or plagiarism of the work of
others, then I am willing to accept sanctions in accordance with applicable laws
and regulations.
Cikarang, 17 December 2018
Jose Bonifacio Pakpahan
vi
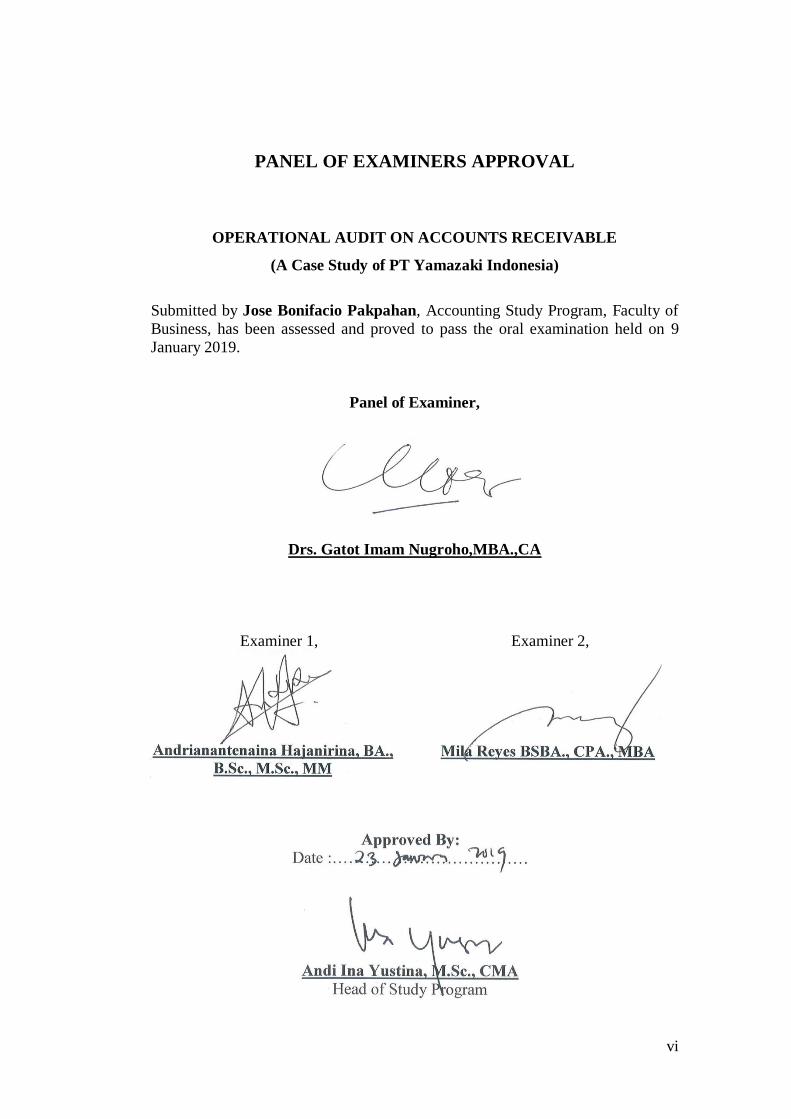
PANEL OF EXAMINERS APPROVAL
OPERATIONAL AUDIT ON ACCOUNTS RECEIVABLE
(A Case Study of PT Yamazaki Indonesia)
Submitted by Jose Bonifacio Pakpahan, Accounting Study Program, Faculty of
Business, has been assessed and proved to pass the oral examination held on 9
January 2019.
Panel of Examiner,
Advisor,
Drs. Gatot Imam Nugroho,MBA.,CA
Examiner 1,
Examiner 2,
Andrianantenaina Hajanirina, BA.,
B.Sc.,M.Sc.,MM.
Mila Reyes BSBA.,CPA.,MBA.
Approved By
Date:………………………………
Andi Ina Yustina, M.Sc., CMA.
Head of Study Program

vii
ACKNOWLEDGEMENT
These are the best supporters that I ever have since the very beginning of
this Skripsi process. I realized that without them I would never accomplish every
single step until I reach this phase of life. They deserve all my gratitude.
1. My Father, Jesus Christ, thank You for Your love, strength and guidance
from the very beginning of my life up until now. Thank you for never letting
me down, for every tear you have turned into joy, for every single
opportunity that you entrusted to me. You have done a lot for me. This
skripsi is fully dedicated to You.
2. Papa and mama, there are not enough words to describe how thankful I am
for both of you. I know I don't show how grateful I am enough, but I really
am. You both have taught me so much, and going away to college and being
apart from you has made me realize how much you both mean to me.
Distance means nothing; since both of you are something precious for me.
Thank you for always being there for me. Without the two of you, I don't
know where I would be. I realize I do not thank you enough for everything.
And for that, I apologize. If I have learned anything while being away from
you, it is that you are the most important people in my life, and I love you
both more than anything. So, mom and dad... Thank you. For everything. I
promise I will work hard to make you proud.

viii
3. My brother and my sister, Juan Benedict and Arthia Josephine. I look up to
you in so many ways, and you inspire me more than you could ever imagine.
I know, I was once the annoying little brother who got everything you guys
wanted, and you were the mean big brother and sister who always picked on
me (if we’re being honest, you still do), but now that we are older and
somewhat more mature, I realize how lucky I am to have an older siblings. I
know I’m lucky to have you guys, and even luckier to have one that I’m so
close to. I couldn’t imagine life without you, and I wouldn’t want to. Thanks
for not only being my bro and sis but also being the greatest friend I could
ever ask for. I'm so proud to call you my big bro and sis.
4. My brother from another mother, bang Daniel Tommy Tambunan. Thank you
for having me in your company to conduct this research. Thank you for every
help you gave to me, you’re like a living savior for my skripsi. I’m glad that I
did ever spent some times in eating Indomie, playing badminton, sleep
together, playing Mobile Legends (the combination of Harith/ Gord and
Rafaela) and most importantly, working together as a team in the last
Company Dinner of PT Yamazaki Indonesia with a person like you. Thank
you for the opportunity and I feel really honored for that.
5. My advisor, Drs. Gatot Imam Nugroho, Ak., MBA., CA. Thank you for your
time, guidance and advices for me in doing this skripsi. Semangat sir
nyalegnya! Saya doain terus!
ix
6. Pak Frans, Pak Jun, Ka Rischa. Thank you for entrusting me in conducting
the research in PT Yamazaki Indonesia; it was a really expensive and great
experience.
7. My lovable friends in PT Yamazaki Indonesia, bang Hendra, bang Niko, Pak
Agung, ka Depi, bang Restu, Ius, pak Budi, ka Rachma, nci Shella, bu Fanny,
ka Dwi, Okky, Indri, ka Ganis and bu Nasha. THANK YOU VERY MUCH
FOR ALL OF THE DATAS GIVEN TO ME! WORKING IN YAMAZAKI
WAS AN EXCITEMENT FOR ME! SEE YOU ON TOP GUYS! I WILL
MISS YOU ALL. THANK YOU SO MUCH.
8. Thank you Mami Tari, for the love you gave to me during my research in PT
Yamzaki Indonesia. I will surely miss your panic expression.
9. Thank you pak Untung for the kuah soto 3 ribu that we eat together with pak
David, ka Hendra and bang Tommy. You’re surely is the funniest guy I’ve
met. I will really miss eating “soto pak Untung” together.
10. My dear skripsi survivor and a roommate of mine, Fredrik Wijaya. Thanks
for making all the way of this semester colorful by all your jokes and
encouragement. I wish you have a great career ahead and success in your
thesis defense as well. I’m sorry if I snore to loud, hehehe.
11. Komsel KomBaWa, for my partners Agatha, Fanya, Daniel, Iki, Nabila and
Feli. Thank you so much for the encouragement throughout these 2 years of
serving as Kakak Komsel together. You guys will always have a special part
in my heart. For Gilbert, Rida, Fidel, Angie and Fidel, thank you for asking

x
me “kapan sidang ko?” every single day we met and all prayers. It boosts up
my spirit. Wishing you all has a great phase on your university life.
12. My dearest friend Sonia. Thank you for reminding me of my things, cheering
me up when I’m down, and supporting me through the process of completing
this skripsi. You may think that you did nothing great, but for me, all those
“nothing great” means world to me. Now that we are apart means that we
have to be more responsible with our activities! Good luck in completing
your college life. Thank you for everything and God bless you and family.
13. Fredrik Wijaya and Ignasius Dymas, my classmates. Thank you for being a
great mate in class and also being a great supporter of mine. I wish you all a
great success on your skripsi and defense along with your career path ahead.
14. Community of Love President University. I have no regret of joining this
family. Thank you for letting me to be a part of this family and for every
opportunity given to me to serve Him through this community. I am blessed
beyond measure. Thank you for being a great supporter. May the light will
always shine in this community. Let all the glory just for Him.
15. My chit chat mates, Amsal 17:17 members. For Jovaldi, Refo, Moses,
Jeremy, Joshua, and Holy, thank you for lots of laughs, supports, and prayers.
I wish you guys a great study and career path ahead.
16. All examiners, I am not able to cross this path without you.
17. All Accounting lecturers and friends. You made up my university life. Thank
you for everything.

xi
I do realize that this skripsi is far from the perfection and I would never be
able to have it done without those great people and every one that I may not able
to mention one by one. I hope that this research will be valuable and useful for
future users.
Jose Pakpahan
The Researcher

xii
RECOMMENDATION LETTER FROM THESIS ADVISOR
This thesis is prepared and submitted by
Name : Jose Bonifacio Pakpahan
Student ID : 008201500012
Faculty : Business
Study program : Accounting
Field of study : Managerial Accounting
Thesis title : OPERATIONAL AUDIT ON ACCOUNTS
RECEIVABLE (A Case Study of PT Yamazaki
Indonesia)
Has been reviewed and found to have satisfied the necessities for oral defenseas
partial fulfillment of the requirements for the Bachelor’s Degree in Accounting.
Cikarang, 17 December 2018
Bekasi, Indonesia
Acknowledged by:
Head of Study Program Thesis Advisor
Andi Ina Yustina, M.Sc., CMA. Drs. Gatot Imam Nugroho,MBA.,CA
xiii
TABLE OF CONTENTS
SKRIPSI ............................................................................................................................ i
PLAGIARISM CHECK RESULT ................................................................................ ii
DECLARATION OF ORIGINALITY ......................................................................... v
PANEL OF EXAMINERS APPROVAL ..................................................................... vi
ACKNOWLEDGEMENT ............................................................................................ vii
RECOMMENDATION LETTER FROM THESIS ADVISOR ............................... xii
TABLE OF CONTENTS ............................................................................................. xiii
LIST OF TABLES ....................................................................................................... xvi
LIST OF FIGURES .................................................................................................... xvii
LIST OF APPENDICES.............................................................................................. xix
CHAPTER I: INTRODUCTION .................................................................................. 1
1.1 Background.............................................................................................................. 1
1.2 Problem Formulation ............................................................................................... 5
1.3 Benefits of Research ................................................................................................ 5
1.4 Scope and Limitations of Research ......................................................................... 6
CHAPTER II: LITERATURE REVIEW ..................................................................... 8
2.1 Introduction ............................................................................................................. 8
2.2 Account Receivables Management ......................................................................... 8
2.3 Account Receivables Turnover ............................................................................. 10

xiv
2.4 Aging Schedule ..................................................................................................... 11
2.5 Bad Debt and Allowance Provision ...................................................................... 13
2.6 Factors Affecting the Amount of Receivables ...................................................... 13
2.6.1 Percentage of Credit Sales .............................................................................. 14
2.6.2 Stuck Billing Customer ................................................................................... 14
2.6.3 Billing Business .............................................................................................. 14
2.7 Variables Affecting Receivables ........................................................................... 15
2.8 Receivable Billing ................................................................................................. 16
2.9 Policy for Uncollectible Accounts Receivable ...................................................... 16
CHAPTER III: METHODOLOGY ............................................................................ 17
3.1 Research Framework ............................................................................................. 17
3.2 Location and Time of Research ............................................................................. 20
3.3 Data Collection ...................................................................................................... 20
3.4 Processing and Data Analysis ............................................................................... 20
3.4.1 Analysis per Component ................................................................................. 21
3.4.2 Trend Analysis ................................................................................................ 22
3.4.3 Cash Conversion Cycle Analysis .................................................................... 23
3.4.4 Analysis of Company’s Financial Ratio ......................................................... 24
CHAPTER IV: RESULTS AND DISCUSSION ........................................................ 25
4.1 Account Receivable Management in PT Yamazaki Indonesia ............................. 25

xv
4.2 Factors Affecting the Amount of Receivables at PT Yamazaki Indonesia ........... 27
4.3 Account Receivable Management Process in PT Yamazaki Indonesia ................ 39
4.4 Debt Collection Procedure .................................................................................... 43
4.5 Trend Analysis....................................................................................................... 44
4.6 Cash Conversion Cycle Analysis .......................................................................... 48
4.7 Financial Ratio Analysis........................................................................................ 51
4.7.1 Activity Ratio .................................................................................................. 51
4.8 Managerial Implications ........................................................................................ 54
4.9 Findings ................................................................................................................. 55
4.9.1 Insufficient and Ineffective Number of AR Employees ................................. 55
4.9.2 Recording of Accounts Receivable that are Still Incomplete ......................... 56
4.9.3 Provision ......................................................................................................... 57
4.9.3 Over Sales Returns.......................................................................................... 58
CHAPTER V: CONCLUSION AND RECOMMENDATION ................................ 60
5.1 Conclusion ............................................................................................................. 60
5.2 Recommendation ................................................................................................... 61
REFERENCE ................................................................................................................ 62
APPENDICES (INTERVIEW) .................................................................................... 65
APPENDICES (DOCUMENTATION) ....................................................................... 69
xvi
LIST OF TABLES
Table 1 Analysis per Component of Balance Sheet (Partial) .......................................... 26
Table 2 Cash Conversion Cycle Analysis ....................................................................... 27
Table 3 Trend Analysis of Some Balance Sheet and Profit and Loss Accounts............. 29
Table 4 Some Balance Sheet and Profit and Loss Accounts .......................................... 29
Table 5.1 PT Supra Boga Lestari’s July Aging Schedule ............................................... 30
Table 5.2 PT Supra Boga Lestari’s July Aging Schedule (New Orders) ........................ 30
Table 6.1 PT Fajar Mitra Indah’s July Aging Schedule.................................................. 31
Table 6.2 PT Fajar Mitra Indah’s July Aging Schedule (New Order) ............................ 31
Table 7.1 PT Lion Super Indo’s July Aging Schedule.................................................... 31
Table 7.2 PT Lion Super Indo’s July Aging Schedule (New Order) .............................. 31
Table 8.1 PT Naga Swalayan’s July Aging Schedule ..................................................... 31
Table 8.2 Naga Swalayan’s July Aging Schedule (New Order) ..................................... 31
Table 9.1 Supra Boga Lestari’s August Aging Schedule ................................................ 32
Table 9.2 Supra Boga Lestari’s August Aging Schedule (New Order) .......................... 32
Table 10.1 PT Fajar Mitra Indah’s August Aging Schedule ........................................... 32
Table 10.2 PT Fajar Mitra Indah’s August Aging Schedule (New Order) ..................... 33
Table 11.1 PT Lion Super Indo’s August Aging Schedule ............................................. 33
Table 11.2 PT Lion Super Indo’s August Aging Schedule (New Order) ....................... 33
Table 12.1 PT Naga Swalayan’s August Aging Schedule .............................................. 33
Table 12.2 PT Naga Swalayan’s August Aging Schedule (New Order) ........................ 33
Table 13.1 PT Supra Boga Lestari’s September Aging Schedule .................................. 34
Table 13.2 PT Supra Boga Lestari’s September Aging Schedule (New Orders) ........... 34
xvii
Table 14.1 PT Fajar Mitra Indah’s September Aging Schedule ..................................... 34
Table 14.2 PT Fajar Mitra Indah’s September Aging Schedule (New Order)................ 34
Table 15.1 PT Lion Super Indo’s September Aging Schedule ....................................... 34
Table 15.2 PT Lion Super Indo’s September Aging Schedule (New Order).................. 34
Table 16.1 PT Naga Swalayan’s September Aging Schedule ........................................ 35
Table 16.2 Naga Swalayan’s September Aging Schedule (New Order) ........................ 35
Table 17.1 Supra Boga Lestari’s October Aging Schedule ............................................ 35
Table 17.2 Supra Boga Lestari’s October Aging Schedule (New Order) ....................... 35
Table 18.1 PT Fajar Mitra Indah’s October Aging Schedule ......................................... 35
Table 18.2 PT Fajar Mitra Indah’s October Aging Schedule (New Order) .................... 36
Table 19.1 PT Lion Super Indo’s October Aging Schedule ........................................... 36
Table 19.2 PT Lion Super Indo’s October Aging Schedule (New Order) ...................... 36
Table 20.1 PT Naga Swalayan’s October Aging Schedule............................................. 36
Table 20.2 PT Naga Swalayan’s October Aging Schedule (New Order) ....................... 37
Table 21 Trend Analysis of Some Balance Sheet and Profit and Loss Accounts........... 48
Table 22 PT Yamazaki Indonesia Cash Conversion Cycle Analysis ............................. 49
Table 23 PT Nippon Indosari Corpindo Cash Conversion Cycle ................................... 49
Table 24 PT Yamazaki Indonesia Activity Ratio ........................................................... 53
Table 25&26 Numbers of Invoices Were Made in 2017 & 2018 ................................... 56
Table 27&28 AR Balance Sheet Record of PT Yamazaki Indonesia 2017&2018 ......... 56
Table 29 Statements of Financial Position ...................................................................... 58
Table 30 Data Return ...................................................................................................... 59
xviii
LIST OF FIGURES
Figure 1 Accounts Receivable Ratio (Investopedia) ....................................................... 10
Figure 2 Traditional Aging Schedule .............................................................................. 12
Figure 3 Research Framework ........................................................................................ 19
Figure 4 Accounts Receivable Business Process (Created by the Researcher) .............. 42
Figure 5 – Descriptive Statistics for FMCG and Airline Industry .................................. 50
xix
LIST OF APPENDICES
APPENDICES (INTERVIEW)
Appendix 1 – Engagement with Director, Manager & Supervisor ................................. 65
Appendix 2 – Interview with Accounts Receivable (Supervisor) ................................... 66
APPENDICES (DOCUMENTATION)
Appendix 1 – Invoice ...................................................................................................... 69
Appendix 2 – Proof of Receipt of Goods (Bukti Terima Barang) .................................. 70
Appendix 3 – Payments .................................................................................................. 71
Appendix 3.1 – Voucher Receipt ............................................................................. 71
Appendix 3.2 – Invoice Receipt (Tanda Terima Faktur) ......................................... 72
Appendix 3.3 – Invoice Receipt (Compiled) ........................................................... 73
Appendix 4 – Delivery Notes .......................................................................................... 74
Appendix 5 – Goods Received Receipt .......................................................................... 75
Appendix 6 – Tax Invoice ............................................................................................... 76
Appendix 7 – Company Acceptance Letter .................................................................... 77
Appendix 8 – Company’s Confirmation Letter .............................................................. 78
Appendix 9 – The Researcher with Mr. Frans (Director) ............................................... 79
Appendix 10 – The Researcher with Mr. Karno (HRGA General Manager) ................. 79
Appendix 11 – The Researcher with Fin/Acc/Mar/Dis Staff .......................................... 80
Appendix 12 – The Researcher with Mr. Furumi (Director) .......................................... 80
Appendix 13 – The researcher with Mr. Ichiro Saito (President Director) ..................... 81

xx
OPERATIONAL AUDIT ON ACCOUNTS RECEIVABLE
(A Case Study of PT Yamazaki Indonesia)
ABSTRACT
PT Yamazaki Indonesia is one company whose entire business activities or
sales are carried out on credit. The company carries out sales activities based on
policies set by the company (verbal). The applied credit policy is expected to be
able to provide optimal benefits and be able to increase customer satisfaction.
This is due to the high level of credit sales risk, which requires companies to carry
out all sales procedures based on their credit policies. This study aims to
determine the accounts receivable management system run at PT Yamazaki
Indonesia, analyze the factors that affect the size of PT Yamazaki Indonesia's
receivables, and analyze the effectiveness of controlling receivables against cash
flows. The results of this study indicate that based on an analysis of the accounts
receivable management system, PT Yamazaki Indonesia has carried out the
management, and control of accounts receivable based on the verbal SOP
(Standard Operation Procedure) that has been set by the company, but there are
still some things that are not implemented. Factors that influence the amount of
receivables are the percentage of credit sales, stuck billing customer, and effort of
billing. PT Yamazaki Indonesia has a large amount of receivables in the balance
sheet, mainly influenced by the large percentage of credit sales and effort of
billing undertaken. Based on the analysis of financial performance in the
company's financial statements for the period of 2016 - 2017, it shows that the
company still has good financial performance. This is indicated by a number of
positive financial ratios. Accounts receivable control carried out by PT Yamazaki
Indonesia has not been effective against the company's cash collection. This is
evidenced from the results of the cash conversion cycle analysis which is less than
the average value of the FMCG industry and means that the amount of
receivables owned is not good enough to be converted into cash (if compared with
FMCG industries) due to the existence of inhibiting factors such as collection and
not properly applied credit analysis to all customers.
Keyword: Accounts Receivable, Allowance for Doubtful Accounts, Provision,
financial performance, Accounts Receivable Management.

1
CHAPTER I
INTRODUCTION
1.1 Background
One of the purposes of setting any business is to maximize profit; hence
sales revenue will improve the profitability of that company. Selling by cash is
the most ideal way of improving cash inflow but at times a company must sell
on credit which is normally termed as trade credit. Effective receivables
management and the ability of a company to collect the credit must be the
prerequisite of selling on credit otherwise it will affect the liquidity and the
condition of the company. As suggested by Paramasivan and Subramanian
(2009) most businesses sell on credit or by cash. Irrespective of best efforts of
organizations to do effective credit assessment it is difficult to avoid credit
problems as indicated by Kimmel et al. (2011). Burt (2004) reaffirmed the
essence of comprehensive credit assessment of customers.
In a company, especially a manufacturing company, financial management
has an important role in a company's management function. When the company
conducts its sales system on credit, then the receivables will arise. This will
have an effect on the company's financial statements, especially the impact on
cash flows. As for a problem that often occurs is when consumers are negligent
in making payments. This will have an impact on the company, namely the
delay in repayment of accounts receivable and the company's cash flow will
decrease so that it affects the effectiveness of the company's operations.
2
Cash Conversion Cycle is an analysis that uses an approach that company
goals to minimize working capital provided that the working capital must be
sufficient to finance the company's operations. The process of minimizing
working capital is done by accelerating the collection of cash from sales,
increasing inventory turnover, and reducing spending with cash (Keown,
2010).
PT Yamazaki Indonesia is one of the companies where all business
activities or sales are carried out on credit. The company carries out sales
activities based on policies set by the company (verbal). The applied credit
policy is expected to be able to provide optimal benefits and be able to increase
customer satisfaction. This is due to the high level of credit sales risk that
requires companies to carry out all sales procedures based on their credit
policies.
The company carries out sales procedures based on its credit policies
because it relates to the characteristics of products sold, which are related to the
quality of products that provide a guarantee within the specified time limit, so
consumers will usually get a purchase return when the product used does not
match the expected performance. The purchase returns made by consumers will
have an impact on the receipt of receivables that will be paid by consumers to
the company. Therefore, in a company there needs to be a good debt control
system in order to be able to manage its finances and continue to operate to
meet market demand and maintain customer loyalty and trust.
3
According to Fabozzi and Peterson (2003) whenever a company decides to
sell to customers on credit it creates accounts receivables. Repayment of debt is
critical for the liquidity position of any company, for it is important for debtor
and creditor to agree on how the debt will be settled before the debt must be
granted as advised by Finlay (2008). In management of debtors, it is imperative
to ensure that repayment of the credit sale is done within the agreed period and
most importantly with the minimum administrative cost to the company as
suggested by Paramasivan and Subramanian (2009). Specific industry and kind
of customers can influence a company to consider credit sales. In managing
receivables among others there must be consideration in the following as
suggested by Mecklin (2007) such as creditworthy of the customer, monitoring
of debt, and sanction plan for defaulters, a policy on bad debt and possibly
factoring the debt.
Credit policy must contain a detailed procedure for granting credit and its
repayment as suggested by Burt (2004). Reuvid (2010) explained that credit
policy must guide credit management and more so ensure that there is a
balance between a liberal and stricter credit. Brigham and Ehrhardt (2011)
reaffirmed that credit policy must have captured credit terms, period for
payments and policy on the debt collection. Credit policy guides credit
management and must include credit terms and standards with debt collection
approach as advised by Burt (2004). Brealeyet al. (2011) recommended that in
dealing with debtors, companies must establish the following: assessment of
4
the credit worthiness of the customer, credit terms and effective collection
procedure.
Watson and Head (2013) stressed that the expenses of debt collection must
not surpass the amount to be recover. Paramasivan and Subramanian (2009)
indicated that it will make a business sense if companies can charge interest on
overdue repayment by customers to push them to pay on time. Kimmel et. al.
(2011) pointed out that there is the need for a company’s collection policy but
without efficient system of debt collection in place it will affect repayment on
time negatively. Watson and Head (2013) recommended that it is important for
companies to get it right between strict collection policy and the real benefits
ensuing from a decent management of credit. Brealeyet. al., (2011) suggested
that smaller companies without specialized credit department can hire debt
collection agents to help them in that direction.
Adelman and Marks (2014) recommended that factoring is an option
business can use to get their money back if it is becoming difficult to recover
the debt through the internal systems. Brigham and Ehrhardt (2011) indicated
that as much as there is the need of credit policy for a company without
effective monitoring system to check the observance of the credit policy
repayment of the credit can be delayed or will not be paid at all. Effective
follow-up measures on the debtors list of a company does not only enhances
the opportunity of getting the money on time it also put the debtors on their
alert to fulfill repayment on time as suggested by Kimmel et. al. (2011) and
5
Burt (2004). This paper examines accounts receivable management of PT
Yamazaki Indonesia
1.2 Problem Formulation
PT Yamazaki Indonesia is a company that has not long been established
(only 4 years) and is not very experienced in running its business. In its
implementation, the company is still experiencing problems with the collection
of receivables. The company has customers of up to 180 companies, which
shows that the company has been highly trusted and is able to provide products
according to customer demand but without a good management this could
possibly become a boomerang to the company. The formulation of the problem
in this study, namely:
1. How does the receivable management system run at PT Yamazaki
Indonesia?
2. What factors influence the amount of receivables of PT Yamazaki
Indonesia?
3. What is the Account Receivable performance of PT Yamazaki Indonesia in
the period 2015 – 2017?
1.3 Benefits of Research
The results of this study are expected to provide value and benefits to
various parties in need, especially for the company, such as consideration in
6
implementing the system of controlling accounts receivable and in the
decision-making process relating to the policy of accounts receivable. In
addition, this research is also expected to be used as a reference or guideline for
further research.
1.4 Scope and Limitations of Research
When conducting research, researchers only discuss the system of
controlling accounts receivable related to the effectiveness, efficiency and
accuracy. This is obtained from an analysis of the accounts receivable control
system that has been carried out and analysis of receivables held by the
company in the period 2015-2017.
This study presents the new evidence of receivables management impact
on the firm financial collectability performance, which is done by analyzing the
trend, data given by PT Yamazaki Indonesia from 2015 – 2018. The relevance
on the impact of receivables management on the firm performance, specifically
on firm financial collectability performance which in reality is still lagging.
Hence, this study attempts for broadening the research to a deeper level of
receivables management.
This research is expected to be beneficial for the readers and broaden the
point of view for both the other researcher and also the management of PT
Yamazaki Indonesia and to go beyond the other factors that may affect account
management collection performance. This research is mainly focused on the
analysis of account receivables management in PT Yamazaki Indonesia.

7
The rest of this skripsi is organized as follows. In the next chapter, that is
literature review section, the researcher will explain more about the variables
and the research done by other researcher which will be used as the basis for
reference of the study. The methods used to investigate and gather the data are
in chapter 3. The results of this study along with the discussion are outlined in
chapter 4, and the conclusion of all this skripsi will be provided in the chapter
5.
8
CHAPTER II
LITERATURE REVIEW
2.1 Introduction
This section will explain more about the variables and the research done
by other researcher which will be used as the basis for reference of the study, such
as the Account Receivables Management, Account Receivables Turnover, Aging
Schedule, Bad Debt and Allowance Provision and etc. This section will give a
clear picture about the definition of those variables, the theory being used for this
research, along with the research gaps in this study.
2.2 Account Receivables Management
If we derive a definition of an account from the AMA Dictionary of
business and management, it is defined as a statement of transaction. The
definition stated in AMA Dictionary actually relates to the definition of
accounts receivable which is defined as an amount owed to a business by
customers for invoice amounts (transactions) classified as current accounts in
the balance sheet. Many companies sell credit in order to sell more products or
services. Receivables arising from such sales are usually classified as trade
accounts receivable or notes receivable. The term receivables include all claims
in the form of money against other parties, including individuals, companies, or
other organizations. Receivables usually have a significant share of the
company's total current assets (Warren, 2005).
9
A company manages its receivables depending on what the company sells
on credit. The more that is sold on credit, the higher the proportion of assets
related to receivables. As a result, when discussing the management of
accounts receivable, it is actually also discussing one fifth of the company's
assets. In addition, because the cash flow from the sale cannot be invested until
the receivables are paid, control of the receivables becomes increasingly
important. The efficient billing determines the profitability and liquidity of the
company (Keown, 2010).
Managers and external users of financial statements need to measure how
efficiently a company uses business assets or operating assets, especially
elements of certain working capital such as accounts receivable, inventory, and
trade payables. The most common relationship commonly used to monitor
accounts receivable is the average billing period (Stice, 2004).
The importance of a good debt management provides an impact on the
company's financial statements and can then show a company's performance.
According to Warren (2005), relating to the process of controlling accounts
receivable, companies attempt to limit the value of uncollectible receivables by
implementing various control devices. The most important controls are related
to the function of credit approval. This control involves investigating the
customer's credibility. The two accounting methods for recording receivables
that are not expected to be collected, which are the allowance method and the
direct write-off method. Seeing this, the role of financial managers is very

10
influential in the management of accounts receivable which is closely related to
the overall financial condition of the company.
2.3 Account Receivables Turnover
The Account receivables turnover ratio shows how many times a company
pays off its average accounts receivable within a given period of time, it could
be monthly or yearly basis (Investopedia, 2017). The account receivables
turnover ratio is an activity ratio used by management to understand how a
company handles the collection of payments owed to the business. If the
accounts receivable turnover ratio declines from one year to the next, it may
signal a company's collections department is unable to collect from older
customers or the company has an excessive amount of debt. If the account
receivables turnover ratio increases from one year to the next, it may be a sign
of an aggressive collections department or a conservative credit policy on the
part of the company. The formula to calculate the ratio is:
Figure 1 Accounts Receivables Ratio (Investopedia)
Accounts Receivable Turnover
Accounts Receivable
Turnover =
Beginning + Ending AR
Average AR
Average Accounts
Receivable (AR) = 2
Net Sales
11
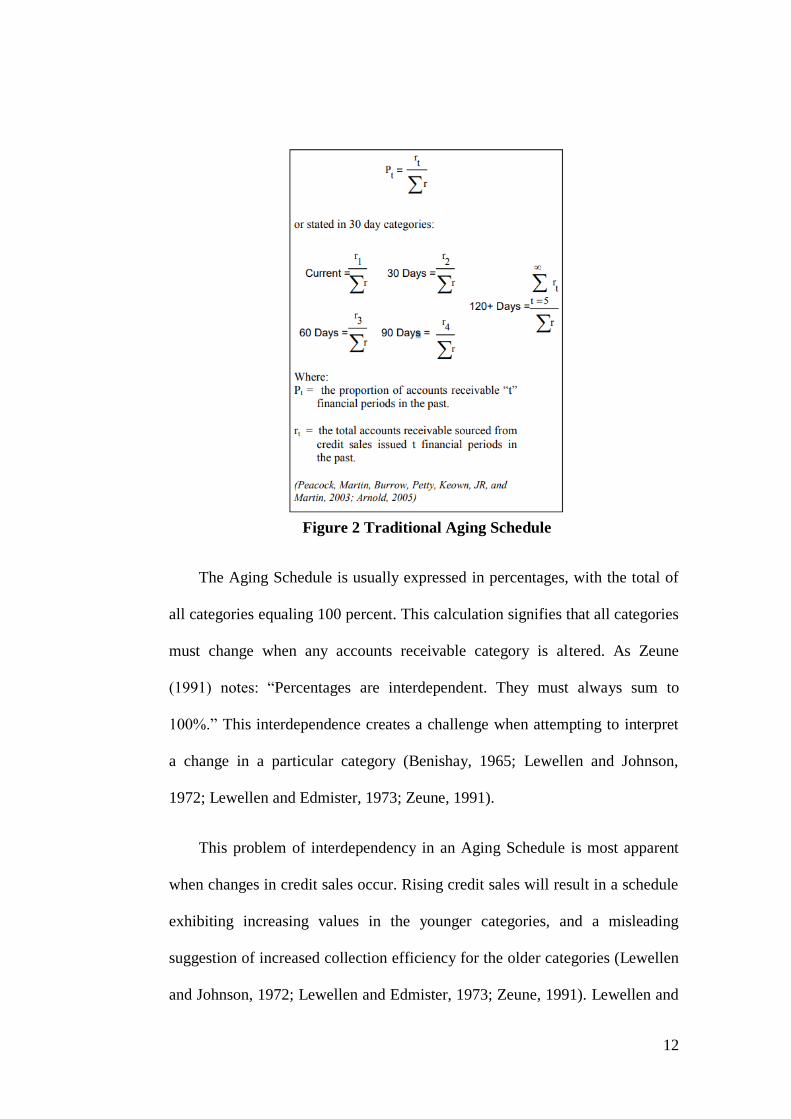
2.4 Aging Schedule
The Accounts Receivable (A/R) Aging Schedule, also known as a
Schedule of Accounts Receivable, allows a company or entities to analyze the
accounts receivable due to the company from the customers engaged. It
provides general information, at a point of time, on which the companies are
expecting payment from and can also assist with determining the likelihood of
collection. As accounts become more aged, their collectability becomes less
certain (BMO, 2016).
The Aging Schedule is a popular accounts receivable tool (Pike and
Cheng, 2001) and is widely referred to in the normative accounting and finance
literature (Peacock, et.al., 2003; Arnold, 2005). It comprises a classification of
outstanding balances according to the period of time they have been
outstanding (Equation 1).
These age categories can be calibrated according to months, weeks, or
days, depending on an organization’s requirements, and are frequently
expressed as a percentage relative to the total accounts receivable balance
(Lewellen and Johnson, 1972; Lewellen and Edmister, 1973; Zeune, 1991). If
debts are collected on time, most debts should be younger, and few should be
older. It is assumed that increased collection efficiency would reduce the
percentage of debt in the older categories.
12
Figure 2 Traditional Aging Schedule
The Aging Schedule is usually expressed in percentages, with the total of
all categories equaling 100 percent. This calculation signifies that all categories
must change when any accounts receivable category is altered. As Zeune
(1991) notes: “Percentages are interdependent. They must always sum to
100%.” This interdependence creates a challenge when attempting to interpret
a change in a particular category (Benishay, 1965; Lewellen and Johnson,
1972; Lewellen and Edmister, 1973; Zeune, 1991).
This problem of interdependency in an Aging Schedule is most apparent
when changes in credit sales occur. Rising credit sales will result in a schedule
exhibiting increasing values in the younger categories, and a misleading
suggestion of increased collection efficiency for the older categories (Lewellen
and Johnson, 1972; Lewellen and Edmister, 1973; Zeune, 1991). Lewellen and

13
Edminster (1973) argue that it is only in periods of evenly occurring credit
sales that an Aging Schedule can be seen to represent a tool that accurately
depicts collection efficiency. Zeune (1991) and Lewellen and Johnson (1972)
conclude that the Aging Schedule produces an incorrect analysis and false
warning patterns can be raised by normal sales fluctuations. One can conclude
that the sum of credit sales achieved in the most recent 30-day period is
positively correlated to the current category in a traditional Aging Schedule.
2.5 Bad Debt and Allowance Provision
If collectability is probable at the outset, but subsequently facts and
circumstances change such that collection from the customer is no longer
probable, the amount of the debt deemed to be uncollectible should be written
off as a bad debt expense or the company should provide a bad debt provision
for the account, as it is appropriate. Contingences, provides guidance to
determine if it is probable that amounts will or will not be collected. The
company should account for any impairment of its existing receivable.
2.6 Factors Affecting the Amount of Receivables
Manufacturing companies are companies that have business or business
activities from the start of production operations to the sales of products
produced. Manufacturing companies that carry out sales activities on credit will
14
get additional assets in the current assets, which are marked by the emergence
of receivables. Then the receivables that have arrived at maturity, then cash
flow occurs. According to Keown (2010), the factors that influence the size of
investment in receivables are:
2.6.1 Percentage of Credit Sales
The greater the sales on credit, the greater the receivables that will be
obtained. When a company experiences sales growth, the level of investment in
accounts receivable will also go up.
2.6.2Stuck Billing Customer
Determining the type of customer is a decisive variable in seeing customer
qualifications in obtaining credit. When a company receives customers who
are less creditworthy, it will result in a default.
2.6.3Effort of Billing
The key to maintaining control over receivable billing is the fact that the
probability of default is increasing with the age of the bill. Control over
receivables is focused on the control and elimination of receivables that are
past due. Strength and timeliness of billing will affect the period of bills that
are due but still negligent to pay.
15
2.7 Variables Affecting Receivables
According to Jusuf (2005) internal variables are variables (factors) that are within
the control of the company. While external variables are variables (factors) that are
outside the company and the company does not have the ability to control these factors
at all. Internal variable are company policies related to accounts receivable consisting
of:
a. Sales
The greater the sales in credit, the greater the profitability. But if credit
sales are limited, the company is more concerned with credit safety.
b. Doubtful Accounts
If the greater the amount of the receivables, the greater the possibility of
uncollectible accounts.
c. Sales Return
When PT Yamazaki sales are dominated with return, then there will be a
high chance of Deductive Receivable and Revenue.
2.8 Receivable Billing
There are several techniques that can be used to increase billing on receivables
that are due. The cheapest billing is by phone and mail (Maya, 2005). Billing
techniques include:
• Sent a letter
• On the phone
16
• visited
• Using agents / other people (debt collector)
The company can use the person or the State Auction and Receivable
Affairs Agency (BUPLN) or Legal actions or civil claims
Credit insurance is formed with the intention to protect manufacturers,
retailers, service companies and other companies against unexpected credit
losses. In collection of accounts receivable, financial managers must determine
the average billing time that can be received or the level of outstanding sales
days as well as the ratio of total uncollectible receivables to total operating
revenues made.
2.9 Policy for Uncollectible Accounts Receivable
Strength and timeliness of billing will affect the period of bills that are due
but still negligent to pay and will affect the amount of receivables (Keown,
2010). The company has the possibility to obtain funding sources easily and
quickly up to 80% of the value of its sales invoice on credit, namely through
factoring (Siamat, 2005). The definition of factoring company based on the
Minister of Finance Decree No. 1251 / KMK.013 / 1988 is a business entity
that carries out financing activities in the form of purchases and / or transfers
and management of short-term receivables or bills of a company from domestic
or foreign trade transactions.

17
CHAPTER III
METHODOLOGY
3.1 Research Framework
PT Yamazaki Indonesia is one of the manufacturing companies that
entirely do credit sales activities. When a company conducts sales activities on
credit, there is a receivable for the company. The company certainly tries to
manage its receivables properly so that the company's cash flow statement is
also in good condition. By analyzing the factors that affect receivables, then it
can also analyze financial ratios obtained from the balance sheet, and Profit and
Loss statement. After that, the analysis will be carried out per component to see
the proportion of the amount of receivables contained in the balance sheet
report and then see how much influence the amount of receivables the company
has on the effectiveness of collection. The cash conversion cycle analysis is
used to see the effect of controlling accounts receivable on the effectiveness of
collection and to minimize a working capital which will then be used in
financing the company's operating activities, so that a good turnover between
inventory, cash and receivables will be seen in operating company.
PT Yamazaki Indonesia is a manufacturing company that also accepts
payment transactions in foreign currency. This is evidenced by the presence of
several consumers who make receivable payment transactions using foreign
currency units. In addition, the company also purchases raw materials from
18
foreign suppliers. This will be affected by fluctuating currency exchange rates
and impact on receivables which fluctuate as well.
The results of the analysis carried out in this study are expected to help the
company run its debt control system properly, because it will be related to sales
patterns that also affect the company's liquidity. A clearer understanding can be
seen in Figure 3, in the next page.

19
Figure 3 Research Framework
20
3.2 Location and Time of Research
This research was conducted at PT Yamazaki Indonesia which is located in
Kawasan Industri Greenland Batavia Blok BA No.1, Ds Cikarang Pusat,
Sukamahi, CikarangPusat, Bekasi, Jawa Barat 17530. The choice of research
location was done intentionally or purposively. This research was conducted in
September–December 2018.
3.3 Data Collection
This research collects data directly from the company both primary and
secondary data. Primary data is obtained from interviews with the company,
especially financial managers, regarding the control system of receivables and
the decision-making process related to the receivable policy. Secondary data
was obtained from company in the form of financial statements for the 2015 –
2017 period, sales data, Aging Schedule data, Listing Invoices Data, Balance
Sheet Data, Profit and Loss data, etc. for the period 2017 – 2018, literature
studies, and research reports.
3.4 Processing and Data Analysis
This study obtained data directly from the company and then processed
and analyzed by statistical methods, namely analysis per component, trend
analysis, cash conversion cycle analysis, and financial ratio analysis. Analysis
per component is used to see the proportion of the amount of receivables
contained in the balance sheet report and then see how much influence the

21
amount of receivables held by the company on the effectiveness of collection.
Trend analysis is used to analyze the comparison between the amount of
receivables and sales made by the company. Cash conversion cycle analysis is
used to see the effect of controlling receivables on the effectiveness of
collection and to minimize working capital owned by a company by
accelerating the collection of cash from sales, increasing inventory turnover,
and reducing spending with cash. Financial ratio analysis is used to see the
company's financial performance in each period. In addition, computer
software that will be used to process and analyze data is Microsoft Excel 2007.
3.4.1 Analysis per Component
According to Jumingan (2008), the analysis per component is percentage
of each asset element to total assets, each element of liability to the total
liability, and each element of profit and loss on the amount of net sales. Such
reports called the common size statement. General size statements are also
called quantities per component because for each total replaced with the
number 100 and each nothing changes to a percent of the total number.
Analysis per component is actually also a ratio analysis (comparison) or some
sorts of proportion, because of the amount of rupiah from each element of the
financial statements are expressed in percent of the total. The method changes
the amount of rupiah from each report element to percent of the total, done as
follows:
22
1. State the total assets, total liabilities, and total net sales with100%.
2. Calculate the ratio of each element of the financial statement with the total
is by dividing the rupiah amount of each element the financial statements in
total.
3. Percentage analysis per component can be formulated as follows:
Information:
Ryi = The percentage value for the purpose of comparing
Pyi = Post (Amount) of y in the financial statements year-i
Pyo = Post (Amount) as a basic comparison
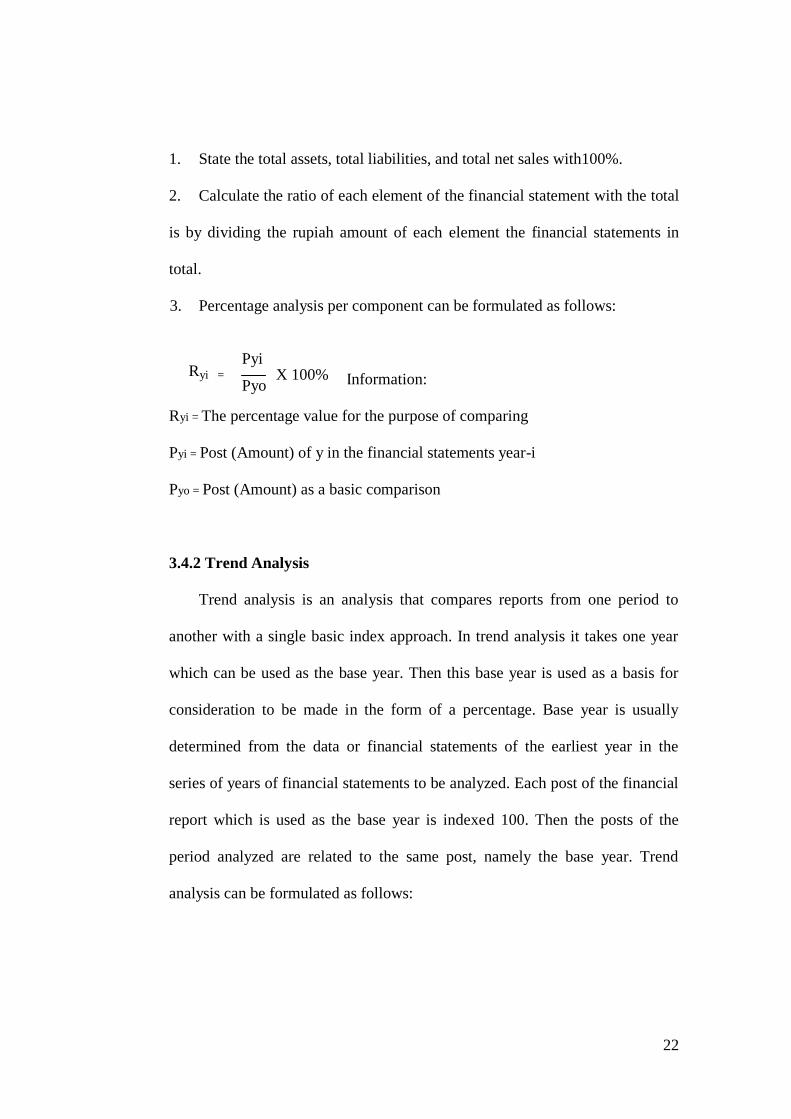
3.4.2 Trend Analysis
Trend analysis is an analysis that compares reports from one period to
another with a single basic index approach. In trend analysis it takes one year
which can be used as the base year. Then this base year is used as a basis for
consideration to be made in the form of a percentage. Base year is usually
determined from the data or financial statements of the earliest year in the
series of years of financial statements to be analyzed. Each post of the financial
report which is used as the base year is indexed 100. Then the posts of the
period analyzed are related to the same post, namely the base year. Trend
analysis can be formulated as follows:
Pyo
100
%
Pyo
Ryi =
= Pyi
x
100%
Pyo
Pyi
=
Pyi
x
100
%
Pyo
X 100%
Pyo

23
Information:
Rxi = The percentage value for the year-i
Pxi = Post (Amount) of x in the financial statements that will be analyzed
Pxo = Post (Amount) as a year base
3.4.3 Cash Conversion Cycle Analysis
According to Keown (2005), the cash conversion cycle analysis is an analytical
method that uses an approach that is the purpose of the company working
capital with the condition that working capital must be sufficient to legalize the
company's operations. The process of working capital is done by speeding up
cash from sales, increasing preparation turnover, and reducing spending on
cash. This cash cycle can be calculated as follows:
Cash Conversion Cycle =DSO + DSI – DPO
Information:
A. Days of Sales Outstanding (DSO)
DSO can also be considered as the average age of the company's receivables or
the average billing period. Days of Sales Outstanding (DSO) can be calculated
as follows:
Days of Sales Outstanding =
Days in Period
Pxo
=
Pyi
x
100
%
Pyo
Rxi =
= Pyi
x
100%
Pyo
Pxi
]]
Pyi
x
100
%
Pyo
X 100%
Pyo
24
B. Days of Sales in Inventory (DSI)
DSI can also be considered as the average age of preparation, the number of
days the company can make the inventory to be used or converted into saleable
products. DSI can be calculated as follows:
C. Days of Payable Outstanding (DPO)
The DPO shows the average age (in the number of days) of the trade debt held
by the company. DPO can be calculated as follows:
3.4.4 Analysis of Company’s Financial Ratio
A. Activity Ratio
This ratio explains the various activities of the company in conducting
operational activities efficiently which the company can then carry out its
operations properly.
Average Billing Period = Accounts Receivable / (Net Credit Sales/365)
This ratio shows the period of time to consider in collecting accounts
receivable from customers for all sales activities carried out on credit.
Accounts Receivable Turnover = Sales / Accounts Receivable
The ratio that explains a company can roll back the receivables held based on
sales activities that have been carried out.
Days of Sales in Inventory =
Days in Period
Days of Payable Outstanding =
Days in Period
25
CHAPTER IV
RESULTS AND DISCUSSION
4.1 Account Receivable Management in PT Yamazaki Indonesia
The accounts receivable management system owned by PT Yamazaki
Indonesia starts from input, process, to output. At PT Yamazaki Indonesia
input from the accounts receivable management system, which is characterized
by the sale of products, are mostly carried out on credit. Credit sales conducted
by PT Yamazaki Indonesia aim to sell more to customers which will have an
impact on the company's inflow, especially the collection of receivables. When
a company makes a sale on credit, it will allow an increase in the number of
customers to buy the company's products. In terms of the company, credit sales
have a high level of risk, that is, when customers buy products on credit, the
company must compensate with a good billing process in order to reduce the
risk of loss of accounts due to customers paying off their debts.
Then the debt management process at PT Yamazaki Indonesia is marked
by the activity of preparing sales documents (such as PO letters from
customers, DRq letters from purchasing divisions, tax invoices from financial
& accounting division), issuing invoices, to carrying out receivables collection
activities to customers. The collection of receivables made will greatly affect
the amount of the company's receivables. When the company bills well, the
collection of receivables will also be good. But in its implementation, PT
Yamazaki Indonesia sometimes often faces a number of obstacles that come
26
from the customer, for example customer negligence in paying the debt or
delay in paying the debt according to the time due. In addition, there are also
several constraints that originate from the company, such as personnel who are
very limited in terms of the collection of accounts receivable, allowing double
jobs or multiple jobs to manage receivables, and factors that originate from the
internal company.
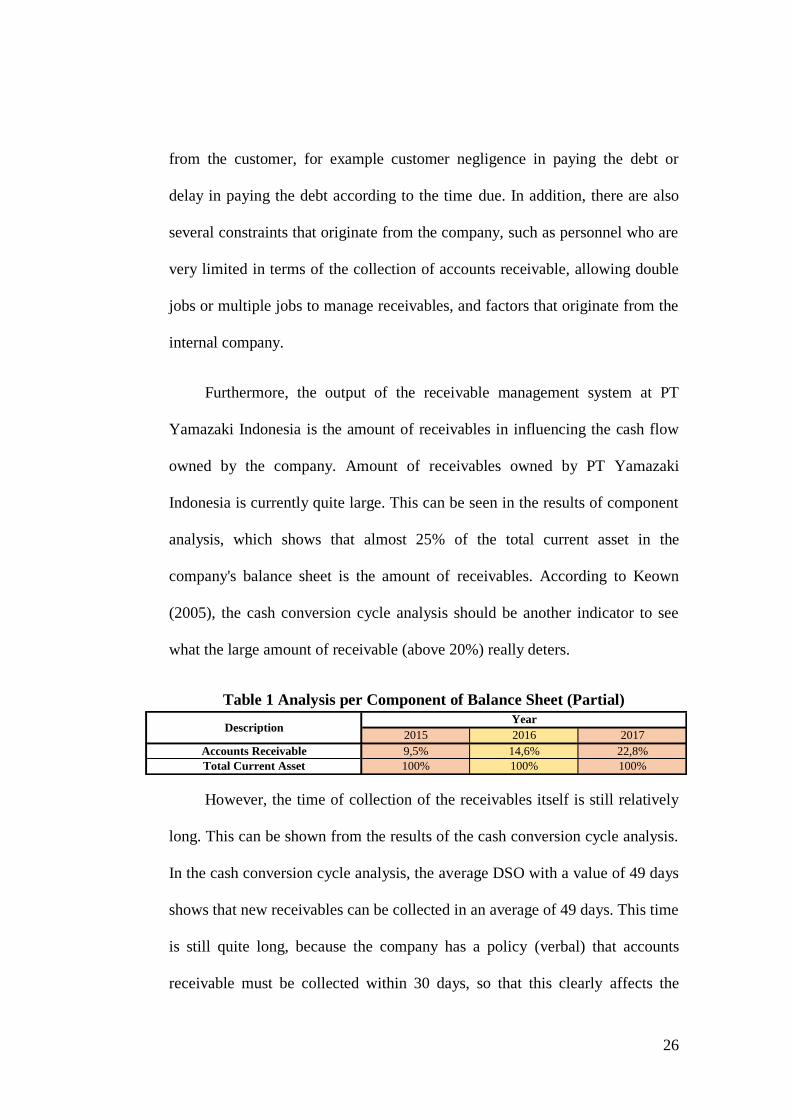
Furthermore, the output of the receivable management system at PT
Yamazaki Indonesia is the amount of receivables in influencing the cash flow
owned by the company. Amount of receivables owned by PT Yamazaki
Indonesia is currently quite large. This can be seen in the results of component
analysis, which shows that almost 25% of the total current asset in the
company's balance sheet is the amount of receivables. According to Keown
(2005), the cash conversion cycle analysis should be another indicator to see
what the large amount of receivable (above 20%) really deters.
Table 1 Analysis per Component of Balance Sheet (Partial)
However, the time of collection of the receivables itself is still relatively
long. This can be shown from the results of the cash conversion cycle analysis.
In the cash conversion cycle analysis, the average DSO with a value of 49 days
shows that new receivables can be collected in an average of 49 days. This time
is still quite long, because the company has a policy (verbal) that accounts
receivable must be collected within 30 days, so that this clearly affects the
2015 2016 2017
Accounts Receivable 9,5% 14,6% 22,8%
Total Current Asset 100% 100% 100%
YearDescription
27
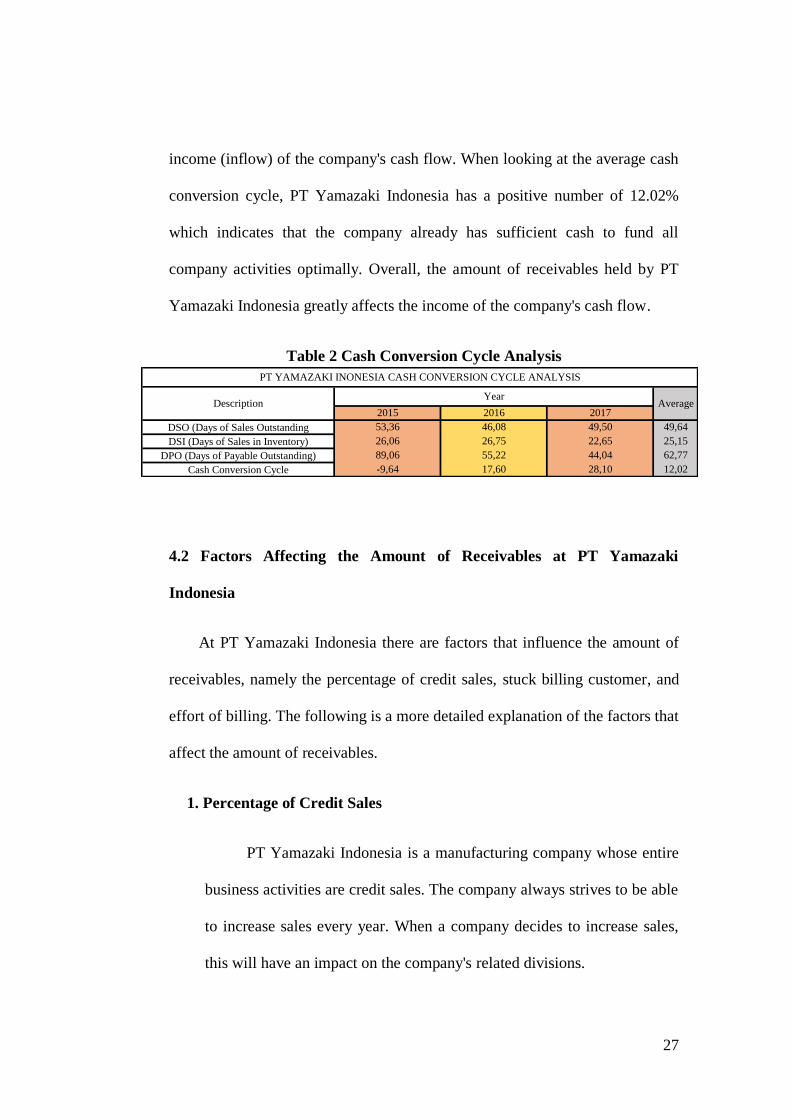
income (inflow) of the company's cash flow. When looking at the average cash
conversion cycle, PT Yamazaki Indonesia has a positive number of 12.02%
which indicates that the company already has sufficient cash to fund all
company activities optimally. Overall, the amount of receivables held by PT
Yamazaki Indonesia greatly affects the income of the company's cash flow.
Table 2 Cash Conversion Cycle Analysis
4.2 Factors Affecting the Amount of Receivables at PT Yamazaki
Indonesia
At PT Yamazaki Indonesia there are factors that influence the amount of
receivables, namely the percentage of credit sales, stuck billing customer, and
effort of billing. The following is a more detailed explanation of the factors that
affect the amount of receivables.
1. Percentage of Credit Sales
PT Yamazaki Indonesia is a manufacturing company whose entire
business activities are credit sales. The company always strives to be able
to increase sales every year. When a company decides to increase sales,
this will have an impact on the company's related divisions.
2015 2016 2017
DSO (Days of Sales Outstanding 53,36 46,08 49,50 49,64
DSI (Days of Sales in Inventory) 26,06 26,75 22,65 25,15
DPO (Days of Payable Outstanding) 89,06 55,22 44,04 62,77
Cash Conversion Cycle -9,64 17,60 28,10 12,02
AverageDescription
PT YAMAZAKI INONESIA CASH CONVERSION CYCLE ANALYSIS
Year
28
The most related division is the Sales, Marketing, Distribution and
Return division (SMDR Division), because the division greatly influences
the size of sales activities carried out to consumers. The SMDR division
strives to give customers confidence in being able to buy more company
products, or strive for new consumer searches to increase sales.
Furthermore, the purchasing division and production division also require
adjustments in terms of increasing the scale of production to meet the
decision to increase sales.
However, the four divisions mentioned above need to consider
decisions from the financial & accounting division due to the high level
of risk from sales activities carried out on credit to the company's inflow.
When the company decides to increase sales, the Sales estimator division
will estimate how much the receivables will be obtained by the company
considering the billing process carried out needs to be increased as well.
When the company has increased sales on credit, the financial &
accounting division needs to work optimally in collecting accounts
receivable, considering that financial & accounting division personnel are
very few (only 5 people) and very difficult to collect receivables from
customers (180 companies).
Every year the company has sales figures that tend to increase. PT
Yamazaki Indonesia has a percentage of sales on credit of 100% of total
sales. This is clearly based on a joint decision of the company's leadership
in deciding to increase sales. This can be seen in the following data which
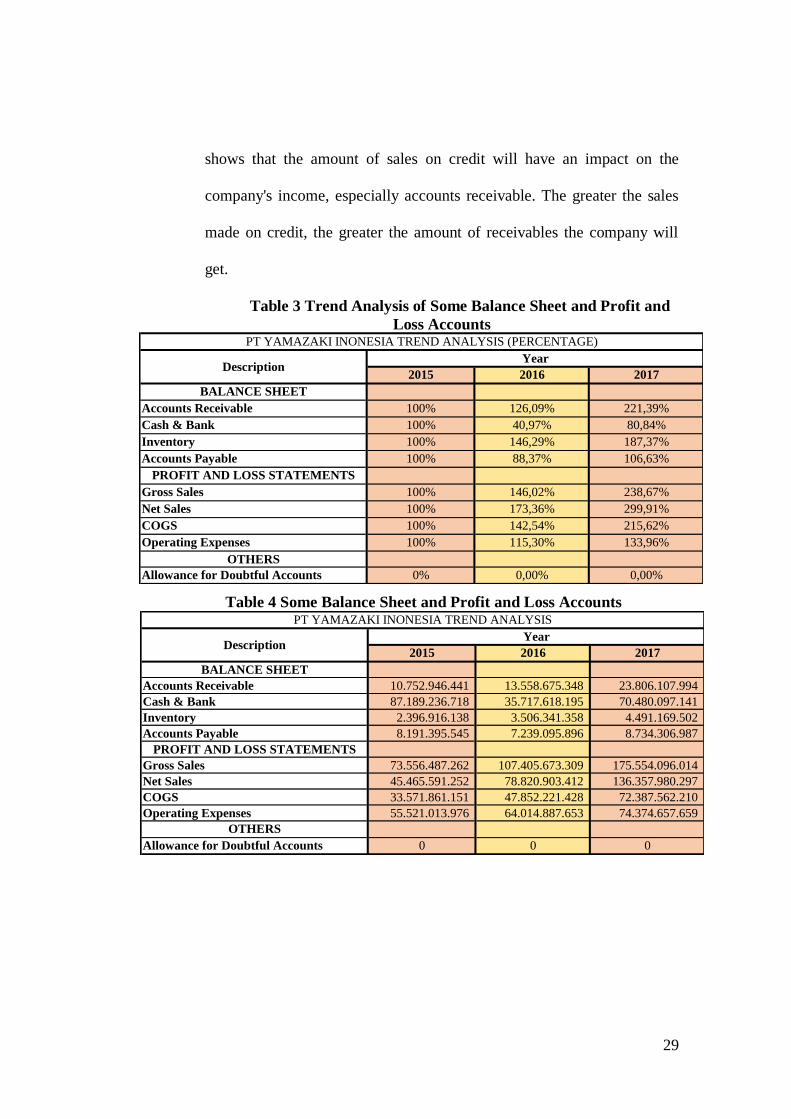
29
shows that the amount of sales on credit will have an impact on the
company's income, especially accounts receivable. The greater the sales
made on credit, the greater the amount of receivables the company will
get.
Table 3 Trend Analysis of Some Balance Sheet and Profit and
Loss Accounts
Table 4 Some Balance Sheet and Profit and Loss Accounts
2015 2016 2017
BALANCE SHEET
Accounts Receivable 100% 126,09% 221,39%
Cash & Bank 100% 40,97% 80,84%
Inventory 100% 146,29% 187,37%
Accounts Payable 100% 88,37% 106,63%
PROFIT AND LOSS STATEMENTS
Gross Sales 100% 146,02% 238,67%
Net Sales 100% 173,36% 299,91%
COGS 100% 142,54% 215,62%
Operating Expenses 100% 115,30% 133,96%
OTHERS
Allowance for Doubtful Accounts 0% 0,00% 0,00%
DescriptionYear
PT YAMAZAKI INONESIA TREND ANALYSIS (PERCENTAGE)
2015 2016 2017
BALANCE SHEET
Accounts Receivable 10.752.946.441 13.558.675.348 23.806.107.994
Cash & Bank 87.189.236.718 35.717.618.195 70.480.097.141
Inventory 2.396.916.138 3.506.341.358 4.491.169.502
Accounts Payable 8.191.395.545 7.239.095.896 8.734.306.987
PROFIT AND LOSS STATEMENTS
Gross Sales 73.556.487.262 107.405.673.309 175.554.096.014
Net Sales 45.465.591.252 78.820.903.412 136.357.980.297
COGS 33.571.861.151 47.852.221.428 72.387.562.210
Operating Expenses 55.521.013.976 64.014.887.653 74.374.657.659
OTHERS
Allowance for Doubtful Accounts 0 0 0
DescriptionYear
PT YAMAZAKI INONESIA TREND ANALYSIS
30
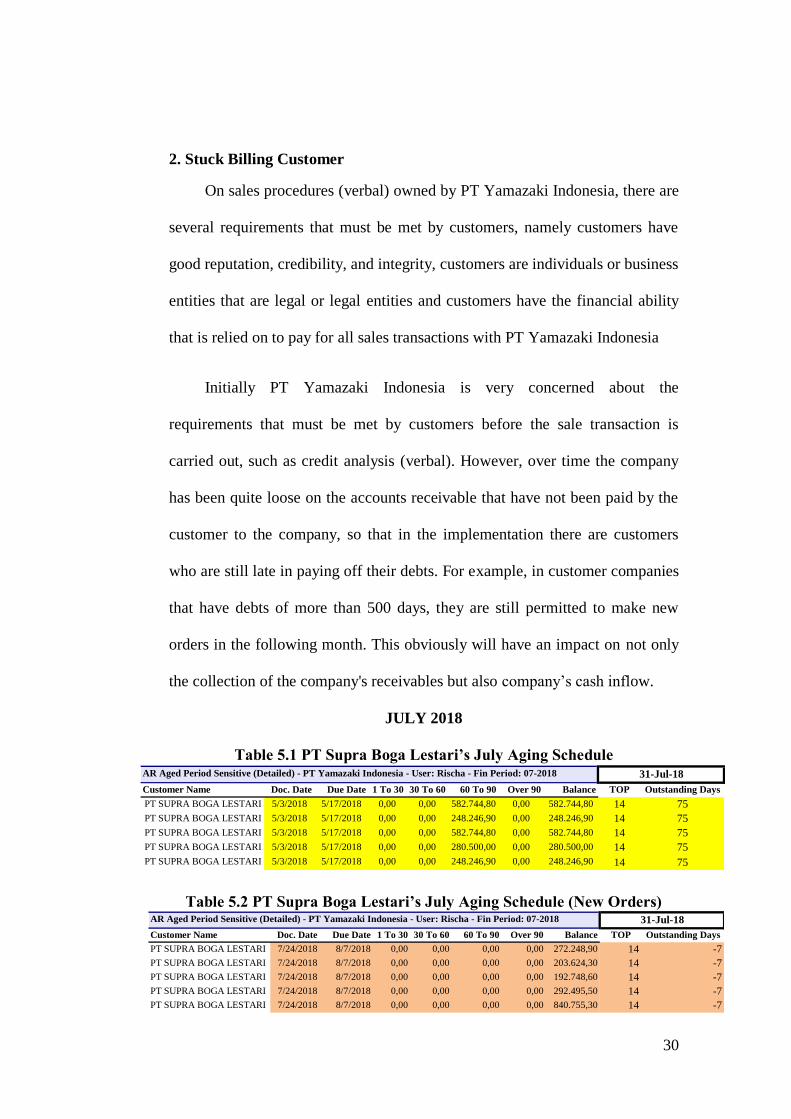
2. Stuck Billing Customer
On sales procedures (verbal) owned by PT Yamazaki Indonesia, there are
several requirements that must be met by customers, namely customers have
good reputation, credibility, and integrity, customers are individuals or business
entities that are legal or legal entities and customers have the financial ability
that is relied on to pay for all sales transactions with PT Yamazaki Indonesia
Initially PT Yamazaki Indonesia is very concerned about the
requirements that must be met by customers before the sale transaction is
carried out, such as credit analysis (verbal). However, over time the company
has been quite loose on the accounts receivable that have not been paid by the
customer to the company, so that in the implementation there are customers
who are still late in paying off their debts. For example, in customer companies
that have debts of more than 500 days, they are still permitted to make new
orders in the following month. This obviously will have an impact on not only
the collection of the company's receivables but also company’s cash inflow.
JULY 2018
Table 5.1 PT Supra Boga Lestari’s July Aging Schedule
Table 5.2 PT Supra Boga Lestari’s July Aging Schedule (New Orders)
AR Aged Period Sensitive (Detailed) - PT Yamazaki Indonesia - User: Rischa - Fin Period: 07-2018
Customer Name Doc. Date Due Date 1 To 30 30 To 60 60 To 90 Over 90 Balance TOP Outstanding Days
PT SUPRA BOGA LESTARI 5/3/2018 5/17/2018 0,00 0,00 582.744,80 0,00 582.744,80 14 75
PT SUPRA BOGA LESTARI 5/3/2018 5/17/2018 0,00 0,00 248.246,90 0,00 248.246,90 14 75
PT SUPRA BOGA LESTARI 5/3/2018 5/17/2018 0,00 0,00 582.744,80 0,00 582.744,80 14 75
PT SUPRA BOGA LESTARI 5/3/2018 5/17/2018 0,00 0,00 280.500,00 0,00 280.500,00 14 75
PT SUPRA BOGA LESTARI 5/3/2018 5/17/2018 0,00 0,00 248.246,90 0,00 248.246,90 14 75
31-Jul-18
AR Aged Period Sensitive (Detailed) - PT Yamazaki Indonesia - User: Rischa - Fin Period: 07-2018
Customer Name Doc. Date Due Date 1 To 30 30 To 60 60 To 90 Over 90 Balance TOP Outstanding Days
PT SUPRA BOGA LESTARI 7/24/2018 8/7/2018 0,00 0,00 0,00 0,00 272.248,90 14 -7
PT SUPRA BOGA LESTARI 7/24/2018 8/7/2018 0,00 0,00 0,00 0,00 203.624,30 14 -7
PT SUPRA BOGA LESTARI 7/24/2018 8/7/2018 0,00 0,00 0,00 0,00 192.748,60 14 -7
PT SUPRA BOGA LESTARI 7/24/2018 8/7/2018 0,00 0,00 0,00 0,00 292.495,50 14 -7
PT SUPRA BOGA LESTARI 7/24/2018 8/7/2018 0,00 0,00 0,00 0,00 840.755,30 14 -7
31-Jul-18
31
Table 6.1 PT Fajar Mitra Indah’s July Aging Schedule
Table 6.2 PT Fajar Mitra Indah’s July Aging Schedule (New Orders)
Table 7.1 PT Lion Super Indo’s July Aging Schedule
Table 7.2 PT Lion Super Indo’s July Aging Schedule (New Orders)
Table 8.1 PT Naga Swalayan’s July Aging Schedule
Table 8.2 PT Naga Swalayan’s July Aging Schedule (New Orders)
AR Aged Period Sensitive (Detailed) - PT Yamazaki Indonesia - User: Rischa - Fin Period: 07-2018
Customer Name Doc. Date Due Date 1 To 30 30 To 60 60 To 90 Over 90 Balance TOP Outstanding Days
PT FAJAR MITRA INDAH 7/22/2016 8/12/2016 0,00 0,00 0,00 424.499,00 424.499,00 21 718PT FAJAR MITRA INDAH 8/12/2016 9/2/2016 0,00 0,00 0,00 138.002,00 138.002,00 21 697PT FAJAR MITRA INDAH 8/12/2016 9/2/2016 0,00 0,00 0,00 339.004,00 339.004,00 21 697PT FAJAR MITRA INDAH 10/1/2016 10/22/2016 0,00 0,00 0,00 193.499,00 193.499,00 21 647PT FAJAR MITRA INDAH 11/23/2016 12/14/2016 0,00 0,00 0,00 628.882,00 628.882,00 21 594
31-Jul-18
AR Aged Period Sensitive (Detailed) - PT Yamazaki Indonesia - User: Rischa - Fin Period: 07-2018
Customer Name Doc. Date Due Date 1 To 30 30 To 60 60 To 90 Over 90 Balance TOP Outstanding Days
PT FAJAR MITRA INDAH 7/24/2018 8/14/2018 0,00 0,00 0,00 0,00 15.856.393,30 21 -14
PT FAJAR MITRA INDAH 7/25/2018 8/15/2018 0,00 0,00 0,00 0,00 23.060.478,10 21 -15
PT FAJAR MITRA INDAH 7/26/2018 8/16/2018 0,00 0,00 0,00 0,00 13.346.528,80 21 -16
PT FAJAR MITRA INDAH 7/27/2018 8/17/2018 0,00 0,00 0,00 0,00 12.474.647,90 21 -17
PT FAJAR MITRA INDAH 7/28/2018 8/18/2018 0,00 0,00 0,00 0,00 7.245.890,30 21 -18
31-Jul-18
AR Aged Period Sensitive (Detailed) - PT Yamazaki Indonesia - User: Rischa - Fin Period: 07-2018
Customer Name Doc. Date Due Date 1 To 30 30 To 60 60 To 90 Over 90 Balance TOP Outstanding Days
PT LION SUPER INDO 1/16/2018 2/15/2018 0,00 0,00 0,00 354.375,05 354.375,05 30 166
PT LION SUPER INDO 4/5/2018 5/5/2018 0,00 0,00 141.000,02 0,00 141.000,02 30 87
PT LION SUPER INDO 4/5/2018 5/5/2018 0,00 0,00 265.125,05 0,00 265.125,05 30 87
PT LION SUPER INDO 4/6/2018 5/6/2018 0,00 0,00 171.750,03 0,00 171.750,03 30 86
PT LION SUPER INDO 4/9/2018 5/9/2018 0,00 0,00 202.500,03 0,00 202.500,03 30 83
31-Jul-18
AR Aged Period Sensitive (Detailed) - PT Yamazaki Indonesia - User: Rischa - Fin Period: 07-2018
Customer Name Doc. Date Due Date 1 To 30 30 To 60 60 To 90 Over 90 Balance TOP Outstanding Days
PT LION SUPER INDO (JAWA BARAT)7/26/2018 8/25/2018 0,00 0,00 0,00 0,00 604.881,20 30 -25
PT LION SUPER INDO (JAWA BARAT)7/26/2018 8/25/2018 0,00 0,00 0,00 0,00 592.127,80 30 -25
PT LION SUPER INDO (JAWA BARAT)7/26/2018 8/25/2018 0,00 0,00 0,00 0,00 268.127,20 30 -25
PT LION SUPER INDO (JAWA BARAT)7/26/2018 8/25/2018 0,00 0,00 0,00 0,00 227.252,30 30 -25
PT LION SUPER INDO (JAWA BARAT)7/26/2018 8/25/2018 0,00 0,00 0,00 0,00 1.653.021,70 30 -25
31-Jul-18
AR Aged Period Sensitive (Detailed) - PT Yamazaki Indonesia - User: Rischa - Fin Period: 07-2018
Customer Name Doc. Date Due Date 1 To 30 30 To 60 60 To 90 Over 90 Balance TOP Outstanding Days
NAGA SWALAYAN 6/14/2018 7/14/2018 532.133,80 0,00 0,00 0,00 532.133,80 30 17
NAGA SWALAYAN 6/14/2018 7/14/2018 507.007,60 0,00 0,00 0,00 507.007,60 30 17
NAGA SWALAYAN 6/14/2018 7/14/2018 508.509,10 0,00 0,00 0,00 508.509,10 30 17
NAGA SWALAYAN 6/14/2018 7/14/2018 437.632,80 0,00 0,00 0,00 437.632,80 30 17
NAGA SWALAYAN 6/14/2018 7/14/2018 922.134,40 0,00 0,00 0,00 922.134,40 30 17
31-Jul-18
AR Aged Period Sensitive (Detailed) - PT Yamazaki Indonesia - User: Rischa - Fin Period: 07-2018
Customer Name Doc. Date Due Date 1 To 30 30 To 60 60 To 90 Over 90 Balance TOP Outstanding Days
NAGA SWALAYAN 7/26/2018 8/25/2018 0,00 0,00 0,00 0,00 758.634,80 30 -25
NAGA SWALAYAN 7/26/2018 8/25/2018 0,00 0,00 0,00 0,00 710.256,80 30 -25
NAGA SWALAYAN 7/26/2018 8/25/2018 0,00 0,00 0,00 0,00 763.133,80 30 -25
NAGA SWALAYAN 7/26/2018 8/25/2018 0,00 0,00 0,00 0,00 516.006,70 30 -25
NAGA SWALAYAN 7/26/2018 8/25/2018 0,00 0,00 0,00 0,00 1.685.638,90 30 -25
31-Jul-18
32
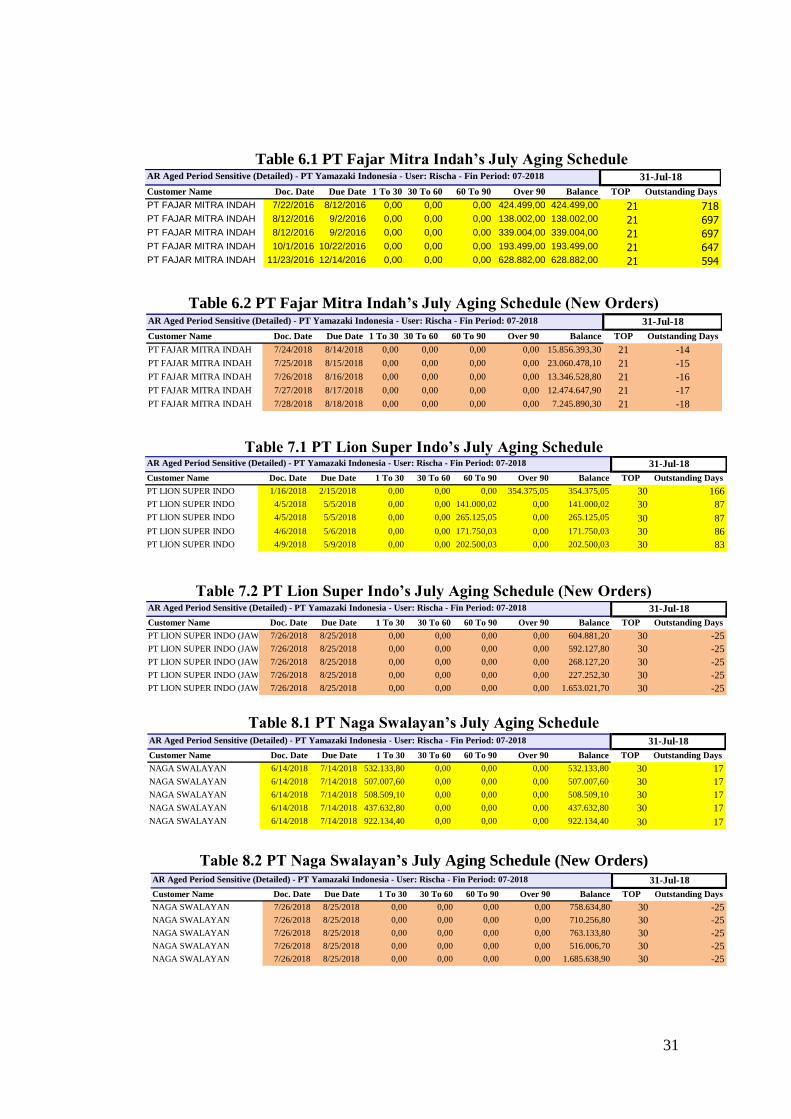
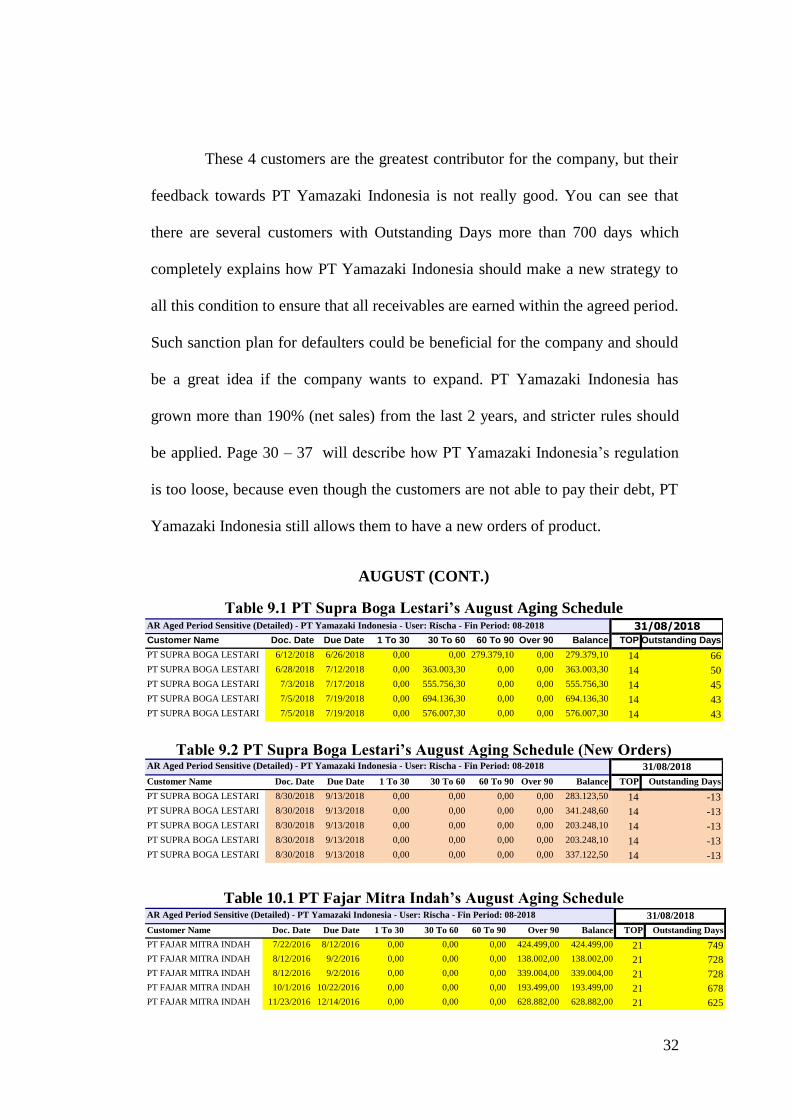
These 4 customers are the greatest contributor for the company, but their
feedback towards PT Yamazaki Indonesia is not really good. You can see that
there are several customers with Outstanding Days more than 700 days which
completely explains how PT Yamazaki Indonesia should make a new strategy to
all this condition to ensure that all receivables are earned within the agreed period.
Such sanction plan for defaulters could be beneficial for the company and should
be a great idea if the company wants to expand. PT Yamazaki Indonesia has
grown more than 190% (net sales) from the last 2 years, and stricter rules should
be applied. Page 30 – 37 will describe how PT Yamazaki Indonesia’s regulation
is too loose, because even though the customers are not able to pay their debt, PT
Yamazaki Indonesia still allows them to have a new orders of product.
AUGUST (CONT.)
Table 9.1 PT Supra Boga Lestari’s August Aging Schedule
Table 9.2 PT Supra Boga Lestari’s August Aging Schedule (New Orders)
`
Table 10.1 PT Fajar Mitra Indah’s August Aging Schedule
AR Aged Period Sensitive (Detailed) - PT Yamazaki Indonesia - User: Rischa - Fin Period: 08-2018
Customer Name Doc. Date Due Date 1 To 30 30 To 60 60 To 90 Over 90 Balance TOP Outstanding Days
PT SUPRA BOGA LESTARI 6/12/2018 6/26/2018 0,00 0,00 279.379,10 0,00 279.379,10 14 66
PT SUPRA BOGA LESTARI 6/28/2018 7/12/2018 0,00 363.003,30 0,00 0,00 363.003,30 14 50
PT SUPRA BOGA LESTARI 7/3/2018 7/17/2018 0,00 555.756,30 0,00 0,00 555.756,30 14 45
PT SUPRA BOGA LESTARI 7/5/2018 7/19/2018 0,00 694.136,30 0,00 0,00 694.136,30 14 43
PT SUPRA BOGA LESTARI 7/5/2018 7/19/2018 0,00 576.007,30 0,00 0,00 576.007,30 14 43
31/08/2018
AR Aged Period Sensitive (Detailed) - PT Yamazaki Indonesia - User: Rischa - Fin Period: 08-2018
Customer Name Doc. Date Due Date 1 To 30 30 To 60 60 To 90 Over 90 Balance TOP Outstanding Days
PT SUPRA BOGA LESTARI 8/30/2018 9/13/2018 0,00 0,00 0,00 0,00 283.123,50 14 -13
PT SUPRA BOGA LESTARI 8/30/2018 9/13/2018 0,00 0,00 0,00 0,00 341.248,60 14 -13
PT SUPRA BOGA LESTARI 8/30/2018 9/13/2018 0,00 0,00 0,00 0,00 203.248,10 14 -13
PT SUPRA BOGA LESTARI 8/30/2018 9/13/2018 0,00 0,00 0,00 0,00 203.248,10 14 -13
PT SUPRA BOGA LESTARI 8/30/2018 9/13/2018 0,00 0,00 0,00 0,00 337.122,50 14 -13
31/08/2018
AR Aged Period Sensitive (Detailed) - PT Yamazaki Indonesia - User: Rischa - Fin Period: 08-2018
Customer Name Doc. Date Due Date 1 To 30 30 To 60 60 To 90 Over 90 Balance TOP Outstanding Days
PT FAJAR MITRA INDAH 7/22/2016 8/12/2016 0,00 0,00 0,00 424.499,00 424.499,00 21 749
PT FAJAR MITRA INDAH 8/12/2016 9/2/2016 0,00 0,00 0,00 138.002,00 138.002,00 21 728
PT FAJAR MITRA INDAH 8/12/2016 9/2/2016 0,00 0,00 0,00 339.004,00 339.004,00 21 728
PT FAJAR MITRA INDAH 10/1/2016 10/22/2016 0,00 0,00 0,00 193.499,00 193.499,00 21 678
PT FAJAR MITRA INDAH 11/23/2016 12/14/2016 0,00 0,00 0,00 628.882,00 628.882,00 21 625
31/08/2018

33
Table 10.2 PT Fajar Mitra Indah’s August Aging Schedule (New Orders)
Table 11.1 PT Lion Super Indo August Aging Schedule
Table 11.2 PT Lion Super Indo’s August Aging Schedule (New Orders)
Table 12.1 PT Naga Swalayan’s August Aging Schedule
Table 12.2 PT Naga Swalayan’s August Aging Schedule (New Orders)
AR Aged Period Sensitive (Detailed) - PT Yamazaki Indonesia - User: Rischa - Fin Period: 08-2018
Customer Name Doc. Date Due Date 1 To 30 30 To 60 60 To 90 Over 90 Balance TOP Outstanding Days
PT FAJAR MITRA INDAH 8/31/2018 9/21/2018 0,00 0,00 0,00 0,00 18.500.340,10 21 -21
PT FAJAR MITRA INDAH 8/31/2018 9/21/2018 0,00 0,00 0,00 0,00 691.848,30 21 -21
PT FAJAR MITRA INDAH 8/30/2018 9/20/2018 0,00 0,00 0,00 0,00 16.102.702,00 21 -20
PT FAJAR MITRA INDAH 8/29/2018 9/19/2018 0,00 0,00 0,00 0,00 27.253.982,80 21 -19
PT FAJAR MITRA INDAH 8/28/2018 9/18/2018 0,00 0,00 0,00 0,00 17.799.171,50 21 -18
31/08/2018
AR Aged Period Sensitive (Detailed) - PT Yamazaki Indonesia - User: Rischa - Fin Period: 08-2018
Customer Name Doc. Date Due Date 1 To 30 30 To 60 60 To 90 Over 90 Balance TOP Outstanding Days
PT LION SUPER INDO 1/16/2018 2/15/2018 0,00 0,00 0,00 354.375,05 354.375,05 30 197
PT LION SUPER INDO 4/26/2018 5/26/2018 0,00 0,00 0,00 245.250,05 245.250,05 30 97
PT LION SUPER INDO 4/28/2018 5/28/2018 0,00 0,00 0,00 231.750,02 231.750,02 30 95
PT LION SUPER INDO 4/28/2018 5/28/2018 0,00 0,00 0,00 423.000,07 423.000,07 30 95
PT LION SUPER INDO 4/28/2018 5/28/2018 0,00 0,00 0,00 399.000,05 399.000,05 30 95
31/08/2018
AR Aged Period Sensitive (Detailed) - PT Yamazaki Indonesia - User: Rischa - Fin Period: 08-2018
Customer Name Doc. Date Due Date 1 To 30 30 To 60 60 To 90 Over 90 Balance TOP Outstanding Days
PT LION SUPER INDO (JAWA BARAT)8/31/2018 9/30/2018 0,00 0,00 0,00 0,00 686.628,80 30 -30
PT LION SUPER INDO (JAWA BARAT)8/31/2018 9/30/2018 0,00 0,00 0,00 0,00 529.125,30 30 -30
PT LION SUPER INDO (JAWA BARAT)8/31/2018 9/30/2018 0,00 0,00 0,00 0,00 371.625,10 30 -30
PT LION SUPER INDO (JAWA BARAT)8/31/2018 9/30/2018 0,00 0,00 0,00 0,00 434.253,60 30 -30
PT LION SUPER INDO (JAWA BARAT)8/31/2018 9/30/2018 0,00 0,00 0,00 0,00 1.710.016,00 30 -30
31/08/2018
AR Aged Period Sensitive (Detailed) - PT Yamazaki Indonesia - User: Rischa - Fin Period: 08-2018
Customer Name Doc. Date Due Date 1 To 30 30 To 60 60 To 90 Over 90 Balance TOP Outstanding Days
NAGA SWALAYAN 7/2/2018 8/1/2018 777.007,00 0,00 0,00 0,00 777.007,00 30 30
NAGA SWALAYAN 7/2/2018 8/1/2018 878.257,60 0,00 0,00 0,00 878.257,60 30 30
NAGA SWALAYAN 7/4/2018 8/3/2018 1.031.631,70 0,00 0,00 0,00 1.031.631,70 30 28
NAGA SWALAYAN 7/4/2018 8/3/2018 1.755.015,90 0,00 0,00 0,00 1.755.015,90 30 28
NAGA SWALAYAN 7/6/2018 8/5/2018 2.054.268,70 0,00 0,00 0,00 2.054.268,70 30 26
31/08/2018
AR Aged Period Sensitive (Detailed) - PT Yamazaki Indonesia - User: Rischa - Fin Period: 08-2018
Customer Name Doc. Date Due Date 1 To 30 30 To 60 60 To 90 Over 90 Balance TOP Outstanding Days
NAGA SWALAYAN 8/31/2018 9/30/2018 0,00 0,00 0,00 0,00 2.860.904,20 30 -30
NAGA SWALAYAN 8/31/2018 9/30/2018 0,00 0,00 0,00 0,00 1.184.638,40 30 -30
NAGA SWALAYAN 8/31/2018 9/30/2018 0,00 0,00 0,00 0,00 4.357.548,80 30 -30
NAGA SWALAYAN 8/31/2018 9/30/2018 0,00 0,00 0,00 0,00 2.782.532,50 30 -30
NAGA SWALAYAN 8/30/2018 9/29/2018 0,00 0,00 0,00 0,00 914.639,00 30 -29
31/08/2018

34
SEPTEMBER (CONT.)
Table 13.1 PT Supra Boga Lestari’s September Aging Schedule
Table 13.2 PT Supra Boga Lestari’s September Aging Schedule (New
Orders)
Table 14.1 PT Fajar Mitra Indah’s September Aging Schedule
Table 14.2 PT Fajar Mitra Indah’s September Aging Schedule (New
Orders)
Table 15.1 PT Lion Super Indo’s September Aging Schedule
Table 15.2 PT Lion Super Indo’s September Aging Schedule (New Orders)
AR Aged Period Sensitive (Detailed) - PT Yamazaki Indonesia - User: Rischa - Fin Period: 09-2018
Customer Name Doc. Date Due Date 1 To 30 30 To 60 60 To 90 Over 90 Balance TOP Outstanding Days
PT SUPRA BOGA LESTARI 9/30/2018 10/14/2018 0,00 0,00 0,00 0,00 854.254,50 14 -14
PT SUPRA BOGA LESTARI 9/29/2018 10/13/2018 0,00 0,00 0,00 0,00 0,80 14 -13
PT SUPRA BOGA LESTARI 9/29/2018 10/13/2018 0,00 0,00 0,00 0,00 319.875,60 14 -13
PT SUPRA BOGA LESTARI 9/29/2018 10/13/2018 0,00 0,00 0,00 0,00 399.374,80 14 -13
PT SUPRA BOGA LESTARI 9/29/2018 10/13/2018 0,00 0,00 0,00 0,00 301.499,00 14 -13
30/09/2018
AR Aged Period Sensitive (Detailed) - PT Yamazaki Indonesia - User: Rischa - Fin Period: 09-2018
Customer Name Doc. Date Due Date 1 To 30 30 To 60 60 To 90 Over 90 Balance TOP Outstanding Days
PT FAJAR MITRA INDAH 7/22/2016 8/12/2016 0,00 0,00 0,00 424.499,00 424.499,00 21 779
PT FAJAR MITRA INDAH 8/12/2016 9/2/2016 0,00 0,00 0,00 138.002,00 138.002,00 21 758
PT FAJAR MITRA INDAH 8/12/2016 9/2/2016 0,00 0,00 0,00 339.004,00 339.004,00 21 758
PT FAJAR MITRA INDAH 10/1/2016 10/22/2016 0,00 0,00 0,00 193.499,00 193.499,00 21 708
PT FAJAR MITRA INDAH 11/23/2016 12/14/2016 0,00 0,00 0,00 628.882,00 628.882,00 21 655
30/09/2018
AR Aged Period Sensitive (Detailed) - PT Yamazaki Indonesia - User: Rischa - Fin Period: 09-2018
Customer Name Doc. Date Due Date 1 To 30 30 To 60 60 To 90 Over 90 Balance TOP Outstanding Days
PT FAJAR MITRA INDAH 9/30/2018 10/21/2018 0,00 0,00 0,00 0,00 590.978,30 21 -21
PT FAJAR MITRA INDAH 9/30/2018 10/21/2018 0,00 0,00 0,00 0,00 535.854,00 21 -21
PT FAJAR MITRA INDAH 9/29/2018 10/20/2018 0,00 0,00 0,00 0,00 13.578.291,10 21 -20
PT FAJAR MITRA INDAH 9/28/2018 10/19/2018 0,00 0,00 0,00 0,00 590.978,30 21 -19
PT FAJAR MITRA INDAH 9/28/2018 10/19/2018 0,00 0,00 0,00 0,00 20.442.359,30 21 -19
30/09/2018
AR Aged Period Sensitive (Detailed) - PT Yamazaki Indonesia - User: Rischa - Fin Period: 09-2018
Customer Name Doc. Date Due Date 1 To 30 30 To 60 60 To 90 Over 90 Balance TOP Outstanding Days
PT LION SUPER INDO (JAWA BARAT)9/30/2018 10/30/2018 0,00 0,00 0,00 0,00 81.004,00 30 -30
PT LION SUPER INDO (JAWA BARAT)9/30/2018 10/30/2018 0,00 0,00 0,00 0,00 677.254,60 30 -30
PT LION SUPER INDO (JAWA BARAT)9/30/2018 10/30/2018 0,00 0,00 0,00 0,00 91.129,50 30 -30
PT LION SUPER INDO (JAWA BARAT)9/30/2018 10/30/2018 0,00 0,00 0,00 0,00 531.374,80 30 -30
PT LION SUPER INDO (JAWA BARAT)9/30/2018 10/30/2018 0,00 0,00 0,00 0,00 30.376,50 30 -30
30/09/2018
AR Aged Period Sensitive (Detailed) - PT Yamazaki Indonesia - User: Rischa - Fin Period: 09-2018
Customer Name Doc. Date Due Date 1 To 30 30 To 60 60 To 90 Over 90 Balance TOP Outstanding Days
PT SUPRA BOGA LESTARI 6/12/2018 6/26/2018 0,00 0,00 0,00 279.379,10 279.379,10 14 96
PT SUPRA BOGA LESTARI 6/28/2018 7/12/2018 0,00 0,00 363.003,30 0,00 363.003,30 14 80
PT SUPRA BOGA LESTARI 7/5/2018 7/19/2018 0,00 0,00 694.136,30 0,00 694.136,30 14 73
PT SUPRA BOGA LESTARI 8/2/2018 8/16/2018 0,00 859.884,30 0,00 0,00 859.884,30 14 45
PT SUPRA BOGA LESTARI 8/7/2018 8/21/2018 0,00 531.756,50 0,00 0,00 531.756,50 14 40
30/09/2018
AR Aged Period Sensitive (Detailed) - PT Yamazaki Indonesia - User: Rischa - Fin Period: 09-2018
Customer Name Doc. Date Due Date 1 To 30 30 To 60 60 To 90 Over 90 Balance TOP Outstanding Days
PT LION SUPER INDO 5/25/2018 6/24/2018 0,00 0,00 0,00 0,00 0,00 30 98
PT LION SUPER INDO 6/4/2018 7/4/2018 0,00 0,00 43.125,01 0,00 43.125,01 30 88
PT LION SUPER INDO 6/5/2018 7/5/2018 0,00 0,00 312.750,03 0,00 312.750,03 30 87
PT LION SUPER INDO 6/6/2018 7/6/2018 0,00 0,00 160.875,02 0,00 160.875,02 30 86
PT LION SUPER INDO 6/6/2018 7/6/2018 0,00 0,00 947.980,00 0,00 947.980,00 30 86
30/09/2018
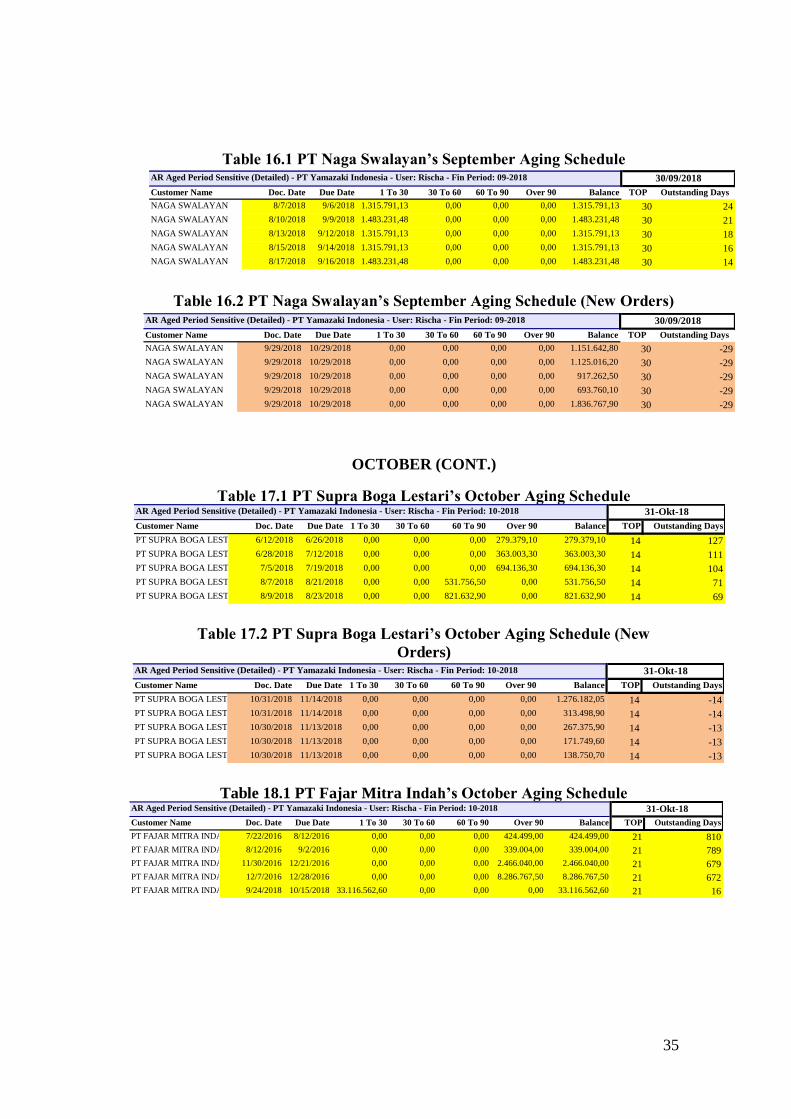
35
Table 16.1 PT Naga Swalayan’s September Aging Schedule
Table 16.2 PT Naga Swalayan’s September Aging Schedule (New Orders)
OCTOBER (CONT.)
Table 17.1 PT Supra Boga Lestari’s October Aging Schedule
Table 17.2 PT Supra Boga Lestari’s October Aging Schedule (New
Orders)
Table 18.1 PT Fajar Mitra Indah’s October Aging Schedule
AR Aged Period Sensitive (Detailed) - PT Yamazaki Indonesia - User: Rischa - Fin Period: 09-2018
Customer Name Doc. Date Due Date 1 To 30 30 To 60 60 To 90 Over 90 Balance TOP Outstanding Days
NAGA SWALAYAN 8/7/2018 9/6/2018 1.315.791,13 0,00 0,00 0,00 1.315.791,13 30 24
NAGA SWALAYAN 8/10/2018 9/9/2018 1.483.231,48 0,00 0,00 0,00 1.483.231,48 30 21
NAGA SWALAYAN 8/13/2018 9/12/2018 1.315.791,13 0,00 0,00 0,00 1.315.791,13 30 18
NAGA SWALAYAN 8/15/2018 9/14/2018 1.315.791,13 0,00 0,00 0,00 1.315.791,13 30 16
NAGA SWALAYAN 8/17/2018 9/16/2018 1.483.231,48 0,00 0,00 0,00 1.483.231,48 30 14
30/09/2018
AR Aged Period Sensitive (Detailed) - PT Yamazaki Indonesia - User: Rischa - Fin Period: 09-2018
Customer Name Doc. Date Due Date 1 To 30 30 To 60 60 To 90 Over 90 Balance TOP Outstanding Days
NAGA SWALAYAN 9/29/2018 10/29/2018 0,00 0,00 0,00 0,00 1.151.642,80 30 -29
NAGA SWALAYAN 9/29/2018 10/29/2018 0,00 0,00 0,00 0,00 1.125.016,20 30 -29
NAGA SWALAYAN 9/29/2018 10/29/2018 0,00 0,00 0,00 0,00 917.262,50 30 -29
NAGA SWALAYAN 9/29/2018 10/29/2018 0,00 0,00 0,00 0,00 693.760,10 30 -29
NAGA SWALAYAN 9/29/2018 10/29/2018 0,00 0,00 0,00 0,00 1.836.767,90 30 -29
30/09/2018
AR Aged Period Sensitive (Detailed) - PT Yamazaki Indonesia - User: Rischa - Fin Period: 10-2018
Customer Name Doc. Date Due Date 1 To 30 30 To 60 60 To 90 Over 90 Balance TOP Outstanding Days
PT SUPRA BOGA LESTARI 6/12/2018 6/26/2018 0,00 0,00 0,00 279.379,10 279.379,10 14 127
PT SUPRA BOGA LESTARI 6/28/2018 7/12/2018 0,00 0,00 0,00 363.003,30 363.003,30 14 111
PT SUPRA BOGA LESTARI 7/5/2018 7/19/2018 0,00 0,00 0,00 694.136,30 694.136,30 14 104
PT SUPRA BOGA LESTARI 8/7/2018 8/21/2018 0,00 0,00 531.756,50 0,00 531.756,50 14 71
PT SUPRA BOGA LESTARI 8/9/2018 8/23/2018 0,00 0,00 821.632,90 0,00 821.632,90 14 69
31-Okt-18
AR Aged Period Sensitive (Detailed) - PT Yamazaki Indonesia - User: Rischa - Fin Period: 10-2018
Customer Name Doc. Date Due Date 1 To 30 30 To 60 60 To 90 Over 90 Balance TOP Outstanding Days
PT SUPRA BOGA LESTARI 10/31/2018 11/14/2018 0,00 0,00 0,00 0,00 1.276.182,05 14 -14
PT SUPRA BOGA LESTARI 10/31/2018 11/14/2018 0,00 0,00 0,00 0,00 313.498,90 14 -14
PT SUPRA BOGA LESTARI 10/30/2018 11/13/2018 0,00 0,00 0,00 0,00 267.375,90 14 -13
PT SUPRA BOGA LESTARI 10/30/2018 11/13/2018 0,00 0,00 0,00 0,00 171.749,60 14 -13
PT SUPRA BOGA LESTARI 10/30/2018 11/13/2018 0,00 0,00 0,00 0,00 138.750,70 14 -13
31-Okt-18
AR Aged Period Sensitive (Detailed) - PT Yamazaki Indonesia - User: Rischa - Fin Period: 10-2018
Customer Name Doc. Date Due Date 1 To 30 30 To 60 60 To 90 Over 90 Balance TOP Outstanding Days
PT FAJAR MITRA INDAH 7/22/2016 8/12/2016 0,00 0,00 0,00 424.499,00 424.499,00 21 810
PT FAJAR MITRA INDAH 8/12/2016 9/2/2016 0,00 0,00 0,00 339.004,00 339.004,00 21 789
PT FAJAR MITRA INDAH 11/30/2016 12/21/2016 0,00 0,00 0,00 2.466.040,00 2.466.040,00 21 679
PT FAJAR MITRA INDAH 12/7/2016 12/28/2016 0,00 0,00 0,00 8.286.767,50 8.286.767,50 21 672
PT FAJAR MITRA INDAH 9/24/2018 10/15/2018 33.116.562,60 0,00 0,00 0,00 33.116.562,60 21 16
31-Okt-18
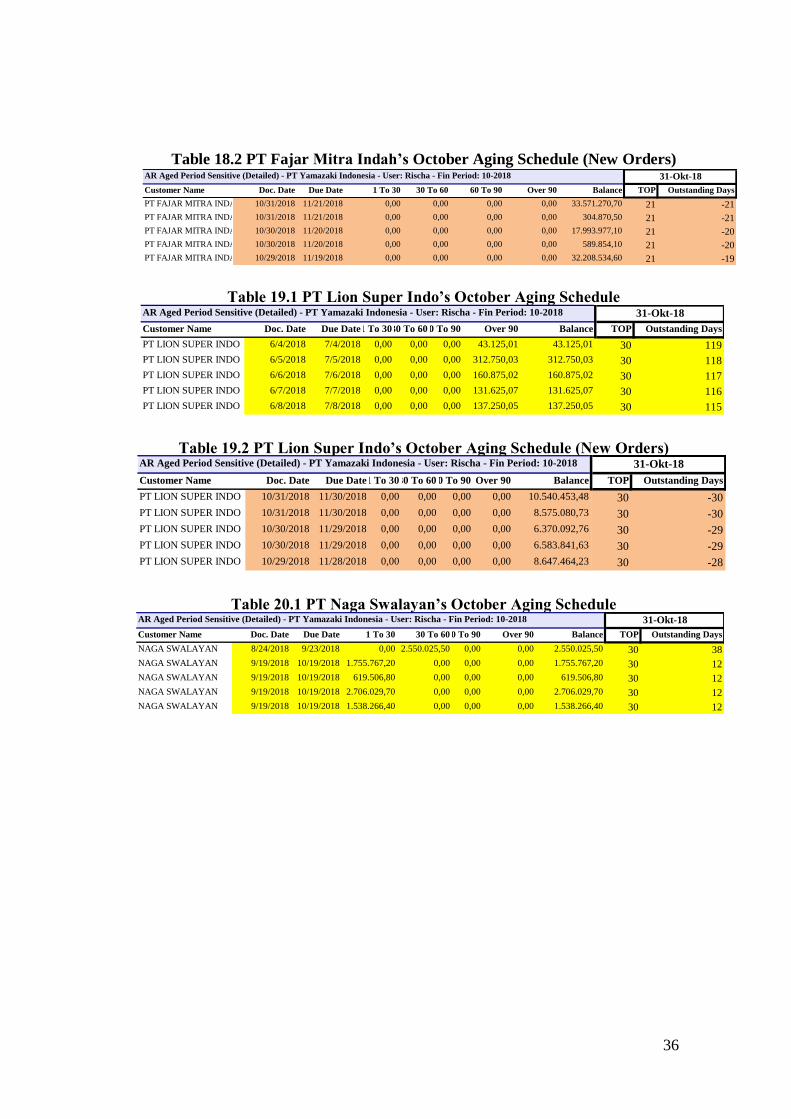
36
Table 18.2 PT Fajar Mitra Indah’s October Aging Schedule (New Orders)
Table 19.1 PT Lion Super Indo’s October Aging Schedule
Table 19.2 PT Lion Super Indo’s October Aging Schedule (New Orders)
Table 20.1 PT Naga Swalayan’s October Aging Schedule
AR Aged Period Sensitive (Detailed) - PT Yamazaki Indonesia - User: Rischa - Fin Period: 10-2018
Customer Name Doc. Date Due Date 1 To 30 30 To 60 60 To 90 Over 90 Balance TOP Outstanding Days
PT FAJAR MITRA INDAH 10/31/2018 11/21/2018 0,00 0,00 0,00 0,00 33.571.270,70 21 -21
PT FAJAR MITRA INDAH 10/31/2018 11/21/2018 0,00 0,00 0,00 0,00 304.870,50 21 -21
PT FAJAR MITRA INDAH 10/30/2018 11/20/2018 0,00 0,00 0,00 0,00 17.993.977,10 21 -20
PT FAJAR MITRA INDAH 10/30/2018 11/20/2018 0,00 0,00 0,00 0,00 589.854,10 21 -20
PT FAJAR MITRA INDAH 10/29/2018 11/19/2018 0,00 0,00 0,00 0,00 32.208.534,60 21 -19
31-Okt-18
AR Aged Period Sensitive (Detailed) - PT Yamazaki Indonesia - User: Rischa - Fin Period: 10-2018
Customer Name Doc. Date Due Date1 To 3030 To 6060 To 90 Over 90 Balance TOP Outstanding Days
PT LION SUPER INDO 10/31/2018 11/30/2018 0,00 0,00 0,00 0,00 10.540.453,48 30 -30
PT LION SUPER INDO 10/31/2018 11/30/2018 0,00 0,00 0,00 0,00 8.575.080,73 30 -30
PT LION SUPER INDO 10/30/2018 11/29/2018 0,00 0,00 0,00 0,00 6.370.092,76 30 -29
PT LION SUPER INDO 10/30/2018 11/29/2018 0,00 0,00 0,00 0,00 6.583.841,63 30 -29
PT LION SUPER INDO 10/29/2018 11/28/2018 0,00 0,00 0,00 0,00 8.647.464,23 30 -28
31-Okt-18
AR Aged Period Sensitive (Detailed) - PT Yamazaki Indonesia - User: Rischa - Fin Period: 10-2018
Customer Name Doc. Date Due Date1 To 3030 To 6060 To 90 Over 90 Balance TOP Outstanding Days
PT LION SUPER INDO 6/4/2018 7/4/2018 0,00 0,00 0,00 43.125,01 43.125,01 30 119
PT LION SUPER INDO 6/5/2018 7/5/2018 0,00 0,00 0,00 312.750,03 312.750,03 30 118
PT LION SUPER INDO 6/6/2018 7/6/2018 0,00 0,00 0,00 160.875,02 160.875,02 30 117
PT LION SUPER INDO 6/7/2018 7/7/2018 0,00 0,00 0,00 131.625,07 131.625,07 30 116
PT LION SUPER INDO 6/8/2018 7/8/2018 0,00 0,00 0,00 137.250,05 137.250,05 30 115
31-Okt-18
AR Aged Period Sensitive (Detailed) - PT Yamazaki Indonesia - User: Rischa - Fin Period: 10-2018
Customer Name Doc. Date Due Date 1 To 30 30 To 6060 To 90 Over 90 Balance TOP Outstanding Days
NAGA SWALAYAN 8/24/2018 9/23/2018 0,00 2.550.025,50 0,00 0,00 2.550.025,50 30 38
NAGA SWALAYAN 9/19/2018 10/19/2018 1.755.767,20 0,00 0,00 0,00 1.755.767,20 30 12
NAGA SWALAYAN 9/19/2018 10/19/2018 619.506,80 0,00 0,00 0,00 619.506,80 30 12
NAGA SWALAYAN 9/19/2018 10/19/2018 2.706.029,70 0,00 0,00 0,00 2.706.029,70 30 12
NAGA SWALAYAN 9/19/2018 10/19/2018 1.538.266,40 0,00 0,00 0,00 1.538.266,40 30 12
31-Okt-18
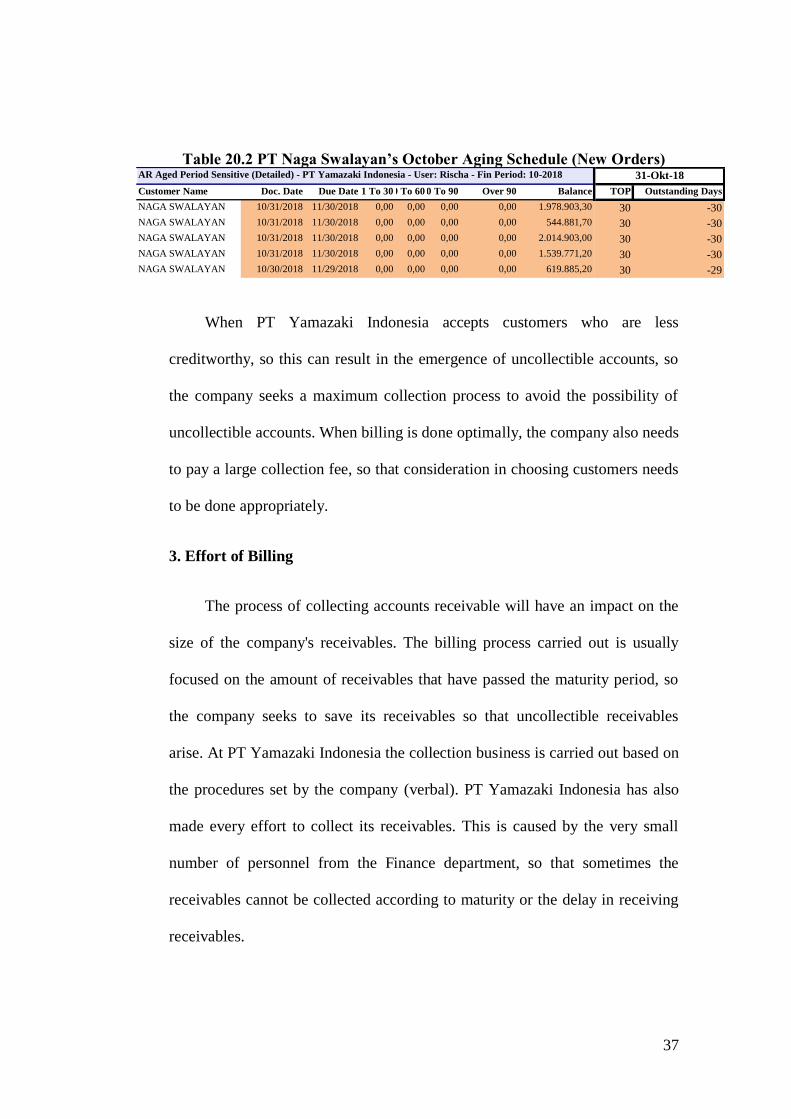
37
Table 20.2 PT Naga Swalayan’s October Aging Schedule (New Orders)
When PT Yamazaki Indonesia accepts customers who are less
creditworthy, so this can result in the emergence of uncollectible accounts, so
the company seeks a maximum collection process to avoid the possibility of
uncollectible accounts. When billing is done optimally, the company also needs
to pay a large collection fee, so that consideration in choosing customers needs
to be done appropriately.
3. Effort of Billing
The process of collecting accounts receivable will have an impact on the
size of the company's receivables. The billing process carried out is usually
focused on the amount of receivables that have passed the maturity period, so
the company seeks to save its receivables so that uncollectible receivables
arise. At PT Yamazaki Indonesia the collection business is carried out based on
the procedures set by the company (verbal). PT Yamazaki Indonesia has also
made every effort to collect its receivables. This is caused by the very small
number of personnel from the Finance department, so that sometimes the
receivables cannot be collected according to maturity or the delay in receiving
receivables.
AR Aged Period Sensitive (Detailed) - PT Yamazaki Indonesia - User: Rischa - Fin Period: 10-2018
Customer Name Doc. Date Due Date 1 To 3030 To 6060 To 90 Over 90 Balance TOP Outstanding Days
NAGA SWALAYAN 10/31/2018 11/30/2018 0,00 0,00 0,00 0,00 1.978.903,30 30 -30
NAGA SWALAYAN 10/31/2018 11/30/2018 0,00 0,00 0,00 0,00 544.881,70 30 -30
NAGA SWALAYAN 10/31/2018 11/30/2018 0,00 0,00 0,00 0,00 2.014.903,00 30 -30
NAGA SWALAYAN 10/31/2018 11/30/2018 0,00 0,00 0,00 0,00 1.539.771,20 30 -30
NAGA SWALAYAN 10/30/2018 11/29/2018 0,00 0,00 0,00 0,00 619.885,20 30 -29
31-Okt-18
38
Technically, PT Yamazaki Indonesia has carried out a predetermined
billing procedure, starting from preparing billing documents until the invoice is
issued. But there is no standard that is the basis for the process of managing
accounts receivable. Then in its implementation, the company experienced
several obstacles, especially constraints that came from customers such as
negligence in paying off debts that were due, deliberately slowing down in
paying off debts for certain reasons and so on. The billing process that is
carried out also sometimes involves the financial manager up to the president
director in confirming the receivables bill to the customer. This is due to the
nature of customers who sometimes pay less attention to ethics in paying off
debt.
Sometimes companies feel a dilemma when there are customers who are
late in paying off their debts to PT Yamazaki Indonesia. On one side the
company needs to save its receivables that are due, but on the other hand the
company is worried that customers will feel dissatisfied with the services
provided by the company to customers. This is because the company has
established a fairly close cooperative relationship with several customers who
have been buying PT Yamazaki Indonesia products for a very long time so that
sometimes there is a concession in the billing process carried out. This means
that customers and PT Yamazaki Indonesia are less professional in carrying out
this business collaboration. A good cooperation relationship should have an
impact on the timeliness of debt repayment rather than slowing down debt
payments.
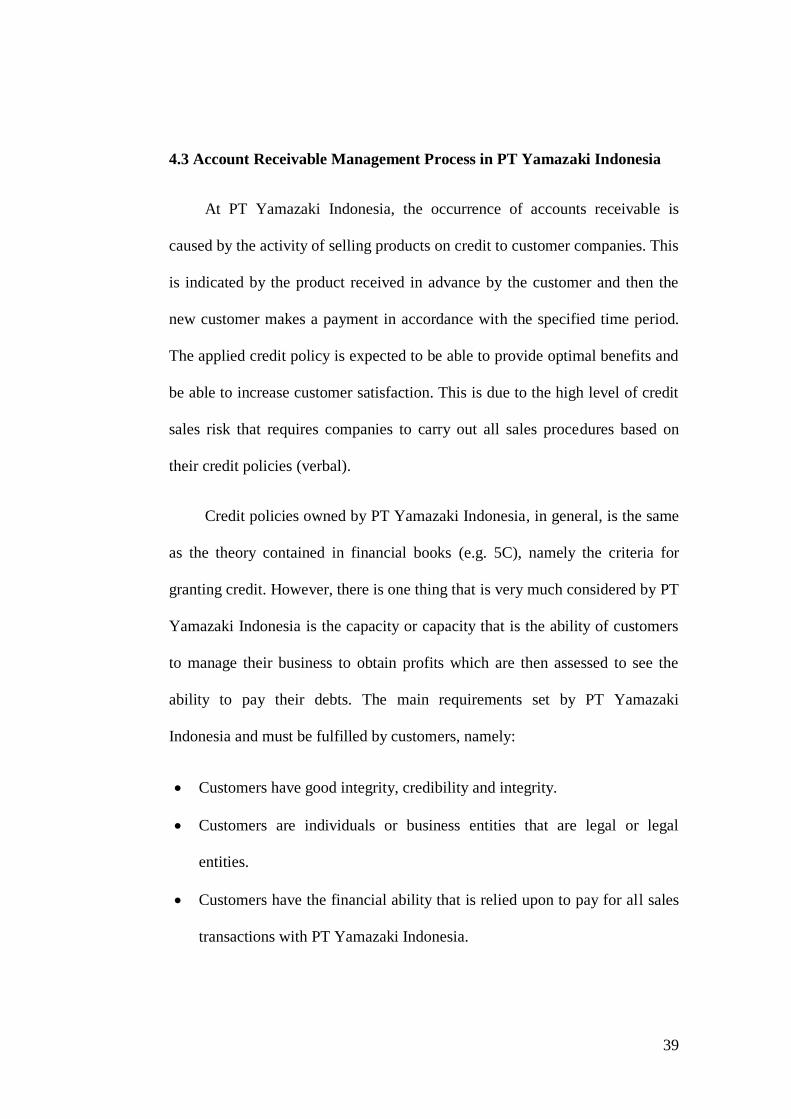
39
4.3 Account Receivable Management Process in PT Yamazaki Indonesia
At PT Yamazaki Indonesia, the occurrence of accounts receivable is
caused by the activity of selling products on credit to customer companies. This
is indicated by the product received in advance by the customer and then the
new customer makes a payment in accordance with the specified time period.
The applied credit policy is expected to be able to provide optimal benefits and
be able to increase customer satisfaction. This is due to the high level of credit
sales risk that requires companies to carry out all sales procedures based on
their credit policies (verbal).
Credit policies owned by PT Yamazaki Indonesia, in general, is the same
as the theory contained in financial books (e.g. 5C), namely the criteria for
granting credit. However, there is one thing that is very much considered by PT
Yamazaki Indonesia is the capacity or capacity that is the ability of customers
to manage their business to obtain profits which are then assessed to see the
ability to pay their debts. The main requirements set by PT Yamazaki
Indonesia and must be fulfilled by customers, namely:
Customers have good integrity, credibility and integrity.
Customers are individuals or business entities that are legal or legal
entities.
Customers have the financial ability that is relied upon to pay for all sales
transactions with PT Yamazaki Indonesia.

40
PT Yamazaki Indonesia’s sales are all made on credit, both unsecured
credit sales and collateral sales. Unsecured credit sales policies are given to
companies that are believed to be able to pay sales transactions well, such as
Alfa-mart, Alfa-midi and private companies that are believed to be able to
make payments well. The sale of unsecured credit is based on an agreement
agreed by both parties without violating the policies set by PT Yamazaki
Indonesia. Then the credit sales policy with guarantees is given to companies
that are able to submit collateral in accordance with the provisions of PT
Yamazaki Indonesia.
Technically, PT Yamazaki Indonesia has procedures for making credit
sales to customers. The procedure carried out involves several divisions within
the company's management functions. The most involved divisions are the
marketing, purchasing division and financial & accounting division. The sales
procedure begins with the issuance of a price quote letter (Surat Penawaran
Harga) from the marketing division to customers. Then the customer will give
a reply in the form of a letter ordering goods or a PO (Purchase Order) to the
marketing division of PT Yamazaki Indonesia. After that, the PO letter is
received and processed by negotiation between the customer and PT Yamazaki
Indonesia. Negotiations are carried out by both parties until they find a specific
agreement, especially in terms of payment and discount times. Then the
agreement that has been obtained is outlined in the form of an agreement
signed by both parties. After obtaining an agreement, then the ordered product
is ready to be sent. When the goods have been sent and received by the
41
customer, then the financial & accounting division begins preparing documents
to issue invoice invoices. When an invoice is issued, there is usually a sales
discount, but in this case there is an exception namely the absence of sales
discounts for the whole. Sales discounts are only given to certain customers
who have a special relationship with PT Yamazaki Indonesia, namely the
Holding Company of the company itself. Unfortunately, all of this information
was obtained from interview sessions only (verbally), so to give more
contribution to the company, the researcher decides to create SOP for PT
Yamazaki Indonesia in the form of Flowchart. Further explanation can be
described in Figure 4 page 42.
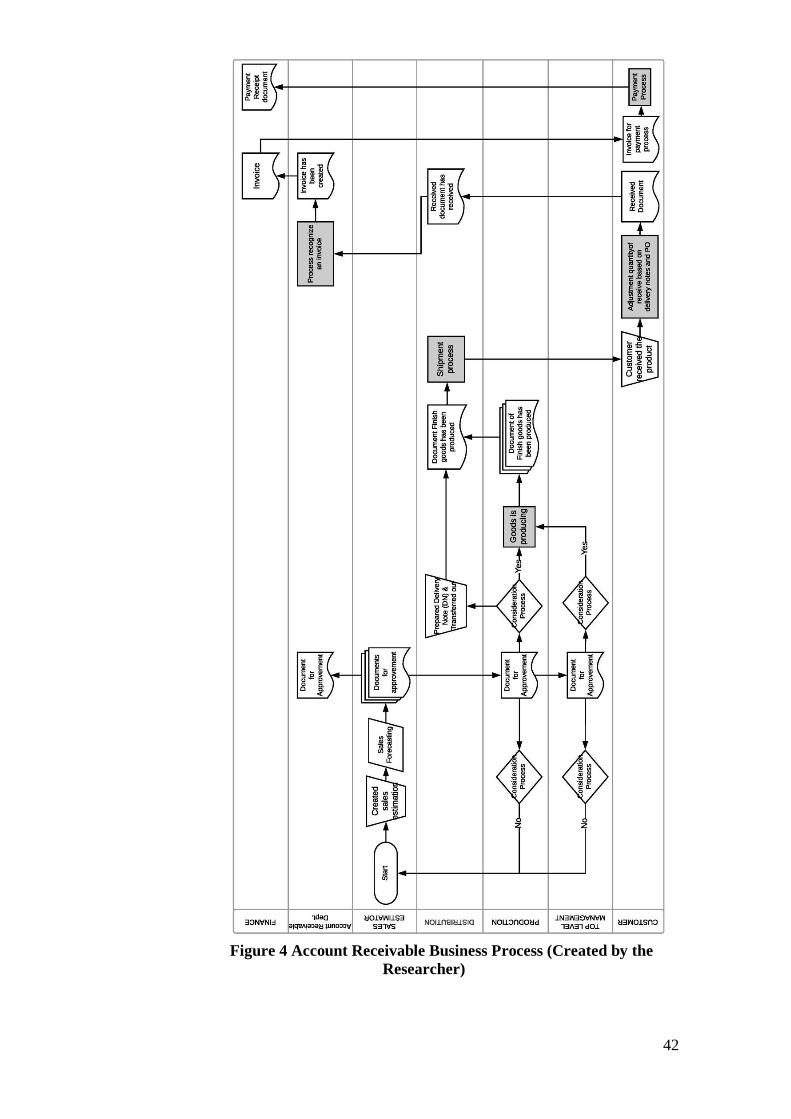
42
Figure 4 Account Receivable Business Process (Created by the
Researcher)
43
4.4 Debt Collection Procedure
The billing process using an invoice is only done once. This is to avoid the
possibility of double invoice. However, if there are errors in the invoice, such
as errors in product data being billed, errors in tax invoice numbers, typing
errors and so on, then there is a procedure for returning invoices via return
notes first. Then invoices that have been repaired or revised are issued. PT
Yamazaki Indonesia also has a fairly good scheduling system, when all invoice
documents are ready to be issued.
After the invoice is issued, sometimes the customer is difficult or slow in
responding to bills or it is difficult to pay off, so the next attempt is made by PT
Yamazaki Indonesia, namely monitoring or supervision. The monitoring
activities are carried out by the financial & accounting division by contacting
by fax or calling the customer to confirm or by coming directly to the location
of the customer's company. When this is considered less influential, then the
company involves the individual role of the marketing division in assisting the
billing process.
PT Yamazaki Indonesia experienced several obstacles in the billing
process, namely the distance or coverage of the customer's company area, data
changes such as address changes, tax invoices, and lack of personnel in the
financial & accounting division. In addition, the main obstacle that most often
occurs is the delay in paying off debt. Of the several constraints faced,
management always strives to be able to manage and control their receivables.
When the management cannot manage and control the receivables, it will have

44
an impact on the income received (inflow) or maybe the company will lose
revenue due to the emergence of uncollectible accounts.
The most tangible effort made by PT Yamazaki Indonesia in dealing with
these problems is by sticking to existing credit guidelines or policies and
implementing a good management system.
4.5Trend Analysis
Based on trend analysis, the financial condition of PT Yamazaki Indonesia
shows a situation that tends to increase from 2015-2017 (volatile). When
viewed from several accounts contained in the balance sheet, such as accounts
receivable, debt and inventory, all tend to increase. However, the increasing
trend does not always provide good information. For example, the amount of
receivables that always increases from 2015-2017 shows an increase in credit
sales made by the company. This will affect the increase in inflow that will be
received by the company. The percentage of accounts receivable can be seen
in the balance sheet (inflow) from 2016 to 2017 which is 126.09%; and
221.39%. However, when the receivables are not followed by a good collection
process, it will affect the income that will be received so that it will also have
an impact on the company's operations. In addition, the amount of accounts
receivable can allow an increase in uncollectible accounts.
The percentage of allowance for accounts receivable from 2015 to 2017 is
0%. This clearly violates the regulations made by IFRS. Accounting standards,
45
both SAK and IFRS, treat receivables as financial instruments, namely
financial assets, whose recognition and measurement are regulated in PSAK 55
/ IAS 39, while the presentation is regulated in PSAK 50 / IAS 32 and PSAK 1 /
IAS 1 which states that all the receivables should be provisioned.
The percentage of corporate debt also tends to increase, namely by 88.37%
and 106.63% from 2016 to 2017 (volatile). This is due to an increase in sales
which requires companies to increase the scale of production so that it also has
an impact on increasing corporate debt. The main reason for the increase in
debt is because companies always buy raw materials from suppliers on credit
so that it influences the increase in the percentage of corporate debt. However,
an increase in debt to companies is not too problematic when there is also an
increase in sales activities which will then affect the company's inflow.
At PT Yamazaki Indonesia, sales activities tend to increase. As presented
in table 22, the data from 2016 to 2017 is equal to 146.02% and 238,67%.
This shows that the company is able to provide trust to customers regarding the
quality of the products offered. In addition, the increase in sales was caused by
the role and hard work of the marketing division. However, the trend of
increasing sales every year causes an increase in inventory. As presented in
table 22, the data from 2016 to 2017 is equal to 146.29% and 187.37%. This
causes companies to need to increase their sales extra so that inventory does
not accumulate too much in the company's warehouse. Stockpiles that
accumulate result in additional storage costs, considering the products stored
contain ingredients that are easily spoiled.
46
The component in the income statement shows that there is an increase in
sales which has a fairly good impact on the net income obtained by the
company. It can be seen from the data from 2016 to 2017 that there is a
fluctuating situation in the net sales that is equal to 173.36% and 299,91%. This
explains the increase in net income that is significant in 2017.
In addition, other possible causes of the rise and fall of net income are the
tendency of fluctuations in cost of goods sold and the company's operating
expenses. The trend of increasing cost of goods sold is caused by the possibility
of rising raw material requirements as evidenced by the increase in sales every
year. As stated in table 22, the data of cost of goods sold in 2016 up to 2017
which is equal to 142.54% and 215.62%. This shows that an increase in sales
results in an increase in cost of goods sold as well as an impact on profits to be
received. As it is understood that gross profit is the difference between sales
and cost of goods sold and similarly, the amount of operating expenses that
affect the amount of net income received by the company. It can be seen in the
data on the number of business expenses in 2016 up to 2017 which shows an
increasing trend of 115.30% and 133.96%. Based on these data, it was
explained that the increase in sales also resulted in an increase in operating
expenses. This is due to the increase in sales expenses and general and
administrative expenses each year.
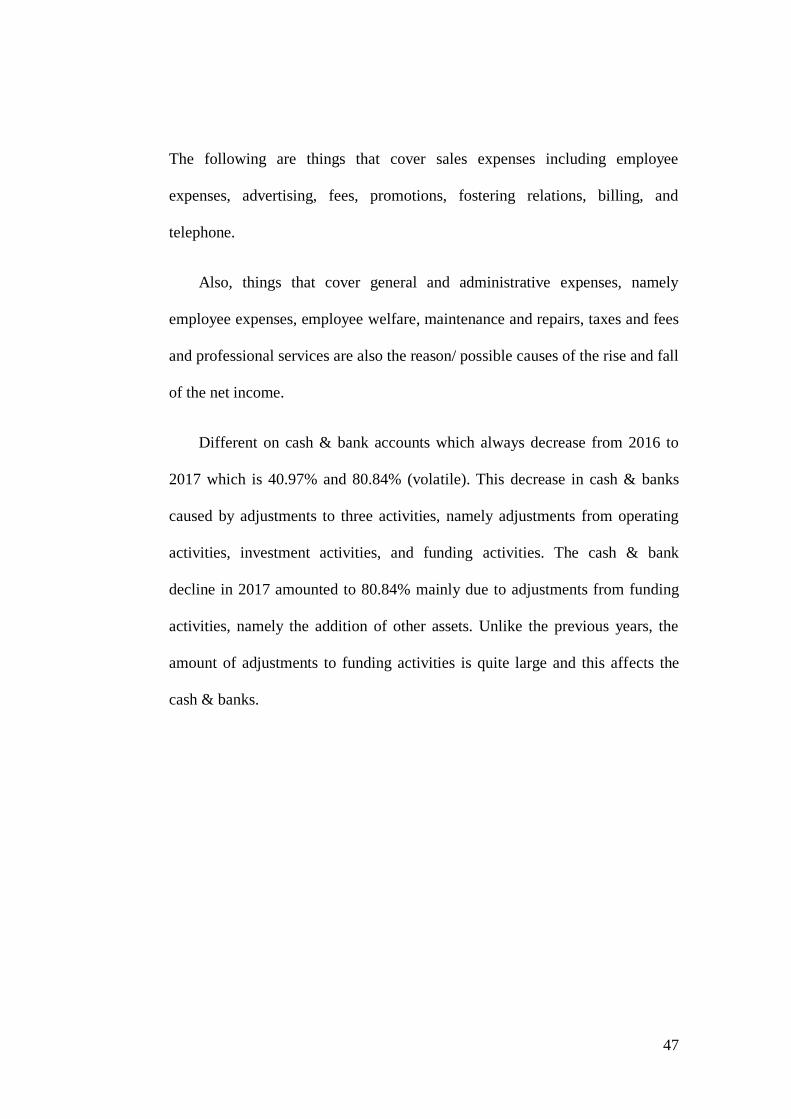
47
The following are things that cover sales expenses including employee
expenses, advertising, fees, promotions, fostering relations, billing, and
telephone.
Also, things that cover general and administrative expenses, namely
employee expenses, employee welfare, maintenance and repairs, taxes and fees
and professional services are also the reason/ possible causes of the rise and fall
of the net income.
Different on cash & bank accounts which always decrease from 2016 to
2017 which is 40.97% and 80.84% (volatile). This decrease in cash & banks
caused by adjustments to three activities, namely adjustments from operating
activities, investment activities, and funding activities. The cash & bank
decline in 2017 amounted to 80.84% mainly due to adjustments from funding
activities, namely the addition of other assets. Unlike the previous years, the
amount of adjustments to funding activities is quite large and this affects the
cash & banks.
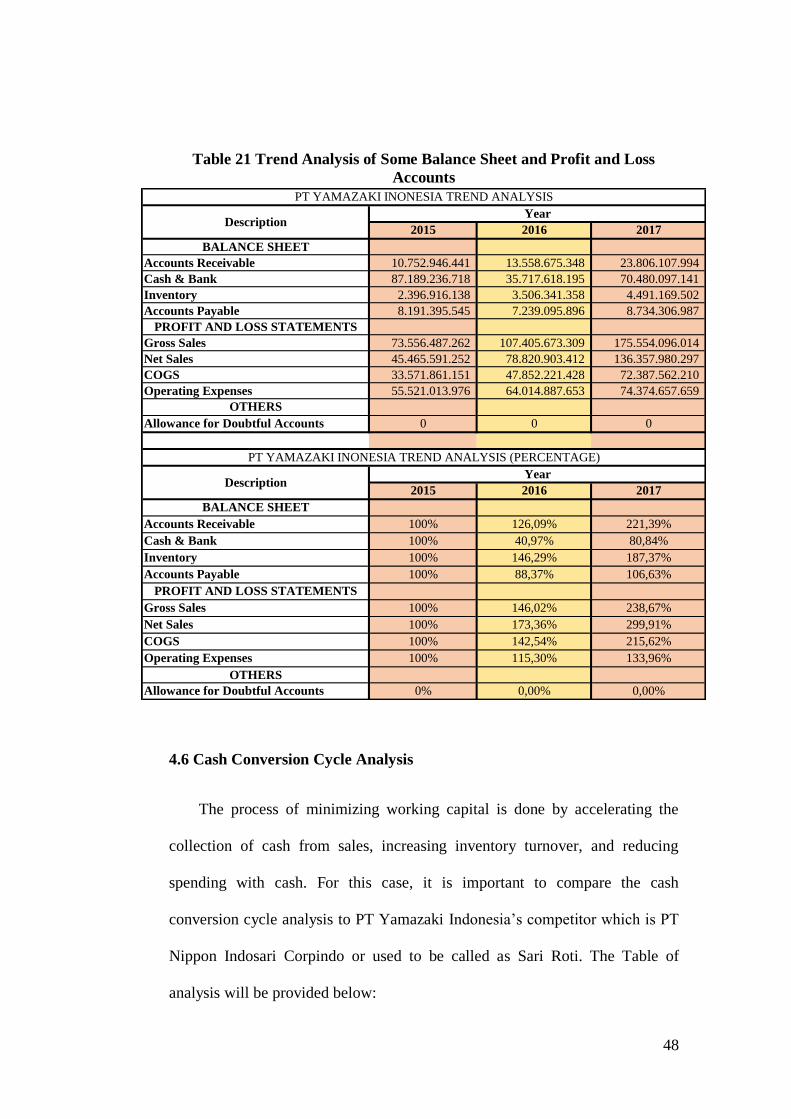
48
Table 21 Trend Analysis of Some Balance Sheet and Profit and Loss
Accounts
4.6 Cash Conversion Cycle Analysis
The process of minimizing working capital is done by accelerating the
collection of cash from sales, increasing inventory turnover, and reducing
spending with cash. For this case, it is important to compare the cash
conversion cycle analysis to PT Yamazaki Indonesia’s competitor which is PT
Nippon Indosari Corpindo or used to be called as Sari Roti. The Table of
analysis will be provided below:
2015 2016 2017
BALANCE SHEET
Accounts Receivable 10.752.946.441 13.558.675.348 23.806.107.994
Cash & Bank 87.189.236.718 35.717.618.195 70.480.097.141
Inventory 2.396.916.138 3.506.341.358 4.491.169.502
Accounts Payable 8.191.395.545 7.239.095.896 8.734.306.987
PROFIT AND LOSS STATEMENTS
Gross Sales 73.556.487.262 107.405.673.309 175.554.096.014
Net Sales 45.465.591.252 78.820.903.412 136.357.980.297
COGS 33.571.861.151 47.852.221.428 72.387.562.210
Operating Expenses 55.521.013.976 64.014.887.653 74.374.657.659
OTHERS
Allowance for Doubtful Accounts 0 0 0
2015 2016 2017
BALANCE SHEET
Accounts Receivable 100% 126,09% 221,39%
Cash & Bank 100% 40,97% 80,84%
Inventory 100% 146,29% 187,37%
Accounts Payable 100% 88,37% 106,63%
PROFIT AND LOSS STATEMENTS
Gross Sales 100% 146,02% 238,67%
Net Sales 100% 173,36% 299,91%
COGS 100% 142,54% 215,62%
Operating Expenses 100% 115,30% 133,96%
OTHERS
Allowance for Doubtful Accounts 0% 0,00% 0,00%
DescriptionYear
PT YAMAZAKI INONESIA TREND ANALYSIS (PERCENTAGE)
DescriptionYear
PT YAMAZAKI INONESIA TREND ANALYSIS
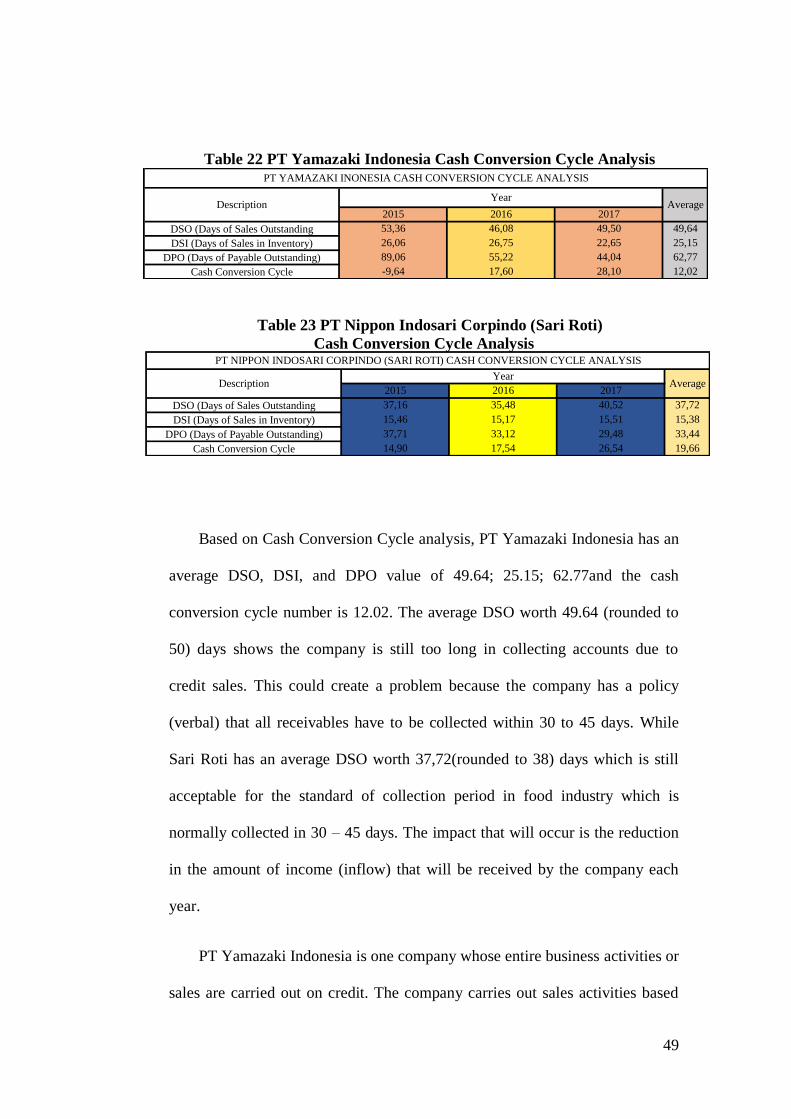
49
Table 22 PT Yamazaki Indonesia Cash Conversion Cycle Analysis
Table 23 PT Nippon Indosari Corpindo (Sari Roti)
Cash Conversion Cycle Analysis
Based on Cash Conversion Cycle analysis, PT Yamazaki Indonesia has an
average DSO, DSI, and DPO value of 49.64; 25.15; 62.77and the cash
conversion cycle number is 12.02. The average DSO worth 49.64 (rounded to
50) days shows the company is still too long in collecting accounts due to
credit sales. This could create a problem because the company has a policy
(verbal) that all receivables have to be collected within 30 to 45 days. While
Sari Roti has an average DSO worth 37,72(rounded to 38) days which is still
acceptable for the standard of collection period in food industry which is
normally collected in 30 – 45 days. The impact that will occur is the reduction
in the amount of income (inflow) that will be received by the company each
year.
PT Yamazaki Indonesia is one company whose entire business activities or
sales are carried out on credit. The company carries out sales activities based
2015 2016 2017
DSO (Days of Sales Outstanding 53,36 46,08 49,50 49,64
DSI (Days of Sales in Inventory) 26,06 26,75 22,65 25,15
DPO (Days of Payable Outstanding) 89,06 55,22 44,04 62,77
Cash Conversion Cycle -9,64 17,60 28,10 12,02
AverageDescription
PT YAMAZAKI INONESIA CASH CONVERSION CYCLE ANALYSIS
Year
2015 2016 2017
DSO (Days of Sales Outstanding 37,16 35,48 40,52 37,72
DSI (Days of Sales in Inventory) 15,46 15,17 15,51 15,38
DPO (Days of Payable Outstanding) 37,71 33,12 29,48 33,44
Cash Conversion Cycle 14,90 17,54 26,54 19,66
DescriptionYear
Average
PT NIPPON INDOSARI CORPINDO (SARI ROTI) CASH CONVERSION CYCLE ANALYSIS
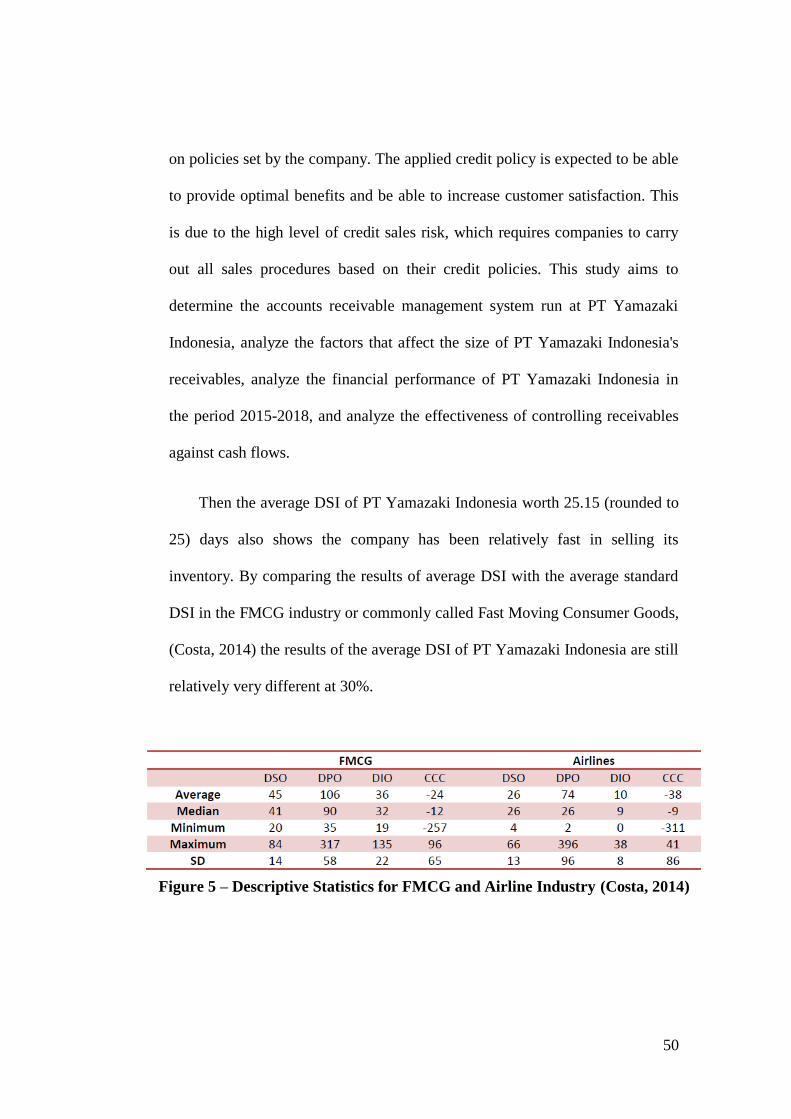
50
on policies set by the company. The applied credit policy is expected to be able
to provide optimal benefits and be able to increase customer satisfaction. This
is due to the high level of credit sales risk, which requires companies to carry
out all sales procedures based on their credit policies. This study aims to
determine the accounts receivable management system run at PT Yamazaki
Indonesia, analyze the factors that affect the size of PT Yamazaki Indonesia's
receivables, analyze the financial performance of PT Yamazaki Indonesia in
the period 2015-2018, and analyze the effectiveness of controlling receivables
against cash flows.
Then the average DSI of PT Yamazaki Indonesia worth 25.15 (rounded to
25) days also shows the company has been relatively fast in selling its
inventory. By comparing the results of average DSI with the average standard
DSI in the FMCG industry or commonly called Fast Moving Consumer Goods,
(Costa, 2014) the results of the average DSI of PT Yamazaki Indonesia are still
relatively very different at 30%.
Figure 5 – Descriptive Statistics for FMCG and Airline Industry (Costa, 2014)
51
This means that PT Yamazaki Indonesia is too fast in selling its inventory, but
the inventory is funded by debt (the DPO will be discussed after this). The
company needs to increase sales effectively with debt collection which is also
effective so that the inventory of goods in the warehouse is not funded by debt.
Similarly, the average DPO worth 62.77 (rounded to 62) days indicates that the
company has a long enough time to pay off its debts after collecting cash and
receivables in one period and it actually doubles the amount of days needed in
PT Nippon Indosari Corpindo which only need 33,44 (rounded to 33) days.
This is due to the large amount of debt held by the company because most of its
operations are funded from debt. For example, the purchase of raw materials
obtained from suppliers (suppliers) is done on credit or debt.
4.7 Financial Ratio Analysis
Financial ratio analysis is used to know in general the financial
performance of a company. In this study, the researcher used several financial
ratios, namely activity ratios to determine the financial performance of PT
Yamazaki Indonesia.
4.7.1Activity Ratio
The activity ratio is a ratio that explains the various activities of the
company in conducting operations efficiently and then the company can
carry out its operations properly. From the results of the activity ratio
52
analysis consisting of the average billing period and accounts receivable
turnover, explained that PT Yamazaki Indonesia has a fluctuating activity
ratio in 2017.
In the ratio of the average billing period, PT Yamazaki Indonesia still
requires a considerable amount of time in collecting receivables. This can
be seen from the average billing period in the period 2015 - 2017 which is
equal to 70.95 (rounded to 71) days, equivalent to 2.36 months (almost
close to 2.5 months), where the company targets collectible receivables in
the long term time of 30-45 days or 1 - 1.3 months. This is clearly very far
compared to the average Nippon Indosari Corpindo billing period, which
amounted to 44.22 (rounded up to 44) days or equivalent to 1.5 months,
where the figure still covers the existing standard. This is one indication
that the company is still not good at conducting the collection of
receivables in accordance with the time set. This is caused by several
factors, namely in terms of customers or in terms of the company itself. In
terms of customers, that is caused by the goods received are still partial or
sent in part, so customers tend to want to pay after the goods are received in
full and complete. Then it was also caused by customer negligence in
paying off debts that made PT Yamazaki Indonesia always contact. When
viewed in terms of the company, the billing system (verbal) has been
implemented well but has not been effective. The main obstacle that is
quite inhibiting is the personnel factor which only amounts to five people in
the financial & accounting division compared to the very large number of
53
customers reaching 180 companies. This causes the possibility of double
jobs or multiple jobs such as carrying out billing and managing financial
documents.
Table 24 PT Yamazaki Indonesia Activity Ratio
*ABP = Average Billing Period
** ABP Monthly = Average of Average Billing Period (Days)/12
To support the researchers' argument against the average billing period
ratio, researchers also provide other analyzes, namely the analysis of the
accounts receivable turnover ratio. In the accounts receivable turnover ratio,
PT Yamazaki Indonesia has a fluctuating ratio figure from the 2015-2017
periods. This means that PT Yamazaki Indonesia was only able to play
back the accounts receivable from the sales activities, namely the average
ratio of 5.26 times. It is different from PT Nippon Indosari Corpindo who
managed to collect its receivables as much as 8.31 times per year. This is
caused by a bad collection of accounts receivable and has the impact of the
possibility of uncollectible accounts. When the amount of uncollectible
receivables increases, the company will also experience a decrease in
income (inflow), especially the decrease in accounts receivable itself.
2015 2016 2017 AVERAGE
86,32518225 62,78685333 63,72365885 70,94523148 2,36 5,074336816
2015 2016 2017 AVERAGE
42,05501414 41,09686203 49,51705685 44,22297767 1,47 8,140564452
2015 2016 2017
4,23 5,81 5,73 5,26
2015 2016 2017
8,68 8,88 7,37 8,31
AVERAGE BILLING PERIOD OF PT YAMAZAKI INDONESIA (ANNUALLY)
AVERAGE BILLING PERIOD OF PT NIPPON INDOSARI CORPINDO (ANNUALLY)
ABP MONTHLY**
ABP MONTHLY**
12/ABPM
ACCOUNT RECEIVABLE TURNOVER PT YAMAZAKI INDONESIAAVERAGE
AVERAGEACCOUNT RECEIBALE PT NIPPON INDOSARI CORPINDO
12/ ABPM
54
4.8 Managerial Implications
PT Yamazaki Indonesia is a manufacturing company whose entire
business is credit sales. Sales made on credit will have an impact on the amount
of receivables that will be obtained and the amount of the receivables will have
an influence on the company's cash flow income. Credit sales conducted by PT
Yamazaki Indonesia are based on the policies set by the company (verbal). A
very important policy is the analysis of the criteria that must be met by the
customer before starting a credit purchase transaction.
At PT Yamazaki Indonesia, the policies that have been held are quite
good, because the policy is generally related to the collection of customer
information including the ability of customers to process payments for sales
transactions made on credit. But in its implementation, PT Yamazaki Indonesia
has difficulty collecting fees. One reason is from the customer itself. Initially
the company did prior credit analysis to customers, namely adjusting criteria
that must be met by customers, but after the company established a cooperative
relationship with several customers for a long time, sometimes some customers
ignored all regulations in the process of repaying debt. On the one hand, the
company has been able to establish good and long-standing cooperative
relationships with several customers, but on the other hand it turns out that
customers are less professional in paying their debts so that this will affect the
collection of receivables that can be billed and have an impact on the
company's cash flow.
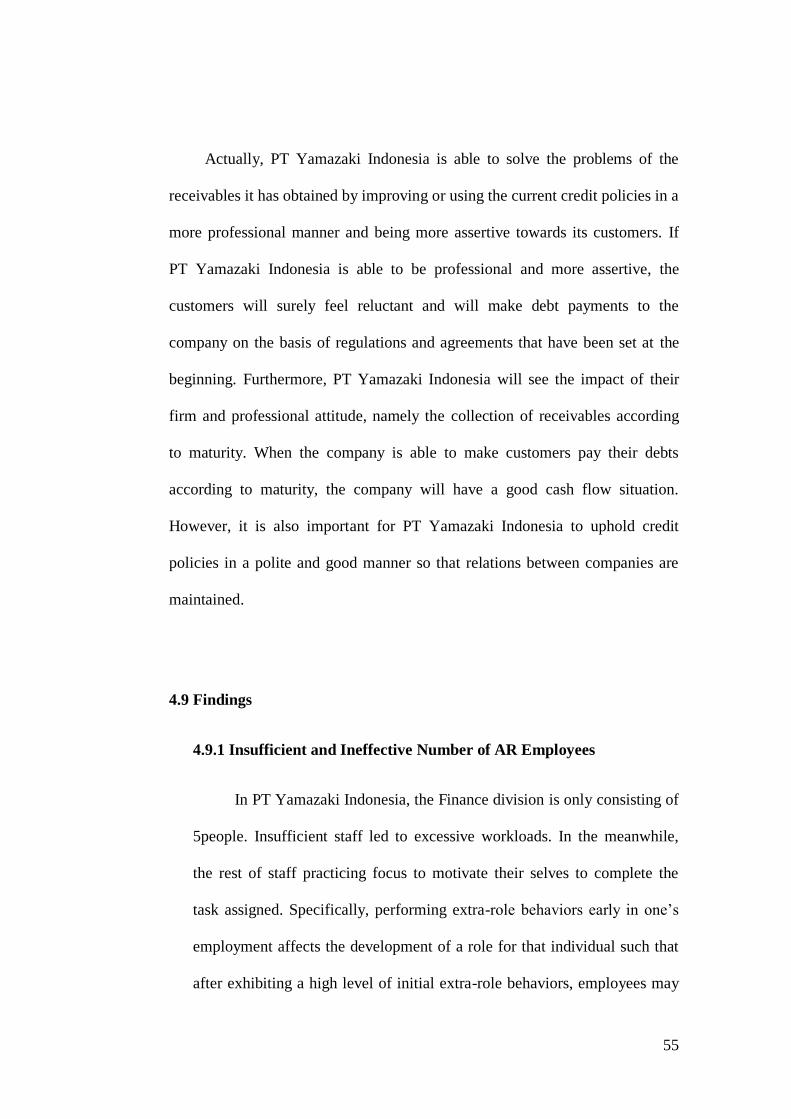
55
Actually, PT Yamazaki Indonesia is able to solve the problems of the
receivables it has obtained by improving or using the current credit policies in a
more professional manner and being more assertive towards its customers. If
PT Yamazaki Indonesia is able to be professional and more assertive, the
customers will surely feel reluctant and will make debt payments to the
company on the basis of regulations and agreements that have been set at the
beginning. Furthermore, PT Yamazaki Indonesia will see the impact of their
firm and professional attitude, namely the collection of receivables according
to maturity. When the company is able to make customers pay their debts
according to maturity, the company will have a good cash flow situation.
However, it is also important for PT Yamazaki Indonesia to uphold credit
policies in a polite and good manner so that relations between companies are
maintained.
4.9 Findings
4.9.1 Insufficient and Ineffective Number of AR Employees
In PT Yamazaki Indonesia, the Finance division is only consisting of
5people. Insufficient staff led to excessive workloads. In the meanwhile,
the rest of staff practicing focus to motivate their selves to complete the
task assigned. Specifically, performing extra-role behaviors early in one’s
employment affects the development of a role for that individual such that
after exhibiting a high level of initial extra-role behaviors, employees may
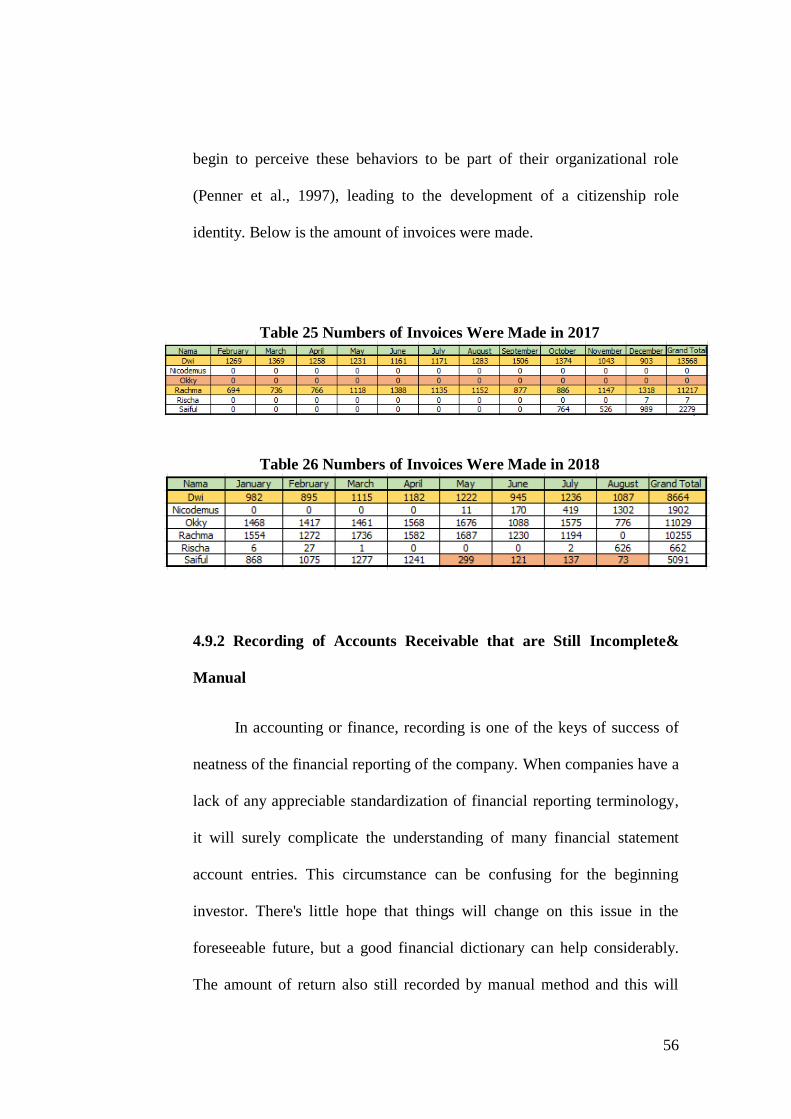
56
begin to perceive these behaviors to be part of their organizational role
(Penner et al., 1997), leading to the development of a citizenship role
identity. Below is the amount of invoices were made.
Table 25 Numbers of Invoices Were Made in 2017
Table 26 Numbers of Invoices Were Made in 2018
4.9.2 Recording of Accounts Receivable that are Still Incomplete&
Manual
In accounting or finance, recording is one of the keys of success of
neatness of the financial reporting of the company. When companies have a
lack of any appreciable standardization of financial reporting terminology,
it will surely complicate the understanding of many financial statement
account entries. This circumstance can be confusing for the beginning
investor. There's little hope that things will change on this issue in the
foreseeable future, but a good financial dictionary can help considerably.
The amount of return also still recorded by manual method and this will

57
clearly creates a high risk of error made by the employee. The average
difference every month is around (299.676.275). Usually in auditing, the
amount of numbers in aging schedule should represent the actual number in
Financial Statement. Differently in PT Yamazaki Indonesia as you may see
below.
Table 27 Accounts Receivable Balance Sheet Record of PT Yamazaki
Indonesia (2017)
Table 28 Accounts Receivable Balance Sheet Record of PT Yamazaki
Indonesia (2018)
4.9.3 Provision
If you extend credit to customers, chances are a percentage of those
accounts will eventually become uncollectable and need to be written off. A
bad debt allowance, also known as an allowance for doubtful accounts, is
one of two ways to account for and offset the losses from charged off
accounts. The other method is the direct write-off. The bad debt allowance
creates a general fund based on your accounts receivables, or “A/R,” the
Balance Sheet January February March April May June July August
Trade Receivable
Related parties 14.066.902.019 15.445.591.630,29 18.714.163.819,36 18.338.219.363,36 16.185.576.408,12 15.483.974.232,15 17.146.822.284,85 18.606.896.191,75
Third parties 1.214.264.967 1.390.515.352,30 1.055.523.760,76 930.430.267,55 970.595.798,44 1.106.111.976,83 1.435.265.703,02 1.948.825.632,35
15.281.166.986 16.836.106.983 19.769.687.580 19.268.649.631 17.156.172.207 16.590.086.209 18.582.087.988 20.555.721.824
Data Listing Invoice 14.064.618.362 14.011.088.395 16.471.181.673 15.271.202.307 15.478.353.063 13.370.946.463 15.810.198.418 17.632.329.549
Difference with TB 2.283.657 1.434.503.236 2.242.982.146 3.067.017.056 707.223.345 2.113.027.769 1.336.623.867 974.566.643
Third parties 136.234.793 132.054.793,00 132.054.793,00 132.054.793,00 132.054.793,00 132.054.793,00 0,00 0,00
Related Parties - 0,00 0,00 0,00 0,00 0,00 0,00 0,00
TOTAL AR 15.417.401.779 16.968.161.776 19.901.742.373 19.400.704.424 17.288.227.000 16.722.141.002 18.582.087.988 20.555.721.824
Per Aging / Listing AR 15.281.419.308 16.836.971.475 19.984.914.189 19.484.324.454 17.372.485.925 16.811.088.917 18.798.243.612 20.776.719.532
DIFFERENCE 135.982.471 131.190.301 (83.171.816) (83.620.030) (84.258.925) (88.947.915) (216.155.624) (220.997.708)
Balance Sheet January February March April May June July August
Trade Receivable
Related parties 21.001.910.899 16.830.309.650 16.654.036.533 17.273.777.852 16.590.637.777 15.812.518.238 23.099.909.255 22.900.481.318
Third parties 2.370.632.198 2.350.906.882 2.554.639.663 2.571.596.763 2.584.893.244 2.422.045.231 2.201.125.965 2.393.665.463
23.372.543.097 19.181.216.532 19.208.676.197 19.845.374.615 19.175.531.022 18.234.563.469 25.301.035.221 25.294.146.780
TOTAL AR 23.372.543.097 19.181.216.532 19.208.676.197 19.845.374.615 19.175.531.022 18.234.563.469 25.301.035.221 25.294.146.780
Per Aging / Listing AR 23.672.219.373 19.480.892.807 19.508.352.472 20.145.050.890 19.475.207.297 18.234.563.469 25.301.035.221 25.294.146.780
DIFFERENCE (299.676.275) (299.676.275) (299.676.275) (299.676.275) (299.676.275) 0 0 0
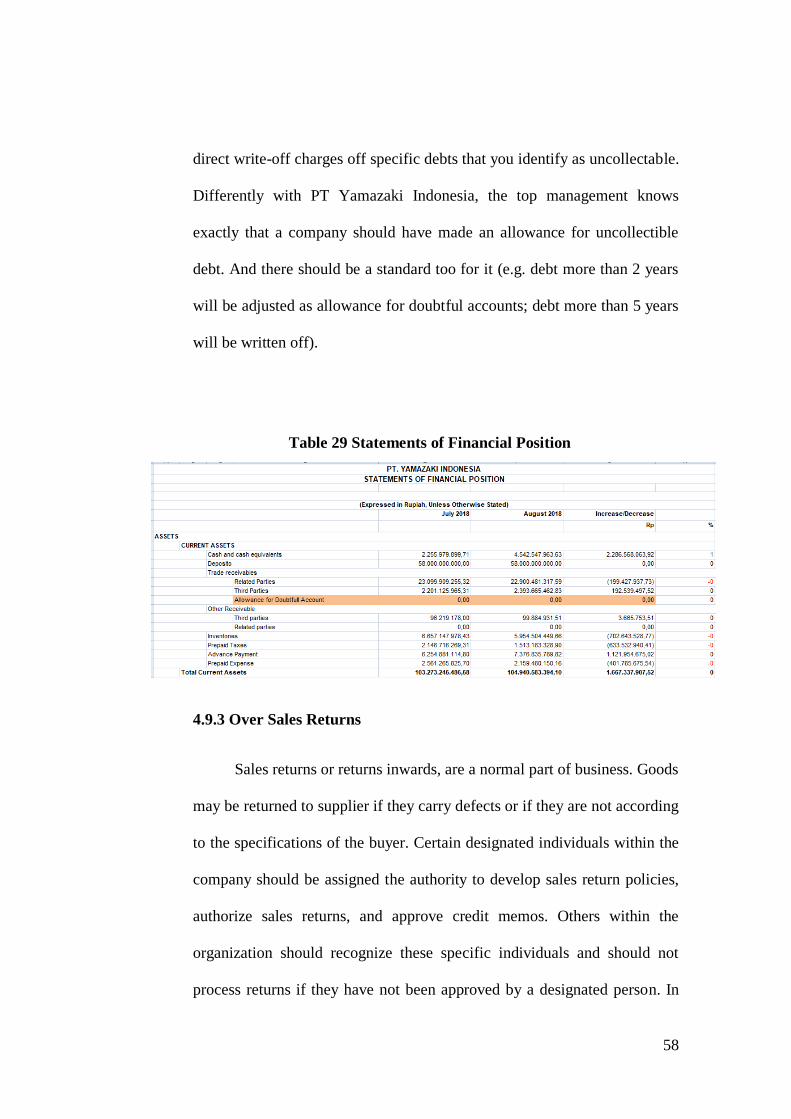
58
direct write-off charges off specific debts that you identify as uncollectable.
Differently with PT Yamazaki Indonesia, the top management knows
exactly that a company should have made an allowance for uncollectible
debt. And there should be a standard too for it (e.g. debt more than 2 years
will be adjusted as allowance for doubtful accounts; debt more than 5 years
will be written off).
Table 29 Statements of Financial Position
4.9.3 Over Sales Returns
Sales returns or returns inwards, are a normal part of business. Goods
may be returned to supplier if they carry defects or if they are not according
to the specifications of the buyer. Certain designated individuals within the
company should be assigned the authority to develop sales return policies,
authorize sales returns, and approve credit memos. Others within the
organization should recognize these specific individuals and should not
process returns if they have not been approved by a designated person. In
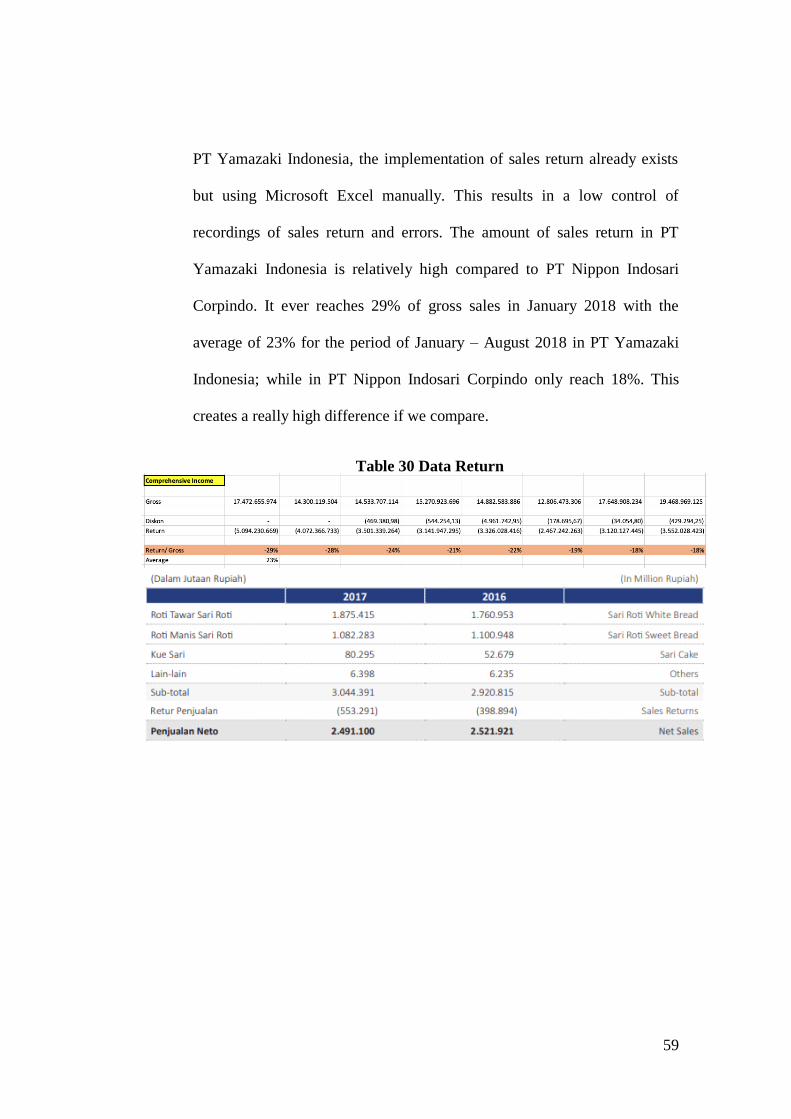
59
PT Yamazaki Indonesia, the implementation of sales return already exists
but using Microsoft Excel manually. This results in a low control of
recordings of sales return and errors. The amount of sales return in PT
Yamazaki Indonesia is relatively high compared to PT Nippon Indosari
Corpindo. It ever reaches 29% of gross sales in January 2018 with the
average of 23% for the period of January – August 2018 in PT Yamazaki
Indonesia; while in PT Nippon Indosari Corpindo only reach 18%. This
creates a really high difference if we compare.
Table 30 Data Return
60
CHAPTER V
CONCLUSION AND RECOMMENDATION
5.1 Conclusion
A. Based on the analysis of the receivable management system, PT Yamazaki
Indonesia has a verbal SOP not yet in writing. Verbally, PT Yamazaki
Indonesia has carried out the process of management, management and control
of accounts receivable based on verbal SOP (Standard Operation Procedure)
that has been set by the company, but in its implementation there are still a
number of things that are not in accordance with the SOP. To mitigate the
problem, the researcher had created the Flowchart for the base of the SOP.
B. Factors influencing the amount of accounts receivable, such as the
percentage of credit sales, Stuck Billing Customer, and collection business, PT
Yamazaki Indonesia have a large amount of receivables in the balance sheet,
mainly influenced by the large percentage of credit sales and collection efforts
undertaken.
C. Based on the analysis of financial performance in the company's financial
statements for the 2015-2017 periods, it shows that the company still has good
financial performance but when compared to PT Nippon Indosari Corpindo, PT
Yamazaki still loses. This is indicated by a number of positive financial ratios.
D. Debt control carried out by PT Yamazaki Indonesia has not run effectively
against the company's cash collection. This is evidenced from the results of the
61
cash conversion cycle analysis which is quite different from the CCC standard
issued by Costa. This means that the amount of receivables held is still quite
slow to convert into cash due to the existence of inhibiting factors such as
billing and not applying credit analysis (verbal) to customers.
5.2 Recommendation
A. PT Yamazaki Indonesia should recruit employees to cover the shortage of
employees in the financial & accounting division, which is expected to improve
performance, especially in the collection of accounts receivable.
B. PT Yamazaki Indonesia needs to improve its credit policy so that the credit
sales system and receivable management can be carried out better and make
appropriate decisions when the accounts receivable have begun to be
hampered.
C. PT Yamazaki Indonesia should do a system record return instead of using a
manual system (especially for return)
D. PT Yamazaki Indonesia should follow PSAK 55 / IAS 39, while the
presentation is regulated in PSAK 50 / IAS 32 and PSAK 1 / IAS 1 which
states that all the receivables should be provisioned.
E. Preferably, Receivable Accounts are recorded neatly and neatly by using a
system so that it creates a good presentation for investors.
62
REFERENCE
Adusei, C. (2017). Accounts receivables management: Insight and challenges.
International Journal of Finance & Banking Studies, 6(1), 101-112.
doi:http://remote-lib.ui.ac.id:2090/10.20525/ijfbs.v6i1.668
Cummings, J. (2005). Revenue and receivables management. Business
Finance, 11 (11), 62. Retrieved from https://remote-
lib.ui.ac.id:2155/docview/210951320?accountid=17242
Gifis, S. H. (01/01/2016). Dicionary of legal terms: Defiitions and explantions for
non-lwyers Brron's Educatioal Seris.
Haibo Yao, Yiling Deng, (2018) "Managerial incentives and accounts receivable
management policy", Managerial Finance, Vol. 44 Issue: 7, pp.865-884,
https://remote-lib.ui.ac.id:2067/10.1108/MF-05-2017-0148
Jumingan. 2008. Analysis of Financial Statements. PT. Earth Literacy. Jakarta.
Keown, A.J. 2001. Fundamentals of Financial Management (translation).
Salemba Four. Jakarta.
Keown, A.J. 2010. Financial Management: Principles and Applications, Editions
Tenth, Volume 2. PT. Index. Jakarta.
Kurian, G. T. (01/01/2013). The AMA dictionary of business and
managementAMACOM.
63
Mangkusubroto, K. 1983. Decision Analysis (Deep Systems Approach Business
and Project Management). BASKARA Publisher. Bandung.
Mattjik, A.A and IM. Sumertajaya. 2002. Design Experiments with SAS and
Minitab applications. Bogor. Bogor Agricultural Institute.
Maya, S. 2005. Effectiveness of Debt Management and Factors Affecting the
Amount of Receivables from PT. Indonesian Classification Bureau
(Persero). Thesis in the Department of Management, Faculty of Economics
and Management. Bogor Agricultural Institute.
Palia, D., & Sopranzetti, B. J. (2004). Securitizing accounts receivable. Review of
Quantitative Finance and Accounting, 22(1), 29-38. Retrieved from
https://remote-lib.ui.ac.id:2155/docview/210311749?accountid=17242
Riley, Mark E., C.P.A., PhD., & Pasewark, William R,C.P.A., PhD. (2009).
Assessing the allowance for doubtful accounts. Journal of
Accountancy, 208(3), 40-44,12,14. Retrieved from https://remote-
lib.ui.ac.id:2155/docview/206788658?accountid=17242
Santosa, P.B. 2005. Statistical Analysis with Microsoft Excel and SPSS. Publisher
ANDI. Yogyakarta.
Salek, J. G. (2007). 7 steps to optimize A/R management. Business Finance, 13
(4), 42-46. Retrieved from https://remote-
lib.ui.ac.id:2155/docview/211073793?accountid=17242
64
Sitterly, R. (1991). A credit manager's guide to objective A/R analysis: Part
II.Business Credit, 93(10), 18. Retrieved from https://remote-
lib.ui.ac.id:2155/docview/230122946?accountid=17242
Sagner, James S. (11/08/2010). "Accounts Receivable and Working Capital
Issues" in Essentials of working capital management (0-470-87998-X, 978-
0-470-87998-6), (p. 81).Hoboken, NJ, USA: John Wiley & Sons, Inc.
Stice, E.K. 2004. Intermediate Accounting, Issue 15, Book One. Salemba Empat.
Jakarta.
Stice, E.K. 2005. Intermediate Accounting, Issue 15, Book Two. Salemba Empat.
Jakarta.
Warren, C.S. 2005. Introduction to Accounting, 21st Edition, Book One, Salemba
Empat. Jakarta.

65
APPENDICES (INTERVIEW)
1. Engagement with Director, Manager & Supervisor:
The Researcher : Good morning to all of you (Mr. Frans, Mr. Jun and Ms.
Riska), I’d like to ask you several things regarding the research
that will be conducted here. First of all, I’d like to introduce
myself, my name is Jose Bonifacio Pakpahan, I’m from
President University Majoring in Accounting.
Mr. Frans : What do you want to ask, Jose?
The Researcher : So, Honestly I’m going to be conducting my research in
Accounting and Finance department, specifically in Accounts
Receivable.
Mr. Frans : Oh well, you can do it. Later Ms. Riska and Mr. Jun will help
you in gathering the data and things that you need for your
research.
The Researcher : Wow, that’s a very kind of you! Anyways, if possible, I’m
going to start the research next Monday, and if there’s anything
I can do to help, I will surely help, because PT Yamazaki
Indonesia has helped me as well right
Mr. Jun : Yes, you can start Jose, what data do you need?
66
The Researcher : I will need Financial Statements, Aging Schedule, Listing
Invoice and many documents related to Accounts Receivable.
The rules and regulations and SOP will be good too.
Ms. Riska : Unfortunately we don’t have SOP yet, maybe if you want, you
can make it for us. For the past couple years, PT Yamazaki
Indonesia only uses verbal SOP not written/ drawn one.
The Researcher : I will surely make it.
Mr. Frans : Okay Jose, Is there anything more you want to say or ask?
The Researcher : No sir, I think that’s all. Thank you so much.
2. Interview with Accounts Receivable (Supervisor):
The Researcher : Can you explain to me regarding the business process of
Accounts Receivable from beginning until the end?
Ms. Riska : Technically, PT Yamazaki Indonesia has procedures for
making credit sales to customers. The procedure carried out
involves several divisions within the company's management
functions. The most involved divisions are the marketing,
purchasing division and financial & accounting division. The
sales procedure begins with the issuance of a price quote letter
(Surat Penawaran Harga) from the marketing division to
customers. Then the customer will give a reply in the form of a
67
letter ordering goods or a PO (Purchase Order) to the marketing
division of PT Yamazaki Indonesia. After that, the PO letter is
received and processed by negotiation between the customer and
PT Yamazaki Indonesia. Negotiations are carried out by both
parties until they find a specific agreement, especially in terms
of payment and discount times. Then the agreement that has
been obtained is outlined in the form of an agreement signed by
both parties. After obtaining an agreement, then the ordered
product is ready to be sent. When the goods have been sent and
received by the customer, then the financial & accounting
division begins preparing documents to issue invoice invoices.
When an invoice is issued, there is usually a sales discount, but
in this case there is an exception namely the absence of sales
discounts for the whole. Sales discounts are only given to
certain customers who have a special relationship with PT
Yamazaki Indonesia, namely the Holding Company of the
company itself.
The Researcher : Ohh, so it’s like that. I want to ask regarding the control
system in Accounting and Finance department specifically in
Accounts Receivable. What do you think is the greatest
contributor of weakness here?

68
Ms. Riska : I think in PT Yamazaki Indonesia there is no weakness in
Accounting and Finance department, but if you want to know
about other things maybe I can help. Such manual recording of
Sales Return that is done by Toro, is I think that it’s not good.
Because several times Accounts Receivable team is confused
about the incomplete data for revising the returns and so on and
so forth.
The Researcher: Are there anything else you want to say?
Mss. Riska : I think that’s all from me, just a little thing to say that PT
Yamazaki Indonesia has done a great job in collecting the
receivables.
The Researcher : Well thank you very much, I appreciate your time and I’ll try
to check deeper later when I see the data. Thank you very much
for your favorable time.

69
APPENDICES (DOCUMENTATION)
1. Invoice
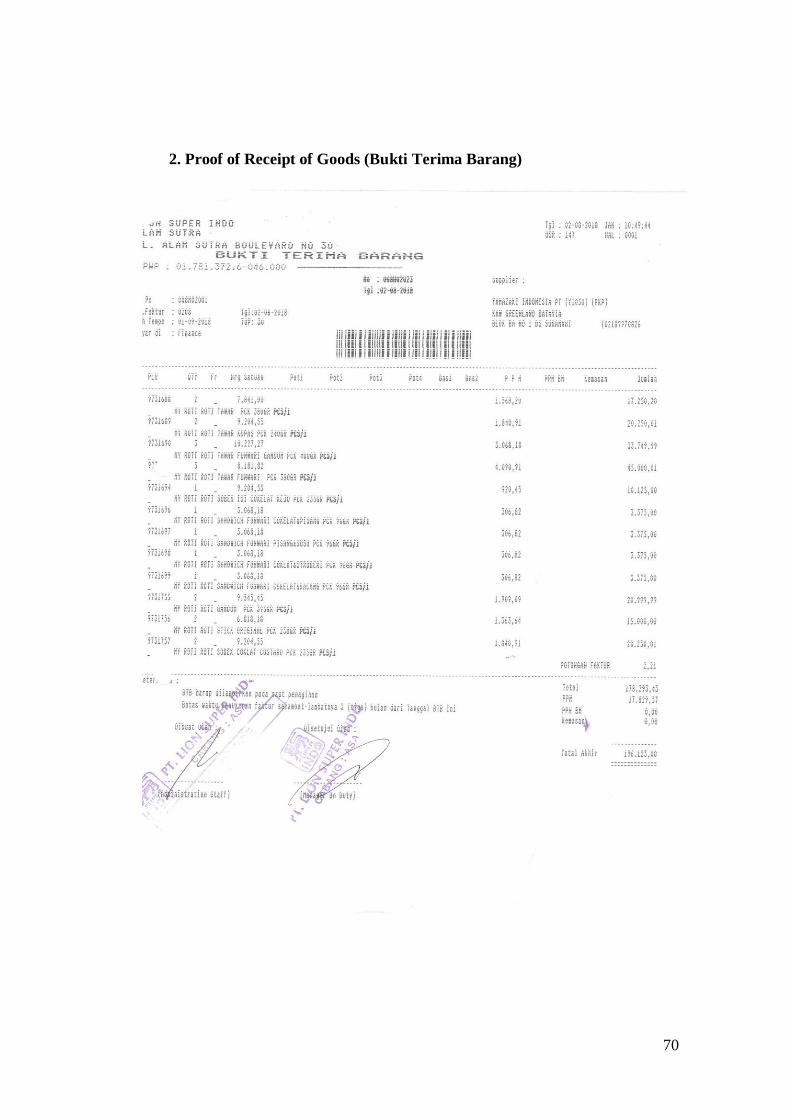
70
2. Proof of Receipt of Goods (Bukti Terima Barang)
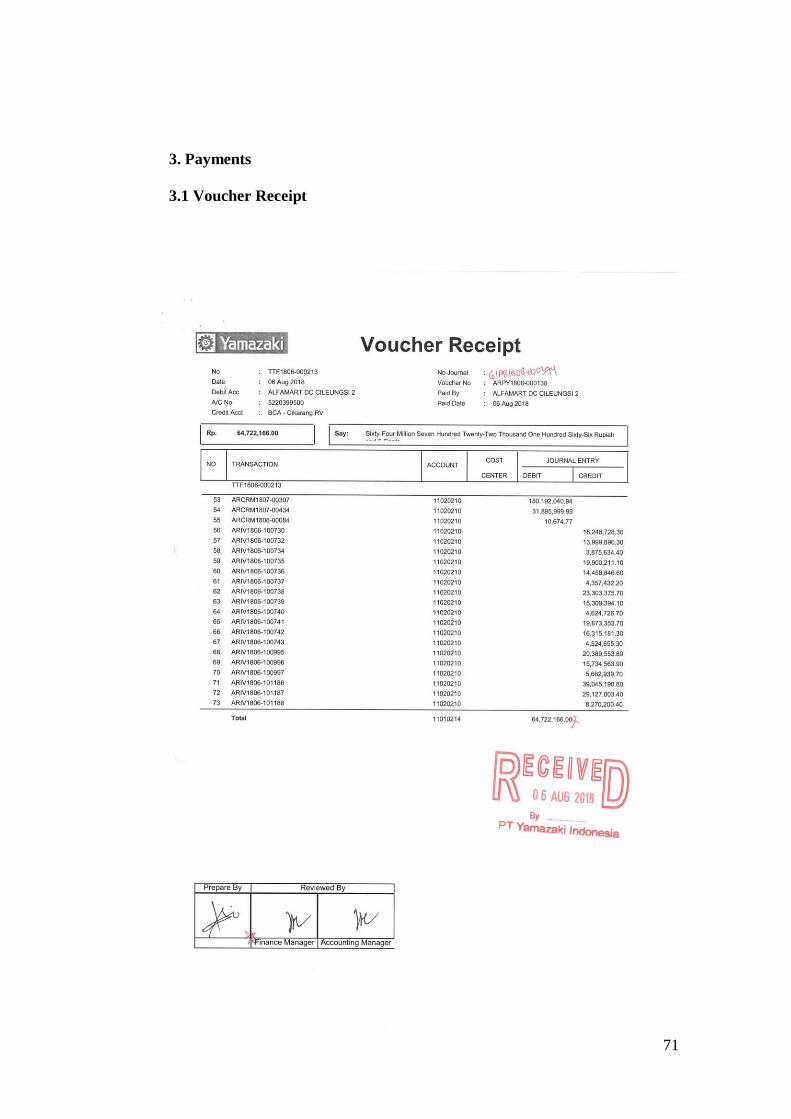
71
3. Payments
3.1 Voucher Receipt
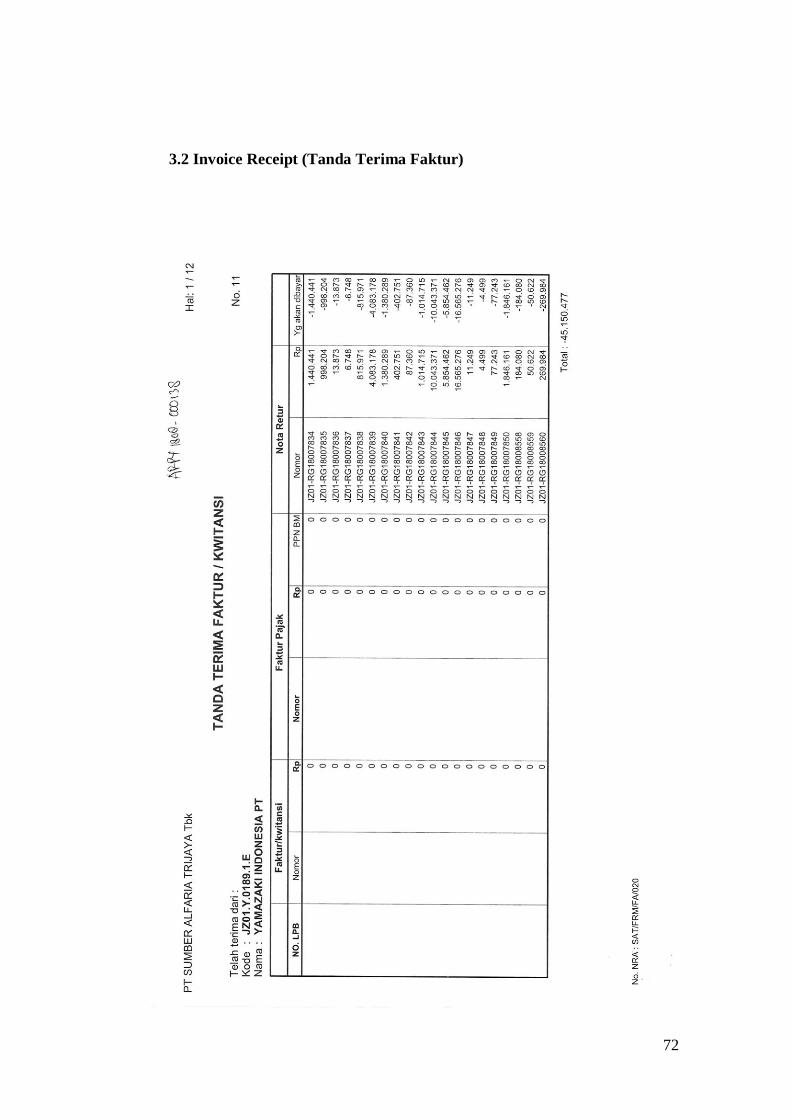
72
3.2 Invoice Receipt (Tanda Terima Faktur)

73
3.3 Invoice Receipt (Compiled)

74
4. Delivery Notes
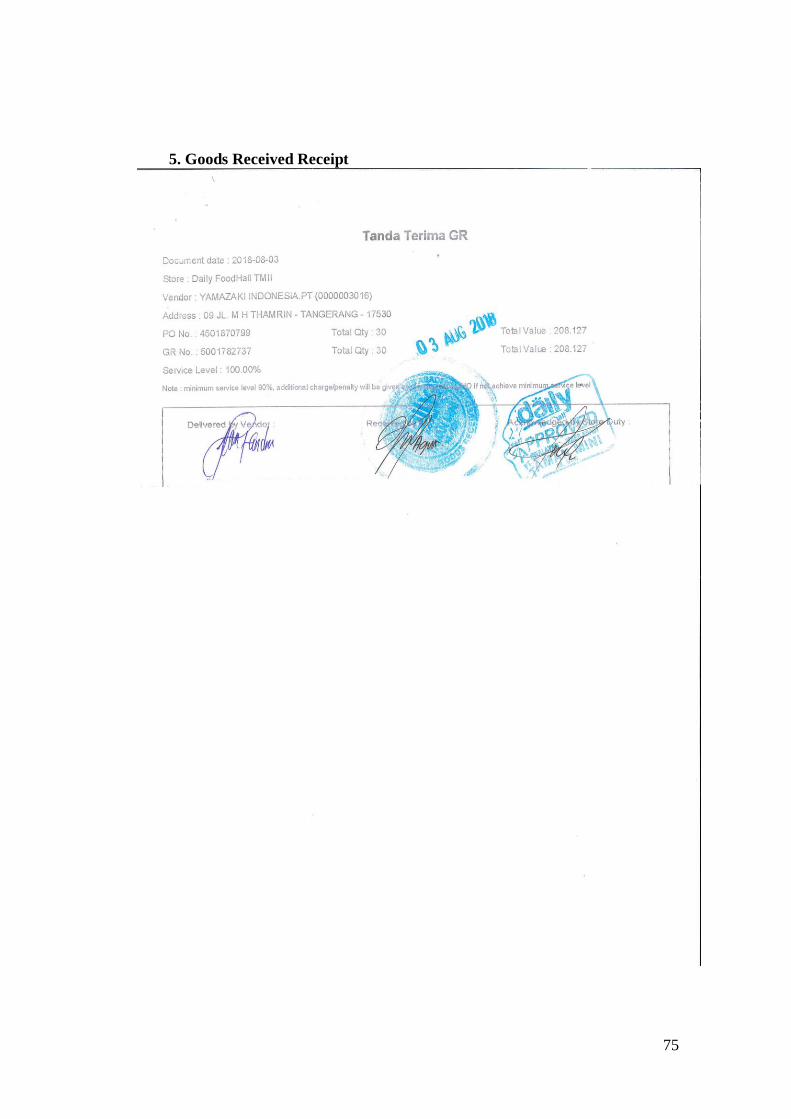
75
5. Goods Received Receipt
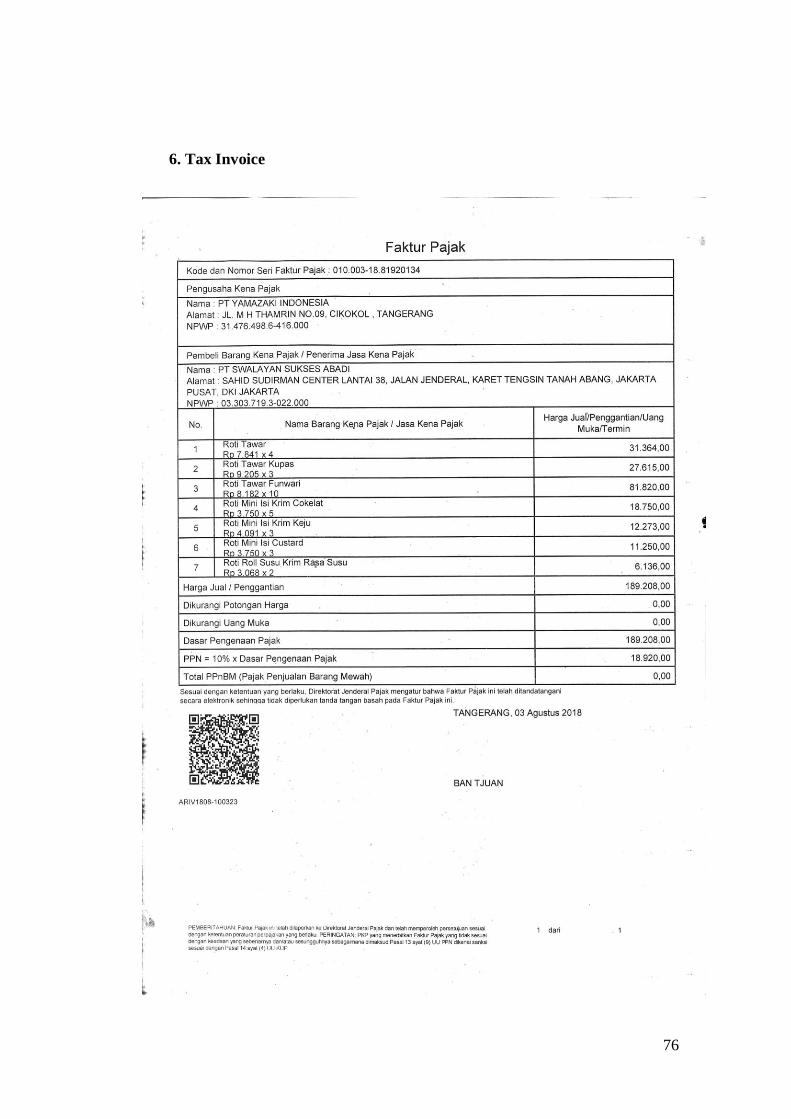
76
6. Tax Invoice
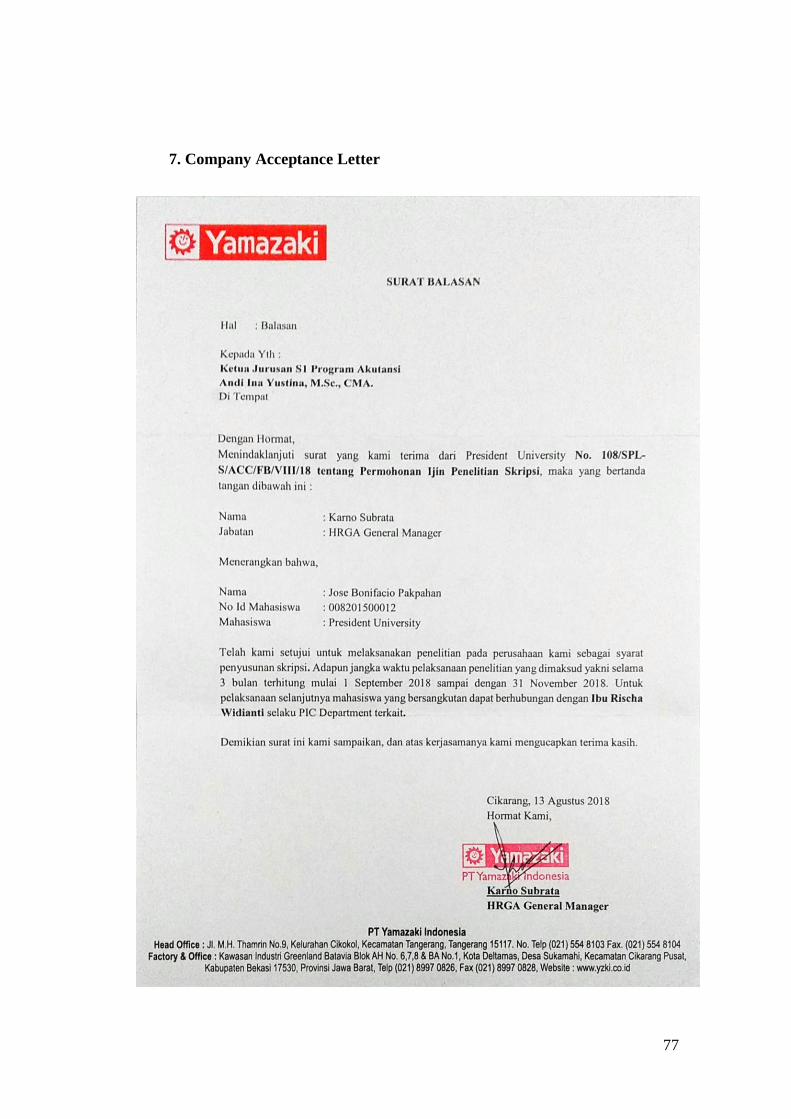
77
7. Company Acceptance Letter
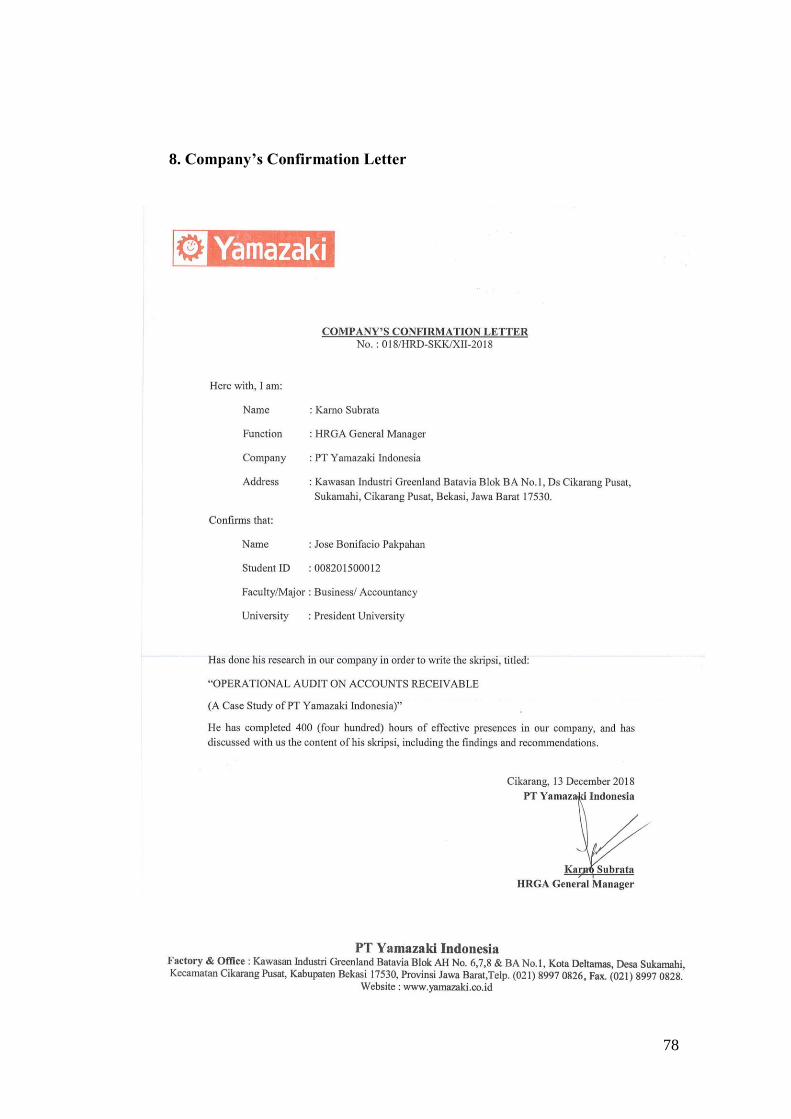
78
8. Company’s Confirmation Letter

79
9. The researcher with Mr. Frans (Director)
10. The researcher with Mr. Karno (HRGA General Manager)
80
11. The researcher with Finance, Accounting, Sales, Marketing and
Distribution Staff
12. The researcher with Mr. Furumi (Director)

81
13. The researcher with Mr. Ichiro Saito (President Director)