operational intelligence pre launch, current reality and next generation
TRANSCRIPT

OPERATIONAL INTELLIGENCEPre launch, current reality and next generation

Technology Reports
Insights
Projects and Activity
One Version Of Truth
Mobile Asset Inventory
O u t l e t m a p r e p o r ti n g

Insights
Instore Routine Project
- SS (Planogram ) - SOS (Share Of Shelf)- Proposition (Proposition)
Call Cycle Project
- Field Force - Shops Plan
FOS Dashboard
Survey Module e.g. ROD Competition Unilever Share On ROD
OSA SKU Unavailability
OSA
InputCOMPOSA
OutputReports/Dashboard
Projects and Activity
Planorama
Reporting Overview
Dynamic Reporting Model
ROD Competition
OSA
Stolen & Damages

Technology Reports
PS-Reports REPORT NAME DAILY WEEKLY MONTHEnhance FOS Dashboard Start of Day-National ••• Start of Day-Zonal ••• Start of Day- Area Manager ••• Active/Inactive Field Force Details ••• Accepted Vs Actual Call Compliance-National ••• Accepted Vs Actual Call Compliance-ZMM ••• Accepted Vs Actual Call Compliance-AMM ••• Accepted Vs Actual Call Compliance-Monthly Report •••Image Report ••• GAP-SKU-National GAP-SKU-Zonal
Gap SKU Report -AMM ••• ••• •••
GAP SKU Report -FMM Call Cycly Analyzer(Callage Compliance) ••• •••Instore Routine- Checkedstore ••• •••Perfect Store Tracker - Compliance ••• •••AMM CheckedStore Summary ••• •••AMM CheckedStore Details ••• •••FMM CheckedStore Summary ••• •••FMM CheckedStore Details ••• •••
FM Checklist-Perfect store Checklist-Field Manager (By Category) ••• •••
FM Checklist-Perfect store Checklist-Field Manager (By Element) ••• •••
AM Checklist-Perfect store Checklist-Field Manager (By Category) ••• •••
AM Checklist-Perfect store Checklist-Field Manager (By Element) •••
• Enhanced FOS Dashboard tracking (Field Force , Region, distributors and AMM Level)• All Reports Bust till FMM Level daily, weekly and monthly.• Web Portal for backup. • Dynamic Reporting Model (
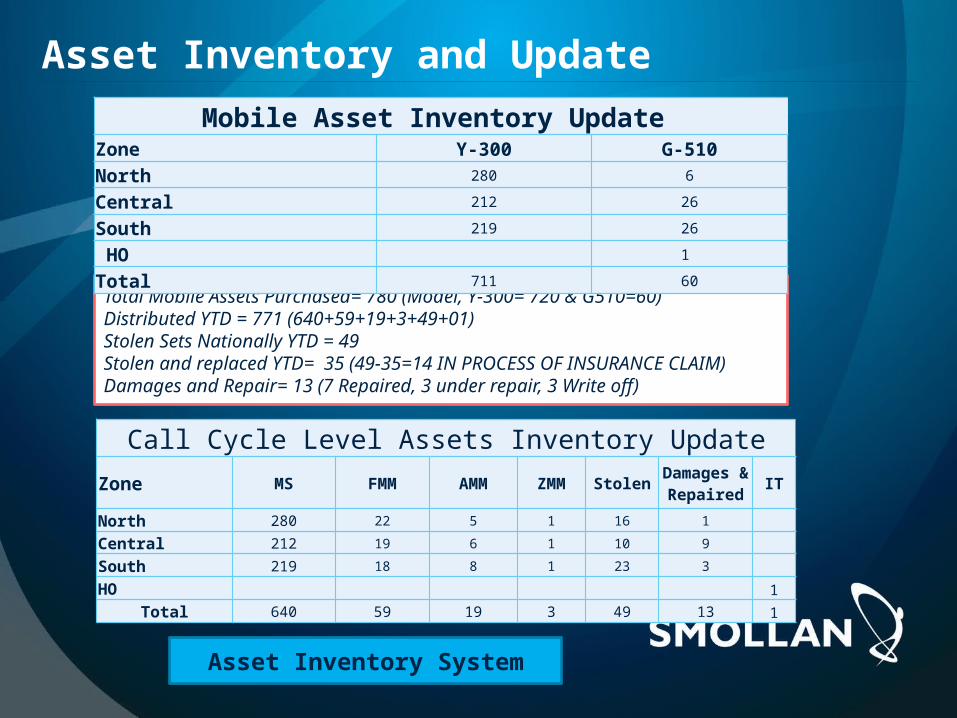
Asset Inventory and Update
Total Mobile Assets Purchased= 780 (Model, Y-300= 720 & G510=60)Distributed YTD = 771 (640+59+19+3+49+01)Stolen Sets Nationally YTD = 49Stolen and replaced YTD= 35 (49-35=14 IN PROCESS OF INSURANCE CLAIM)Damages and Repair= 13 (7 Repaired, 3 under repair, 3 Write off)
Mobile Asset Inventory Update Zone Y-300 G-510North 280 6Central 212 26South 219 26 HO 1 Total 711 60
Call Cycle Level Assets Inventory UpdateZone MS FMM AMM ZMM Stolen Damages &
Repaired IT
North 280 22 5 1 16 1 Central 212 19 6 1 10 9 South 219 18 8 1 23 3 HO 1
Total 640 59 19 3 49 13 1
Asset Inventory System

Outlet map reporti ng 2015
Stores to be colour coded for V Perfect vs N Perfect
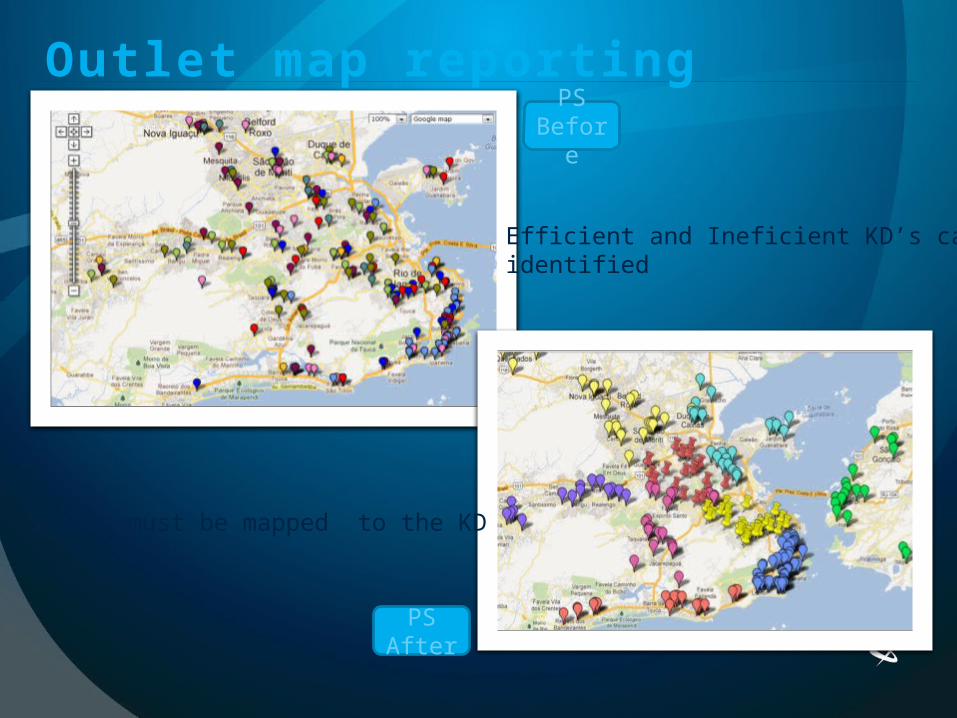
Outlet map reporti ngPS
Before
PS After
Stores must be mapped to the KD
Efficient and Ineficient KD’s can be identified
Outlet map reporti ng
Stores must be mapped to the KD