operational monitoring of us croplands with landsat 8 ... · sentinel-2 vs landsat 7 & 8...
TRANSCRIPT
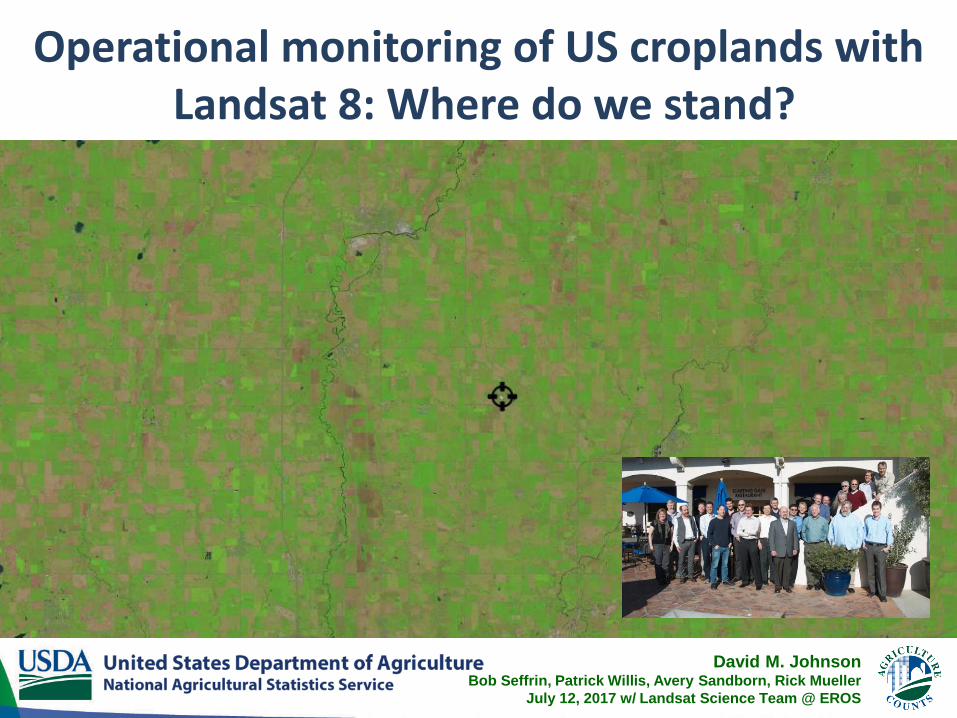
Operational monitoring of US croplands withLandsat 8: Where do we stand?
David M. JohnsonBob Seffrin, Patrick Willis, Avery Sandborn, Rick Mueller
July 12, 2017 w/ Landsat Science Team @ EROS

2
Most popular crop reports from NASS
Annually – end of June
Monthly - noon ~ 10th day
Weekly – 4PM ~ Mondays

A Little Math
640 ac of corn * 174.6 bu/ac * 3.80 $/bu = $424,627.20

A Lot of Math
86,748,000 ac of corn * 174.6 bu/ac * 3.80 $/bu = $57,555,563,040.00
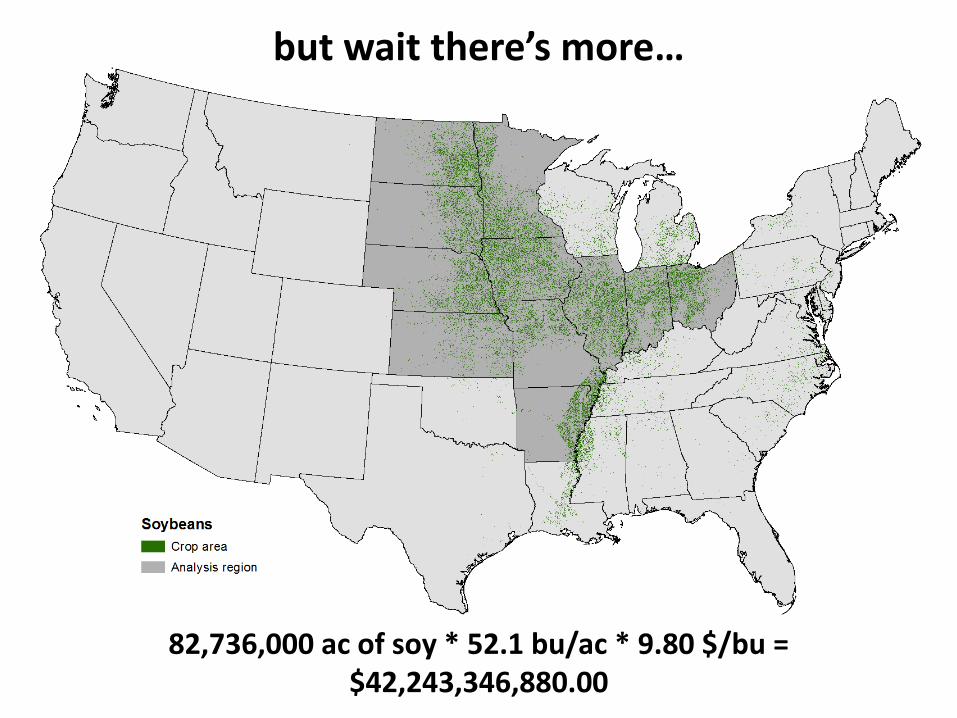
but wait there’s more…
82,736,000 ac of soy * 52.1 bu/ac * 9.80 $/bu = $42,243,346,880.00

and pushing US crop value over $100B
30,222,000 ac winter wheat * 55.3 bu/ac * 5.30 $/bu = $8,857,766,000.00
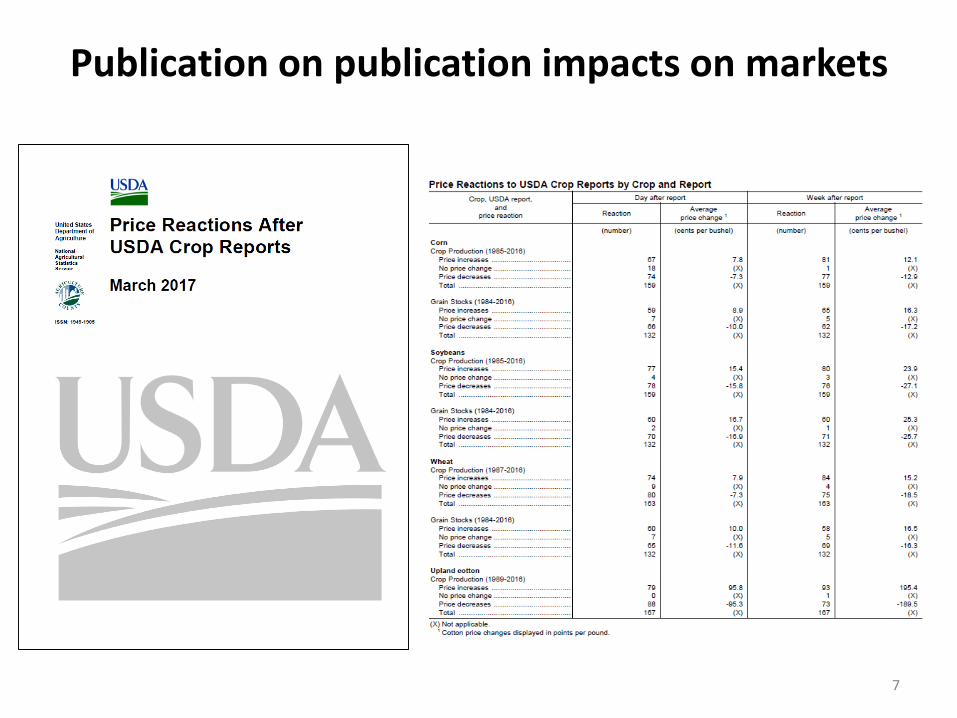
Publication on publication impacts on markets
7

Land cover mapping - Cropland Data Layer (CDL)
* 2008 – 2016 publically available* 2017 in the works* 2008 and 2009 being reprocessed from 56m to 30m
8

9
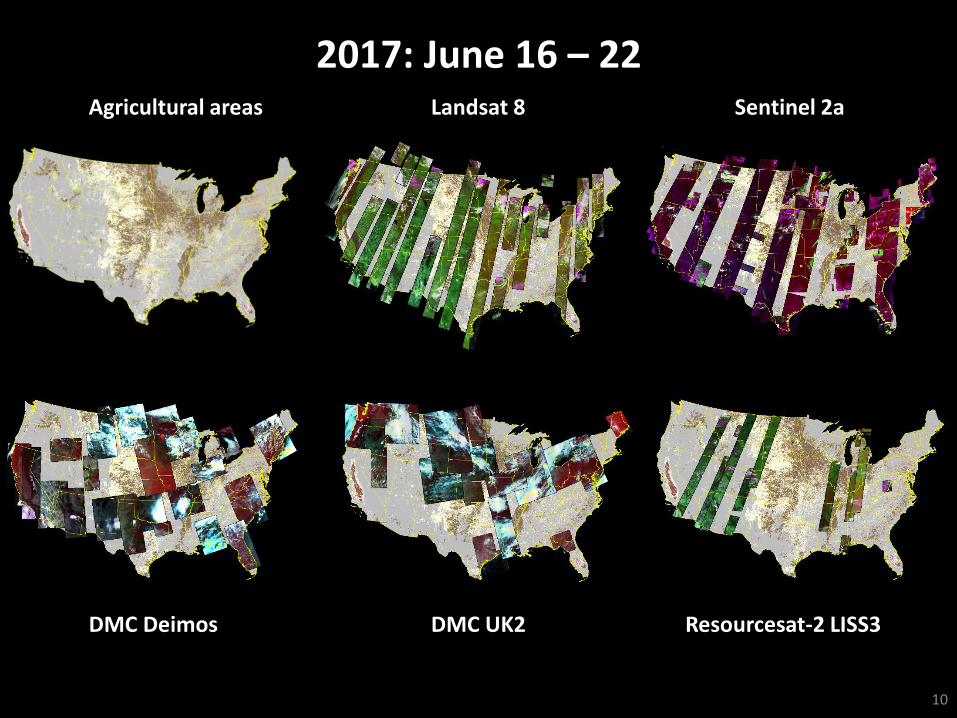
2017: June 16 – 22
10
Agricultural areas Landsat 8 Sentinel 2a
DMC Deimos DMC UK2 Resourcesat-2 LISS3
2017: June 16 – 22
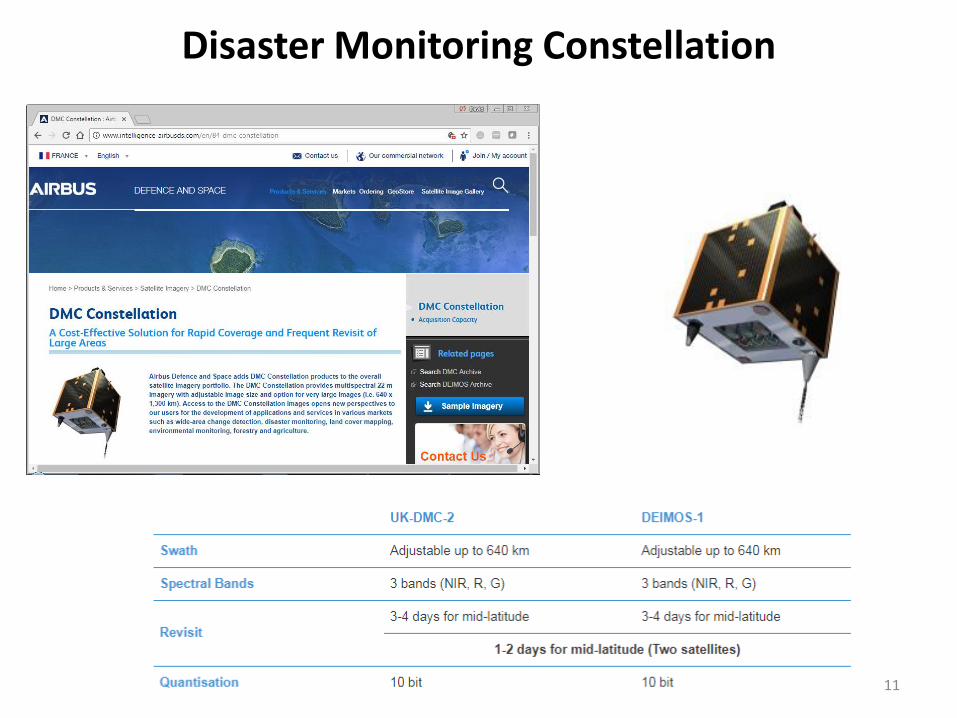
Disaster Monitoring Constellation
11
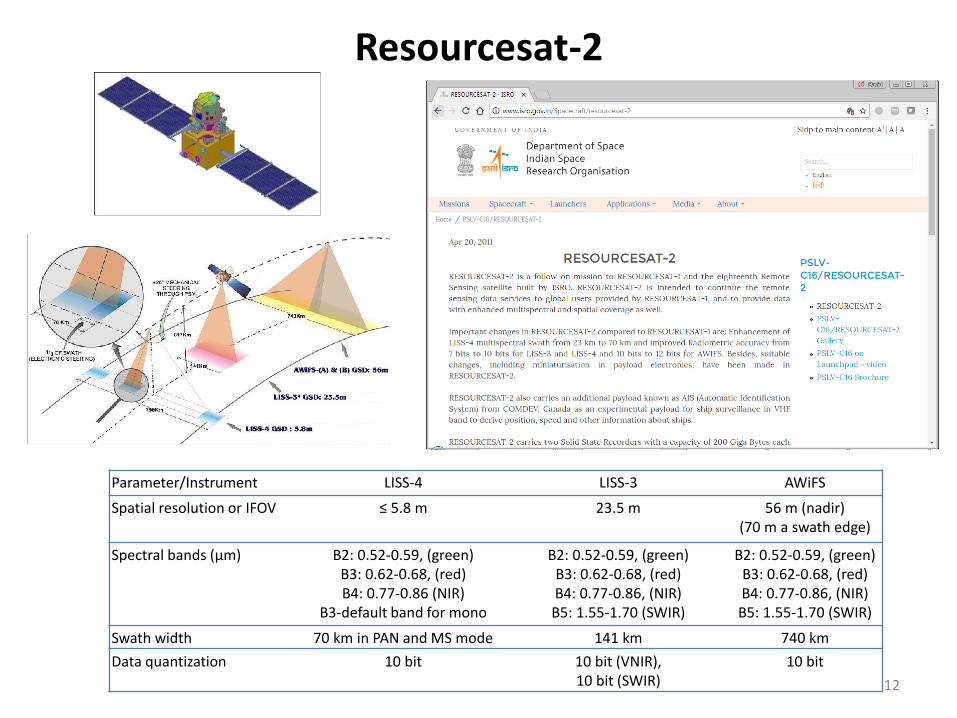
Resourcesat-2
12
Parameter/Instrument LISS-4 LISS-3 AWiFS
Spatial resolution or IFOV ≤ 5.8 m 23.5 m 56 m (nadir)(70 m a swath edge)
Spectral bands (µm) B2: 0.52-0.59, (green)B3: 0.62-0.68, (red)B4: 0.77-0.86 (NIR)
B3-default band for mono
B2: 0.52-0.59, (green)B3: 0.62-0.68, (red)B4: 0.77-0.86, (NIR)B5: 1.55-1.70 (SWIR)
B2: 0.52-0.59, (green)B3: 0.62-0.68, (red)B4: 0.77-0.86, (NIR)B5: 1.55-1.70 (SWIR)
Swath width 70 km in PAN and MS mode 141 km 740 km
Data quantization 10 bit 10 bit (VNIR),10 bit (SWIR)
10 bit
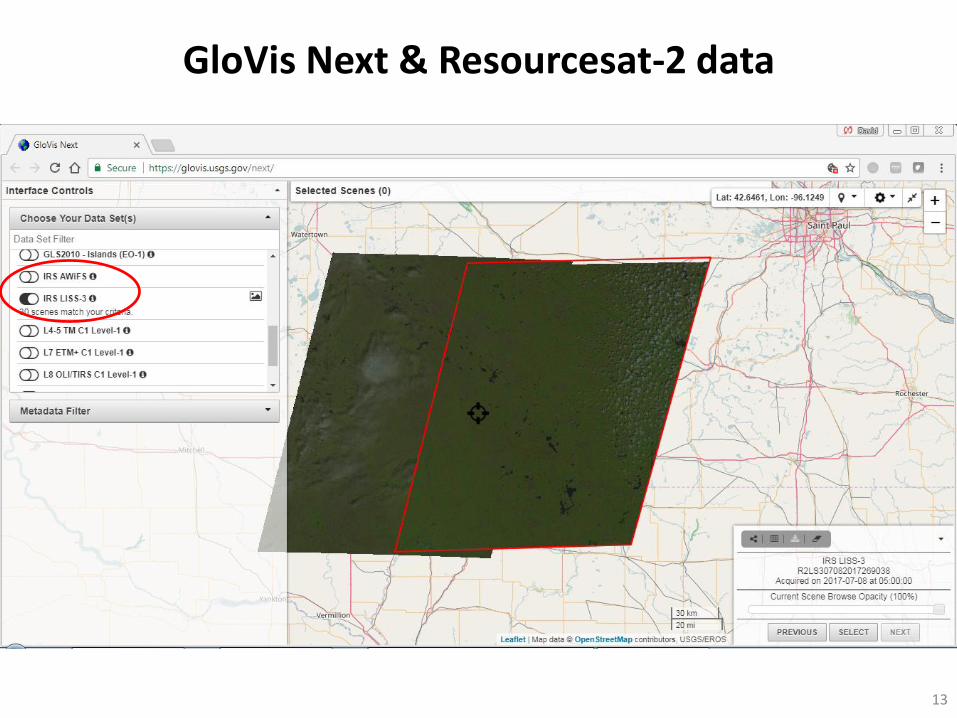
13
GloVis Next & Resourcesat-2 data

Sentinel-2 vs Landsat 7 & 8 spectral bands
14
System Bands SourceDeimos, UK2 1, 2, 3 AirbusLandsat 8 3, 4, 5, 6, 9, 10 USGSSentinel 2a 3, 4, 8, 10, 11, 12 AWSLISS3 2, 3, 4, 5 USGS
NASS Utilization
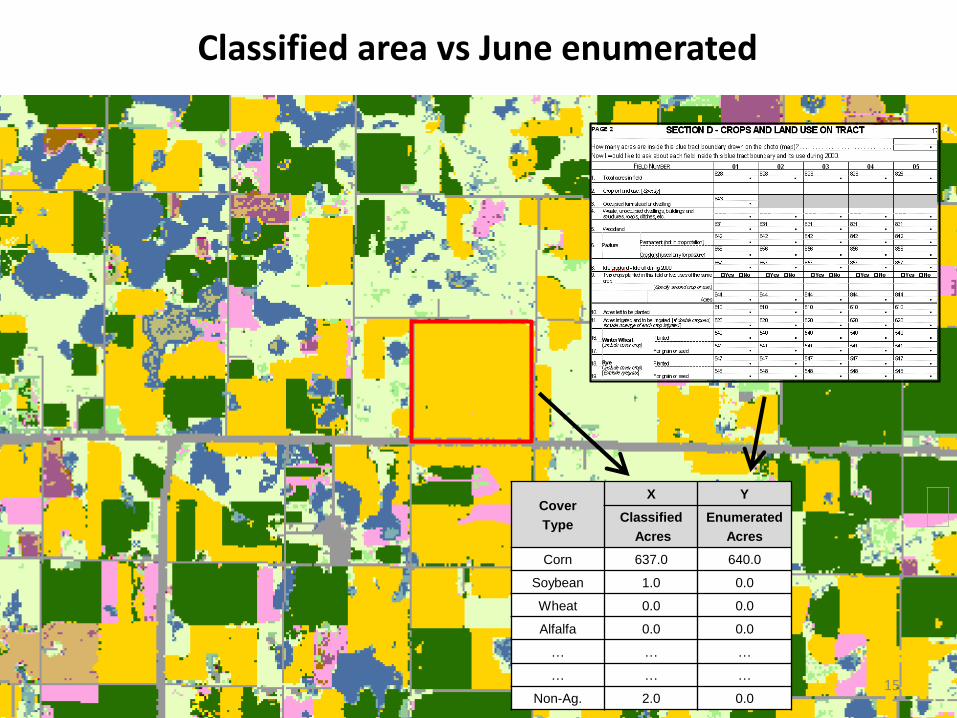
Classified area vs June enumerated
15
Cover
Type
X Y
Classified
Acres
Enumerated
Acres
Corn 637.0 640.0
Soybean 1.0 0.0
Wheat 0.0 0.0
Alfalfa 0.0 0.0
… … …
… … …
Non-Ag. 2.0 0.0
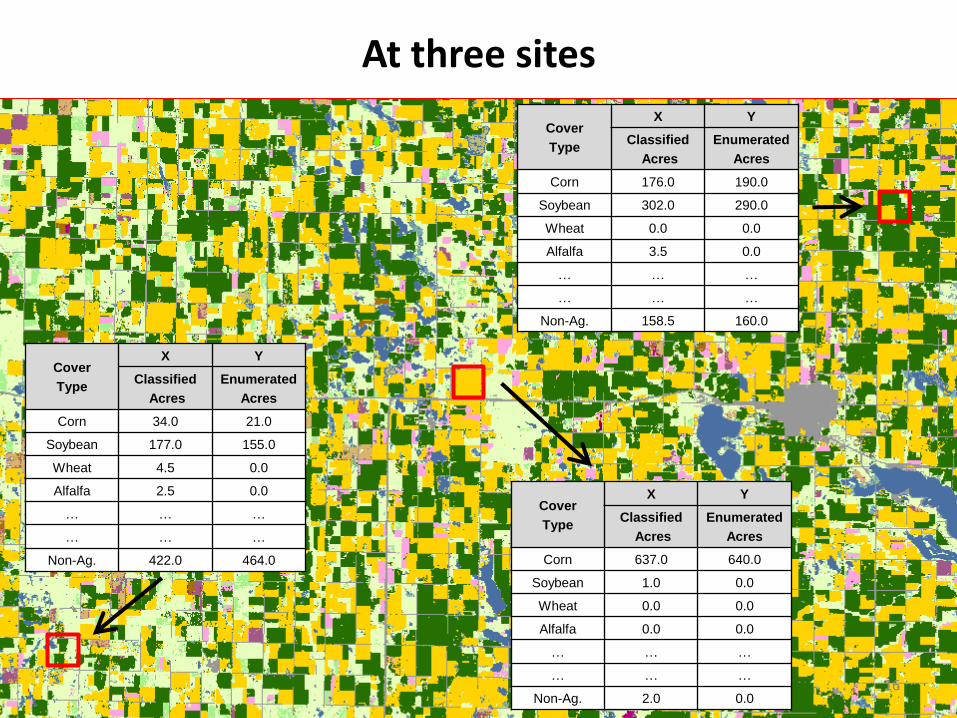
At three sites
16
Cover
Type
X Y
Classified
Acres
Enumerated
Acres
Corn 637.0 640.0
Soybean 1.0 0.0
Wheat 0.0 0.0
Alfalfa 0.0 0.0
… … …
… … …
Non-Ag. 2.0 0.0
Cover
Type
X Y
Classified
Acres
Enumerated
Acres
Corn 176.0 190.0
Soybean 302.0 290.0
Wheat 0.0 0.0
Alfalfa 3.5 0.0
… … …
… … …
Non-Ag. 158.5 160.0
Cover
Type
X Y
Classified
Acres
Enumerated
Acres
Corn 34.0 21.0
Soybean 177.0 155.0
Wheat 4.5 0.0
Alfalfa 2.5 0.0
… … …
… … …
Non-Ag. 422.0 464.0

10 sites and so forth….
17

Acreage Regression Estimation
18We don’t just “pixel count” from CDL to estimate acreage

19
NASS SAS-based Regression Estimate system

Sentinel-2a study area (gray)
20

30m Sentinel-2a 30m Landsat 8
93.9 93.8
Classification comparison #1
21

10m Sentinel-2a 15m Sentinel-2a
94.2 94.0
Classification comparison #2
22

10 S2 red-edge bands(5,6,7) 10m S2 20m bands (5,6,7,8a, 11, 12)
92.5
93.8
Classification comparison #3
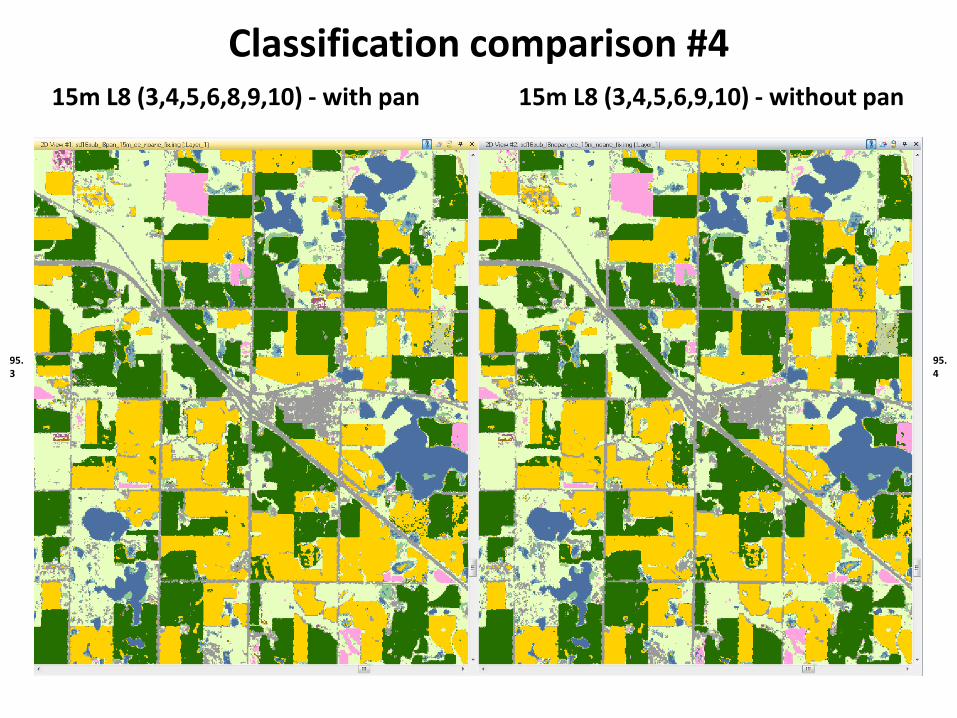
15m L8 (3,4,5,6,8,9,10) - with pan 15m L8 (3,4,5,6,9,10) - without pan
95.3
95.4
Classification comparison #4

30m Sentinel-2a 30m Sentinel-1 Radar
Classification comparison – bonus!
25
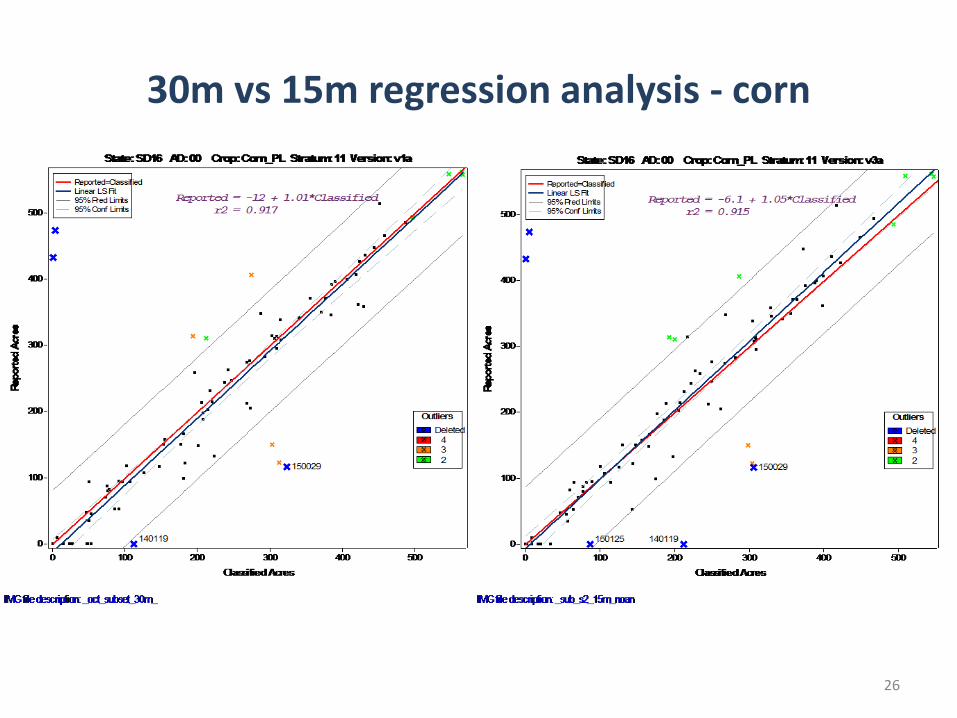
30m vs 15m regression analysis - corn
26

30m vs 15m regression analysis - soybeans
27

60m vs 15m regression analysis - corn
28

60m vs 15m regression analysis - soybeans
29
30
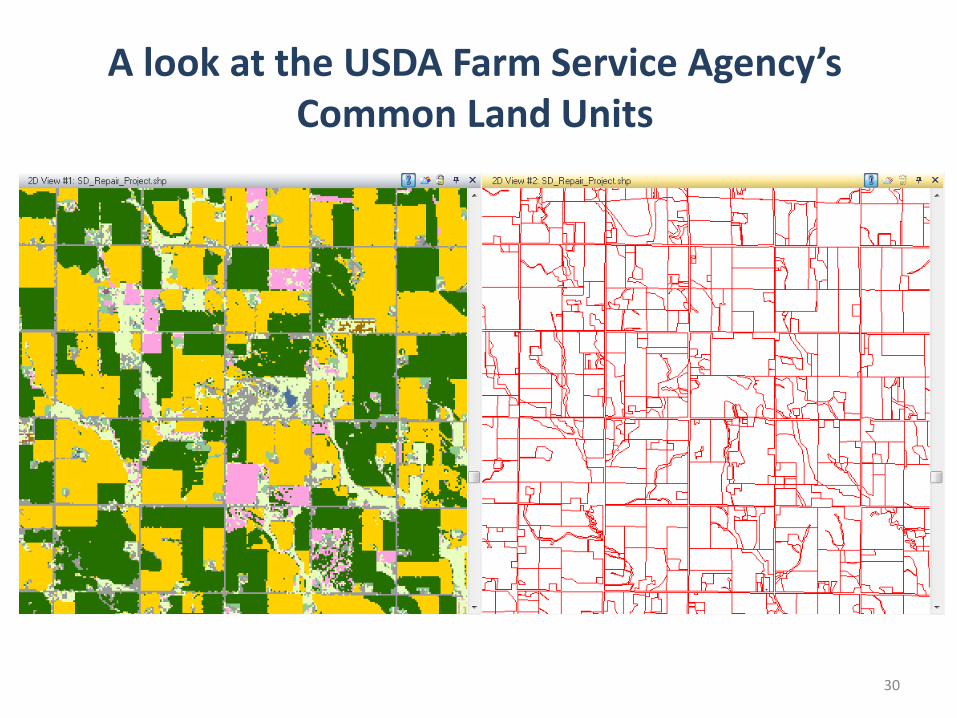
A look at the USDA Farm Service Agency’s Common Land Units

-
200,000
400,000
600,000
800,000
1,000,000
1,200,000
1,400,000A
L
AR
AZ
CA
CO CT
DE FL GA IA ID IL IN KS
KY
LA MA
MD
ME
MI
MN
MO
MS
MT
NC
ND
NE
NH NJ
NM NV
NY
OH
OK
OR
PA RI
SC SD TN TX UT
VA VT
WA
WI
WV
WY
Total Number of CLU Crop Polygons

0%
10%
20%
30%
40%
50%
60%
70%
80%
90%
100%A
L
AR
AZ
CA
CO CT
DE FL GA IA ID IL IN KS
KY
LA MA
MD
ME
MI
MN
MO
MS
MT
NC
ND
NE
NH NJ
NM NV
NY
OH
OK
OR
PA RI
SC SD TN TX UT
VA VT
WA
WI
WV
WY
% of CLU Crop Polygons that Contain at Least 1 30m Pixel
30m
0%
10%
20%
30%
40%
50%
60%
70%
80%
90%
100%A
L
AR
AZ
CA
CO CT
DE FL GA IA ID IL IN KS
KY
LA MA
MD
ME
MI
MN
MO
MS
MT
NC
ND
NE
NH NJ
NM NV
NY
OH
OK
OR
PA RI
SC SD TN TX UT
VA VT
WA
WI
WV
WY
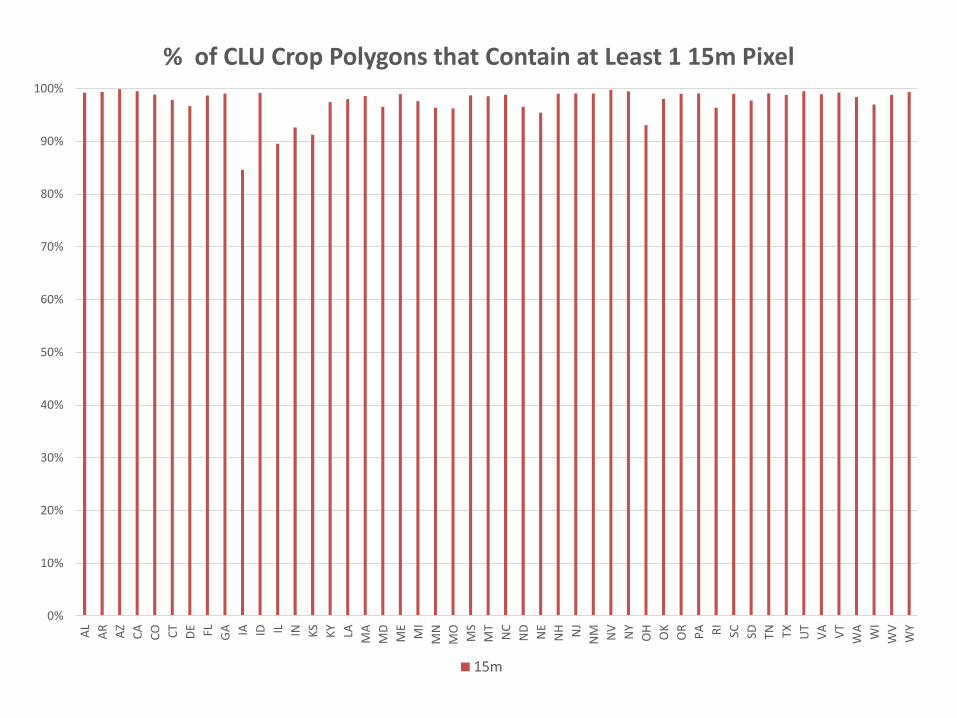
% of CLU Crop Polygons that Contain at Least 1 15m Pixel
15m
0%
10%
20%
30%
40%
50%
60%
70%
80%
90%
100%A
L
AR
AZ
CA
CO CT
DE FL GA IA ID IL IN KS
KY
LA MA
MD
ME
MI
MN
MO
MS
MT
NC
ND
NE
NH NJ
NM NV
NY
OH
OK
OR
PA RI
SC SD TN TX UT
VA VT
WA
WI
WV
WY
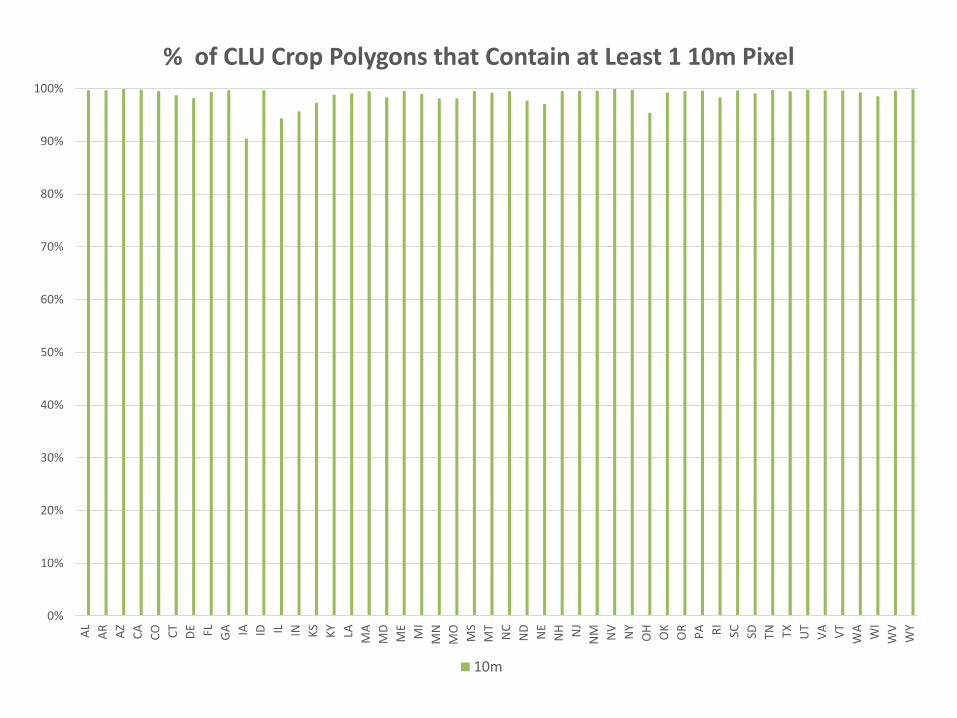
% of CLU Crop Polygons that Contain at Least 1 10m Pixel
10m

0%
10%
20%
30%
40%
50%
60%
70%
80%
90%
100%A
L
AR
AZ
CA
CO CT
DE FL GA IA ID IL IN KS
KY
LA MA
MD
ME
MI
MN
MO
MS
MT
NC
ND
NE
NH NJ
NM NV
NY
OH
OK
OR
PA RI
SC SD TN TX UT
VA VT
WA
WI
WV
WY
% of CLU Crop Polygons that Contain at Least 1 x-sized Pixel
250m 375m 500m

% Pixel Containment National Summary
Cropland CLUs
10m 97.9
15m 96.0
30m 88.5
250m 10.9
375m 3.3
500m 1.7
Numerous questions about the evolving Grassland <–> Cropland boundary
37
Cox, C., Rundquist, S., 2013. Going, Going, Gone! Environmental Working Group, Washington, DC.
Gelfand, I., Sahajpal, R., Zhang, X., Izaurralde, R.C., Gross, K.L., Robertson, G.P., 2013. Sustainable bioenergy production from marginal lands in the US
Midwest. Nature 493, 514–517.
Johnston, C.A., 2014. Agricultural expansion: land use shell game in the U.S. Northern Plains. Landsc. Ecol. 29, 81–95.
Johnston, C.A., 2013. Wetland Losses Due to Row Crop Expansion in the Dakota Prairie Pothole Region. Wetlands 33, 175–182.
Kline, K.L., Singh, N., Dale, V.H., 2013. Cultivated hay and fallow/idle cropland confound analysis of grassland conversion in the Western Corn Belt. Proc. Natl.
Acad. Sci
Laingen, C., 2015. Measuring Cropland Change: A Cautionary Tale. Pap. Appl. Geogr. 1, 65–72.
Lark, T.J., Salmon, J.M., Gibbs, H.K., 2015. Cropland expansion outpaces agricultural and biofuel policies in the United States. Environ. Res. Lett. 10, 044003.
Li, R., di Virgilio, N., Guan, Q., Feng, S., Richter, G.M., 2013. Reviewing models of land availability and dynamics for biofuel crops in the United States and the
European Union. Biofuels Bioprod. Biorefining 7, 666–684.
Long, J.A., Lawrence, R.L., Miller, P.R., Marshall, L.A., 2014a. Changes in field-level cropping sequences: Indicators of shifting agricultural practices. Agric.
Ecosyst. Environ. 189, 11–20.
Mladenoff, D.J., Sahajpal, R., Johnson, C.P., Rothstein, D.E., 2016. Recent Land Use Change to Agriculture in the U.S. Lake States: Impacts on Cellulosic
Biomass Potential and Natural Lands. PLOS ONE 11,
Plourde, J.D., Pijanowski, B.C., Pekin, B.K., 2013. Evidence for increased monoculture cropping in the Central United States. Agric. Ecosyst. Environ. 165, 50–
59.
Reitsma, K.D., Clay, D.E., Clay, S.A., Dunn, B.H., Reese, C., 2015. Does the US Cropland Data Layer Provide an Accurate Benchmark for Land-Use Change
Estimates? Agron. J.
Sahajpal, R., Zhang, X., Izaurralde, R.C., Gelfand, I., Hurtt, G.C., 2014. Identifying representative crop rotation patterns and grassland loss in the US Western
Corn Belt. Comput. Electron. Agric. 108, 173–182.
Wright, C.K., Larson, B., Lark, T.J., Gibbs, H.K., 2017. Recent grassland losses are concentrated around U.S. ethanol refineries. Environ. Res. Lett. 12, 044001.
Wright, C.K., Wimberly, M.C., 2013a. Recent land use change in the Western Corn Belt threatens grasslands and wetlands. Proc. Natl. Acad. Sci.

Operational monitoring of US croplands withLandsat 8: Where do we stand?
David M. Johnson, [email protected]
July 12, 2017 w/ Landsat Science Team @ EROS
• Additional spectral information does not seem to add anything in terms of classification accuracy.
• Multiple images through growing season are known to be helpful for classification accuracy.
• Finer spatial resolution makes for nice classification products. However, may not actually help in area estimation work.
• Grasslands/rangeland community underserved.• Crop progress/condition/yield still a challenge.