operations manual - europadigitalearthlab.jrc.ec.europa.eu/sites/default/... · operations manual...
TRANSCRIPT

My Seasons (Phenology) App by Jonas Eberle ([email protected])
Operations Manual
Menu
Home
Please use the button on the top left corner to open the
menu. From this menu you can navigate into the start
page, maps, settings, about and funding.
The start page shows a welcome message, a button to start
exploring our datasets, the analysis and the data collection
tasks, as well as the activities that has been done by the
user. If you start the app the first time, of course you will
see no activity. Use the “Start exploring” button to navigate
to the maps. This is the same page than using the map link
within the menu (top left button).
Within the activities all kinds of analysis and data collection
tasks you have done is listed here. With a click on the item
the analysis or data collection results are shown in a new
window. You can delete one entry from the local database
with the trash icon. You can clear the complete local
database on the settings page. Please note: You will
manage only your local database, data collection tasks
submitted to the server will not be deleted.
My Seasons (Phenology) App by Jonas Eberle ([email protected])
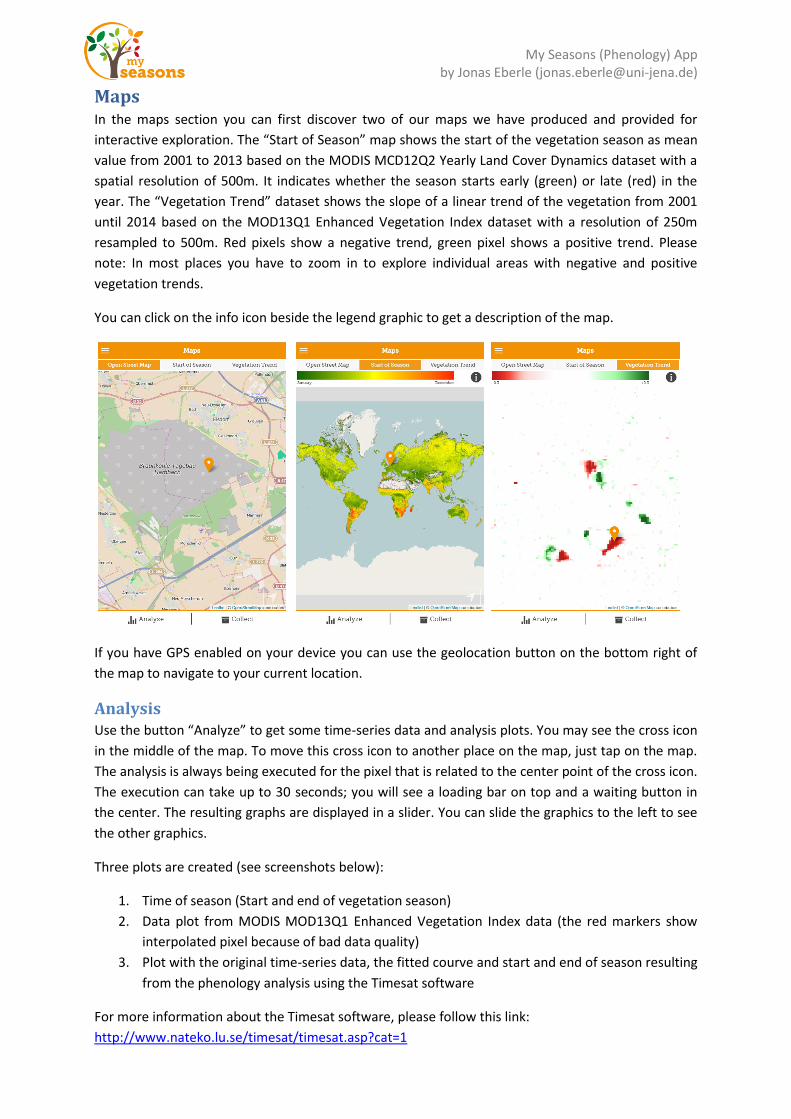
Maps In the maps section you can first discover two of our maps we have produced and provided for
interactive exploration. The “Start of Season” map shows the start of the vegetation season as mean
value from 2001 to 2013 based on the MODIS MCD12Q2 Yearly Land Cover Dynamics dataset with a
spatial resolution of 500m. It indicates whether the season starts early (green) or late (red) in the
year. The “Vegetation Trend” dataset shows the slope of a linear trend of the vegetation from 2001
until 2014 based on the MOD13Q1 Enhanced Vegetation Index dataset with a resolution of 250m
resampled to 500m. Red pixels show a negative trend, green pixel shows a positive trend. Please
note: In most places you have to zoom in to explore individual areas with negative and positive
vegetation trends.
You can click on the info icon beside the legend graphic to get a description of the map.
If you have GPS enabled on your device you can use the geolocation button on the bottom right of
the map to navigate to your current location.
Analysis Use the button “Analyze” to get some time-series data and analysis plots. You may see the cross icon
in the middle of the map. To move this cross icon to another place on the map, just tap on the map.
The analysis is always being executed for the pixel that is related to the center point of the cross icon.
The execution can take up to 30 seconds; you will see a loading bar on top and a waiting button in
the center. The resulting graphs are displayed in a slider. You can slide the graphics to the left to see
the other graphics.
Three plots are created (see screenshots below):
1. Time of season (Start and end of vegetation season)
2. Data plot from MODIS MOD13Q1 Enhanced Vegetation Index data (the red markers show
interpolated pixel because of bad data quality)
3. Plot with the original time-series data, the fitted courve and start and end of season resulting
from the phenology analysis using the Timesat software
For more information about the Timesat software, please follow this link:
http://www.nateko.lu.se/timesat/timesat.asp?cat=1

My Seasons (Phenology) App by Jonas Eberle ([email protected])
Collect If you wish to support scientists and collect some data, you need to have GPS enabled on your device
as you can only collect data while you are in the field. Please be aware: Any data collection you
submit is related to the current GPS position!
First of all you need to select the tree species that you are observing. You can scroll down for other
tree species. You can select a tree by tapping on the icon. We have prepared a setting of properties
for each tree that can be seen relevant to vegetation phenology. In total we provide the following
properties, but not all are available for any species:
- Flowering: Start, Mid (Full), End
- Leaf development: Begin, End
- Fruit maturity: Yes, No
- Leaf discoloring: Yes, No
- Defoliation: Yes, No
For any of the properties that are related to a specific tree species you can select a value and take a
foto of the leaf, the fruit or the tree. Please select the value of the property, take a photo (optional)
and click on the “Next” button in the lower right. Finally you have to accept the rights of use and use
the “Submit” button to send the data collection to our server. Optionally you can also provide your
name and your electronic mail address. Your mail will never be published or transferred to other
institutions (see rights of use).

My Seasons (Phenology) App by Jonas Eberle ([email protected])
Settings
Bugs There are still some bugs in the software:
- Using the analysis there could be an error in the data processing task. If you do not get
results within one minute, you should close and start the app again.
- For areas especially in the southern hemisphere or with late starts of the vegetation season,
the resulting “Time of season” plot looks not perfect. This need to be improved.
- Some times the map is not being loaded correctly. It sometimes helps to go the “About” page
and then back to the map. If this does not help, you should close and start the app again.
Future work There are some tasks we would like to do before releasing this app and before GEO Ministerial
Summit in Mexico City:
- Upload app to Google Play Store and Apple Store.
- Improve the “Time of season” plot for areas especially in the southern hemisphere or with
late starts of the vegetation season.
- Build a small webpage to make the data collection database accessible to all
- The app can be easily translated to other languages, if someone can provide translation to
Spanish, we could include this for the final release.
- Improve some texts within the data collection task.
Within the settings page you can…
- Disallow the app to send usage statistics to our
Google Analytics account.
- Change the language of the app (at the moment
you can select between English and German)
- Set default values for name and electronic mail if
you want to provide this information during the
data collection tasks.
- Any activity (analysis, data collection) is locally
stored in a Web SQL database and is accessible
through the start page of the app. You can clear
this database if you like.