opinion thomas russo -lbhi -2008
TRANSCRIPT

7/28/2019 Opinion Thomas Russo -LBHI -2008
http://slidepdf.com/reader/full/opinion-thomas-russo-lbhi-2008 1/42
3 0
Credit Crunch:
Where Do We Stand?
O c c a s i o n a l P a p e r 7 6
Group of Thirty, Washington, DC
Thomas A. Russo

7/28/2019 Opinion Thomas Russo -LBHI -2008
http://slidepdf.com/reader/full/opinion-thomas-russo-lbhi-2008 2/42
About the Author
Thomas A. RussoVice Chairman and Chie Legal Ofcer o Lehman Brothers
The views expressed in this paper are those o the author and do not
necessarily represent the views o the Group o Thirty.
This material has been prepared by Thomas A. Russo and is not a product
o the Lehman Brothers Research Department. It is or inormational
purposes only. Lehman Brothers makes no representation that the
inormation contained in this document is accurate or complete. Opinions
expressed herein are those o Thomas A. Russo and not Lehman Brothers.
All levels, prices and spreads are historical and do not represent current
market levels, prices or spreads, some or all o which may have changed
since the issuance o this document.
ISBN I-56708-140-1
Copies o this report are available or $20 rom:
Group o Thirty
1726 M Street, N.W., Suite 200
Washington, DC 20036
Tel.: (202) 331-2472, Fax: (202) 785-9423
E-mail: [email protected] WWW: http://www.group30.org

7/28/2019 Opinion Thomas Russo -LBHI -2008
http://slidepdf.com/reader/full/opinion-thomas-russo-lbhi-2008 3/42
Published by
Group o Thirty©
Washington, DC
2008
Credit Crunch:
Where Do We Stand?
Thomas A. Russo
Occasional Paper
No. 76

7/28/2019 Opinion Thomas Russo -LBHI -2008
http://slidepdf.com/reader/full/opinion-thomas-russo-lbhi-2008 4/42
7/28/2019 Opinion Thomas Russo -LBHI -2008
http://slidepdf.com/reader/full/opinion-thomas-russo-lbhi-2008 5/42
Contents Page
Acronyms and Abbreviations 5
Introduction 7
Consumer spending as a share o GDP 9
Real personal consumption and disposable income 9
Household net worth 9
Unemployment rate and average hourly earnings 10
Consumer condence 10
Energy “tax” on consumer spending 10
Household debt burden — nancial obligations ratio 11
The consumption challenge 11
Mortgages outstanding 11
Non-agency mortgage resets 12
Subprime mortgages 60-day delinquencies 12
Foreclosure orecasts 12
National home price infation 13
Wealth eect on consumer spending growth 13
Net mortgage equity extraction 13
Mortgage lending standards 14
ABX.HE implied spreads over libor 14
Credit card debt outstanding 15
Credit card 30+-day delinquencies 15
Credit card and other consumer lending standards 15
Credit card xed-rate spreads over swap rates 16
Subprime auto ABS 60-day delinquencies 16
Prime auto xed-rate spreads over swap rates 16
Securitizations 17
Credit card securitizations 18
Auto securitizations 18
S&P 500 implied volatility (VIX) 18
Treasury yields 19
Gold and oil prices 19

7/28/2019 Opinion Thomas Russo -LBHI -2008
http://slidepdf.com/reader/full/opinion-thomas-russo-lbhi-2008 6/42
How does global liquidity play into this? 19
U.S. M&A transaction value 20
The Fed’s global reach 20
U.S. trade position with Europe, Canada, OPEC, China 20International reserve assets excluding gold (world) 21
Comparative returns 21
#1 Gold bubble (gold spot prices) 22
#2 Tech bubble (Nasdaq composite index – CCMP) 22
#3 Housing bubble (S&P super composite
homebuilding index – S15Home) 22
#4 Global liquidity bubble? (iShares MSCI
Emerging Market index – EEM) 22
Bank balance sheets 23
Reduction in asset growth 23
Conclusion 24
Recommendations 25
APPENDIX: 27
Contribution to GDP growth rom net exports 27
GDP share o exports to U.S. 27
Share o growth due to exports to U.S. 27
Uses o cash-out renancing 28
Size o sovereign wealth und market 28
Recent SWF investments in banks / investment banks 29
Group o Thirty Members 31
Group O Thirty Publications Since 1990 35

7/28/2019 Opinion Thomas Russo -LBHI -2008
http://slidepdf.com/reader/full/opinion-thomas-russo-lbhi-2008 7/42
5
Acronyms and Abbreviations
ABCP Asset-backed commercial paper
ABS Asset-backed security
ABX A series o credit deault swap indices reerencing deals in the home equity loan sector,
issued hal-yearly and broken down into sub-indices by rating buckets (AAA, AA, A, BBB
and BBB-). Each ABX index reerences 20 home equity loan deals, and each sub index iscomposed o 20 equally weighted ABS credit deault swaps reerencing cash bonds, one
rom each deal (see also ABX.HE)
Alt-A Mortgage loans or those with a good credit score, but who lack normal documentation
Alt-B Mortgage loans that straddle the credit score spectrum between subprime and Alt-A mort-
gages. Typical borrowers have very little equity in their homes
ARM Adjustable Rate Mortgage
bp or bps Basis points
bn Billion
CCMP Nasdaq composite index
CDO Collateralized debt obligation
CIA Central Intelligence Agency
DPI Disposable personal income
ECB European Central Bank
EEM iShares MSCI Emerging Markets Index Fund
FHA Federal Housing Administration
FX Foreign exchange
GDP Gross domestic product
HUD U.S. Department o Housing and Urban Development
HY High yield
IMF International Monetary Fund
LIBOR London Interbank Oered Rate
LHS Let-hand scale
LTV Loan-to-value
M&A Mergers and acquisitions
MBS Mortgage-backed securities
NAFTA North American Free Trade Agreement
OECD Organisation or Economic Co-operation and Development
OFHEO Oce o Federal Housing Enterprise Oversight
OPEC Organization o the Petroleum Exporting Countries
PCE Personal consumption expenditures
pp Percentage point
Q Quarter
q-o-q Quarter-over-quarter
RHS Right-hand scaleS&P Standard & Poor’s
SAAR Seasonally adjusted annualized rate
SIVs Structured investment vehicles
SWFs Sovereign wealth unds
tr Trillion
VIX Volatility index
y-o-y Year-over-year

7/28/2019 Opinion Thomas Russo -LBHI -2008
http://slidepdf.com/reader/full/opinion-thomas-russo-lbhi-2008 8/42

7/28/2019 Opinion Thomas Russo -LBHI -2008
http://slidepdf.com/reader/full/opinion-thomas-russo-lbhi-2008 9/42
7
Introduction
This paper was presented by Thomas A. Russo1 on November 30, 2007, during the Group o Thirty’s 58th
plenary on a panel entitled: “Credit Crunch: Where Do We Stand?” The paper was updated as o January
17, 2008, in preparation or the World Economic Forum Annual Meeting 2008 in Davos, Switzerland.
In the paper, Mr. Russo weaves together a narrative o the interrelated orces that are unolding in the
current economic environment. To begin, he ocuses on the U.S. consumer, who has been crucial to eco-
nomic growth and yet now nds himsel increasingly levered and under duress. Mr. Russo explains how
the declining housing market, exacerbated by stress in the mortgage market, has let consumers unable to
borrow rom their homes to nance consumption. He then details the increasing signs o contagion rom
mortgage-backed securitizations to other markets such as credit cards and auto loans, as general uneasiness
grows and as challenged consumers begin to struggle to pay other debts. As nervousness spreads across
markets, Mr. Russo describes a fight to quality and to hard assets, leading to rising prices or gold, ne art,
oil, etc. The paper goes on to tackle the role o liquidity, questioning whether we are in the midst o a globalliquidity bubble contributing to excess valuations o certain assets. Finally, Mr. Russo comes ull circle to the
U.S. nancial “crisis” where bank balance sheets are backing up with assets, potentially urther reducing
credit creation, urther pinching the consumer.
Against this backdrop, the paper concludes with policy proposals aimed at ameliorating the current situ-
ation. Mr. Russo calls or broad-brush approaches to addressing subprime mortgages; an extension o the
U.S. Department o Housing and Urban Development and Federal Housing Administration programs to
keep borrowers in their homes; targeted tax incentives; discount window action; an expansion o volume
caps o state housing authorities; and a lowering o the ederal unds rates.
1 Thomas A. Russo is Vice Chairman and Chie Legal Ocer o Lehman Brothers.

7/28/2019 Opinion Thomas Russo -LBHI -2008
http://slidepdf.com/reader/full/opinion-thomas-russo-lbhi-2008 10/42

7/28/2019 Opinion Thomas Russo -LBHI -2008
http://slidepdf.com/reader/full/opinion-thomas-russo-lbhi-2008 11/42
9
Consumer spending as a share o gdp
73
71
69
67
65
63
61
59
Mar-52
%
Mar-62 Mar-72 Mar-82 Mar-92 Mar-02
Source: Commerce Department; data through 3Q07.
Consumer spending is the main driver o U.S. GDP
• Consumer spending has been a rising share o GDP,
currently accounting or about 70%.
• The health o the consumer is thereore a major
driver o the overall economy.
• U.S. consumer spending is important to global
growth. Exports to the U.S. account or 25% o
Canada’s GDP, 22% o Mexico’s, and 8% o China’s
(see appendix, page 27).
real personal Consumption and disposable inCome
10
8
6
4
2
0
-2
-4
Mar-52 Mar-61 Mar-70 Mar-79 Mar-88
DPI
PCE
Mar-97 Mar-06
% y-o-y
Note: PCE = personal consumption expenditures; DPI = disposable
personal income.
Source: Commerce Department; data through 3Q07. Shaded bars
denote recessions.
Consumption is supported by income…
• The marginal propensity to spend out o a dollar o
income is nearly 1, leaving the savings rate close to
zero.
• Consumer spending virtually never alls outside o
recessions. Even in periods o weak income growth,
consumers will continue to spend by drawing down
their savings.
• Even in recessions, spending on essentials such as
medical and housing services virtually never turns
negative.
• Healthy income gains over the past ew years have
underpinned consumer spending.
household net worth
20.0
15.0
10.0
5.0
0.0
-5.0
-10.0
-15.0
Mar-60 Mar-68 Mar-76 Mar-84 Mar-92
Tech bust
Housing boom
Mar-00
% y-o-y
Source: Federal Reserve Flow o Funds; data through 3Q07.
….and wealth
• Consumers respond with long and variable lags to
changes in wealth.
• About 60% o household assets are nancial, and
roughly 30% are residential real estate.
• However, changes in nancial wealth aect only
a portion o the population since the majority isheld by the top tier o the income distribution. In
contrast, homeownership is spread more evenly
across income levels.
• Household net worth will likely start to decline on
a year-over-year basis in the rst hal o 2008.

7/28/2019 Opinion Thomas Russo -LBHI -2008
http://slidepdf.com/reader/full/opinion-thomas-russo-lbhi-2008 12/42
10
unemployment rate and average hourly earnings
6.5
6.0
5.5
5.0
4.5
4.0
3.5
Jan-95 Jan-97 Jan-99 Jan-01 Jan-03
Unemp rate, lhs
Average hourly
earnings, rhs
Jan-05 Jan-07
%
4.5
4.0
3.5
3.0
2.5
2.0
1.5
%y-o-y
Source: Bureau o Labor Statistics.
Signs o a soter job market are starting to emerge…
• There is an inverse relationship between unemploy-
ment and earnings.
• Higher unemployment reduces employee bargaining
power and as such leads to slower wage growth.
• The unemployment rate increased rom 4.4% in
March 2007 to 5.0% in December 2007.
• Higher unemployment leads not only to lower
per capita wages, but it also hurts consumer
condence.
Consumer ConidenCe
115
110
105
100
95
90
85
80
75
70
Jan-05 Jun-05 Nov-05 Apr-06 Sep-06 Feb-07 Jul-07 Dec-07
Index (1985 = 100)
Source: Conerence Board; data through December 2007.
…contributing to a decline in consumer condence
• Consumer expectations o uture inancial and
economic conditions trend with personal consump-
tion.
• I consumers expect the economy to weaken, they
may cut back spending and increase precautionary
saving.
• Consumer conidence has been alling amid
concerns about housing weakness, turbulence in
nancial markets and rising energy prices.
energy “tax” on Consumer spending
4.0
3.0
2.0
1.0
0.0
-1.0
-2.0
Mar-60 Sep-67 Mar-75 Sep-82 Mar-90 Sep-97 Mar-05
% y-o-y
Source: Commerce Department; Lehman Brothers Economics; datathrough 4Q07 (December estimate).
Higher energy prices add to the strain
• About 6% o consumption is directed toward
energy.
• In periods o rising energy prices, a greater portion
o consumer budgets must be used or energy
consumption, causing consumers to cut back on
discretionary spending.
• This is an energy “tax,” which equals change in
energy prices weighted by the share o personal
consumption.
• The latest increase in energy prices amounts to about
a 1% “tax” on income.

7/28/2019 Opinion Thomas Russo -LBHI -2008
http://slidepdf.com/reader/full/opinion-thomas-russo-lbhi-2008 13/42
11
household debt burden — inanCial obligations ratio
19
18
17
16
15
14
13
12
Mar-80 Mar-85 Mar-90 Mar-95 Mar-00 Mar-05
% of disposable income
Source: Federal Reserve Flow o Funds; data through 3Q07.
Meanwhile, the consumer is very levered
• Total household debt has grown rapidly over the
past ve years, largely due to a jump in mortgage
debt.
• The burden o servicing debt is at an all-timehigh.
• The nancial obligations ratio, which estimates
required payments on outstanding debt (including
mortgages, consumer loans and auto loans), has
been rising as a share o disposable income.
the Consumption Challenge
Mortgage market problems and the contagion into credit markets and banks pose an additional challenge
to consumers
Confidence Inventories
Prices
Construction
Bank lendingNon-mortgagecredit
Mortgage creditproblems
Consumption ?
Offers Sales
mortgages outstanding
Subprime($1.2tr)14%
Alt-A/Alt-B($1.2tr)13%
Jumbo
($2.7tr)29%
Agency($4.0tr)44%
Source: Lehman Brothers Mortgage Strategy; LoanPerormance; data
through 3Q07.
The housing boom, in its later stages, was
supported by aggressive mortgage lending in an
environment o lower underwriting standards
• Subprime mortgage origination surged in 2005 and
2006 in response to lower underwriting standards
and higher home prices.
• In 2006, subprime loans accounted or just over
20% o total origination, up rom 8.6% in 2001.
• Similarly, origination o Alt-A/Alt-B (near-prime)mortgages climbed.

7/28/2019 Opinion Thomas Russo -LBHI -2008
http://slidepdf.com/reader/full/opinion-thomas-russo-lbhi-2008 14/42
12
non-agenCy mortgage resets
180
160
140
120
100
80
60
40
20
0
1Q08 2Q08
Subpri me Prime
3Q08 4Q08 1Q09 2Q09 3Q09 4Q09
$bn
Source: Lehman Brothers Mortgage Strategy.
Subprime ARMs originated in 2005–06 will reset to
higher rates over the next several quarters
• About two-thirds o subprime mortgages outstanding
have adjustable rates.
• About $550bn or 2.8 million subprime loans willreset beore 2009.
• On average, monthly payments will likely jump
20% to 25%, boosting average monthly payments
by $300 a month.
• Given tight lending standards, weak demand, and
alling home prices, it will be dicult to renance
or make a sale. As such, many borrowers will be
orced to deault on their mortgages.
subprime mortgages 60-day delinquenCies
30
25
20
15
10
5
0
0 12
Deal Age (months)
2001
2003
2005
2007
2002
2004
2006
24 36 48 60
% outstanding
Source: Lehman Brothers Mortgage Strategy; LoanPerormance.
The jump in subprime resets should add to already-
high delinquency rates…
• Early perormance o 2006 and 1H07 loans has
shown more than twice as many delinquencies as
normal (e.g., 2002).
• Based on early perormance, cumulative deaults o
subprime loans originated in 2006 and 1H07 could
be about 40%.
• The 2005 subprime vintage has perormed better
relative to 2006 and 2007. However, there have been recent signs o deterioration in the 2005
vintage.
oreClosure oreCasts
1,200
1,000
800
600
400
200
0
2.5
2.0
1.5
1.0
0.5
0.0
1992 1994
Foreclosure, lhs Foreclosure rate, rhs
Forecasts
1996 1998 2000 2002 2004 2006 2008
Units, 000s %
Note: The graph only measures oreclosures o single-amily existing
home sales. With condos/coops, oreclosures would likely be
about 20% higher.
Source: Lehman Brothers Mortgage Strategy.
…and ultimately to oreclosures given the weak
housing market and reduced availability o
mortgage credit
• Based on early perormance and subprime resets,
Lehman Brothers mortgage strategists estimate
there will be a total o 2 million homes oreclosed
over the next two years.
• This is about 3 times the normal oreclosure rate.
• Foreclosures will add to already-bloated inventory
and sell at discounted prices, putting downward
pressure on home prices.

7/28/2019 Opinion Thomas Russo -LBHI -2008
http://slidepdf.com/reader/full/opinion-thomas-russo-lbhi-2008 15/42
13
national home priCe inlation
20
15
10
5
0
-5
-10
Mar-88 Mar-92
Case-Shiller national index
OFHEO index
Forecasts
Mar-96 Mar-00 Mar-04 Mar-08
% y-o-y
Source: OFHEO; S&P Case-Shiller; Lehman Brothers Economics;
orecasts as o 4Q07.
Stress in the mortgage market has exacerbated
the huge imbalance between housing demand and
supply, urther depressing home prices
• National home prices will most likely all by the
most since the Great Depression.
• Expect the Case-Shiller index to all 15% rom peak
to trough and OFHEO to all 10%, with risks to the
downside.
• Case-Shiller is likely a better representation o actual
home prices since it tracks homes with all types o
mortgages, unlike OFHEO which is limited to agency
(conorming).
wealth eeCt on Consumer spending growth
2.0
1.0
0.0
-1.0
-2.0
Mar-90 Jun-93
housing
stock mkt
Forecast
Sep-96 Dec-99 Mar-03 Jun-06 Sep-09
% q-o-q, ar
Note: Analysis uses OFHEO home prices.Source: Lehman Brothers Economics; orecasts as o 3Q07.
Falling home prices and tighter credit should restrain consumer spending
• The literature on the “wealth eect” suggests
consumers boost spending anywhere rom 2 to 8
cents on every dollar o perceived permanent gains
in housing wealth.
• Given easy credit and nancial innovation, the
upper end o this range probably applies.
• Using a 6 cents wealth eect and assuming home
prices all 10% over the next 2 years, the housing
wealth eect on consumption has swung rom an
estimated 1.4pp to -0.4pp by end o 2009.
net mortgage equity extraCtion
$bn, SAAR
net equity extraction, lhs % disposable income, rhs
1998 1999 2000 2001 2002 2003 2004 2005 2006 2007
12
10
8
6
4
2
0
%
1,200
1,000
800
600
400
200
0
Note: SAAR = seasonally adjusted annualized rate.
Source: James Kennedy, Federal Reserve Board; Lehman Brothers
Economics; orecasts or 4Q 2007.
One o the major channels to realize changes in
housing wealth is mortgage equity extraction
• Mortgage equity extraction is one way to realize
changes in housing wealth (in addition to changing
savings patterns or other borrowing).
• Net equity extraction has tumbled rom a peak o an
annualized $989bn, or 10% o disposable income,
in 1Q06 to $436bn in 3Q07.
• There are likely lags between changes in equity
extraction and consumption.
• See appendix (page 28) or uses o cash-out
renancing.

7/28/2019 Opinion Thomas Russo -LBHI -2008
http://slidepdf.com/reader/full/opinion-thomas-russo-lbhi-2008 16/42
14
mortgage lending standards
Net % reporting tighter standards
All
prime
nontraditional
subprime
Jan-01 Apr-02 Jul-03 Oct-04 Jan-06 Apr-07
68
56
44
32
20
8
-4
-16
Source: Federal Reserve Senior Loan Ocer Survey; data through
October 2007.
In response to rising delinquencies and weak
housing undamentals, mortgage lenders have
aggressively tightened lending standards
• Lending standards have tightened or all types o
mortgages.
• Lending standards or subprime loans started to
tighten markedly in the beginning o 2007, virtually
eliminating the space.
• Subprime originators have let the market or have
laid o people.
• In contrast, we have just started to witness tighter
lending standards or prime mortgages, which is
largely driven by jumbo loans.
abx.he implied spreads over libor
bp
AAA
AA
A
BBB
BBB-
Jul-06 Nov-06 Mar-07 Jul-07 Nov-07
3,500
3,000
2,500
2,000
1,500
1,000
500
0
Source: Markit Partners; data through January 16, 2008.
Financial markets have responded in a similar
ashion—demand or mortgage-backed securities
has plunged, pushing up spreads and dragging
down prices
• We have witnessed a jump in even highly rated
subprime securities in response to both poor
remittance perormance and risk aversion.
• The market is pricing about a 25% loss in pools
o mortgages underlying subprime MBS, which
translates into an assumption o a 50% deault
rate.
• By way o example, the ABX market or single-A
bonds is assuming 100% principal loss on these
bonds and receipt o interest only.
• 6 months ago, beore the turmoil, the market was
pricing about 8% to 9% losses, and 1 year ago it
was pricing 4% to 5% losses.

7/28/2019 Opinion Thomas Russo -LBHI -2008
http://slidepdf.com/reader/full/opinion-thomas-russo-lbhi-2008 17/42
15
Credit Card debt outstanding
% y-o-y
During housing boom,
growth in credit card
debt slowed
Jan-86 Jan-90 Jan-94 Jan-98 Jan-02 Jan-06
25
20
15
10
5
0
Source: Federal Reserve Board; data through November 2007.
The challenge to liquidate money rom home equity
has let consumers to nance spending through
other sources (e.g., credit cards and anticipation o
increased wages)
• During the housing boom consumers could clean
up their credit card problems by taking money out
o their homes.
• Over the past year, credit card debt has been growing
at a aster pace than it has in the previous 4 years.
• However, year-over-year growth in credit card debt
is still below the 10% average growth rate o the
past decade.
Credit Card 30+-day delinquenCies
%
Jan-03
Citibank Capital One BofA Chase
Jan-04 Jan-05 Jan-06 Jan-07
6.5
6.0
5.5
5.0
4.5
4.0
3.5
3.0
2.5
2.0
Source: Company 10D lings; data through November/December
2007.
There are signs o stress in the credit card sector
• Credit card delinquencies have started to pick up
or the major issuers.
• It is likely that credit card delinquencies will increase
urther with a lag as consumer budgets become
stretched and mortgage delinquencies continue to
rise.
Credit Card and other Consumer lending standards
Net % reporting tighter standards
1Q96
cred it card non-credi t card consumer loans
3Q97 1Q99 3Q00 1Q02 3Q03 1Q05 3Q06
60
50
40
30
20
10
0
-10
-20
Source: Federal Reserve Senior Loan Ocer Survey; data through
October 2007.
Lenders are tightening standards or non-credit
card debt, and urther tightening in the coming
quarters is expected
• Banks have started to tighten lending standards or
consumer loans (such as auto and other big-ticket
items) with the exception o credit cards.
• Loose lending standards or credit cards suggests
consumers can boost credit card borrowing to
nance consumption.
• However, anecdotal evidence suggests banks are
starting to grow increasingly concerned, which will
likely encourage banks to ultimately tighten lending
standards.

7/28/2019 Opinion Thomas Russo -LBHI -2008
http://slidepdf.com/reader/full/opinion-thomas-russo-lbhi-2008 18/42
16
Credit Card ixed-rate spreads over swap rates
bp
AAA A BBB
450
400
350
300
250
200
150
100
50
0
Jan-00 Jan-02 Jan-04 Jan-06 Jan-08
Source: LehmanLive; data through January 10, 2008.
The market is already anticipating credit problems
• A jump in spreads likely refects both averse market
sentiment and concern about credit card loan
perormance.
subprime auto abs 60-day delinquenCies
%
2003
Deal Age (months)
2004 2005 2006 2007
4.5
4.0
3.5
3.0
2.5
2.0
1.5
1.0
0.5
0.0
0 12 24 36 48
Source: Lehman Brothers and Intex; based on representative deals
rom one selected subprime issuer (AmeriCredit).
Early signs o credit problems in the auto loan
market are starting to emerge...
• Delinquencies have started to pick up in the recent
vintages or subprime, particularly 2007.
• Similar signs o deterioration are appearing in the
prime sector.
prime auto ixed-rate spreads over swap rates
bp
AAA A BBB
450
400
350
300
250
200
150
100
50
0
Jan-03 Jan-04 Jan-05 Jan-06 Jan-08Jan-07
Source: LehmanLive; data through January 10, 2008.
…which are also seemingly priced into nancial
markets
• The rise in spreads refects both increasing concerns
about uture perormance and overall market
sentiment.

7/28/2019 Opinion Thomas Russo -LBHI -2008
http://slidepdf.com/reader/full/opinion-thomas-russo-lbhi-2008 19/42
17
seCuritizations
Parts o the securitization markets are rozen, and parts are still unctioning at higher spreads
v ($)
a C 2004 2005 2006 2007
a
Autos Total $73 $99 $85 $69
Prime 29 58 54 45
Nonprime 34 28 25 18
Floorplan 10 13 6 5
C C
Credit Cards
Total $61 $72 $66 $93
mbs
MBS Total $743 $1,069 $1,063 $620
Prime 395 591 584 404
Nonprime 349 478 479 216
• Mortgage issuance has allen sharply, while auto
securitizations are down less than mortgages, and
credit cards were actually up through 2007.
• August was a very low issuance month because
o the spread increase in securitized products and
broader market volatility.
• Credit cards and auto securitizations rebounded in
the all, but spreads remain high.
• At a minimum, 2008 credit card and auto securitiza-
tions will only get done at higher spreads.
Much o the decline in mortgage issuance has been over the past 6 months. Autos have shown signs o a
decline in volume, and or now credit cards have remained somewhat stable
C C a p mbs s mbs
v ($) # v ($) # v ($) # v ($) #
n-06 $5 8 $13 9 $42 52 $41 44
dc-06 3 4 3 3 45 53 35 39
J-07 5 9 3 4 44 57 27 34
-07 11 17 8 8 60 68 35 40
m-07 9 14 2 4 50 62 28 33
a-07 7 10 6 5 50 57 36 42
m-07 9 15 9 7 50 59 30 35
J-07 8 14 11 11 52 66 24 34
J-07 8 14 3 3 30 39 4 6
a-07 3 4 5 4 20 30 7 10
s-07 11 8 6 8 21 28 15 13
oc-07 16 19 9 8 15 20 7 11
n-07 5 3 4 3 10 17 1 3
dc-07 2 1 2 1 3 6 0 0
Source: Intex (as o January 10, 2008; nal ’07 volumes may adjust higher); Lehman Brothers' Public and Private Issues ABS Database.

7/28/2019 Opinion Thomas Russo -LBHI -2008
http://slidepdf.com/reader/full/opinion-thomas-russo-lbhi-2008 20/42
18
Credit Card seCuritizations auto seCuritizations
Credit card securitizations are less likely to have
the same perormance deterioration as mortgages
• Credit card securitizations use a revolving master
trust that purchases new receivables monthly.
• Credit card issuers can more easily alter thequality o the credit card receivables sitting in
the trust.
• However, those credit card issuers would have
to warehouse higher credit risk receivables on
their balance sheets.
• Plus, spreads have widened, indicating nervous-
ness.
• Recent unemployment data, together with
growing recession concerns, will translate into
higher charge-os and losses on credit cardportolios.
• We have already started to see credit card issuers
react by increasing their loss reserves.
Auto securitizations also have some characteristics
that may insulate the market relative to mortgages
• The payment size (approximately $300/month on
average) is smaller, and since the loans are xed
rate, there is no reset/payment shock.
• But auto loans are sensitive to unemployment
levels; i unemployment keeps rising, auto loan
perormance could deteriorate signicantly.
• Already, delinquencies are rising as consumers get
stretched, which can restrain auto sales, ultimately
lowering securitization volumes.
• For domestic captive/quasi-captive issuers (Ford,
GMAC, and Chrysler), this is important since
securitization is core to their unding strategies.
• Spreads have widened (BBBs by about 400 bps), andissuers are retaining lower-rated assets as demand
has dried up or risky assets.
• Coming ull circle, as ABS markets tighten, credit
to consumers to purchase autos is restricted,
urther reducing auto sales, which urther hurts the
economy.
s&p 500 implied volatility (vix)
%
35
30
25
20
15
10
5
Jan-06 May-06 Sep-06 Ja n-07 Sep-07 Ja n-08May-07
Source: Bloomberg; data through January 16, 2008.
The “xed income inection” is impacting the
equity markets
• The S&P is about 13% o o its highs.
• There are other actors such as expectations o
uture corporate prots; however, it all becomes
somewhat circular in nature since credit impacts
uture protability.
• Nevertheless, volatility is rising, scaring many
“committers o capital.”
7/28/2019 Opinion Thomas Russo -LBHI -2008
http://slidepdf.com/reader/full/opinion-thomas-russo-lbhi-2008 21/42
19
treasury yields
%
9.0
8.0
7.0
6.0
5.0
4.0
3.0
2.0
1.0
0.0
Jan-93 Jan-96 Jan-99 Jan-02
2 yr
10 yr
Jan-08Jan-05
Source: Bloomberg; data through January 16, 2008.
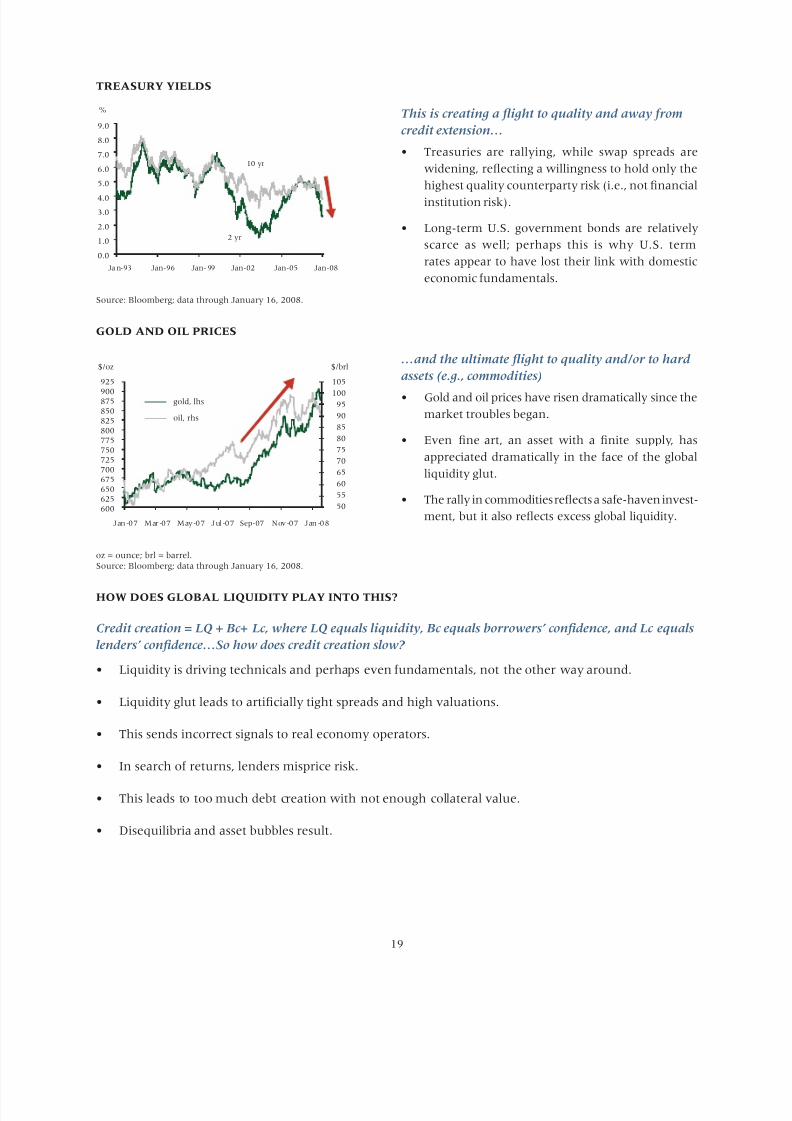
This is creating a fight to quality and away rom
credit extension…
• Treasuries are rallying, while swap spreads are
widening, refecting a willingness to hold only the
highest quality counterparty risk (i.e., not nancial
institution risk).
• Long-term U.S. government bonds are relatively
scarce as well; perhaps this is why U.S. term
rates appear to have lost their link with domestic
economic undamentals.
gold and oil priCes
$/oz
gold, lhs
oil, rhs
$/brl
925
900875
850
825
800
775
750
725
700
675
650
625
600
105
10095
90
85
80
75
70
65
60
55
50
Jan-07 Mar-07 May-07 Jul-07 Nov-07 Jan-08Sep-07
oz = ounce; brl = barrel.
Source: Bloomberg; data through January 16, 2008.
…and the ultimate fight to quality and/or to hard
assets (e.g., commodities)
• Gold and oil prices have risen dramatically since the
market troubles began.
• Even ne art, an asset with a nite supply, has
appreciated dramatically in the ace o the global
liquidity glut.
• The rally in commodities refects a sae-haven invest-
ment, but it also refects excess global liquidity.
how does global liquidity play into this?
Credit creation = LQ + Bc+ Lc, where LQ equals liquidity, Bc equals borrowers’ condence, and Lc equals
lenders’ condence…So how does credit creation slow?
• Liquidity is driving technicals and perhaps even undamentals, not the other way around.
• Liquidity glut leads to articially tight spreads and high valuations.
• This sends incorrect signals to real economy operators.
• In search o returns, lenders misprice risk.
• This leads to too much debt creation with not enough collateral value.
• Disequilibria and asset bubbles result.

7/28/2019 Opinion Thomas Russo -LBHI -2008
http://slidepdf.com/reader/full/opinion-thomas-russo-lbhi-2008 22/42
20
u.s. m&a transaCtion value
$bn, 60-day moving avg
14
12
10
8
6
4
2
0
Jan-01 Mar-02 May-03 Jul-04 Nov-06 Jan-08Sep-05
Note: 60-day average o announced M&A deals (sum o mergers,
acquisitions, divestitures, sel-tenders, and spinos).
Source: Bloomberg; data through January 11, 2008.
Tighter spreads drove transaction volume to cyclical
highs
• Like residential real estate, the M&A wave appears
to have collapsed under its own weight.
• In both cases, it was lenders’ conidence thatdisappeared—not liquidity.
the ed’s global reaCh
C
s u.s. t
dfc ‘07
Cc
r
s n-u.s.
g gdp
China 31.4% managed 7.5%
Nigeria 3.4% managed 0.3%
Venezuela 3.2% pegged 0.5%
Saudi Arabia 2.9% pegged 1.0%
Malaysia 2.7% managed 0.4%
Algeria 2.2% managed 0.3%
Russia 1.6% managed 2.8%
India 1.5% managed 2.5%
Angola 1.5% managed 0.1%50.4% 15.6%
Note: Trade decit through 2Q07; GDP as o 2006, current US$.
Source: International Monetary Fund; International Trade
Administration / Commerce Department.
Today’s discussions o the appropriateness o Fed policy do not refect the Fed’s global reach...The
Fed heavily infuences monetary policy or much o
the world by virtue o pervasive managed currency
regimes
• Global GDP is about $48tr and the U.S. makes up
about $13tr (27%).
• Together, the U.S. and countries that “shadow” the
dollar represent nearly 40% o global GDP.
• While many countries are dramatically dierent rom
the U.S. and need their own policy mechanisms,
mercantilist proclivities leave them constrained by
generic managed currency regimes.
• All else being equal, rates are too low, and growth
is too hot and not in equilibrium.
u.s. trade position with europe, Canada, opeC, China
us d t fc
% n 06/n 07 % n 06/n 07
$ / Euro (10.50%) (7.70%)
$ / Canada (12.50%) (11.90%)$ / China (5.50%) 11.50%
$ / OPEC 0.00% 12.10%
Note: Dollar change is November month-end; trade decit is 12
months ending November.
Source: Commerce Department; Bloomberg.
When markets are ree to set policy based on
undamentals, things tend to balance
• The U.S. trade position with Europe and Canada
has improved as the dollar weakened, as one would
expect.
• However, when a currency is pegged to the dollar,
trade balances are not allowed to correct and
things can even get worse, such as with China and
OPEC.

7/28/2019 Opinion Thomas Russo -LBHI -2008
http://slidepdf.com/reader/full/opinion-thomas-russo-lbhi-2008 23/42
21
international reserve assets exCluding gold (world)
$ trillion
6.50
6.00
5.50
5.00
4.50
4.00
3.50
3.00
2.50
2.00
Jan-03 Jan-04 Jan-05 Jan-06 Jan-07
Source: Bloomberg; data through January 11, 2008.
Large and growing capital fows to developing
countries are largely the result o undervalued
currencies
• Ongoing trade decits that are not allowed to sel-
correct lead to massive build-ups o ocial oreign
currency reserves.
• Global FX reserves have grown 168% since January
2003 compared to global GDP, which has grown by
about 20% over the same time.
• In addition, sovereign wealth unds (SWFs) are
conservatively estimated to have about $2tr–$2.5tr
in assets and are rapidly growing—assuming SWF
assets get levered, it is clear SWFs will become very
infuential on markets (see appendix, page 28).
Comparative returns
% y-o-y
70
50
30
10
-10
-30
Nov-06 Jan-07
IShares-EMG S&P 500 index SPDR-FINL select
Mar-07 May-07 Jul-07 Sep-07 Nov-07
Note: EEM holds about 300 stocks rom emerging market countries
and seeks to provide results corresponding to the MSCI
Emerging Markets Index.
Source: Bloomberg; data through January 16, 2008.
When will it end?
• So ar, strong global growth, led by exploding
liquidity has continued, while the U.S. nancial
sector has tried to eel or a bottom.
• Blue chip emerging market stocks (shown by
IShares-EMG on the graph, ticker EEM) demonstrate
this.
• Ultimately, the question is whether the global
liquidity dynamic is so great that the growing U.S.
nancial “crisis” can unold in a vacuum.

7/28/2019 Opinion Thomas Russo -LBHI -2008
http://slidepdf.com/reader/full/opinion-thomas-russo-lbhi-2008 24/42
22
I history is any guide, the “liquidity bubble” has room to run…this may continue to underpin strong
global asset markets in 2008
• Asset bubbles typically experience three stages: (1) denial, (2) conventional wisdom, and (3) speculative
renzy.
• Below (in quadrants #1 – #3) are three asset bubbles:
o The gold bubble in the late 1970s in which prices rose about 6.5 times over about 3.5 years.o The tech bubble in the late 1990s in which prices rose about 6.7 times over 5 years.
o The recent housing bubble where major homebuilder stocks rose about 7.8 times over about 5.5
years.
• Is excess global liquidity the next bubble?
o Quadrant #4 shows an emerging market index (EEM) that is up about 4.1 times in about 4.5 years.
o EEM is a possible proxy or a liquidity bubble since it is liquid, big, and popular, but one could also
look at charts or ne art, gold, and oil, which can also be driven by global liquidity.
#1 gold bubble (gold spot priCes) #2 teCh bubble (nasdaq
Composite index – CCmp)
$
900
800
700
600
500
400
300
200
100
0
J un -7 6 Fe b- 77 O ct- 77 J un -7 8 F eb -79 Oc t- 79
1
2
3$
5500
5000
4500
4000
3500
3000
2500
2000
1500
1000
500
0
J an -9 5 Ja n- 96 Ja n- 97 Ja n- 98 J an -9 9 J an -0 0
1
2
3
Source: Bloomberg. Source: Bloomberg.
#3 housing bubble (s&p super Composite
homebuilding index – s15home)
#4 global liquidity bubble? (ishares msCi
emerging market index – eem)
$
1100
1000
900
800
700
600
500
400
300
200
100
0
J an -0 0 J an -0 1 J an -0 2 J an -0 3 J an -0 4 J an -0 5
1
2
3$
200
180
160
140
120
100
80
60
40
20
Apr-0 3 Apr-04 Apr-0 5 Apr-0 6 Apr-07 Apr-0 8
1
2
3 ?
Source: Bloomberg. Source: Bloomberg.

7/28/2019 Opinion Thomas Russo -LBHI -2008
http://slidepdf.com/reader/full/opinion-thomas-russo-lbhi-2008 25/42
23
bank balanCe sheets
($) J-07 +/(-) dc-07
Assets $8,361 $250 $8,611
Equity 691 (65-115) 626 - 576
Equity/Assets
Ratio
8.3% 7.3% - 6.7%
Deterioration in Ratio (1.0%) - (1.6%)
Risk Weighted
Assets
$5,863 $186 $6,049
Tier 1 Capital 486 (65-115) 421 - 371
Teir 1 Ratio 8.3% 7.0% - 6.1%
Deterioration in Ratio (1.3%) - (2.2%)
Note: Based on top 30 commercial banks covered by Lehman
Brothers Equity Research (represents approximately 80%
o assets in all depository institutions).
Note: HY loans/bonds notional estimated using pipeline and league
table share o U.S. banks in 2007. ABCP notional estimated
rom amount o decline in ABCP and U.S. banks share o
liquidity puts. Losses assumed at 10–15% o notional or
high-yield and non-CDO ABCP. CDO losses and potential
losses rom mortgage assets rom Lehman Brothers Mortgage
Strategy group.
Note: Unanticipated assets include SIVs brought onto balance sheet.Source: Lehman Brothers Equity Research and Lehman Brothers
Fixed Income Research (“Buyers o Last Resort: Do Banks Have
Enough Balance Sheet?” November 13, 2007).
Bank balance sheets are backing up with assets…
• As o end-December, Lehman Brothers estimated
that about $250bn in unanticipated assets ($120bn
o HY Bonds/Loans and $130bn in ABCP Assets,
including SIVs) had been brought onto bank balance
sheets.
• Risk-weighted assets were estimated to be
$186bn.
• In addition, losses are estimated at about $65bn–
$115bn ($10bn due to HY Bonds/Loans, $15bn
in ABCP Assets, $15bn in ABS CDOs, and $25bn–
$75bn in mortgage losses).
• This signiicantly reduces banks’ capital ratios
relative to June-07 (prior to the market troubles),
assuming they had raised no resh capital.
• To the extent securitization markets are closed ortoo pricey, banks will be orced to keep additional
assets on balance sheets.
reduCtion in asset growth
($) oc pc
Mortgage Losses $25 $75
Total Losses $65 $115
Capital Raised
Reduced Buybacks $10 $10
Fresh Issuance $40 $60t $50 $70
Previously Forecast
Asset Growth or 2008 $685 $685
Asset Growth to
Meet 8% Ratio $522 $147
s g ($163) ($538)
Slowing in Growth (%) (1.8%) (6.0%)
Note: Credit growth o $2tr includes only non-nancial sectors (i.e.,
primarily households, corporates, and governments).
Source: Lehman Brothers Fixed Income and Equity Research; Flow
o Funds.
…which could lead to a reduction in credit creation
urther pinching the consumer
• Prior to recent events, Lehman Brothers Equity
Research orecast $685bn in asset growth or 2008.
• I banks want to bring Tier-1 capital ratios back
to 8% in a year, they would need to reduce asset
growth by anywhere rom $160bn to $540bn.
• Banks have other options such as reducing buybacks
and dividends, or raising resh capital (into a dicult
market) as Citi has just done, which could bias the
slowdown in asset growth to the lower end o the
range.
• In either event, asset growth (i.e., credit extension)
could slow between $160bn–$540bn, compared
with average annual credit growth over recent years
o $2tr or the entire economy.
• Demand or credit will slow, too, given the slowing
economy; however, non-bank supply o credit will
also slow, given stress in securitization markets.
These two eects likely oset each other, thus the
slowing in bank asset growth is still relevant.
• Stress on bank balance sheets not only aects
consumers, but it also impacts lending to oreign
banks that depend on dollar lending.

7/28/2019 Opinion Thomas Russo -LBHI -2008
http://slidepdf.com/reader/full/opinion-thomas-russo-lbhi-2008 26/42
24
Conclusion In the next year or two:
• Pressure on the consumer grows as:
o Home prices all, reducing the wealth
eect.
o Energy tax weighs heavily.
o Credit conditions tighten.
o Unemployment rate edges higher.
• Consumers need their incomes to grow or to
seek additional sources o credit to consume, or
otherwise slow consumption
o Problems in one market can spread to
other markets, urther damaging access to
credit.
o Rising delinquencies rom leveredconsumers exacerbate the credit problem.
o This is causing pressure on asset-backed
securities and indexes…
o Resulting in pressure on balance sheets
and unding vehicles…
o SIVs that cannot nance themselves will
sell the assets.
o Mortgage and bond insurers own these
assets. Their balance sheets deteriorate.
o This creates pressure on what they
guarantee.
o Counterparty risk o these institutions
grows…Liquidity continues to dry up in
the mortgage space.
o Capital needs to be raised, but the market
is concerned about the underlying assets…
Consequently, the cost to raise capital
becomes high and or some prohibitive.
o Some bleed into other consumer credit
assets creates more ear.
o Hence, the willingness to lend becomes
extraordinarily constrained.
o All o this lowers consumption, unless
incomes rise to make up or it.
o However, higher unemployment will
cause urther problems through loss o
jobs and more generally through a loss o
condence.
o I consumer spending alls, it can lead to
alling corporate prots, which leads to alling
equity markets, which reduces wealth, and
leads to alling consumption, etc.
• Liquidity in general will continue to grow in countriesthrough reserves and sovereign wealth unds
o This will lead to increased prices where
investor condence is present, particularly or
assets with nite supplies.
o A weakened dollar will lead to more
investment in the U.S., but only in areas with
a perception o value and investor condence.
o This liquidity could nd its way into mortgage
markets once there is an understanding o
the value proposition—at that point the short
side will add upward pressure as it unwinds.
o Mortgage losses will be indirectly nanced
through capital inusions in nancial
institutions primarily through sovereign
wealth unds (see appendix, page 29).
• Severe losses in the mortgage market lower
consumer conidence, which coupled with a
weaker economy, will lead to greater government
involvement both scally and monetarily
o The Federal Reserve will most likely continue
to lower interest rates and adopt various
methods to add liquidity to the market. Sowill other central banks, including, most
importantly, the ECB.
o The U.S. Congress will move orward with
scal stimuli aimed at the economy and
perhaps targeted to the housing market.
o The combination o strong monetary and
scal policy will be an important actor in
reversing the trend.
In the long run:
• Lower home prices spur sales recovery.• Securitization returns or less exotic products.
• A broader array o mortgage credit returns.
• Liquidity growth rates through reserves will slow
since countries with pegged currencies will need to
use monetary policy to be able to manage growth
and ght infation.
• Like all cycles, this too will come to an end.

7/28/2019 Opinion Thomas Russo -LBHI -2008
http://slidepdf.com/reader/full/opinion-thomas-russo-lbhi-2008 27/42
25
Recommendations
Something needs to be done
• The recent market has been, in many respects,
worse than it was in August
o The lack o condence in pricing has
led most buyers away rom mortgage
products, and there are ew buyers in the
market with both the balance sheet and
expertise to understand any “bargains.”
o Such players are currently dealing with
the less risky assets in the mortgage asset
class (particularly agencies).
o Directed liquidity is needed to restore
condence.
Some things that might be done are:
1. We need legal clarity that the undamentalpolicy or dealing with the subprime issue should
involve broad-brush approaches rather than
traditional loan-by-loan analyses
o Servicers are reluctant to implement
innovative loan modication protocols
because o perceived litigation exposure.
o The Paulson/HOPE NOW initiative refects
the need or ormulaic approaches that
insulate servicers rom liability.
o Regulators and legislators alike should
consider granting servicers comort i they
act in “good aith” based on homeowner
payment history.
2. Develop and expand the reach o programs to
keep at-risk borrowers in their homes. HUD and
FHA have shown great leadership, and we need
to consider ways o developing new programs
and scaling programs like FHASecure
o Programs should be targeted to
homeowners (not investors) with ARMs
who are or will become delinquent as a
result o resets and are unable to renance because o credit issues or property value
declines.
For example:
o Loan servicers could oer a new FHA-
insured xed-rate amortizing loan at
90% o the current appraised value o the
home.
o The insuring agency would receive a
percentage (e.g., 75%) o the home
appreciation between the new and old loan
balances to compensate or its guarantee.o Combination o reduced LTV and the
appreciation share enables more aordable
loan terms or borrowers to keep them in
their homes.
o Agency insurance would enable securitization
and enhanced liquidity or the program to
enable it to reach more at-risk borrowers.
o I the new cash payment is lower than the
original, a foor could be created at the
original cash payment to prevent a windall.
o Congress has appropriated unds to bemade available through HUD to non-prots
to help homeowners modiy or renance
their mortgages. Conceivably, some o such
money might be used as seed money or the
development o such programs.
3. Since the U.S. housing stock is worth about $23tr (or
about $10tr more than annual U.S. GDP) a drop o
15% would reduce wealth by about $3.5tr. Policy-
makers should careully evaluate opportunities to
reverse the trend in this diminution o wealth and,
thereby, also stimulate all the by-products o the
housing industry. One such idea directed at the epi-
centre o the credit crunch is to consider targeted tax
incentives to stimulate single-amily home purchase
activity. This would help reduce inventories that
are dragging down the housing market and reduce
uture problems due to the overhang o scheduled
resets. It would also liquiy many o the mortgages
that are in present securitized products thereby giv-
ing greater certitude to their value. The ollowing
program should be considered:
o Borrowers would receive an income tax
credit in lieu o the interest deduction equalto a designated percentage o the interest they
pay on a mortgage loan used to purchase
a home they will use continuously as a
principal dwelling.

7/28/2019 Opinion Thomas Russo -LBHI -2008
http://slidepdf.com/reader/full/opinion-thomas-russo-lbhi-2008 28/42
26
reCommendations Continued
o The credit would be reduced as the value
o the dwelling increases. For example, the
credit would equal 100% o the interest
on the rst $400K o purchase price. On
the next $200K, the credit would all (on
a straight-line basis) rom 100% to 80%.There would be no credit or any home
bought in excess o $600K.
o The $400K/$600K numbers are not magic,
but rather were selected as a starting point
or discussions. In addition, the duration
o the tax credit need not extend orever
and policymakers could set the duration as
appropriate, keeping in mind the need or
it to be enticing enough to create buyers
(demand).
o The home must be the borrower’s primary
residence.
o Borrowers would be required to have
made a 20% down payment. To preserve
equity, subordinate nancing that resulted
in a combined LTV in excess o 80% would
be prohibited at any time.
o The borrower’s ability to repay the
loan would have to have been ully
documented.
o This program would apply only or single-
amily homes purchased in 2008.
o Such a program would need to have
an anti-abuse provision similar to the
learning experience rom rent-controlled
apartments.
o To urther increase liquidity, FHA could
develop a program to insure loans meeting
these parameters.
o Such loans should have natural buyers
such as pension unds because o the
long-dated nature o the product, thereby
minimizing the need to put such loans
on bank balance sheets. In addition, asiderom the tax credit it does not require
government support.
4. Broaden access to the discount window or nancial
institutions that are signiicant players in this
market
o The assumption would be that the utilization
o the discount window would be or
purposes o adding liquidity to the mortgage
market.
o The vehicles or this could be the primary
bond dealers or depository institutions owned
by them.
o Consideration should also be given to
lowering the discount rate to coincide with
the ederal unds rate.
o These measures could be done on a
temporary basis.
5. Expand volume caps o various state housingauthorities to issue loans to rst-time buyers and
expand the limitation on such loans to cover
renancing or such buyers
o This will enable the utilization o the tax-
exempt market to help, in particular, the
renancing o rst-time buyers.
o Such loans would be under the same credit
limitations that currently exist but with
expanded volume caps.
6. Sharply lower the ederal unds rate
o This could negatively aect the dollar and
infation, but must be considered given the
high possibility that markets will get worse
and could dramatically aect the economy as
a whole.
o Measures 1–5 are more surgical in nature.
A lot is at stake or the economy, and all actions that add liquidity or help prevent distressed sales that
exacerbate the problem, are worthy o consideration (even i they are somewhat “out o the box”).
Emphasis should be placed on developing a portolio o actions, some o which could be temporary in
nature, rather than nding a magic bullet!

7/28/2019 Opinion Thomas Russo -LBHI -2008
http://slidepdf.com/reader/full/opinion-thomas-russo-lbhi-2008 29/42
27
APPENDIX:
Contribution to gdp growth rom net exports
Contrib, ppForecast
2.0
1.5
1.0
0.5
0.0
-0.5
-1.0
-1.5
-2.0
Mar-00 Sep-01 Mar-03 Sep-04 Mar-06 Sep-07 Mar-09
Source: Commerce Department; Lehman Brothers Economics.
• Trade made a positive contribution on growth in
2007 or the rst time in nearly a decade.
• Exports have been underpinned by a weaker US$.
From its peak in 2002, the US$ has allen roughly
35% rom the Federal Reserve’s major basket o
currencies.
• In addition, buoyant growth in the Euro Area,
Canada, Mexico and Emerging Asia has led to
healthy demand or U.S. exports.
• Net exports are expected to improve urther in 2008
and 2009 in response to both stronger exports and
weaker imports.
gdp share o exports to u.s.
% o GDP 1980 1990 2000 2006
Euro Area 1 1 2 2
Japan 3 3 3 3
UK 2 2 3 2
Canada 15 16 33 25
Mexico 5 7 25 22
Korea 7 7 7 5
Australia 2 1 2 1
India 1 1 2 3
China 1 1 4 8
g10 -us 2 3 5 5
• Those countries closest to the U.S. and which are
members o NAFTA, namely Canada and Mexico,
have the highest share o exports to the U.S.
• But in a number o other economies outside o
NAFTA, notably China, their shares have been
growing.
• The rising share o exports to the U.S. in economies’
GDP means that integration with the U.S. has been
increasing. It also suggests that exports to the U.S.
may have been making an important contributionto growth in these economies in recent years.
Source: OECD; Datastream; Lehman Brothers Economics.
Source: “Global Decoupling,” Lehman Brothers Economics, July 2007.
share o growth due to exports to u.s.
Annual average 2000–2006, pp
* Lehman Brothers calculations; change in nominal trade balance
with the US as a percentage of the previous year’s GDP.
1.2
1.0
0.8
0.6
0.40.2
0.0
-0.2
E u r o a r e a
J a p a n
U K
C a n a d a
M e x i c o
K o r e a
A u s t r a l i a
I n d i a
C h i n a
• Three economies stand out as having beneted rom
U.S. demand: Canada, Mexico and China.
• The ormer two are easily explained by these
countries’ proximity to the U.S. and, perhaps, rom
an eect rom NAFTA membership.
• China’s contribution probably refects its export-
led growth strategy, epitomized by its managed
exchange rate policy against the dollar.
• There are also linkages between countries, which
adds to the impact rom U.S. growth.Source: OECD; Datastream; Lehman Brothers Economics.
Source: “Global Decoupling,” Lehman Brothers Economics, July 2007.

7/28/2019 Opinion Thomas Russo -LBHI -2008
http://slidepdf.com/reader/full/opinion-thomas-russo-lbhi-2008 30/42
28
uses o Cash-out reinanCing
share of dollars
Home improvements
Repayment of other debts
Consumer expenditures
Financial investments
Real estate, business inv
Taxes
% 0 10 20 30 40
35
26
16
11
10
2
• Consumers use the equity extracted in a variety o
ways. The majority is spent to repay other debts and
home improvement.
• Some o the money is spent on consumer expen-
ditures including vehicles, education, medical ex-
penses, living expenses, and consumer purchases.
Source: Federal Reserve Survey o Consumers.
size o sovereign wealth und market
with diversifiedmonetaryauthorities
7,000
6,000
5,000
4,000
3,000
2,000
1,000
0
Hedge Fund
Industry
Assets, $bn
Sovereign
Wealth Funds
Global Official FX
Reserves
• Accurate inormation regarding the size o some
sovereign wealth unds (SWFs) is hard to obtain.
• $2.0tr is a very conservative estimate excluding
diversied monetary authorities.
• $2.5tr is a conservative estimate including estimated
excess reserves o diversied monetary authorities.
Note: Diversied monetary authorities are select central banks/
monetary authorities that have signicantly diversied their
assets and investment objectives beyond traditional reserve
management, but not exclusively through a separate SWF
entity.
Source: Central Banking Publications; Lehman Brothers; IMF; CIA
data; Bloomberg.

7/28/2019 Opinion Thomas Russo -LBHI -2008
http://slidepdf.com/reader/full/opinion-thomas-russo-lbhi-2008 31/42
29
reCent sw investments in banks / investment banks
d t i
e
v
($)
15-Jan-08 Citigroup Government o Sin-
gapore Investment
Corporation (GIC),
Kuwait InvestmentAuthority (KIA),
Prince Alawaleed
bin Talal, et al.
$12.5
15-Jan-08 Merrill
Lynch
KIA, Korea Invest-
ment Corp (KIC),
et al.
$6.6
24-Dec-07 Merrill
Lynch
Temasek $4.4
19-Dec-07 Morgan
Stanley
China Investment
Corporation (CIC)
$5.0
10-Dec-07 UBS GIC, Middle East
investor
$11.5
26-Nov-07 Citigroup Abu Dhabi Invest-ment Authority
(ADIA)
$7.5
22-Oct-07 Bear
Stearns
Citic Securities
Company
$1.0
t $48.5
• Since the market turmoil, SWFs and other investors
have made a number o investments to shore up
capital in banks and investment banks.
• The adjacent table does not include the additional
investments SWFs have made in alternative
investment managers (e.g., Blackstone) or in banks
or other strategic purposes (e.g., Barclays).
Note: Deal sizes and stakes estimated and could change due to
changes in FX rates, share prices, and deal terms.
Source: News reports; Dealogic; company press releases.

7/28/2019 Opinion Thomas Russo -LBHI -2008
http://slidepdf.com/reader/full/opinion-thomas-russo-lbhi-2008 32/42

7/28/2019 Opinion Thomas Russo -LBHI -2008
http://slidepdf.com/reader/full/opinion-thomas-russo-lbhi-2008 33/42
31
Group o Thirty Members
Paul A. Volcker
Chairman o the Board o Trustees, Group o Thirty
Former Chairman, Board o Governors o the Federal Reserve System
Jacob A. FrenkelChairman, Group o Thirty
Vice Chairman, American International GroupFormer Governor, Bank o Israel
Montek S. Ahluwalia
Deputy Chairman, Planning Commission o India
Former Director, Independent Evaluation Oce, International Monetary Fund
Abdulati Al-Hamad
Chairman, Arab Fund or Economic and Social Development
Former Minister o Finance and Minister o Planning, Kuwait
Leszek Balcerowicz
Former President, National Bank o Poland
Former Deputy Prime Minister and Minister o Finance, Poland
Georey L. Bell
Executive Secretary, Group o Thirty
President, Georey Bell & Company, Inc.
Jaime Caruana
Counsellor and Director, MCM Department, International Monetary Fund
Former Governor, Banco de EspañaFormer Chairman, Basel Committee on Banking Supervision
Domingo Cavallo
Chairman and CEO, DFC Associates, LLC
Former Minister o Economy, Argentina
E. Gerald Corrigan
Managing Director, Goldman Sachs & Co.
Former President, Federal Reserve Bank o New York
Andrew D. Crockett
President, JP Morgan Chase International
Former General Manager, Bank or International Settlements
Guillermo de la Dehesa Romero
Director and Member o the Executive Committee, Grupo Santander
Former Deputy Managing Director, Banco de EspañaFormer Secretary o State, Ministry o Economy and Finance, Spain
Mario Draghi
Governor, Banca d’Italia Member o the Governing and General Councils, European Central Bank
Former Vice Chairman and Managing Director, Goldman Sachs International
Martin Feldstein
President, National Bureau o Economic Research
Former Chairman, Council o Economic Advisers
Roger FergusonChairman, Swiss Re America Holding Corporation
Former Vice Chairman, Board o Governors o the Federal Reserve System
Former Chairman, Financial Stability Forum
Stanley Fischer
Governor, Bank o Israel Former First Managing Director, International Monetary Fund

7/28/2019 Opinion Thomas Russo -LBHI -2008
http://slidepdf.com/reader/full/opinion-thomas-russo-lbhi-2008 34/42
32
Arminio Fraga Neto
Partner, Gavea Investimentos
Former Governor, Banco do Brasil
Timothy F. Geithner
President and Chie Executive Ocer, Federal Reserve Bank o New York
Former U.S. Undersecretary o Treasury or International Aairs
Gerd Häusler
Vice Chairman, Lazard International
Managing Director and Member o the Advisory Board, Lazard & Co.Former Counsellor and Director, International Capital Markets Department; International Monetary Fund
Mervyn King
Governor, Bank o England
Former Proessor o Economics, London School o Economics
Paul Krugman
Proessor o Economics, Woodrow Wilson School, Princeton University
Former Member, Council o Economic Advisors
Guillermo Ortiz Martinez
Governor, Banco de Mexico
Former Secretary o Finance and Public Credit, Mexico
Tommaso Padoa-Schioppa
Minister o Economy and Finance, Italy
Former Chairman, International Accounting Standards CommitteeFormer Member o the Executive Board, European Central Bank
Lawrence Summers
Charles W. Eliot University Proessor, Harvard UniversityFormer President, Harvard University
Former U.S. Secretary o the Treasury
Jean-Claude Trichet
President, European Central Bank
Former Governor, Banque de France
David Walker
Senior Advisor, Morgan Stanley International Inc.
Former Chairman, Morgan Stanley International Inc.Former Chairman, Securities and Investments Board, UK
Zhou XiaochuanGovernor, People’s Bank o ChinaFormer President, China Construction Bank
Former Asst. Minister o Foreign Trade
Yutaka Yamaguchi
Former Deputy Governor, Bank o Japan
Former Chairman, Euro Currency Standing Commission
Ernesto Zedillo
Director, Yale Center or the Study o Globalization, Yale University
Former President o Mexico
senior MeMbers
William McDonough
Vice Chairman and Special Advisor to the Chairman, Merrill LynchFormer Chairman, Public Company Accounting Oversight Board
Former President, Federal Reserve Bank o New York
William R. Rhodes
Senior Vice Chairman, Citigroup
Chairman, President and CEO, Citicorp and Citibank

7/28/2019 Opinion Thomas Russo -LBHI -2008
http://slidepdf.com/reader/full/opinion-thomas-russo-lbhi-2008 35/42
33
Ernest Stern
Partner and Senior Advisor, The Rohatyn Group
Former Managing Director, J.P. Morgan ChaseFormer Managing Director, World Bank
Marina v. N. Whitman
Proessor o Business Administration & Public Policy, University o MichiganFormer Member, Council o Economic Advisors
eMeritus MeMbers
Lord Richardson o Duntisbourne, KG
Honorary Chairman, Group o Thirty
Former Governor, Bank o England
Richard A. Debs
Advisory Director, Morgan Stanley & Co.
Gerhard Fels
Former Director, Institut der deutschen Wirtschat
Wilried Guth
Former Spokesmen o the Board o Managing Directors, Deutsche Bank AG
Toyoo Gyohten
President, Institute or International Monetary Aairs
Former Chairman, Bank o Tokyo
John G. Heimann
Senior Advisor, Financial Stability Institute
Former US Comptroller o the Currency
Erik Homeyer
Former Chairman, Danmarks Nationalbank
Peter B. Kenen
Senior Fellow in International Economics, Council on Foreign RelationsFormer Walker Proessor o Economics & International Finance, Department o Economics,
Princeton University
Jacques de Larosière
Conseiller, BNP Paribas
Former President, European Bank or Reconstruction and Development
Former Managing Director, International Monetary Fund Former Governor, Banque de France
Shijuro Ogata
Former Deputy Governor, Bank o Japan
Former Deputy Governor, Japan Development Bank
Sylvia Ostry
Distinguished Research Fellow Munk Centre or International Studies, Toronto
Former Ambassador or Trade Negotiations, Canada
Former Head, OECD Economics and Statistics Department

7/28/2019 Opinion Thomas Russo -LBHI -2008
http://slidepdf.com/reader/full/opinion-thomas-russo-lbhi-2008 36/42

7/28/2019 Opinion Thomas Russo -LBHI -2008
http://slidepdf.com/reader/full/opinion-thomas-russo-lbhi-2008 37/42
35
Group O Thirty Publications Since 1990
rePorts
Sharing the Gains rom Trade: Reviving the DohaStudy Group Report. 2004
Key Issues in Sovereign Debt RestructuringStudy Group Report. 2002
Reducing the Risks o International Insolvency A Compendium o Work in Progress. 2000
Collapse: The Venezuelan Banking Crisis o ‘94Ruth de Krivoy. 2000
The Evolving Corporation: Global Imperatives and National ResponsesStudy Group Report. 1999
International Insolvencies in the Financial SectorStudy Group Report. 1998
Global Institutions, National Supervision and Systemic RiskStudy Group on Supervision and Regulation. 1997
Latin American Capital Flows: Living with VolatilityLatin American Capital Flows Study Group. 1994
Defning the Roles o Accountants, Bankers and Regulators in the United StatesStudy Group on Accountants, Bankers and Regulators. 1994
EMU Ater MaastrichtPeter B. Kenen. 1992
Sea Changes in Latin AmericaPedro Aspe, Andres Bianchi and Domingo Cavallo, with discussion by S.T. Beza and William Rhodes. 1992
The Summit Process and Collective Security: Future Responsibility SharingThe Summit Reorm Study Group. 1991
Financing Eastern EuropeRichard A. Debs, Harvey Shapiro and Charles Taylor. 1991
The Risks Facing the World EconomyThe Risks Facing the World Economy Study Group. 1991
tHe WiLLiAM tAYLor MeMoriAL LeCtures
Two Cheers or Financial StabilityHoward Davies. 2006
Implications o Basel II or Emerging Market CountriesStanley Fisher. 2003
Issues in Corporate GovernanceWilliam J. McDonough. 2003
Post Crisis Asia: The Way ForwardLee Hsien Loong. 2001
Licensing Banks: Still Necessary?
Tommaso Padoa-Schioppa. 2000
Banking Supervision and Financial Stability Andrew Crockett. 1998
Global Risk ManagementUlrich Cartellieri and Alan Greenspan. 1996
The Financial Disruptions o the 1980s: A Central Banker Looks BackE. Gerald Corrigan. 1993
7/28/2019 Opinion Thomas Russo -LBHI -2008
http://slidepdf.com/reader/full/opinion-thomas-russo-lbhi-2008 38/42
36
sPeCiAL rePorts
Global Clearing and Settlement: Final Monitoring ReportGlobal Monitoring Committee. 2006
Reinsurance and International Financial MarketsReinsurance Study Group. 2006
Enhancing Public Confdence in Financial ReportingSteering & Working Committees on Accounting. 2004
Global Clearing and Settlement: A Plan o ActionSteering & Working Committees o Global Clearing & Settlements Study. 2003
Derivatives: Practices and Principles: Follow-up Surveys o Industry PracticeGlobal Derivatives Study Group. 1994
Derivatives: Practices and Principles, Appendix III: Survey o Industry PracticeGlobal Derivatives Study Group. 1994
Derivatives: Practices and Principles, Appendix II: Legal Enorceability:Survey o Nine JurisdictionsGlobal Derivatives Study Group. 1993
Derivatives: Practices and Principles, Appendix I: Working PapersGlobal Derivatives Study Group. 1993
Derivatives: Practices and PrinciplesGlobal Derivatives Study Group. 1993
Clearance and Settlement Systems: Status Reports, Autumn 1992Various Authors. 1992
Clearance and Settlement Systems: Status Reports, Year-End 1990Various Authors. 1991
Conerence on Clearance and Settlement Systems;London, March 1990: SpeechesVarious Authors. 1990
Clearance and Settlement Systems: Status Reports, Spring 1990Various Authors. 1990
oCCAsionAL PAPers
75. Banking, Financial, and Regulatory Reorm
Liu Mingkang, Roger Ferguson, Guillermo Ortiz Martinez. 2007
74. The Achievements and Challenges o European Union Financial Integration
and Its Implications or the United States
Jacques de Larosiere. 2007
73. Nine Common Misconceptions About Competitiveness and Globalization
Guillermo de la Dehesa. 2007
72. International Currencies and National Monetary PoliciesBarry Eichengreen. 2006
71. The International Role o the Dollar and Trade Balance AdjustmentLinda Goldberg and Cédric Tille. 2006
70. The Critical Mission o the European Stability and Growth PactJacques de Larosiere. 2004
69. Is It Possible to Preserve the European Social Model?
Guillermo de la Dehesa. 2004
68. External Transparency in Trade PolicySylvia Ostry. 2004
67. American Capitalism and Global Convergence Marina v. N. Whitman. 2003
66. Enron et al: Market Forces in DisarrayJaime Caruana, Andrew Crockett, Douglas Flint, Trevor Harris, Tom Jones. 2002
65. Venture Capital in the United States and EuropeGuillermo de la Dehesa. 2002

7/28/2019 Opinion Thomas Russo -LBHI -2008
http://slidepdf.com/reader/full/opinion-thomas-russo-lbhi-2008 39/42
37
64. Explaining the Euro to a Washington AudienceTommaso Padoa-Schioppa. 2001
63. Exchange Rate Regimes: Some Lessons rom Postwar EuropeCharles Wyplosz. 2000
62. Decisionmaking or European Economic and Monetary UnionErik Homeyer. 2000
61. Charting a Course or the Multilateral Trading System: The SeattleMinisterial Meeting and BeyondErnest Preeg. 1999
60. Exchange Rate Arrangements or the Emerging Market EconomiesFelipe Larraín and Andrés Velasco. 1999
59. G3 Exchange Rate Relationships:A Recap o the Record and a Review o Proposals or ChangeRichard Clarida. 1999
58. Real Estate Booms and Banking Busts: An International PerspectiveRichard Herring and Susan Wachter. 1999
57. The Future o Global Financial RegulationSir Andrew Large. 1998
56. Reinorcing the WTOSylvia Ostry. 1998
55. Japan: The Road to Recovery
Akio Mikuni. 1998
54. Financial Services in the Uruguay Round and the WTOSydney J. Key. 1997
53. A New Regime or Foreign Direct InvestmentSylvia Ostry. 1997
52. Derivatives and Monetary PolicyGerd Hausler. 1996
51. The Reorm o Wholesale Payment Systemsand Impact on Financial MarketsDavid Folkerts-Landau, Peter Garber, and Dirk Schoenmaker. 1996
50. EMU ProspectsGuillermo de la Dehesa and Peter B. Kenen. 1995
49. New Dimensions o Market Access
Sylvia Ostry. 1995
48. Thirty Years in Central BankingErik Homeyer. 1994
47. Capital, Asset Risk and Bank FailureLinda M. Hooks. 1994
46. In Search o a Level Playing Field: The Implementationo the Basle Capital Accord in Japan and the United StatesHal S. Scott and Shinsaku Iwahara. 1994
45. The Impact o Trade on OECD Labor MarketsRobert Z. Lawrence. 1994
44. Global Derivatives: Public Sector ResponsesJames A. Leach, William J. McDonough, David W. Mullins, Brian Quinn. 1993
43. The Ten Commandments o Systemic Reorm
Vaclav Klaus. 199342. Tripolarism: Regional and Global Economic Cooperation
Tommaso Padoa-Schioppa. 1993
41. The Threat o Managed Trade to Transorming EconomiesSylvia Ostry. 1993
40. The New Trade AgendaGeza Feketekuty. 1992
39. EMU and the RegionsGuillermo de la Dehesa and Paul Krugman. 1992
7/28/2019 Opinion Thomas Russo -LBHI -2008
http://slidepdf.com/reader/full/opinion-thomas-russo-lbhi-2008 40/42
38
38. Why Now? Change and Turmoil in U.S. BankingLawrence J. White. 1992
37. Are Foreign-owned Subsidiaries Good or the United States?Raymond Vernon. 1992
36. The Economic Transormation o East Germany:Some Preliminary LessonsGerhard Fels and Claus Schnabel. 1991
35. International Trade in Banking Services: A Conceptual FrameworkSydney J. Key and Hal S. Scott. 1991
34. Privatization in Eastern and Central EuropeGuillermo de la Dehesa. 1991
33. Foreign Direct Investment: The Neglected Twin o TradeDeAnne Julius. 1991
32. Interdependence o Capital Markets and Policy ImplicationsStephen H. Axilrod. 1990
31. Two Views o German ReunifcationHans Tietmeyer and Wilried Guth. 1990
30. Europe in the Nineties: Problems and AspirationsWilried Guth. 1990
29. Implications o Increasing Corporate Indebtedness or Monetary PolicyBenjamin M. Friedman. 1990
28. Financial and Monetary Integration in Europe: 1990, 1992 and BeyondTommaso Padoa-Schioppa. 1990

7/28/2019 Opinion Thomas Russo -LBHI -2008
http://slidepdf.com/reader/full/opinion-thomas-russo-lbhi-2008 41/42
7/28/2019 Opinion Thomas Russo -LBHI -2008
http://slidepdf.com/reader/full/opinion-thomas-russo-lbhi-2008 42/42
Group of ThirTy
1726 M Street, N.W., Suite 200
Washington, DC 20036