opportunities for construction industries at minagri · opportunities for construction industries...
TRANSCRIPT

Azene Bekele-Tesemma,
AG-Consult
June 3, 2008
Opportunities for Construction
Industries at MINAGRI Government of Rwanda

Facilitating and promoting: 1. Increased productivity of land by catalyzing
comprehensive land-husbandry work on 30,250 ha land in 34 sub-watersheds and
2. Farmer-driven, and professionally managed commercial agriculture on a 10,000 ha irrigable hillside land within the same 34 sub-watersheds


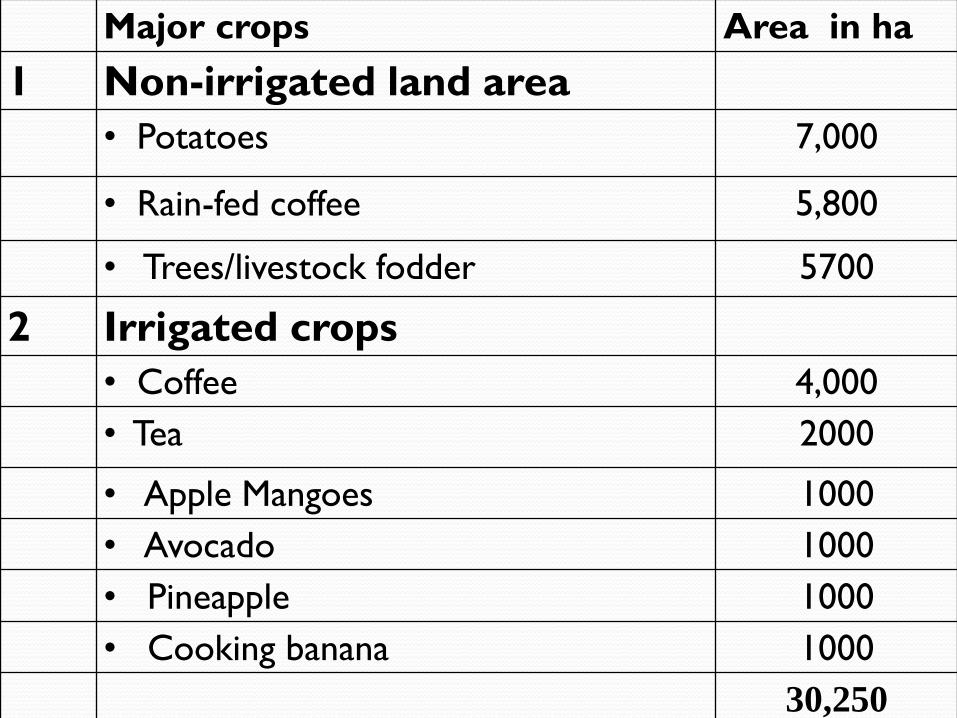
Major crops Area in ha
1 Non-irrigated land area
• Potatoes 7,000
• Rain-fed coffee 5,800
• Trees/livestock fodder 5700
2 Irrigated crops
• Coffee 4,000
• Tea 2000
• Apple Mangoes 1000
• Avocado 1000
• Pineapple 1000
• Cooking banana 1000
30,250

Major land Management interventions Nearly level to
strongly
undulating (slope
0-6 %)
Grass strips/trash lines (~1km /ha) 3000
ha agroforestry interventions
Intercropping with plant cover and green manuring
Applying manure/compost at the rate of 10 tons/ha & mulching
Gently rolling to
strongly rolling
(slope 6- 16%)
Construction of soil bunds (1km/ha) (level or graded as per ACZ) 10,000
ha Planting trees/shrubs along the lower side supporting the bunds
intercropping with forage legumes and green manuring
Applying manure /compost at 10 tons/ha and mulching
Hilly to steep
(slope 16 – 40 %
Constructing Bench (radical) terraces (~1km/ha) 16, 450
ha Planting trees/shrubs along the lower side supporting the radical
terraces
intercropping and green manuring
liming with agricultural lime at 2.5 tons/ha
Applying manure /compost at 10 tons/ha and mulching
Very steep (slope
40 – 60 %)
Constructing progressive terraces (~5 km/ha) 700 ha
Intercropping and green manuring
Extremely steep
(slope 60 – 120%)
Constructing micro-basins with tree planting pits at 1000 /ha plus
in-situ conservation, feed development for zero-grazing
100 ha
30,250

Project components
Budgetary flow at implementations period
(A) Infrastructure, input & services
Transacted in the country Transacted abroad
Year 1 Year 2 Year 3 Year 4 Year 1 Year 2 Year 3 Year 4 Total
A1. Project coordination 1.34 1.66 1.14 0.86 0.98 1.22 0.28 0.22 7.7
A2. Facilitation and empowerment of beneficiaries
2.86 3.54 0 0 0.67 0.83 0 0 7.9
A3. Land-husbandry 21.87 27.12 0 0 3.44 4.26 0 0 56.69
A4. Water catchments protection
0.25 0.3 0.85 0.65 0.07 0.08 0.04 0.03 2.27
A5. Construction of 101 Reservoir & laying out conveyance
6.04 7.48 19.42 14.76 8.48 10.52 21.59 16.41 104.7
A6. Irrigation on 10,000ha 2.01 2.49 5 3.8 0.22 0.28 1.36 1.04 16.2
A7. M&E and up-scaling 0.09 0.12 0 0 0.89 1.11 0 0 2.21
(B1 ) Strengthening staffs 0.32 0.4 0 0 0.71 0.89 0 0 2.32
Total 34.78 43.12 26.41 20.07 15.47 19.18 23.28 17.69 200

Budgetary plan by source of fund and year
Year DONOR Grant
25%
Loan
60%
GoR and
Beneficiaries
15%
Total
1. 12.5 30.0 7.5 50
2. 15.5 37.2. 9.3 62
3. 12.5 30.0 7.5 50
4 9.5 22.8 5.7 38
Total 50.0 120.0 30.0 200
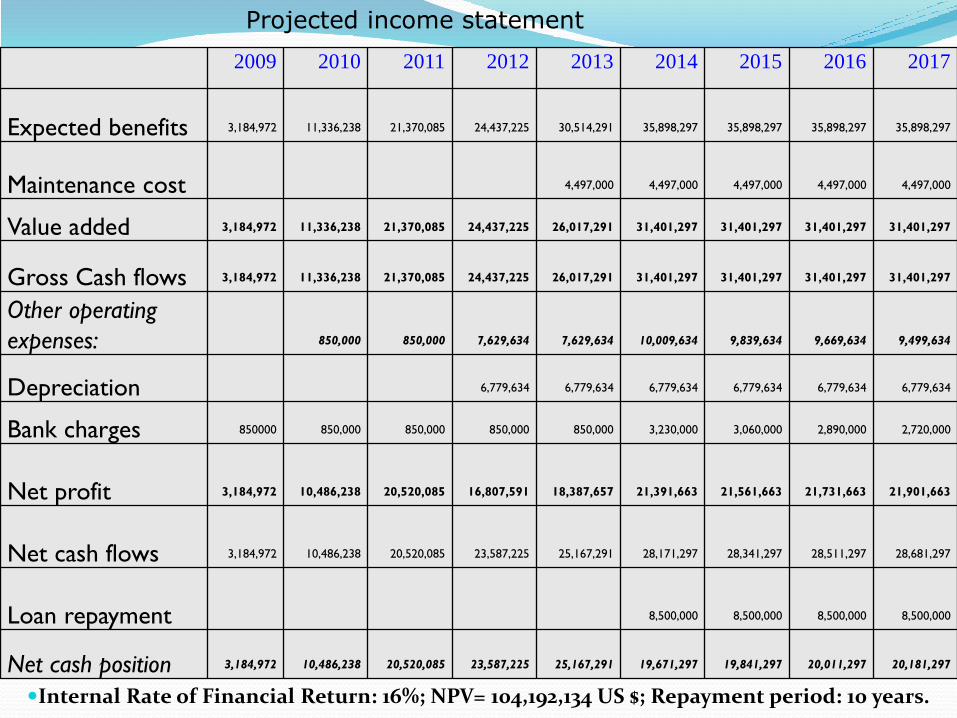
Internal Rate of Financial Return: 16%; NPV= 104,192,134 US $; Repayment period: 10 years.
2009 2010 2011 2012 2013 2014 2015 2016 2017
Expected benefits 3,184,972 11,336,238 21,370,085 24,437,225 30,514,291 35,898,297 35,898,297 35,898,297 35,898,297
Maintenance cost 4,497,000 4,497,000 4,497,000 4,497,000 4,497,000
Value added 3,184,972 11,336,238 21,370,085 24,437,225 26,017,291 31,401,297 31,401,297 31,401,297 31,401,297
Gross Cash flows 3,184,972 11,336,238 21,370,085 24,437,225 26,017,291 31,401,297 31,401,297 31,401,297 31,401,297
Other operating
expenses: 850,000 850,000 7,629,634 7,629,634 10,009,634 9,839,634 9,669,634 9,499,634
Depreciation 6,779,634 6,779,634 6,779,634 6,779,634 6,779,634 6,779,634
Bank charges 850000 850,000 850,000 850,000 850,000 3,230,000 3,060,000 2,890,000 2,720,000
Net profit 3,184,972 10,486,238 20,520,085 16,807,591 18,387,657 21,391,663 21,561,663 21,731,663 21,901,663
Net cash flows 3,184,972 10,486,238 20,520,085 23,587,225 25,167,291 28,171,297 28,341,297 28,511,297 28,681,297
Loan repayment 8,500,000 8,500,000 8,500,000 8,500,000
Net cash position 3,184,972 10,486,238 20,520,085 23,587,225 25,167,291 19,671,297 19,841,297 20,011,297 20,181,297
Projected income statement

Environmental Impact
1. Watershed approach
2. Interventions fitted to:
Slope categories
Agroclimatic zones
3. Dams are micro-level
4. Inundation of farms and houses very minimal
5. More natural ecosystem
6. Community-preferred crops, dam-sites
7. Labor saving & supportive to rural health and sanitation
8. Natural mitigating measures
9. Consultations with
Beneficiaries
facilitators

Thank you !!!