opportunities for equitable access to quality basic ... · of katanga to describe children’s...
TRANSCRIPT

1
Prepared by:
Catalina Torrente, John Lawrence Aber & Brian Johnston
New York University
Anjuli Shivshanker
International Rescue Committee Research, Evaluation & Learning Unit
Evaluation Team:
Jeannie Annan & Tom Bundervoet
International Rescue Committee Research, Evaluation & Learning Unit
May 2012
Opportunities for Equitable Access to Quality Basic Education (OPEQ)
Baseline Report: Results from the Socio-Emotional Wellbeing &
Perceptions of School Context Data in Katanga Province, DRC

2
This report is made possible by the generous support of the American people through the United States
Agency for International Development (USAID). The contents are the responsibility of the IRC and do
not necessarily reflect the views of USAID or the United States Government.
With special thanks to:
Anita Anastacio, Aissatou Balde, Willy Mpwate, Julia Frazier, Jennifer Sklar, Nina Weisenhorn,
the Democratic Republic of Congo Ministry of Primary, Secondary, and Professional Education
(MEPSP), and our talented data collection supervisors and enumerators
Acknowledgments
Thanks to Dr. Edward Seidman for his continued support and to our dedicated research
assistants and volunteers at NYU: Dirk Witteveen, Taveeshi Gupta, Emily Jacobson, Todd
Solomon, Mahjabeen Raza, Marissa McCoy, Alana Gross, Marian Tes, Damira Rasheed, and
Vanessa Paul.

3
Table of Contents
Executive Summary .................................................................................................................... 5
Introduction .................................................................................................................................. 9
Sample Description .................................................................................................................... 10
Measure Development .............................................................................................................. 10
Baseline Descriptive Findings .................................................................................................. 12
Children’s Perception of Schools, Classrooms, and Teachers ................................. 12
Supportive Schools & Teachers ...................................................................... 12
Schools & Classrooms as Predictable & Cooperative Contexts ................. 16
Children’s Socio-emotional Wellbeing ...................................................................... 18
Victimization .................................................................................................... 18
Mental Health ................................................................................................... 21
Associations between SEL Constructs .................................................................................... 25
Preliminary Regression Analyses ........................................................................................... 26
Introduction ................................................................................................................... 26
Preliminary Results
Child demographic characteristics ............................................................................. 28
General household characteristics .............................................................................. 28
Other living conditions ................................................................................................ 28
Prior school adaptation ............................................................................................................. 29
Conclusion .................................................................................................................................. 33
List of Tables
Table 1. SIRC and CSCLE across DRC, Nigeria and South Africa ...................................... 13
Table 2. Mental Health mean scores in Katanga (OPEQ) and Kinshasa samples ............ 22

4
Table 3. Complete list of child characteristics organized by block ..................................... 27
Table 4. Summary of results for child socio-emotional outcomes as predicted by child
characteristics ............................................................................................................... 31
List of Figures
Figure 1. Distribution of variability in children's perceptions of support from schools and
teachers ........................................................................................................................... 14
Figure 2. Boxplots of children's perceptions of supportive schools and teachers by
subdivision ..................................................................................................................... 15
Figure 3. Variability in children's perceptions of predictable and cooperative schools and
Classrooms ..................................................................................................................... 16
Figure 4. Boxplots of children's perceptions of supportive schools and teachers by
Subdivision .................................................................................................................... 17
Figure 5. Variability in children's victimization .................................................................... 19
Figure 6. Boxplots of children's report of victimization by subdivision ........................... 20
Figure 7. Variability in children's mental health ................................................................... 23
Figure 8. Boxplots of Mental health problems by subdivision ............................................ 24
5
Executive Summary
1. Introduction
The International Rescue Committee (IRC), in partnership with Research Triangle Institute
(RTI), the Flemish Association for Development Cooperation and Technical Assistance (VVOB)
and the Institute of Human Development and Social Change (IHDSC) at New York University
(NYU), has undertaken an initiative entitled Opportunities for Equitable Access to Quality Basic
Education (OPEQ) with the purpose of enhancing learning opportunities, academic attainment
and socio-emotional wellbeing for more than 480,000 girls and boys in three eastern provinces
of the Democratic Republic of Congo.
The IRC and NYU are conducting a cluster-randomized trial of OPEQ, aiming to evaluate the
efficacy of the intervention and inform efforts for the improvement of learning conditions in the
DRC and other post-conflict settings. The present report uses baseline data from the province
of Katanga to describe children’s socio-emotional learning (SEL) outcomes, and present
preliminary regression analyses examining how children’s characteristics relate to their socio-
emotional wellbeing. A description of the overall design and data collection procedures can be
found in the child literacy and numeracy baseline report (Torrente et al., 20111).
2. Main Descriptive Results
Supportive Schools & Teachers
Children perceived their schools and teachers as being highly supportive. However, there are
some aspects of school supportiveness that require more improvement than others (i.e., scores
were relatively lower for child-centered and intellectually stimulating environments than for
safe, inclusive and respectful climates), and there is substantial variability between children and
among subdivisions.
Schools & Classrooms as Predictable & Cooperative Contexts
Overall, children reported that their schools and classrooms were somewhat predictable and
cooperative, but there appears to be more room for improvement in this dimension than in how
supported children felt in their schools.
1 Torrente, C., Aber, J.L., Shivshanker, A., Annan, J., & Bundervoet, T. (2011). Opportunities for Equitable
Access to Quality Basic Education (OPEQ). Results from the Early Grade Reading Assessment, the Early
Grade Math Assessment, and children’s demographic data in Katanga Province, Democratic Republic of
Congo. Unpublished Manuscript.

6
Victimization
On average, children reported being victimized "never" (a score of 1) to "one or two times" (a
score of 2) in the two weeks preceding the survey. Interestingly, only 15.5% of children reported
never being victimized, suggesting that the vast majority of children experienced some level of
victimization at school.
Mental Health
Average levels of mental health problems were moderate, but as with the constructs previously
described, this does not imply that there is no room for improvement. Only about half of the
variance in children's mental health can be attributed to individual differences between
children, about a third of the variance can be explained by differences between subdivisions,
and the remaining variance can be explained by difference between schools. These patterns
suggest there is a lot of potential for school-based initiatives aiming to improve children’s
outcomes.
3. Main Results from Regression Analyses
Overall, children’s personal characteristics were not associated with their socio-emotional
outcomes. The only exception was conduct problems, which was more prevalent for 2nd
graders (relative to 3rd and 4th graders) and less prevalent for 3rd graders (relative to 4th graders).
Regarding children’s household characteristics, results suggest different patterns of associations
for children’s perceptions of their school environment vs. children’ self-reports of socio-
emotional wellbeing. For example, children living in households with high children burden
(children per adult) perceived their schools and teachers as less supportive, but reported less
hyperactivity & emotional symptoms.
Children’s diet and job at home were important correlates of their socio-emotional outcomes.
Specifically, children whose diet included meat - an index of wealth – and who had a job at
home tended to report less mental health (conduct problems, hyperactivity & emotional
symptoms) and victimization problems. Children who reported having a job at home also
rated schools and teachers as more supportive and schools as more predictable and
cooperative.
The associations found between attending kindergarten, getting homework and help with
homework and children’s socio-emotional outcomes were rather puzzling. For instance,
children who attended kindergarten reported more conduct problems, hyperactivity &
emotional symptoms and victimization. The meaning of getting homework and getting help

7
with homework in the DRC needs clarification. It is possible that children who are struggling in
school are the ones who are assigned homework and need someone to help at home.
4. Conclusions and recommendations
Overall, our results indicate substantial variability between children, between schools and
subdivisions in children’s socio-emotional outcomes. OPEQ’s goal of providing “equitable
access to quality basic education” is a promising effort to close the gap between children at the
high and low ends of the spectrum.
Descriptive findings from Katanga suggest that on average children perceive their schools and
teachers as supportive, but that compared to other African countries improvement is needed in
creating intellectually stimulating and student-centered learning environments. Providing
supportive environments for all children should be a goal of all schools. As suggested by our
findings, children’s perceptions of supportive schools and teachers are associated with lower
levels of victimization and mental health problems.
Also, children perceived their schools and classrooms as moderately predictable and
cooperative, and there is considerable room for improvement in this dimension. Features of
schools and subdivisions appear to play a very important role on how children come to see
their schools and classrooms. Establishing routines and being explicit about the classroom
schedule, as well as promoting peer cooperation by means of small-group work and the
encouragement of sharing, may all contribute to children’s perceptions of their schools and
classrooms as predictable and cooperative.
In terms of children’s individual wellbeing, victimization appears to be a more common
experience for Congolese children than for children in other countries. Whereas the average
rates of victimization are not alarming, the vast majority of children experience some level of
peer victimization at school, and as corroborated by our results, victimization takes a toll on
children’s mental health. Victimization is mostly associated with children’s individual
characteristics, meaning that some children may be more susceptible to be targets of aggression.
Schools should aim to promote environments that prevent victimization for all children by
developing tolerance for diversity, empathy and other moral emotions, as well as the mastery of
non-aggressive ways of interaction.
Children’s self-reports of mental health problems suggest moderate levels of conduct
problems, hyperactivity & emotional symptoms. However, levels of mental health issues
appear to be higher than in Kinshasa, where children may be less exposed to violent conflict or
other negative experiences. There was a substantial amount of variability in children's mental
health problems that lies between subdivisions, and a large proportion that resides at the school

8
level. Programs like OPEQ may help schools in providing increasingly supportive contexts for
struggling children.
Regression analyses indicated that with the exception of grade differences in conduct problems,
children’s personal characteristics (i.e., gender, grade, language) were not related to their socio-
emotional outcomes. In terms of household characteristics, children’s living conditions, and
kindergarten experiences, results were mixed. Some household characteristics that were
negatively associated with children’s perceptions of schools were positively related to children’s
mental health. Also, findings related to children’s kindergarten experiences were
counterintuitive. These results should be interpreted with caution as the direction of causality
cannot be determined and these results focused on the unique contribution of each variable to
children’s socio-emotional outcomes. A clearer picture may emerge when their interactions are
explored, as well as by examining their cumulative effects on children’s outcomes. Future
analyses are expected to shed light on some of these unexpected findings, and to explore the
contribution of teacher and school characteristics to children’s outcomes.

9
INTRODUCTION
The International Rescue Committee (IRC), in partnership with Research Triangle Institute
(RTI), the Flemish Association for Development Cooperation and Technical Assistance (VVOB)
and the Institute of Human Development and Social Change (IHDSC) at New York University
(NYU), has undertaken an initiative entitled Opportunities for Equitable Access to Quality Basic
Education (OPEQ). The main objective of OPEQ is to improve primary education in North
Kivu, South Kivu and Katanga provinces of the Democratic Republic of Congo (DRC), for more
than 480,000 girls and boys.
The OPEQ project consists of two key interventions: 1) an Integrated Curriculum (IC) that
incorporates the IRC’s socio-emotional learning model (Healing Classrooms, a protocol of
techniques to create safe, inclusive learning environments for all learners) into high-quality
reading and math curricula; and 2) a collaborative professional development system of
continuous in-service Teacher Training and Coaching (TTC). In addition, the OPEQ team has
worked with the DRC Ministry of Primary, Secondary and Professional Education (MEPSP) to
revive TTC practices in their education system; and to strengthen community participation
through school management committees and parent-teacher associations. OPEQs coordinated
efforts aim to improve children’s access to quality elementary education in approximately 350
communities, enhance teachers’ motivation and performance and socio-emotional wellbeing,
literacy, and math outcomes for hundreds of thousands of Congolese children.
As part of the IRC’s commitment to gathering evidence about the impact of its interventions,
the IRC and NYU are conducting a cluster-randomized trial (CRT) on the IC and TTC
components of OPEQ. The impact evaluation will gather evidence about the impact of OPEQ
on teachers' motivation and performance and children’ outcomes; examine whether the impact
of OPEQ varies as a function of characteristics of children (e.g., gender, grade), schools (e.g.,
school size) and communities (e.g., access to resources); make improvements over the life of the
project; and inform similar initiatives and policy efforts in DRC and internationally.
Baseline data for the impact evaluation were collected in Katanga province from March to May
2011 from three different sources: school principals, teachers and children. Children provided
information about their background and household characteristics through a demographic
questionnaire, were assessed on their reading and math skills using the EGRA (Early Grade
Reading Assessment) and EGMA (Early Grade Math Assessment), and on their socio-emotional
wellbeing and perceptions of schools, classrooms and teachers using two socio-emotional
learning (SEL) surveys. Results for child academic performance and teacher characteristics are

10
summarized in the literacy and numeracy and teacher baseline reports, respectively2. The
current report presents descriptive findings and preliminary regression analyses on children's
socio-emotional wellbeing and perceptions of school contexts.
Sample Description
As explained in the child literacy and numeracy baseline report, in order to reduce participant
burden all children who participated in baseline data collection were administered the
demographic survey and were randomly assigned to different pairs of additional assessments
(e.g., EGRA and EGMA, EGMA and socio-emotional well being, etc.). As a result of this
strategy, 4,777 children -out of the 6,702 children who were assessed at baseline-completed one
or two SEL questionnaires. This report is based on the random sub-sample of 993 2nd to 4th
grade children (42.3% girls; 35% 2nd grade, 33% 3rd grade, 32% 4th) who were administered the
demographic survey and the two SEL questionnaires. The sample includes 84 schools across
six educational subdivisions in Katanga province: Kalemie, Kasenga, Kambove, Kongolo,
Mutshatsha and Lubudi. A more detailed description of the sampling and data collection
procedures can be found in the literacy and numeracy baseline report1.
Measure Development
The two SEL questionnaires consisted of a combination of questions from pre-validated
measures and questions developed by the NYU team to assess specific aspects of IRC's Healing
Classrooms program (see Appendix A).
Together, the surveys had a total of 95 questions (excluding administrative questions) and each
took an average of 11 minutes to be administered. All questions were measured with ordinal
Likert-scales from 1 to 4 or 0 to 3, with lower values indicating less endorsement or lower
frequency depending on the construct.
Exploratory factor analyses were conducted using Mplus version 5.2 (Muthen & Muthen, 1998-
2007) with the aim of reducing the number of questions and identifying an internally reliably
and robust set of constructs to be carried over to future waves of data collection. Mplus enabled
us to address two methodological challenges present in our data. Specifically, we were able to
adjust for the nesting of children in subdivisions and to accurately model categorical, as
2 Child literacy and numeracy report: Torrente, C., Aber, J.L., Shivshanker, A., Annan, J., & Bundervoet,
T. (2011). Opportunities for Equitable Access to Quality Basic Education (OPEQ). Results from the Early
Grade Reading Assessment, the Early Grade Math Assessment, and children’s demographic data in
Katanga Province, Democratic Republic of Congo. Unpublished Manuscript. Teacher report: Torrente, C.,
Aber, J.L., Witteveen, D., Gupta, T., Johnston, B., Shivshanker, A.. Annan, J., & Bundervoet, T. (2012).
Baseline Report: Teacher Survey Results. Unpublished Manuscript.
11
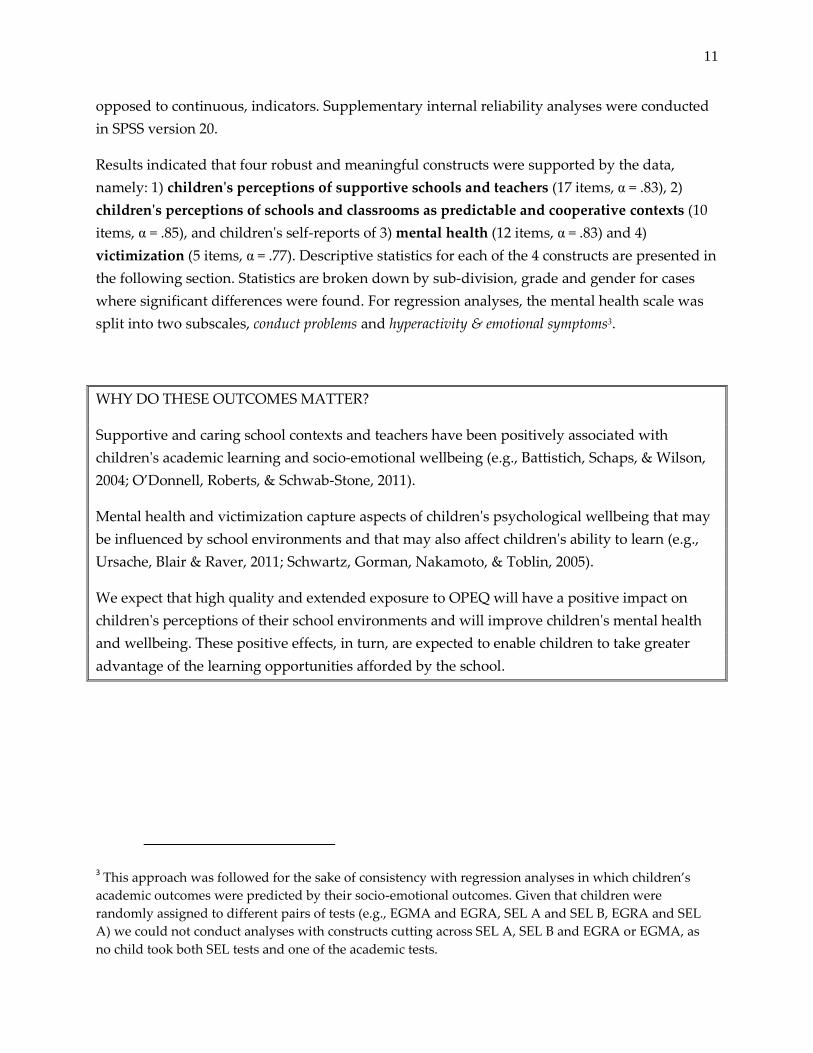
opposed to continuous, indicators. Supplementary internal reliability analyses were conducted
in SPSS version 20.
Results indicated that four robust and meaningful constructs were supported by the data,
namely: 1) children's perceptions of supportive schools and teachers (17 items, α = .83), 2)
children's perceptions of schools and classrooms as predictable and cooperative contexts (10
items, α = .85), and children's self-reports of 3) mental health (12 items, α = .83) and 4)
victimization (5 items, α = .77). Descriptive statistics for each of the 4 constructs are presented in
the following section. Statistics are broken down by sub-division, grade and gender for cases
where significant differences were found. For regression analyses, the mental health scale was
split into two subscales, conduct problems and hyperactivity & emotional symptoms3.
WHY DO THESE OUTCOMES MATTER?
Supportive and caring school contexts and teachers have been positively associated with
children's academic learning and socio-emotional wellbeing (e.g., Battistich, Schaps, & Wilson,
2004; O’Donnell, Roberts, & Schwab-Stone, 2011).
Mental health and victimization capture aspects of children's psychological wellbeing that may
be influenced by school environments and that may also affect children's ability to learn (e.g.,
Ursache, Blair & Raver, 2011; Schwartz, Gorman, Nakamoto, & Toblin, 2005).
We expect that high quality and extended exposure to OPEQ will have a positive impact on
children's perceptions of their school environments and will improve children's mental health
and wellbeing. These positive effects, in turn, are expected to enable children to take greater
advantage of the learning opportunities afforded by the school.
3 This approach was followed for the sake of consistency with regression analyses in which children’s
academic outcomes were predicted by their socio-emotional outcomes. Given that children were
randomly assigned to different pairs of tests (e.g., EGMA and EGRA, SEL A and SEL B, EGRA and SEL
A) we could not conduct analyses with constructs cutting across SEL A, SEL B and EGRA or EGMA, as
no child took both SEL tests and one of the academic tests.

12
BASELINE DESCRIPTIVE FINDINGS
Children’s Perception of Schools, Classrooms, and Teachers
Supportive Schools & Teachers
Children's perceptions of how supportive their schools and teachers are were measured with a
combination of questions from the Relationship with Teacher Questionnaire (Blankemeyer,
Flannery, & Vazsonyi, 20024), and questions from two scales developed by the American
Institutes for Research (AIR) to evaluate UNICEF's Child Friendly Schools (CFS) initiative. The
AIR scales used were the Safe, Inclusive and Respectful Climates scale (SIRC) and the
Challenging Student-Centered Environments scale (CSCLE).
Children were asked to rate in a scale ranging from 1 to 4 (1: completely false, 2: a little false, 3:
a little true, 4: completely true) the extent to which, for example, they felt respected by teachers,
teachers are fair and willing to provide help, and their school is a welcoming place for children
like them. A list of all questions is included in the Appendix.
Overall, children perceived their schools and teachers as being highly supportive (M = 3.28,
SD = .46). However, as shown below, there are some aspects of school supportiveness that
require more improvement than others, and there is substantial variability between children
and among subdivisions.
For the purpose of comparison with the CFS evaluation (UNICEF, 20095), mean scores were
computed separately for the SIRC and CSCLE scales (see Table 1). The CFS evaluation found
lower average scores for SIRC in South African schools that had recently started implementing
the CFS principles, as well as Nigerian schools that have been implementing CFS for more than
2 years. Interestingly, results for the CSCLE scale were higher in these two countries than they
were in the DRC.
4 Blankemeyer, M., Flannery, D. J., & Vazsonyi, A. T. (2002). The role of aggression and social competence
on children’s perceptions of the child-teacher relationship. Psychology in the Schools, 39(3), 293-304. 5 UNICEF (2009). Child friendly schools programming: Global Evaluation Report. United Nations
Children’s Fund, New York, NY.

13
Table 1. SIRC and CSCLE across DRC, Nigeria and South Africa
Means (and Standard Deviations)
Scale/Country DRC (OPEQ) Nigeria South Africa
Safe, Inclusive and
Respectful climates (SIRC)
3.37 (SD = .53) 3.08 (n.a)6 2.94 (n.a)
Challenging Student-
Centered Environments
(CSCLE)
3.10 (SD = .55) 3.32 (n.a) 3.35 (n.a)
This comparison suggests that while Congolese teachers and schools were regarded as more
safe, inclusive and respectful than the African teachers and schools in the UNICEF CFS
evaluation, DRC schools and teachers are lagging behind in terms of creating student-
centered and intellectually challenging learning environments.
Moving beyond average scores, and as illustrated in the pie chart and boxplots below (see
Figures 1 and 2), there is significant variability between children, between schools and among
subdivisions regarding children's perceptions of how supportive their schools and teachers are.
The pie chart shows that most of the variability resides between children (79.54%), suggesting
that children in the same school perceived significantly different levels of support from teachers
and other school members. These differences may reflect differential treatment and inequitable
learning opportunities for different groups of children. Preliminary descriptive analyses did
not suggest that gender or grade explained differences in children's perceptions of support.
Future analysis will seek to illuminate what factors underlie these differences in children’s
appraisals of their school and teachers.
Importantly, while most of the variation lies between children, differences between schools and
subdivisions account for about 20% of the variance in children's perceptions. The amount of
variation attributable to differences between subdivisions in striking, and it suggests that there
are meaningful differences across subdivisions that impact how children view their schools. The
nature of these differences remains a question to be explored. These may relate to differential
amounts of education resources across subdivisions, distinct educational policies, or different
levels of exposure to violent conflict, among others.
6 n.a: data not available.

14
The length of the whiskers in the boxplots in Figure 2 shows that in Kalemie, Kongolo and
Lubudi over 30% of children obtained scores below 3, indicating that they reported that their
schools and teachers’ being supportive was "a little true" to "a little false". Mutshatsha and
Kambove, in contrast, stood out for having the highest overall scores coupled with the smallest
amount of variation between children (as indicated by the relatively short whiskers). This
means that in these two subdivisions the majority of children perceived their schools and
teachers as being highly supportive.
Altogether, findings suggest that in spite of the overall positive outlook, there is still
considerable room for improvement in this aspect of school climate.
9.84%
79.54%
10.62%
Figure 1. Distribution of variability in children's perceptions of support from schools and teachers
School
Children
Subdivision

15
Figure 2. Boxplots of children's perceptions of supportive schools and teachers by subdivision
How to interpret boxplots:
The box shows the range of scores for 50% of children.
The horizontal line inside the box is the median score (50% of children got
scores above that score and 50% got scores below that score).
The lines (or whiskers) coming out of the box on either end show the full
range of scores (the maximum and the minimum).
The line coming from the top of the box represents the top 25%; the line
coming from the bottom of the box represents the bottom 25%.
The “longer” the box and whiskers appear, the more variability is present.
The dots and stars outside of the lines (or whiskers) show outlier scores.

16
Schools & Classrooms as Predictable & Cooperative Contexts
The questions to measure predictability and cooperativeness of school contexts were developed
by the NYU team and asked children to rate in a scale from 1 to 4 (1: completely false, 2: a little
false, 3: a little true, 4: completely true) whether they knew their classroom routines (e.g.,
knowing what time their lessons begin) and the degree to which their peers shared and worked
together to learn.
The average score in this measure was 2.63 (SD = .73), which is lower than the score obtained in
the supportive schools and teachers dimension. Overall, children reported that their schools
and classrooms were somewhat predictable and cooperative, but there appears to be more room
for improvement in this dimension than in how supported children felt in their schools.
The distribution of variability between children, schools and subdivisions looks very different
from that of the previous measure. As shown by the pie chart, a large amount of variability can
be explained by characteristics of schools and subdivisions, and only about half of the variation
in scores can be explained by differences between children. This suggests that the characteristics
of schools and subdivisions are as influential as children’s individual characteristics in shaping
children’s perceptions of their schools and classrooms. There are teaching practices or school
conditions that permeate the school as a whole, as well as regional policies or socio-economic
conditions that lead children in the same subdivision to perceive similar levels of predictability
and cooperativeness in their school environments. This means that introducing school- or
subdivision-wide initiatives to enhance predictability and cooperativeness in the school and
classroom may have powerful transformative effects on children’s feelings about school.
As indicated by the boxplots in Figure 4, there are substantial differences in the median scores
and in the dispersion of scores across subdivisions. Kambove stood out for having the least
19.73%
48.98%
31.29%
Figure 3. Variability in children's perceptions of predictable and cooperative schools and
classrooms
School
Children
Subdivision

17
predictable and cooperative classrooms. This contrasts with the fact that it had one of the
highest levels of supportive schools and teachers. Kasenga, Kongolo and Lubudi had the
greatest heterogeneity in scores; and Mutshatsha and Kalemie had the highest median scores.
Children in Mutshatsha also perceived their schools and teachers as highly supportive.
As with supportive schools and teachers, inspection of descriptive statistics did not reveal
meaningful differences by gender and grade.
Figure 4. Boxplots of children's perceptions of supportive schools and teachers by subdivision
How to interpret boxplots:
The box shows the range of scores for 50% of children.
The horizontal line inside the box is the median score (50% of children got
scores above that score and 50% got scores below that score).
The lines (or whiskers) coming out of the box on either end show the full
range of scores (the maximum and the minimum).
The line coming from the top of the box represents the top 25%; the line
coming from the bottom of the box represents the bottom 25%.
The “longer” the box and whiskers appear, the more variability is present.
The dots and stars outside of the lines (or whiskers) show outlier scores.

18
Children's Socio-Emotional Wellbeing
Victimization
Children were asked to report the frequency with which they have been subject to physical
(e.g., being pushed, hit, called bad names) or relational (e.g., being excluded, being the object of
rumors) aggression by their peers in the past two weeks, using a set of previously validated
questions (Orpinas & Kelder, 19957). Children provided their answers in a scale from 1 to 4 (1:
Never, 2: One or two times, 3: Some times, 4: Many times).
On average, children reported being victimized "never" to "one or two times" in the two weeks
preceding the survey (M = 1.88, SD = .68). Interestingly, only 15.5% of children got a score of 1
(i.e., "never"), suggesting that the vast majority of children experienced some level of
victimization at school.
Although not entirely comparable due to differences in the context and age of children, a study
conducted using the same measure with a sample of 3rd grade children from low-income inner-
city schools in the U.S. found a nearly identical mean score at baseline (M = 1.89, SD = .84) but a
higher percentage (21.4%) of children reporting "never" being victimized in the week before the
survey (4Rs Impact Evaluation, unpublished results). Another study using a nationally
representative sample of Colombian children in 5th and 9th grades also found a similar average
score (M = 1.53, SD = .54) but a higher percentage (25.3%) of children reporting "never" being
victimized in the week preceding the study (Pruebas Saber, 2005; unpublished results). Keeping
in mind the differences between the contexts where the studies took place, these comparisons
suggest that victimization may be a more widespread experience in Congolese schools (as a
smaller percentage of children reports never being victimized), but average levels of
victimization reported by Congolese children are very similar to those reported in other studies.
As illustrated by the pie chart below, most of the variability in children's levels of victimization
can be explained by individual differences between children. Nonetheless, there is an
important portion of the variance that can be attributed to differences between subdivisions and
a smaller, yet still important portion that can be explained by differences between schools.
Information about schools collected as part of OPEQ will serve to explore some of the features
of schools that may explain variation in children's levels of victimization. Differences between
subdivisions are intriguing and may reflect differences in exposure to community violence or
other risk factors that similarly affect children living in the same regions.
7 Orpinas, P., & Kelder, S. (1995). Students for Peace Project: Second student evaluation. Houston, TX:
University of Texas Health Science Center at Houston, School of Public Health.

19
Even though differences between subdivisions are significant, the boxplots by subdivision (see
Figure 6) show relatively small variation in terms of median scores, with all falling in the range
between 1.40 and 2.20. However, there are important differences in the dispersion of scores
around the median, and this may account for the significant result reported above. Kongolo
and Lubudi, for example, have children dispersed across the whole spectrum and are the only
two subdivisions with children obtaining scores of 4, or children who reported being very
frequent victims of physical and relational aggression. Kongolo and Lubudi, along with
Kalemie, had 8 to 10% of children who reported being victimized "sometimes" to "many times".
These children are especially vulnerable to develop mental health and school adaptation
problems.
6.19%
83.22%
10.59%
Figure 5. Variability in children's victimization
School
Children
Subdivision

20
Figure 6. Box plots of children's report of victimization by subdivision
How to interpret boxplots:
The box shows the range of scores for 50% of children.
The horizontal line inside the box is the median score (50% of children got
scores above that score and 50% got scores below that score).
The lines (or whiskers) coming out of the box on either end show the full
range of scores (the maximum and the minimum).
The line coming from the top of the box represents the top 25%; the line
coming from the bottom of the box represents the bottom 25%.
The “longer” the box and whiskers appear, the more variability is present.
The dots and stars outside of the lines (or whiskers) show outlier scores.

21
Mental Health
Finally, children were asked a series of questions aimed to assess their level of conduct
problems (e.g., getting in fights, lying or cheating, yelling, etc), hyperactivity (e.g., having
difficulty sitting quietly and concentrating in school) and emotional symptoms (e.g., feeling
nervous, worrying a lot, feeling sad or wanting to cry a lot of the time). Items were drawn from
a previously validated and widely used measure (Strengths and Difficulties Questionnaire,
SDQ). Children rated their answers in a scale from 1 to 4, where 1 was "completely false", 2 was
"a little false", 3 was "a little true", and 4 was "completely true". Factor analyses revealed one
robust factor consisting of 12 questions drawn from the three subscales. Those items were
averaged to compute a total summary score.
Analyses with the total score suggested that average levels of mental health problems were
moderate (M = 2, SD = .65) but as with the constructs previously described, this does not imply
that there is no room for improvement. A study conducted in Kinshasa, the capital of DRC, with
a sample of 1,187 7-9 year olds from randomly selected schools, asked teachers to rate their
students using the SDQ scales (Kashala, Elgen, Sommerfelt & Tylleskar, 20054). For the purposes
of comparison, individual items utilized in OPEQ were transformed to a scale from 0 to 3 (0:
completely false, 1: a little false or a little true, and 3: completely true) and broken down by
gender. With a couple of exceptions (i.e., distractibility and fights for boys), children in the
OPEQ study reported more mental health problems than those reported by teachers in Kinshasa
(see Table 2). While the importance of differences in reporter and in children's age cannot be
understated, these data suggest that children in Katanga face more challenges to their mental
health than children in Kinshasa.

22
Table 2. Mental Health mean scores in Katanga (OPEQ) and Kinshasa samples
Boys Girls
OPEQ Kinshasa OPEQ Kinshasa
Worries .86 .50 .86 .50
Fights .51 .60 .50 .40
Lies .57 .50 .54 .30
Steals .45 .10 .41 .10
Fidgety .75 .50 .74 .50
Distractible .68 .90 .68 .80
Fears .84 .60 .91 .50
Unhappy .71 .40 .76 .40
Temper .61 .70 .57 .50
Fights .60 .60 .53 .40
Obedient 1.58 .40 1.59 .30
In contrast with victimization, there was a substantial amount of variability in children's mental
health problems that lies between subdivisions, and a large proportion that resides at the school
level. Only about half of the variance in children's mental health can be attributed to individual
differences between children, and about a third of the variance can be explained by differences
between subdivisions. This attests to the power of macro-economic, political and societal
processes in shaping individual's wellbeing. However, the fact that most of the variance can be
explained by differences between individuals and schools also suggests that that a lot can be
done at these two levels to foster children's wellbeing.

23
Inspection of the boxplots by subdivision shows important differences between subdivisions'
median scores, which could be foreseen from the pie chart. Kongolo and Lubudi had the highest
levels of mental health problems as well as the greatest dispersion in scores.
As with all the other SEL constructs assessed at baseline, children's mental health problems
were not significantly different for boys and girls, nor for children in 2nd to 4th grades.
14.28%
53.54%
32.19%
Figure 7. Variability in children's mental health
School
Children
Subdivision

24
Figure 8. Boxplots of Mental health problems by subdivision
How to interpret boxplots:
The box shows the range of scores for 50% of children.
The horizontal line inside the box is the median score (50% of children got
scores above that score and 50% got scores below that score).
The lines (or whiskers) coming out of the box on either end show the full
range of scores (the maximum and the minimum).
The line coming from the top of the box represents the top 25%; the line
coming from the bottom of the box represents the bottom 25%.
The “longer” the box and whiskers appear, the more variability is present.
The dots and stars outside of the lines (or whiskers) show outlier scores.

25
Associations between SEL Constructs
Bivariate multi-level regressions adjusting for the nesting of children in schools and
subdivisions were run to examine associations between the four constructs assessed with the
SEL surveys. The following results were found:
Children's who perceived their schools and teachers as supportive reported lower
levels of victimization (b = -.17, p < .05) as well as less mental health problems (b = -.26,
p < .05). Children's perceptions of support explained 9.18% of the variance in their
mental health problems, and 2.8% of the variance in their reports of victimization.
Children who reported higher levels of peer victimization reported more mental health
problems (b = .28, p < .05) than less victimized children. Being victimized explained 16%
of the total variance in children's mental health problems.
The level of predictability and cooperativeness of school contexts was not significantly
associated with peer victimization (b = -.04, p = .12) nor with children's mental health (b
= -.05, p = .07), but there was a significant yet small association between predictability
and cooperativeness and children's perceptions of support from school members (b =.34,
p < .05). These findings corroborate that while related, these two constructs capture
distinct dimensions of school contexts.

26
PRELIMINARY REGRESSION ANALYSES
Introduction
Three level multi-level models were fitted using HLM (V. 6.06, Raudenbush & Bryk, 2002), in
order to explore the associations between child characteristics and living conditions and their
socio-emotional outcomes: 1) children's perceptions of supportive schools and teachers, 2)
children's perceptions of schools and classrooms as predictable and cooperative, and children's
self-reports of 3) mental health (conduct problems, hyperactivity & emotional symptoms) and 4)
victimization. Children were modeled at level 1, teachers at level 2 and school clusters at level 3.
Child characteristics and living conditions were grouped in blocks of variables (see Table 3)
hypothesized to be conceptually related. Analyses were run entering one block at a time, and
then stacking blocks (1 and 2, 1, 2 and 3 and so on). This analytic strategy allowed us to get a
sense of the association between the outcome and variables in each block, when the variance
shared between blocks was, or was, adjusted for.
In this report we describe preliminary results from models in which the shared variance
between all variables was adjusted for (i.e., all blocks simultaneously entered). That means that
the association between a particular variable and the outcome represents the unique
contribution of that variable to the prediction of the outcome, net of the association between
that variable and other variables included in the model. For example, suppose grade and age are
highly correlated. When models are separately run for each variable, we could find a significant
association between both grade and age and children's math scores. However, when we
simultaneously model grade and age, the association between age and math may no longer be
significant, as it is already accounted for by grade. In other words, the variance in age that is
not associated with grade does not explain additional variance in children's math scores, once
the effect of grade is accounted for.
Dummies8 for all subdivisions (with Kalemie as the reference group) were included at the
cluster level to adjust for differences between these geographical units. This means that all
8 Dummy variables are commonly used in regression analysis when dealing with categorical or nominal
information, of the sort of subdivisions, race or gender. To include information on 3 race groups in a
regression analyses, for example, we create 3 dummy variables where (1) Black = 1, Not Black = 0, (2)
Asian = 1, Not Asian = 0, and (3) White = 1, Not White = 0. When fitting the model, we exclude one of the
three variables to avoid redundancy, and the excluded group becomes the reference. Thus, if we exclude
Black, the regression coefficients for Asian and White will represent the increase in the outcome for
Asians and Whites relative to Blacks, but if we exclude Asian, the coefficients will represent the increase
in the scores for the other two groups compared to Asians.

27
results should be interpreted net of differences between subdivisions. In other words, since
Kalemie is the reference group, the intercept represents the mean for Kalemie and coefficients
for all predictors represent the estimated increase in the score relative to that mean. Since we
did not have any specific hypotheses regarding differences between subdivisions, the selection
of Kalemie as the reference group is arbitrary, and analyses could be run using other
subdivisions as reference.
Table 3. Complete list of child characteristics organized by block
Block Variable Label
Su
bd
ivis
ion
dummy code intercept for Kalemie
dummy code for Kambove
dummy code for Kasenga
dummy code for Kongolo
dummy code for Mutshatsha
dummy code for Lubudi
Block 1 Child gender (1=male)
Swahili (1=yes)
Grade 2 vs. 3 & 4
Grade 3 vs. 4
Block 2 Average number of people in household
Density (ppl/room)
Child burden (child/adult)
Lives w both parents (1=yes)
Someone important not in household (1=yes)
Mother ever been to school (1=yes)
Father ever been to school (1=yes)
Mother has job (1=yes)
Wealth (Factor 1-Rural wealth)
Wealth (Factor 2-Urban wealth)
Block 3 Eats meat (=1) vs. never (=0)
Goes to bed hungry (0=never, 1, 2, 3=often)
Moved: 0, 1, 2, 3= more than 2
Job at home (1= yes)
Job outside home (1= yes)
Block 4 Age (centered around the group mean)
Repeat prev grade (1= yes)
Attend Kindergarten (1= yes)
Usually homework from K teacher? (1= yes)
Someone to help w K homework? (1= yes)

28
Days late last week
Days missed school last week
Comprehension of questions (0= a lot of
difficulties, 1, 2= no difficulties) as judged by
enumerator
PRELIMINARY RESULTS
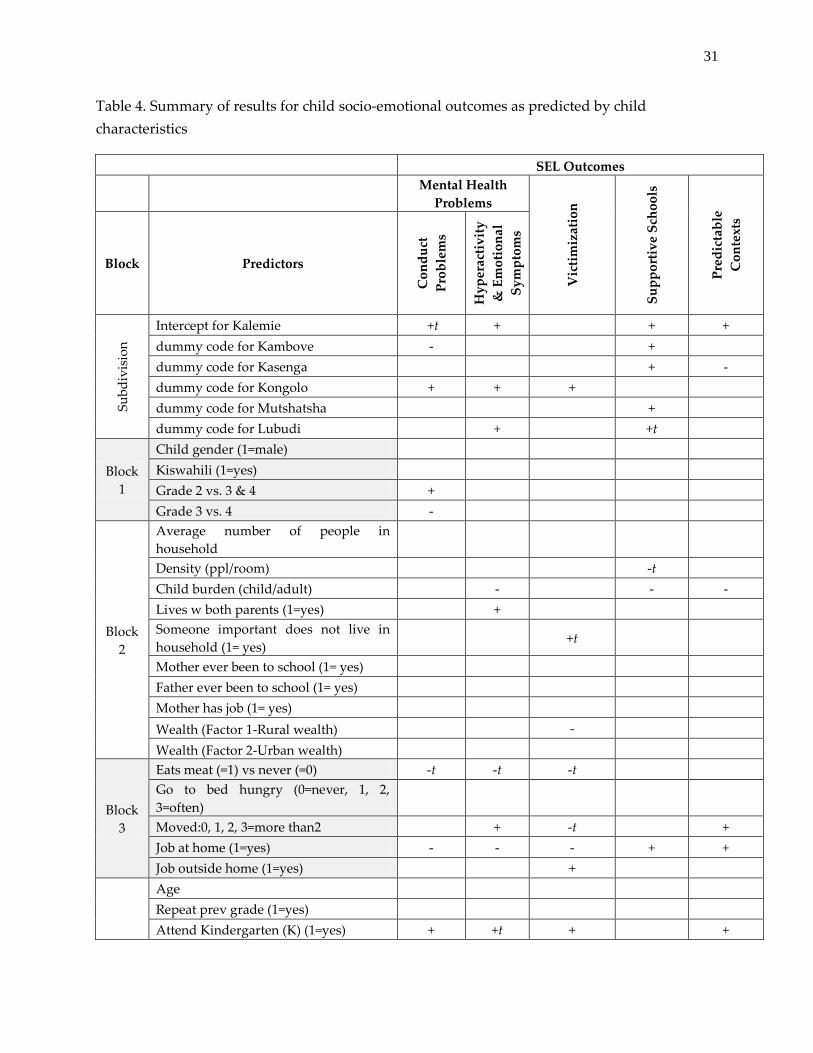
Table 4 (page 31) presents a visual summary of results for regression analyses exploring the
association between child characteristics and socio-emotional outcomes.
Child demographic characteristics (Block 1)
Overall, children’s personal characteristics were not associated with their socio-emotional
outcomes. The only exception was conduct problems, which was more prevalent for 2nd
graders (relative to 3rd and 4th graders) and less prevalent for 3rd graders (relative to 4th graders).
General household characteristics (Block 2)
Regarding children’s household characteristics, results suggest different patterns of associations
for children’s perceptions of their school environment vs. children’ self-reports of socio-
emotional wellbeing.
On the one hand, children living in households with high density (people per room) and high
children burden (children per adult) perceived their schools and teachers as less supportive.
Children in high child burden households also perceived schools as less predictable and
cooperative. On the other hand, these children reported less hyperactivity & emotional
symptoms. In sum, dense and high child burden households appear to be negatively associated
with children’s perceptions of the school environment, but positively with children’s self-
regulation and wellbeing.
Contrary to expectations, children who reported living with both parents reported more
hyperactivity & emotional symptoms.
Finally, children who reported someone important does not live in the household reported
more victimization and children from households with more rural wealth reported less
victimization.
Other living conditions (Block 3)
Children’s diet and job at home were important correlates of their socio-emotional outcomes.
Specifically, children whose diet included meat - an index of wealth – and who had a job at

29
home tended to report less mental health (conduct problems, hyperactivity & emotional
symptoms) and victimization problems. Children who reported having a job at home also
rated schools and teachers as more supportive and schools as more predictable and
cooperative. Having a rich diet and helping with household chores can have a positive impact
on children’s development, but it is not clear why these factors would be associated with
children’s perceptions of schools as more supportive, predictable, and cooperative. It may be
that children who have a job at home, and who according to the previous findings are less likely
to have mental health problems (i.e., conduct problems, hyperactivity & emotional symptoms),
elicit more positive responses from teachers and other school personnel and, as a result, come to
see their school in a more positive light.
Whereas having a job at home was positive for children, having a job outside the home may be
detrimental. Specifically, students who reported having a job outside the home reported more
victimization at school. Working outside the home may be an indicator of lower socio-
economic status and this, in turn, may be associated with more peer victimization.
Finally, higher household mobility was associated with perceptions of schools and classrooms
as more predictable and cooperative and with less victimization, but also with more
hyperactivity and emotional symptoms. It is possible that children who move residences often
perceive schools as relatively predictable settings compared to their home environment. As per
its association with hyperactivity & emotional symptoms, previous empirical work has not been
conclusive and recent studies point to the need to study mobility in the context of other child
and household characteristics (e.g., Ginsburg, Richter, Fleisch, & Norris, 20109). OPEQs second
wave of data includes additional questions that will allow us to better understand the nature of
household mobility in our sample.
Prior school adaptation (Block 4)
The associations found between attending kindergarten, getting homework and help with
homework and children’s socio-emotional outcomes were rather puzzling.
Children who attended kindergarten reported more conduct problems, hyperactivity &
emotional symptoms and victimization. However, these children also perceived their schools
as more predictable and cooperative than children who did not attend kindergarten.
9 Ginsburg, C., Richter, L.M., Fleisch, B., & Norris, S.A. (2011). Associations between residential
and school mobility and educational outcomes in South African urban children: The birth to twenty
cohort. International Journal of Educational Development, 31(3), 213-222.

30
Interestingly, children who said they used to get homework from their kindergarten teacher
reported more victimization and conduct problems, and children who said they had someone
to help with homework also reported more conduct problems. The meaning of getting
homework and getting help with homework in the DRC needs clarification. It is possible that
children who are struggling in school are the ones who are assigned homework and need
someone to help at home.
Being late to school was associated with more conduct problems and victimization.
Finally, the less difficulties children had in understanding the survey, as judged by the data
collector, the less conduct problems and hyperactivity & emotional symptoms they reported.
These children also perceived their schools as more predictable, cooperative and supportive
than children who had more difficulties understanding the questions. Children who report
higher levels of conduct problem and hyperactivity & emotional symptoms have a harder time
paying attention and get usually distracted; this may have contributed to their difficulties in
understanding the questions, as judged by the data collector, and may also hinder their ability
to internalize school routines and get support from teachers and other school personnel.
31
Table 4. Summary of results for child socio-emotional outcomes as predicted by child
characteristics
SEL Outcomes
Mental Health
Problems
Vic
tim
izat
ion
Su
pp
ort
ive
Sch
oo
ls
Pre
dic
tab
le
Co
nte
xts
Block Predictors
Co
nd
uct
Pro
ble
ms
Hy
per
acti
vit
y
& E
mo
tio
nal
Sy
mp
tom
s
Su
bd
ivis
ion
Intercept for Kalemie +t + + +
dummy code for Kambove - +
dummy code for Kasenga + -
dummy code for Kongolo + + +
dummy code for Mutshatsha +
dummy code for Lubudi + +t
Block
1
Child gender (1=male)
Kiswahili (1=yes)
Grade 2 vs. 3 & 4 +
Grade 3 vs. 4 -
Block
2
Average number of people in
household
Density (ppl/room) -t
Child burden (child/adult) - - -
Lives w both parents (1=yes) +
Someone important does not live in
household (1= yes) +t
Mother ever been to school (1= yes)
Father ever been to school (1= yes)
Mother has job (1= yes)
Wealth (Factor 1-Rural wealth) -
Wealth (Factor 2-Urban wealth)
Block
3
Eats meat (=1) vs never (=0) -t -t -t
Go to bed hungry (0=never, 1, 2,
3=often)
Moved:0, 1, 2, 3=more than2 + -t +
Job at home (1=yes) - - - + +
Job outside home (1=yes) +
Age
Repeat prev grade (1=yes)
Attend Kindergarten (K) (1=yes) + +t + +

32
Block
4
Mental Health
Problems
Vic
tim
izat
ion
Su
pp
ort
ive
Sch
oo
ls
Pre
dic
tab
le C
on
text
s
Co
nd
uct
Pro
ble
ms
Hy
per
acti
vit
y
& E
mo
tio
nal
Sy
mp
tom
s
Usually got homework from K teacher?
(1=yes) + +
Someone to help w homework in K?
(1=yes) +
Days late last week + +
Days missed school last week
Comprehension of questions as judged
by enumerator (0= a lot of difficulties,
1, 2= no difficulties)
- +t +
Note: Significant associations between a predictor and outcome are indicated by a positive (+) or negative (-) sign,
which also represents the direction of the association. Trends for significance (p < 0.10) are indicated by a “t” next to
the positive or negative sign. Non-significant associations are represented by empty cells.

33
CONCLUSIONS
Overall, our results indicate substantial variability between children, between schools and
subdivisions in children’s socio-emotional outcomes. While the average findings are generally
positive, it is of concern that even children in the same school experience significantly different
learning contexts and levels of wellbeing. OPEQ’s goal of providing “equitable access to quality
basic education” is a promising effort to close the gap between children at the high and low
ends of the spectrum.
Descriptive findings from Katanga suggest that on average children perceive their schools and
teachers as supportive, but that compared to other African countries improvement is needed in
creating student-centered and intellectually stimulating learning environments. Our results also
indicate that children with different backgrounds have different perceptions of the level of
support they receive from teachers and other school personnel. It remains an open question
whether children from relatively disadvantaged home environments elicit differential treatment
from school personnel, or whether they see schools and teachers through a more negative lens.
In any case, providing supportive environments for all children should be a goal of all schools.
As suggested by our findings, children’s perceptions of supportive schools and teachers are
associated with lower levels of victimization and mental health problems.
Also, children perceived their schools and classrooms as moderately predictable and
cooperative, and there is considerable room for improvement in this dimension. Unlike
children’s perceptions of their schools and teachers as supportive —mostly driven by
characteristics of children themselves— features of schools and subdivisions appear to play a
very important role on how predictable and cooperative children come to see their schools and
classrooms. Establishing routines and being explicit about the classroom schedule, as well as
promoting peer cooperation by means of small-group work and the encouragement of sharing,
may all contribute to children’s perceptions of their schools and classrooms as predictable and
cooperative. This may be particularly important for children from highly mobile and otherwise
disorganized homes, who may rely on schools to build a sense of control over their
environment.
In terms of children’s individual wellbeing, victimization appears to be a more common
experience for Congolese children than for children in other countries. Whereas the average
rates of victimization are not alarming, the vast majority of children experience some level of
peer victimization at school, and as corroborated by our results, victimization takes a toll on
children’s mental health. Like children’s perceptions of supportive schools and teachers,
victimization is mostly associated with children’s individual characteristics, meaning that some
children may be more susceptible to be targets of aggression. Schools should aim to promote

34
environments that prevent victimization for all children by developing tolerance for diversity,
empathy and other moral emotions, as well as the mastery of non-aggressive ways of
interaction.
Children’s self-reports of mental health problems suggest moderate levels of conduct
problems, hyperactivity & emotional symptoms. However, levels of mental health issues
appear to be higher than in Kinshasa, where children may be less exposed to violent conflict or
other adverse experiences. In contrast with victimization, there was a substantial amount of
variability in children's mental health problems that lies between subdivisions, and a large
proportion that resides at the school level. This supports the contention that there are larger
societal factors impacting children’s mental health, in addition to children’s individual
predispositions and household experiences. This finding calls for awareness at the subdivision
or regional level of the need to intentionally address children’s mental health problems.
Programs like OPEQ may help schools in providing increasingly supportive contexts for
struggling children.
Regression analyses indicated that with the exception of grade differences in conduct problems,
children’s personal characteristics (i.e., gender, grade, language) were not related to their socio-
emotional outcomes. It is somewhat surprising that there were no gender differences in
children’s socio-emotional outcomes, given the wide differences found in boys’ and girls’
academic performance (see Torrente et al., 2011).
In terms of household characteristics, children’s living conditions, and kindergarten
experiences, results were mixed. Some household characteristics that were negatively
associated with children’s perceptions of schools were positively related to children’s mental
health. Also, findings related to children’s kindergarten experiences were counterintuitive.
There are at least two reasons why results from these preliminary analyses should be taken with
caution. First, analyses were correlational, so it is not possible to establish the direction of
causality. Second, we focused on exploring the unique contribution of each variable to
children’s socio-emotional outcomes, but given that many of these factors work together on
influencing children’s development, a clearer picture may emerge when their interactions are
explored, as well as by examining their cumulative effects on children’s outcomes. Future
analyses are expected to shed light on some of these unexpected findings, and to explore the
contribution of teacher and school characteristics to children’s outcomes.

35
Appendix A
Construct Variable Label Source/Measure
SU
PP
OR
TIV
E S
CH
OO
LS
& T
EA
CH
ER
S (
17)
Your teachers treat you with respect CFS10- Safe, Inclusive, Respectful climate
Teachers at your school are interested in what students like
you have to say CFS- Safe, Inclusive, Respectful climate
You think this school respects families like yours CFS- Safe, Inclusive, Respectful climate
The school is a welcoming place for children from families
like yours CFS- Safe, Inclusive, Respectful climate
This school understands and values children’s rights CFS- Safe, Inclusive, Respectful climate
If students see another student being picked on, they try to
stop it CFS- Safe, Inclusive, Respectful climate
This school is a welcoming place for all types of students CFS- Safe, Inclusive, Respectful climate
Boys and girls have equal opportunities to succeed at this
school CFS- Safe, Inclusive, Respectful climate
My teacher gives me help whenever I need it
Perceived Teacher Support (Teacher-child
relationship)
Your teacher always tries to be fair
Perceived Teacher Support (Teacher-child
relationship)
Your teacher notices good things you do
Perceived Teacher Support (Teacher-child
relationship)
Students at this school try to do a good job on their lessons,
even if they are difficult or not interesting
CFS - Challenging student-centered learning
env
The subjects we are studying at this school are interesting
CFS - Challenging student-centered learning
env
10 Child Friendly Schools, UNICEF

36
Variable Label Source/Measure
Teachers at this school will listen if you want to explain
your answers in class or on assignments
CFS - Challenging student-centered learning
env
Every student is encouraged to participate in class
discussions
CFS - Challenging student-centered learning
env
Teachers at this school expect students like me to succeed
in life
CFS - Challenging student-centered learning
env
You want to complete secondary school
CFS - Challenging student-centered learning
env
PR
ED
ICT
AB
LE
& C
OO
PE
RA
TIV
E
CO
NT
EX
TS
(10
)
Do you know what time: you have reading lessons NYU
Do you know what time: You have Math lessons NYU
Your classmates and you: help each other learn NYU
Your classmates and you: work together to solve a problem NYU
Your classmates and you: work together to learn how to
read NYU
Your classmates and you: work together to learn Math NYU
Your classmates and you: Share books without fighting NYU
Your Teacher: recognizes and praises students when they
work together NYU
Your Teacher: helps students work together NYU
Your Teacher: shows students how to share books NYU
VIC
TIM
IZA
TIO
N (
5) A kid from school pushed, shoved, or hit you Aggression self-report (Victimization)
A kid from school called you a bad name Aggression self-report (Victimization)
Kids from school said that they would hit you Aggression self-report (Victimization)
Other kids left you out on purpose Aggression self-report (Victimization)
A student made something up, so kids wouldnt like you Aggression self-report (Victimization)

37
Variable Label Source/Measure
ME
NT
AL
HE
AL
TH
PR
OB
LE
MS
(12
) You get in many fights with other children SDQ11- Conduct Problems Scale
You are often accused of lying or cheating SDQ- Conduct Problems Scale
You get angry and yell at people a lot SDQ- Conduct Problems Scale
You take things that do not belong to you from home,
school and elsewhere SDQ- Conduct Problems Scale
You are always in trouble with adults SDQ- Conduct Problems Scale
Is it difficult for you to sit quietly for a long SDQ -Hyperactivity Scale
Is it difficult for you to concentrate in school SDQ -Hyperactivity Scale
You are usually distracted SDQ -Hyperactivity Scale
You worry a lot SDQ- Emotional Symptoms Scale
you feel nervous in situations that are new SDQ- Emotional Symptoms Scale
You feel sad or want to cry a lot of the time SDQ- Emotional Symptoms Scale
Nothing makes you happy SDQ- Emotional Symptoms Scale
11 Strengths & Difficulties Questionnaire