optical and epr studies on the 5 ev band of cdcl₂ crystals
TRANSCRIPT

TitleOptical and EPR Studies on the 5 eV Band of CdCl₂ Crystals(Special Issue on Physical, Chemical and Biological Effect ofGamma Radiation, XIII)
Author(s) Matsumoto, Hiroaki; Nakamura, Yoshimitsu
Citation Bulletin of the Institute for Chemical Research, KyotoUniversity (1972), 50(1): 8-19
Issue Date 1972-03-31
URL http://hdl.handle.net/2433/76403
Right
Type Departmental Bulletin Paper
Textversion publisher
Kyoto University

Bull. Inst. Chem. Res., Kyoto Univ., Vol. 50, No. 1, 1972
Optical and EPR Studies on the 5 eV Band
of CdC12 Crystals
Hiroaki MATSUMOTO and YOShimitsu NAKAMURA*
Received December 27, 1971
Optical absorption spectra of various impurity ions doped in CdC12 crystals are studied to identify the center responsible to the 5 eV absorption band. Electron paramagnetic
resonance absorption spectra are also investigated on the r-ray or x-ray irradiated CdC12 crystals.
The crystals can be classified into two groups : (1) CdCl2 containing Li ions and (2) CdC12 containing other impurities than Li ions. The 5 eV absorption band of group 1 crystals
appeared at about 0.10- '0.16 eV lower energy than that of group 2 crystals. In the crystals of group 1, the 5 eV absorption band disappeared with the irradiation of 7-rays or x-rays at
room temperature and paramagnetic center was produced instead. In the crystals of group 2, the irradiation of ;-rays of x-rays at room temperature did not make any change in the
5 eV absorption band but the irradiation of x-rays at liquid nitrogen temperature caused the decrease of the intensity of the 5 eV absorption and an appearance of a small new absorption
band at 4.55 eV. After the irradiation had ceased the recovery of the 5 eV absorption and the disappearance of 4.55 eV band were attained very quickly.
Some discussions are made on the possible models of the center responsible to the 5 eV band and the paramagnetic center.
I. INTRODUCTION
There are considerably many investigations on the electronic states of metal impurities in the CdC12 type or CdI2 type crystals with the methods of electron
paramagnetic resonance absorption, optical absorption and emission of light.1 " Some studies have also been reported on the change of these electronic
states brought by the irradiation of 7-rays or x-rays.12,13) In general, any dominant absorption bands are not observed at the lower
energy side of the fundamental absorption, which rises about 5.5 eV, down to the near infra-red region in the optical absorption spectra of undoped CdC12 crystals. Sometimes, an absorption band is observed in the vicinity of the
photon energy of 5 eV in the optical absorption spectra of CdC12 crystals doped with certain monovalent metal ions or doped without any intended impurities.
Though the appearance of this absorption band seems to be almost inde-
pendent from the kind of doped monovalent metal ions, it may be due to the processes of drying the raw chemicals prior to the growth of single crystals or to some unintended impurities in the CdC12.
It is natural to consider that the center of this absorption band may have
* r'~` ~hI , i oo$k : Department of Electronics, Fukui University, Fukui. Part of this work was done in the Research Reactor Institute of Kyoto University.
(8)
Optical and EPR Studies on CdCl2 Crystals
important relation to a impurity which remains unrejected in the CdC12 chemi-
cals during the crystal growth, to a miner impurity contained in the added
chemicals to CdC12 as intended impurities or to an ion such as hydroxide oxygen or nitrogen which comes to be mixed into CdC12 during dehydration and baking
processes of raw chemicals of crystals in the low vacuum. It has been reported that in alkali halides there exist some optical absorp-
tion bands due to the hydrogen atoms, hydroxide ions or oxide molecular ions
which are brought into crystals during the preparation processes of single
crystals or converted from them by irradiation. They have the electronic ab-
sorption peaks near the fundamental absorption of the host crystals and their
spectroscopic characteristics have been investigated extensively.'4 17)
For the investigation of irradiation effects on CdCl2 crystals or on the im-
purities in the CdC12 crystals, the role of the center responsible to the 5 eV band cannot be neglected as they may act as sources or traps for electrons or holes.
It may be interesting to study the characteristics of this band to clarify
the origin of it. It may also be important to make researches on the relation
of the center of this band to other impurities or to the irradiation effects on the
crystals. In this paper absorption spectra of CdC12 doped with various impurities are
reported and the relations between the 5 eV band and impurities doped into the
CdC12 crystals are described.
EPR and optical absorption studies on the relations between the center of the 5 eV band and doped impurities under the irradiation of 1-rays or x-rays are
also reported and some discussions on the origin of the center of the 5 eV band
are given here.
II. EXPERIMENTAL AND RESULTS
II. 1. Sample Preparation
The drying procedure of chemicals was as follows : the mixture of reagent
grade CdC12 and chemicals to be doped as an impurity was heated in the vacuum of about 10-3 mmHg at 80°C for a few hours and heated at 500°C for one or two
hours further. The drying procedure of samples containing KC1 or T1C1 as an impurity was not such as described above. They were melted in the vacuum
of 10-3 mmHg to remove water and other adsorbed gases.
These dried chemicals were sealed in the quartz crucible in the vacuum
and used to grow the single crystal of CdCl2 by Stockbarger method. The quartz
crucible was pulled down with the rate of 15°C per hour in the furnace.
The impurities doped were LiCl, LiOH, KC1, T1C1, Cd(OH)2, CdO, CaC12,
ZnC12, PbC12, MnC12, CuC12 and CrC13.
II. 2. Optical Absorption Spectra
The samples of about 10 mm x 5 mm x 0.2 mm size were cloven from crystal-line ingot for optical absorption measurements. The crystal has layer structure
( 9 )
H. MATSUMOTO and Y. NAKAMURA
and the direction of incident light for absorption measurements was parallel to
the crystal c-axis which is perpendicular to the layer plane.
II. 2.1. Undoped CdC12
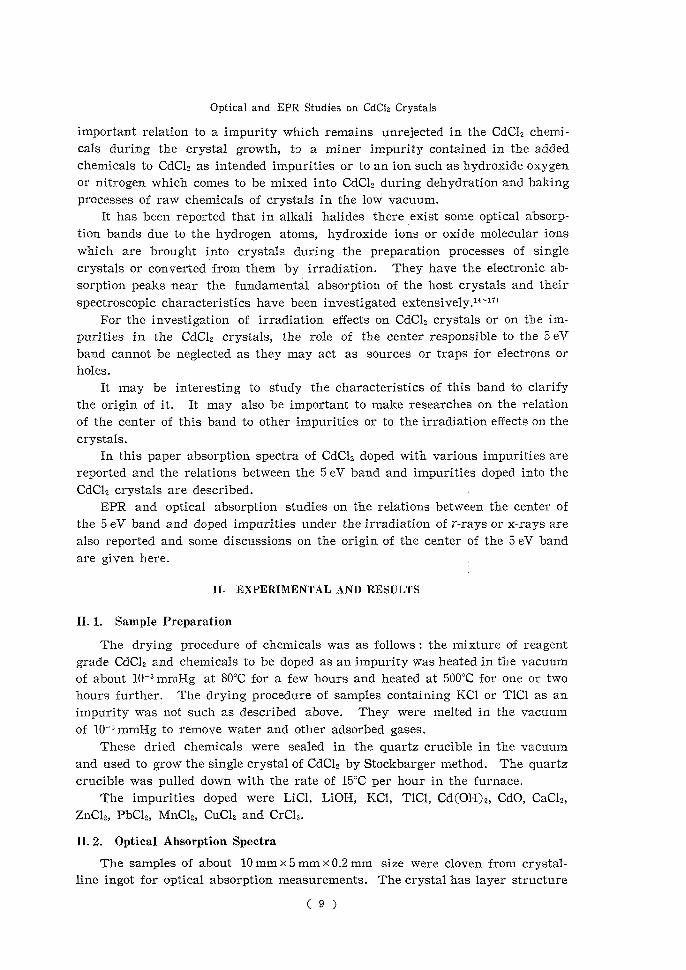
Optical absorption spectra of pure CdC12 are shown in Fig. 1.
Sometimes a weak absorption peak appeared at 5.02 eV, while it scarcely
appeared in the spectra of well baked pure crystals.
An absorption peak at 5.68 eV was also found at liquid nitrogen temperature.
As it overlapped on the rising slope of the fundamental absorption and the sur-
face of the crystal was apt to become dim because of the hygroscopic nature
of the crystal, it was very difficult to distinguish the peak from the fundamental
absorption. Any clear relation between 5.68 eV band and 5.02 eV band is not
apparent.
220 250 300400600 (nm)
2.0-CdCl2
}
cn1.5- z w 0 J U U
a1.0
o
6 5PHOTON ENERGY21 (eV)
Fig. 1. Optical absorption spectra of undoped CdC12. Dotted curve was measured at room temperature and solid
curve was measured at liquid nitrogen temperature.
II. 2.2. CdC12 : LiC1 and CdC12 : LiOH
Optical absorption spectra of CdC12 : LiC1 and CdCl2 : LiOH are shown in Fig. 2(a) and (b) respectively. They resemble each other. In the measurement at
room temperature there existed an absorption band with the peak at 4.95 eV
and the half width of 0.36 eV for each crystal. The band peak shifted to 5.00
eV and the band width diminished to 0.31 eV at 77°K. This means that the center of this absorption has considerable interaction
with the neighboring crystal lattices.
It is clear that the peak position of this band differs not only from 5.02 eV
peak of undoped CdCl2 but also from 5.05-5.03 eV peak of CdCl2 : Cd(OH)2, CdC12 : CdO and CdCl2 doped with other impurities than lithium as described below.
The intensity of 4.95 eV absorption differed from sample to sample which
( 10 )

Optical and EPR Studies on CdCl2 Crystals
220 240 250 300400600(nm)
:::z(a)
r 1.5- f(b) CdC12:LiOH
01 .0-
65 PHOTON ENERGY21 (eV)
Fig. 2. Optical absorption spectra of group 1 CdC12 crystals. (a) CdCl2: LiCl. (b) CdCl2: LiOH.
Dotted curves were measured at room temperature and solid curves were measured at liquid nitrogen temperature.
was cloven from different part of a crystalline ingot. The stronger absorption
was observed for the samples cloven from upper part of the CdC12 : LiOH ingot
which had been grown by pulling down the crucible in the furnace.
This implies that wheather the specific gravity of the center is compara-
tively small in the melt or the segregation constant of the center has a small
value in the CdC12 : LiOH.
An absorption band at 5.7 eV was also observed at 77°K in the CdC12 : LiC1
spectra.
225 240 270 300400600 (nm)
I 1.5- (a) CdC12:Cd(OH)2
1.0-
z w ----fI-----------------------------------------------------------------
iiEi(b) CdClz:CdO 5432 1
PHOTON ENERGY (eV)
Fig. 3. Optical absorption spectra of (a) CdCl2 : Cd(OH)z and (b) CdC12: CdO. Dotted curves and solid curves were measured at room and liquid nitrogen
temperatures respectively.
( 11 )

H. MATSUMOTO and Y. NAKAMURA
II. 2.3. CdC12 : Cd(OH)2 and CdC12 : CdO
Optical absorption spectra of CdC12 : Cd(OH)2 and CdC12 CdO are shown in Fig. 3(a) and (b) respectively. Both spectra resemble each other.
Absorption bands were observed at 5.05 eV (CdC12: Cd(OH)2) and 5.03 eV
(CdC12 : CdO) and the half widths of both bands were 0.37 eV at room tempera-ture. The band peaks shifted to 5.16 eV and the band widths diminished to 0.33
eV at 77°K.
Samples cloven from upper part of the CdC12: Cd(OH)2 showed stronger ab-sorption.
The energies of these absorption bands are apparently higher than that of
CdCl2 containing lithium.
The Li+ ion in the crystal seems to perturb the electronic state of the cen-
ter resposible to the 5 eV band and to make its absorption peak shift to the
lower energy.
Any splitting or fine structure of the band was not observed at room tem-
perature or 77°K. The 5.68 eV band was also observed. The separation of this band from the
fundamental absorption was not sufficient to make the comparison of this band with the corresponding band of crystals with lithium.
II. 2.4. CdC12 with other impurities
Sometimes an absorption band has been observed near the threshold of the
fundamental absorption in the CdC12 single crystals containing KCl or T1C1.
The optical absorption spectra are shown in Fig. 4.
220 240 260 300 400600 (nm) rIr
3.0- (a) CdC12:KCl
2.0-
t-.1.0-....... ...... ..... (r)
~ rrr
(b) CdC12:TICl
01.0- 0.5
rrr
65 2 PHOTON ENERGY (eV)
Fig. 4. Optical absorption spectra of (a) CdC1z : KC1 and (b) CdC12: T1C1 measured at room temperature.
Each spectrum shows very similar absorption to that of CdC12: Cd(OH)2 and
CdC12: CdO.
CdC12 single crystals doped with other impurities such as MnC12, CaC12 or
( 12 )
Optical and EPR Studies on CdC12 Crystals
ZnC12 had not any absorption band other than the fundamental absorption in
the energy ranges of ultra-violet, visible and near infra-red.
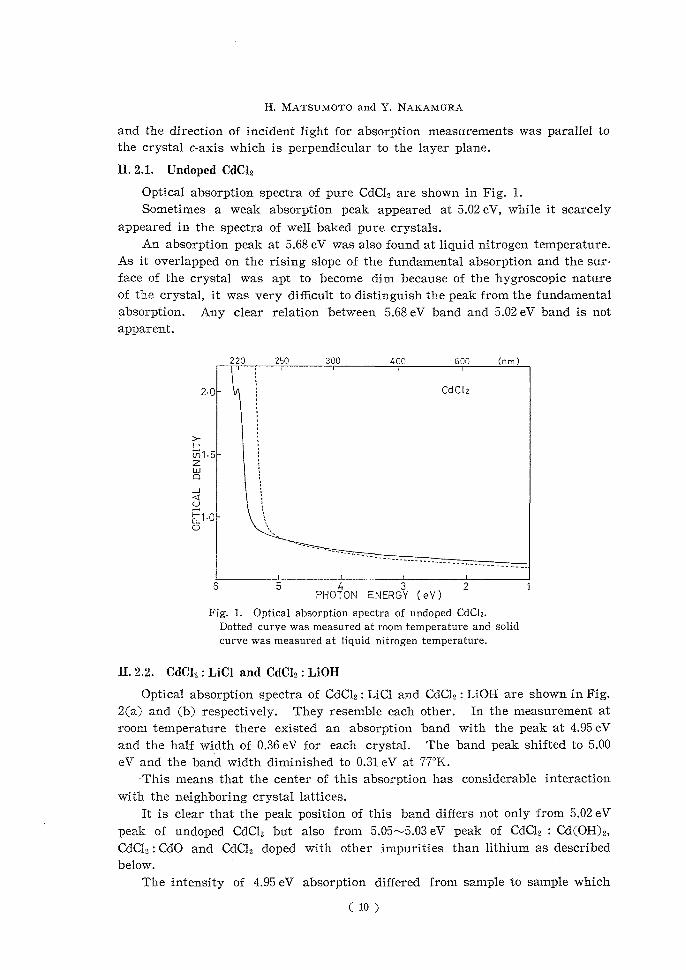
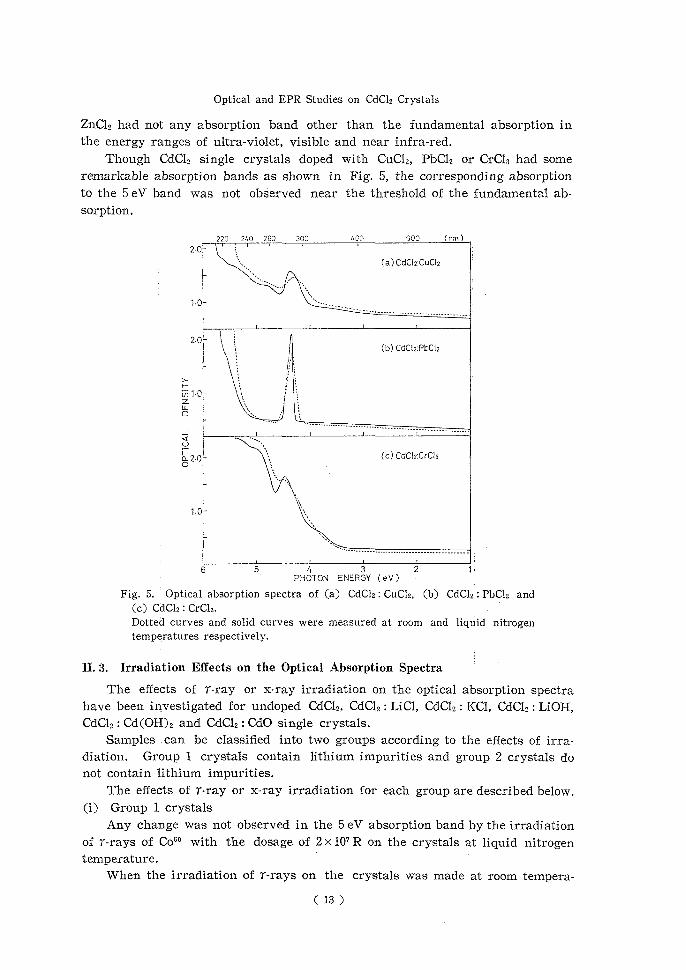
Though CdC12 single crystals doped with CuCl2, PbC12 or CrC13 had some
remarIiable absorption bands as shown in Fig. 5, the corresponding absorption
to the 5 eV band was not observed near the threshold of the fundamental ab-
sorption.
220 240 260 300 400 500 (nm) 20-
(a) CdC12:CuC12
• 1.0- ...
2.0- (b) CdC12:PbGb
cn 1,0-t
J 1 11t............................................................
------------------------------------------------ U
d ZO _•(c) CdC12:CrC3 a.
1.0-
65432 PHOTON ENERGY (eV )
Fig. 5. Optical absorption spectra of (a) CdC12 : CuC12, (b) CdC12': PbC12 and (c) CdClz : CrC13.
Dotted curves and solid curves were measured at room and liquid nitrogen temperatures respectively.
II. 3. Irradiation Effects on the Optical Absorption Spectra
The effects of r-ray or x-ray irradiation on the optical absorption spectra
have been investigated for undoped CdC12, CdC12 : LiC1, CdCl2 : KCI, CdC12 : LiOH, CdC12 : Cd(OH)2 and CdC12 : CdO single crystals.
Samples can be classified into two groups according to the effects of irra-
diation. Group 1 crystals contain lithium impurities and group 2 crystals do not contain lithium impurities.
The effects of r-ray or x-ray irradiation for each group are described below.
(i) Group 1 crystals Any change was not observed in the 5 eV absorption band by the irradiation
of r-rays of Co60 with the dosage of 2 x 10⁷ R on the crystals at liquid nitrogen temperature.
When the irradiation of r-rays on the crystals was made at room tempera-
( 13 )

H. MATSUMOTO and Y. NAKAMURA
ture, the 5 eV band disappeared completely with a dosage of 3 x 10⁶ R and a very broad band appeared near 3 eV. The intensity of the broad band increased as the dosage of r-rays increased even after the 5 eV band had vanished.
This suggests that the center responsible to the 5 eV band is not transform-
ed directly into the center responsible to the broad band near 3 eV.
225 240 270 300400600 ( nm )
(a) 2.0-
} n 1.0-
a(b)
0
0 1.0-
54321 PHOTON ENERGY(eV)
Fig. 6.Absorption spectra of CdC12: LiCl.
(a) Irradiated at room temperature with 1-ray dosage of about 3 x 10⁶ R. (b) Irradiated at liquid nitrogen temperature with 1-ray dosage of about 2 x 10⁷R.
Absorption measurements were made at liquid nitrogen temperature.
225 250 275 300400600 ( nm )
1.5-
a b
(7)1.0- ;\e
C)
a05- 0•
6 54321 PHOTON ENERGY (eV)
Fig. 7. Optical absorption spectra of x-ray irradiated CdC12 : LiOH. (a) Spectrum prior to the x-ray irradiation.
(b) Spectrum irradiated with x-ray for 60 minutes. (c) Spectrum irradiated with x-ray for 120 minutes. (d) Spectrum irradiated with x-ray for 180 minutes. X-ray irradiation was made at room temperature with Toshiba AFX 60 A x-
ray tube operating at 40 KV and 25 mA. (e) Recovered spectra of the x-ray irradiated CdC12 : LiOH measured at 9 days
after the irradiation.
( 14 )

Optical and EPR Studies on CdClz Crystals
Other new absorption bands were not observed after the irradiation of r-rays at room temperature.
Absorption spectra of 1-ray irradiated CdC12 : LiC1 crystals are shown in Fig. 6. Spectrum (a) was obtained by irradiating the crystal at room temperature and (b) at liquid nitrogen temperature.
As described later, an electron paramagnetic resonance absorption was ob-served for the crystals of group 1 irradiated at room temperature.
The intensity of the 5.01 eV absorption band of CdC12 : LiOH decreased and the absorption between 4.5 eV and 2.5 eV increased as the dosage of x-ray irra-diation was increased at room temperature.
When the x-ray irradiated CdCl2 : LiOH at room temperature was kept in the dark vacuum for 9 days after irradiation, the 5.01 eV band recovered to a certain extent and the absorption between 4.5 eV and 2.5 eV decreased. This is shown in Fig. 7. (ii) Group 2 crystals
The precise peak positions of the 5 eV absorption appeared at higher en-ergies for the crystals of group 2 than for that of group 1.
The crystals of group 2 differ from that of group 1 also in the effects of r-ray irradiation or x-ray irradiation.
The intensity of the 5.16 eV band of CdC12 : CdO decreased with x-ray irra-diation at 77°K and a new absorption band appeared at 4.55 eV. This band disappeared within a few minutes after the irradiation had ceased at 77°K and the 5.16 eV band recovered completely.
No change was observed in the 5 eV absorption band for CdC12 : Cd(OH)2 and CdC12 : KC1 with the irradiation of r-rays of 5 x 10⁷ R at room temperature.
II. 3. Electron Parmagnetic Resonance Absorption Spectra
CdC12 samples showed the EPR spectra of Mn2+ ions which might remain in the host crystals.
Though the 5 eV absorption band of CdC12 doped with LiCl disappeared com-
111
3100 33003500
MAGNETIC FIELD (GAUSS )
Fig. 8. EPR absorption spectra of r-ray irradiated CdC12 :LiC1. A spectrum of Mnz+ ion is superposed on the three lines produced by r-ray
irradiation. r-ray irradiation was made at room temperature.
( 15 )

H. MATSUMOTO and Y. NAKAMURA
pletely with the r-ray irradiation of 3 x 10⁶ R at room temperature, new absorp-tion lines appeared in the EPR spectra besides that of Mn2+ ions in the crystal.
The new EPR spectra are composed of three lines as shown in Fig. 8. The value of g-factor of the central line is 2.011, the intensity ratio of three lines is
about 1 :3: 1, the separations of lines are about 20 gauss and the peak to peak
width of a line is about 10 gauss each at 77°K.
Any anisotropy of EPR spectrum was not observed with respect to the direc-tions of static magnetic field and crystal orientation.
The EPR spectra of Mn2+ ions in the host crystal seemed to make no change with the irradiation of r-rays.
III. DISCUSSION
As for the positions of the absorption peaks, the 5 eV band of CdC12 crystals
which appears at the edge of the fundamental absorption resembles the absorp-
tion bands due to (OH)- ions15,16), 02_ ions"' or 02- ions"' in the alkali halide crystals.
It is well known that these ions are apt to be mixed into crystals during the
procedure of preparation and growth. The possibility that the 5 eV band of CdC12 crystals is due to these ions cannot be eliminated at this stage.
The absorption peak of the 5 eV band shifts to the higher energy and the
width of the band decreases and becomes sharp at lower temperature. This
suggests that the electrons responsible to the absorption band would suffer the
considerable influence of the potential energy of surrounding lattices. This
situation is similar to that of F band, a band and ig band in alkali halide
crystals .18,1°)
The absorption peak of the 5 eV appears at 0.15 eV lower for the group 1
crystals than for the group 2 crystals. This implies that the center is stable in
the position close to Li+ impurity in the crystals and the center suffers a strong
perturbation from neighboring Li+ ion. This is very similar to the case of FA center in alkali halide crystals, however, the splitting of the band is not observed
in this case in contrast with the FA band in alkali halide crystals.20'
Though the irradiation of 1-rays or x-rays on the group 1 crystals does not
make any change in the 5 eV band at liquid nitrogen temperature, the 5 eV band can be vanished completely by the irradiation on the group 1 crystals at room
temperature. The irradiation on the group 2 crystals does not make any change
in the 5 eV band at room temperature.
These facts suggest that the 5 eV band does not owe to the fundamental
absorption perturbed by the impurities or imperfections accompanied by the
impurities as the case of a band or (3 band in the alkali halide crystals.18'
It is natural to consider that the disappearance of the 5 eV band results from
the destruction of the centers caused by the release of lithium from the centers.
Li+ ions capture electrons released from the centers or from other ions by the
action of ionizing radiation and become neutral lithium atoms. They may leave
the centers and move around in the crystals to make aggregations of lithium
( 16 )

Optical and EPR Studies on CdCIz Crystals
metals. The broad absorption band around 3.5 eV of group 1 crystals may be
attributed to these lithium aggregations.21-23)
Though irradiation of r-rays or x-rays on the group 2 crystals at room
temperature does not affect the 5 eV absorption bands, intensity of the 5 eV band
decreases and new absorption band appears with the irradiation of x-rays on
CdC12 : CdO of the group 2 at 77°K. This new band is very unstable and vanishes
in few minutes at 77°K and the intensity of the 5 eV band recovers.
In group 2 crystals, a certain temporary change caused by the irradiation is
not accompanied with the release of lithium or other ions from the center and
the destruction of the center does not occur. To the contrary, in group 1 crystals
the change caused by the irradiation at room temperature is accompanied with the release of lithium from the center and destruction of the center, so that the
recovery of the crystal from the radiation damage is very slow and incomplete.
Finally, the 5 eV absoption band may belong to an intra radical transfer
spectrum of impurity radical such as (OH)- or 02- in the crystal or ,to a kind
of charge transfer spectra due to a transfer of an electron from an unknown
impurity to its ligand or from the ligand to the impurity where the ligand con-tains Li+ ion in the case of group 1 crystal.
Some possible models will be discussed below for the paramagnetic centers
produced by r-ray irradiation in the group 1 crystals. Three unequal lines in the EPR spectra such as shown in Fig. 8 can be
produced in the following cases. (1) Superhyperfine structure of an electron or a hole interacting with two similar nuclei whose spin quantum number are 1/2.
(2) Superposition of a single line caused by an isolated one electron or one hole center and three lines caused by a pair of two similar one electron or one hole
certers coupled by an exchange interaction. (3) EPR spectrum of an ion whose
electronic spin quantum number is 3/2 and orbital angular momentum of the
ground state is quenched. (4) Superposition of hyperfine structures of isotopes with different nuclear spin quantum numbers.
As case (1), nuclei H', Cd11' and Cd113 would be plausible and as case (2), O2_
ions would be considered. As there may exist sufficiently large anisotropies in
the interactions between these two nuclei or two centers in the crystals, certain
anisotropies may be expected in the EPR spectra. This contradicts the experi-
mental observations. As a strong hyperfine interaction of Li' may exist, the
possibility of the appearance of a single line due to the colloidal aggregates of lithium meta124) and three lines or more due to the exchange interactions between
neutral lithium atoms in the aggregates should be examined in detail.
As for the case (3), firstly, iron group ions of (d)3 or (d)7 electronic config-urations can be considered. In this case these paramagnetic centers would have
been converted from the centers responsible to the 5 eV optical absorption bands. Cr'', (3d)3, ion may be converted from Cr2+, (3d)4, by irradiation. Though Cr3+
ion in the CdC12 shows complex optical absorption spectra as shown in Fig. 5 (c),
irradiated crystals of group 1 do not show such absorption bands, so that Cr3*
ion can be excluded from the model of the paramagnetic center.
As Co2+, (3d)7, ion has a large number of hyperfine structures and large values
( 17 )

H. MATSUMOTO and Y. NAKAMURA
of g-factor'), this ion is also excluded.
If it is assumed that Ni',+ (3d)', can be converted from Ni',+ (3d)8, the optical absorption spectrum of Ni2+ ion in CdCl2 has been known' and the 5 eV absoption
band has not been observed in the spectrum, then Ni'+ ion also can be excluded
for the center.
Secondly, as O+ ion has an electronic configuration (3p)3 and 4S ground state,
it would have three EPR absorption lines and g values of about 2. The calculated intensity ratio of the lines is 3 : 4 : 3, in the strong magnetic field approximation.
Agreement of this ratio with observed one is not good.
As for the possibility of (4), isotopes responsible to the spectrum must have
nuclear spin quantum numbers of 1/2 and zero with the abundance ratio of about 2 to 3 or nuclear spin quantum numbers of 1 and zero with the abundance ratio of
about 3 to 2. There may exist none of natural isotope satisfying these limitation except cadmium.
Cadmium has many isotopes, though Cd"1 and Cd113 have nuclear spins of 1/2
and abundance of 12.8 percent and 12.3 percent respectively, Cd112 and Cd"4 have no nuclear spins and abundance is 24.1 percent and 28.9 percent respectively.
The abundance ratio is not satisfactory to explain the observed intensity ratio
of the lines.
After all, a decisive model is not obtained at this stage and colloidal lithium, oxygen ion (O+) or cadmium ion (Cd3+ or Cd+) is not excluded from the model
of the paramagnetic center.
More extensive studies are needed under various conditions in irradiation
dosage and temperature and in sample preparation to obtain the compatible
explanation for the optical and EPR data.
ACKNOWLEDGMENT
The authors wish to express their sincere thanks to Professor Yoshio Nakai
for the encouragement throghout the work. Their thanks are also due to Messrs. T. Miyanaga, K. Kanno and S. Naoe for the helpful cooperation in the measure-
ments. They are also deeply indebted to Dr. T. Higashimura, Mr. R. Katano
and Mr. T. Warashina for the use of facilities for Y-ray irradiation.
REFERENCES
(1) H. Watanabe, Progr. Theor. Phys., 18, 405 (1957). (2) H. Koga, K. Horai and O. Matsumura. J. Phys. Soc. Japan, 15, 1340 (1960) ; T. P. P.
Hall, W. Hayes and F. I. B. Williams, Proc. Phys. Soc. (London), 78, 883 (1961). (3) K. Morigaki, J. Plzys. Soc. Japan, 16, 1639 (1961).
(4) H. Matsumoto, J. Phys. Soc. Japan, 20, 1579 (1965). (5) I. Y. Chan, D. C. Doetschman, C. A. Hutchison Jr., B. E. Kohler and J. W. Stout, J.
Chem. Phys., 42, 1048 (1965). (6) L. Langouet, J. Phys., 28, 582 (1967).
(7) H. G. Hove and D. O. Van Ostenburg, Phys. Rev., 167, 245 (1968). (8) T. Iri and G. Kuwabara, J. Phys. Soc. Japan, 24, 127 (1968).
(9) R. G. Wilson, F. Holuj and N. E. Hedgecock, Phys. Rev. B, 1, 3609 (1970). (10) T. Goto and M. Ueta. J. Phys. Soc. Japan, 29, 1512 (1970).
( 18 )

Optical and EPR Studies on CdC12 Crystals
(11) R. R. Sharma, Phys. Rev. B, 3, 76 (1971). (12) H. Matsumoto and T. Miyanaga, Bull. Inst. Chem. Res. Kyoto Univ., 44, 1 (1966) ; 45,
43 (1967). (13) K. Kanno, T. Miyanaga, S. Naoe and H. Matsumoto, Bull. Inst. Chem. Res. Kyoto Univ.,
47, 14 (1969) ; J. Phys. Soc. Japan, 30, 1669 (1971).
(14) J. Rolfe, J. Chem. Phys., 40, 1664 (1964). (15) D. A. Patterson and M. N. Kabler, Solid State Commun., 4, 75 (1965). (16) H. KOstlin, Solid State Commun., 4, 81 (1965). (17) T. Andersen and J. L. Baptista, Phys. Status Solidi (b), 44, 29 (1971). (18) F. Seitz, Rev. Mod. Phys., 26, 7 (1954), §24. (191 W. B. Fowler, "Physics of Color Centers," ed. W. B. Fowler (Academic Press, Inc.,
New York, N. Y., 1968), Chapter 2. (20) F. Luty, "Physics of Color Centers," ed. W. B. Fowler (Academic Press, Inc., New
York, N. Y., 1968), Chapter 3. (21) F. Seitz, ibid., §17. (22) S. C. Jain and G. D. Sootha, Phys. Rev., 171, 1075 ; 1083 (1968). (23) S. C. Jain and S. Radhakrishna, J. Phys. Soc. Japan, 25, 1618 (1968). (24) W. T. Doyle, D. J. E. Ingram and M. J. A. Smith, Proc. Phys. Soc. (London), 74, 540
(1959).
( 19 )