optical textures observed during the shearing of ...152 optical studies of thermotropic liquid...
TRANSCRIPT

Faraday Discuss. Chem. Soc., 1985, 79, 149-160
Optical Textures Observed during the Shearing of Thermotropic Liquid-crystal Polymers
BY N. J. ALDERMAN AND M. R. MACKLEY*
Department of Chemical Engineering, University of Cambridge, Pembroke Street, Cambridge CB2 3RA
Received 3rd January, 1985
We report optical observations of a number of main-chain thermotropic liquid-crystal polymers. In situ measurements were carried out at elevated temperatures using an apparatus that is capable of providing a controlled translational oscillatory shearing motion to samples of typically 1-10 pm thickness. In static samples we observe either a general birefringence with local scattering from line defects which we believe to be disclinations, or in thicker samples a texture dominated by light scattering due to the presence of dense disclinations. Superimposed shearing appears to result in both the multiplication of disclinations and the progressive decrease in the distance between individual disclinations. At high shear rates pure birefringence in the direction of flow is observed. Finally we report on the optical relaxation behaviour of oriented samples together with an explanation for the skin core effect observed when thermotropic liquid-crystal polymers are extruded through dies.
When viewed in the optical microscope, main-chain thermotropic liquid-crystal polymers generally exhibit strong birefringence and or scattering where usually the light scattering is of sufficient intensity to limit transmitted-light microscopy to sample thicknesses < 15-20 pm. It is one of the primary objectives of this paper to characterize the parameters that influence these optical textures and to provide a structural interpretation of the observations. In addition we are particularly inter- ested in the effect of shear on the structural reorganization of liquid-crystal polymers.
Our starting viewpoint is that if the molecular weight of the liquid-crystal polymer is reduced sufficiently, we would expect the material to behave in a similar way to that of small-molecule liquid crystals. On this basis our investigation can start in an area where materials have previously been fully optically characterized; see e.g. ref. ( 1)-(4). Whilst the textures and classification appropriate to small-molecule liquid crystals need not necessarily apply to liquid-crystal polymers our own optical observations suggest that for the systems we have examined there are indeed strong connections with nematic small-molecule liquid crystals and thermotropic liquid- crystal polymers.
For static nematic small molecular liquid crystals there is ample evidence to support the view for the existence of line defects, which have been shown to correspond closely to Frank’s’ two-dimensional theoretical classification of disclina- tions. Meyer‘ observed what he called ‘thick’ and ‘thin’ disclination lines, where the ‘thicks’ generally had the characteristics of s = *l and the ‘thins’ s = *$, the strength of the disclination being defined as s = f (the number of extinction bands). In some instances it is possible to obtain a sample free from line defects. In particular, if the surfaces are clean, the director ,may orient with the director vertical to the glass plates bounding the fluid. When viewed between crossed polars and
149

150 OPTICAL STUDIES OF THERMOTROPIC LIQUID CRYSTALS
Fig. 1. spring-
Schematic diagram of shearing apparatus: ( 1 ) motor, (2) gearbox, (3) cam, .loaded piston, (5) mechanical slider, (6) heater, (7) 13 mm diameter quartz glass
and (8) hole for the thermocouple.
(4) disc
vertically through the plates, the field of view will be dark, and in bright field there will be no contrast. Wahl and Fischer’ conducted experiments starting from this situation and they observed the effect of a superimposed steady rotational displace- ment of one circular plate with respect to the other. They observed that at low shear rates (typically 0.1 - 10 s-’ depending on sample thickness) the shear had the effect of orienting the director in the direction of flow, an observation that was consistent with the predictions of the Erickson-Leslie theory’ for small-molecule liquid crystals. At higher shear rates they observed the appearance of line defects causing bright-field scattering which progressively obscured the field of view. Graziano and Mackleyg subsequently observed the occurance of these line defects in detail and showed that the line defects were due to a dynamic equilibrium of disclination loops for both ‘thick’ and ‘thin’ variety corresponding to loops of +1 and *$ strength. Disclination loops were being continually created, deformed, relaxed and lost depending in particular on the relative orientation at any instant of the loop with respect to the flow field.
It will be the contention of the results which follow that thermotropic liquid- crystal polymers also possess disclinations and that on shearing substantial disclina- tion multiplication is observed. Typically the disclination density appears to be greatly enhanced over that found for small-molecule liquid crystals.

N . J. ALDERMAN A N D M. R. MACKLEY 151
APPARATUS
Experiments were carried out in an apparatus shown schematically in fig. 1 and as a photograph in plate 1. The essential features of the device comprise a static-top quartz glass disc which can be accurately positioned using three outer micrometers with respect to a bottom glass disc mounted onto a precision horizontal mechanical slider. With experience we were able to position the top glass disc such that the gap between the optically flat glass discs was uniform and typically 1-15 pm in thickness. The temperatures of both the top and bottom glass discs were controlled independently using separate heaters in the temperature range 20-350 "C. At a temperature of say 300°C we estimate temperature variations of not more than *1 "C over the whole field of view. Controlled movement of the bottom glass disc was achieved by means of a piston-and-cam arrangement shown in fig. 1. In order to achieve different amplitudes of oscillation a range of cams were used varying from 0.1 to 0.5 mm displacement from the central position; in addition variable rotational speeds were explored ranging from 0.07 to 2 1 .O rad s-'. Experiments described in the paper were carried out using a modified 'Swift' polarizing-light microscope with a x20 long working-distance objective and the useful facility of coupled polarizer and analyser rotation.
MATERIALS AND SAMPLE PREPARATION
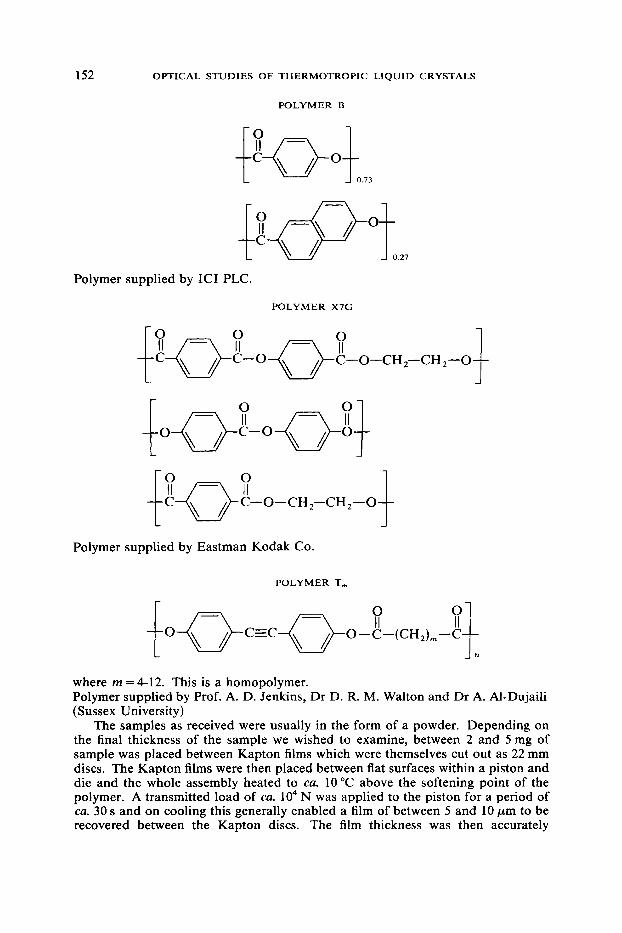
Over the past five years we have examined a wide range of thermotropic liquid-crystal polymers from a variety of sources. In this paper we will limit our observations to four different chemical compositions. Our knowledge of the molecular-weight averages and/or distribution is very limited, and only in one of the series to be discussed do we have low and high molecular-weight variants. The repeat units of what are thought to be random copolymers are shown below.
POLYMER A
L c1 JII
This has molecular weights corresponding to the following inherent viscosities.
Polymer A1 : inherent viscosity 0.056 x Polymer A5: inherent viscosity >0.12 X lop3 m3 kg-'
m3 kg-'
Polymer supplied by ICI. PLC.
152 OPTICAL STUDIES OF THERMOTROPIC LIQUID CRYSTALS
POLYMER B
Polymer supplied by ICI PLC.
POLYMER X7G
f C-0-CH ,-CH 2-0
C-O-CH2-CH2-0 L J
Polymer supplied by Eastman Kodak Co.
POLYMER T,
where rn = 4-12. This is a homopolymer. Polymer supplied by Prof. A. D. Jenkins, Dr D. R. M. Walton and Dr A. Al-Dujaili (Sussex University)
The samples as received were usually in the form of a powder. Depending on the final thickness of the sample we wished to examine, between 2 and 5mg of sample was placed between Kapton films which were themselves cut out as 22 mm discs. The Kapton films were then placed between flat surfaces within a piston and die and the whole assembly heated to cu. 10 "C above the softening point of the polymer. A transmitted load of ca. lo4 N was applied to the piston for a period of cu. 30 s and on cooling this generally enabled a film of between 5 and 10 pm to be recovered between the Kapton discs. The film thickness was then accurately

N. J. ALDERMAN A N D M. R. MACKLEY 153
measured using a digital micrometer and samples of ca. 2-3 mm2 were cut for each optical observation. When the sample had been placed between the glass discs of the shearing apparatus a low-magnification photograph was taken of the sample. On subsequent heating the sample thickness might change and further low-magnifica- tion photographs were taken during the experiment. In this way the area of the sample was known, and for a given known starting area and thickness, the thickness at any subsequent stage could be determined to an accuracy of ca. *l pm.
STATIC OPTICAL TEXTURES
Optical observations in static thermotropic liquid-crystal polymers have been made by a number of worker^^^-^^ and our main objective in this section is to extend these observations showing clearly that textures are sensitive in particular to molecular weight, temperature and sample thickness. We have deliberately chosen samples in temperature ranges that do not obviously show any phase transitions, and in particular we are limiting observations to a temperature below that where the polymer may become isotropic. All observations shown are thermally stable and do not change significantly with time.
We have observed certain optical features general to polymers Al, A5, B, X7G, T7 and others not cited in this paper. We list their general features below and then demonstrate their existence using specific examples from the chosen range of polymers tested. (1) Individual disclination lines and loops exist in thin-section samples when observations are generally made at high temperatures. (2) Increasing the sample thickness causes the background birefringence to be obscured owing to the presence of a dense disclination texture. ( 3 ) Increasing the molecular weight appears to result in an increasing disclination density. (4) Decreasing the tem- perature causes the disclination density to increase.
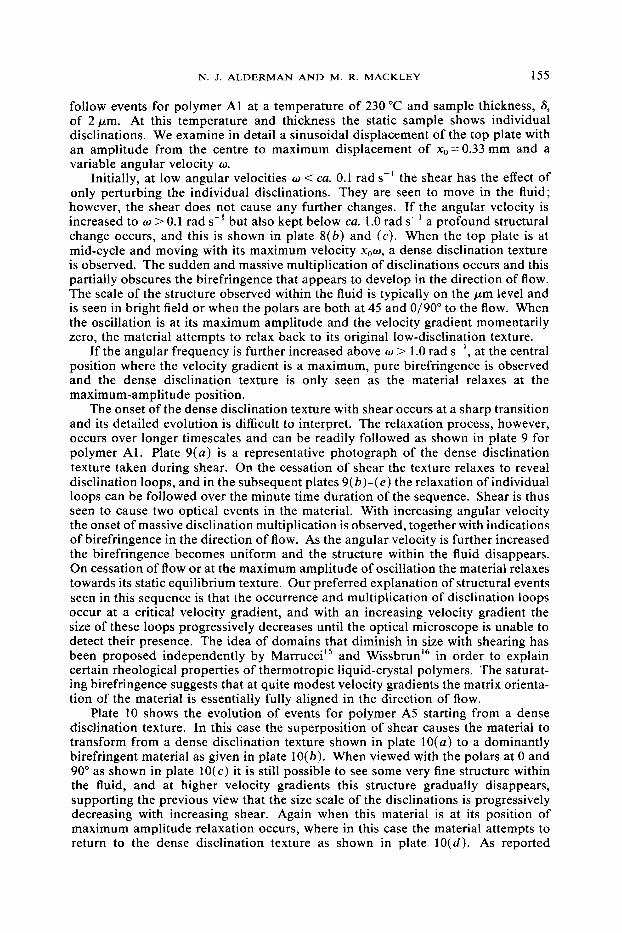
We have found that the A series polymers are particularly suitable for optical observation as the working temperature range is broad and in the region of 200- 300 "C. The presence of individual line defects is clearly shown in plates 2(a ) and (b), which corresponds to the lower-molecular-weight version of polymer A, viewed at a temperature of 230 "C with a specimen thickness of 2.0 pm. At this temperature the melt is mobile and birefringent as shown in plate 2(a ) when viewed between crossed polars. When the analyser is removed the individual line defects are seen as in plate 2(b). We see predominantly loops, although line defects terminating at the top and bottom glass surface can also be observed. Whilst it is not possible from this side elevation view to prove conclusively that these line defects are disclinations, their characteristics bear a striking resemblance to the f 1 'thick' disclinations observed in previous work' for nematic small-molecule liquid-crystal polymers. When the sample thickness is increased as shown in plates 2( c ) and ( d ) , the disclination density increases. We note that the background spatial variation of the matrix birefringence seems largely unaffected by the presence of the line defects, suggesting that the line defects although present are only significantly affecting the director trajectory of the material very close to the line defect.
With a further increase in sample thickness shown in plates 2(e) and (f), the birefringent contrast is gradually lost and an intense bright-field scattering is observed. The texture then appears very similar when viewed either between crossed polars or without an analyser. In a previous publication one of us13 named this contrast a 'worm texture'. After careful examination of many experiments we are now able to be more specific and state that this contrast corresponds to a dense disclination texture where we are observing the net optical effect of light that has

154 OPTICAL STUDIES OF THERMOTROPIC LIQUID CRYSTALS
been strongly refracted and scattered as it passes thraugh a sample that contains many disclinations of the type that were seen individually in the thinner sections.
The effect of increasing molecular weight is shown in plate 3 . These photographs are for polymer A5 which has a higher molecular weight than polymer A1 used in plate 2. In order to observe individual disclinations shown in plate 3(a) it is now necessary to increase the temperature to ca. 280 "C and have a sample thickness of CQ. 1 pm. If at this temperature the sample thickness is increased to say 5 pm, the dense disclination texture occurs as shown in plate 3( 6). If at this sample thickness the temperature is reduced the scattering further increases, resulting in the material becoming nearly opaque at this sample thickness.
The systematic effect of temperature on texture is clearly shown in plate 4 for polymer X7G. At a temperature of 350"C, which is close to the material's anisotropic-isotropic transition individual disclination lines can be seen. Also, in the middle of plate 4(a) a 'centred texture' can be seen where four extinction bands emanate from a point. These extinction bands rotate with the polar rotation indicat- ing that we are viewing a *I disclination along the axis of the line defect. If the temperature is reduced to 280 "C the number of disclinations increases as shown in plate 4( b) . A further reduction in temperature to 220 "C at the same sample thickness results in the progressive appearance of the dense disclination texture where the birefringence becomes obscured by the intense scattering. Polymer B also shows a similar effect in terms of disclination density. In plate 5( a ) , at the higher temperature of 300 "C individual disclinations can again be seen. If the thickness remains constant a reduction in temperature will result in the disclination density increasing to such an extent that the dense disclination texture develops as shown in plate 5( 6). Again many of the T, series Sussex Polymers also show the characteristic dense disclination texture, and an example is given in plate 6 for the polymer T7. Plate 6(a) shows the dense disclination texture viewed between crossed polars and plate 6( b ) similar contrast with polarizer only.
The T, series polymers are interesting in that they provide a system with a variable flexible unit. Generally up to the T7 polymer a dense disclination texture was observed; however, the T8 polymer has a striking and unusual mobile behaviour shown in plate 7. Initially, the mobile polymer at 180 "C shown in plate 7(a) and ( b ) is strongly birefringent with extinction bands that respond to the rotation of the polars. No line defects are apparent in this material, and this makes optical observations less complicated. On heating, as shown in plate 7 ( c ) and ( d ) , regions of the sample gradually become dark, indicating that these areas either have become isotropic or (as we believe) are areas where the director is vertical with respect to the glass plates. At a temperature of 225 "C all the sample appears dark [plate 7( e ) ] . If the sample is then sheared as shown in plate 7 ( f ) uniform and bright birefringence is seen, strongly suggesting that the previous orientation was director-vertical and that the shear had rotated the director in the direction of flow. The temperature effect is thermally reversible and has two plausible explanations. When the director is vertical the material must be optically uniaxial, as darkness is observed for all crossed polar orientations. With the lowering of temperature either the material in certain regions is reorienting towards director horizontal or alternatively (as pro- posed by Viney et aZL4 from separate experimental observations) the material is becoming optically biaxial with the principal director remaining vertical.
EFFECT OF SHEAR
Our starting point for optical observations of shear is either from the texture showing individual disclinations or the dense disdlination texture. In plate 8 we
N. J. ALDERMAN A N D M. R. MACKLEY 155
follow events for polymer A1 at a temperature of 230°C and sample thickness, 8, of 2 pm. At this temperature and thickness the static sample shows individual disclinations. We examine in detail a sinusoidal displacement of the top plate with an amplitude from the centre to maximum displacement of xo= 0.33 mm and a variable angular velocity w.
Initially, at low angular velocities w < ca. 0.1 rad s-I the shear has the effect of only perturbing the individual disclinations. They are seen to move in the fluid; however, the shear does not cause any further changes. If the angular velocity is increased to w > 0.1 rad s-I but also kept below ca. 1 .O rad s-' a profound structural change occurs, and this is shown in plate 8(6) and (c). When the top plate is at mid-cycle and moving with its maximum velocity xow, a dense disclination texture is observed. The sudden and massive multiplication of disclinations occurs and this partially obscures the birefringence that appears to develop in the direction of flow. The scale of the structure observed within the fluid is typically on the pm level and is seen in bright field or when the polars are both at 45 and 0/90° to the flow. When the oscillation is at its maximum amplitude and the velocity gradient momentarily zero, the material attempts to relax back to its original low-disclination texture.
If the angular frequency is further increased above w > 1.0 rad s-', at the central position where the velocity gradient is a maximum, pure birefringence is observed and the dense disclination texture is only seen as the material relaxes at the maximum-amplitude position.
The onset of the dense disclination texture with shear occurs at a sharp transition and its detailed evolution is difficult to interpret. The relaxation process, however, occurs over longer timescales and can be readily followed as shown in plate 9 for polymer Al . Plate 9 ( a ) is a representative photograph of the dense disclination texture taken during shear. On the cessation of shear the texture relaxes to reveal disclination loops, and in the subsequent plates 9( 6)-( e ) the relaxation of individual loops can be followed over the minute time duration of the sequence. Shear is thus seen to cause two optical events in the material. With increasing angular velocity the onset of massive disclination multiplication is observed, together with indications of birefringence in the direction of flow. As the angular velocity is further increased the birefringence becomes uniform and the structure within the fluid disappears. On cessation of flow or at the maximum amplitude of oscillation the material relaxes towards its static equilibrium texture. Our preferred explanation of structural events seen in this sequence is that the occurrence and multiplication of disclination loops occur at a critical velocity gradient, and with an increasing velocity gradient the size of these loops progressively decreases until the optical microscope is unable to detect their presence. The idea of domains that diminish in size with shearing has been proposed independently by Marrucci I S and WissbrunI6 in order to explain certain rheological properties of thermotropic liquid-crystal polymers. The saturat- ing birefringence suggests that at quite modest velocity gradients the matrix orienta- tion of the material is essentially fully aligned in the direction of flow.
Plate 10 shows the evolution of events for polymer A5 starting from a dense disclination texture. In this case the superposition of shear causes the material to transform from a dense disclination texture shown in plate lO(a) to a dominantly birefringent material as given in plate 10(b). When viewed with the polars at 0 and 90" as shown in plate 1O(c) it is still possible to see some very fine structure within the fluid, and at higher velocity gradients this structure gradually disappears, supporting the previous view that the size scale of the disclinations is progressively decreasing with increasing shear. Again when this material is at its position of maximum amplitude relaxation occurs, where in this case the material attempts to return to the dense disclination texture as shown in plate 10(d). As reported

156 OPTICAL STUDIES OF THERMOTROPIC LIQUID CRYSTALS
1 I 1 1 l 1 1 l I I I I I 1 1 1
1 10 100 1000
Fig. 2. Polymer A5. T = 240 "C. Graph of maximum measured birefringence as a function of the maximum velocity gradient d, = x o w / 6 where 6 = 4.3 pm and xo = 0, 0.33, 0, 0.24 and A, 0.1 1 mm. (A) Dense disclination texture; (B) ordered texture only observed at
maximum strain rate; (C) ordered texture.
previously by Graziano and Mackley," on the cessation of flow the material may under certain circumstances relax to the dense disclination texture or alternatively, as shown in plate 11 straight at right angles to the direction of flow may occur.
The development of birefringence measured using a rotary quartz compensator and plotted as a function of the maximum applied velocity x ,w/6 is shown in fig. 2 for polymer A5 at a temperature of 240°C. The graph shows the approximate range in which the dense disclination texture is seen, together with the birefringence measurements which at high velocity gradients rapidly saturate corresponding pre- sumably to the fully oriented state. We noted a very slight effect on the magnitude of the maximum birefringence observed using cams of different amplitudes xo.
PROCESSING OF FIBRES
We can expect the development of orientation and textures reported in the previous sections to influence the rheology, processing and final solid-state properties of thermotropic liquid-crystal polymers, and by way of example we report on how the properties of fibres made from polymer A5 and polymer B can be significantly influenced by processing conditions.
Polymer fibres were produced by ram extrusion of the polymer through a circular die of the form shown schematically in fig. 3. The extrudate, which showed little or no die swell, was wound up in air at ambient temperature on a take-up spool such that either a 'free-fall' fibre could be obtained or alternatively a differential draw could be applied between the die exit and take-up. Initially a series of experiments were carried out for different length-to-diameter ratios of dies and at different die temperatures with the mobile anisotropic phase of the polymer; however, no systematic effect on fibre properties could be established. A further series of experiments was conducted, examining the effect of the fibre draw ratio that was achieved during subsequent cooling and solidification of the fibre downstream of the die. Scanning electron micrographs of fracture surfaces of fibres formed from a 1 mm diameter die are shown in plate 12 for polymer A5 processed at T = 250 "C. Plate 12(a) corresponds to the free-fall fibre where no draw down occurs downstream of the die. The micrograph clearly shows what appears to be a two-phase structure. Near the outer surface the skin is highly fibrous with the fibres oriented parallel to

N. J. ALDERMAN A N D M. R. MACKLEY 157
Fig. 3. Schematic diagram of fibre extrusion system: ( a ) experimental arrangement, and ( b ) velocity-profile rearrangement.
the fibre axis. X-Ray measurements1' also show that this material is highly oriented. In the central region the structure of the core material is less well ~ r i e n t e d ' ~ with an observed texture resembling that of a 'knotty' piece of wood. Plate 12(b) is an electron micrograph of a sample drawn to a draw ratio of 3 where the draw ratio is defined as the ratio of the original diameter of the fibre at the die exit to the final diameter of the solid fibre. In this fibre the material appears to have a uniform and highly oriented texture across the ~amp1e.l~
The mechanical properties reflect the ratio of skin core present in the fibre. Fig. 4 shows the Young's molulus of polymer fibres A5 and B produced from a 0.4 mm die with different final draw ratios. As the draw ratio increases the amount of oriented skin increases and the amount of 'disoriented' core decreases. This leads to an increasing Young's modulus as a function of draw ratio until a limiting plateau modulus is reached for both polymers.
An explanation for the variation of modulus and the presence of a sharp skin-core boundary low draw ratios can be envisaged in terms of an understanding of the velocity profile rearrangement at the exit of the die.
Pressure-drop measurements of polymers A5 and B suggested that they both behaved as power-law fluids where the shear stress T is given by
where K and n are constants for the fluid and v is the velocity at a radial position r within the die. We found that the power-law indices for polymers A5 and B were 0.50 and 0.72, respectively. If we assume the fluid behaves as a power-law fluid and the flow is viscometric at the exit, the velocity profile at the exit is given by
where S is the pressure gradient in the die and ro the radius of the die.

158 OPTICAL STUDIES OF THERMOTROPIC LIQUID CRYSTALS
30
2 5
"E -r 20 z 4: m
1
ln 3
'cf Y 15
z ln
bD
10 *
5
0
-1 rA---.- - -- -
$ 1 I
I' i
I t
. i
1 2 3 4 5 draw ratio
Fig. 4. Plot of Young's modulus as a function of draw ratio for polymers A5 (0) and B (A) extruded at 256 "C and 295 "C, respectively from a 0.4 mm die at a volumetric flow of
4.6 x m3 s-'.
For the above velocity profile the mean velocity is is given by
and the centre line maximum velocity v, is given by
In the case of the free-fall fibre, the final velocity of the fibre at the take-up will be 5; this means that in outer regions of the fibres, where v, <6, fluid elements will be accelerated longitudinally and in the core region, where v, > is, these fluid elements are decelerated in an axial compression velocity fluid. The boundary between accelerated and decelerated fluid elements occurs at a radius r, where v,= 6 ; this yields
On the basis that the skin comes from oriented fluid elements -that have been stretched and the core from fluid elements that have been axially compressed, we

N. J. ALDERMAN AND M. R. MACKLEY 159
might expect from the above equation to have skin/core area ratios of 0.84 and 0.93 for free-fall polymers of types A5 and B where n = 0.5 and 0.72, respectively.
When the fibre is drawn down after extrusion from the die, the final velocity v2 of the fibre increases and the fibre radius ratio is given from the mass balance:
v2.nr: = fi.rrri
where r2 is the final diameter of the fibre. Eventually, when v2 >urn, the maximum velocity at the die exit, all fluid elements leaving the die should be being accelerated with none decelerated. On this simple basis one might expect all the fibre to correspond to oriented skin when v2= urn, yielding a critical draw ratio R, where
3n + 1
This gives values of R, = 1.29 for polymer A5 and R, = 1.35 for polymer B. In fig. 4 we note that a draw ratio of ca. 2 is required in order to rech plateau modulus values where presumably all the fibre is fully oriented. The above predictions are therefore low; however, the trend is in the correct direction and this gives confidence that the sharp skin-core transition and its transfer to all-skin at high draw ratios is indeed due to the materials extreme shear sensitivity.
We have shown in the previous section that thermotropic liquid-crystal polymers orient readily in shearing flows. The results described in this section suggest that these liquid-crystal polymers also readily orient in longitudinal accelerating flows but of possible equal importance they do not appear to be stable in decelerating axial flows, where a form of random anisotropy appears to develop. The stability of director orientation in small-molecule nematic liquid crystals subject to convergent flows, and their apparent instability in divergent flows was eluded to by Leslie in a recent address.8 This could be an important starting point for the further mathe- matical simulation of the flow behaviour for the more complex thermotropic liquid- crystal polymer. The additional role of disclinations, their multiplication and pos- sible relaxation is an additional area that demands future attention if the properties of these interesting materials are to be fully understood and exploited.
We acknowledge the pioneering contribution of Diane Graziano to this work. Stimulating discussions with Sir Charles Frank, Kurt Wissbrun, Aubrey Jenkins, David Walton, Amar Al-Dujaili and Geoff Mitchell have aided our thinking. The skin-core work was largely carried out with the help of Chemical Engineering project students Fiona Macleod, Richard Fenner, Debbie Collins and Paul Chambers, and we are grateful for all their contributions. We also thank the various suppliers of material. Finally our thanks go to Alan Butcher, who expertly constructed the shearing apparatus.
D. Demus and L. Richter, Textures of Liquid Crystals (VEB Deutscher Verlag fur Grundstoff Industrie, 2nd edn, 1978). S. Chrandraseker, Liquid Crystals (Cambridge University Press, Cambridge, 1980). P. G. de Gennes, The Physics of Liquid Crystals (Oxford University Press, Oxford, 1974). M. KICman, Points, Lines and Walls (Wiley Interscience, New York, 1983). F. C. Frank, Discuss. Furaday SOC., 1958, 25, 19.
ti R. B. Meyer, Philos. Mag., 1973, 27, 405. ’ J. Wahl and F. Fischer, Mol. Cryst. Liq. Cryst., 1973, 22, 359. * F. M. Leslie, Philos. Trans. R. Soc. London, Ser. A 309, 1983, 155.
lo M. R. Mackley, F. Pinaud and G. Siekmann, Polymer, 1981, 22, 437. D. J. Graziano and M. R. Mackley, Mol. Cryst. Liq. Cryst., 1984, 106( 1/2), 103.

160 OPTICAL STUDIES OF THERMOTROPIC LIQUID CRYSTALS
M. Kleman, L. Liebert and L. Strzelecki, Polymer, 1983, 24, 295. l 2 C. Viney and A. H. Windle, J. Muter. Sci., 1982, 17, 2661. l 3 D. J. Graziano and M. R. Mackley, Mol. Ctyst. Liq. Crysf., 1984, 106(1/2), 73. l4 C. Viney, G. R. Mitchell and A. H. Windle, Mol. Ctysf. Liq. Crysf., in press. I 5 G. Marrucci, paper presented at Int. Congr. Rheology (Acapulco, 1984). l 6 K. F. Wissbrun, Faraday Discuss. Chem. SOC., 1985, in press.
G. R. Mitchell, personal communication.

Plate 1. Photograph of shearing apparatus.
[facing page 160

Plate. 2. Polymer Al: t = 230 "C, horizontal field of view 350 pm. Sample thickneqs 6 given for each photograph, crossed polar orientation shown in each photograph by orientation of cross wires. ( a ) Crossed polars, S = 2.1 pm; ( b ) polarizer only, S = 2.1 pm; (c) crossed polars, S = 7.9 pm; ( d ) polarizer only, S = 7.9 pm; (e ) crossed polars, 6 = 15 pm; (f) polarizer only,
S = 15 pm.
Plate 3. Polymer A5: horizontal field of view 350 pm. ( a ) Crossed polars, S = 1.2 pm, T = 280 "C; ( b ) crossed polars, S = 6.0 pm, T = 280 "C ; (c ) crossed polars, S = 6.0 pm, T =
240 "C.
Plate 4. Polymer X7G: horizontal field of view 350 pm. ( a ) Polars crossed, 6 = 4.0 pm, T = 350 "C; ( b ) polars crossed, S = 4.0 pm, T = 280 "C; ( c ) polars crossed 6 = 4.0 pm, T =
220 "C.
Plate 5. Polymer B: horizontal field of view 350 pm. ( a ) Polars crossed, S = 5 pm, T = 300 "C ; ( b ) polars crossed, S = 5 pm, T = 280 "C.
Plate 6. Polymer TI: horizontal field of view 350 pm. ( a ) Polars crossed, S = 10 pm, T = 140 "C; ( b ) polarizer only, S = 10 pm, T = 140 "C.
Plate 7. Polymer T8: horizontal field of view 350 pm. (a ) Polars crossed, T = 180 "C; ( b ) polars crossed, T = 180 "C; [rotated w.r.t. ( a ) ] ; ( c ) polars crossed, T = 200 "C; ( d ) polars crossed, T = 210 "C; (e) polars crossed, T = 225 "C; (f) polar crossed, T = 225 "C, shear in
45" direction.
Plate 8. Polymer Al: horizontal field of view 350 pm, T = 230 "C. Horizontal shear, w = 1.27 rad s-', x, = 0.33 mm, S = 1.5 pm. ( a ) Polars crossed, 0 and 90", no shear; (b ) polars crossed, 45" shear at maximum i, w = 1.27 rad s-'; ( c ) polars crossed, 0 and 90", shear at maximum i, w = 1.27 rad s-' ; ( d ) polars crossed, 45", shear at maximum E, w = 10 rad s-'.
Plate 9. Polymer Al : horizontal field of view 350 pm, T = 235 "C, 6 = 5 pm. ( a ) Polarizer only during shear, w = 1.27 rad s-', xo = 0.33 mm; ( b ) polarizer only, 10 s after cessation of flow; ( c ) polarizer only, 20 s after cessation of flow; ( d ) polarizer only, 30 s after cessation
of flow; ( e ) polarizer only, 60 s after cessation of flow.
Plate 10. Polymer A5: horizontal field of view 350 pm, T = 240 "C, S = 3.7 pm. Horizontal shear w = 1.27 rad s-', xo = 0.33 mm. ( a ) Crossed polars, no shear; ( b ) crossed polars, 45" shear at maximum i ; ( c ) crossed polars, 0 and 90" shear at maximum i ; ( d ) crossed polars,
45" shear at maximum amplitude.
Plate 11. Polymer A5: horizontal field of view 350 pm, T = 220 "C, S = 15 pm. Striated texture observed after cessation of flow.
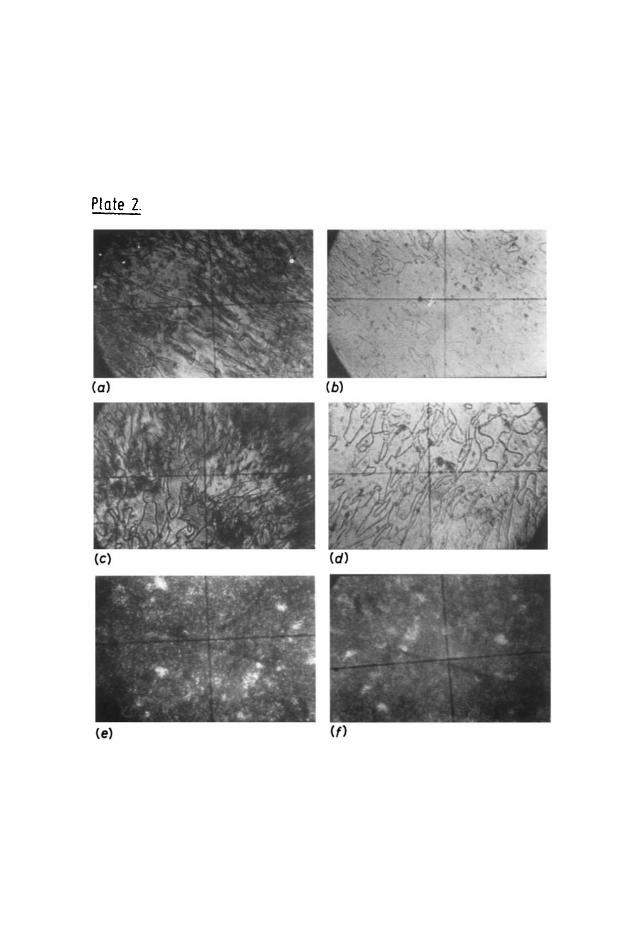
Plate 2 -*

Plate 3. Plate I;.
Plate 5. Plate 8.
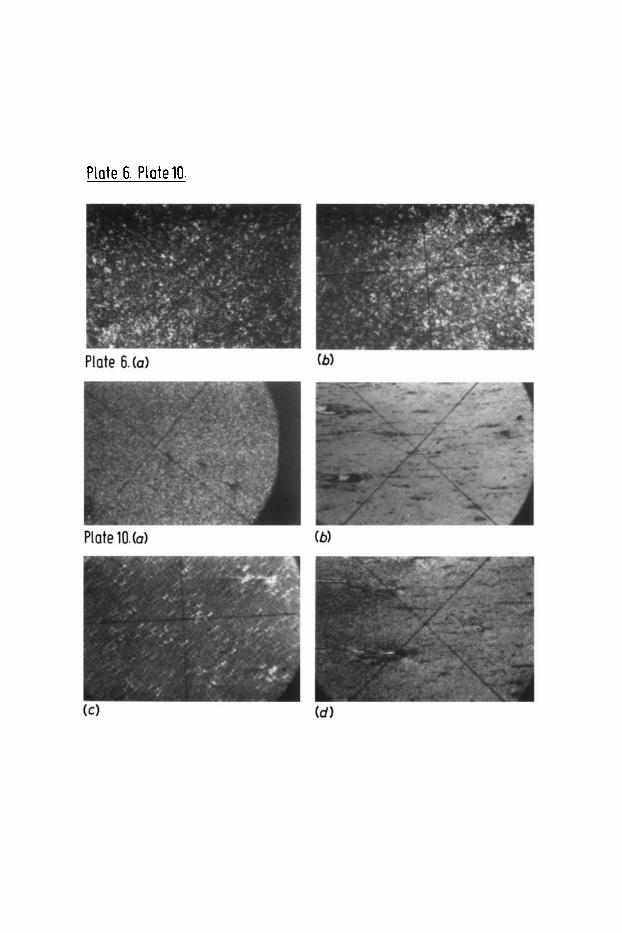
Plate 6. Platelo.
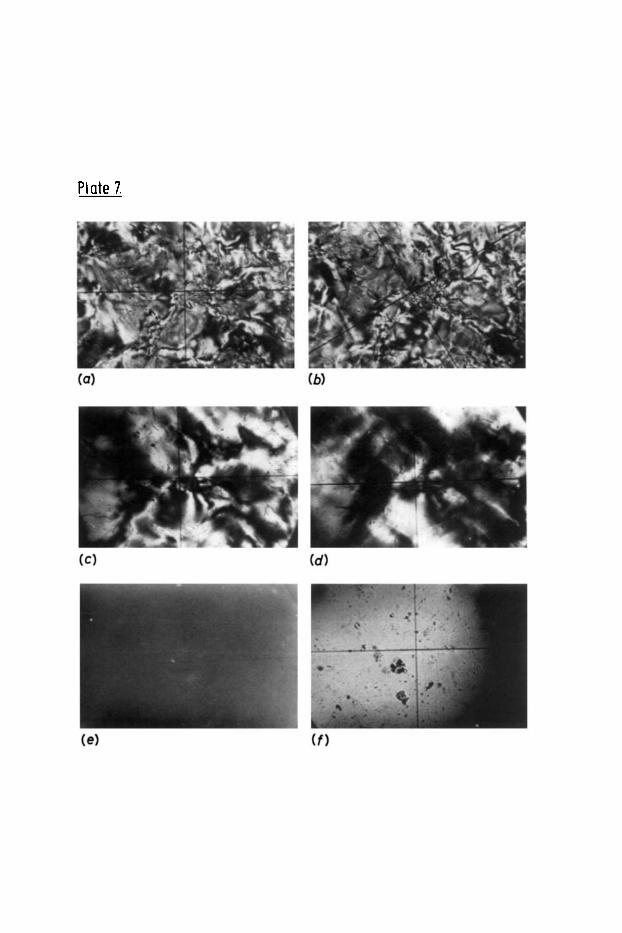
Plate 7.
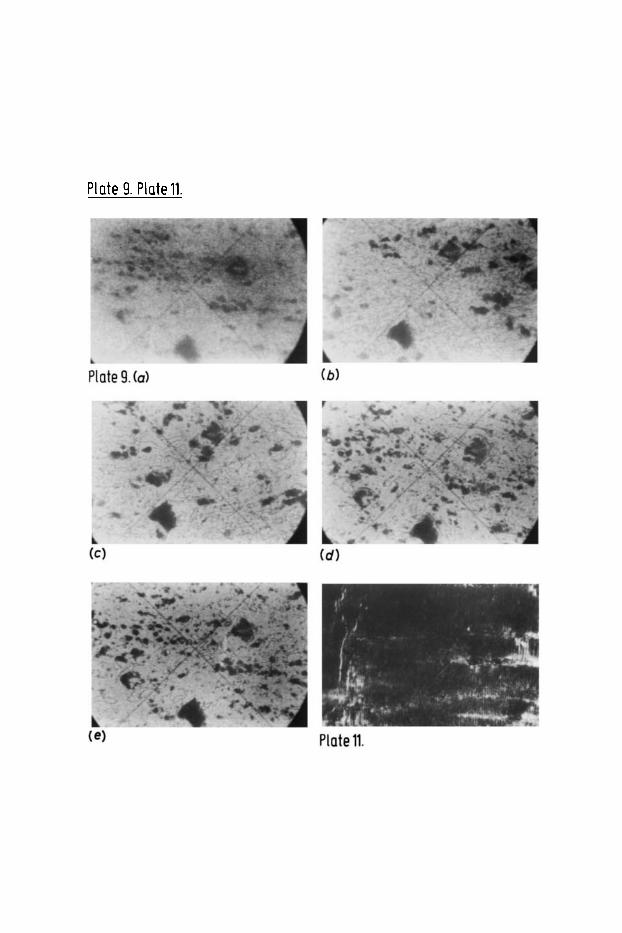
Plate 9. Platell.

Plate 12. Scanning electron micrograph of fracture surface for polymer A5, extruded from a 1 mm die: ( a ) free-fall fibre of 1 mm diameter and ( b ) drawn-down fibre of 0.3 mm diameter.