optimization and ultimate limitations for …...optimization and ultimate limitations for...
TRANSCRIPT

Optimization and Ultimate Limitations for Immunoassay
and Clinical Diagnostics
by
Christine F. Woolley
A Dissertation Presented in Partial Fulfillment
of the Requirements for the Degree
Doctor of Philosophy
Approved July 2015 by the
Graduate Supervisory Committee:
Mark Hayes, Chair
Joshua LaBaer
Alexandra Ros
ARIZONA STATE UNIVERSITY
August 2015

i
ABSTRACT
Biological fluids, in particular blood plasma, provide a vital source of information
on the state of human health. While specific detection of biomarker species can aid in
disease diagnostics, the complexity of plasma makes analysis challenging. Despite the
challenge of complex sample analysis, biomarker quantification has become a primary
interest in biomedical analysis. Due to the extremely specific interaction between
antibody and analyte, immunoassays are attractive for the analysis of these samples and
have gained popularity since their initial introduction several decades ago. Current
limitations to diagnostics through blood testing include long incubation times,
interference from non-specific binding, and the requirement for specialized
instrumentation and personnel. Optimizing the features of immunoassay for diagnostic
testing and biomarker quantification would enable early and accurate detection of disease
and afford rapid intervention, potentially improving patient outcomes. Improving the
limit of quantitation for immunoassay has been the primary goal of many diverse
experimental platforms. While the ability to accurately quantify low abundance species in
a complex biological sample is of the utmost importance in diagnostic testing, models
illustrating experimental limitations have relied on mathematical fittings, which cannot
be directly related to finite analytical limits or fundamental relationships. By creating
models based on the law of mass action, it is demonstrated that fundamental limitations
are imposed by molecular shot noise, creating a finite statistical limitation to quantitative
abilities. Regardless of sample volume, 131 molecules are necessary for quantitation to
take place with acceptable levels of uncertainty. Understanding the fundamental
limitations of the technique can aid in the design of immunoassay platforms, and assess

ii
progress toward the development of optimal diagnostic testing. A sandwich-type
immunoassay was developed and tested on three separate human protein targets:
myoglobin, heart-type fatty acid binding protein, and cardiac troponin I, achieving
superior limits of quantitation approaching ultimate limitations. Furthermore, this
approach is compatible with upstream sample separation methods, enabling the isolation
of target molecules from a complex biological sample. Isolation of target species prior to
analysis allows for the multiplex detection of biomarker panels in a microscale device,
making the full optimization of immunoassay techniques possible for clinical diagnostics.

iii
DEDICATION
For Tyler, you know why

iv
ACKNOWLEDGMENTS
First I must thank my advisor, Dr. Mark Hayes, for the guidance and support that
have helped me through these years of scientific development. Thank you to my
committee members, Drs. Joshua LaBaer and Alexandra Ros for your time commitment
and the contributions that have helped to improve the quality of my work.
I would also like to thank all of the Hayes lab group members, without whom I
could not have made it through graduate school as successfully. A special thanks to Fanyi
Zhu for all of your help in device fabrication and collaboration in experiments. Thank
you to Jie Ding for entertaining conversations and assistance in the lab. Thanks to Claire
Crowther and Ryan Yanashima for their expertise in microscale device design, and to all
of the others who have helped along the way.
On a more personal level I would like to thank my husband, Tyler. Thank you for
your support and encouragement over the years, for never letting me give up, and for
being my best friend. I could not have gotten through these years without you. Thank you
to my mom, for pushing me to reach my academic goals, encouraging my passion for
science from a young age, and always being there for me. Thanks to my dad, for the
support during my years as a student and for cheering me on as I pursued my doctorate.
Thank you to my brother, for offer distraction and support from across the country, to my
grandparents for always believing in me and encouraging my academic pursuits, and to
all the friends and family who have supported me during this journey. I could not have
gotten here without you.

v
TABLE OF CONTENTS
Page
LIST OF TABLES ................................................................................................................... xi
LIST OF FIGURES ............................................................................................................... xii
CHAPTER
1 INTRODUCTION.............................................................................................................1
1.1 Disease, and the Role of Biological Species...............................................1
1.2 Current Disease Diagnostics.........................................................................2
1.3 Analysis of Complex Biological Samples....................................................3
1.4 Advantages and Limitations of Traditional Non-Competitive
Immunoassays..…………………………...……………………………...4
1.5 Miniaturization in Immunoassay………....……..........................……….6
1.6 Parallel Detection in Immunoassay……………..................……....…...11
1.7 Dissertation Objectives…………….……..........................………….....14
1.8 Dissertation Summary..............................................................................14
1.9 References………………………………….................…………….......16
2 EMERGING TECHNOLOGIES FOR BIOMEDICAL ANALYSIS...........................21
2.1 Introduction.................................................................................................21
2.2 Biological Recognition...............................................................................23
2.2.1 Laboratory-Based Bio-recognition Assays................................24
2.2.2 Point-of-Care Assays..................................................................32
2.3 Imaging.......................................................................................................39
2.3.1 Laboratory-based Imaging Techniques......................................39

vi
CHAPTER Page
2.3.2 Point-of-Care and mHealth Platforms........................................44
2.4 Concluding Remarks..................................................................................50
2.5 References..................................................................................................52
3 RECENT DEVELOPMENTS IN EMERGING MICROIMMUNOASSAYS............57
3.1 Introduction................................................................................................57
3.2 Assays Using Micro- or Nanoparticles......................................................59
3.2.1 FMIA...........................................................................................60
3.2.2 Off-chip Preparation of Magnetic Bead-Based Assay...............66
3.2.3 On-chip Assays with Sequential Introduction to
Reagents/Samples.......................................................................72
3.2.4 Other Techniques........................................................................77
3.3 Signal Generation by Flow Conditions......................................................82
3.4 Use of a Static Solid Support to Trap Antigen and Generate Signal.........86
3.5 Concluding Remarks..................................................................................94
3.6 Future Perspectives.....................................................................................96
3.7 References...................................................................................................97
4 OFF-CHIP MAGNETIC MICROBEAD IMMUNOASSAY FOR THE DETECTION
OF MYOGLOBIN, CARDIAC TROPONIN, AND FATTY ACID BINDING
PROTIEN…..…...............…………………............…………………………….102
4.1 Introduction..............................................................................................102
4.2 Experimental............................................................................................104

vii
CHAPTER Page
4.2.1 Myoglobin Detection Antibody Conjugation to
Fluorescein- 5-EX, Succinimidyl Ester…...............................104
4.2.2 cTnI and H-FABP Detection Antibody Conjugation to NHS-
Fluorescein……..................................................................….105
4.2.3 Preparation of Capture Antibody and Particles……......…….105
4.2.4 Sandwich Immunoassays……………….................................106
4.2.5 Data Collection.........................................................................106
4.2.6 Data Analysis............................................................................108
4.3 Results and Discussion............................................................................108
4.3.1 Assay Optimization and Protein Detection..............................108
4.3.2 Quantitation Limit....................................................................110
4.3.3 Assay Evaluation......................................................................117
4.4 Concluding Remarks.............................................................................119
4.5 References.............................................................................................120
5 THEORETICAL LIMITATIONS OF QUANTIFICATON FOR NONCOMPETITIVE
IMMUNOASSAYS .......................................................................................................124
5.1 Introduction...............................................................................................124
5.2 Theory.......................................................................................................127
5.2.1 Fundamental Relationships.......................................................127
5.2.2 Second Equilibrium, Completion of the Sandwich Assay........129
5.2.3 Single Molecule Detection and Fundamental Sources of
Noise.......................................................................................131

viii
CHAPTER Page
5.2.4 Instrumental Background and Noise......................................132
5.2.5 Non-Specific Binding.............................................................132
5.2.6 Molecular Shot Noise.............................................................133
5.3 Results....................................................................................................134
5.4 Discussion..............................................................................................144
5.5 Concluding Remarks..............................................................................148
5.6 References..............................................................................................149
6 IMMUNOASSAY TARGET SAMPLE PREPARATION USING DC GRADIENT
INSULATOR DIELECTROPHORESIS......................................................................153
6.1 Introduction...............................................................................................153
6.2 Materials and Methods..............................................................................156
6.2.1 Microdevice Fabrication...........................................................156
6.2.2 Red Blood Cell and Protein Labeling.......................................157
6.2.3 Experimental..........................................................................157
6.3 Results and Discussion..........................................................................159
6.4 Concluding Remarks..............................................................................165
6.5 References.............................................................................................165
7 ISOLATION OF CARDIAC BIOMARKER PROTEINS USING
ELECTROPHORETIC EXCLUSION..........................................................................168
7.1 Introduction...............................................................................................168
7.2 Materials and Methods..............................................................................170
7.2.1 Microdevice Fabrication.........................................................170

ix
CHAPTER Page
7.2.1.1 PDMS.........................................................................170
7.2.1.2 Electrode Fabrication..................................................171
7.2.2 Protein Labeling and Sample Preparation...............................172
7.2.3 Experimental...........................................................................172
7.3 Results and Discussion...........................................................................174
7.4 Concluding Remarks..............................................................................180
7.5 References..............................................................................................181
8 THE DEVELOPMENT OF A MICROFLUIDIC DEVICE FOR USE IN PARALLEL
IMMUNOASSAY QUANTITATION..............................................................................184
8.1 Introduction...............................................................................................184
8.2 Materials and Methods..............................................................................186
8.2.1 Design and Microdevice Fabrication......................................186
8.2.1.1 PDMS.........................................................................187
8.2.1.2 Electrodes...................................................................188
8.2.2 Materials.................................................................................189
8.2.3 Experimental Setup................................................................190
8.3 Results and Discussion..........................................................................192
8.3.1 Device Design.........................................................................192
8.3.2 Device Fabrication..................................................................193
8.3.3 Operation of the Microfluidic Device.....................................193
8.3.3.1 Detection of Species...................................................193
8.3.3.2 Experimental Design..................................................194

x
CHAPTER Page
8.3.4 Results of cTnI and Myoglobin Separation Experiments.......197
8.3.5 Results of cTnI Quantification Experiments..........................199
8.3.6 Assessment of the Initial Design............................................201
8.3.6.1 Observed Challenges Preventing Optimal
Function......................................................................201
8.3.6.2 Proposed Alterations to Electrode Design..................202
8.3.6.3 Incorporation of Physical Valves................................202
8.3.6.4 Sample Introduction to the Microdevice.....................203
8.4 Concluding Remarks.............................................................................204
8.5 References.............................................................................................204
9 CONCLUDING REMARKS........................................................................................207
9.1 Fundamental Limitations of Quantification for Immunoassay................207
9.2 Current Commercial and Experimental Capabilities for Bioanalysis......207
9.3 Immunoassay Quantitation of Individual Targets.................................208
9.4 Potential for Multiplex Immunoassay Utilizing a Microscale Total
Analysis System.....................................................................................208
9.5 Future Directions..................................................................................209
REFERENCES.....................................................................................................................211
APPENDIX
A PUBLISHED PORTIONS ................................................................235
B SUPPLEMENTAL INFORMATION ..............................................237

xi
LIST OF TABLES
Table Page
2.1 Summary of Laboratoty-Based Biological Recognition Assays ...................... 25
2.2 Experimental Biological Recognition Techniques Used as Point-of-Care
Devices.................................................................................................................33
2.3 Laboratory-Based Imagning Techniques ........................................................... 40
2.4 Summary of Imaging Techniques used as Point-of-Care Devices ................... 45
4.1 Quantitation Limits for Immunoassay Techniques .......................................... 111
5.1 Limitations of Assays Based on the Type of Noise that is Responsible for
Limiting Quantitation........................................................................................135
5.2 The Influence of Antibody Equilibrium Constants on the Limit of
Quantitation .......................................................................................................140
3.1 Summary of the Techniques Described for Emerging Micro-
Immunoassays ...................................................................................................238

xii
LIST OF FIGURES
Figure Page
1.1 Scheme for the Reverse Discplacement Immunoassay.........................................7
1.2 Image of Self-Assembled Magnetic Chains and Intensity Profile Formed
On-Chip.................................................................................................................9
1.3 Schematic Showing Method Utilized for Immunoassay.....................................11
1.4 Schematic Demonstrating the Principles of Electrophoretic Exclusion..............13
2.1 Illustration of the Process for Printing Microarrays............................................28
2.2 Ilustration Showing the Overall Process for Performing a DVD-Based
Assay....................................................................................................................34
2.3 Platform for the Attachment of a Lens-Free Microscopy Application...............47
3.1 Overall Process of a Luminex®
Multiplex Immunoassay...................................62
3.2 Images of Self-Assembled Chains Formed in Immunoassay.............................68
3.3 Scheme for a Reverse Displacement Immunoassay...........................................84
3.4 On-Chip Immunoassay Protocol.........................................................................91
4.1 Images Showing Fluorescence at the Detection Limit.....................................110
4.2 Standard Curves Showing the Fluorescence Intensity Data for the
Sandwich Immunoassay.....................................................................................116
4.3 Standard Curve Showing the Average Fluorescence Intensity Versus
Concentration for Myoglobin..........................................................................117
5.1 Schematic of the Sandwich Immunoassay Format...........................................128
5.2 Log Plot Showing the Concentration of Antigen Bound to Primary
Antibody............................................................................................................129
xiii
Figure Page
5.3 Plots Illustrating the Impact of Error from Molecular Shot Noise on the LOD
and LOQ............................................................................................................138
5.4 Plots Illustrating the LOD and LOQ Defined by Non-Specific
Binding...............................................................................................................142
5.5 Plot Illustrating Limited Amplification or Increased Background Bias and
Variance of the Instrumentation........................................................................144
6.1 Schematic of the iDEP Microchannel Used......................................................158
6.2 Observed Capture of RBCs at Gate 27 in the Presence of H-FABP................159
6.3 Quantitation of Red Blood Cell Capture by Monitoring Fluorescence
Intensity.............................................................................................................161
6.4 Depletion of RBCs at the Exit Reservoir of the Sawtooth Channel.................163
6.5 Fluorescence Measurements and RBC Counts at the Exit Reservoir...............164
7.1 Device Used for Exclusion of Protein with Schematic of Electrode
Design.................................................................................................................174
7.2 Exclusion of cTnI From the Entrance to Exit Channel Two.............................176
7.3 Bar Graph Showing Required Potential for Complete Exclusion of Proteins
from a Channel...................................................................................................177
7.4 Representative Change in Intensity Values for Varying Electric Field
Strengths for cTnI............................................................................................. 179
7.5 Images Showing the Separation Between cTnI and Myoglobin.......................180
8.1 Microdevice for Protein Separation and Quantitation.......................................187

xiv
Figure Page
8.2 Schematic Designs of PDMS Channel and Electrodes.....................................189
8.3 Voltage Divider Connected to the Microdevice................................................191
8.4 Representative Sequence of Applied Potentials Used for Separation...............195
8.5 Graphic Showing the Progression of a Separation Experiment........................196
8.6 Graphic Showing the Progression of a Quantitation Experiment.....................197
8.7 Images Showing the Separation of Myoglobin and cTnI .................................198
8.8 Images Showing the Concentration, Manipulation, and Quantification of
cTnI....................................................................................................................200

1
CHAPTER 1
INTRODUCTION
1.1 Disease, and the Role of Biological Species
It is unlikely that one can ever know the origins of medicine exactly, as the
practice of treating the sick seems as old as mankind. However, the concept of illness
has evolved throughout time, and the foundations of our modern understanding of
disease are easier to trace. Historic cultures throughout the world attributed illness to
witchcraft, demons, hubris, or the will of gods [1-3]. In these cultures a physician
was closely associated with religion and functioned primarily to gather herbs or
perform rites believed able to reverse the misfortune of the sick [1-4].
The foundation of modern medical beliefs can be attributed to the ancient Greeks.
While Greece still maintained one school of thought based on spiritual beliefs, a
second emerged, founded by Hippocrates, stating that treatment should be based on
observations of the condition of the human body [1,2]. The emergence of diagnostics
based on observation lead to a new belief about the origins of disease. The body was
understood to consist of four humors (blood, phlegm, yellow bile and black bile) that
must be in balance to maintain physical health [2,3]. While this medicine was more
grounded in observation than that practiced in earlier cultures, its treatments
functioned only to restore this balance, and disease was primarily attributed to
changes in season, climate, or the habits of an individual [3].
For several centuries the humoral theory of medicine persisted, until the 1880s
with the emergence of Germ Theory developed by Robert Koch and Louis Pasteur
[5-7]. With the evolution to a belief that disease states are produced by molecular

2
entities foreign to the body, or from a physical event occurring internally, technology
has had to evolve to improve the ability to recognize and diagnose disease states. A
clear and direct line could be drawn between the Germ Theory philosophy and the
development modern diagnostic techniques, including histology and the testing of
biological fluids.
1.2 Current Disease Diagnostics
When testing biological fluids, the monitoring of minute changes in disease-
indicating species is needed in order to make effective healthcare decisions and allow
early disease intervention. In many cases, such as that of myocardial infarction (MI)
where early intervention leads to a much better prognosis, the rapid serial monitoring of
target species may be required for the positive identification of a disease state so
appropriate courses of treatment can be administered [8].
Initial clinical evaluations in the diagnosis of MI have a two-fold objective: to assess
the likelihood that observed cardiac symptoms relate to an acute coronary event, and to
determine an individual’s risk of a experiencing subsequent cardiac event [8]. While it is
necessary to consider factors such as a patient’s medical history, visible physical
symptoms, and results of the electrocardiogram (ECG), cardiac biomarkers are also
valuable in achieving the diagnostic objectives.
Optimal sensitivity of blood testing is expected to coincide with the time at which
cardiac protein marker concentrations reach a maximum in the blood, which may occur
several hours after the initial onset of symptoms [8]. However, by utilizing high sensitive
assay approaches and a multimarker strategy for the diagnosis of MI, earlier diagnosis
and intervention may be possible. Early diagnosis would require more rapid and, where

3
necessary, serial monitoring and quantification of specific disease targets. Since blood
testing currently takes place in centralized laboratories requiring several milliliters of
blood and long assay times for quantitative monitoring [9], achieving these goals
compels a change in the way blood samples are treated for testing, shifting away from
single-analyte assay requiring long analysis times to those allowing the simultaneous
quantitation of multiple targets. Truly optimized diagnostic testing should satisfy several
criteria: high sensitivity, low sample volumes, the ability for multiplex quantification,
rapid analysis times, and operational simplicity while maintaining a low cost per analysis
[10]. Rapid testing in the emergency room for the diagnosis of myocardial infarction
should meet the following metrics to be considered truly optimized: sensitivity allowing
quantification of samples below the pM range using fingerprick blood and the ability to
quantify 3 targets simultaneously in under 30 minutes without the requirement for
expensive, complicated or bulky instrumentation.
1.3 Analysis of Complex Biomedical Samples
While there are many approaches to the diagnosis of disease, when analyzing
physical samples they can often be too complex for direct analysis, necessitating the rapid
isolation and analysis of target species. The study of these complex samples is of primary
interest in biomedical analysis where current clinical approaches to diagnosis include
both imaging [11-13] and biological recognition techniques [14-16].
Immunoassays have
gained in popularity since their initial introduction in 1959 [17] and are attractive for the
analysis of complex samples because of the extremely specific interaction between
analyte and antibody. While the applications of immunoassay are highly diverse, ranging

4
from detecting pesticides in soil [18] to the detection of small molecules [19,20], a
primary clinical sample of interest is blood [21-23].
Blood is generally considered to be the most important fluid used for clinical
diagnostics because it is the most reflective of the physiologic condition of the body and
provides a relatively easy source of specific health information [22,23]. Not only does
this include classical plasma proteins, but also proteins present through tissue leakage,
and many immunoglobulin sequences [22]. While the density of information that can be
attained by monitoring the concentration of a biomarker, or set of biomarkers, offers
great diagnostic potential, these species are often present in very low concentrations
while the protein content is dominated by only a handful of species [24]. These species
may interfere with the quantitation of low abundance species, therefore it is necessary to
fractionate samples prior to detection [24,25]. Cross-reactivity can be mitigated to some
extent through the use of highly specific monoclonal antibodies [25]. Among
immunoassay techniques, non-competitive sandwich immunoassays have been generally
recognized to allow the most sensitive detection [26]. This has made them an attractive
option for both commercial and experimental applications geared towards clinical
diagnostics.
1.4 Advantages and Limitations of Traditional Non-Competitive Immunoassays
Non-competitive immunoassays utilize a sandwich-type format and involve the
binding of two antibodies to different target sites [27]. This may be accomplished through
the use of the same polyclonal antibody for both capture and detection, but is frequently
performed with multiple monoclonal antibodies. Compared with competitive
immunoassays, this two-site binding allows for better specificity in the assay.

5
Traditional non-competitive immunoassays have been used experimentally for many
years and are available commercially. These techniques have been successful in
achieving sensitive limits of detection. Duhau et al. describe a sandwich-type
immunoassay utilizing a 96-well microtiter plate for the detection of rat prolactin [28]. In
this work, the detection threshold was found to be 0.5 ng/mL (2.2 pM). However, to
achieve high sensitivity, incubation times of up to five days were used in a total reaction
volume of 150 μL for the quantitation of a single analyte.
Similar immunoassay techniques were used by Boever et al. [29] and by Kratzsch et
al. [30] for the detection of samples from biological fluids. Both methods achieved
detection limits in the pM range. However, analogous to the work performed by Duhau et
al., incubation times were long and sample volumes on the order of 100 μL per target
were required to achieve these results. The long reaction times necessary for these
techniques can be explained in part by their use of a static solid substrate for the
immobilization of capture antibody.
While reactions taking place in solution or on a cell surface are limited by their
equilibrium coefficient, those taking place on static solid surfaces have been
experimentally shown to differ [31,32]. After the initial stage of a reaction at an artificial
surface there is a local decrease in analyte concentration which forces reactants to travel
further to participate in binding events [32,33]. This depletion, along with strong antigen-
antibody interactions and the high capture antibody concentrations used in reagent-
excess assays, produces a diffusion-limited reaction over long incubation times arising
from the distribution of analyte in solution becoming less random as more antigen binds
to the surface-immobilized antibodies in a reaction considered to be practically

6
irreversible [31,34,35]. Since separation of the unbound phase from the solid surface
takes place before quantification, in a diffusion-controlled reaction setting incubation
times must be unrealistically long to produce a quantifiable signal for low-concentration
samples [36].
These drawbacks have led to the development of miniature assays and use of forced
convection during incubations to alleviate diffusion related limitations and help
homogenize the reaction volume near the capture surface [37]. The evolution of the solid
phase from microtiter wells to microparticles as a solid surface has also proven to be
useful in the elimination of diffusion dependence. Microparticles have a very high
surface area relative to a microtiter well and have been demonstrated to achieve solution-
phase performance due to their colloidal nature [27].
1.5 Miniaturization in Immunoassay
Miniaturization in immunoassay has resulted in the development of highly diverse
platforms, ranging from straightforward downscaling of traditional concepts [38,39], to
flow-based techniques [40,41], and those utilizing microparticles as a solid surface [42-
45]. These varied methods have improved upon the limitations noted in traditional
clinical tests in several ways: lowered analysis time [40,43-45], portability [44], and
lowered sample size [40,41,45], while maintaining clinically-relevant limits of detection
[38-45]. Miniaturized immunoassays employing a static solid surface, while useful in
maintaining high levels of sensitivity, continue to suffer from long analysis times on a
microscale [46-48].
To combat long analysis times, alterations in the solid support used for target
immobilization have been explored in several ways. Flow-based techniques are capable

7
of very rapid analysis, ranging from 30 seconds to 10 minutes [40,41]. These rapid assays
have maintained clinically relevant limits of detection (pM range) while utilizing small
sample volumes (0.5 – 20 μL). However, at present these systems are only able to
quantify a single target analyte per assay. In particular, the reverse displacement
immunoassay described by Schiel et al. relies on the use of columns containing
immobilized analog for the specific target being examined [41]. Label displaced by
analyte is eluted from the column past a detector to determine the extent of analyte in a
sample (Figure 1.1). While it is possible to redesign a system using a portable analysis
device, the redesign would present significant challenges before parallel or multiplexed
detection could be possible.

8
Figure 1.1 Scheme for the reverse displacement immunoassay, where (—●) represents
the immobilized drug analog; (shaded □) indicates the labeled monoclonal antibody or
Fab fragments; (○) depicts the drug or target analyte; and (half circle), indicates the
serum protein or binding agent.
An alternative method to flow-based systems is the use of microparticle-based
immunoassays. By incorporating particles as a solid support for immunoassay techniques,
several advantages are realized, including both the ease of surface manipulation during
wash steps as well as the potential for convective mixing to shorten incubation times.
Along with the ability for rapid analyte capture, these techniques are compatible with
traditional detection methods, maintaining sensitive limits of quantitation. Microparticles
9
have been incorporated into assays in a variety of ways, and a subset of this work that is
of particular interest involves the use of magnetic microparticles as the solid support.
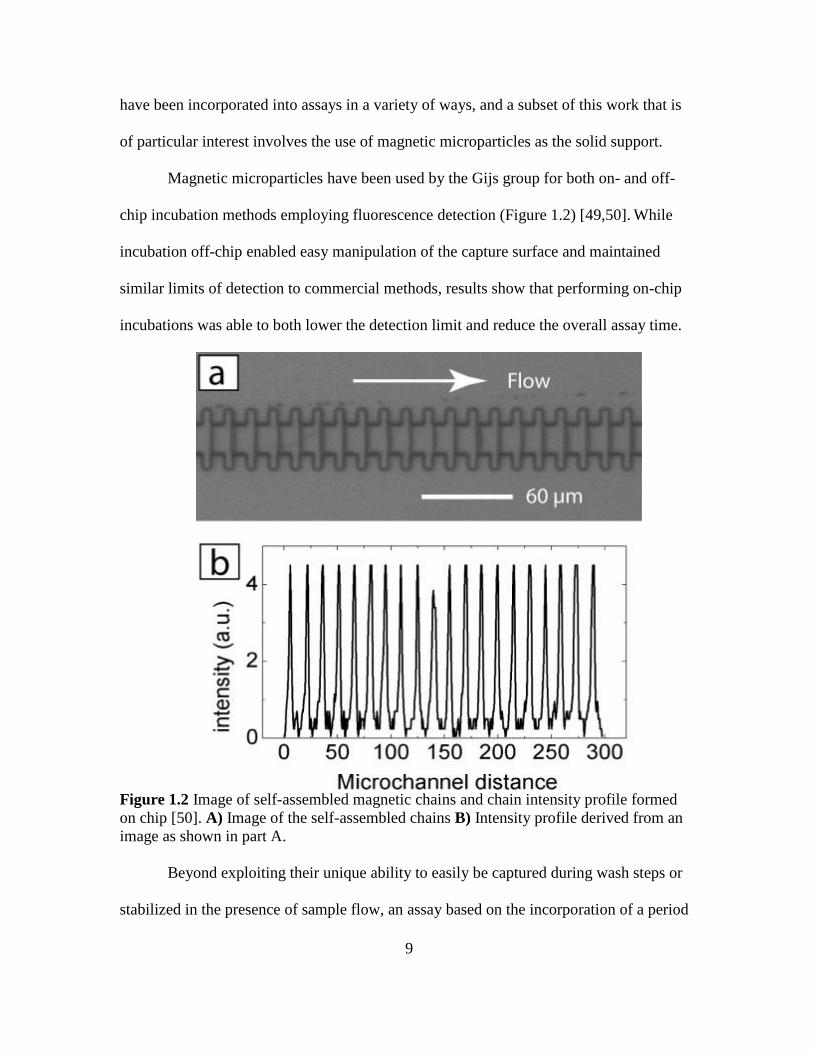
Magnetic microparticles have been used by the Gijs group for both on- and off-
chip incubation methods employing fluorescence detection (Figure 1.2) [49,50]. While
incubation off-chip enabled easy manipulation of the capture surface and maintained
similar limits of detection to commercial methods, results show that performing on-chip
incubations was able to both lower the detection limit and reduce the overall assay time.
Figure 1.2 Image of self-assembled magnetic chains and chain intensity profile formed
on chip [50]. A) Image of the self-assembled chains B) Intensity profile derived from an
image as shown in part A.
Beyond exploiting their unique ability to easily be captured during wash steps or
stabilized in the presence of sample flow, an assay based on the incorporation of a period

10
fluctuation in the applied field was originally developed to improve the detectability of
low concentration samples in the presence of a relatively high background signal (Figure
1.3) [51,52]. In addition to utilizing a magnetic field to improve the ease of wash steps,
incorporating a periodic fluctuation in the magnetic field during data capture enables this
technique to take advantage of coupling signal processing and amplification strategies
that allow greater signal power to be extracted from the data [53]. The advantage of
extracting a greater signal power from collected video is that it enables improved limits
of quantitation for the technique and enables sensitive detection from a small original
sample volume.
A methodical optimization of data collection and processing was employed to
achieve extremely sensitive quantitation and directly address many of the metrics of an
optimized immunoassay stated above. Changes to both optics and acquisition settings
allowed improvements to the signal-to-noise ratio (S/N), while data analysis was altered
to maximize the signal power obtained from each sample. This enabled the extremely
sensitive quantification of cardiac biomarkers myoglobin, cardiac troponin I (cTnI), and
heart-type fatty acid binding protein (H-FABP) while maintaining a simple batch
incubation approach [54]. While these improvements satisfy the sensitivity needs of
clinical assays while utilizing a minimal sample volume, there still exists a need for this
sensitive and selective quantitation ability to be applied to the simultaneous detection of
biomarker panels. Parallel detection is of particular importance because no single marker
has proven to have sufficient diagnostic accuracy for AMI, or a variety of other
conditions in which early detection would improve prognosis [8,55,60].

11
Figure 1.3 Schematic showing method utilized for immunoassay. In the presence of a
magnetic field, self-assembled supraparticle structures form and may be manipulated
through the alteration of the field producing a periodic change in fluorescence intensity.
1.6 Parallel Detection in Immunoassay
There are many potential advantages to the use of a parallel detection immunoassay
system, including increased throughput, simplification of the work performed, reduced
overall cost per analyte, and increased sensitivity for disease detection through use of a
biomarker panel as compared to a single species [27]. Multianalyte testing has been
investigated in two primary ways: through batch incubation with specific antibodies to
different target analytes (e.g. Luminex systems or microarray printing) and differentiation
during detection, and through separation prior to target capture [57-60]. While
multianalyte testing hold the potential to improve diagnostic testing capabilities, it has
not yet commercially replaced the singleplexed analyte testing frequently used both

12
clinically and in point-of-care testing. One of the drawbacks of batch incubation,
particularly when utilizing a complex sample such as plasma, is the potential for cross-
reactivity [24,25].
Reducing or eliminating the potential for cross-reactivity brings about interest in
sample pre-treatment steps to separate components. On a microscale, several options
exist for the treatment of blood prior to target quantification. These range from the use of
physical barriers to filter sample components [61,62], to differentiation through the use of
lateral flow, and the incorporation of electrophoretic separation methods [63-67]. While
there are many potential methods for plasma separation, the use of electrophoretic
exclusion to separate proteins is particularly attractive because it allows samples to be
separated in bulk solution based on their native properties without the need for
differentiation based on binding. Differentiation using this method requires the presence
of three factors: hydrodynamic flow, the presence of an electric field, and species having
an electrophoretic mobility in the buffer conditions used [67]. Electrophoretic exclusion
achieves resolution of species based on differences in their electrophoretic mobilities
(Figure 1.4) [68]. With the assumption that flow and buffer conditions remain constant
during an experiment electric field strengths may be manipulated to separate species.
Exclusion is achieved by maintaining a constant electric field across reservoirs in a
channel or array, and introducing a sharp gradient to the electric field at channels
connecting these reservoirs. When the electrophoretic velocity of an analyte (𝑣𝑎), based
on the relationship:
𝑣𝑎 = 𝜇𝑎𝐸 1.1

13
where μa is the electrophoretic mobility of an analyte and E is the local electric field
strength, is equal and opposite (or greater than) the hydrodynamic flow. Under these
conditions a species is prevented from entering a channel whereas species with a smaller
μa (and therefore smaller 𝑣𝑎 ) will be able to enter and flow through the channel.
Figure 1.4 Schematic demonstrating the principles of electrophoretic exclusion. When no
electric field is applied both samples are allowed to flow through the channel (left), but
when the electric field is applied and electrophoretic velocity of one species is equal and
opposite to (or greater) than hydrodynamic flow it is excluded from the channel while the
analyte with a smaller electrophoretic mobility is still able to enter and flow through the
channel (right).
Creation of a microscale analysis system consisting of one primary separation
channel (consisting of reservoirs connected by microchannels) connected to many
parallel cross-channels with individual compartments for specific target detection makes
electrophoretic exclusion ideal for the separation of complex samples prior to the
simultaneous quantitation by immunoassay of many isolated species since it not only
isolates species, but serves to concentrate individual targets prior to detection. Because
separation of components based on other native physical properties takes place prior to

14
identification based on a binding interaction between the target species and its respective
antibodies, there is a reduction in potential NSB from competing species as the sample
has been greatly simplified compared to batch incubation approaches. This allows the
simultaneous quantitation of species that is theoretically limited only by the size of the
analysis system and number of individual compartments as opposed to increasing
uncertainty as additional analytes are quantified using batch incubation methods.
1.7 Dissertation Objectives
This dissertation is dedicated to describing the optimization of an immunoassay
platform for disease diagnostics and its incorporation into a microscale analysis system
envisioned as an accurate, rapid tool for plasma analysis. The novel non-competitive
immunoassay platform was initially used to quantify myoglobin concentrations to a limit
of 50 pM using a benchtop incubation format and lock-in amplification [52]. However,
the bulk of the work presented herein discusses the optimization of data collection and
signal processing to achieve superior detection sensitivities for myoglobin, cTnI and H-
FABP. A discussion of its applicability as a quantification scheme incorporated into a
microscale total analysis system and the limitations of immunoassay quantification are
also addressed, focusing on the importance of developing a fully-optimized platform for
clinical immunoassay applications.
1.8 Dissertation Summary
To first introduce the field of biomedical analysis, analyte detection carried out both
in laboratory settings and utilizing point-of-care devices a review of novel techniques is
included as Chapter 2. This chapter covers detection platforms utilizing both imaging and
biological recognition and evaluates the capacity of techniques to be used both in clinical

15
and remote disease diagnostics and monitoring. Articles that are reviewed in this chapter
are from January 2010 to January 2014.
To further explore emerging microimmunoassay techniques, a critical evaluation
based on their ability to achieve the capabilities of a fully optimized quantification
platform is included as Chapter 3. This chapter covers diverse immunoassay platforms
including the use of microparticles as an assay surface, flow-based techniques, and the
incorporation of a static solid support. Articles that are reviewed in this chapter are from
January 2008 to April 2012.
Chapters 4 – 7 present experiments using a novel immunoassay platform and
evaluating its utility for incorporation into a microscale total analysis system (μTAS).
Chapter 4 presents individual detection and quantification utilizing benchtop sample
preparation for three target species: myoglobin, cTnI, and H-FABP. Chapter 5 develops
the theory for the limitations of quantitation possible for a non-competitive immunoassay
and includes a brief analysis of the results obtained from individual targets. Chapter 6
demonstrates the ability of insulator-based dielectrophoresiss (i-DEP) to act as an initial
sample preparation step for the evaluation of whole blood samples on a microscale.
Chapter 7 evaluates the capability a current microdevice to manipulate and separate the
target species using electrophoretic exclusion. A discussion for adaptation of the assay to
a more complete microscale analysis system is also included. Chapter 8 details the
development of a prototype total analysis system and includes the preliminary results
achieved as well as a discussion of modifications that could improve its ability to process
a whole blood sample completely on-chip.

16
1.9 References
[1] Zuskin, E., Lipozencic, J., Pucarin-Cvetkovic, J., Mustajbegovic, J.,
Schachter, N., Mucic-Pucic, B., Neralic-Meniga, I., Acta Dermatovenerol
Croat, 2008, 16, 149-157.
[2] Vecchio, I., Tornali, C., Rampello, L., Rigo, G.S., Rampello, L., Migliore,
M., Castellino, P., Malta, R., Armocida, G., Acta Medica Mediterranea,
2013, 29, 363-367.
[3] Papavramidou, N., Fee, E., Christopoulou-Aletra, H., J. Gastrointest. Surg.,
2007, 11, 1728-1731.
[4] Loukas, M., Tubbs, R.S., Louis Jr., R.G., Pinyard, J., Vaid, S., Curry, B.,
International Journal of Cardiology, 2007, 120, 145-149.
[5] Berche, P., Clinical Microbiology and Infection, 2012, 18, 1-6.
[6] Koch, R., Investigations into the Etiology of Traumatic Infective Diseases
(The Relations of Micro-Organisms to Traumatic Infective Diseases), 1880,
19-39.
[7] Beale, L.S., Disease Germs: Their Supposed Nature, an Original
Investigation, with Critical Remarks (Disease Germs), 1870, 1-13.
[8] Morrow, D. A., Cannon, C. P., Jesse, R. L., Newby, L. K., Ravkilde, J.,
Storrow, A. B., Wu, A. H. B., Christenson, R.H., Clinical Chemistry, 2007,
53, 552-574.
[9] Dimov, I.K., Basabe-Desmonts, L., Garcia-Cordero, J.L., Ross, B.M., Ricco,
A.J., and Lee, L.P., Lab on a Chip, 2011, 11, 845-850.
[10] Woolley, C. F., Hayes, M. A., Bioanalysis, 2013, 5, 245-264.
[11] Cheung, K.T., Trevisan, J., Kelly, J.G., Ashton, K.M., Stringfellow, H.F.,
Taylor, S.E., Singh, M.N., Martin-Hirsch, P.L., Martin, F.L., Analyst, 2011,
136, 2047-2055.
[12] Policar, C., Birgitta Waern, J., Plamont, M.A., Clede, S., Mayet, C., Prazeres,
R., Ortega, J.M., Vessieres, A., Dazzi, A., Angew. Chem. Int. Ed., 2011, 50,
860-864.

17
[13] Huth, F., Schnell, M., Wittborn, J., Ocelic, N., Hillenbrand, R., Nature
Materials, 2011, 10, 352-356.
[14] Song, S. Y., Han, Y. D., Kim, K., Yang, S. S., and Yoon, H. C., Biosensors
and Bioelectronics, 2011, 26, 3818-3824.
[15] Garcia-Valdecasas, S., Ruiz-Alvarez, M.J., Garcia De Tena, J., De Pablo, R.,
Huerta, M. Barrionuevo, I., Coca, C., Arribas, I., Acta Cardiol, 2011, 66,
315-321.
[16] Liao, J., Chan, C.P., Cheung, Y., Lu, J., Luo, Y., Cautherley, G.W.H., Glatz,
J.F.C., Renneberg, R., International Journal of Cardiology, 2008, 133, 420-
423.
[17] Berson, S. A., Yalow, R. S., Nature, 1959, 184, 1648-1649.
[18] Long, F., Zhu, A., Shi, H., Sheng, J., Zhao, Z., Chemosphere, 2015, 120,
615-620.
[19] Allinson, J. L., Bioanalysis, 2011, 3, 2803-2816.
[20] Verch, T., Bakhtiar, R., Bioanalysis, 2012, 4, 177-188.
[21] Bellei, E., Bergamini, S., E. Monari, S., Fantoni, L.I., Cuoghi, A., Amino
Acids, 2011, 40, 145-156.
[22] Anderson, N.L., Anderson, N.G., Molecular and Cellular Proteomics, 2002,
1.11, 845-867.
[23] Fan, R., Vermesh, O., Srivastava, A., Yen, B.K.H., Qin, L., Ahmad, H.,
Kwong, G.A., Liu, C.C., Gould, J., Hood, L., Heath, J.R., Nature
Biotechnology, 2008, 26, 1373-1378.
[24] Tirumalai, R.S., Chan, K.C., Prieto, D.A., Issaq, H.J., Conrads, T.P., and
Veenstra, T.D., Molecular and Cellular Proteomics, 2006, 2.10, 1096-1103.
[25] Mitchell, P., Nature Biotechnology, 2010, 28, 665-670.
[26] Ohmura, N., Lackie, S. J, Saiki, H., Anal. Chem. 2001, 73, 3392-3399.
[27] Diamandis, E. P., Christopoulos, T. K., Immunoassay (Theory of
Immunoassays CH 3, Interfaces in Immunoassays CH 7), 1996, 25-187.
[28] Duhau, L., Grassi, J., Grouselle, D., Enjalbert, A., Grognet, J. M., Journal of
Immunoassay, 1991, 12, 233-250.

18
[29] Boever, J. D., Kohen, F., Bouve, J., Leyseele, D., Vandekerckhove, D.,
Clinical Chemistry, 1990, 36, 2036-2041.
[30] Kratzsch, J., Ackermann, W., Keilacker, H., Besch, W., Keller, E.,
Experimental and Clinical Endocrinology and Diabetes, 1990, 95, 229-236.
[31] Werthen, M., Nygren, H., Journal of Immunological Methods 1988, 115, 71-
78.
[32] Stenberg, M., Nygren, H., Journal of Immunological Methods 1988, 113, 3-
15.
[33] Stenberg, M., Stiblert, L., Nygren, H., J. theor. Biol. 1986, 120, 129-140.
[34] Nygren, H., Werthen, M., Stenberg, M., Journal of Immunological Methods
1987, 101, 63-71.
[35] Nygren, H., Stenberg, M., Immunology 1989, 66, 321-327.
[36] Ekins, R., Kelso, D., Clin. Chem. 2011, 57, 372-375.
[37] Ishikawa, E., Hashida, S., Kohno, T., Hirota, K., Clinica Chimica Acta 1990,
194, 51-72.
[38] Tian, J., Zhou, L., Zhao, Y., Wang, Y., Peng, Y., Hong, X., Zhao, S., J
Fluoresc, 2012.
[39] Lee, G. Y., Choi, Y. H., Chung, H. W., Ko, H., Cho, S., Pyun, J. C.,
Biosensors and Bioelectronics, 2013, 40, 227-232.
[40] Casolari, S., Roda, B., Mirasoli, M., Zangheri, M., Patrono, D., Reschiglian,
P., Roda, A., Analyst, 2013, 138, 211-219.
[41] Schiel, J. E., Tong, Z., Sakulthaew, C., Hage, D. S., Analytical Chemistry,
2011, 83, 9384-9390.
[42] Fu, X., Meng, M., Zhang, Y., Yin, Y., Zhang, X., Xi, R., Analytica Chimica
Acta, 2012, 722, 114-118.
[43] Sakamaki, N., Ohiro, Y., Ito, M., Makinodan, M., Ohta, T., Suzuki, W.,
Takayasu, S., Tsuge, H., Clinical and Vaccine Immunology, 2012, 19, 1949-
1954.
[44] Lee, W.B., Chen, Y.H., Lin, H.I., Shiesh, S.C., Lee, G.B., Sensors and
Actuators B: Chemical, 2011, 157, 710-721.

19
[45] Song, S. Y., Han, Y. D., Kim, K., Yang, S. S., Yoon, H. C., Biosensors and
Bioelectronics, 2011, 26, 3818-3824.
[46] Lee, S., Kang, S.H., Talanta, 2012, 99, 1030-1034.
[47] Sloan, J. H., Siegel, R. W., Ivanova-Cox, Y. T., Watson, D. E., Deeg, M. A.,
Konrad, R. J., Clinical Biochemistry, 2012, 45, 1640-1644.
[48] Vashist, S. K., Biosensors and Bioelectronics, 2013, 4, 297-302.
[49] Lacharme, F., Vandevyver, C., Gijs, M. A. M., Microfluid Nanofluidics,
2009, 7, 479-487.
[50] Lacharme, F., Vandevyver, C., Gijs, M. A. M., Analytical Chemistry, 2008,
80, 2905-2910.
[51] Petkus, M. M., McLauchlin, M., Vuppu, A. K., Rios, L., Garcia, A. A.,
Hayes, M. A., Analytical Chemistry, 2006, 78, 1405-1411.
[52] Hayes, M. A., Petkus, M. M., Garcia, A. A., Taylor, T., Mahanti, P., Analyst,
2008, 134, 533-541.
[53] Mahanti, P., Taylor, T., Hayes, M. A., Cochran, D., Petkus, M. M., Analyst,
2011, 136, 365-373.
[54] Woolley, C.F., Hayes, M.A., Anal. Methods., submitted.
[55] Macdonald, S.P.J., Nagree, Y., Fatovich, D.M., Phillips, M., Brown, S.G.A.,
Emergency Medicine Journal, 2012, 30, 149-154.
[56] Molin, S.Da., Cappellini, F., Falbo, R., Signorini, S., Brambilla, P., Clinical
Biochemistry, 2014, 47, 247-249.
[57] Jayadev, C., Rout, R., Price, A., Hulley, P., Mahoney, D., Journal of
Immunological Methods, 2012, 386, 22-30.
[58] Pereira, A. T., Novo, P., Prazeres, D. M. F., Chu, V., Conde, J. P.,
Biomicrofluidics, 2011, 5, 014102-1-014102-13.
[59] Granger, J.H., Granger, M.C., Firpo, M.A., Mulvihill, S.J., Porter, M.D.,
Analyst, 2013, 138, 410-416.
[60] Proczek, G., Gassner, A. L., Busnel, J. M., Girault, H. H. , Anal. Bioanal.
Chem. 2012, 402, 2645-2653.

20
[61] Camerini, S., Polci, M. L., Liotta, L. A., Petricoin, E. F., Zhou, W.,
Proteomics Clin. Appl., 2007, 1, 176-184.
[62] Joglekar, M., Roggers, R. A., Zhao, Y., Trewyn, B. G., RSC Advances, 2013,
3, 2454-2461.
[63] Wang, X., Masschelein, E., Hespel, P., Adams, E., Schepdael, A. V.,
Electrophoresis, 2012, 33, 402-405.
[64] Jubery, T. Z., Hossan, M. R., Bottenus, D. R., Ivory, C. F., Dong, W., Dutta,
P., Biomicrofluidics, 2012, 6, 016503-1-13.
[65] Startsev, M. A., Inglis, D. W., Baker, M. S., Goldys, E. M., Analytical
Chemistry, 2013, 85, 7133-7138.
[66] Inglis, D. W., Goldys, E. M., Calander, N. P., Angew. Chem. Int. Ed., 2011,
50, 7546-7550.
[67] Kenyon, S. M., Weiss, N. G., Hayes, M. A., Electrophoresis, 2012, 33, 1227-
1235.
[68] Kenyon, S. M., Keebaugh, M. W., Hayes, M. A., Electrophoresis, 2014, 35,
2551-2559.

21
CHAPTER 2
EMERGING TECHNOLOGIES FOR BIOMEDICAL ANALYSIS
2.1 Introduction
Early disease diagnosis is vital so that more effective intervention strategies may
be employed. Because early intervention is essential for improving disease prognosis, in
recent years there has been an emphasis on increasing the sensitivity of biomedical
analysis methods [1-6]. Stemming from this quest for superior sensitivity, several new
technologies for biomedical analysis have emerged on both experimental and commercial
platforms. These technologies, in general, take place in one of two formats; biological
recognition or imaging.
The area of biological recognition is focused on specifically and sensitively
quantifying low-abundance species that are indicators of disease pathways. The platforms
are highly diverse, ranging from the immobilization of antibodies on hydrogels1 or
unmodified plastics [7,8], to CD disks for microarray printing [2,9-11], and assays taking
place in the traditional microwell format [3]. While some of these assays focus on
reducing the non-specific binding associated with long incubation times in traditional
assays [3], the primary trends over the last few years have been toward the development
of multiplex assays or rapid point-of-care devices [8,11,12].
Work also continues towards improving traditional imaging methods used in
disease diagnosis. Imaging approaches analyze the information-rich spectra obtained
from tissues to identify characteristic absorptions revealing the underlying chemical
composition of the sample and identifying cellular biomarkers [13]. Using these methods
both labeled and label-free detection methods have been utilized [13-20]. A main

22
contribution in this area has been the improvement of resolution in infrared spectroscopy
(IR) to overcome the usual limitations imposed by diffraction [13-17].
Although methods that can be used for biomedical analysis in a traditional lab
setting continue to be investigated, a primary focus over the last several years has been
the development of mobile health (mHealth) platforms that could be used in telemedicine
applications or resource-poor settings where access to quality healthcare is limited [21-
26]. Mobile health devices have largely been created on one of two platforms: CD discs
that have been used as the solid phase for immunorecognition assays and can be read
using an unmodified CD player [8,27], and those that take place via a smartphone
attachment [9,12,21-23,25,26]. In both cases an emphasis is placed on using simple
fabrication procedures, as well as reusable materials, to keep costs low. There is also an
emphasis on producing user-friendly applications that allow patients to perform tests
independently and upload the results for experts to interpret and determine the best
course of treatment [21-23,26]. Advances in this capacity are vital to rapidly identify and
address emerging public health threats, as well as to treat chronic diseases that require
persistent monitoring [26].
While both imaging techniques and biological recognition assays have been the
subject of recent reviews [28-31], the focus of this review will be the application of those
new techniques to biomedical analysis and the improvement of early disease intervention
published during the time span from January 2010 to January 2014, initiated with
literature keyword searches associated with biomedical analysis as well as their
references and the later citations of found works. Articles were chosen based on their
contribution to new technologies in the area of biomedical analysis and offering

23
improvements both in terms of shorter test duration and higher sensitivity, as well as
improving the mobility of testing platforms to reach resource poor areas. While many
tests were described in the context of identifying a particular molecule or disease pattern,
they could easily be adapted for the testing of many biological species. The topics
addressed are divided into techniques used for biological recognition [Section 2.2] and
those used for imaging analysis [Section 2.3]. These sections are further subdivided into
laboratory or clinic-based testing and platforms intended for point-of-care diagnostics.
2.2 Biological Recognition
Techniques utilizing biological recognition may further be divided into two main
subcategories: (i) biorecognition assays that take place within a laboratory or clinical
setting and (ii) portable microarrays allowing point-of-care diagnostic testing. Some of
the techniques discussed in this section include magnetic bead-based assays, assays
taking place on unmodified plastic substrates (Figure 2.1), and those utilizing a compact
disc (CD) as a solid support. CD-based assays have gained popularity for a variety of
reasons including the ease of fabrication and established detection methods. The use of
computer drives/disc players adapted as a precise optical reading mechanism and
employed as a detection instrument allows the assays to be accomplished at low-cost and
away from specialized laboratories. Users are able to fabricate high-density microarrays
on a CD disc and perform tests for a variety of different targets including DNAzyme
assays, antibody-antigen binding, and microorganisms. The recent expansion of this
technique to Blu-ray technology has allowed a reduction in feature sizes and a subsequent
improvement in assay sensitivity.

24
2.2.1 Laboratory-Based Bio-recognition Assays
Traditional biological recognition assays employing a static solid support
continue to have widespread use both on commercial and experimental platforms
[1,3,7,32-36]. Their high sensitivity, versatility in detection methods, and adaptability for
the quantification of a myriad of targets continue to make their replacement by other
testing platforms a challenge (summary of techniques shown in Table 2.1). While these
methods employ diverse tactics, a primary focus over the last several years has been to
address a common pitfall of these assays: non-specific binding (NSB) and its limitation
of the assays’ potential sensitivity [1,3]. Efforts continue to be made toward increasing
sensitivity and reducing the characteristically long incubations associated with these
techniques so they may eventually be adapted to portable care diagnostics.

25
Technique Applications Sensiti
-vity
Analysis
Time
Fabrication/Equipm
ent Requirements
Reference(s)
Microwell
ELISA
Serum
antibody
immunoassay
s, protein
detection
- 10 min Micro-well plate pre-
incubation procedure,
optical density
detection
3
Microarray
Assays
Protein
detection,
diagnostics
1 pM 3+ hours Protein printing, UV-
exposure crosslinking;
Biodetect 645® read-
out system
1,7
Colorimetric
Detection
Sandwich
bioassays,
DNA and
protein
detection
0.67 -
10 nM
2+ hours UV/ozone activation
of plastic sheet, 1-
ethyl-3-(3’-
dimethylaminopropyl)
-cabodiimide/N-
hydroxy-succinimide
coupling; fluorescent
microscope
8
Rolling circle
amplification
Assay
Low-
abundance
protein
monitoring
38 fM 5+ hours Overnight microplate
preparation;
electrochemical
workstation
37
pH and
metabolic
monitoring of
live cells
Personalized
medicine
applications
50
cells
Real-time
monitorin
g
Chemical
modification of
nanowires;
extracellular pH probe
38
Amperometric
Biosensor
Simultaneous
drug detection
1.2-
5.5 fM
35
minutes
Fabrication of
biosensor probe;
electrochemical
detector
39
Magnetic
Bead
Separation
Assay
Biomolecule
detection
7.1 nM 15 min Soft lithography
fabrication;
hemocytometer and
microscope apparatus
40
Optically
switched
dielectrophore
tic force
Tissue
engineering
- Days Photolithography
using SU-8
photoresist; CCD
equipped microscope
41
Table 2.1 Summary of laboratory-based biological recognition assays.
The reduction in non-specific binding for assays having long incubations was
investigated by Farajollah et al [3]. They describe that the most common problem in

26
microwell assays is the detection antibody binding directly to the solid phase. This can
occur if undiluted serum is applied even when using a well that has been chemically or
biochemically blocked. To minimize the signal arising from NSB while continuing to
provide sufficient signal for the detection of low-abundance species, this work introduces
a pre-incubation procedure. Using this technique, a biotinylated capture reagent is first
incubated with the serum sample and introduced in a secondary step to a streptavidin-
coated well. Detection is enabled with labeled anti-species antibodies. The utility of this
technique was investigated and findings show that NSB is time-dependent and both
serum as well as purified IgG would bind non-specifically to plastic wells. Blocking
provided a slight reduction in NSB, but the blocking agents could be displaced after
lengthy incubations. Utilizing the pre-incubation method, along with rapid capture times
have allowed for improved sensitivities compared with traditional ELISA (enzyme-linked
immunosorbent assay) testing and could potentially help to solve the background noise
issue associated with those tests. However, because pre-incubation takes place prior to
antibody fixation this technique would be difficult to adapt to the parallel detection of
analytes since signals could not be spatially isolated.
The issue of NSB was also addressed by the Ruhe group [1]. In earlier work the
single step production of protein microarrays on unmodified plastic substrates is
presented [7]. Proteins, along with a terpolymer, were printed at high concentration in
surface-attached hydrogels. A single UV-exposure step both covalently immobilizes the
protein and modifies the surface, inducing swelling to a 3D surface and increasing its
binding capacity. The swelling strongly influences the accessibility of the proteins in the
hydrogel. Analyzing this method over a series of analyte standards, it was discovered that

27
analyte capture increases linearly with antibody concentration up to an asymptotic limit
of ~108 antibodies/spot while achieving a signal-to-noise value of more than 200 at a
concentration of 9 x 10⁷ antigens/spot. This technique, through employing more
complicated fabrication procedures than assays achieving detection through use of a
microwell plate, enables parallel detection of analytes due to the pre-printing of capture
proteins prior to analyte incubation and detection. If the fabrication and swelling of the
3D surfaces in the device could be achieved at low cost and with a reasonable shelf life
this technique could transition from use in the lab to a portable device.

28
Figure 2.1. Illustration of the process for printing microarrays with mixed polymer
protein solutions and immobilization through UV-crosslinking both in the macroscopic
(A) and microscopic (B) views.7 Macroscopic view images show (1) a solution is mixed
of buffer and polymer (2) a microarray of the solution is printed onto the provided plastic
slide and (3) the chip is irradiated using UV light to crosslink the polymers and
immobilize them on the surface. On a microscopic level (B) it is observed that (1)
epoxide side groups of the polymer react with primary amino acids, (2) droplets
containing these formed complexes form on the surface, and (3) the UV photoreaction
crosslinks the polymer, attaching it to the surface and immobilizing the proteins in the
network of polymers.
In later work the Ruhe group evaluated assay sensitivity and the extent of NSB
observed using these hydrogels [1]. Compared to traditional methods of preventing NSB
through blocking procedures the hydrogel has an intrinsically weak binding capacity for
proteins. While purified capture antibody is covalently linked to the structure during the
UV-exposure step, NSB is essentially eliminated on these surfaces. This method proved
effective for the quantification of bovine serum albumin (BSA) between 1 and 500 nM. It

29
was detected to a limit of 1 pM using this technique. However, at this level the
concentration dependence of the signal is too low for quantification. While this limitation
is sufficient for the detection of BSA, for adaptation to the detection of other species
more sensitive quantitation to the low pM range would be necessary.
Work has also been done on the development of highly sensitive assays by Zhang
et al. using alpha-fetoprotein (AFP) as a model protein [37]. This was accomplished by
coupling metal surface nanolabels to a silver nanocluster (AgNC)-based rolling circle
amplification strategy. Under optimal assay conditions results show a dynamic range of
0.14 fM – 2.9 nM with a detection limit of 0.11 fM and a limit of quantification found at
38 fM. These levels are able to completely meet the clinical diagnostic requirements for
AFP. However, the long duration of incubations and specialized detection methods
required for the assay prevents its easy adaptation for use outside the clinic.
In an effort to move biochip technology away from labs and hospitals and enable
its use as a point-of-care device, Wen et al. describe the development of a novel plastic
biochip [8]. The work shows its utility for the sensitive colorimetric detection of both
human IgG and DNA. After UV/ozone activation of the plastic substrate probe
biomolecules are covalently attached. Signal reporting units are introduced to complete a
sandwich-style assay and achieve sensitive detection. Using this label-free recognition
system detection limits of 67 pM and 10 nM were achieved for IgG and DNA,
respectively. These limits are dependent on staining time and could be adjusted according
to assay needs, providing an easy and flexible approach to a portable biochip.
Beyond assays employing a static support, several unique laboratory-based
approaches have been developed [38]. Quantitative bioanalysis was accomplished using a

30
sensitive pH sensor by the Patolsky group. This detection method was performed by
evaluating the ratio of electrical signals in ground and excited states to determine the
concentration of target species. The device was applied to the real-time monitoring of
both intra- and extracellular metabolic activity, with sensitivities down to the signal
produced by less than 50 cells, or in the vicinity of single-cell metabolic measurements.
Although the assay is not currently carried out on a mobile platform, its ability to provide
sensitive and rapid monitoring gives this approach potential for the expansion to
detecting specific biological species and its utilization in personalized medicine-oriented
diagnostics. However, since detection is based on ratios of electrical signals,
modifications to allow the parallel detection of biomarker panels represent a significant
hurdle for this technique.
Amperometric biosensors were used in a microfluidic device by Chandra et al. for
the sensitive detection of several anticancer drugs [39]. Sensing was accomplished
through the integration of preconcentration and separation steps prior to detection.
Results show that the detection limit for all four drugs tested was between 1.2 – 5.5 fM
with a linear response over the 2 – 60 pM range. This work represents a rapid and
sensitive microscale total analysis system whose adaptation to the detection of
biomarkers would be beneficial in diagnostics as well as disease monitoring.
Detection on the microscale was also accomplished by Wang et al. who
demonstrated the capture and separation of biomolecules using magnetic beads [40].
Taking place on a microchip consisting of two reservoirs connected by a tapered channel,
assays were performed in one well using the beads as a solid surface and separated for
detection in the second well by an external permanent magnet. Results show the transfer

31
could be accomplished within two minutes and that carryover was less than 0.002%. This
separation was achieved without the use of a pump, giving it potential as a point-of-care
device. While this method allows for rapid detection and in the absence of excess
detection antibody, the current setup only allows for the quantification of one target
molecule at a time. Alterations of the assay to detect markers in parallel would require
drastic changes to the chip design as species would need to be separated prior to capture
and detection to avoid cross reactivity and allow differentiation of signals.
Microbeads were also utilized alongside and optically switched dielectrophoretic
(ODEP) force in bottom-up tissue engineering [41]. Cell-encapsulating alginate
microbeads with three different densities were assembled and manipulated using an
ODEP force-based mechanism. Manipulations allowed for the formation of a sheet-like
cell structure imitating the cell distribution of articular cartilage. Cells encapsulated
remained viable to a rate of 96 ± 2%. This system holds promise for the engineering of
tissue with a tunable cell distribution and may aid in efforts for developing biological
substitutes for the repair of damaged or diseased tissues.
Many commercial methods for bio-recognition assays employing a solid support
are available. These include Whatman’s FAST® slides, Oncyte-Avid slides, and Unisart
slides [6,32-36]. FAST
® slides can be used to perform reverse phase protein arrays,
traditional protein arrays and antibody arrays utilizing less sample than a traditional
ELISA test. They also allow for the parallel quantitation of many samples to a limit of 1
pg/mL [6]. This platform has recently been utilized as a point of reference for new
experimental techniques as well as tested in comparison to other commercially available
slides [32-34]. The ONCYTE® nitrocellulose slides provide a three dimensional
32
microporous film designed in three formulations to diversify its use for higher binding
capacities, low-fluorescence intensity, or both [35]. This diversity allows for the use of
ONCYTE slides in biomarker discovery as well as studies of protein function. The
Unisart membranes are utilized in lateral flow immunoassays (LFIAs) by binding the
antibodies or capture molecules while preserving their reactivity [36]. These membranes
currently enable the analysis of over 60 markers.
2.2.2 Point-of-Care Assays
The compact disc assay is a diagnostic platform that functions without the use of
sophisticated laboratory equipment. Utilizing this technique, a microfluidic device is
created by modifying a CD so that quantitative biological assays can be performed and
detection can take place using a standard (or modified) disc reader or the CD drive in a
personal computer (Figure 2.2, Table 2.2). Typically, CDs are prepared by activating the
polycarbonate surface with UV/ozone treatment followed by the use of a PDMS stamp to
apply surface patterning [2,9,27]. Following CD disc preparation, samples are applied
and allowed to incubate for extended periods of time. Once assays are complete, the disc
is loaded into a CD-drive where the extent and location of errors in disc reading directly
detect and quantify compounds of interest. In addition to their high sensitivity and
relatively simplistic fabrication processes, assays using this platform have become
increasingly popular due to their low-cost and portability. This makes them an attractive
diagnostic option for remote settings as well as use in areas with limited resources.

33
Technique Applications Sensiti
-vity
Analysis
Time
Fabrication/Equip
-ment
Requirements
Reference(s
)
CD disc
bioassay
Lead
detection,
streptavidin
binding, DNA
detection,
antibody-
antigen
detection
10 nM
– 25
nM
45 – 65
min
Soft lithography
fabrications;
unmodified disc
reader/computer
drive and error
analysis software
2, 9, 27
CD disc
micro-
immunoassa
y
Agrochemical
residue
quantification
37 pM
– 0.28
nM
30 min Direct attachment
of binding groups
to disc; silver
enhancement/optica
l disc drive
detection
11
CD disc
microparticl
e counting
Measure
biomolecules/
cells
1 x 10⁶
cells/m
L
2.5
hours
Soft lithography
fabrication;
unmodified disc
drive
10
Blu-ray
microarray
Competitive
microcystin
array
0.4 nM 1 hour Blu-ray disc drive
and Nero Disc
speed software
42
Table 2.2 Experimental biological recognition techniques that can be used as point-of-
care devices for medical diagnostics.

34
Figure 2.2 is an illustration showing the overall process for performing a DVD-based
assay. On the polycarbonate surface of the DVD, activation with oxygen plasma
generates carboxylic acid groups which are covalently attached to amino-modified
oligionucleotide probes. The use of an unmodified disc reader on a laptop allows for the
visualization of spots where binding events occurred and the quantitation of species being
investigated. Reproduced from Reference 11 with permission from The Royal Society of
Chemistry.
In one experimental incarnation of this technique, Wang et al. have demonstrated
the detection of lead at the parts-per-billion (ppb)-level [2]. Lead detection was quantified
using a DNAzyme assay where a DNAzyme strand was hybridized to a substrate strand
and immobilized on CD. In the presence of lead the substrate strand was cleaved
preventing reporter strand binding and reducing CD reading-error rates. The results of
this work demonstrate a direct correlation between lead concentrations and error reading
signals in the range of 10 nM to 1 mM, with a lead detection limit of 10 nM (2 ppb). This
high sensitivity for lead is more than is required for the routine monitoring of its presence
in environmental samples. However, while the disc-based assay is adaptable for other
targets the detection setup reflects the approach used in a competitive assay, where signal
decreases as concentrations of target analyte increase. This method may therefore not

35
prove to be as sensitive as those for non-competitive immunoassay where signal is
directly proportional to sample concentration and could result in an assay with
insufficient sensitivity for other low-abundance species. Additionally, the method
requires long assay times in excess of two hours, which should ideally be reduced for its
application as a point-of-care device.
A similar example of a reading errordetection-based disc assay is demonstrated by
Pallapa et al. in the development of a quantitative biotin-streptavidin binding assay
utilizing IsoBuster software for the more specific detection of erroneous bits in a frame as
opposed to total error number alone [27]. Identifying where errors took place on disc
allows the most direct approach for the modification of a CD to biomedical diagnostics
and allows various data formats to be used. Using the IsoBuster analysis software, the
results depict a clear dependence of reading error on streptavidin concentration. This
allowed for a quantitative assay over the tested range of 5.8 nM – 29 nM with high spatial
accuracy. Detection was accomplished using an unmodified conventional optical drive,
increasing its potential in point-of-care applications. While quantitation was achieved for
the tested samples, to adaptto other targets the dynamic range should be expanded and
fully evaluated, allowing clinically relevant concentrations of various biomarkers to be
detected.
This same approach was used to analyze three trial systems: DNA hybridization,
antibody-antigen binding, and ultrasensitive lead detection [9]. The CD-quality
diagnostic program is used for detection, which allows a relationship to be generated
displaying the reading error on disc as a function of CD playtime. This enables the
specific position of the error on disc to be identified, corresponding to the position of the

36
binding event. The results show that this method is sensitive for all systems tested
achieving a 25 nM detection limit of DNA from a sample volume of 2.0 µL (50 fmol of
DNA), a 0.17 nM detection limit for IgG, and a 10 nM (2 ppb) detection limit for lead.
This platform has been shown to be highly diverse in terms of applicable target molecules
and portable for on-site applications due to its use of an unmodified disc reader for
detection.
Error reading detection was also employed in microparticle and cell counting
[10], providing development of a health diagnostic compact disc (HDCD) aimed at
providing rapid and affordable point-of-care diagnostics. While the detection methods
employed are simplistic and accessible, the device fabrication is more complicated than
that used in similar assays. First, a trench was machined in the polycarbonate surface of
the CD and transparency was restored through wet sanding. A PDMS microfluidic layer
was fabricated via soft lithography, embedded into the CD trench, and bonded to the CD
through an additional PDMS adhesive layer. After sample application, a focused laser
beam reflected on the CD data layer is interfaced by the sample suspension. Because the
sample is placed directly above the CD data layer, the original digital information is
changed through optical interference. The alteration of interaction between the laser and
data layer directly relates to the shape, concentration, and optical density of the sample
being analyzed. Results show a clear trend with increasing error rates as sample
concentration increases. However, incubations of two hours were required between
sample introduction and detection. This represents an obstacle to be overcome in the
development of a truly mobile device, which would benefit from rapid assay times to
increase end user ease of operation.

37
An alternative CD assay approach was presented by Tamarit-Lopez et al [11].
Haptens were attached to the polycarbonate surface of the CD by direct covalent
attachment. Assays were based on an indirect competitive format and utilized silver
enhancement solution to display the immunoreaction. Compared to related methods, this
assay occurs rapidly, lasting about 30 minutes from sample application to detection. The
detection limits for the tested compounds chloropyrifos, atrazine, and 2-(2,4,5-
trichlorophenoxy)propionic acid were found to be 0.1nM, 37 pM and 0.28 nM,
respectively, an order of magnitude better than classical methods. Along with the use of
a conventional optical detector, this illustrates the potential of this assay to be a useful
point-of-care diagnostic tool even though it is demonstrated on non-biological samples.
The disc-based assay platform was expanded by this group through its extension
to the use of the underlying physicality of DVD technology as the solid support [4]. The
disc was activated with oxygen plasma and used to detect the PCR products of
Salmonella spp. through attenuated analog signal detection. Similar to their previous
work the assay time was short, with an 18 minute amplification time to achieve a
detection limit of 2 nM with unmodified DVD drive detection.
A further evolution of this technique is illustrated by the introduction of Blu-ray
technology in the recent work by Arnandis-Chouer et al [42]. The use of Blu-ray discs
presents several advantages over a DVD-based assay: 1) blue laser light is used, so the
range of optical detection is expanded and 2) a higher numerical aperture lens is used for
greater focusing precision allowing for smaller spot sizes and more information to be
stored on disc. As a proof-of-concept experiment Blu-ray discs were compared to DVDs
for the same assay, Blu-ray assays were detected by a drive attached to a personal

38
computer through a USB and analyzed using Biodisk software. Results show the Blu-ray
disc has a 6.2 fold improved detection limit versus DVD assays, achieving levels of 0.4
nM for microcystin LR and 100 and 10
1 cfu/mL for Salmonella typhimurium and
Cronobacter sakazakii respectively. While these assays have achieved clinically relevant
detection limits for the targets investigated, to become a versatile point-of-care device
increased sensitivity should be achieved for the detection of varied proteins.
Several commercial methods utilizing mobile platforms are also available through
IMTEK, GenePOC, and Gyros [43-45]. These products have been utilized extensively for
biomedical analysis investigations. IMTEK is working to develop an automated, user-
friendly platform that can integrate micro, nano, and bio components into a
multifunctional point-of-care device [43]. The core of this lab-on-a-chip device is its foil-
based centrifugal cartridge that can assist in the integration of all operations allowing raw
sample to be injected, purified and analyzed at low cost. Although use of this device has
not been widespread to date, it’s continued investigation and fine-tuning promises to
result in a valuable tool for point-of-care diagnostics and personalized medicine.
The Gyros lab has developed a range of Gyrolab BioaffyTM
CD’s that are used for
nanoliter-scale immunoassays that allowresults to be read in under an hour [44]. This
technique was recently validated for the quantification of rituximab in human serum by
Liu et. Al [46]. Here, the GyrolabTM
technology was tested and results show validation of
the quantification of rituximab between concentrations of0.62 nM – 0.41 µM.. This
platform allows for fully automated assays to take place utilizing small reagent and
sample volumes. While there are limited examples of fully validated Gyrolab assays, this
method holds many advantages that make it an attractive option for point-of-care

39
diagnostics. While it also lacks significant examples of test validation in literature, the
platform developed by GenePOC diagnostics was designed to be user-friendly with only
four steps required for performance [45]. This fully automated system generates results in
less than an hour with minimal hands-on time.
2.3 Imaging
Imaging-based techniques can be similarly divided into subcategories: (i) those
utilizing modified traditional instrumentation and taking place in the laboratory or clinic
and (ii) portable platforms allowing remote diagnostics. Some of the techniques discussed
in this section include modified Fourier-Transform Infrared Spectroscopy (FTIR)
detection, the development of multimodal optical probes, and mHealth monitoring
applications. The mHealth platform and others similar to it have gained interest over the
last several years because they allow for rapid, sensitive and affordable testing to be
accessible in remote settings. It also allows quality healthcare to be possible through
telemedicine in regions where access is limited.
2.3.1 Laboratory-based Imaging Technologies
Infrared (IR) spectroscopy has been used extensively for imaging-based
biomedical analysis. A major focus in this area has been the improvement of FTIR for
high definition imaging [13-20]. Conventional FTIR microscopy has been limited by
trade-offs between signal-to-noise ratios (SNRs) and data acquisition times, as well as
spatial resolution [17,18]. While IR spectroscopy has long been recognized as a
potentially valuable diagnostic tool due to its coverage of regions encompassing
characteristic biomolecule absorptions [13], its utility has been limited by these trade-offs
and the lower size boundary imposed by the diffraction limit for the relatively long

40
wavelengths. New experimental techniques have worked over the past several years to
overcome those limitations so its full diagnostic potential may be realized (Table 2.3).
Technique Applications Resolution Duration Fabrication/
Equipment
Requirements
Reference(s)
ATR-FTIR Endometriosi
s detection
4 cm-1
– 8
cm-1
32-45
scans/sam
ple
ATR-FTIR, Bruker
Vector 22 FTIR
spectrometer,
Thermo Nicolet
Continuum FTIR
microscope
13
Synchrotron
FTIR
Lipid
detection,
label-free
imaging
Diffraction
limited –
0.54 x 0.54
µm2
From < 1
min for
30 x 30
µm
Mid-infrared
beamline IRENI;
multiple synchrotron
beam source and
wide field detection
FTIR
16, 17
Nanoscale
Imaging
FTIR, AFM-
IR
100 – 200
nm
From 10
min for
100 x 100
pixel
image
AFM-IR, novel
FTIR system based
on s-SNOM
15, 19
Phototherma
lly induced
resonance
Organometall
ic conjugate
detection
20 – 50
nm; 10 µM
1 hour AFM and tunable
pulsed laser
20
Multifunctio
nal probes
Detection of
cancer cells,
estrogen
From 10
cells/mL;
25 µM
2 hours –
overnight
TEM, UV-Vis-near
infrared laser;
synchrotron UV
spectromicroscope,
FTIR
47, 48
Table 2.3 Laboratory-based imaging techniques that have been modified to improve
resolution in biomedical analysis applications.
Work by Nasse et al. introduces the use of multiple synchrotron beams into FTIR
[17]. This was able to extend the IR abilities to truly diffraction-limited imaging over the
whole mid-infrared spectrum by combining the multiple beams with wide-field detection.
This approach was based on the strategy of wide-field imaging with the use of
multichannel focal plane array detectors. Results show the successful measurement of ~1

41
µm polystyrene beads to a limit of 6 ± 1 fmol in a single pixel (0.54 µm2). In addition to
vast improvement in acquisition time (30 minutes to scan a 280 µm x 310 µm area
compared to over 11 days using diffraction-limited resolution raster-scanning), this
modification to IR holds great promise as a diagnostic imaging technique.
Synchrotron FTIR (sFTIR) was further used to examine lipids in and around
amyloid plaques associated with Alzheimer’s disease [16]. The primary motivation was
to test for elevated lipid presence near recently formed plaques using sFTIR in
transmission mode. To archive acceptable SNR ratios, between 64 and 256 scans were
co-added. From this analysis a lipid membrane-like signature was found in and around
dense core plaques in both advanced and early stage plaque. While analysis suggests that
lipid is a common feature of the plaque structure, there are several potential explanations
for its origin, which remains unknown.
In addition to the analysis of Alzheimer’s disease-related tissue FTIR was
recently used by Cheung et al. to discriminate spectral signatures of endometriosis [13].
In this work, both transmission FTIR and attenuated total reflection Fourier-transform IR
(ATR-FTIR) were coupled with subsequent computational analysis in an attempt to
discern endometrial tissue-specific biochemical-cell fingerprints. Through detailed
spectral analysis biochemical differences were identified between healthy tissue and
tissue with endometriosis present. While spectral signatures have been observed, this
technique requires highly specialized analysis which may limit its utility as a widespread
clinical diagnostic tool.
Beyond diffraction-limited resolution lies an interest in the application of FTIR to
nanoimaging [15]. As recently discussed by Huth et al., an approach has been developed

42
based on the superfocusing of thermal radiation with an infrared antenna, detection of the
scattered light and signal enhancement using an asymmetric FTIR spectrometer. A
semiconductor device was used as the sample and imaging was accomplished within a
few minutes. Results show that 10 nm spatial resolution can be achieved. For even more
rapid applications spectra with 25 cm-1
resolution and an SNR of 10:1 were captured in
only 2 minutes. While demonstrated here for the mapping of a semiconductor, imaging of
this resolution could become a powerful tool for chemical/biochemical sample analysis.
However, as with many imaging techniques, results must be interpreted by an expert
adding to overall analysis time. Additionally, the use of highly specialized lab equipment
prevents adaptation of this method to a point-of-care device.
Pita et al. also demonstrated simulations aimed at improving the spatial resolution
of IR techniques [14]. Results of these simulations suggest that the difference in
transmitted and reflected IR energy between a Gaussian reference and a vortex-shaped
beam using a confocal microscope could be mapped. This would result in vibrational
absorption images with a spatial resolution better than λ/10. This resolution would enable
detection sensitivities great enough for the imaging of organic nanoparticles and would
indicate great improvement over classical IR for diagnostic imaging.
In related work toward nanoscale IR spectroscopy, Marcott et al. have coupled an
atomic force microscope (AFM) and a tunable IR laser source [19]. Using samples of
stratum corneum (SC), results show a spatial resolution of ~200 nm. This technique
enables the SC to be spectroscopically characterized in more detail than ever before.
These studies may prove useful in diagnostic testing as they are enabling use of this
technique for the understanding of penetration pathways for topically applied drugs.

43
However, data capture requires sophisticated laboratory equipment and data
interpretation is performed by specialized personnel limiting its capability for widespread
use in diagnostics or disease monitoring.
Another technique for the coupling of AFM to IR to improve near-field resolution
is described by Policar et al [20]. It focusses on the development of photothermally
induced resonance (PTIR), where AFM is coupled with a tunable pulsed IR laser. IR is
attractive for bioimaging because IR probes are stable in biological environments, they
are small, and have intense absorption in the 1800-2200 cm-1
region where biological
samples are transparent. Using PTIR the spatial resolution is improved to 20-50 nm,
which is sensitive enough for subcellular mapping. This was demonstrated using an
organometallic conjugate whose uptake by breast cancer cells could be monitored. While
not currently used in diagnostic biomedical analysis, imaging at this sensitive level
illustrates a powerful improvement to traditional IR imaging and could provide valuable
diagnostic data in a sophisticated laboratory setting.
Recent work by Guo et al. describes the development of an optical probe used for
cancer cell detection [47]. Localized surface plasmon resonance (LSPR) absorption, as
well as the fluorescence properties of folic acid-conjugated gold nanorods (F-GNRs)
were used as detection systems for the multifunctional probe. The absorption capabilities
were explored through the quantification of human cervical carcinoma (HeLa) cells
versus African green monkey (Vero) control cells. Results indicate a detection limit using
fluorescence detection of 70 cells/mL for HeLa cells with a quantitative range covering
100 – 5000 cells/mL. Using the absorption mode, the probe reduced the detection limit to
10 cells/mL while maintaining the quantitative range for the technique. While this

44
technique achieves low detection limits for whole cells, the same approach could not be
used for the detection of proteins without alteration of the assay procedures prior to
detection. Additionally, major adjustments would need to be made to the assay platform
in order to achieve parallel target detection.
Another unique multimodal probe was investigated by Clède et al [48]. This
probe, called SCoMPI (single core multimodal probe for imaging), was used for the
detection of two breast cancer cell lines. Resolution at the subcellular level was achieved,
allowing information about the location of the metal conjugated probe within the cell.
This capability allows reliable information to be gathered using many imaging
techniques. The diverse and sensitive, rapid imaging platform may prove to be a valuable
tool for the biomedical analysis of tissues used in diagnostics.
Experimental adaptations to traditional imaging equipment have also been
pursued by Neaspec [49]. The NeaSNOM microscope utilized a new technology allowing
imaging in the visible, infrared and terahertz spectral regions to a spatial resolution of 10
nm. This technology has been utilized to map insulin fibrils [50] , as well as determine
the local dielectric permittivity of a PMMA film [51], among other applications. With a
scan speed of up to 20 µm/s and capability for the analysis of sample up to 40 x 50 x 15
mm, this technique offers a desirable balance of sensitivity and speed for the imaging of
biological tissues.
2.3.2 Point-of-Care and mHealth Platforms
While improvements to traditional imaging techniques have garnered attention
over the past several years, mHealth imaging efforts are growing just as quickly (Table
2.4). This technique takes place with a variety of imaging detection formats attached to

45
the camera lens of a smartphone. By using the camera to capture data, results can be sent
to a central hub in a clinic or hospital so care providers can make treatment decisions
without patients having to commute from remote locations. This is also valuable for
monitoring health in resource-poor settings where access to healthcare is limited and
telemedicine is the only real viable option.
Technique Applications Resolution Duration Fabrication/
Equipment
Requirements
Reference(s)
mHealth Fluorescein
detection
1 – 10 nM 10 – 15 sec
data
capture
(~85 min
sample
prep)
Capillary array,
fluorescence
detector, multiple
wavelength LED,
computational
image stacking
program
12, 25
Cell-phone
microscope
Detection of
micro-
particles, red
blood cells,
white blood
cells,
parasites
~1 – 2 µm 5 minutes Specially
designed
microscope
attachment
21
Fluorescent
imaging
cytometry
on
cellphone
White blood
cell density
measurement
2 µm
resolution
6 minutes Specialized
optofluidic
cellphone
attachment
23
Label-free
smartphone
biosensor
Protein
detection
4.25 nM 20 minutes Photonic crystal
biosensor,
application for
automated data
interpretation
24
Rapid
diagnostic
test reader
on
cellphone
Immune-
chromatograp
hic assays
4x dilution
of whole
blood
< 1 minute,
(0.2
seconds
per image)
Specialty rapid
diagnostic test
reader attachment
26
Table 2.4 Summary of imaging techniques utilized as point-of-care devices for
diagnostics.

46
The Rasooly group has contributed a several studies in the area of mHealth over
the last few years. In a first example a capillary tube array was developed to improve the
sensitivity of smart phones [25]. An increase in sensitivity was needed since common
cellphone cameras are generally not able quantify the weak fluorescent signals present in
many mHealth applications. An array using 36 capillaries was developed and illuminated
using a multi-wavelength LED directed horizontally to the capillary axis. Fluorescein
dilutions were tested between 0-10,000 nM, and a limit of detection was found to be ~10
nM in water. This represents roughly a 100-fold increase in sensitivity over the
unmodified phone as well as a vast increase in sensitivity compared to 36 well plates
whose LOD was 1000 nM.
In a secondary work from this group, mHealth diagnostic sensitivity was further
improved using computational image stacking [12]. This was accomplished by capturing
data in video mode, stacking the collected images and averaging the intensity of each
pixel to reduce or eliminate random noise. To demonstrate the ability of this system to
quantify disease-related biomarkers, adenovirus DNA was labeled with SYBR green or
fluorescein. Using computational image stacking signal sensitivity was improved,
reducing the LOD to 1 nM. While this technique currently demonstrates sensitivity
similar to a standard well-plate reader, its portability, ease of use, and the potential for
further increasing the sensitivity while utilizing minute sample volumes makes it an
attractive and promising mHealth platform. However, before this technique could be used
in diagnostic applications the platform would need to be evaluated for signal arising from

47
cross-reactivity or non-specific binding in samples which are not present in the current
model system and have not been considered in its limit of detection.
Cost-effective microscopy for telemedicine has also been studied extensively by
the Ozcan group. The primary focus of this group has been the development of lens-free
microscopy (Figure 2.3) [21-23,26]. A microscope-based on digital in-line holography
was developed using an light-emitting-diode (LED) and compact opto-electric sensor-
array, which allows imaging without the need for lenses or bulky optical equipment [21].
The microscope was tested for imaging performance using a variety of cells and particles.
Results show that, in addition to making the platform robust and cost-effective, lens-free
imaging was able to achieve subcellular resolution. This work was extended by the
imaging of micro-particles, red-blood cells, white blood cells, platelets and a waterborne
parasite [22]. The spatial resolution in this application was limited by the pixel size of the
sensor.
Figure 2.3 is reproduced from Reference 21 with permission from The Royal Society of
Chemistry. The figure shows the platform for the attachment of a lens-free microscopy
application to an existing cellphone camera. (A) shows an image of the actual device
used. Shown in (B) is a schematic of the microscope shown in (A).

48
Further expansion of these efforts was observed by the integration of imaging
cytometery and fluorescent microscopy as an optofluidic attachment [23,26]. This is
achieved by inserting a disposable microfluidic channel above the existing cellphone
camera to deliver targets of interest to the imaging volume. The captured images are then
processed through a smart application that both validates the test and automatically
presents the diagnostic results. This provided an imaging resolution of ~2 µm, which
highlights this technique’s potential as a valuable rapid imaging test for the routine
remote monitoring of chronic conditions as well as disease screening in resource-poor
areas.
The rapid-diagnostic-test platform was expanded to work with various lateral flow
immuno-chromatographic assays to sense a target analyte [26]. In order to accomplish
high-contrast imaging, diffused LED arrays were incorporated prior to data processing.
The platform was experimentally tested using malaria, tuberculosis (TB) and HIV
through detection with gold-labeled antibody-antigen complexes. This technique is
capable of rapid, high-resolution screening while providing instant testing results.
However, because its format only allows for the analysis of one target species at a time,
its use as a diagnostic point-of-care device would require the transport of a library of
microfluidic channel inserts which could decrease its ease of use, leaving it better suited
to the monitoring of chronic diseases in remote locations as opposed to a diagnostic tool.
Label-free detection on a smart phone was recently demonstrated by Gallegos et
al [24]. Broadband light entered through a pinhole and was collimated prior to passing
through a photonic crystal biosensor fabricated on a plastic substrate. A custom software
application was able to convert the resulting images to transmission spectra and perform

49
curve-fitting analysis. Results show peak wavelength value shifts could be measured with
0.009 nm spectral accuracy, allowing the detection of an immobilized protein monolayer
as well as selective, concentration-dependent antibody binding to a limitof 4.25 nM. The
measurement of wavelength shifts above the sensor-specific background noise suggests
the LOD is controlled by variations within the assay as opposed to the detector
resolution. The development of label-free biodetection on an affordable, sensitive, and
mobile platform represents a valuable potential tool for point-of-care diagnsotics, but
similar to many cellphone-based techniques is hampered by its limitation to the detection
of a single analyte.
The concept of a rapid, affordable point-of-care device has also been explored
commercially [52-55]. The most common commercial platform thus far is that
traditionally used in glucose monitoring [52,53]. One recent study compares the StatStrip
(SS) and SureStrep Flexx (SF) for glucose testing [52]. Results of this show the that the
sensitivity of SS was 94.7%, compared to 100% for SF and negative predictive values
were found to be 86.1% in both cases. These results were achieved using venous blood
samples compared to plasma glucose traditionally monitored, and it was determined that
they were of limited use compared to the reading of plasma samples.
The development of point-of-care testing for diverse disease biomarkers has also
been explored through a partnership between Texas Instruments and Cnoga Medical
[54,55]. Together they have investigated the use of video cameras to measure vital signs
like blood oxygen, carbon dioxide levels, blood pressure and pulse rate through skin
analysis. Current research by these companies aims to expand this technology toward
having capabilities to noninvasively identify biopatterns for diverse diseases.

50
2.4 Concluding Remarks
In examining the publications over this time span, there was a large emphasis on
the development of mobile diagnostic devices both utilizing imaging and biological
recognition detection platforms. This focus has evolved from the need to monitor global
health issues, as well as treat patients in remote or resource limited locations. While
platforms in this arena range from microarrays printed on CD or DVD discs, to the use of
a cellular phone camera to image or count cells and interface with applications that allow
data to be analyzed centrally through telemedicine, importance has been placed on the
need to perform tests rapidly, at low cost, with sensitivity comparable to technologies
used in a permanent laboratory, and with user-friendly interfaces. While mHealth and
related cellphone applications do not currently share the advantage of parallel biomarker
analysis, alterations in the design of the microfluidic cartridges used for testing prior to
detection through the cell phone camera should not detract from the sensitivity of
detection.
Another broad area of research is modifying traditional infrared spectroscopy
equipment to overcome the traditional diffraction-limited resolution capabilities while
maintaining reasonable analysis times. These approaches are valuable as they allow for
subcellular imaging, pinpointing label locations within a cell, and determination of
characteristic spectral signatures for related tissues that may help in the evolution of
imaging biomarkers for disease. However, the ultimate limitation to these techniques is
the singleplex analysis format they are confined to. While improvements in resolution
and reduction in analysis time make these valuable testing platforms, often a great deal of
post image-capture analysis is required for the interpretation of results, and only one

51
tissue may be imaged at a time, presenting a bottleneck to diagnosis of conditions
compared to techniques that allow many tests to be performed in parallel in a similar time
frame.
Finally, laboratory or clinic-based biorecognition assays have continued to evolve
in terms of their sensitivity and capability for the analysis of many compounds
simultaneously. While these techniques are diverse, they often require moderate sample
volumes and longer incubation times than many of the point-of-care testing devices. In
terms of these testing devices, the greatest potential for providing an optimized
biomedical analysis device comes from those assays being developed as part of a
microfluidic analysis system, where traditional incubation methods are forgone in lieu of
convective mixing, as well as sample pre-concentration and purification prior to detection
which both reduces cross-reactivity and allows for relatively complete capture of analyte
from a sample volume enabling low sample volumes and reduced analysis times.
While many of the biomedical analysis techniques described here have been
successful in improving upon on diagnostic capabilities or disease monitoring, there does
not currently exist one definitive optimal technique. Progress has been made in the ability
of various platforms to be user-friendly, rapid, and sensitive while achieving high
resolution and using low sample sizes. However, challenges still remain in adapting many
laboratory-based biological recognition assays to a point-of-care format without
compromising sensitivity or requiring specialists to interpret results. Future techniques, in
addition to being adaptable for the testing of a variety of diseases, should require minimal
sample and be capable of quantifying multiple targets in parallel.

52
While various analysis approaches have specific advantages, combining the rapid
analysis capabilities and user-friendly data presentation of the cellphone-based platforms
with the high sensitivities and parallel analyte analysis achieved in laboratory-based
biological recognition assays appears to present the most realistic path toward optimizing
diagnostic and disease monitoring capabilities. Although more work needs to be done
toward optimizing microfluidic attachments that may be used in remote locations for
multi-analyte detection, developments in this arena over the next few years hold promise
in providing optimize tests for disease monitoring tailored to the needs of their specific
targets, as well as versatile platforms that may be adapted to the early detection and
diagnosis of varied diseases.
2.5 References
[1] Moschallski, M., Evers, A., Brandsetter, T., Ruhe, J., Analytica Chimica Acta,
2013, 781, 72-79.
[2] Wang, H., Ou, L.M.L, Suo, Y., Yu, H.Z., Analytical Chemistry, 2011, 83, 1557-
1563.
[3] Farajollahi, M.M., Cook, D.B, Hamzehlou, S., Self, C.H., Scandinavian Journal
of Clinical and Laboratory Investigation, 2012, 72, 531-539.
[4] Tamarit-Lopez, J., Morais, S., Puchades, R., Maquieira, A., Bioconjugate
Chemistry, 2011, 22, 2573-2580.
[5] Zhang, B., Liu, B., Zhou, J., Tang, J., Tang, D., Applied Materials and
Interfaces, 2013, 5, 4479-4485.
[6] FAST®
Slide Protein Microarray 2013 KeraFast, Inc.
https://www.kerafast.com/c-1-fast-slide-protein-microarray.aspx
[7] Moschallski, M., Baader, J., Prucker, O., Ruhe, J., Analytica Chimica Acta,
2010, 671, 92-98.

53
[8] Wen, J., Shi, X., He, Y., Zhou, J., Li, Y., Anal. Bioanal. Chem., 2012, 404,
1935-1944.
[9] Yu, H.Z., Li, Y., Ou, L.M.L., Accounts of Chemical Research, 2013, 46, 258-
268.
[10] Imaad, S.M., Lord, N., Kulsharova, G., Liu, G.L., Lab on a Chip, 2011, 11,
1448-1456.
[11] Tamarit-Lopez, J., Morais, S., Manuis, M.J., Puchades, R., Maquieira, A.,
Analytical Chemistry, 2010, 82, 1954-1963.
[12] Balsam, J., Rasooly, R., Bruck, H.A, Rasooly, A., Biosensors and
Bioelectronics, 2014, 51, 1-7.
[13] Cheung, K.T., Trevisan, J., Kelly, J.G., Ashton, K.M., Stringfellow, H.F.,
Taylor, S.E., Singh, M.N., Martin-Hirsch, P.L., Martin, F.L., Analyst, 2011,
136, 2047-2055.
[14] Pita, I., Hendaoui, N., Liu, N., Kumbham, M., Tofail, S.A.M., Peremans, A.,
Silien, C., Optics Express, 2013, 21, 25632-25642.
[15] Huth, F., Schnell, M., Wittborn, J., Ocelic, N., Hillenbrand, R., Nature
Materials, 2011, 10, 352-356.
[16] Liao, C.R., Rak, M., Lund, J., Unger, M., Platt, E., Albensi, B.C., Hirschmugi,
C.J., Gough, K.M., Analyst, 2013, 138, 3991-3997.
[17] Nasse, M.J., Walsh, M.J., Mattson, E.C., Reininger, R., Kajdacsy-Balla, A.,
Macias, V., Bhargava, R., Hirschmugl, C.J., Nature Methods, 2011, 8, 413-416.
[18] Reddy, R.K., Walsh, M.J., Schulmerich, M.V., Carney, P.S., Bhargava, R.,
Applied Spectroscopy, 2013, 67, 93-105.
[19] Marcott, C., Lo, M., Kjoller, K., Domanov, Y., Balooch, G., Luengo, G.S.,
Experimental Dermatology, 2013, 22, 417-437.
54
[20] Policar, C., Birgitta Waern, J., Plamont, M.A., Clede, S., Mayet, C., Prazeres,
R., Ortega, J.M., Vessieres, A., Dazzi, A., Angew. Chem. Int. Ed., 2011, 50,
860-864.
[21] Mudanyali, O., Tseng, D., Oh, C., Isikman, S.O, Sencan, ., I., Bishara, W.,
Oztoprak, C., Seo, S., Khademhosseini, B., Ozcan, A., Lab on a Chip, 2010, 10,
1417-1428.
[22] Tseng, D., Mudanyali, O., Oztoprak, C., Isikman, S.O., Sencan, I., Yaglidere,
O., Ozcan, A., Lab on a Chip, 2010, 10, 1787-1792.
[23] Zhu, H., Mavandadi, S., Coskun, A.F., Yaglidere, O., Ozcan, A., Analytical
Chemistry, 2011, 83, 6641-6647.
[24] Gallegos, D., Long, K.D., Yu, H., Clark, P.P., Lin, Y., George, S., Nath, P.,
Cunningham, B.T., Lab on a Chip, 2013, 13, 2124-2132.
[25] Balsam, J., Bruck, H.A., Rasooly, A., Sensors and Actuators B: Chemical,
2013, 186, 711-717.
[26] Mudanyali, O., Dimitrov, S., Sikora, U., Padmanabhan, S., Navruz, I., Ozcan,
A., Lab on a Chip, 2012, 12, 2678-2686.
[27] Pallapa, M., Ou, L.M.L., Parameswaran, M., Yu, H.Z., Sensors and Actuators
B, 2010, 148, 620-623.
[28] Zhu, H., Isikman, S.O., Mudanyali, O., Greenbaum, A., Ozcan, A., Lab on a
Chip, 2013, 13, 51-67.
[29] Zeng, Y., Wang, T., Anal. Bioanal. Chem., 2013, 405, 5743-5758.
[30] Zhu, H., Cox, E., Quian, J., Proteomics Clin. Appl., 2012, 6, 548-562.
[31] Walsh, M.J., Reddy, R.K., IEEE Journal of Selected Topics in Quantum
Electronics, 2012, 18, 1502-1513.
[32] Prashanth, G.R., Goudar, V.S., Raichur, A.M., Varma, M.M., Sensors and
Actuators B: Chemical, 2013, 183, 496-503.

55
[33] Mujawar, L.H., Moers, A., Norde, W., van Amerongen, A., Anal. Bioanal
Chem, 2013, 405, 7469-7476.
[34] Mujawar, L.H., Maan, A.A., Khan, M.K.I., Norde, W., van Amerongen, A.,
Analytical Chemistry, 2013, 85, 3723-3729.
[35] “ONCYTE® Nitrocellulose Film Slides” Grace Bio-Labs, Inc. 2010.
http://www.gracebio.com/life-science-products/microarray/oncyte-
nitrocellulose-film-slides.html
[36] UniSart® Membranes Consistency by Design http://www.sartorius-
stedim.com.tw/Attachment/FCKeditor/Product/file/PDF/lab/filter&membran/Br
och_Unisart_Membranes_SL-1522-e.pdf
[37] Zhang, B., Liu, B., Zhou, J., Tang, J., Tang, D., Applied Materials and
Interfaces, 2013, 5, 4479-4485.
[38] Peretz-Soroka, H., Pevzner, A., Davidi, G., Naddaka, V., Tirosh, R., Flaxer,
Patolsky, F., NANO Letters, 2013, 13, 3157-3168.
[39] Chandra, P., Abbas Zaidi, S., Noh, H.B., Shim, Y.B., Biosensors and
Bioelectronics, 2011, 28, 326-332.
[40] Wang, J., Morabito, K., Erkers, T., Tripathi, A., Analyst, 2013, 138, 6573-6581.
[41] Lin, Y.H., Yang, Y.W., Chen, Y.D., Wang, S.S., Chang, Y.H., Wu, M.H., Lab
on a Chip, 2012, 12, 1164-1173.
[42] Arnandis-Chover, T., Morais, S., Gonzalez-Martinez, M.A., Puchades, R.,
Maquieira, A., Biosensors and Bioelectronics, 2014, 51, 109-114.
[43] Disc-shaped Point-of-Care platform for infectious disease diagnosis, K.
Mitsakakis, 2014 http://www.imtek.de/laboratories/mems-
applications/projects/projects_overview?projectId=8073
[44] Gyrolab Bioaffy CDs 2013 Gyros AB http://www.gyros.com/products/products-
optimized/gyrolab-bioaffy-cds/
[45] GenePOC 2014, GenePOC, Inc. http://www.genepoc-
diagnostics.com/Technology.shtml

56
[46] Liu, X.F., Wang, X., Weaver, R.J., Calliste, L., Xia, C., He, Y.J., Chen, L.,
Journal of Pharmacological and Toxicological Methods, 2012, 65, 107-114.
[47] Guo, Y.J., Sun, G.M., Zhang, L., Tang, Y.J., Luo, J.J., Yang, P.H., Sensors and
Actuators B: Chemical, 2014, 191, 741-749.
[48] Clede, S., Lambert, F., Sandt, C., Kascakova, S., Unger, M., Harte, E.,
Platmont, M.A., Saint-Fort, R., Deniset-Besseau, A., Gueroui, Z., Hirschmugl,
C., Lecomte, S., Dazzi, A., Vessieres, A., Policar, C., Analyst, 2013, 138, 5627-
5638.
[49] NeaSNOM Microscope, 2013 Neaspec
http://www.neaspec.com/products/neasnom-microscope/
[50] Amenabar, I., Poly, S., Nuansing, W., Hubrich, E.H., Govyadinov, A.A., Huth,
F., Krutokhvostov, R., Zhang, L., Knez, M., Heberle, J., Bittner, A.M.,
Hillenbrand, R., Nature Communications, 2013, 4, 1-9.
[51] Govyadinov, A.A., Amenabar, I., Huth, F., Carney, P.S., Hillenbrand, R., J.
Phys. Chem. Lett., 2013, 4, 1526-1531.
[52] Kitsommart, R., Ngerncham, S., Wongsiridej, P., Kolatat, T., Jirapaet, K.S.,
Paes, B., Eur J Pediatr, 2013, 172, 1181-1186.
[53] StatStrip®
Connectivity and StatStrip Xpress Point-of-Care Glucose/Ketone
Monitoring Systems 2014 Nova Biomedical Corporation
http://www.novabiomedical.com/products/statstrip-glucoseketone-statstrip-
xpress-glucoseketone/
[54] Nadeski, M., Frantz , G., The future of medical Imaging
http://www.ti.com/lit/wp/slyy020/slyy020.pdf
[55] Cnoga Medical develops diagnostics through skin color, G. Weinreb, 2013
Globes http://www.globes.co.il/serveen/globes/docview.asp?did=1000877563

57
CHAPTER 3
RECENT DEVELOPMENTS IN EMERGING MICROIMMUNOASSAYS
3.1 Introduction
Over the last several years micro-immunoassay development has focused on
replacing existing immunometric assays based on a micro-titer plate format. Notable
among these currently existing methods is the enzyme-linked immunosorbent assay, or
ELISA. Since its introduction in 1971, ELISA has remained a core, widely accepted
practice and remains a common focal point to differentiate and discuss current
experimental techniques [1]. Its success stems from the enzyme-based amplification
mode and ease of use, along with the specificity and sensitivity of the antibody-antigen
interactions common to all immunoassays. Despite the long incubation times and
relatively high sample volumes and reagent costs, experimental assays aimed at the
replacement of ELISA have universally failed to displace it and few have been
implemented commercially. While much of the following discussion is centered on
comparisons to ELISA, all immunoassay platforms are included. Over the last five years,
efforts to improve upon clinically used sandwich immunoassays have targeted one (or
more) of six metrics: increased sensitivity [2-5], reduced analysis time [6-9], reduced cost
[10], lower sample volumes [6-11], ability to multiplex [2,6,12-15], or operational
simplicity [3]. While many studies improved various aspects of immunoassays, a so-
called optimized immunoassay capable of displacing existing tests and significantly
improving capabilities for clinical or diagnostic purposes has not been produced. A
platform capable of doing so would need to not only meet the critera defined above, but
possess high reproducibility and show selectivity for the condition or disease being
58
investigated. Many of the methods discussed herein have been addressed only in single
publications, therefore reproducility of immunoassay results needs to be improved before
one may be considered optimal for diagnostics. However, several studies noted here may
lay the foundation for a successor to ELISA.
Several groups continue to develop variations on standard immunoassay
protocols, notably those of Ko, Gijs, Yang, and Hage. The current article will focus on
the ability of these systems (and others) to create sensitive, robust, rapid and cost-
effective diagnostic tools with high throughput on a multiplex format. While many of the
assays discussed currently take place using singleplex analysis, their ability to be adapted
to a high-throughput format will be assessed relative to other formats.
For any assay platform, the ultimate level of sensitivity will depend on the
reaction kinetics (Keq) resulting from reagent quality [16]. However, reagent specificity
will have differing impacts on the assay outcome depending on the platform in which
they are used. An optimized clinical immunoassay format should meet several criteria to
be applicable to a comprehensive range of diagnostic tests. First, a sensitivity down to the
low pg/mL range is optimal so any plasma protein may be monitored, which allows for
ultra-sensitive detection in medical diagnostics [17]. An analysis time should be no more
than 1 hour (if samples may be evaluated simultaneously) to permit changes over time to
be tracked with ease [18], and sample volumes in the range of 10 µL per analyte
interrogated to minimize reagent consumption. Finally, an assay should be able to
multiplex for the evaluation of five proteins simultaneously, representing quantification
of a group of biomarkers for a specific disease [15], and should take place with minimal
transfer/pipetting steps to lessen variation between tests/testing sites [18]. These criteria

59
represent the desired capabilities of an immunoassay platform such that it may be easily
adapted for the detection of a complete range of targets in a clinical setting. The
individual assays discussed have been optimized for a particular target (or set of targets),
which in some cases have requirements deviating from the desired qualities described
above for an optimized clinical assay. While these criteria are not inclusive to all tests,
they have been established to provide an organized framework in which to discuss the
diverse experimental immunoassay platforms available.
While immunoassays have been the subject of several recent reviews [19,20], the
focus of this review is immunoassay platforms aimed at improving diagnostic abilities
published during the time span from January 2008 to April 2012, initiated with literature
keyword searches associated with micro-immunoassays along with the references and
later citations of found works. These articles contributed new techniques to the field by
improving limits of detection, decreasing sample analysis time, and refining the ability of
assays to accommodate multiple samples in parallel. Many of the designs represent
relatively simple fabrication processes and, while demonstrated for specific analytes,
could be easily adapted for any number of target compounds. The topics addressed are
categorized into three classes: (i) use of micro- or nanoparticles (both magnetic and non-
magnetic) as a solid support or to generate signal [Section 3.2], (ii) generation of signal
using flow conditions [Section 3.3], and (iii) use of a static solid support to trap antigen
and generate signal [Section 3.4]. A summary of these techniques is provided for
reference (Table 3.1, Appendix B). Although articles have been divided into these
categories for clarity, they are not mutually exclusive and many studies could have been
placed in more than one class.

60
3.2 Assays using micro- or nanoparticles
Assays employing micro- or nanoparticles may be further divided into two
categories: (i) those using magnetized particles and (ii) those which use non-magnetic
particles. Some of the techniques described here include the fluorescent microsphere
immunoassay (FMIA) and its variations, magnetic bead-based immunoassays occurring
fully on-chip where beads are manipulated to afford contact with successive reagents and
samples, and magnetic bead-based assays which employ batch incubation off-chip prior
to on-chip detection. The use of micro- or nanoparticles has gained popularity for a
variety of reasons. Chief among these are the ease of manipulation during sample
preparations and the ability to tailor the number of beads employed to suit the specific
needs of an assay. This allows the solid surface area to be altered and optimized for
various targets. Users are able to trap lesser sample concentrations on a small surface area
(by employing low bead numbers) which provides signal concentration, allowing
sensitive detection. Assays utilizing magnetic particles, in particular, also lend
themselves well to coupling with varied signal processing approaches which have
improved sensitivities and lowered limits of detection [4,5,21].
3.2.1 FMIA
FMIA is a technique that uses numerous sets of spectroscopically-coded
fluorescent microspheres, where each microsphere set is conjugated to a unique antibody
or antigen, forming a solid phase for analyte detection [12]. This format was developed
with a focus on multiplex analyses and has been used to successfully quantify ten
compounds in parallel with detection limits in a clinically relevant range. Antigen-
antibody reactions are simply performed in the well of a micro-titer plate. Analysis

61
follows, on a flow cytometer using Luminex X-MapTM
technology, in which separate
wavelengths of light excite the microsphere sets and surface-bound reporter dyes [22,23].
The microspheres are labeled with a combination of red and orange fluorescent dyes. The
ratio of these dyes acts as an identifier of the target analyte immobilized on the
microsphere surface [18]. A separate detector, measuring green fluorescent response
proportional to the amount of target, is able to quantify the total analyte present (Figure
3.1) [24]. This technique has been tailored to quantify groups of compounds relevant to a
particular disease and possesses the obvious advantage observed in its ability to
interrogate up to ten analytes from a single sample. However, in order to achieve
clinically relevant levels of sensitivity, this format requires long incubation times and the
use of specialized equipment. While verified assays are powerful in the information
content they are able to provide, validation studies to ensure specificity represent a time-
consuming hurdle for adaptations to limitless biological applications.

62
Figure 3.1. Overall process of a Luminex
® multiplex immunoassay. Following the
immunoreaction shown in (A) fluorescence signals from both the reporter-molecule and
color-coding dyes are read simultaneously (B) and processed digitally to translate signals
to quantitative data (C).
The labor-intensive development process for FMIA was demonstrated in one
instance by the validation of assays detecting the porcine reproductive and respiratory
virus (PRRSV) in both serum and oral-fluid based samples [12,13].This work, done at
South Dakota State University, produced an 8-plex FMIA for cytokine detection and
requires a single 50 μL sample to quantify the analytes simultaneously [13]. Using the
same volume typically required for one ELISA sample, the FMIA assay was able to
achieve sensitivities in the pg/mL range. For seven out of the eight analytes studied this
detection limit represents between 1.2 – 8.2 fold improvements to sensitivity compared
with the analogous ELISA. Follow-up work aimed at replacing serum samples with oral-

63
fluid resulted in decreased diagnostic capabilities [12]. However, the assay did maintain a
clinically-acceptable level of sensitivity and was able to detect the multiple target
compounds in a single sample. While this work was successful in producing an assay
based around the use of a non-invasive sample (allowing widespread testing), expansion
to theoretical capabilities is limited by the quality, in terms of selectivity, of the
antibodies employed. Additionally, since the possibility of shorter incubation times was
not fully explored, leading to assay times comparable to a traditional commercial ELISA
format [24], along with the requirement for sophisticated equipment, this assay carries
significant costs both in terms of analysis time and labor for development.
Nonetheless, this technology has been used for various applications including the
detection of sera infectious agents [25], matrix metalloproteinases [26], and small
molecule drugs [27]. These uniquely optimized assays share the advantage of using a
single sample for multiple analytes equivalent to the volume used for one ELISA target.
Moreover, owing to reduced sample handling, the multiplexed estimates are less
impacted by operator error as compared to ELISAs performed on multiple analytes
requiring several trials [26]. These studies were able to achieve sensitivities of 1 µg/mL
for sera infectious agents, 17 pg/mL for matrix metalloproteinases and below 1 ng/mL for
small molecule drugs. However, like the studies discussed above, antibody cross-
reactivity presents a practical limit to the number of analytes that may be interrogated
from a single sample and may limit sensitivity.
Using a similar format, but with the added advantage of reduced analysis time,
Kuriakose et al. described the use of FMIA for the development of a multiplex assay for
avian influenza viruses [28]. The reactions were analyzed on a Bioplex instrument using a

64
minimum of 100 microspheres in each set. Mean fluorescence intensity calculations for
each bead set were used to quantify influenza viruses M, H5, H7, N1 and N2 to 0.04,
0.15, 0.17, 1.56, and 1.15 ng in a 50µl sample, respectively. This represents an average
detection limit of 12.3 ng/mL, where the assay can be accomplished within 70 minutes.
While the detection capabilities of FMIA are not fully exploited in this effort, the study
represents a subset of work where reduced analysis times hold greater importance.
A comparable emphasis on reduced analysis time is observed in the work on
glycopolymer quantification by Pochechueva et al, where analysis time totaled 90
minutes [29]. Here, glycoproteins Atri, Btri, Lex, and Hd were analyzed in both singleplex
and multiplex formats to assess antibody cross-reactivity. The mono- and multiplex assay
data correlated well, having Pearson’s r values ranging from 0.95 to 0.99 for the different
analytes, indicating that the six target compounds investigated could be detected
independently from a single sample. The lowest concentration tested was detected at 15
µg/mL. While successful under these circumstances, where target compounds have a
relatively high relevant range, the full detection capabilities of FMIA were not
maximized. Application to other biological targets, where physiological concentrations
may be significantly lower, could require longer incubations and negate the time
advantage observed here.
In a unique twist on work related to FMIA, Ji et al. reported on the production of
quantum dot (QD)-doped microparticles for use in immunoassays [30]. A flow-focusing
microchannel with a double T-junction was designed to merge a sodium alginate solution
into a hydrogel matrix for trapping QDs. The system affords a series of QD-encoded
microparticles to be developed in one step. When tested in an immunoassay on IgG

65
(immunoglobulin G), FITC-labeled (fluorescein isothiocyanate) IgG could be detected to
a minimum concentration of 2.2 µg/mL. Further investigations are needed to separate
target and encoding signals and optimize other assay conditions to improve detection
sensitivities. Once optimized, this process provides an attractive alternative to the need to
purchase fluorescent microparticles commercially for small-scale operations focused on
minimizing cost. However, the low cap on bead diversity, as well as the time required to
produce the QDs, limit the utility of this platform for large-scale clinical use.
The assays developed using FMIA have, to this point, achieved success in
measuring up to ten analytes from a single sample [25]. They require low sample
volumes (typically 50 µL), which has permitted the thorough investigation of limited
samples by allowing quantification of anywhere from one to ten antigens. Each of the
investigations discussed have successfully adapted FMIA to suit their individualized
needs. However, they are relatively expensive to perform due to the requirement for
specialized analysis equipment and depend completely on antibody specificity for a
reliable response. This reliance on antibody quality restricts the flexibility of FMIA in
terms adaptation to new target compounds since adjustments require extensive testing to
assure minimal cross-reactivity within the assay. This immunoassay format also requires
long incubation times, totaling two or more hours, to achieve levels of sensitivity in the
pg/mL range. The requirement for these long incubations arises from sample preparation.
Samples are incubated in in the absence of convective mixing or sample flow employed
by other methods to increase the speed of antibody-antigen recognition events.
Other companies have developed similar commercial products to FMIA,
including the cytometric bead array (CBA) from BD Biosciences and the Amplified
66
Luminescent Proximity Homogeneous Assay (AlphaLISA) [31-33]. Like FMIA, CBA
uses small sample volumes (50 µL) and has achieved clinically acceptable limits of
detection (3 pg/mL) while operating in the same time frame as FMIA [31]. AlphaLISA
has been able to quantify target compounds in a shorter time span using a competitive
assay format [32,33]. While AlphaLISA has also attained sensitive detection (0.007
ng/mL) in a shorter time frame using a competitive assay format, signal production
depends on an energy transfer between donor and acceptor beads in close proximity to
produce a chemiluminescent signal which subsequently activates a fluorophore in the
same bead. This method of signal production has resulted in studies that focus on assay
development in a singleplex format. Adaptation to a multiplex format would require the
ability to distinguish between signals from different acceptor beads. Additionally,
because AlphaLISA operates in a competitive assay format, where increases in analyte
represent decreases in observed signal, the limits of detection for this platform are not as
sensitive as those operating in a noncompetitive sandwich assay design.
3.2.2 Off-chip preparation of magnetic bead-based assay
The use of magnetic particles as a solid support is an attractive alternative to
fluorescent microspheres because it allows for easy manipulations and separations both
on and off-chip. Off-chip incubation is often employed because it allows sample
preparations to be performed in advance of the assay. The initial incubations are simple
to perform and can be accomplished using common lab equipment, such as an Eppendorf
tube [21], or the well of a micro-titer plate [34]. Magnetic particles may be easily
detained by the introduction of a permanent magnet during wash steps, and high
sensitivities have been achieved with small sample volumes. In addition to the ease of

67
manipulations and high sensitivity, use of magnetic particles has gained in popularity
because of their compatibility with diverse detection and signal processing systems
including, but not limited to, chemiluminescent [34,35], fluorescent [21,36-38], or
electrochemical detection [39].
Fluorescence continues to be one of the most popular detection methods, and
several protocols used in fluorescence immunoassays (FIA) were described during this
time period by the Gijs group from Switzerland [36,37]. In one article, a channel was
constructed having periodically enlarged cross-sections used to trap magnetic chains in a
homogeneous field [36]. The results showed that off-chip incubation of capture antibody
with target analyte under agitation produced uniform fluorescence throughout the channel
(Figure 3.2). This approach provided a detection limit of 50 ng/mL, which is similar to
classical ELISA. However, the off-chip incubation resulted in the linking of beads via
capture antibody interactions creating chain irregularities on-chip. By implementing a full
on-chip procedure the issue of chain irregularities was resolved [36,40]. This gave an
improved detection limit of a few ng/mL and afforded a reduction in assay time from 2
hours to 25 minutes.

68
Figure 3.2. Images of the self-assembled chains formed using off-chip incubation,
on-chip detection and the full on-chip immunoassay formats. (A) shows an optical
image of the self-assembled chains following off-chip incubation. (B & C) compare
the fluorescence images of the chains after the off-chip incubation and full on-chip
assay, respectively.
Building from their work on FIA protocols, an integrated silicon chip was
developed by Dupont et al. based on the measurement of photon-induced electrical
current pulses in single photon avalanche diodes (SPADs) [37]. This allows for

69
fluorescence measurements of microparticles without the requirement of a microscope.
Here, manipulation on-chip after off-chip incubation of sample is achieved by applying
current through microcoils which positions single beads over a SPAD. Once oriented, the
fluorescence signal of a single bead could be measured for the detection of monoclonal
antibodies down to 1 ng/mL in only 25 minutes using a sample volume of 100 µl. While
this assay achieves a comparable sensitivity in the same time frame to the fully on-chip
assay described by the group, the sample volume required is much greater (100 μL as
compared to 4.1 nL) [36,40]. Additionally, the speed of this assay is an improvement
over the 2.5 -3 hours typically required of a commercial ELISA using an identical sample
volume. However, the limit of detection is slightly higher than the 0.03 ng/mL limit
typically observed commercially for monoclonal antibodies used in analyte capture [101].
A different approach to signal generation in FIA protocols is described by the
Hayes group from Arizona State University [4,21]. In these articles, during data
acquisition on an inverted fluorescent microscope coupled to a CCD camera, a magnetic
field is introduced. By incorporating a periodicity into this field, lock-in amplification
was used to selectively quantify surface-localized myoglobin, even in the presence of
background noise. Using lock-in amplification, a detection limit of 1 ng/mL was
afforded, which is comparable to the methods previously described [21]. By introducing a
novel image processing system capable of estimating and eliminating background noise,
only the pixels corresponding to the solid surface are used in concentration
determinations [4]. Coupling this signal processing to the previously described
immunoassay protocol improved sensitivity to a 11.5 pg/mL detection limit for
myoglobin using a sample volume of 30 µl. This detection limit represents roughly 100-

70
fold improvement over previous results and is 2.3-fold more sensitive than the
corresponding ELISA.
Off-chip incubation protocols have also been described for methods using varied
detection methods. Electrochemical detection was employed both by Proczek et al. [33],
and by Piao et al [41]. In the work by Proczek et al. analyte quantification was performed
using GRAVITM
-chips from DiagnoSwiss [39]. These chips contain eight independent
microchannels, which allows parallel testing. Following off-chip incubation, IgE
(immunoglobulin E) could be quantified to a detection limit of 17.5 ng/mL in less than an
hour.
Piao et al. used a novel approach to develop an electrochemical immunosensor
based on carbon nanotubes coated with enzyme and magnetic particles in combination
with an electrically-driven reversible reaction allowing substrate recycling to amplify
signal [41]. After off-chip conjugation of magnetic particles and capture antibody to the
carbon nanotubes and the binding of target analyte on-chip, the sensing assembly is
magnetically guided to a gold electrode. Here, the amperometric responses of the
enzymatic reaction were recorded using cyclic voltammetry. Results show a detection
limit of 0.19 ng/mL of hIgG after a 30 minute enzymatic reaction. While both methods
were able to quantify target compounds with a similar limit of detection to FIA and do
not require the use of a fluorescent microscope, sensitivity is afforded through long
enzymatic reactions relative to assays boasting the completion of entire protocols within
25 minutes [36,40].
An alternative method employing batch incubation was described by Li et al [34].
Here, the development of a micro-plate magnetic chemiluminescence immunoassay

71
(MMCLIA) was discussed. This assay uses magnetic particles as the solid support and
micro-plate wells as the reactor. The full procedure takes just under two hours to perform.
With incubation times similar to conventional ELISA, a detection limit of 0.61 ng/mL for
carcinoembryonic antigen was afforded using a sample volume of 35 µl. Although not
offering advantages in terms of rapid analysis, and with a format that would be reliant on
antibody quality to preserve sensitivity if multiplexing were to take place, this assay
affords a competitive detection limit while requiring roughly 1/3 the sample used by
current commercial protocols.
This group of assay methods shares the advantage of sensitive detection limits
using affordable methods and, in general, low to moderate levels of complexity. They
also offer the ability to limit sample use (generally between 30-50 µl is consumed) and
reagent consumption. This is afforded by the ability of the magnetic particles comprising
the solid support to remain free-flowing during incubations, as well as through
convective mixing, which allows the entire sample to be interrogated for antigen capture
affording quantifiable signal of low-concentration targets from small sample volumes.
Additionally, while many have been evaluated only in a singleplex format, the alteration
to these assays allowing the ability to multiplex is straightforward and should not affect
assay quality. However, while many of these assays require only simple lab equipment
for the initial incubation steps, the chips employed during detection (as well as the
detection methods themselves) vary greatly. So, while many methods can be performed
with the use of a common fluorescent microscope, there may be initial instrumentation
costs depending on the assay platform selected. Furthermore, with off-chip preparation
of samples, long incubation times on the order of hours are required. This limits the

72
capability of these assays to make serial measurements and track concentration
fluctuations with time. In addition, some studies have observed issues in the manipulation
or non-uniform aggregation, of beads on-chip, following off-chip pelleting protocols
during wash steps [36]. Many of these issues can be eliminated through the adaptation of
batch incubation procedures to those that take place fully on-chip. The advantages, and
limitations, of the on-chip immunoassay format are discussed in the following section.
3.2.3 On-chip assay with sequential introduction to reagents/samples
When immunoassays take place entirely on-chip the magnetic beads employed as
the solid support may be manipulated in a variety of ways. Beads can be injected onto the
chip at the outset of the experiment, immobilized by permanent magnets, and introduced
to reagents and sample by sequential injection [11,36,40,42,43]. They may also be
injected onto the chip and manipulated through static plugs of sequential reagents [44], or
forced through laminar streams of flowing reagents [8,9]. Relative to their batch-
incubation counterparts, these assays are relatively simple to perform, requiring minimal
pipetting steps and no transfer of the assay between containers. This minimizes the
aggregation issues that have been observed in some off-chip immunoassay applications
[36]. Additionally, through the flow of sample and reagents the duration of the assays is
minimized. While this is sometimes accompanied by a decrease in sensitivity, some
optimized procedures are able to remain competitive with those using longer incubation
steps.
The manipulation of magnetic particles through streams or static plugs of sample
and reagent was explored by multiple groups [8,9,44]. In the first study, performed by
Sasso et al., magnets are placed on both sides of a microchannel [9]. The field is strong

73
enough to pull magnetic beads to the wall of the channel, but not strong enough to
overcome the shear stress from fluid flow required to trap the particles. This allows
incubations to occur along the channel walls, and the beads are able to traverse the
channel to enter or exit reactant streams. This format allows rapid assay times and
requires minimal handling of the sample or reagent. Using an epifluorescence microscopy
detection platform a 625 ng/mL limit of detection was realized for biotin-FITC with
incubation times of less than five minutes and a sample volume of 90 µL. Despite
requiring a relatively larger sample volume compared with other magnetic particle-based
assays, this study allows for rapid serial measurements. This could easily be used to track
changes in analyte concentration with time, but only for target compounds with a high
concentration in plasma. Alterations to the method would have to be made to afford more
sensitive detection, and allow this method to be readily ported to additional applications.
A second example of the rapid analysis afforded by fully on-chip immunoassay
applications was described by Peyman et al. where IgG quantification was achieved in
about ten minutes consuming only 7.5 µl of reagents [8]. In this study several
independent laminar flow streams are produced across a rectangular reaction chamber.
The functionalized magnetic particles are deflected across these streams, passing through
sample, wash, and detection reagents. Once the chip is set up there is only one required
pipetting step to perform the assay, minimizing variations between runs. This, in addition
to speed, represents a secondary advantage over batch incubation processes. Results show
that negative controls used on chip produce little to no nonspecific binding or transfer of
reagents between boundaries, evidenced by the lack of fluorescence for these samples.
Using this system the detection limit for IgG was 0.1 µg/mL. This high limit of detection

74
could potentially be improved by increasing the sample volume, or through longer
interaction times of the magnetic particles with sample.
A final example of particle manipulation through reagents and sample was
developed by Chen et al. from the University of Rhode Island who describe a platform
for a microfluidic inverse phase enzyme-linked immunosorbent assay (µIPELISA) [44].
In this format magnetic beads are loaded into a microchannel and transferred sequentially
through plugs of sample and reagents separated by oil. This design allows the assay to be
set up completely ahead of time and allows the process to be limited to one pipetting step,
making operation simple. The oil plugs also prevents the mixing of reagents before, and
during, the assay. The beads are allowed to incubate in each plug for 30-45 minutes and
fluorescence data are collected for 180 seconds after being moved into the final buffer
plug containing a fluorescein diphosphate (FDP) solution. Using this platform
digoxigenin-labeled double-stranded DNA (Dig-dsDNA) was detected to a limit of 259
ng/mL. However, at higher sample concentrations the µIPELSIA was less capable of
detecting analyte compared to traditional methods. This was proposed to be a product of
carry-on water between plugs bringing free detection antibody into the exposure plug.
Although slightly more sensitive than similar on-chip methods, this assay loses the
advantage of rapid analysis and does not compare to the sensitivities achieved with
similar incubation times off-chip. Additionally, adaptation of the current assay to a
multiplex format would involve use of all four parallel channels available in the current
chip design. This would allow analytes to be quantified simultaneously but would
quadruple the consumption of sample and reagents compared to the current system.

75
The other predominant assay structure for on-chip protocols involves maintaining
magnetic beads in a single position by employing a homogeneous magnetic field and
sequentially introducing reactants by flow, which has been explored extensively
[2,11,40,43]. Keeping particles trapped in a magnetic field prevents undesirable
aggregation and reduces the loss associated with particle transfers using batch incubation.
Also, sample and reagent exposure times can be varied simply by altering flow rates to
optimize signal under minimally required assay durations. This minimizes assay times
while affording limits of detection competitive with assay formats requiring long
incubations. This approach was used by Do et al. from the University of Cincinnati to
design a new lab-on-a-chip facilitating an enzyme-labeled electrochemical immunoassay
(ECIA) [11]. The chip uses a magnetic microarray as a bead separator and an
interdigitated array (IDA) microelectrode as a biosensor. Results show IgG could be
detected to 16.4 ng/mL in 35 minutes using 5 µl of reagent.
In another study magnetic nanoparticles were used as labels on microbeads to
detect bound analyte by isomagnetophoretic focusing [2]. An external magnetic field
causes particle movement to a denser or sparser field until its magnetic susceptibility is
equal to the surrounding gradient. This is important because it allows small changes in
concentration to be detected by utilizing a low concentration of gadolinium paramagnetic
diethylenetriamine pentacetic acid (Gd-DTPA), used to create the magnetic susceptibility
gradient. This low concentration allows a narrow dynamic range with high resolution.
However, by employing a higher concentration of Gd-DTPA solution, a wider
concentration range may be interrogated, making the assay flexible for diverse target
compounds. Using this set-up rabbit IgG-biotin could be detected to a limit of 3.2 fg/mL.

76
The use of fluorescent microbeads allowed for a multiplexed assay with the detection of
three analytes while maintaining pg/mL sensitivity and requiring 200 µL of sample. This
represents improved sensitivity compared to commercially available ELISA, but required
double the sample volume and similar assay duration. With the flexibility of tailoring the
Gd-DTPA gradient, and using long incubations during sample preparation and
specialized equipment to prepare and analyze samples, a low limit of detection was
achieved for this assay.
Many of the fully on-chip immunoassays afford users rapid results and consume
low volumes of sample [8,9,11]. Rapid analysis is allowed by manipulating the solid
phase through reagents or by holding the solid surface in place while flow is used to
direct sample to the assay surface, decreasing the depletion zone observed with diffusion-
mediated incubations. Large depletion zones, which reach a sensor-size dependent steady
state during incubations dependent upon diffusion, can be combated by convective
mixing or flow which accelerate mass transport and actively decrease the thickness of the
depletion zone near a sensor surface [45]. This allows the assay time to be dependent
upon the speed of the reaction itself as opposed to mass transport limitations. However,
this rapid analysis is frequently accompanied by higher limits of detection. While non-
specific binding is not a large problem because the particles are in contact with sample
and reagent for short time periods, the entire population of antigen may not be trapped
causing an increase in limits of detection. In other cases long incubation times have
allowed for sample analysis with high sensitivity, and the interrogation of multiple
analytes [2]. Where optimal incubation times are employed these assays require less
sample manipulation than their corresponding off-chip counterparts and have shown

77
equal, or greater, sensitivities. Similar to their off-chip counterparts many of these assays
may be accomplished using a fluorescent microscope as the detection element.
Nonetheless, due to the diversity of assay platforms, many formats require specialized
equipment to perform. This, along with the need to fabricate chips on a large scale, could
increase the initial cost and time investment in adaptations of the techniques to a large
scale. The full on-chip assay structure holds promise both in terms of assay sensitivity
and rapid analysis. However, in order to produce a truly optimized assay these
considerations must be balanced to afford a test capable of interrogating any biological
sample of interest, regardless of the targets’ physiological concentration.
3.2.4 Other Techniques
Several studies have employed micro- or nanoparticles in creative ways that do
not fit into one of the above categories. These include rapid analyses where particles are
spiked directly into a sample for target quantification [3], protein-functionalized
microparticles capable of electrostatic self-assembly [46,47], and fluorescent microbeads
that employ simple detection methods [48]. These varied techniques hold individual
advantages specific to their applications. Some have been tailored for the rapid analysis
of target compounds, while others have been simplified to allow ease of use. The
preeminent disadvantage associated with the assays described below is their vast
differences from other microbead assays, requiring large adaptations in the average
laboratory for widespread implementation.
In the study by Ranzoni et al., a new technology based on magnetic nanoparticles
in a pulsed magnetic field was investigated [3]. This method uses a small spike of
nanoparticle probing reagent, pre-coated with monoclonal antibodies, which is directly

78
injected into a sample. The particles are free to move within the sample to capture antigen
without the presence of a magnetic field. By introducing a pulsed magnetic field the
particles are concentrated and allowed to form clusters mediated by biomarker-induced
inter-particle binding. These clusters are then detected by applying magnetic rotation
frequencies and using optical scattering to determine cluster size, which correlates with
antigen concentration.
Using this technique, after only one reagent addition step, an assay can be
performed in a total time of 14 minutes. Using this scheme prostate specific antigen
(PSA) was detected to a limit of 13.6 – 17 pg/mL in plasma. This format allows for the
sensitive and rapid quantification of a single analyte, in a format greatly simplified
compared to ELISA testing. The analysis of multiple compounds would depend on the
specificity of antibodies, comparable to FMIA. It would also require detection to be
altered so that clusters possessing different targets may be identified without the addition
of sophisticated analysis equipment.
Another study based on the manipulations of magnetic microparticles was
described by Afshar et al. in the development of a microfluidic magnetic actuation system
that allows the 3D focusing of magnetic beads for agglutination assays [49]. The system
was designed with a magnetic microtip, used as a field concentrator, to focus magnetic
beads in a microchannel. A single lateral sheath flow positions and aligns individual
beads in the center of the flow. This allows a small number of beads to be counted in an
observation window by automated image reading. Having the individual beads 3-
dimensionally focused in the flow center allows reliable counting of single beads versus
agglutinated bead doublets which allows biotinylated bovine serum albumin (bBSA)
79
concentrations to be determined. It was demonstrated that bBSA could be detected to 400
pg/mL (6 pM) with the fully on-chip assay in about 20 minutes with the consumption of 2
µl sample. This format, while rapid, would be difficult to multiplex due to the
quantification of signal arising from the counting of aggregate numbers.
As an alternative to the use of magnetic beads, the Gijs group contributed several
immunoassay articles investigating electrostatically self-assembled micropatterns
performed on-chip [46,47]. Electrostatic forces were used to mediate bead self-assembly
in a channel formed by reversibly sealing PDMS onto an (aminopropyl)triethoxysilane
(APTES) patterned glass substrate. As opposed to external magnets which create dense
bead plugs on-chip, the fabrication of positively-charged APTES-patterns results in low
fields where beads align. This allows the formation of self-assembled chains that are
stable during both flow-based and static incubation steps. Performing the immunoassay
in stop-flow mode, where the channel is sequentially filled and incubated with sample
and reagents afforded IgG was quantification to a lower limit of 15 ng/mL in 30 minutes
using 560 nL of sample.
A second contribution investigated the effect of continuous-flow versus stop-flow
conditions for the assay [46]. The results show that mouse Antigen (m-Ag) could be
detected under continuous flow to a limit of 250 pg/mL, representing roughly a 60-fold
improvement over stop-flow limits and requiring only 10 minutes to perform. This
procedure was performed using 1.3 µl. The advantage of reduced analysis time is
afforded using continuous flow because diffusion associated depletion of analyte around
the bead chains does not occur as observed under stop-flow conditions. This allows more
analyte to be successfully captured onto beads in a short time span, analogous to analyte

80
capture in affinity chromatography utilized during protein purification. Additionally, high
specificity antibodies allowed for two-analyte detection on a single chip. In both cases the
rapid analysis and small sample size provide advantages as compared to ELISA without
sacrificing the limit of detection. By decreasing the flow rate, thereby increasing analysis
time, the second assay could potentially reach a more sensitive limit of detection. This
would maintain its advantage of small sample requirements and rapid analysis while
increasing its ability to compete with more sensitive analysis techniques.
Several studies employed simple polystyrene spheres in unique ways to produce
fluorescent signals. In the study by Fu et al., a bead-trapping/releasing flow cell for a
fluidic assay was developed [50]. This device integrated a pillar-array and pneumatic
valve to provide flow injection/sequential injection analysis. Using the valve, beads could
be manipulated in the device to perform the immunoassay in ten minutes with a detection
limit of 0.80 ng/mL for 3,4,6-trichloropyridinol (TCP) using a competitive assay format
and 15 µl of sample. This assay could later be altered to perform a noncompetitive assay,
which would improve the sensitivity but increase the time required for analysis. Even
with these alterations, the current detection method does not lend itself easily to
multiplexing and would have to be altered to distinguish between signals arising from
different compounds in order to quantify multiple antigens in parallel.
A second example of polystyrene microsphere use is the cross-talk-free duplex
FIA for the simultaneous detection of carcinoembryonic antigen (CEA) and neuron
specific enolase (NSE) described by Cao et al [14]. A sandwich immunoassay was
developed using multiple quantum dots as detection elements, which yield a tunable,
symmetrical, and narrow emission band. Each color QD conjugate was capped by a

81
capture antibody, and polystyrene microspheres (PSM) brought antibodies proximal to
the QD surface in a diffusion-driven incubation, allowing both antigens to be specifically
identified simultaneously to a limit of 0.625 ng/mL, which is comparable to many
methods using long incubation durations. The assay requires incubation times analogous
to ELISA, but could be further multiplexed depending on the specificity of antibodies
employed.
Finally, employing intrinsically fluorescent beads in a unique way, a fluoro-
microbead guiding chip (FMGC)-based sandwich immunoassay for the quantification of
biomarkers was investigated by Song et al [48]. The FMGC consists of four
immunoassay regions, each containing five gold functional surfaces to support five
identical tests performed simultaneously with the quantification of four separate analytes
in parallel. The gold surfaces were conjugated to capture antibodies to create a sensing
surface, where capture of both antigen and detection antibody was diffusion-driven.
Using fluoro-microbeads conjugated to antibody and a fluorescent microscope, a
sandwich immunoassay was performed and antigen concentrations determined directly
by counting microbeads immobilized on the immunosensing regions. In an assay time of
less than one hour cardiac troponin I (cTnI) could be quantified in a range from 0.1-100
ng/mL. With the addition of agitation or convective mixing to increase sample capture
and improve sensitivity, its time advantage over ELISA may be maintained.
As illustrated in the sections above, the immunoassay applications achieved using
both magnetic and non-magnetic particles as a solid support are diverse. These assays
have been tailored to meet the needs particular to their use, which may be increased assay
speed, sensitivity, or simplicity of operation. In general, assays that achieved rapid

82
analysis suffered from limitations in sensitivity. However, assays have not been produced
which optimize the relationship between assay speed and ability to detect biomolecules
with diverse physiological concentrations. Work done to improve this relationship may
be the most promising avenue toward reaching a truly optimized micro-immunoassay,
owing to the other advantages inherent to microparticle solid supports such as ease of
manipulation, small sample size, and the straightforward coupling to advanced signal
processing methods.
3.3 Signal generation by flow conditions
A second major area of interest in micro-immunoassay applications involves
those based around the use of flow conditions to produce a quantifiable signal. In this
section assays employing microcolumns [51,52] and immobilization on channel walls
[53], where target quantification is achieved by the release and flow of a signal-
generating agent to a detector, will be discussed. This format has the advantage of
allowing rapid quantification times with small sample requirements. Additionally, it is
easily adapted to quantify different analytes. However, these assays are limited to a
singleplex format and each antigen would require a unique column.
The Hage group from the University of Nebraska has contributed significantly to
this area since 2008 [51,52]. One recent study introduced a reverse displacement
immunoassay (RDIA) that generates signal by the analyte displacement of a label from a
small immobilized analog column [52]. When a complex is formed between analyte and
label, a displacement peak is created and the signal is measured allowing analyte
quantification (Figure 3.3). Results show the lower limit of detection for RDIA to be
around 67µg/mL (27-29 pmol) and the upper limit 400 µg/mL (160-200 pmol) for a 20 µl
83
sample of mouse IgG Fab1. The total assay analysis time is less than ten minutes, with
signal generation occurring within 20-30 seconds after sample application to the column.
This rapid analysis, which offers a pronounced time advantage over ELISA, is afforded
because no pre-incubation of the sample with label is required. While this assay is limited
to a singleplex format, it can be applied to any analyte where an appropriate label and
immobilized analog are available or can be generated. Although sensitivity of the assay
may be improved by using a larger sample volume, this format is not competitive with
those employing incubation steps between sample and detecting agent.

84
Figure 3.3. Scheme for a reverse displacement Immunoassay. Reprinted with permission
from [22] © American Chemical Society (2011).
A second contribution made by this group analyzed the binding and elution of
target compounds from IAC/HPIAC (immunoaffinity chromatography/high performance
immunoaffinity chromatography) columns in order to understand both association and
dissociation efficiencies [51]. Using this format a variety of detection schemes can be
used to obtain kinetic and binding information, including fluorescence, mass

85
spectrometry, and absorbance. The insight gained from this study can be valuable in the
design of future solid-phase immunoassays.
A more sensitive flow based assay was described by Liu et al. who published on
the development of a poly(methylmethacrylate) (PMMA) microfluidic chip coupled to
electrochemical detection for the quantification of α-fetoprotein (AFP) [53]. AFP
antibody is immobilized on the poly(ethyleneimine) (PEI)-derived PMMA surface. After
antigen and horse radish peroxidase (HRP)-conjugated AFP antibody bind sequentially in
the channel, a three-electrode electrical system at the microchip outlet records the
reduction in the H2O2 current response. Results show a linear response between 1-500
pg/mL with a 1 pg/mL detection limit requiring minimal use of sample in a time of 40
minutes. Although it requires minimal sample and achieves sensitive quantification in
under an hour, the assay is not easily adaptable to the analysis of multiple analytes in
parallel.
Theoretical work to assist in predictions of device performance was conducted by
Sinha et al [54]. A comprehensive model was created to characterize interactions during a
flow-through immunoassay. Findings may help provide a rational basis for determining
operating conditions in microfluidic IMS devices.
These immunoassays share the ability to achieve the rapid quantification of
analytes using minimal sample volumes. This rapid analysis is made possible by the
ability to perform the assay without sample pre-incubation steps. The sensitivity of these
rapid tests is comparable to many immunoassays employing much longer incubation
times [14,41,44], and are easily adaptable to quantify any target compound. However,

86
since detection is dependent on the measurement of a displacement peak composed of
label and antigen, multiplexing this assay format would be challenging.
3.4 Use of a static solid support to trap antigen and generate signal
The use of a solid support provides certain advantages, including the
straightforward ability to multiplex and sensitive limits of detection. In this area of
research many variations on this traditional “static well” format have evolved. This
section discusses techniques that employ antibodies patterned on PDMS [6,7] or in
capillary systems [15], as well as antibody microarrays [55], and novel techniques that
employ static detection like the surround optical fiber immunoassay (SOFIA) [5] or
oligonucleotide-linked immunosorbent assay (OLISA) [56]. These assays offer the
advantage of easy and direct multiplexing, often accomplished by the patterning of
capture antibodies on a static surface. Many of the assays also offer sensitive limits of
detection, owing to long incubation times. The long incubations allow time for sample to
interact with antibodies by diffusion, but put a limitation on the potential throughput or
ability to track changes in protein levels over time using serial measurements.
Since 2008 many groups have developed new technologies centered around the
traditional static solid-phase immunoassay. The Delamarche group from Switzerland has
made multiple contributions in this area [6,15]. In one study, the patterning of capture
antibodies (cAbs) on PDMS in order to be compatible with capillary systems (CSs) was
described [6]. Once cAbs are patterned, the PDMS block is placed on CSs with cAbs
oriented perpendicularly to the reaction chambers which produces well-defined areas for
analyte capture from solution. These small patterned areas allow one-step fluorescent
imaging of all analytes, and the fast reaction is permitted by confining sample to a minute

87
space as it flows over capture zones. The capillaries allow multiple analytes to be
detected from small samples (1 µL or less). This produces a “micro-mosaic assay” with
the potential for 96 test sites if used with a chip having six independent reaction
chambers. Results show that CRP could be detected to a sensitivity of 0.9 ng/mL in 11
minutes using only 1 µl of sample. While already comparable in sensitivity to ELISA
with a much smaller sample and shorter assay duration, the sensitivity of these assays
may be further improved by coupling the detection to signal-amplification methods.
In a second contribution the group described a one-step immunoassay using
capillary systems [15]. The assay is based on the preloading of freeze-dried detection
antibodies (dAbs) into the analyte flow path. After antibody reconstitution and analyte
addition, fluorescence detection can be performed downstream on patterned capture
antibodies. Results show that within ten minutes analyte concentrations with a lower limit
of 3µg/mL could be detected. After 25 minutes of total assay time a decrease in the
background noise-(resulting from the decay of unbound dAbs)- allowed concentrations
down to 1 µg/mL to be observed. This single-step assay reduces handling overhead for
the end-user. Although this assay possesses a higher limit of detection and an equal or
longer assay time than the previous work, this study suggests that the positive aspects of
CSs previously exploited could potentially be achieved in a one-step immunoassay.
The fluorescent one-step immunoassay platform was further studied by Ruckstuhl
et al [57]. In this contribution a system of polymer test tubes with fluorescence collection
optics was utilized along with a compact fluorescence reader. The detection technology,
based on supercritical angle fluorescence (SAF), allows for the real-time monitoring of
surface reactions. Because the intensity of the signal decays exponentially with the

88
distance from the boundary, surface-selective detection is achieved providing a sensitive
readout for immunoassays. In an assay time of only 13 mintues, IL-2 could be quantified
with a linear response down to 4.5 pg/mL using a sample volume of 40 µl. This
represents advantages compared to the traditional ELISA format, which requires four
hours and 100 µL to give a limit of detection of 4 pg/mL, but presents an analogous
limitation in terms of multiplexing. The assay, currently taking place in disposable test
tubes, may be adapted to a well-plate format but will remain limited to the analysis of one
compound per sample.
Other static solid-phase assays produced based on the traditional format continue
to employ 96 well micro-titer plates as incubation chambers. Chang et al. reported on the
development of SOFIA, which uses 96 well plates for incubations, consuming volumes
analogous to commercial ELISA methods [5]. Analysis takes place in a singleplex format
using specially designed equipment. Samples are placed in a 100 µl microcapillary and
excited in a detection unit by focusing temporally modulated light along the capillary’s
axis. After light is focused into a single optical fiber and coupled to a low noise photo-
voltaic diode, detection takes place using phase sensitive detection employing a lock-in
amplifier. The sensitivity was tested using Rhodamine Red and results show a 0.1
attogram limit of detection. Prion proteins from varying species were also investigated
and found to have a limit of detection >10 attograms from a sample volume of 100 µl and
requiring long incubation times. While this assay offers superior sensitivity and the
ability to multiplex, long incubation times and highly specialized equipment increase
assay costs and limit sample throughput.
89
Work done by Han et al. also made use of a 96 well plate to develop a creative
variation on traditional ELSIA termed OLISA [56]. It is designed based on a detection
antibody tethered to DNA through the incorporation of RNase H mediated signal
amplification. Using a fluorescence platform, the limit of detection for OLISA was
around 1 ng/mL using 100 µl of sample. This is comparable to the analogous ELISA,
although slightly less sensitive. Detection antibodies employing different
fluorophore/quencher pairs are employed that have independent spectral ranges for
excitation and emission. This allows up to ten analytes to be interrogated in a single
sample without signals arising from separate analytes interfering in the quantification of
each compound. While this allows multiple analytes to be interrogated from a single
sample, sensitivities are not improved relative to ELISA and incubation times, along with
sample volumes, remain the same. Adaptations to the 96-well plate to allow nano-scale
read volumes were achieved by the use of Siloam technology [58]. Incorporation of a
spiral microchannel into each well of a microplate allows samples to be reduced to 5-10
µL and the washing to be reduced while mirroring the standard ELISA steps. The
sensitivity of this commercial format is in line with that for OLISA and ELISA (around 1
pg/mL), but is accomplished in a time frame of 90 minutes and can accommodate
multiple repeat samples to the same well to increase detection.
The static solid-support format has also been used to develop a fully automated
ELISA on a portable disc-based format in work done by Lee et al [59]. In this unique
alternative to typical disc systems, fluid transfer occurs through ferrowax microvalves
created using low intensity laser light to melt paraffin wax embedded in iron oxide
nanoparticles. The paraffin valves allow the full integration of the immunoassay on-disc

90
starting with a sample of whole blood. The assay is not limited in its number of steps as
typically is seen with lab-on-a-disc systems where increasing spin speed is employed for
sample transfers. With each disc having three identical units, multiple assays may be
performed simultaneously in 30 minutes. The assay speed is afforded by disc rotation
while sample is in the mixing chambers with reagents. This allows the assay to overcome
time hurdles associated with diffusion-dependent incubations. Using 150 µl of whole
blood, results show detection limits for anti-hepatitis B (anti-HBs) and hepatitis B antigen
(HBsAg) of 8.6 mIU/ml and 0.51 ng/mL, respectively. This represents limits of detection
comparable with ELISA using half the sample size and an assay time with one-fourth the
duration. While this device is portable and disposable, assays are limited to the detection
of three compounds simultaneously. This, coupled with the need to produce new devices
for each assay may result in high costs associated with fabrication. This assay shares
similar qualities to the commercially available Gyrolab, which is a completely integrated
immunoassay system [60]. Here, 10 µL samples are loaded onto a special compact disk
which, through centrifugal force, is pushed into nano-scale channels containing
streptavidin-coated bead columns used to trap the immunocomplex. While quantification
may take place in one hour, this format is limited to serial measurements and has high
costs associated with specialized instrumentation and a single source of reagents.
As an alternative to expensive and complicated fabrication processes associated
with many static immunoassays, a low-cost micro-chip based fluorescent immunoassay
was presented by Shao et al. for IgG detection [10]. The chip design is composed of four
X-direction channels and one Y-direction channel to form four designated reaction zones
(DRZ, Figure 3.4). Areas between the zones were used as negative controls, where no

91
obvious fluorescence was observed. Results show a limit of detection for IgG to be 5
ng/mL from a 10 µl sample, but this method requires long incubation times. These
incubation times (1 hour per step) were required because no agitation or mixing
accompanied reaction steps, which were accomplished by diffusion after the initial
channel filling. With times comparable to ELISA, this assay requires only one-tenth the
sample volume to achieve analogous limits of detection. The same design could be used
for the monitoring of multiple analytes with the possible integration of more DRZs
without additional technical complexity.
Figure 3.4. On-chip immunoassay protocol. Initially flowing coating antibody and
blocking reagent through channel Y prepares the DRZs for the addition of analyte
through the independent X channels. A reporting antibody can be delivered to each DRZ
by addition through the Y channel, producing four independent DRZs, having negative
controls present in the Y channel between reaction zones. The DRZs are prepared by (A)
exposing channel Y to a coating antibody and (B) BSA as a blocking agent. (C) After
sample addition through each X channel, (D) a reporting antibody can be delivered to
each DRZ by addition through the Y channel. This produces four independent DRZs with
negative controls present in the Y channel between reaction zones. DRZ: Designated
reaction zones.
Although detection took place on a static printed array, Lian et al. describe the use
fluorescent nanoparticles (NP) to produce a NP-labeled microarray [55]. In order to
92
perform a multiplexed assay on the same slide, multiple blocks of capture antibodies
were printed as subarrays. After incubation and wash steps occurring at room temperature
as well as at 4°C for long time spans (two hours to overnight), select bioterrorism agents
could be detected down to 10 pg/mL using 100 µl of sample over the entire array. The
detection limits here represent roughly 100-fold improvements over fluorescent ELISA
protocols used previously and require minimal sample use. However, equal or longer
incubations are necessary which would limit assay throughput and the ability to make
serial analyses.
While most static solid-support assays require long incubation times to complete,
Li et al. reported on a pre-functionalized PDMS microfluidic chip in an effort to produce
an ultrafast heterogeneous immunoassay [7]. Using an antigen-antibody reaction time of
5 minutes, the study found that blocking time had very little effect on the signal-to-noise
ratio observed. This implies that nonspecific adsorption is reduced by short
immunoreaction times. Results show a limit of detection for IgG of 600 ng/mL in an
overall assay time of 19 minutes, while requiring only 10 nl of sample. This assay also
offered the ability to quantify 5 analytes in parallel on a single chip. This assay boasts the
advantage of completing analysis six times faster than ELISA using one-tenth the sample
volume. Since incubation steps are currently defined by diffusion, detection limits may be
improved by the introduction of agitation during sample reactions. With the ability to
more sensitively quantify many compounds in parallel using small sample volumes and
short assay durations, this assay would be competitive with the most optimized formats
currently employing mobile solid phases.

93
With an emphasis on assay sensitivity as opposed to rapid quantification, Lee et
al. presented a sensitive total internal reflection fluorescence microscopy (TIRFM)
system for the detection of TNF-α on a nanoarray protein chip [17]. Using a homemade
experimental system, TNF-α was successfully observed at a concentration of 0.13 fg/mL
using a 50 µl sample. The total assay time took two hours to complete, following the
preparation of capture protein probe and sample. The assay affords a comparable assay
duration to ELISA, but employs half the sample. Although it offers a highly sensitive
assay that could be reasonably adapted to quantify multiple analytes, the assay requires
sophisticated and specialized equipment.
While most static support immunoassay systems employ fluorescence detection,
the Ju group investigated chemiluminescent immunoassay platforms for the near-
simultaneous detection of two analytes, CEA and AFP [61,62]. In the first study a
modified glass tube with immobilized anti-CEA antibody was incubated with a mixture
of the two antigens, their HRP-conjugated detection antibodies, and anti-AFP
immobilized on paramagnetic particles [61]. After immunocomplexes were formed, AFP
could be separated into an unmodified glass tube. Following separation, near-
simultaneous detection with the aid of an optical shutter could be performed. Results
show detection limits for CEA and AFP of 0.6 and 0.89 ng/mL from 10 µL of sample,
with negligible cross-reactivity, respectively. A later study, based on a system of series-
wound immunosensing channels (SWIC), was performed on the same target antigens
[62]. With a procedure similar to the one reported previously, the immunoassay could be
completed in 27 minutes using 15 µl of sample. Here, the limits of detection for CEA and
AFP were reduced to 0.39 and 0.41 ng/mL, respectively. Both assays afford the

94
advantage of reduced assay duration and sample volume while maintaining comparable
limits of detection to reference methods.
Many of the assays discussed in this section require relatively long incubation
times and moderate sample volumes. These requirements are similar to those for micro-
cantilevers, which offer novel detection modes using elegant physics [63,64]. While
simple to operate and capable of attaining clinically relevant sensitivities (0.1 ng/mL),
these methods require long incubations and large sample volumes (100 -200 µL).
Additionally, due to the detection platform they appear restricted in their ability to adapt
to a multiplexed format, limiting their practical utility in diagnostic immunoassay
applications.
While many of the methods discussed here have long incubation requirements, in
cases where incubation times may be reduced through agitation or mixing this format
remains competitive with the on-chip assays utilizing magnetic solid supports. They offer
the advantage of straightforward multiplexing and sensitive sample quantification, mostly
without introducing complicated reaction processes or detection systems. While currently
competitive with mobile solid-support formats these assays rely heavily on detection
through static fluorescence measurements. This limits their ability to be coupled with
advanced signal processing mechanisms and may restrict their capacity to quantify target
compounds at the low end of the physiological range.
3.5 Concluding Remarks
Looking at the literature over this time span, a large number of publications
focused on the use of a mobile solid phase, especially those utilizing magnetic micro- or
nanoparticles. This emphasis evolved from the ease of manipulation through the

95
introduction of magnetic forces that allowed for simple wash steps to be performed
during the assay. In designs executed entirely on-chip, it also allowed flow conditions to
be used for sample and reagent introduction, which drastically cuts overall assay time
requirements. While this group of assays have primarily been evaluated in a single-
analyte format, alterations allowing analysis of multiple compounds in parallel are
straightforward and would not detract from sensitivity. In terms of attaining a fully
optimized assay, fully on-chip immunoassays employing magnetic solid supports reduced
sample size and time requirements while using simple detection methods and maintaining
ease of use. The sensitivity achieved by methods with long incubation times could
potentially be reached using convective mixing or slow flow rates to minimize the
depletion-layer surrounding the solid surface, all while maintaining rapid analysis. To
tailor assays for clinical use techniques must balance incubation durations and limits of
detection. In addition, compatibility with the signal processing methods demonstrated to
improve detection limits to reach superior sensitivity is ideal to and achieve a fully
optimized micro-immunoassay [4,5,21].
Another broad area of research is that using fluorescent microbeads as a solid
support, predominantly in the area of FMIA, which has been used successfully to detect
up to ten analytes simultaneously with clinically acceptable levels of sensitivity. This
approach is obviously useful, as it provides information about multiple analytes in the
same sample volume as one traditional assay and could theoretically be used to detect up
to 100 compounds in a single run. However, its ultimate limitation is the specificity of
antibodies used, and the cross-reactivity this produces between different targets. This
could put a practical limitation on the number of compounds quantified simultaneously.

96
Adaptions to testing for different analytes, while entirely possible, will require intensive
assay development to ensure that singleplex assays for each compound give equivalent
results to the multiplex assay used diagnostically. Additionally, due to the diffusion-
mediated incubations, long assay durations are required to achieve acceptable limits of
detection and this format is not readily capable of coupling to sophisticated signal
processing methods. Nonetheless, in terms of practical immunoassay requirements these
tests can achieve the required level of multiplex capabilities and offer reasonable limits of
detection (ng/mL to pg/mL) for most analytes.
Finally, the micro-mosaic assays offer the advantage of easy multiplexing and
simple fabrication. They also produce low limits of detection, although they require
moderate sample volumes and long incubation times resulting from the diffusion-
mediated sample adsorption required using this format. Similarly, the flow-through
assays allow simple sample analysis. These assays also produce rapid results using
moderate sample volumes. However, unlike the micro-mosaic assays they do not lend
themselves easily to multiplexing.
3.6 Future Perspectives
While many of the assay formats described here were successful in improving
upon one or more of the areas required for developing an optimized clinical test, none
have been able to fully reach that mark. Today, the same issues challenging
immunoassays development remain. These issues consist of finding the appropriate
balance between rapid analysis and sensitivity using techniques capable of coupling to
signal processing methods, which may enhance detection limits. New techniques, in
addition to consuming limited quantities of sample, should be currently capable of, or

97
easily adaptable to, multiplexing without the requirement for highly specialized detection
equipment. While various techniques have their specific advantages, a combination of
aspects from multiple approaches appears to hold the greatest promise if a truly
optimized assay is to be found.
With an increased understanding of reaction principles and conditions leading to
superior sensitivity, immunoassay techniques continue to improve and progress toward
optimization. Additionally, the now more familiar process of microfabrication enables the
realistic implementation of many on-chip methods through large scale photolithographic
or injection mold production. In this arena techniques will benefit from simple chip
designs to ensure technical reproducibility. More development on this front over the next
few years is poised to provide immunoassays well-tailored to their specific needs, which
may be rapid analysis of samples taken on-site, or the ability to detect minute fluctuations
in biomarkers over time indicative of disease states.
3.7 References
[1] Engvall E, Jonsson K, Perlmann P., Biochimica et Biophysica Acta. 1971, 251,
427-434 .
[2] Hahn YK, Park JK., Lab Chip. 2011, 11, 2045-2048.
[3] Ranzoni A, Sabatte G, van Ijzendoorn LJ, Prins MWJ., ACSnano. 2012, 6,
3134-3141.
[4] Mahanti P, Taylor T, Hayes MA, Cochran D, Petkus MM., Analyst. 2011, 136,
365-373.
[5] Chang B, Gray P, Piltch M, et al., J. Viro. Met. 2009, 159, 15-22.
[6] Ziegler J, Zimmermann M, Hunziker P, Delamarche E., Anal. Chem. 2008, 80,
1763-1769.
98
[7] Li P, Abolmaaty A, D’Amore C, Demming S, Anagnostopoulos C, Faghri M.,
Microfluid Nanofluid. 2009, 7, 593-598.
[8] Peyman SA, Iles A, Pamme N., Lab Chip. 2009, 9, 3110-3117.
[9] Sasso LA, Under A, Zahn JD., Microfluid Nanofluid. 2010, 9, 253-265.
[10] Shao G, Wang J, Li Z, Saraf L, Wang W, Lin Y, Sensors and Actuators B.
2011, 159, 44-50.
[11] Do J, Ahn CH. , Lab Chip. 2008, 8, 542-549.
[12] Langenhorst RJ, Lawson S, Kittawornrat A, et al., Clin. Vacc. Immunol. 2011,
19, 180-189.
[13] Lawson S, Lunney J, Zuckermann F, et al., Vaccine. 2010, 28, 5356-5364.
[14] Cao Z, Li H, Lau C, Zhang Y. , Analytica Chimica Acta. 2011, 698, 44-50.
[15] Zimmermann M, Hunziker P, Delamarche E., Biomed. Microdevices.2009, 11,
1-8.
[16] Pesce AJ, Michael JG., J. Immunol. Met. 1992, 150, 111-119.
[17] Lee S, Cho NP, Kim JD, Jung H, Kang SH, Analyst. 2009, 134, 933-938.
[18] Vignali DAA.,. J.Immunol. Met. 2000, 243, 243-255.
[19] Allinson JL., Bioanalysis. 2011, 3, 2803-2816.
[20] Verch T, Bakhtiar R., Bioanalysis. 2012, 4, 177-188.
[21] Hayes MA, Petkus MM, Garcia AA, Taylor T, Mahanti P., Analyst. 2009, 134,
533-541.
[22] Watson DS, Reddy SM, Brahmakshatriya V, Lupiani B., J. Immunol. Met.
2009, 340, 123-131.
[23] Kellar KL, Douglass JP., J. Immunol. Met. 2003, 279, 277-285.

99
[24] Clavijo A, Hole K, Li M, Collignon B., Vaccine. 2006, 24, 1693-1704.
[25] Ravindran R, Khan IH, Krishnan VV, et al., J. Immunol. Met. 2010, 363, 51-59.
[26] Svateck RS, Shah JB, Xing J, et al., Cancer. 2010, 116, 4513-4519.
[27] Smith J, Samons D, Robertson S, Biagini R, Snawder J., Toxic. Mech. Meth.
2010, 20, 587-593.
[28] Kuriakose T, Hilt DA, Jackwood MW. , Avian Diseases. 2012, 56, 90-96.
[29] Pochechueva T, Chinarev A, Spengler M, et al., Analyst. 2011, 136, 560-569.
[30] Ji XH, Cheng W, Guo F, et al., Lab Chip. 2011, 11, 2561-2568.
[31] Talat N, Shahid F, Perry S, et al., Cytokine. 2011, 54, 136-143.
[32] Bin Z, Ke W, Jian J, et al., Food. Anal. Meth. 2011, 4, 228-232.
[33] Cauchon E, Liu S, Percival MD, et al., Anal. Biochem. 2009, 388, 134-139.
[34] Li Z, Zhang QY, Zhao LX, et al., Sci. China. Chem. 2010, 53, 812-819.
[35] Sista RS, Eckhardt AE, Srinivasan V, Pollack MG, Palanki S, Pamola VK., Lab
Chip. 2008, 8, 2188-2196.
[36] Lacharme F, Vandevyver C, Gijs MAM. , Microfluid Nanofluid. 2009, 7, 479-
487.
[37] Dupont EP, Labonne E, Vandevyver C, Lehmann U, Charbon E, Gijs MAM.,
Anal. Chem. 2010, 82, 49-52.
[38] Kim JI, Wang C, Kuizon S, et al., Neuroimmunol 2005, 158, 112-119.
[39] Proczek G, Gassner AL, Busnel JM, Girault HH., Anal. Bioanal. Chem. 2012,
402, 2645-2653.
[40] Lacharme F, Vandevyver C, Gijs MAM. , Anal. Chem. 2008, 80, 2905-2910.

100
[41] Piao Y, Jin Z, Lee D, et al., Biosens.Bioelectron. 2011, 26, 3192-3199.
[42] Soh N, Tanaka M, Hirakawa K, et al., Anal. Sci. 2011, 27, 1069-1076.
[43] Gao D, Li HF, Guo GS, Lin JM., Talanta. 2010, 82, 528-533.
[44] Chen H, Abolmatty A, Faghri M., Microfluid. Nanofluid. 2011, 10, 593-605.
[45] Squires TM, Messinger RJ, Manalis SR., Nat. Biotechnol. 2008, 26, 417-426.
[46] Sivagnanam V, Song B, Vandevyver C, Gijs MAM., Anal. Chem. 2009,81,
6509-6515.
[47] Sivagnanam V, Bouhmad A, Lacharme F, Vandevyver C, Gijs MAM.,
Microelectron. Eng. 2009, 86, 1404-1406.
[48] Song SY, Han YD, Kim K, Yang SS, Yoon HC., Biosens. Bioelectron. 2011,
26, 3818-3824.
[49] Afshar R, Moser Y, Lehnert T, Gijs MAM., Anal. Chem. 2011, 83, 1022-1029.
[50] Fu Z, Shao G, Wang J, Lu D, Wang W, Lin Y., Anal. Chem. 2011, 83, 2685-
2690.
[51] Pfaunmiller E, Moser AC, Hage DS., Methods 2012, 56, 130-135.
[52] Schiel JE, Tong Z, Sakulthaew C, Hage DS., Anal. Chem. 2011, 83, 9384-9390.
[53] Liu Y, Wang H, Huang J, Yang J, Liu B, Yang P., Anal. Chim. Acta 2009, 650,
77-82.
[54] Sinha A, Ganguly R, Puri IK., J. Appl. Phys. 2010, 107, 034907-1-034907-6.
[55] Lian W, Wu D, Lim DV, Jin S., Anal. Biochem. 2010, 401, 271-279.
[56] Han KC, Ahn DR, Yang EG., Bioconjugate Chem. 2010, 21, 2190-2196.
[57] Ruckstuhl T, Winterflood CM, Seeger S., Anal. Chem. 2011, 83, 2346-2360.

101
[58] Kai J, Puntambekar A, Sehy D, Brescia P, Banks P, Gen. Engineer. Biotechnol.
News. 2011, 31, 26-27.
[59] Lee BS, Lee JN, Park JM, et al., Lab Chip. 2009, 9, 1548-1555.
[60] Roman J, Qiu J, Dornadula G, et al., J. Pharm. Toxic. Meth. 2011, 63, 227-235.
[61] Yang Z, Liu H, Zong C, Yan F, Ju H., Anal. Chem. 2009, 81, 5484-5489.
[62] Yang Z, Zong C, Yan F, Ju H., Talanta. 2010, 82, 1462-1467.
[63] Xue C, Zhao H, Liu H, et al., Sens.Actuators B. 2011, 156, 863-866.
[64] Tan W, Huang Y, Nan T, et al., Anal. Chem. 2010, 82, 615-620.
Websites
[101] RNase H1Antibody (5D10). www.novusbio.com/H00246243-M01

102
CHAPTER 4
OFF-CHIP MAGNETIC MICROBEAD IMMUNOASSAY FOR THE
DETECTION OF MYOGLOBIN, CARDIAC TROPONIN, AND FATTY ACID
BINDING PROTIEN
4.1 Introduction
Due to their high sensitivity, biosensors have become a popular diagnostic tool for
both early and rapid disease detection. Rapid detection is particularly important in cases
of acute myocardial infarction (AMI) where prompt diagnosis is crucial for patient
survival. The biomarker targeted by the biosensor is of key importance and the
characteristics an ideal cardiac marker have recently been defined [1]. These include both
the rapid release of the biomarker into the blood for early detection and prolonged
elevation for later assessment and confirmation, along with the quantitative assay
possessing a high clinical sensitivity and specificity. The American College of
Cardiology (ACC) and the American Heart Association (AHA) currently recognize a
biomarker panel composed of myoglobin, cardiac troponins (cTnI), and creatine kinase
MB (CK-MB) for the diagnosis of AMI [2,3]. However, because CK-MB has a low
sensitivity for AMI within six hours after an incident and cTnI is better at detecting minor
cardiac damage, it was not evaluated in this study [2]. Instead, heart-type fatty acid
binding protein (H-FABP) was included due to its early release following cardiac injury
and potential when used as part of a panel with cTnI [4-7].
Myoglobin is an oxygen-binding protein found in both cardiac and striated
muscle, and is currently used as a routine biomarker for AMI [8,9]. Its early release into
the blood (increasing 1-3 hours within the onset of myocardial necrosis), as well as

103
relatively high plasma reference concentration (34 µg/L) illustrate several of the qualities
desired in an ideal cardiac marker [9]. However, because it may also indicate skeletal
muscle damage, by itself myoglobin has shown a sensitivity of 75.9%, and a clinical
specificity of only 25.0% for AMI diagnosis. In recent years H-FABP has also shown
promise as an early cardiac injury marker in plasma [4,7,10,11]. Owing to its lower
concentration in skeletal muscle compared to myoglobin, rapid release into circulation,
and potential to predict patient prognosis, H-FABP has received considerable attention
[5-7,12,13]. Still, due to its release in other medical conditions, H-FABP alone shows
only a 64% sensitivity [5,14]. While no single marker has shown adequate diagnostic
accuracy for AMI, a high sensitivity and specificity has been achieved using myoglobin
and H-FABP as part of a biomarker panel along with cTnI [5,8,10,12,14-16]. Even using
biomarker panels, there still exists a need for more sensitive assays capable of analyzing
multiple markers in a short time enabling serial measurements to be practically evaluated
in a clinical setting. This capability would be beneficial not only in the diagnosis of AMI,
but for the early detection of many diseases which could greatly improve prognosis.
Over the last few years a great deal of research has been devoted to the
development of micro-immunoassay platforms allowing for the sensitive quantitation of
varied target biomarkers [17-25]. A particularly interesting subset of this research
incorporates the use of magnetic micro- or nano-particles as the solid surface employed
for primary antibody fixation and target trapping [26-34]. Use of magnetic particles
permits easy sample manipulation and separation from interfering species, as well as
straightforward coupling to signal amplification and signal processing.

104
This work describes the development of a micro-immunoassay platform allowing
for extremely sensitive quantitation. This system directly and indirectly addresses many
the six metrics of an optimized immunoassay: increased sensitivity, reduced analysis
time, reduced cost, lower sample volumes, ability to multiplex and operational simplicity
[35]. The primary focus of this study is the improvement of quantitative sensitivity for
the assay platform, and emphasis has been placed on optimizing this feature. However,
additional metrics are addressed using this protocol, including the requirement for low
sample volumes and potential to reduce the analysis time. While the studies here are
performed on an AMI biomarker panel composed of myoglobin, cTnI and H-FABP, this
format is easily adaptable to the detection of limitless targets and may be incorporated as
a detection method into a micro-total analysis system (µTAS) for the parallel detection
and quantification of biomarker panels.
4.2 Experimental
4.2.1 Myoglobin Detection Antibody Conjugation to Fluorescein-5-EX, Succinimidyl
Ester
Fifty micrograms (50 µL; 1 mg/mL) of polyclonal rabbit anti-human myoglobin
reconstituted in DI H2O (LSBio, Seattle, Washington) was added to 50 µL of 1 M sodium
bicarbonate in a 1.5 mL capped vial. One milligram of fluorescein-5-EX, succinimidyl
ester (FEXS, Invitrogen) was dissolved in 0.1 mL dimethyl sulfoxide (DMSO) and added
dropwise to the polyclonal antibody (Pab) solution at room temperature. This was reacted
in darkness at room temperature for 3 hours on a stir plate (Corning) and then placed at
4°C to continue the reaction overnight. The crude reaction mixture was added to a
purification column with a 15,000 Dalton molecular weight cut-off (Invitrogen). The

105
fluorescently labeled antibody was separated on-column from unbound dye using 10 mM
PBS with 0.15 M NaCl and 0.2 mM NaN3, pH 7.2 and collected in a single fraction. The
purified FEXS-Pab solution was analyzed for absorbance measurements at 280 and 494
nm (BioTeck Synergy HT Multi-Mode Microplate Reader). These measurements were
used to determine the quantity of antibody present and extent of FEXS conjugation [36].
4.2.2 cTnI and H-FABP Detection Antibody Conjugation to NHS-Fluorescein
250 μg (250 μL; 1 mg/mL) of polyclonal goat anti-human cTnI and 100 μg (100
μL; 1 mg/mL) polyclonal rabbit anti-human FABP were used as purchased in PBS buffer
(cTnI: 0.1% NaN3; FABP: 0.02% NaN3, 0.1% BSA), pH 7.2. NHS-Fluorescein (Thermo
Scientific) was dissolved in DMSO to a concentration of 10 mg/mL and added dropwise
to the Pab solutions at room temperature (24 μL and 40 μL, respectively). This was
reacted in darkness at room temperature for two hours on a shaker (Southwest Science
LabMini MiniMixer). The crude reaction mixtures were added to dialysis cups (Thermo
Scientific) with a molecular weight cut-off of 3,500 Daltons. The labeled protein was
dialyzed in 100 mM PBS with 0.02% NaN3 and 0.1% Tween 20, pH 7.2 overnight. The
dialyzed NHS-Fluorescein-Pab solutions were analyzed for absorbance measurements
utilizing the same method as for anti-human myoglobin Pab.
4.2.3 Preparation of Capture Antibody and Particles
Biotinylated anti-myoglobin Mab (bMab; 100 μL; 1.4 mg/mL; LSBio) was
incubated with 3 μL of BioMag paramagnetic particles having an average diameter of 1.6
μm and ranging in diameter from 1.0-2.0 μm (Quagen, Inc.). The total reaction volume
was diluted to 300 μL with PBS at pH 7.2 containing 5% BSA, 0.1% Tween-20, and
0.1% NaN3. This was incubated for 3 hours on a shaker (Southwest Science LabMini

106
MiniMixer) at room temperature and then stored at 4°C until used. Biotinylated anti-cTnI
Mab (50 μL, 2 mg/mL, LSBio) and biotinylated anti-FABP Mab (45 μL, 2.33 mg/mL,
LSBio) were prepared in the same way.
4.2.4 Sandwich Immunoassays
Purified human myoglobin (7.33 mg/mL) was purchased from MyBioSource,
LLC (San Diego, California). Standards ranging in concentration from 0.62 fg/mL to 25
ng/mL (36 aM to 1.5 nM) were created through serial dilution of the stock myoglobin.
Following sample preparation 30 µL of each Mb standard was mixed with 30 µL of the
bMab-BioMag colloid and incubated at room temperature on a shaker for 1 hour.
Following the incubation, 4 µL of the detection polyclonal antibody-FEXS solution was
added to each sample and incubated in the dark at room temperature for 1 hour with
shaking. After the incubation, samples were washed 3 times using 60 µL of PBS buffer
and then exchanged to a final volume of 30 µL. Three separate 10 μL droplets were
analyzed for each sample, with a total of ten analyses performed for each concentration.
Purified human cTnI (1.07 mg/mL) and H-FABP (2.2 mg/mL) were purchased from Life
Diagnostics (West Chester, Pennsylvania). Standards ranging in concentration from 10
fg/mL to 10 ng/mL (0.42 fM to 0.42 nM) for cTnI and from 1 fg/mL to 10 ng/mL (67 aM
to 0.67 nM) for H-FABP through serial dilution of the initial stock solutions. Following
sample preparation samples were prepared and analyzed in the same way as myoglobin.
4.2.5 Data Collection
Data were collected using an Olympus IX70 inverted microscope with a charge
coupled device (CCD) camera connected to a computer capable of image-capture (Q-
Imaging, Surrey, BC). Capture settings for the CCD camera were optimized for the

107
observation of strong fluorescent signal clusters with minimal contribution from
background pixels through studies utilizing biotinylated fluorescein (Sigma-Aldrich) as a
positive control. Biotinylated fluorescein was chosen as a control due to the strong
binding relationship between biotin and the streptavidin on the BioMag particles and a
common fluorophore with the experimental immunoassays. Offset was adjusted to
minimize background of a washed sample without reducing pixel intensity from signal,
values between −1120 to 440 were tested. With the offset held constant at 100, gain
values between 4.7 to 15.0 were explored to maximize the sensitivity of the assay without
compromising the dynamic range. Optimal image quality was observed at an offset of
100 and gain of 13.8. Once established, capture settings were held constant for all
experiments performed on cardiac targets.
Multiple 10 µL-sized droplets were analyzed for each sample concentration using
a microscope slide having a small hydrophilic zone encompassed by a hydrophobic
Teflon coating (Tekdon Inc., Myakka City, Florida). A cylindrical rare earth magnet (2.5
cm diameter, 0.3 cm thick) placed 2 cm above the droplet was used to generate the
magnetic field (Magcraft, Vienna, VA) and collect structures for ~30s. Supraparticle
structures approximately 15 µm in length were observed. The magnet was secured to a
DC motor by a 7 cm metal shaft allowing for rotation and controlled via a USB 4-motor
stepper controller (Trossen Robotics). The controller was connected to the motor through
a ribbon wire to protect it from fluids used during the experiment. The magnet was
rotated at a constant velocity during assays (30 rpm), and illumination from a mercury
lamp (Olympus) was passed through the appropriate filter cube and a LCPlanFl 40X/0.60

108
objective to excite the assay. Emitted fluorescence was collected using the QIACAM
FAST cooled Mono 12-bit (QImaging) CCD camera and stored as video files.
4.2.6 Data Analysis
Video was analyzed using Image J (National Institute of Health, Bethesda,
Maryland). The images (492 x 396) were captured at an exposure time of ~120 ms (gain,
13.8; offset, 100) which translates to a rate of ~12 frames/s. Fluorescence intensity
measurements were collected by manually selecting all rotors (areas of interest, ROI)
within a video frame and summing the fluorescence intensity. This was performed for ten
randomized frames per video and the resulting intensities were averaged to attain a single
average fluorescence intensity value for a given trial. Ten trials per sample concentration
were averaged per experiment.
4.3 Results and Discussion
4.3.1 Assay Optimization and Protein Detection
Three human cardiac biomarkers, myoglobin, cTnI, and H-FABP, were quantified
using a singleplex immunoassay detection system. Proteins were detected by adjusting
the hardware settings such that images with visible, yet unsaturated, signal clusters with
minimal background contribution were captured. Using an exposure time of 120 ms,
signals generated from low concentrations of proteins (down to 36 aM of myoglobin)
were detected above the background intensity (Figure 4.1).
Control experiments were performed at a zero antigen concentration, exposing
paramagnetic particles with immobilized capture antibody to fluorescently-labeled
detection antibody. Dark structures resulted, with minimal diffuse fluorescence
suggesting that little or no nonspecific binding is present. The average fluorescence

109
intensity of the entire image was noted (including pixels from all areas, including diffuse
fluorescence between rotors) since distinct signal clusters were not visible. This is a more
stringent test for background quantification, since the noise from all pixels is included.
At low sample concentrations, below 360 aM for myoglobin, the signal becomes
highly variable and the uncertainty in the measurements was greater than 10%. When the
uncertainty in a measurement falls below 10% the signal may not only be detected, but
quantified with a reasonable level of certainty [37]. This distinction is important as it
differentiates a qualitative positive result from the ability to distinguish when a biomarker
is present in concentrations that correspond to diagnostic cut-off values. For the
optimization of a clinical assay it is the quantitation limit that is of interest.

110
Figure 4.1 (A and B) Images showing fluorescence of high sensitivity immunoassays at
the detection limit (below the limit of quantification) for 36 aM myoglobin (B) compared
to background (A). (C and D) Surface plots illustrating the difference in fluorescence
intensity between background (zero concentration, C) and signal clusters representing
specific signal (36 aM myoglobin, D). While the signal clusters are not as distinct as
those observed for higher target concentrations, this represents the lower limit detectable
above zero concentration.
4.3.2 Quantitation Limit
Measurements of cardiac targets permitted the quantitation of myoglobin to a
minimal concentration of 360 ± 2.5 aM with an observed detection limit of 36 ± 2.5 aM,
and a linear standard curve from 360 aM to 14 fM (R2 = 0.996; Fig. 2A). H-FABP and
cTnI were quantified to limits of 67 ± 3 fM and 42 ± 0.01 fM, with linear standard curves
from 67 fM to 67 pM and 42 fM to 42 pM, respectively (R2 = 0.998; Fig. 2B and R
2 = 1;
Fig. 2C). The optimized collection of the video sets allowed for improvement in detection

111
over several orders of magnitude compared to previously collected myoglobin data, from
50 pM to 36 aM (Table 4.1) [30]. The limits of quantitation observed in the present work
compare favorably to the metrics of a fully optimized immunoassay, achieving detection
on the same order of magnitude as fundamental limitations. At low numbers of
molecules, quantification becomes impossible due to Poisson statistics [37]. While targets
may be observed below this limit, they may not be quantified due to high levels of
uncertainty in the measurements made.
Previous
Studies30 Commercial
Techniques38,39 Present
Work
Optimized
Values
Plasma
Concentration40
Myoglobin 50 pM
1.5 nM 360 ±2.5
aM
33 aM 2.5 nM
H-FABP -- 6.7 pM 67 ± 3
fM
33 aM 110 pM
cTnI -- 83 pM 42 ±
0.01 fM
33 aM 62.5 pM
Table 4.1 Quantitation limits for immunoassay techniques. Optimized values represent
the limit to immunoassay quantitation in a 10 μL sample volume.
Several differences exist in both the data acquisition and data analysis performed
in this work that account for the observed improvement in quantitation ability compared
to previous studies [30]. In terms of data acquisition, previous work noted differences in
signal strength depending on their location in the field of view, increasing variation in
both signal and noise. The changes to optics and acquisition conditions eliminated this
issue, producing rotors with similar signal intensities independent of their location.
Optimizing acquisition conditions through control studies with b-Fluorescein resulted in
an increase in exposure time from 50 to 120 ms, as well as reductions in gain (from 2000
to 13.8) and offset (from 2600 to 100) [30]. The increase in exposure time still allowed
clear visualization of rotor rotation while reducing the impact on noise compared with a

112
shorter exposure. With a lowered gain, the amplification of the image collected by the
CCD camera is reduced. Since both the signal and noise are reduced, this lowered value
will improve the signal-to-noise ratio (S/N) and reduce the background intensity and
noise while specific signal remains visible. By contrast, reducing the offset allows lower
intensity values for both specific signal and background fluorescence to be captured.
While this increases both the background intensity and noise as well as signal intensity
and noise, this minimal value assures that clusters from low signal concentrations may be
observed. By improving the signal-to-noise ratio of the captured video files lower
intensity signals may be differentiated from background noise, improving assay
sensitivity.
Along with the changes made to data acquisition conditions, the process of data
analysis has also been altered to increase the signal power obtained from each sample
[30]. In previous work a small region of each image (150 x 120 pixels), containing
roughly two of the 10-15 signal clusters present overall, was analyzed. Additionally,
while signal clusters contributed to less than 30% of the region selected, the average pixel
intensity was calculated for the entire selected area, including both signal and noise [41].
Signal processing studies performed on this data conclude that by calculating pixel
intensity for the entire image selection, and by only two of the signal clusters contributing
to target quantification, a large portion of the signal power is lost while the noise power is
increased [41]. By manually segmenting data and selecting all rotors in each frame (492 x
396 pixels) as was done in this work, both issues observed with previous analysis
methods are solved. The overall noise power is reduced while signal power is increased

113
[41]. This, coupled to the increase in S/N through optimal data acquisition conditions,
allowed for a five-fold improvement in assay sensitivity.
In terms of the mass action equilibrium and detection, sensitivity is maximized by
using an excess of both primary and secondary antibodies, and heavy labeling of
secondary antibodies (average among all targets of 4 labels per antibody). Given that the
paramagnetic particles have a binding capacity of 8.2 nmol/mL (manufacturer
specifications), the binding capacity for the primary antibody preparation is 82 nM. Using
fundamental relationships from basic immunology the equilibrium reaction between the
protein and primary antibody can be described as
𝐾𝑒𝑞 = [𝐴𝑔𝐴𝑏1]
[𝐴𝑔][𝐴𝑏1] (4.1)
where [AgAb1] is the concentration of bound antigen, [Ag] is the concentration of
antigen, [Ab1] is the concentration of primary antibody, and Keq is the equilibrium
constant. Given a Keq of 109 M
-1, the equilibrium concentration of bound antigen for a
myoglobin sample at a concentration of 3.6 fM is 0.3 pM, about one hundred times the
concentration of target present. A similar calculation can be performed for the reaction of
bound antigen with secondary antibody, giving an equilibrium concentration of [AgAb2]
in the nM range. With these experimental conditions it can be determined that nearly all
antigen is bound in the sandwich immunoassay, resulting in a linear response for the
portion of the sigmoidal immunoassay curve examined.
At myoglobin concentrations below 360 aM, uncertainty is too high in the
measurement achieve satisfactory quantitation. Although the lowest concentrations
detected could not be quantified due to high variations in signal, the potential exists to

114
improve quantitative sensitivity through coupling to available signal processing
approaches [41]. Using this approach, the detection limit of previously published data has
been improved by a factor of 100. If the same factor of improvement and reduction in
uncertainty for a given sample was realized for the data collected in this work,
quantitation of the lowest sample data collected would be possible.
0
5000
10000
15000
20000
25000
30000
35000
40000
0 5E-16 1E-15 1.5E-15 2E-15
Ave
rage
Flu
ore
sce
nce
Inte
nsi
ty (
Arb
. U)
Concentration (M)
a.
y = 3E+18x + 24801 R² = 0.996
0
15000
30000
45000
60000
75000
90000
0.00E+00 5.00E-15 1.00E-14 1.50E-14 2.00E-14

115
0
2000
4000
6000
8000
10000
12000
14000
16000
0 1E-12 2E-12 3E-12 4E-12 5E-12 6E-12 7E-12
Ave
rage
Flu
ore
sce
nce
Inte
nsi
ty (
Arb
. U)
Concentration (M)
b.
y = 4E+14x + 11538 R² = 0.9976
0
10000
20000
30000
40000
0.00E+00 2.00E-11 4.00E-11 6.00E-11 8.00E-11

116
Figure 4.2 Standard curves showing fluorescence intensity data for the sandwich
immunoassays performed on cardiac biomarker targets. a. Plot showing the quantitation
of Myoglobin down to a minimal concentration of 360 aM. Inset shows the linear range
to 14.7 fM. b. Plot showing the quantitation of h-FABP to a minimal concentration of 67
fM with inset showing the linear range to 67 pM. c. Plot showing the quantitation of
cTnI to a minimal concentration of 42 fM with inset showing the linear range to 42 pM.
Repeated experiments exhibit a similar result. Figure 3 shows the average
fluorescence intensity of data collected from four separate experiments with independent
dilutions of a myoglobin stock sample. Error bars show the standard deviation of each
data set. Differences in overall fluorescence intensity were observed between
experiments, due to aging of the mercury lamp used to illuminate samples. Even when
differences in fluorescence intensity were observed between days, the same linear
relationship was observed.
0
10000
20000
30000
40000
50000
60000
70000
0 1E-12 2E-12 3E-12 4E-12 5E-12
Ave
rage
Flu
ore
sce
nce
Inte
nsi
ty (
Arb
. U)
Concentration (M)
c.
y = 2E+15x + 51963 R² = 1
0
40000
80000
120000
160000
0.00E+00 1.50E-11 3.00E-11 4.50E-11

117
Figure 4.3 Standard curve showing the average fluorescence intensity versus
concentration for the myoglobin sandwich immunoassay for four different experiments
using the target protein. The inset shows the lower concentrations on the standard curve,
error bars represent the standard deviation among data sets. Fluorescence intensity has
been normalized to the background intensity (zero concentration) for each data set.
4.3.3 Assay Evaluation
As has been noted previously, in static immunoassays background fluorescence is
a serious concern that limits the ability to differentiate specific signal from noise. Signal
processing strategies offer the potential to improve detection limits through the
identification of specific signal generating surfaces and reduction of background elements
to reduce the variation observed in signal intensity for low concentration samples [41].
Surface localization is of use in image processing because it creates distinct signal objects
y = 4E+13x + 7.04 R² = 0.997
0
5
10
15
20
25
0.00E+00 5.00E-14 1.00E-13 1.50E-13 2.00E-13 2.50E-13 3.00E-13
Ab
sorb
ance
(A
rb. U
)
Concentration (g/mL)
Myoglobin Normalized Data
0
5
10
0.00E+002.00E-154.00E-156.00E-158.00E-15

118
that are easier to detect and quantify compared to signal spread over the entire field of
view. Creating these distinct signal objects allows for segmentation of collected images
and the quantitation of fluorescent species bound in the immunoassay without the
influence of diffuse background fluorescence.
The potential to optimize quantitation capabilities also exists through the use of
new signal input patterns. Lock-in amplification is a commonly employed method to
recognize a specific input signal in the presence of noise [42]. This method allows an
input signal modulated in amplitude to be matched to a reference signal with the same
periodicity and amplified while background noise is not recognized and is effectively
removed. It has been used in previous work to achieve detection limits in the pM range
[30,32]. However, because the reference signal generated by lock-in amplification is a
sine wave, its correlation with the input wave is imperfect and signal power is lost. This
has been addressed in part by the development of a new signal processing method that
maintains the input signal modulation but uses a new waveform as the reference signal
[37]. While this approach was successful in improving quantitation, using autocorrelation
analysis to recognize more complicated input patterns could improve the distinction
between signal and noise and increase the slope of the regression line at low sample
concentrations.
Other immunoassay techniques have worked on improving quantitative sensitivity
for protein targets [17,23-25,33,34]. Compared to those studies that were performed
using traditional laboratory equipment [23-25,33,34], the assay investigated in this work
achieved superior sensitivity (aM to fM range compared with typical nM sensitivity)
using shorter incubation times. Incubation times could potentially be reduced further for
119
this assay as the dispersed magnetic microbead surface offers an advantage during
analyte capture. Unlike static assay surfaces that are subject to depletion zones and
relaiant on diffusion for target capture, the solid microbead surface is constantly in
motion throughout incubations. Another study discussed the development of a microchip-
based immunoassay for cTnI detection [17]. Movement to the chip format allowed for
shorter analysis times and easy adaptability to portable devices and multiplexed analysis.
While offering an improvement over this work in terms of analysis time, the sensitivity
achieved in this work was superior (fM compared with pM) using a comparable sample
volume.
Many studies have reported on the improved sensitivity of cardiac diagnostic
ability with the use of a biomarker panel as opposed to a single target [5,8,10,12,14-16].
One consequence of this is that parallel detection of targets from a single sample is
desirable. Along with the potential to optimize this immunoassay platform for sensitive
analyte quantitation, the use of magnetic microparticles offers the ability to move from
the batch incubation assay conducted within this work to one performed on a microchip
as part of a total sample analysis system. Easy manipulation of the magnetic solid surface
through an applied magnetic field allows for the containment of surfaces functionalized
for the capture of different targets in separate regions of the microchip. Following target
isolation on chip through separation science techniques, individual species may be
flushed into appropriate detection chambers and quantified. The linear range of this
technique may also be extended through the dilution of samples investigated, or use of
smaller sample volumes, allowing the assay to be tailored to meet detection needs as
required for diagnostic or disease monitoring purposes.

120
4.4 Concluding Remarks
Dispersed magnetic beads were utilized in a batch incubation format to conduct
sandwich immunoassays on three cardiac biomarker targets. Following sample
preparation 10 μL droplets were manipulated through variations in an applied magnetic
field, and the periodic change in observed fluorescence was captured as a video file.
Analysis of video utilizing ImageJ allowed the superior detection of myoglobin (360
aM), H-FABP (67 fM) and cTnI (42 fM) compared to previous results.
Thus, a magnetic bead immunoassay platform was demonstrated utilizing simple
batch incubation and a modified microscope slide. This platform has the potential to be
incorporated into a full sample analysis chip as a quantification method for biomarker
panels while maintaining sensitive detection capabilities, and offers the ability to couple
results to more sophisticated signal processing approaches for the detection of low
sample concentrations independently from background noise. In its current form this
system directly addresses many of the six metrics of an optimized immunoassay.
Incorporation of the assay into a μTAS could further these efforts by affording the ability
to multiplex and further reduce analysis times while maintaining the high sensitivity, low
sample volume, and operational simplicity achieved herein. Doing so has the potential to
produce a platform optimized for the diagnosis of myocardial infarction in emergency
rooms as previously defined: sensitivity allowing quantification of samples below the pM
range using fingerprick blood and the ability to quantify 3 targets simultaneously in under
30 minutes without the requirement for expensive, complicated or bulky instrumentation.
Not only could these advances produce a testing platform tailored to emergency

121
diagnostics, but reaching immunoassay optimization of all six metrics would allow the
application of this technique to other biological and medical issues.
4.5 References
[1] Qureshi, A., Gurbuz, Y., Niazi, J.H., Sensors and Actuators B, 2012, 171-172,
62-76.
[2] ACC and Cardiac Biomarkers, 2014, http://www.acc.org/education-and-
meetings/image-and-slide-gallery/media-
detail?id=d9c880ce33f3482f993161076a32990a
[3] Vasan, R. S., Circulation, 2006, 113, 2335-2362.
[4] Kakoti, A., Goswam, P. i, Biosensors and Bioelectronics, 2013, 43, 400-411.
[5] Ishii, J., Wang, J.H., Naruse, H., Taga, S., Kinoshita, M., Kurokawa, H., Iwase,
M., Kondo, T., Nomura, M., Nagamura, Y., Watanabe, Y., Hishida, H., Tanaka,
T., Kawamura, K., Clinical Chemistry, 1997, 43, 1372-1378.
[6] Huang, C.H., Tsai, M.S., Chien, K.L., Hsu, C.Y., Chang, W.T., Wang, T.D.,
Chen, S.C., Huei-Ming Ma, M., Chen, W.J., Clinica Chimica Acta, 2014, 435, 7-
13.
[7] Glatz, J.F., Renneberg, R., Clinical Lipidology, 2014, 9, 205-220.
[8] Macdonald, S.P.J., Nagree, Y., Fatovich, D.M., Phillips, M., Brown, S.G.A.,
Emergency Medicine Journal, 2012, 30, 149-154.
[9] Liao, J., Chan, C.P., Cheung, Y., Lu, J., Luo, Y., Cautherley, G.W.H., Glatz,
J.F.C., Renneberg, R., International Journal of Cardiology, 2008, 133, 420-423.
[10] Tonomura, Y., Matsushima, S., Kashiwagi, E., Fujisawa, K., Takagi, S.,
Nishimura, Y., Fukushima, R., Torii, M., Matsubara, M., Toxicology, 2012, 302,
179-189.
[11] Inoue, K., Suwa, S., Ohta, H., Itoh, S., Maruyama, S., Masuda, N., Sugita, M.,
Daida, H., Circulation Journal, 2011, 75, 2813-2820.
122
[12] Molin, S.Da., Cappellini, F., Falbo, R., Signorini, S., Brambilla, P., Clinical
Biochemistry, 2014, 47, 247-249.
[13] Setsuta, K., Seino, Y., Mizuno, K., International Journal of Cardiology, 2014,
176, 1323-1325.
[14] McMahon, C.G., Lamont, J.V., Curtin, E., McConnell, R.I., Crockard, M.,
Kurth, M.J., Crean, P., Fitzgerald, S.P., American Journal of Emergency
Medicine, 2012, 30, 267-274.
[15] Gnedenko, O.V., Mezentsev, Y.V., Molnar, A.A., Lisitsa, A.V., Ivanov, A.S.,
Archakov, A.I., Analytica Chimica Acta, 2013, 759, 105-109.
[16] Body, R., McDowell, G., Carley, S., Wibberley, C., Ferguson, J., Mackway-
Jones, K., Resuscitation, 2011, 82, 1041-1046.
[17] Song, S. Y., Han, Y. D., Kim, K., Yang, S. S., Yoon, H. C., Biosensors and
Bioelectronics, 2011, 26, 3818-3824.
[18] Casolari, S., Roda, B., Mirasoli, M., Zangheri, M., Patrono, D., Reschiglian, P.,
Roda, A., Analyst, 2013, 138, 211-219.
[19] Tian, J., Zhou, L., Zhao, Y., Wang, Y., Peng, Y., Hong, X., Zhao, S., J Fluoresc,
2012.
[20] Lin, D., Wu, J., Wang, M., Yan, F., Ju, H., Analytical Chemistry, 2012, 84, 3662-
3668.
[21] Liang, G., Liu, S., Zou, G., Zhang, X., Analytical Chemistry, 2012, 84, 10645-
10649.
[22] Spindel, S., Sapsford, K.E., Sensors, 2014, 14, 22313-22341.
[23] Ammar, M., Smadja, C., Phuong, G.T., Azzous, M., Vigneron, J., Etcheberry,
A., Taverna, M., Dufour-Gergam, E., Biosensors and Bioelectronics, 2013, 40,
329-335.
[24] Caulum, M.M., Murphy, B.M., Ramsay, L.M., Henry, C.S., Analytical
Chemistry, 2007, 79, 5249-5256.

123
[25] Park, M., Bong, J.H., Chang, Y.W., Yoo, G., Jose, J., Kang, M.J., Pyun, J.C.,
Analytical Methods, 2014, 6, 1700-1708.
[26] Han, J., Zhang, J., Xia, Y., Li, S., Jiang, L., Colloids and Surfaces A:
Physiochem. Eng. Aspects, 2011, 379, 2-9.
[27] Proczek, G., Gassner, A. L., Busnel, J. M., Girault, H. H., Anal. Bioanal. Chem.,
2012, 402, 2645-2653.
[28] Ranzoni, A., Sabatte, G., van Ijzendoorn, L. J., Prins, M. W. J., ACS Nano, 2012,
6, 3134-3141.
[29] Hahn, Y. K., Park, J. K., Lab Chip 2011, 11, 2045-2048.
[30] Hayes, M.A., Petkus, M.M., Garcia, A.A., Taylor, T., Mahanti, P., Analyst, 2009,
134, 533-541.
[31] Zhang, Y., Zhou, D., Expert Reviews Ltd, 2012, ISSN 1473-7159, 565-571.
[32] Petkus, M.M., McLauchlin, M., Vuppu, A.K., Rios, L., Garcia, A.A., Hayes,
M.A., Analytical Chemistry, 2006, 78, 1405-1411.
[33] Zhu, Y.D., Peng, J., Jiang, L.P., Zhu, J.J., Analyst, 2014, 139, 649-655.
[34] Sakamoto, S., Omagari, K., Kita, Y., Mochizuki, Y., Maito, Y., Kawata, S.,
Matsuda, S., Itano, O., Jinno, H., Takeuchi, H., Yamaguchi, Y., Kitagawa, Y.,
Handa, H., Clinical Chemistry, 2014, 60, 610-620.
[35] Woolley, C.F., Hayes, M.A., Bioanalysis, 2013, 5, 245-264.
[36] Fluorescein-EX Protein Labeling Kit, 2004,
http://tools.invitrogen.com/content/sfs/manuals/mp10240.pdf.
[37] Currie, L.A., Analytical Chemistry, 1968, 40, 586-593.
[38] Cardiac Marker ELISA Kits, 2013, http://www.calbiotech.com/products/elisa-
kits/human-elisa-kits/cardiac-marker-elisa-kits.

124
CHAPTER 5
THEORETICAL LIMITATIONS OF QUANTIFICATON FOR
NONCOMPETITIVE IMMUNOASSAYS
5.1 Introduction
Immunoassays are invaluable tools for the detection and quantification of
important biomolecules and many other chemical compounds at low concentrations.
Antibodies bind to target structures with large binding constants, which enable selective
detection at low analyte concentrations. Since immunoassays were first introduced,
attempts to optimize the assay process have persistently focused on improving the limit
of detection (LOD) [1,2]. This focus on low LOD’s has been stimulated largely by the
desire for earlier therapeutic intervention through the detection of diagnostic markers at
lower concentrations or from smaller volumes [3]. Over the years these efforts have
resulted in the shift away from radioimmunoassays to enzyme-linked immunosorbent
assays [4,5], and in the exploration of signal amplification approaches to improve
detection of antibody-antigen binding [6-18].
The LOD is an important figure of merit for determining an immunoassay’s
quality and is frequently used to compare competing methods [19,20]. The term, LOD, is
often used interchangeably in the immunoassay literature with the limit of quantification
(LOQ), causing some confusion as to the reported capabilities of different assays [21-23].
As defined by Currie in 1968, the LOD corresponds to the presence of any detectable
signal from the specific instrumental configuration that can be assigned to the target
under study. The LOD is used as a demarcation of the presence or absence of an analyte
(the Ld term in reference) and has high quantitative uncertainty at low sampling numbers

125
(reaching 100%), which undermines its use as an indicator of presence/absence. The
LOQ is the level at which measurements have sufficient precision for quantitative
determination [23]. The distinction between LOD and LOQ highlights that while single
molecule immunoassays can detect the presence of one (or very few) putative signal
generating molecules, detection at this level is highly qualitative. For immunoassays
aimed at the quantification of minute amounts of proteins indicative of disease states,
detection near the LOD is not adequate. Therefore, it is necessary to define the true LOQ
for an immunoassay in terms of a statistical assessment and not instrumental factors.
The LOD for most immunoassays has been limited primarily by the signal-to-
noise ratio provided by the instrument used to detect antibody-antigen binding or by
nonspecific binding (NSB) [24,25]. With improving detection technology capable of
routine single molecule detection, the instrumentation to detect antibody-antigen binding
is no longer a fundamental factor that defines LOD’s for immunoassays. It is well known
that NSB often limits the LOD for immunoassays [19,26-31]; however, if an
immunoassay method is optimized to reduce NSB to insignificant levels, the LOD that
can be obtained with an immunoassay are then limited by antibody-antigen binding and
fundamental statistical limitations.
Detection of a single molecule is an irresistible objective for analytical chemists.
Recently, so-called ‘single molecule immunoassay’ techniques have been introduced [26-
28]. Much of this work demonstrates the detection of individual signals associated with
distinct putative binding events, but detection limits do not approach single molecule for
the antigen [26-28]. These techniques have relied on the use of chemically-linked
fluorophores to secondary (or tertiary) antibodies with detection schemes able to sense a

126
single fluorphore (or activity of a single enzyme). The signals from the individual
counting of presumed immune complexes are averaged, summed or provided other data-
processing mechanisms to generate an estimate of antigen concentration. These studies,
while counting distinct signals assumed to be individual immune complexes, required the
averaging of many individual signals to produce a quantitative measurement with a
satisfactory coefficient of variation (<10%) [32,33]. The requirement for averaging many
individual signals demonstrates that while singular complexes have been, in fact, detected
using immunoassay techniques, the certainty with which they are detected is not
sufficient for quantification of an analyte. Therefore, the true limits of quantification lie
at higher levels than a single molecule. For any analytical immunoassay measurements
approaching single antigen molecule detection, the LOD is ultimately bound by
‘molecular’ shot noise – the absolute floor of the limit of detection, which is a statistical
sampling effect that follows a Poisson distribution [34].
In this work, relationships based on the law of mass action are used to model the
theoretical limit of quantification for immunoassays. Most commercial immunoassay
methods currently use P4-P5 fittings (four or five parameter mathematical fittings of
resulting sigmoidal curves with no connection to fundamental interactions) to model the
sigmoidal immunoassay response curves for quantitative analysis because of the
difficulty of implementing theoretical models based on the law of mass action with many
parameters [35]. These P4-P5 fittings are useful for practical quantitative analysis with
immunoassays, but they cannot be used to explore the fundamental limit of quantification
for immunoassays. The focus of this work is the ultimate limitations of immunoassays,
mostly centered on molecular shot noise. However, without comparing and contrasting

127
this limit with other effects, it cannot be put in proper context. The LOQ for
immunoassays is considered using theoretical models based on the law of mass action for
three situations: when the limit of quantification is defined by 1) instrumental limitations,
2) non-specific binding—the most common case, and 3) conditions where statistical
sampling theory is the only limit, so-called molecular shot noise.
5.2 Theory
5.2.1 Fundamental Relationships
Using equations from basic immunology and describing reaction schemes
according to the law of mass action, the first incubation in the sandwich-type
immunoassay (Figure 5.1) can be described by
𝐾1𝑒𝑞 = [𝐴𝑏1𝐴𝑔]
[𝐴𝑏1][𝐴𝑔] (5.1)
where K1eq is the equilibrium association constant (antibody affinity, M-1
) for the capture
antibody, [Ag] is the concentration of free antigen (M), [Ab1] is the concentration of
unbound capture antibody (M), and [Ab1Ag] is the concentration of the antibody-antigen
complex formed during the reaction (M) [36]. Modeling the reaction this way requires
several assumptions to be made: (i) the interaction of antigen and antibody can be
described using a single equilibrium constant, (ii) binding of antibody to a solid surface
(or fluorophore or enzyme) doesn’t affect binding characteristics, and (iii) wash steps
separating bound and free antigen don’t disturb the equilibrium reached [36].

128
Figure 5.1 Schematic of the sandwich immunoassay format. A) The primary antibody
([Ab1]) is bound to a solid support forming a reaction capture area. B) The target analyte
([Ag]) is incubated with the primary antibody and captured to the surface (forming
[Ab1Ag] which is equivalent to [Ag2]). After washing to remove any unbound species in
the sample volume, C) incubation with the secondary detection antibody ([Ab2]) and
removal of the unbound antibody allows detection of a signal and quantification of the
bound analyte ([Ab2Ag2]).
Given that [Ab1tot] is the total concentration of capture antibody, then
[𝐴𝑏1] = [𝐴𝑏1𝑡𝑜𝑡] − [𝐴𝑏1𝐴𝑔] (5.2)
From Equation 5.2 we can write
[𝐴𝑏1𝐴𝑔] = 𝐾1𝑒𝑞[𝐴𝑔]{[𝐴𝑏1𝑡𝑜𝑡] − [𝐴𝑏1𝐴𝑔]} (5.3)
which can be simplified to [36,37]:
[𝐴𝑏1𝐴𝑔] = 𝐾1𝑒𝑞[𝐴𝑏1𝑡𝑜𝑡][𝐴𝑔]
(1 + 𝐾1𝑒𝑞[𝐴𝑔]) . (5.4)
A plot of [Ab1Ag] with respect to log [Ag] is sigmoidal (Equation 5.4, Figure 5.2), with
very low [Ag] concentrations producing linear changes in [Ab1Ag] (Figure 5.2 inset). The
shape of the curves can be trivially understood by noting that 1 + 𝐾1𝑒𝑞[𝐴𝑔] ≅ 1 when

129
[Ag] is small, thus making eq. 5.4 a linear relationship and when [Ag] is very large
1 + 𝐾1𝑒𝑞[𝐴𝑔] ≅ 𝐾1𝑒𝑞[𝐴𝑔] and the relationship becomes concentration independent.
Figure 5.2. Log plot showing the concentration of antigen (log[Ag]) bound ([Ab1Ag]) to
primary antibody from a sample across approximately seventeen orders of magnitude
(equation 5.4). This response is a typical sigmoidal-shaped response from the laws of
mass action, which is commonly interpreted with four and five parameter sigmoidal
fitting models (P4, P5) disconnected from core equilibrium relationships. Inset:
Concentration of bound antigen ([Ab1Ag]) to primary antibody at low numbers of
antigens ([Ag]), from single molecule to 600 molecules in 50 microliters (30 zeptomolar
to 20 attomolar). Note that across these low concentrations the relationship is linear
(inset).
5.2.2 Second Equilibrium, Completion of the Sandwich Assay
For the second step of the sandwich assay, where the detection antibody (labeled
appropriately) is introduced, the final complex from step one [Ab1Ag] becomes the target
antigen for step two. Therefore the bound antigen concentration [Ab1Ag] is set equal to
the antigen concentration [Ag2] as the target of the second incubation. Maintaining the

130
assumptions outlined during the first incubation process, and going through the same
algebraic strategy, from equation 5.4, the amount of antigen present in the second
incubation ([Ag2]) is equal to the amount bound to the primary antibody in the first
incubation ([AgAb1]).
[𝐴𝑔𝐴𝑏1] = 𝐾1𝑒𝑞[𝐴𝑏1𝑡𝑜𝑡][𝐴𝑔]
(1+ 𝐾1𝑒𝑞[𝐴𝑔]) = [𝐴𝑔2] 5.5
From basic immunology equations, the equilibrium constant for the second incubation
(K2eq) is given in the same format as that for the first incubation (K1eq).
𝐾2𝑒𝑞 =[𝐴𝑔2𝐴𝑏2]
[𝐴𝑔2][𝐴𝑏2] 5.6
Given that
𝐴𝑏2 = [𝐴𝑏2𝑇𝑂𝑇] − [𝐴𝑔2𝐴𝑏2] 5.7
we can write
[𝐴𝑔2𝐴𝑏2] = 𝐾2𝑒𝑞[𝐴𝑔2][𝐴𝑏2𝑇𝑂𝑇 − 𝐴𝑔2𝐴𝑏2] 5.8
which simplifies to
[𝐴𝑔2𝐴𝑏2] = 𝐾2𝑒𝑞[𝐴𝑏2𝑇𝑂𝑇][𝐴𝑔2]
(1+𝐾2𝑒𝑞[𝐴𝑔2] 5.9
Substitution of equation 5.6 results in the concentration of the signal generating species
[Ab2Ag2] (M) to be given by
[𝐴𝑔2𝐴𝑏2] =
𝐾2𝑒𝑞[𝐴𝑏2(𝑡𝑜𝑡)]𝐾1𝑒𝑞[𝐴𝑏1𝑡𝑜𝑡][𝐴𝑔]
(1 + 𝐾1𝑒𝑞[𝐴𝑔])
(1 + 𝐾2𝑒𝑞
𝐾1𝑒𝑞[𝐴𝑏1𝑡𝑜𝑡][𝐴𝑔]
(1 + 𝐾1𝑒𝑞[𝐴𝑔]))
(5.10)

131
where K2eq is the equilibrium association constant (antibody affinity, M-1
) for the
detection antibody, and [Ab2tot] is the total concentration of the secondary antibody (M).
5.2.3 Single Molecule Detection and Fundamental Sources of Noise
Regardless of the detection modality, issues of signal-to-noise, bias and variance
can be generalized for any system that has the appropriate conditions to sense the
presence of a signal-generating species consistent with a single molecule. Each system
will generate a characteristic bias, variance and sensitivity (amplification). To attain
‘single molecule sensitivity’ (ISM), a signal strength more than to six times the standard
deviation () of the noise (ISM>6noise) above the Ibl is considered to be unequivocal
evidence of distinct signal above noise, generating a 99.73% probability that it
statistically represents a positive result (a single molecule is present) if a normal
distribution is assumed [38]. To generalize this assessment and examine the best case
scenario, the only noise considered is Johnson-Nyquist; an unavoidable fundamental
source of noise for all instrumentation [39-41]. Additional fundamental sources of noise
(flicker, shot, etc.) can be added to this by summing bias (as expressed by intensity, I,
(equal to Inoise)) and variance (variance is the square of the standard deviation (2),
equal to 2
noise). Other sources of instrumental bias and variance (dark current,
environmental noise, etc.) can be similarly summed, the specific values depending on the
details of the specific system. The baseline intensity (bias, Ibl), in the case of Johnson-
Nyquist noise, defines the variance, bl2, by
𝜎𝑏𝑙2 = √2𝑞𝐼𝑏𝑙∆𝑓 (5.11)

132
Where q is the charge of an electron, and Δf is the bandwidth (in Hz). Variance also
increases with signal intensity, Is, with the same function, but it is added separately:
𝜎𝑠2 = √2𝑞𝐼𝑠∆𝑓.
5.2.4 Instrumental Background and Noise
There is a broad range of conditions where the relatively high instrument
intensity, Ibl (and the resulting variance, 𝜎bl2 ), or low amplification () defines the limit of
detection. Either the amplification can be insufficient or the instrumental bias and
variance may be too high. Whichever effect is the cause, the result is the same. Under
these conditions the limit of detection is set at Is > 3bl, per standard analytical
assessment.
5.2.5 Non-Specific Binding
Non-specific binding can influence the LOQ through one of two forms: those
arising from the binding of antigen directly to the solid assay surface (and subsequently
binding the signaling antibody) and signal antibody binding to the surface independent of
the antigen. This source of noise will also have characteristic intensity (bias, INSB) and
variance (2
NSB) defined as in equation 5.11. In addition, for very low numbers of
molecular interactions, this form of noise can also add molecular shot noise (a minor, rare
situation—not considered further).
The sum of the sources of noise and background (Esystem) in any system gives the
relationship
𝐸𝑠𝑦𝑠𝑡𝑒𝑚 = 𝐼𝑏𝑙 + 𝐼𝑁𝑆𝐵 + √𝜎𝑏𝑙2 + 𝜎𝑁𝑆𝐵
2 + 𝜎𝑠2 (5.12)

133
where 𝐼𝑏𝑙 and 𝜎𝑏𝑙2 are empirically defined functions of the instrumentation used, and 𝐼𝑁𝑆𝐵,
𝜎𝑁𝑆𝐵2 , and 𝜎𝑠
2 are a function of the amplification and binding properties of a system.
5.2.6 Molecular Shot Noise
In an ideal case where instrument noise is minimized and NSB is eliminated, the
LOQ is set by Poisson noise (molecular shot noise). This limit arises from the fact that
biomolecules are discrete entities and their binding is of a quantum nature, which
produces an unavoidable source of error in any detection system, a fundamental signal-
to-noise boundary for any assessment. This adds to the variance according to [34]:
𝜎𝐴
𝑛𝐴=
1
√𝑛𝐴
. (5.13)
This source of error follows a Poisson statistical distribution for a small number of targets
where σA is the standard deviation (variance is σA2) of the number of molecular
signatures detected (nA). When NSB and extraneous sources of fluorescent signal are
eliminated, the molecular signature is only from the actual number of antigen molecules
detected. Improvement in the precision of sampling dilute targets requires the generation
and averaging of multiple unique samples, since strongly fluorescent signals from non-
antigen specific events may significantly impact the background sampling noise [34].
This sampling statistical effect is different from statistical fluctuations in signal
(variance), and represents an intrinsic limit on detection capabilities for a liquid-phase
immunoassay (Figure 5.3). This source of error is beyond and separate from the
instrumental sources of background (bias) and noise (variance). The sum of the error in
any system may be described as:
𝐸𝑇𝑂𝑇 = 𝐸𝑀𝑆𝑁 +𝐸𝑠𝑦𝑠𝑡𝑒𝑚
𝐼𝑇𝑂𝑇 (5.14)

134
where EMSN is error associated with molecular shot noise and ITOT is the total fluorescence
intensity detected. Percent error (or uncertainty), Epercent, is defined:
𝐸𝑝𝑒𝑟𝑐𝑒𝑛𝑡 = 𝐸𝑇𝑂𝑇 ∗ 100 = (1
√𝑁𝐴+
𝐼𝑏𝑙+ √𝜎𝑠2+𝜎𝑏𝑙
2
𝜉[𝐴𝑔]+𝐼𝑏𝑙+ √𝜎𝑠2+𝜎𝑏𝑙
2) ∗ 100 (5.15)
5.3 Results
The immunoassay signal response was calculated for assays detecting between 1
and 6.7x10⁴ molecules (between 33 zM and 2.2 fM in a 50 µL sample volume).
Equilibrium constants were fixed for both K1eq and K2eq at 1.0 x 10⁹ M
-1 to model levels
typical of monoclonal antibodies [43,44]. Calculations included elements for instrument
bias (background) and variance (noise), non-specific binding, and molecular shot noise.
These calculations were used to examine the LODs and LOQs for the three limiting
conditions for an immunoassay.
To understand the limits on quantification for immunoassay, three domains are
identified, which allow for direct comparison with the ultimate MSN limits. Depending
on which source of noise dominates, each imposes limitations on assay quantitation under
differing conditions (Table 5.1).

135
Limiting Factor Criteria Assay Limit of
Quantitation
Type of Assay
Instrument
background noise
𝐼𝑆𝑀
(6𝜎𝑏𝑙 + 𝐼𝑏𝑙)< 1
11,000 molecules
(0.36 fM)
Traditional laboratory
assays
Non-specific
binding noise 𝐼𝑁𝑆𝐵is present ~150 molecules
and up (5 aM)
Traditional laboratory
assays
Molecular shot
noise 𝐼𝑆𝑀 > 6𝜎𝑏𝑙 + 𝐼𝑏𝑙 ~131 molecules
(3.7 aM)
Optimized high-
sensitivity assay
Table 5.1 shows the limitations of assays based on the type of noise that is responsible
for limiting quantitation. When one source of noise is minimized or eliminated
quantitation becomes more sensitive until reaching a finite statistical limitation bound by
error (uncertainty) due to molecular shot noise. Concentrations are reported for a sample
volume of 50 μL.
Table 5.1, along with equation 5.14 (and equation 5.12), demonstrates that
different factors can dominate the noise observed in assays depending on experimental
conditions. If insensitive or noisy detection instrumentation is used, the background from
these machines will dictate the minimum amount of sample that can successfully be
quantified. If those limitations are overcome with the incorporation of sensitive detection
equipment, assays are typically limited to quantitation in the nano- to picomolar range by
NSB effects. NSB creates a minimal background signal that is detected under an assay
format without sample present and limits the minimal quantitation that can take place.
While it is observed that overall noise increases as signal size increases, the intensity of
the noise compared to the intensity of the signal becomes proportionately smaller,
resulting in a smaller coefficient of variation (CV) and a greater ability to quantitate the
population of specific analytes present.
Since MSN limitations are observed under ideal assay conditions and represent a
best case scenario, the impact of MSN on the LOQ is addressed first. Following this,
influences from NSB and instrumental background, sources of uncertainty that must be

136
minimized or eliminated to observe the effects of MSN, are analyzed to illustrate further
limitations on the LOQ that may be present in experimental immunoassays.
When detection systems used are capable of single molecule recognition (ISM >
(6noise + Ibl)) and NSB is eliminated, the effects of molecular shot noise are apparent
(Figure 5.3). Plots were generated to explore conditions where assay quantification is
limited only by molecular shot noise (Equation 5.13). Beyond defining the ultimate LOD
and LOQ, operating in the regime required for single molecule sensitivity does not
influence the rest of the classic sigmoidal curve, except that it may limit the dynamic
range of the overall measurement due to instrumental linearity being exceeded by
operating in a high amplification mode. Plotting the percent error normalized to the first
data point intensity (error bars = Epercent x total intensity (one molecule)) (Figure 5.3 inset)
as error bars on the Total Intensity values gives an indication of the accuracy with which
measurement can be made. Along with total intensity, the signal and instrument
background and noise are plotted. While the detection limit is set to single molecule limit,
the uncertainty (expressed as error) of the measurement still contributes finite error.
Another method to examine the same calculations is to plot contributions to
percent error (Epercent) for the different sources at low molecule counts (Figure 5.3,
bottom). The signal intensity is linear with increasing concentration, whereas the error in
the measurement grows dramatically at low molecular counts, dominated by molecular
shot noise with some influence from residual instrumental variance. Under these
conditions, the LOD is one molecule (30 zM) and LOQ is 131 molecules (3.7 aM). Note
to effectively eliminate the instrumental influence, the amplification must be increased
two-hundred-fold or instrument bias and variance must decrease by a thousand-fold.

137
0.00E+00
2.00E+04
4.00E+04
6.00E+04
8.00E+04
1.00E+05
1.20E+05
1.40E+05
1.E-20 1.E-19 1.E-18 1.E-17 1.E-16 1.E-15
Sign
al I
nte
nsi
ty (
Arb
. Un
its)
Concentration of Antigen (M)
MSN Limited LOQ Signal Intensity
Total Intensity
-50
0
50
100
150
200
250
300
350
0.E+00 2.E-19 4.E-19 6.E-19 8.E-19 1.E-18 1.E-18
1 to 30 Molecules
Total Intensity
Signal Intensity
Background andNoise Intensity

138
Figure 5.3 Plots illustrating the impact of error from molecular shot noise and residual
instrumentation effects on LOD and LOQ. Total Intensity (Equation 5.10 + Equation
5.12), Signal Intensity (Equation 5.10) and Background and Noise Intensity (Equation
5.12) were plotted. Variables set at Ibl=10, bl=2.38x10⁻⁴
, and =(Ibl+6noise)=10. Error
bars represent percent error. Top: large range of concentration of antigen to emphasize
that most of the curve is not influenced by molecular shot noise (signal intensity and total
intensity lines overlap). Inset: molecular shot noise generates significant error for small
numbers of molecules, error bars are equivalent to the percent error associated with the
measurement multiplied by the intensity of a single molecule and reach an acceptable
%CV (below 10% error) at 131 molecules. Note instrumentation bias and variance
contributes a minor, almost negligible, error. Bottom: Plot of the assay-specific signal
intensity (Equation 5.10) the total intensity of the assay (Equation 5.10 + Equation 5.12)
and the baseline intensity (Equation 5.12) (left-axis) versus the assay variance from
molecular shot noise (Equation 5.13 * 100%) the total variance in signal intensity
(Equation 5.15 * 100%) and the variance from the instrument (Equation 5.15 * 100%
with MSN equal to 0; right axis). Darker background indicates increase error in the
measurement. Total assay variation reaches a level of 10% error when there are fewer
than ~131 molecules (approximately 3.7 attomolar in 50 μL) in a sample.
0
20
40
60
80
100
120
0
500
1000
1500
2000
2500
3000
3500
4000
4500
5000
0 50 100 150 200 250
Per
cen
t Er
ror
lnte
nsi
ty (
arb
. un
its)
Number of Molecules
Quantitation Limited by Molecular Shot Noise
Total Intensity
Signal Intensity
Background andNoise Intensity% Error Total
% Error Molec.Shot Noise% Error frominstrument
10% Uncertainty

139
While typical conditions were used for the investigation of MSN (detection
system capable of single molecule detection, equilibrium constants of monoclonal
antibodies held at 1.0 x 10⁹ M
-1 for both K1eq and K2eq) to provide a representative
analysis of immunoassay capabilities, antibody properties do influence the fundamental
LOQ (Table 5.2). Increasing the equilibrium constant of one or both antibodies can
improve the limit of quantitation to approximately 113 molecules. Increases in the
equilibrium constant beyond that do not impact this fundamental limit strongly
(increasing both K1eq and K2eq to 1.0 x 10¹¹
M-1
only lowered the limit of quantitation to
111 molecules). The effects of antibody properties are greater when antibodies with
below average equilibrium constants are used. By using only one antibody with a Keq of
1.0 x 10⁸
M-1
raised the LOQ to 277 molecules (9.2 aM in 50 μL). Based on the
assumptions stated previously by modeling an immunoassay based on the laws of mass
action, systems are considered to be at equilibrium [36]. An excess of both capture and
detection antibody are used such that it is determined that all antigen in a system is bound
and dissociation is not assumed to occur on the time scale of the experiment. If
dissociation of the target compounds does occur after either wash step in a typical assay,
the limit of quantitation would increase. Under optimal circumstances 131 molecules
must be specifically detected to afford quantitation with a CV below an acceptable
threshold (<10%).

140
K1eq K2eq LOQ (number of molecules)
1X 1X 131
10X 1X 113
1X 10X 113
10X 10X 112
0.1X 1X 277
1X 0.1X 277
0.1X 0.1X 1371
Table 5.2 shows the influence of antibody equilibrium constants on the limit of
quantitation. Here, X is defined as 1.0 x 10⁹
M-1
, representing the typical equilibrium
constant of a monoclonal antibody [43,44]. The impact on the LOQ when this value is
increased or decreased by a factor of 10 for one or both of the antibodies used in a
sandwich immunoassay is demonstrated.
When NSB has not been effectively eliminated from an immunoassay system, it
can limit the LOD and LOQ if the bias and variance of the signal from the NSB exceeds
the instrumental bias and variance. To examine this, amplification was placed at single
molecule sensitivity (=10). NSB can be introduced into a system at any level, and here
will be considered at levels between 30 zM and 0.33 fM (1 and 10,000 molecules in 50
μL) being non-specifically adsorbed and detected (Figure 5.4). With a target
concentration held constant at 1 fM, above the range where MSN and instrument
background (capable of single molecule detection) influence impact quantitation, NSB
was plotted between 30 zM and 0.33 fM. While it is observed that the intensity of the
signal produced from NSB is much lower than the intensity of the specific signal, 10%
uncertainty is reached with the addition of 83 aM (2500 molecules) non-specifically
binding (Figure 5.4, top). This selection of sample concentration was an arbitrary value
emphasizing that any and all NSB will decrease detection limits compared to single
molecule detection, both in terms of false positive and increased molecular shot noise
error. This influence can be similarly observed by comparing the influence of the number
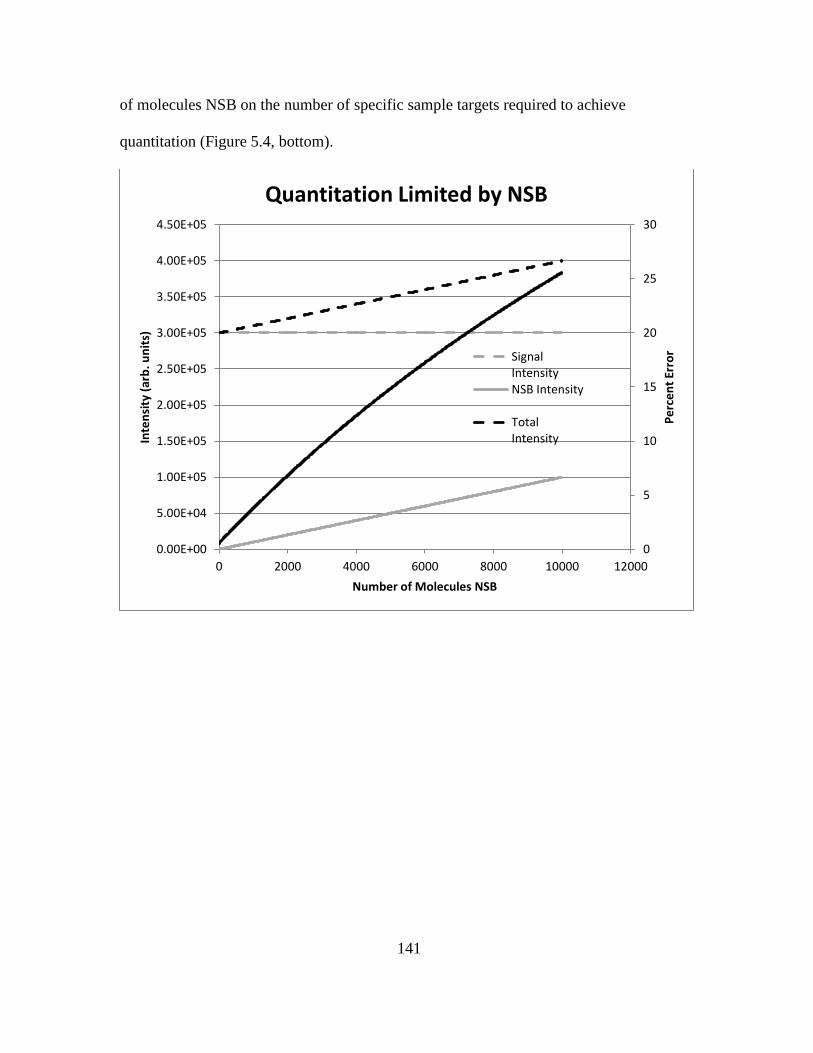
141
of molecules NSB on the number of specific sample targets required to achieve
quantitation (Figure 5.4, bottom).
0
5
10
15
20
25
30
0.00E+00
5.00E+04
1.00E+05
1.50E+05
2.00E+05
2.50E+05
3.00E+05
3.50E+05
4.00E+05
4.50E+05
0 2000 4000 6000 8000 10000 12000
Pe
rce
nt
Erro
r
Inte
nsi
ty (
arb
. un
its)
Number of Molecules NSB
Quantitation Limited by NSB
SignalIntensityNSB Intensity
TotalIntensity

142
Figure 5.4 Plot illustrating LOD and LOQ defined by non-specific binding properties.
Variables set at Ibl=10, bl=2.38x10⁻⁴
, and =(Ibl+6noise)=10 and modeled for a specific
target concentration of 1 fM. The intensity (bias, INSB) and standard deviation (noise,
NSB) were modeled for values between 0 and 104
molecules NSB and included according
to Equation 5.12. Top: The Signal Intensity (Equation 5.5), Total Intensity (Equation 5.10
+ Equation 5.12), and NSB (𝐼𝑁𝑆𝐵) were plotted and compared to Percent Error (Equation
5.10). Note the signal from NSB influences quantification far beyond the number
adsorbed entities, reaching the LOQ at 2500 molecules (83 aM) non-specifically
absorbed. Bottom: As the number of molecules non-specifically binding increases, the
concentration of target molecules required to reach the LOQ increases.
Historically, the LOD and LOQ were determined by the capabilities of the
detection system, generating low amplification of signal or high instrument bias and
variance (Figure 5.10). Reducing the amplification () or increasing the background (𝐼𝑏𝑙)
of the instrument produced a similar impact on quantitation abilities. This relationship
between signal amplification and background is modeled considering Johnson noise only
0
20000
40000
60000
80000
100000
120000
0 2000 4000 6000 8000 10000 12000
Targ
et
Mo
lecu
les
Re
qu
ire
d
Number of Molecules NSB
NSB Effect on LOQ

143
to examine the best case scenario as described previously where ISM > 6noise above Ibl
and noise is modeled according to equation 5.11. The transition towards instrumentation
capabilities being the limiting factor occurs when /(𝐼𝑏𝑙
6+bl) =/(
𝐼𝑏𝑙
6+ √2𝑞𝐼𝑏𝑙∆𝑓4 ) = 6.
When the ratio is less than six, the signal from a signal molecule is no longer
distinguishable above noise and the system is limited by instrumental considerations. For
this data, the ratio was set at 1/1000th of the transition value (Ibl=10, bl=2.38x10⁻⁴
,
=(Ibl+6noise)/1000=0.01). Any value less than six can illustrate this point, but this value
minimum that gave clear and instructive graphical information over a range of antigen
concentrations. For these conditions, the LOD was ~1100 molecules (37 aM) and LOQ
was 1.1x10⁴ molecules (0.36 fM).

144
Figure 5.5 Plot illustrating limited amplification or increased background bias and
variance resulting in LOD and LOQ being defined by the characteristics of
instrumentation. Total Intensity (Equation 5.10 + Equation 5.12), Total Background and
Noise (Equation 5.12), and Signal Intensity (Equation 5.10) were plotted versus antigen
concentration [Ag] (M). Plot shows signal intensity versus antigen concentration
according to immunoassay system of equations. Variables set at Ibl=10, bl=2.38x10⁻⁴
,
and =(Ibl+6noise)/1000=0.01.
5.4 Discussion
It is commonly accepted that the sandwich-type immunoassay allows for the most
sensitive detection among immunoassay formats [30]. With optimal instrumental
detection capabilities, the theoretical quantification limit of the sandwich assay depends
on the reaction binding constant, the percent of the reaction volume required for
measurement, and the precision associated with the measurement made [16]. Precision in
these measurements and the statistical limitations of certainty are important points to
0.00E+00
2.00E+01
4.00E+01
6.00E+01
8.00E+01
1.00E+02
1.20E+02
1.40E+02
1.60E+02
1.80E+02
2.00E+02
1.E-20 1.E-19 1.E-18 1.E-17 1.E-16 1.E-15
Inte
nsi
ty (
Arb
. Un
its)
Concentration of Antigen [Ag] (M)
Instrument Limited LOQ
I(signal)(arb.units)
Totalbkgrd&noise
0
20
40
60
80
100
120
140
160
180
0.00E+00 2.00E-16 4.00E-16 6.00E-16
Total Intensity
Signal Intensity
Total bkgrd &noise

145
consider in the distinction between the LOD and LOQ. The focus on the LOQ is to
ensure that the relative error in a sample measurement remains less than a logical pre-
determined fraction of the total signal (<10%) [22,23,25,44].
Practically, the LOQ is affected by both constant and variable sources of noise
which must be accounted for in determining finite immunoassay capabilities. The
constant sources of noise, arising from detection elements, signal processing, molecular
shot noise, thermal noise and Johnson noise will be present throughout any measurement
at a defined intensity for a particular system. Variable noise arises predominantly from
NSB, which can occur at each step in immunocomplex formation with differing effects.
Although binding of the non-target species is less probable than the specific binding of an
analyte, in the event that the target compound is present at a low concentration, or in a
biological sample, non-specific binding will be a significant contributor to the overall
signal [25].
Plots based on the law of mass action were used here to illustrate three sets of
conditions dictating the LOQ for immunoassays: a) molecular shot noise, b) non-specific
binding, or c) the baseline signal intensity arising from measurement instrumentation.
While the focus of this work is the determination of the LOQ based on the sources of
uncertainty present in a system, and variation in signal response increases with increasing
analyte concentrations [44], above the LOQ the signal-to-noise ratio (SNR) increases and
the noise factor (𝑡𝑜𝑡𝑎𝑙 𝑜𝑢𝑡𝑝𝑢𝑡 𝑛𝑜𝑖𝑠𝑒 𝑝𝑜𝑤𝑒𝑟
𝑜𝑢𝑡𝑝𝑢𝑡 𝑛𝑜𝑖𝑠𝑒 𝑝𝑜𝑤𝑒𝑟 𝑑𝑢𝑒 𝑡𝑜 𝑖𝑛𝑝𝑢𝑡 𝑠𝑜𝑢𝑟𝑐𝑒) decreases [25]. These findings
demonstrate that while there may be more total variation in signal at higher analyte
concentrations, this variation represents a smaller percentage of the overall signal than
fluctuations produced at low sample concentrations. The mass action law was used in

146
this case to gain insight into fundamental limitations of immunoassay systems. While P4
and P5 fitting models are useful in that they provide reasonable estimates of analyte
concentration by back-fitting collected data without incorporating too many parameters,
their estimates of error are less reliable than using the law of mass action and they do not
allow the ultimate LOQ to be determined [1,35].
More recent models of detection statistics have relied on models built from
Bayes’ theorem to define the LOD as both the probability that it exceeds a signal for a
zero dose and its probability density [1,45]. While the accuracy of determining the LOQ
is greatest using a dose-response curve based on the law of mass action, and this analysis
allows the determination of fundamental limitations that may not be surpassed, models
built from Bayes’ theorem provide more rigid requirements for the interpretation of data
as a part of routine laboratory analysis compared with traditional P4 or P5 fittings [1].
These models not only use back-fitting, but also right-skewed probability densities to
determine the extent of error both in blank calibration samples and those with target
analyte present.
When the signal from instrument background is minimized and non-specific
binding is effectively eliminated, molecular shot noise is responsible for establishing the
fundamental statistical LOQ for immunoassay. In this case uncertainty associated with
sample heterogeneity at low analyte concentrations dictates the ultimate limit of
quantification (Figure 3, Equation 10). The assay plots show that regardless of sample
volume, in order to establish certainty in the quantification of an analyte, there must be a
minimum of 131 molecules specifically detected. Because the error associated with
molecular shot noise, coupled with a minimal variance from the instrument and baseline,

147
below this number of molecules corresponds to a coefficient of variation greater than
10% the sample may only be potentially detected, not quantified. Establishing a
fundamental limitation to the LOQ is important both in the design of immunoassay
platforms and the evaluation of existing techniques. As detection instrumentation has
improved to the point where sensing a single molecule is possible, many claims of single-
molecule immunoassays have been made [26-28]. However, despite using
instrumentation capable of sensing individual signals, the actual limits of quantitation are
much higher, falling in the aM range and reaching a minimum of 800 molecules
quantified [28]. While claims of single molecule detection have not yet successfully
approached the fundamental LOQ imposed by MSN, it is necessary to quantitatively
establish this absolute limit and assess the impact of additional noise sources that may be
present in an experimental immunoassay such that new assays may be appropriately
designed to meet the quantitation requirements of specific target species.
Beyond the limitations imposed by MSN, quantification can be impacted by
uncertainty bias and variance introduced through non-specific binding. Non-specific
binding must always be considered when discussing limit of quantitation for
immunoassay. While MSN imposes a fundamental LOQ for immunoassays that cannot
be improved, NSB is likely to occur to some extent in experimental immunoassay
systems. It is particularly relevant in assays used for medical diagnostics, where desired
targets are of relatively low concentration and present in a highly complicated sample.
When present, NSB will impose a further limit on the minimal concentration quantified
by a given system. This can be observed in that when even one molecule binds non-
specifically the LOQ increases from 4.3 to 5.0 aM (Figure 4, bottom).

148
When background noise from the instrument is higher than the signal intensity
arising from molecular shot noise or non-specific binding, the limit of quantification is
dependent only upon what can be effectively distinguished from this baseline signal.
When the LOQ is dictated by the instrumentation, the effects of MSN are of minimal
importance due to the higher numbers of target analyte required for a sample to be
recognized above the background noise. For a given instrumental system this background
noise is a constant source and cannot be altered by adjusting experimental parameters.
However, with the use of a highly sensitive detection instrument capable of sensing the
presence of a single molecule, background noise can be sufficiently lowered leading to
quantitation bound by the limits of the assay itself.
5.5 Concluding Remarks
Due to the high specificity of the interaction between antibodies and antigens,
immunoassays provide a valuable tool when sensitive detection is required. Often, these
assays are used to determine the concentration of a particular biologically relevant target.
When used as a quantitative tool, the limitations of immunoassays have a theoretical floor
bound by molecular shot noise. While detection may still take place below this limit, it
can only be considered qualitative since the uncertainty (error) associated with the
measurement becomes too great (above 10%). While practical limitations, like non-
specific binding or baseline instrumental noise, may result in a higher LOQ for
experiments, there cannot be quantitation with acceptable certainty if samples contain
fewer than 131 detected antigen target molecules since signal outputs will be formed
from rare events and be subject to statistical sampling effects. Therefore, true

149
quantification limits lie not at the single molecule level, but in the atto- to femtomolar, or
poorer, range.
The models employed here to establish the fundamental qualitative ability for
noncompetitive sandwich immunoassays can be employed to assess the ability of an
experimental design to quantify targets under the parameters that will be used. This
provides a valuable tool for predicting the utility of an assay for its intended application,
as well as an aid in the assay design process.
5.6 References
[1] Brown, E. N., McDermott, T. J., Bloch, K. J., McCollom, A. D., Clinical
Chemistry 1996, 42, 893-903.
[2] Ekins, R., Kelso, D., Clin. Chem. 2011, 57, 372-375.
[3] Cook, D. B., Selt, C. H., Clinical Chemistry 1993, 39, 965-971.
[4] Miles, L. E. M., Hales, C. N., Nature 1968, 219, 186-189.
[5] Ishikawa, E., Hashida, S., Kohno, T., Hirota, K., Clinica Chimica Acta 1990,
194, 51-72.
[6] Ylander, P. J., Hanninen, P., Biophysical Chemistry 2010, 151, 105-110.
[7] Klenin, K. V., Kusnezow, W., Langowski, J., J. Chem. Phys. 2005, 122,
214715-1-214715-11.
[8] Rodbard, D., Feldman, Y., Immunochemistry 1978, 15, 71-76.
[9] Sadana, A., Chen, Z., Biosensors and Bioelectronics 1996, 11, 17-33.
[10] Werthen, M., Nygren, H., Journal of Immunological Methods 1988, 115, 71-78.
[11] Nygren, H., Werthen, M., Stenberg, M., Journal of Immunological Methods
1987, 101, 63-71.

150
[12] Nygren, H., Stenberg, M., Immunology 1989, 66, 321-327.
[13] Stenberg, M., Nygren, H., J. theor. Biol. 1985, 113, 589-597.
[14] Stenberg, M., Stiblert, L., Nygren, H., J. theor. Biol. 1986, 120, 129-140.
[15] Beumer, T., Haarbosch, P., Carpay, W., Anal. Chem. 1996, 68, 1375-1380.
[16] Pesce, A. J., Michael, J. G., Journal of Immunological Methods 1992, 150, 111-
119.
[17] Stenberg, M., Nygren, H., Journal of Immunological Methods 1988, 113, 3-15.
[18] Rodbard, D., Feldman, Y., Jaffe, M. L., Miles, L. E. M., Immunochemistry
1978, 15, 77-82.
[19] Jackson, T. M. , Ekins, R. P., Journal of Immunological Methods 1986, 87, 13-
20.
[20] Glass, T. R., Ohmura, N., Saiki, H., Anal. Chem. 2007, 79, 1954-1960.
[21] Seth, J., Clinical Chemistry 1990, 36, 178.
[22] Kalman, S. M., Clark, D. R., Moses, L. E., Clin. Chem. 1984, 30, 515-517.
[23] Currie, L. A., Analytical Chemistry 1968, 40, 586-593.
[24] Yalow, R. S., Berson, S. A., Nature 1959, 184, 1648-1649.
[25] Hassibi, A., Vikalo, H., Hajimiri, A., Journal of Applied Physics 2007, 102,
014909-1-014909-12.
[26] Rissin, D. M., Kan, C. W., Campbell, T. G., Howes, S. C., Fournier, D. R.,
Song, L., Piech, T., Patel, P. P., Chang, L., Rivnak, A. J., Ferrell, E. P., Randall,
J. D., Provuncher, G. K., Walt, D. R., Duffy, D. C., Nature Biotechnology,
2010, 28, 595-599.
[27] Tessler, L. A., Mitra, R. D., Proteomics 2011, 11, 4731-4735.

151
[28] Schmidt, R., Jacak, J., Schirwitz, C., Stadler, V., Michel, G., Marme, N.,
Schutz, G. J., Hoheisel, J. D., Knemeyer, J. P., Journal of Proteome Research
2011, 10, 1316-1322.
[29] Hashida, S., Ishikawa, E., J. Biochem. 1990, 108, 960-964.
[30] Ohmura, N., Lackie, S. J., Saiki, H., Anal. Chem. 2001, 73, 3392-3399.
[31] Chang, L., Rissin, D. M., Fournier, D. R., Piech, T., Patel, P. P., Wilson, D. H.,
Duffy, D. C., Journal of Immunological Methods 2012, 378, 102-115.
[32] Shalev, A., Greenberg, A. H., McAlpine, P. J., J. Immunol. Meth. 1980, 38, 125-
39.
[33] Harris, C. C., Yolken, R. H., Krokan, H., Hsu, I. C., Proc. Natl. Acad. Sci. USA
1979, 76, 5336-5339.
[34] Hungerford, J. M., Christian, G. D., Anal. Chem. 1986, 58, 2567-2568.
[35] Diamandis, E.P., Christopoulos, T.K., Immunoassay (theory of immunoassays
CH 3) 1996, 25-49.
[36] Ezan, E., Tiberghien, C., Dray, F., Clin. Chem. 1991, 37, 226-230.
[37] Yalow, R., Diabetes, 1961, 10, 339-344.
[38] Ractliffe, J. F., Elements of Mathematical Statistics, (the normal distribution CH
7) 1967, 51-68.
[39] Ewing, G.W., Chemical Instrumentation: XXXIX. Signal to Noise Optimization
in Chemistry. Chemical Education, 1968. 45(7): p. A533-A544.
[40] Johnson, J.B., Thermal Agitation of Electricity in Conductors. Physical Review,
1928. 32(1): p. 97-109.
[41] Nyquist, H., Thermal Agitation of Electric Charge in Conductors. Physical
Review, 1928. 32(1): p. 110-113.

152
[42] Abcam plc., 2015,
http://www.abcam.com/index.html?pageconfig=resource&rid=15749&source=p
agetrap&viapagetrap=kd.
[43] Voet, D., Voet, J.G., Pratt, C.W., Fundamentals of Biochemistry (Antibodies
Section 7.3) 2008, 209-215.
[44] Guo, Y., Harel, O., Little, R. J., Epidemiology 2010, 21, S10-S16.
[45] O’Malley, A.J., Deely, J.J., Aust. N.Z. J. Stat., 2003, 45, 43-65.

153
CHAPTER 6
IMMUNOASSAY TARGET SAMPLE PREPARATION USING DC GRADIENT
INSULATOR DIELECTROPHORESIS
6.1 Introduction
Early illness intervention requires the capability of monitoring relatively small
concentration changes in disease indicated species. Because it contains the most
comprehensive depiction of the physiological state of an individual, blood, and in
particular plasma, has become the primary sample fluid used in clinical diagnostics [1-3].
However, owing to a high dynamic range spanning over 10 orders of magnitude, as well
as the presence of a few high abundance proteins (albumin, immunoglobulins, transferrin,
haptoglobin, and lipoproteins), detection of species related to specific disease states is
challenging [2-4]. Beyond the complexity of the plasma proteome, whole-blood samples
also contain cells (platelets, red blood cells, and white blood cells) that may interfere with
specific target detection if not removed [5].
Many clinical diagnostic methods rely on biological recognition, through the use
of immunoassay techniques [6,7]. The specific interaction between the target molecule
and antibody allows for quantitative testing to take place. However, in the use of whole-
blood or plasma one-step assays without prior sample simplification cross-reactivity
limits the LOQ to the nM to μM range [8,9,10]. With the effective removal of
contaminating species, highly sensitive quantitation of target analytes is possible [11-13].
Specific detection at this level is sufficient to quantify the low abundance proteins that
are of interest in diagnostics [1,3].

154
Currently, centrifugation is most commonly used to eliminate cells from a blood
sample [14,15]. Sample testing is primarily performed in centralized clinical laboratories
and requires relatively large volumes of blood (mL) as well as long analysis times [16].
By moving from a centralized laboratory to portable micro-total analysis systems
(μTAS), it is possible to incorporate a separations based strategy such that more
information (both from blood cells and protein analysis) can be extracted from a minimal
sample volume in a short analysis time. Achieving this minimally invasive, rapid
diagnostic ability while maintaining high sensitivity requires sample preparation steps
prior to detection. Separation techniques not only allow the removal of cross-reactive
species for more sensitive quantitation, but provide the potential for multiplex detection.
Many experimental microfluidic techniques exist for the separation of blood cells
from plasma. These technologies include manipulation and separation based on
mechanical, inertial, hydrodynamic, optical, magnetic and electrical methods [14,17-20].
Particularly appealing among these techniques is the use of dielectrophoresis (DEP)
because it allows the rapid and selective manipulation of neutral (as well as charged)
bioparticles in a label-free system [17,21]. When species are introduced into a non-
homogeneous electric field they are exposed to a DEP force according to the relation
[22]:
𝐹𝐷𝐸𝑃 = 2𝜋𝜀𝑚𝑅3𝐶𝑀(𝛻𝐸2) Eq. 6.1
where εm is the permittivity of the medium the species is placed in, R is the radius of the
particle, CM is the Clausius-Mossotti factor related to the permittivity of the particle
compared to that of the medium and E is the amplitude of the electric field. While this
equation includes some simplifications, assuming that the particle is homogeneous and

155
uncharged while the induced polarization once the field E is applied takes the form of a
dipole moment, it is able to accurately predict the reaction of species to the DEP force.
DEP has been used successfully to isolate yeast cells [23], prostate cancer cells [24], ccf-
DNA [25], and red blood cells [26].
Here, insulator-based DEP (iDEP) was performed in a microchannel with
insulating sawtooth features along the channel sides to create an inhomogeneous electric
field. The device used is the second-generation iteration of that described in previous
work [26], and was employed to remove red blood cells from a sample containing heart-
type fatty-acid binding protein (H-FABP) or myoglobin to model the simplification of a
blood sample prior to cardiac biomarker detection. Progressive changes to the distance
between teeth (gate width) create increasing field strength along the length of the
channel. When the magnitude of the DEP force is great enough to counter the effects of
the electroosmotic flow (EOF) and electrophoresis (EP) forces driving analyte movement
down the channel, species will be trapped. Effective trapping of the red blood cells
without affecting protein movement through the channel suggests that this technique
could be valuable as a first step in a μTAS system for the analysis of whole-blood where
centrifugation is not practical due to the small scale of the system. The small sample
volumes required by downstream detection methods are compatible in scale with the
volume requirements needed for RBC removal by incorporating iDEP as an initial sample
preparation step in a μTAS. This approach allows downstream analysis of proteins using
sensitive immunoassay techniques without interference from abundant blood cells and
with small sample volume requirements that allow complete analysis of limited samples
or routine serial-monitoring of disease progression without becoming invasive.

156
6.2 Materials and Methods
6.2.1 Microdevice Fabrication
The sawtooth geometry of the microchannel has been previously described
(Figure 6.1) [26]. In these experiments the channel length was 4 cm, with a uniform depth
of 20 μm. The initial gate width was 73.3 μm and the final gate width was 25.3 μm. The
device was fabricated using standard soft lithography techniques. Briefly, the channel
was designed using Adobe Illustrator (Adobe Systems Inc., San Jose, CA) and printed
onto a chrome-glass photomask (JD Photo-Tools LTD., Oldham, Lancashire, UK). A
silicon wafter was made from the photomask using photolithography and dry etching
techniques. From the silicon wafer, PDMS casts were made using a Sylgard 184 silicone
elastomer kit (Dow Corning Corp., Midland, MI, USA). Access holes were generated
using a 3 mm Harris Uni-Core punch (Shunderson Communications Inc., Orleans,
Ontario, Canada). Casts were stored at -20°C until use. Prior to device assembly, PDMS
casts were washed with isopropanol, acetone, and 18 mΩ water, then sonicated for 30
seconds (Aquasonic ultrasonic cleaner, VWR International, Radnor, PA, USA).
Similarly, glass microscope slides (VWR International) were washed and sonicated for
10 seconds. Slides and PDMS casts were dried using N2 gas and treated with a high level
of O2 plasma for 60 seconds (Plasma Cleaner, Harrick Plasma, Ithaca, NY, USA) before
contact sealing. Once sealed, the channel was rinsed with 115 mM sodium phosphate
buffer at pH 7.4 and treated with 4 mg/mL BSA to reduce electroosmotic flow (EOF) and
prevent nonspecific absorption prior to sample introduction.

157
6.2.2 Red Blood Cell and Protein Labeling
Fresh whole blood was obtained through fingerstick from a human donor and
suspended in 1 mL of isotonic buffer with 1.8 mg/mL ethylenediaminetetraacetic acid
(EDTA). The sample was immediately centrifuged and pelleted red blood cells (RBCs)
were resuspended in buffer. After three wash steps to remove plasma, the RBC sample
was stained as previously described [26]. The final cell pellet was resuspended in 115
mM sodium phosphate buffer at pH 7.4 with a cell count at 111 cells/nL based on the
presumed mean corpuscular volume (MCV) of 90 fL [27].
Purified human myoglobin (7.33 mg/mL) was purchased from MyBioSource and used as
received. Purified human heart-type fatty acid binding protein (2.02 mg/mL) was
purchased from Life Diagnostis and used as recieved. NHS-Rhodamine (Thermo
Scientific) was dissolved in DMSO (Invitrogen) to a concentration of 10 mg/mL. Volume
of NHS-Rhodamine was added dropwise to myoglobin and the sample was incubated in
the dark at room temperature for 1 hour with shaking. Volume of NHS-Rhodamine was
added to FABP and reacted in the same manner. Crude reaction mixtures were added to
dialysis cups (Thermo Scientific) with a molecular weight cut-off of 3,500 Daltons.
Samples were dialyzed in 100 mM PBS, pH 7.2 overnight. Proteins were diluted in the
RBCs to ratios of 1:200 μL (MyO) and 3:200 μL (FABP) for analysis in the DEP device.
6.2.3 Experimental
Channels were filled with roughly 10 μL of a mixture of the fluorescently labeled
protein and red blood cells and filled through capillary action. Flow was stopped by
balancing the menisci at the entrance and exit of the channel through the addition of
running buffer to the outlet reservoir. Platinum electrodes (diameter 0.25 mm) were

158
inserted into the access ports in the PDMS and potentials were applied to the channel
using a LabSmith power supply (Series HV5448, LabSmith Inc., Livermore, CA, USA).
Potentials ranging from 100 to 500 ΔV were applied globally to the device, resulting in
an electric field strength of 25 to 125 V/cm.
Data collection was achieved using an inverted microscope (Olympus IX70)
illuminated by a mercury lamp. Light was passed through an Olympus DAPI, FITC,
Texas Red triple band-pass cube (Olympus, Center Valley, PA) used for fluorescence
microscopy. Video and still images were collected using a CCD camera (QImaging, Inc.,
Surrey, British Columbia, Canada) connected to image capture software (Streampix 5,
NorPix, Montreal, Quebec, Canada). ImageJ (NIH, Bethesda, MD) was used for video
analysis. Fluorescence intensity was measured just upstream of gates where capture of
RBCs was observed.
Figure 6.1 Schematic of the iDEP microchannel used. Devices were fabricated from a
glass microscope slide and PDMS.
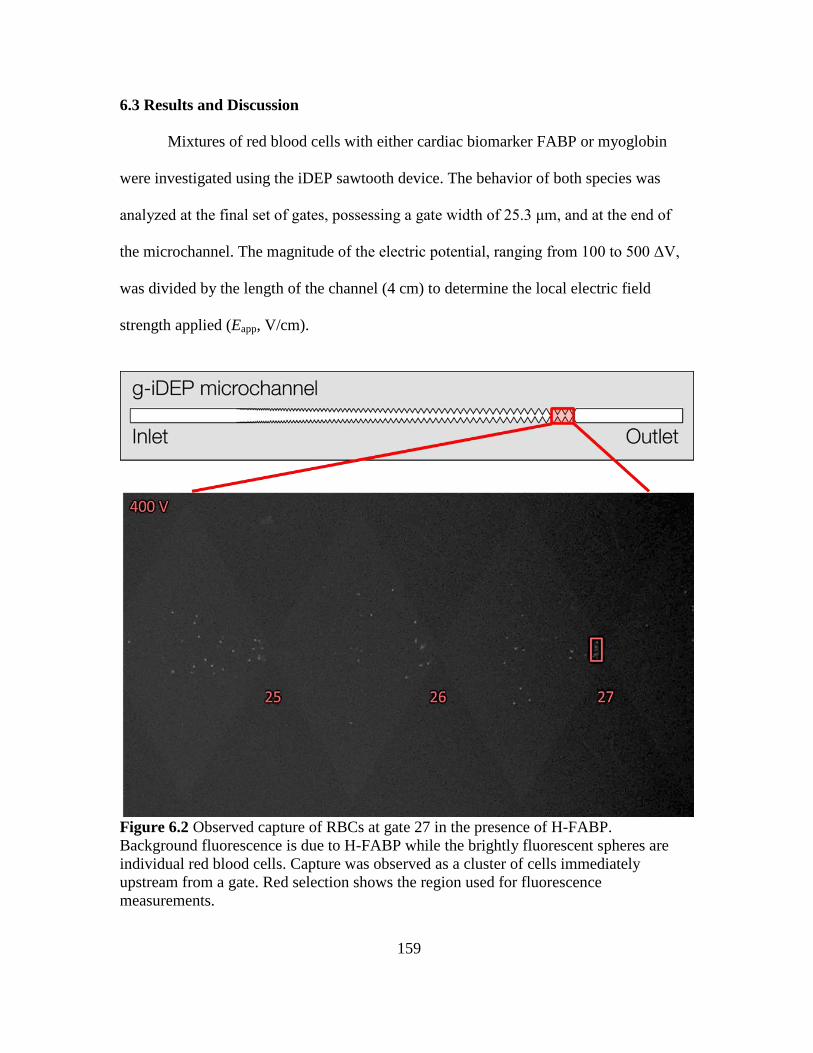
159
6.3 Results and Discussion
Mixtures of red blood cells with either cardiac biomarker FABP or myoglobin
were investigated using the iDEP sawtooth device. The behavior of both species was
analyzed at the final set of gates, possessing a gate width of 25.3 μm, and at the end of
the microchannel. The magnitude of the electric potential, ranging from 100 to 500 ΔV,
was divided by the length of the channel (4 cm) to determine the local electric field
strength applied (Eapp, V/cm).
Figure 6.2 Observed capture of RBCs at gate 27 in the presence of H-FABP.
Background fluorescence is due to H-FABP while the brightly fluorescent spheres are
individual red blood cells. Capture was observed as a cluster of cells immediately
upstream from a gate. Red selection shows the region used for fluorescence
measurements.

160
The dielectrophoretic behavior of RBCs was consistent with prior general
observations in the sawtooth microchannel [26]. When fluid flow was balanced and
potential was applied to the microchannel the bulk motion of particles was oriented
toward the outlet reservoir (cathode) due to the combined forces of EP and EOF. Neither
RBC or protein capture were observed at any voltage in regions of the channel having a
gate width greater than 26.2 μm (size of second-to-last set of gates). In regions with a
larger gate width all fluorescent material traveled toward the cathode. Capture was
defined by the collection of RBCs immediately prior to a gate (Figure 6.2). As the gate
widths become smaller in the microchannel the dielectrophoretic force experienced by
the sample increases, reaching a local maxima at the entrance to the gate. Since the
negative DEP force opposes the combined forces of EP and EOF, when the DEP force is
equal or greater than the combined forces.

161
Figure 6.3 Quantitation of red blood cell capture by monitoring fluorescence intensity.
Average percent fluorescence increase observed at gates 24 and 27 from 5 different
devices and sample preparations of RBCs and FABP. Error bars show the standard
deviation. Inset: Percent increase in fluorescence intensity observed at gate 27 after Eapp.
Onset of capture is observed when Eapp = 300 V (75 V/cm). Capture is observed to a
lesser extent at gate 24 with an Eapp = 300 V. Capture at gate 24 increases with higher
Eapp. At all values of Eapp the fluorescence intensity of protein within the channel
(background fluorescence in channel) is observed to remain unchanged.
The capture of RBCs occurred at 25.3 μm gates with an onset of Eapp = 300 V
applied globally across the device. Capture was observed at 26.2 μm gates minimally at
Eapp = 300 V, with greater material accumulation between Eapp = 400 and 500 V. The
cardiac biomarker proteins were not observed to capture at any Eapp tested and instead
were able to flow freely through the device. Below an Eapp value of 300 V no capture
occurred even at extended time periods of applied voltage. Control studies without
protein showed similar capture of RBCs without the diffuse fluorescence observed
162
throughout the channel in the presence of protein. With an applied voltage meeting the
threshold required for RBC capture, material continued to collect during the time voltage
was on in regions just prior to a gate. Extent of RBC capture was monitored by
determining the local fluorescence intensity increase in regions with observed RBC
collection. Repeated experiments show a similar behavior of the RBCs. Figure 6.3 shows
the average fluorescence intensity for data collected from 5 different devices with
separate preparations of RBCs and H-FABP. Error bars show the standard deviation of
data sets.The extent of capture was dependent not only on the Eapp, but on the location
within the channel (Figure 6.3 inset). RBCs were observed to collect at lower voltages
and to a greater extent at the smallest gates in the channel before they were captured
further upstream. For all values of Eapp tested, the fluorescence intensity resulting from
H-FABP was unchanged. Myoglobin studies produced a similar trend (data not shown).
Variables that could not be specifically controlled, such as staining efficiency of the
RBCs, contribute to the variance observed between samples. Staining efficiency of the
RBCs was determined by inspection of samples at relatively high magnification under
both fluorescence and bright-field microscopy. In all cases staining efficiency was
observed to be about 45%, but varied between 40% and 50% percent despite identical
preparation protocols.

163
Figure 6.4 Depletion of RBCs in the exit channel beyond the final sawtooth gate. In each
image Eapp is 400 V globally across the device (100 V/cm).
Changes in fluorescence intensity were also measured in a small region directly
following the final gate in the microchannel. Using an Eapp of 400 V to ensure complete
capture of RBCs at the 25.3 μm gate, fluorescence was monitored at one minute
increments to assess the depletion of RBCs in the sample that could be collected at from
the exit reservoir (Figure 6.4). Both visual determination of RBCs present and
fluorescence measurements in this region support that, once significant voltage is applied

164
across the channel, complete capture of RBCs occurs (Figure 6.5). This capture allows
simplification of the initial sample, enabling easier quantitation of the protein target in the
exit channel.
Figure 6.5 A) Fluorescence measurements and B) RBC counts present in the exit channel
after and Eapp of 100 V/cm.
Extraction of protein samples was attempted from the exit channel using a
hypodermic needle to remove fluid. Under the current configuration of the device, sample
removal and quantitation is not practical due to issues in removing a great enough sample
volume for off-chip manipulation and detection. While not demonstrated in this work, it
is possible that the iDEP channel could be incorporated as the initial sample preparation
step in next-generation μTAS for the separation and analysis of complex biological
samples. Incorporation of further separation of eluted proteins using electrophoretic
0
5
10
15
20
25
30
35
40
45
50
6200
6300
6400
6500
6600
6700
6800
6900
7000
0 1 2 3 4 5 6
RB
C (
Co
un
ted
)
Sign
al I
nte
nsi
ty (
Arb
.Un
its)
Time (min)
Impact of RBC Capture
Total Fluorescence Intensity (Exit Channel)RBC Count (Exit Channel)

165
manipulation, which has been demonstrated to be effective in the isolation of charged
species [21], as well as on-chip detection through high-sensitivity immunoassay could
allow multiplex detection of biomarkers.
6.4 Concluding Remarks
Using an iDEP microdevice with a sawtooth pattern insulated channel the
effective removal of RBCs from solutions containing cardiac biomarkers H-FABP or
myoglobin. Behavior of the RBCs was consistent with previous observations in an iDEP
microchannel [26]. The results shown here indicate that RBCs can be successfully
captured using DEP and removed from a sample containing protein species, which were
unaffected by the electric potentials applied. Removal of blood cells from plasma
samples is a necessary first step in sample preparation prior to quantitative detection in
medical diagnostics. While centrifugation techniques are traditionally utilized to achieve
cell removal, this method is not practical on a microscale level. Here, it is shown that
iDEP can be used as an alternative initial step in sample simplification compatible with
incorporation into a μTAS system for the quantitative detection of multiple biomarkers.
6.5 References
[1] Fan, R., Vermesh, O., Srivastava, A., Yen, B.K.H., Qin, L., Ahmad, H., Kwong,
G.A., Liu, C.C., Gould, J., Hood, L., Heath, J.R., Nature Biotechnology, 2008,
26, 1373-1378.
[2] Anderson, N.L., Anderson, N.G., Molecular and Cellular Proteomics, 2002,
1.11, 845-867.
[3] Bellei, E., Bergamini, S., Monari, E., Fantoni, L.I., Cuoghi, A., Amino Acids,
2011, 40, 145-156.
[4] Tirumalai, R.S., Chan, K.C., Prieto, D.A., Issaq, H.J., Conrads, T.P., Veenstra,
T.D., Molecular and Cellular Proteomics, 2006, 2.10, 1096-1103.

166
[5] Yan, S., Zhang, J., Alici, G., Du, H., Zhu, Y., Li, W., Lab Chip, 2014, 14, 2993-
3003.
[6] Moschallski, M., Evers, A., Brandsetter, T., Ruhe, J., Analytica Chimica Acta, 2013,
781, 72-79.
[7] Moschallski, M., Baader, J., Prucker, O., Ruhe, J., Analytica Chimica Acta, 2010,
671, 92-98.
[8] Martin, R.M., Patel, R., Oken, E., Thompson, J., Zinovik, A., Kramer, M.S.,
Vilchuck, K., Bogdanovich, N., Sergeichick, N., Foo, Y., Gusina, N., Plos One,
2013, 8, 1-10.
[9] Liang, W., Li, Y., Zhang, B., Zhang, Z., Chen, A., Qi, D., Yi, W., Hu, C.,
Biosensors and Bioelectronics, 2012, 31, 480-485.
[10] Tachi, T., Kaji, N., Tokeshi, M., Baba, T., Lab on a Chip, 2009, 9, 966-971.
[11] Zhang, B., Liu, B., Zhou, J., Tang, J., Tang, D., Applied Materials and
Interfaces, 2013, 5, 4479-4485.
[12] Chandra, P., Abbas Zaidi, S., Noh, H.B., Shim, Y.B., Biosensors and
Bioelectronics, 2011, 28, 326-332.
[13] Svateck, R.S., Shah, J.B., Xin, J., et al., Cancer, 2010, 116, 4513-4519.
[14] Carlo, D.D., Edd, J.F., Irimia, D., Tompkins, R.G., Toner, M., Analytical
Chemistry, 2008, 80, 2204-2211.
[15] Javanmard, M., Emaminejad, S., Gupta, C., Provine, J., Davis, R.W., Howe,
R.T., Sensors and Actuators B, 2014, 193, 918-924.
[16] Dimov, I.K., Basabe-Desmonts, L., Garcia-Cordero, J.L., Ross, B.M., Ricco,
A.J., Lee, L.P., Lab on a Chip, 2011, 11, 845-850.
[17] Li, M., Li, W.H., Zhang, J., Alici, G., Wen, W., Journal of Physics D: Applied
Physics, 2014, 47, 1-30.

167
[18] Jung, J., Han, K.H., Applied Physics Letters, 2008, 93, 223902-1-3.
[19] Gossett, D.R., Carlo, D.D., Analytical Chemistry, 2009, 81, 8459-8465.
[20] VanDelinder, V., Groisman, A., Analytical Chemistry, 2007, 79, 2023-2030.
[21] Demircan, Y., Ozgur, E., Kulah, H., Electrophoresis, 2013, 34, 1008-1027.
[22] Pethig, R., Biomicrofluidics, 2010, 4, 022811-1-35.
[23] Zhu, H., Lin, X., Su, Y., Dong, H., Wu, J., Biosensors and Bioelectronics, 2015,
63, 371-378.
[24] Huang, C., Liu, H., Bander, N.H., Kirby, B.J., Biomed Microdevices, 2013, 15,
941-948.
[25] Sonnenberg, A., Marciniak, J.Y., Skowronski, E.A., Manouchehri, S., Rassenti,
L., Ghia, E.M., Widhopf II, G.F., Kipps, T.J., Heller, M.J., Electrophoresis,
2014, 35, 1828-1836.
[26] Jones, P.V., Staton, S.J.R., Hayes, M.A., Anal Bioanal Chem, 2011, 401, 2103-
2111.
[27] Turgeon, M.L., Clinical Hematology: Theory and Procedures (Principles of
Blood Collection, CH 2), 2004, 18-40.

168
CHAPTER 7
ISOLATION OF CARDIAC BIOMARKER PROTEINS USING
ELECTROPHORETIC EXCLUSION
7.1 Introduction
In clinical diagnostics the parallel detection of biomarker proteins is of particular
importance since no single marker has proven to have sufficient diagnostic accuracy for
AMI, or a variety of other conditions in which early detection may improve prognosis [1-
3]. In the case of clinical diagnostics, plasma has become the primary sample fluid used
because it contains the most complete version of the human proteome, including both
classical plasma proteins as well as those present from tissue leakage [4-6]. While the
protein content in plasma holds great diagnostic potential, protein concentrations in
plasma span over 10 orders of magnitude and species of interest such as biomarkers are
often present in very low concentrations [5-7]. Multiplex testing has been performed in
many cases through batch incubation using monoclonal antibodies specific to each target
species [8,9]. However, when the quantification of species from a complex primary
sample is required, the potential for cross-reactivity becomes a significant concern
[10,11].
In recent years, several microfluidic scale separation-based techniques have been
employed as a sample pre-treatment step in the analysis of plasma [12-18]. These
techniques include the use of physical barriers to filter the sample [12,13], as well as
electrophoretic separation methods [14-18]. Of particular interest among electrophoretic
separation techniques are those that operate using counter-flow along with a gradient for
the isolation and concentration of target species [16-18]. While counter-flow separations

169
have been achieved through pH or conductivity focusing, the use of an electric field
gradient allows isolation and concentration to occur outside a separation channel.
The use of an electric field gradient as a counter to hydrodynamic flow, termed
electrophoretic exclusion, was first used to isolate small molecules [18]. This technique
enables the separation of species having different electrophoretic mobilities (μa).
Assuming that hydrodynamic flow and buffer conditions remain constant throughout
sample manipulation, the strength of an applied electric field may be altered to separate
target species based on these differences. Exclusion of a target species from a channel is
accomplished by maintaining a constant electric field across reservoirs connected to
channels in a device and introducing a sharp electric field gradient in microchannels
connecting these reservoirs. When the electrophoretic velocity of a target species (𝑣𝑎),
according to:
𝑣𝑎 = 𝜇𝑎𝐸 7.1
My work was performed as an extension of investigations performed in a microdevice
demonstrating the first use of electrophoretic exclusion to separate small molecules on a
microscale, as well as the use of a macroscale benchtop device for the manipulation of
proteins [18, 19]. The development of a separations-based array previously allowed for
the isolation of multiple small molecules and has been shown here to be effective in the
exclusion and concentration three cardiac biomarker proteins [20]. The device contains
three separation channels connected in parallel to form an array [12]. With electric field
gradients applied at the entrance of channels connecting the reservoirs within the array,
the magnitude of the electrophoretic velocity can be manipulated until it balances the
hydrodynamic flow and prevents the entry of target species resulting in concentration

170
within a reservoir. The ability to separate and concentrate these target molecules provides
a foundation for the development of a micro-total analysis system (μTAS) offering
parallel quantitation of biomarker panels from untreated whole blood samples. This
method allows downstream analysis of proteins using sensitive immunoassay techniques
without interference from abundant plasma proteins and with small sample volume
requirements that allow complete analysis of limited samples or routine serial-monitoring
of disease progression without becoming invasive.
7.2 Materials and Methods
7.2.1 Microdevice Fabrication
A photograph of the device used for protein separation (top view) and a schematic
of the array is shown (Figure 7.1A). The hybrid glass/PDMS array was used for all
experiments. Each device contained a large entrance reservoir, three central reservoirs
and three exit reservoirs connected by separation channels. The development of this
device has been discussed previously [1,2], and is briefly discussed below.
7.2.1.1 PDMS
A single separation array consisted of an entrance reservoir connected to a three
central and exit reservoirs through separation channels. The entrance reservoir was 19
mm x 5 mm, all central and exit reservoirs were 5 mm x 5 mm and channels were 1 mm
long and 100 μm wide with a uniform depth of 10 μm throughout the device. Masks were
designed using Illustrator (Adobe, San Jose, CA, USA) and were printed on a
transparency using a resolution of 65,000 dpi (Fine Line Imaging, Colorado Springs, CO,
USA). Positive photoresist AZ 4620 was spun onto a silicon wafer and exposed at 500
mJ/cm2 using an EVG
®620 Automated UV-NIL, μ-CP System (EV Group, St. Florian

171
am Inn, Austria) using the transparency as a mask. The array was then fabricated using
common soft lithography techniques. Using Sylgard 184 (Dow Corning, Midland, MI,
USA) a 10:1 mass ratio of polymer and curing agent was prepared and poured onto the
wafer at a thickness of roughly 5 mm. This was allowed to sit at room temperature for 15
minutes and cured at 70°C for 60 min. The cured PDMS was then removed from the
wafer and 3 mm diameter holes were punched in the entrance and exit reservoirs using a
Harris Uni-Core punch (Shunderson Communications Inc., Orleans, Ontario, Canada).
7.2.1.2 Electrode Fabrication
Ti/Pt electrodes were plated on standard microscope slides (VWR International).
A mask was designed using Adobe Illustrator and printed on transparency using a
resolution of 8000 dpi (Fine Line Imaging, Colorado Springs, CO USA). Electrodes were
plated 500 μm wide bracketing each reservoir on three sides to produce a flat potential
within a reservoir and promote exclusion in channels connecting reservoirs. A schematic
of the electrode design is shown (Figure 7.1B). Positive photoresist AZ 4330 was spun
onto microscope slides and exposed at 150 mJ/cm2 with the EVG
®620 Automated UV-
NIL, μ-CP System using the transparency mask. Electron beam evaporation was used to
deposit two layers of metal on the glass microscope slides (PVD75, Kurt J. Lesker
Company, Jefferson Hills, PA, USA). A 300 Ǻ layer of Ti was deposited onto the slides
followed by 500 Ǻ of Pt. Electric leads were attached at the base of the slide using silver
conductive epoxy for connection to an external power supply (Series HV5448, LabSmith
Inc., Livermore, CA, USA) through a house-made voltage divider.

172
7.2.2 Protein Labeling and Sample Preparation
Aspartic acid (Sigma-Aldrich, St. Louis, MO, USA) and DMSO (Mallinckrodt)
were used as received. Aspartic acid buffer was prepared at a 5 mM concentration and pH
of 2.95 using 18 MΩ Milli-Q water. Purified human myoglobin (7.51 mg/mL) , purified
cTnI (1.07 mg/mL) and H-FABP (2.2 mg/mL) were purchased from Life Diagnostics.
Myoglobin and H-FABP were used as received in PBS, cTnI was dialyzed to 100 mM
PBS, pH 7.2 prior to use. NHS-Fluorescein and NHS-Rhodamine (Thermo Scientific)
were dissolved in DMSO to concentrations of 10 mg/mL. 3.0 μL of NHS-Rhodamine
was added to myoglobin and the sample was incubated in the dark at room temperature
for 1 hour with shaking. NHS-Fluorescein was added to cTnI (1.5 μL) and H-FABP (3.0
μL) and reacted in the same manner. The crude reaction mixtures were added to dialysis
cups (Thermo Scientific) with a molecular weight cut-off of 3,500 Daltons. Samples were
dialyzed in 100 mM PBS, pH 7.2 overnight. Proteins were diluted with aspartic acid
buffer to concentrations of 0.33 mg/mL Myoglobin, 0.2 mg/mL cTnI and 0.22 mg/mL H-
FABP prior to analysis.
7.2.3 Experimental
The PDMS layer and glass slide with electrodes were bonded using oxygen
plasma operated at high radio frequency (RF) for 60 s (Plasma Cleaner, Harrick Plasma).
The array was filled with fluorescently labeled protein samples by pipetting the solution
into the entrance reservoir. Channels were filled through capillary action and bulk flow
was directed toward the exit reservoirs by the difference in height between the menisci of
the entrance and exit reservoirs. A total of 21 μL of solution was added to each device.

173
Potentials were applied so that exclusion of individual proteins could be observed near
the entrance to exit channel 2 and entrance channel 3.
Data collection used an inverted microscope with fluorescence capabilities (IX70,
Olympus) using a 100 W high-pressure Hg lamp as the light source. Light was passed
through a band-pass filter and 20X microscope objective to the array. Light emitted from
the sample was collected through a long-pass dichroic mirror and band-pass filter to a
CCD camera capable of image-capture (QICAM, Q imaging, Inc.). ImageJ (NIH,
Bethesda, MD) was used for video analysis. The fluorescence intensity was measured in
the channel to monitor protein exclusion.

174
Figure 7.1 Device used for exclusion of protein with schematic of electrode design. A) A
photograph of the complete chip (glass/PDMS hybrid) with two arrays each containing
three channels and a schematic of a single channel used for exclusion. B) Schematic
showing electrode placement around the reservoirs, promoting exclusion within channels.
7.3 Results and Discussion
When the electrophoretic velocity of a target species is greater than or equal to the
hydrodynamic counter flow, electrophoretic exclusion of that analyte is accomplished. If
exclusion occurs at the entrance to a channel within the experimental array, that analyte
may be separated from other species present in the starting sample. For electrophoretic
exclusion to occur three factors must be present: hydrodynamic flow, species having an

175
electrophoretic mobility, and an applied electric field. With experimental conditions held
constant, the hydrodynamic flow and electrophoretic mobility of investigated species are
unchanged over the time period of data collection. This allows manipulation of the
applied electric field strength such that individual species may be excluded from entering
a channel.
The effects of electrophoretic exclusion on cTnI were investigated (Figure 7.2).
Briefly, an array is filled with a solution containing the sample of interest (either an
individual protein or protein mixture) in aspartic acid buffer (pH 2.95). Initially, no
electric field is applied to the array and sample is free to flow from the entrance reservoir
towards the exit reservoirs, in the direction of hydrodynamic flow (Figure 7.2A). When
an electric field is applied across a channel such that the electrophoretic velocity of the
target protein is greater than or equal to the counter-flow, the species is prevented from
entering a channel and is concentrated within a reservoir immediately upstream of that
channel (Figure 7.2B). Once the electric field is removed, concentrated sample is again
allowed to continue in the direction of hydrodynamic flow (Figure 7.2C). The complete
exclusion of cTnI from the microchannel with an applied electric field of 65 V/cm
demonstrates the potential of this technique to isolate and concentrate proteins from
complex samples. cTnI was allowed to collect in the central reservoir over a time of 35 s.

176
Figure 7.2 Exclusion of cTnI from the entrance to exit channel two. Hydrodynamic flow
is from top to bottom. A) Graphic illustrating where exclusion behavior is observed on
the device. Fluorescence above the microchannel is due to protein, dark band observed in
central reservoir 2 is the electrode. B) Before an electric field is applied the fluorescently
labeled protein travels through the array in the direction of hydrodynamic flow.C) Once
an electric field is introduced at 65 V/cm the protein is excluded in central reservoir two.
D) After the field is released the protein may again travel with hydrodynamic flow
towards the exit reservoir.
When voltage was released the protein is concentrated compared to the original
sample (approximately 3.5 fold). By concentrating samples prior to their quantification,
greater sensitivities can be reached. This, in combination with the isolation of species
afforded using electrophoretic exclusion, hold potential as a sample pre-treatment step in
diagnostic assays requiring multiplex target quantification.
Similar behavior was observed for both myoglobin and H-FABP. Before electric
fields were applied to the array, both proteins were allowed to flow freely toward the exit
reservoirs. Once electric fields were applied at a channel entrance for 35 s, proteins were
observed to collect in the reservoir immediately upstream of that channel. For all target
species, once the electric field was removed samples were again able to enter the channel

177
and move toward the exit reservoirs in the direction of hydrodynamic flow. For studies
monitoring individual proteins, the intensity of fluorescence was quantified within the
channel. All cases were consistent with complete exclusion of the protein from the
microchannel, whereas the electric potential required to achieve this exclusion differs
among target species (Figure 7.3). In all cases it is observed that prior to the application
of an electric field, the concentration of protein within the channel remains constant.
Once potentials were applied to the channel (at t = 10 s) the protein is excluded in the
upstream reservoir and prevented from entering the channel. This results in a decrease in
fluorescence during the time the potential is applied. Following removal of the electric
field (at t = 45 s) the protein is again allowed to enter the channel and an increase in
fluorescence is observed.
Four data sets for each protein were analyzed in which the placement of the
electrodes was consistent for allowing exclusion behavior to be observed within the
channel. The electric field required to exclude each protein under these conditions
remained consistent over time. For cTnI an average electric field of 62.5 ± 6.5 V/cm was
required for exclusion. For myoglobin and H-FABP 143.8 ± 8.5 V/cm and 87.5 ± 6.5
V/cm were required, respectively.

178
Figure 7.3 Bar graph showing required potential for complete exclusion of protein from a
channel. Error bars represent standard deviation between protein preparations and
devices, as well as the electric field strength required for protein exclusion.
Alterations in the exclusion behavior (area of exclusion, speed of recovery) were
observed with changes in electrode placement between days. The slight movement of
electrodes and differences among protein samples account for the deviation in the
exclusion potential required for each protein (Figure 7.3). However, even with this
variation, the trend in exclusion behavior remained consistent, with cTnI requiring the
lowest applied field for complete exclusion and myoglobin requiring the greatest.
Different electric field strengths were applied to determine where the onset of
complete exclusion occurred (Figure 7.4). The change in intensity over the length of the
channel was calculated as the difference in fluorescence observed when the electric field
was applied and immediately following the release of the electric field and return of
protein. For cTnI, at field strengths below 55 V/cm, material is either not excluded at all,
or incomplete exclusion from the channel is observed. With fields applied below 25 V/cm
there is no evidence of exclusion (0 V/cm, 10 V/cm, 12 V/cm), and the characteristic

179
exclusion curve is no longer observed (inset). Evidence of incomplete exclusion is
observed for moderate voltages (25 V/cm and 40 V/cm) showed only the partial
exclusion of cTnI from the channel. Following the onset of complete exclusion (62.5 ±
6.5 V/cm), greater voltages produced larger regions of exclusion (data not shown), but
did not appear to further concentrate the species and required increasingly long time
periods to visualize recovery. Experiments on the exclusion of myoglobin and H-FABP
produced similar results (data not shown).
Figure 7.4 Representative change in intensity values for varying electric field strengths
over a time of 35 s applied potential for cTnI.
Experiments were performed that demonstrated the ability of electrophoretic
exclusion to separate cTnI (green) from myoglobin (red) within the array (Figure 7.5).
0.00E+00
1.00E+04
2.00E+04
3.00E+04
4.00E+04
5.00E+04
6.00E+04
7.00E+04
0 10 20 30 40 50 60
Flu
ore
sce
nce
Inte
nsi
ty C
han
ge (
AU
)
Applied Potential (V/cm)
cTnI Exclusion From Channel
0
20000
40000
60000
80000
0 50 100
Ave
rage
Flu
ore
sce
nce
In
ten
sity
(A
U)
Time (s)
Representative Intensitvy Curves
10 V (change 1V) Mean
14 V (1.4 Vchange)
25 V (2.5 Vchange)
40 V (4.0 Vchange)
55 V (5.5 VChange)

180
Based on the intensity measurements collected in-channel utilizing a blue filter cube, as
well as color images obtained from imaging through an Olympus DAPI, FITC, Texas
Red triple band-pass cube (Olympus, Center Valley, PA), the separation of species could
be clearly visualized. Before the electric field was applied all species were free to flow
through the system in the direction of hydrodynamic flow. After a 65 V/cm electric field
was applied to the system for 35 s, cTnI was excluded from entering the channel while
myoglobin was still able to continue in the direction of bulk flow (observed both visually
in color images and through fluorescence intensity measurements filtered for the
detection of the NHS-Fluorescein used to label cTnI). Following the release of potential
cTnI was again allowed to enter the channel along with the myoglobin.
Figure 7.5 Images showing the separation between cTnI labeled with NHS-Fluorescein
(green) and Myoglobin labeled with NHS-Rhodamine (red). A) Illustration showing the
location of protein separation. B) Channel before voltage is applied, C) separation after
35 s of applied voltage (60 V/cm), and D) the channel after the applied voltage is
removed.

181
The difference in electric potentials necessary to attain complete protein exclusion
from a channel between the target species investigated suggests that a new design may be
produced to exploit these differences and simultaneously isolate, concentrate, and
quantify all three proteins within a single device. Separation of two proteins has been
accomplished here, representing a first step in that process. Future designs include the
incorporation of detection elements to the device such that isolated species may be
quantified in a secondary step. A device utilizing voltage gates to separate detection
chambers from a central separation channel with well-controlled flow and electric field
elements can be designed to allow isolation and detection of desired species from
complex samples.
7.4 Concluding Remarks
This work demonstrates for the first time the use of electrophoretic exclusion on a
microdevice to manipulate and separate proteins. The exclusion of individual proteins, as
well as the direct visualization of protein separation, are significant results. The ability to
isolate and concentrate individual target species on a microdevice is an important first
step in the development of a μTAS optimized for the quantitation of biomarker panels in
clinical diagnostics. By combining the sample treatment step of electrophoretic exclusion
with the sensitive and specific quantitation afforded through an immunoassay platform,
there exists the potential to create a diagnostic platform that is fully optimized not only
for sensitivity and low sample consumption, but for rapid analysis, multiplexed detection
and operational simplicity.

182
7.5 References
[1] Morrow, D. A., Cannon, C. P., Jesse, R. L., Newby, L. K., Ravkilde, J., Storrow,
A. B., Wu, A. H. B., Christenson, R.H., Clinical Chemistry, 2007, 53, 552-574.
[2] Macdonald, S.P.J., Nagree, Y., Fatovich, D.M., Phillips, M., Brown, S.G.A.,
Emergency Medicine Journal, 2012, 30, 149-154.
[3] Molin, S.Da., Cappellini, F., Falbo, R., Signorini, S., Brambilla, P., Clinical
Biochemistry, 2014, 47, 247-249.
[4] Fan, R., Vermesh, O., Srivastava, A., Yen, B.K.H., Qin, L., Ahmad, H., Kwong,
G.A., Liu, C.C., Gould, J., Hood, L., Heath, J.R., Nature Biotechnology, 2008, 26,
1373-1378.
[5] Anderson, N.L., Anderson, N.G., Molecular and Cellular Proteomics, 2002, 1.11,
845-867.
[6] Bellei, E., Bergamini, S., Monari, E., Fantoni, L.I., Cuoghi, A., Amino Acids,
2011, 40, 145-156.
[7] Tirumalai, R.S., Chan, K.C., Prieto, D.A., Issaq, H.J., Conrads, T.P., Veenstra,
T.D., Molecular and Cellular Proteomics, 2006, 2.10, 1096-1103.
[8] Smits, N.G.E., Ludwig, S.K.J., Van der Veer, G., Bremer, M.G.E.G., Nielen,
M.W.F., Analyst, 2013, 138, 111-117.
[9] Jayadev, C., Rout, R., Price, A., Hulley, P., Mahoney, D., Journal of
Immunological Methods, 2012, 386, 22-30.
[10] Tirumalai, R.S., Chan, K.C., Prieto, D.A., Issaq, H.J., Conrads, T.P., Veenstra,
T.D., Molecular and Cellular Proteomics, 2006, 2.10, 1096-1103.
[11] Mitchell, P., Nature Biotechnology, 2010, 28, 665-670.
[12] Camerini, S., Polci, M. L., Liotta, L. A., Petricoin, E. F., Zhou, W., Proteomics
Clin. Appl., 2007, 1, 176-184.
[13] Joglekar, M., Roggers, R. A., Zhao, Y., Trewyn, B. G., RSC Advances, 2013, 3,
2454-2461.

183
[14] Wang, X., Masschelein, E., Hespel, P., Adams, E., Schepdael, A. V.,
Electrophoresis, 2012, 33, 402-405.
[15] Jubery, T. Z., Hossan, M. R., Bottenus, D. R., Ivory, C. F., Dong, W., Dutta, P.,
Biomicrofluidics, 2012, 6, 016503-1-13.
[16] Startsev, M. A., Inglis, D. W., Baker, M. S., Goldys, E. M., Analytical Chemistry,
2013, 85, 7133-7138.
[17] Inglis, D. W., Goldys, E. M., Calander, N. P., Angew. Chem. Int. Ed., 2011, 50,
7546-7550.
[18] Kenyon, S. M., Weiss, N. G., Hayes, M. A., Electrophoresis, 2012, 33, 1227-
1235.
[19] Meighan, M.M., Vasquez, J., Dziubcynski, L., Hews, S., Hayes, M.A., Analytical
Chemistry, 2011, 83, 368-373.
[20] Kenyon, S.M., The Development of a Microfluidic Array for Use in
Electrophoretic Exclusion Separations (Adapting Electrophoretic Exclusion to a
Microdevice, Thesis), 2013, 118-140. http://hdl.handle.net/2286/R.A.97689

184
CHAPTER 8
THE DEVELOPMENT OF A MICROFLUIDIC DEVICE FOR USE IN
PARALLEL IMMUNOASSAY QUANTITATION
8.1 Introduction
Previous chapters have addressed the need for a fully optimized immunoassay to
aid in disease diagnostics and monitoring. Arising from the necessity to quantify multiple
targets in parallel from a single complex sample, separation prior to analysis is an
attractive option. As noted previously, electrophoretic exclusion, is a particularly
appealing option since it allows for multiple capture zones to be oriented in series or
parallel, may be dynamically controlled through adjustment of the applied electric field
strength, and affords sample concentration prior to detection through immunoassay.
In addition to allowing multiplexed detection in parallel, sample treatment
utilizing electrophoretic exclusion is rapid, can be performed on native species, and
avoids the dispersive forces experienced by samples when separation occurs within a
channel or column as opposed to at the channel entrance. This concentration of individual
target samples is ideal prior to detection through immunoassay as it allows a single, small
volume sample to be utilized for the extremely sensitive detection of several targets
simultaneously. Concentration of the species relative to the original sample allows even
greater improvement to the LOQ than improving on the technique of immunoassay alone,
allowing its fundamental limitations of quantitation to be approached in a portable,
simple to operate device.
Over the last decade, adaptations have been made to traditional immunoassay
formats to allow their compatibility with emerging microfluidic devices. Microscale

185
devices have been utilized in diverse immunoassay designs for protein quantification
including the use of magnetic and non-magnetic microparticles [1-6], as well as the use of
a static solid substrate using capillary systems [7,8], modifications on ELISA techniques
[9], and the incorporation of designated reaction zones [10]. Notable advantages allowed
by the transition to detection on a microdevice include the ability to multiplex [1-5,10],
lowered analysis times [7-9], and minimal reagent consumption while maintaining
sensitivities comparable to traditional immunoassay formats. Minimizing the
consumption of reagents is particularly important when sample volumes are limited, for
example in the treatment of infants or during forensic testing. An additional asset of the
microchip format is that allows devices that can often be made portable, allowing both
bedside testing and use in remote locations [11-14].
Due to the previous success in the separation of proteins observed in a
microfluidic device composed of glass and PDMS (Chapter 7), a modified design based
on the concept of this array was designed, fabricated and tested. The use of PDMS is
appealing because it is optically transparent and is compatible with the fluorescence
detection method employed for the immunoassay described throughout this thesis [15].
Modifications were included such that quantitative detection could take place on-chip
compared to the original array used in proteins separations. The rest of this chapter
focuses on the development of a microfluidic device that could be used for the analysis of
complex samples. It has been previously demonstrated that electrophoretic exclusion
plays a potentially important role in the pre-treatment of complex samples prior to
specific target quantification, and that the sensitive immunoassay described throughout

186
this work is well suited for incorporation as the detection method. However, a complete
device combining these techniques has not been developed.
Here, the preliminary device for sample separation, concentration and
quantification is fabricated and tested. Experiments are performed using a mixture of
myoglobin and cTnI to evaluate the proficiency of the device in performing separations
along the primary separation channel (Figure 8.1). Additionally, experiments using a
single target are done to assess the ability of the device to isolate and concentrate an
individual species in one of the separation channel reservoirs prior to quantification. The
capacity for quantification, in terms of protein manipulation into the quantitation
reservoir following concentration, and binding of target species to the magnetic
microbeads was also evaluated.
8.2 Materials and Methods
8.2.1 Design and Microdevice Fabrication
Hybrid glass/PDMS devices were used for each experiment and each device
contained a single analysis system. A photograph was recorded of the device (view from
above) as well as a schematic of a single isolation channel (Figure 8.1). The fabrication
of this device is analogous to the array design discussed in Chapter 7, where deviations
are discussed below.

187
Figure 8.1. Microdevice for protein separation and quantitation by immunoassay.
Photograph (left) of the complete microfluidic device with one separation channel and
three isolation channels, and a schematic of a single (right) isolation channel explaining
terminology used in the device.
8.2.1.1 PDMS
The separation channel was 41 mm in length. It contained five central reservoirs
for isolation connected to two end reservoirs through a series of short channels. Each
central reservoir was 5 mm x 5 mm, end reservoirs were 19 mm x 5 mm and channels
were 1 mm by 100 μm having a uniform depth of 10 μm throughout the device. Each
isolation channel consisted of one of the separation reservoirs connected to two end
reservoirs and a quantitation reservoir through a series of short channels. Each isolation
channel was 23 mm in length. The size and depth of reservoirs and channels was
equivalent to those found in the central reservoirs/channels along the separation channel.
Masks were designed in AutoCad (Autodesk, Inc., San Rafael, CA) and were printed on a
transparency at a resolution of 10,160 dpi (Fine Line Imaging, Colorado Springs, CO,
USA). Positive photoresist AZ 4620 was spun onto a silicon wafer and exposed at 750

188
mJ/cm2
using an EVG®620 Automated UV-NIL, μ-CP System (EV Group, St. Florian am
Inn, Austria) using the transparency as a mask. The system was then fabricated using
standard soft lithography techniques as discussed in Chapter 7.
8.2.1.2 Electrodes
Ti/Pt electrodes were plated on 75 x 50 mm microscope slides (Fisherbrand,
Waltham, MA, USA) (Figure 8.2, right). A mask was designed in AutoCad (Autodesk,
Inc., San Rafael, CA) and printed on a transparency with a resolution of 10,160 dpi (Fine
Line Imaging, Colorado Springs, CO, USA). Electrodes were plated 500 μm wide
bracketing each reservoir within the separation channel, along with the end reservoirs
and quantitation reservoirs immediately adjacent to the separation channel. This was
designed to produce flat potentials within reservoirs and promote exclusion at a channel
entrance such that separation of proteins can occur and species may be concentrated and
isolated within a reservoir. Electron beam evaporation was used to deposit metal onto the
slide as previously discussed in Chapter 7. Electric leads were attached at the sides of the
slide using silver conductive epoxy for connection to an external power supply (Series
HV5448, LabSmith Inc., Livermore, CA, USA) through an in-house produced voltage
divider (1:100). A schematic of the electrode and channel design is included (Figure 8.2).

189
Figure 8.2. Schematic designs of PDMS channel (left) and electrode (right) patterns. The
PDMS pattern includes a separation channel where separation reservoirs contain posts to
support the roof (white circles observed within reservoirs), a large entrance reservoir (far
right) and an exit reservoir (far left). Perpendicular to the separation channel are three
isolation channels. Each isolation channel consists of a backfill buffer reservoir (top),
quantitation reservoir (below separation channel), and an exit reservoir (bottom). The
electrodes are patterned to surround all reservoirs within the separation channel, as well
as the backfill buffer reservoirs and quantitation reservoirs.
8.2.2 Materials
Myoglobin (Life Diagnostics), myoglobin antibody (Lifespan Biosciences,
Seattle, WA, USA), cTnI (Life Diagnostics), cardiac troponin antibody (Lifespan
Biosciences), NHS-rhodamine (ThermoFisher, Waltham, MA, USA), NHS-fluorescein
(ThermoFisher), magnetic microparticles (Qiagen) and DMSO were used as received.
PBS buffer was prepared to a 100 mM concentration at a pH of 7.2 with 0.2% NaN3 and
0.2% Tween 20 using 18 MΩ Milli-Q water. Aspartic acid buffer was prepared to a
concentration of 5 mM at a pH of 2.95 using 18 MΩ Milli-Q water. A 10 mg/mL stock
solution of NHS-rhodamine was prepared in DMSO and 3.03 μL were added to 13.6 μL
of a stock solution of 7.51 mg/mL myoglobin. The mixture was allowed to react at room
temperature for 1 hour and dialyzed in PBS overnight to remove unconjugated dye prior
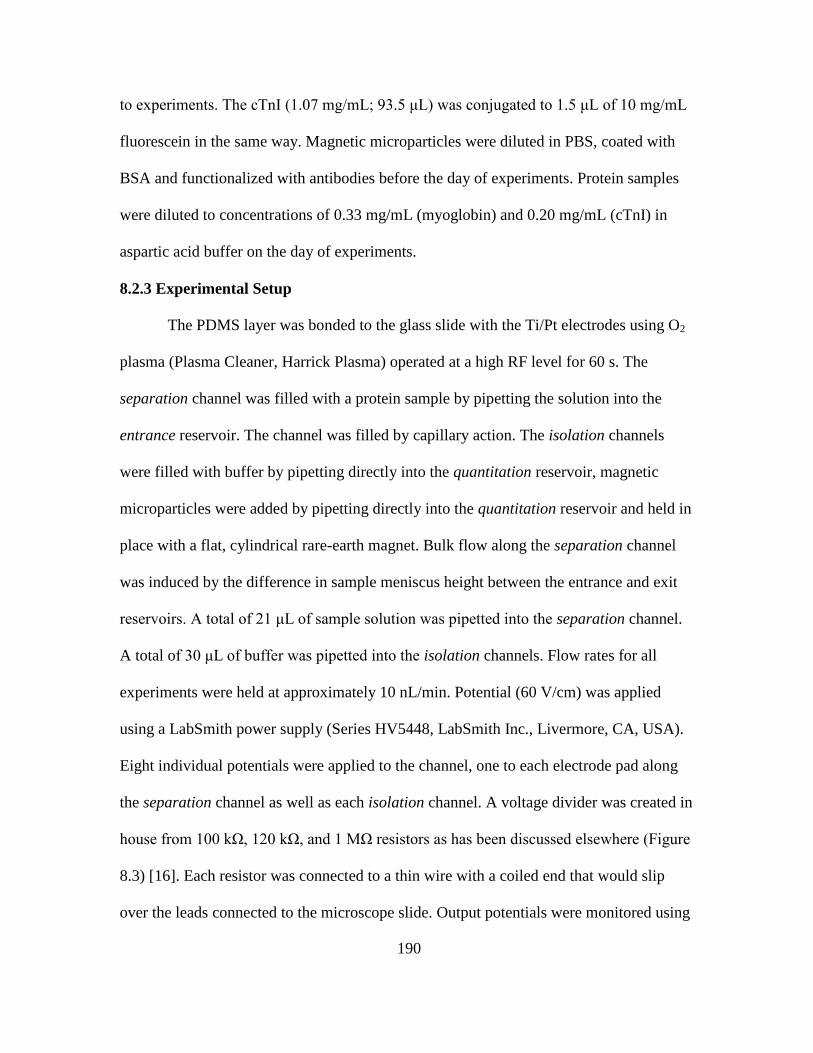
190
to experiments. The cTnI (1.07 mg/mL; 93.5 μL) was conjugated to 1.5 μL of 10 mg/mL
fluorescein in the same way. Magnetic microparticles were diluted in PBS, coated with
BSA and functionalized with antibodies before the day of experiments. Protein samples
were diluted to concentrations of 0.33 mg/mL (myoglobin) and 0.20 mg/mL (cTnI) in
aspartic acid buffer on the day of experiments.
8.2.3 Experimental Setup
The PDMS layer was bonded to the glass slide with the Ti/Pt electrodes using O2
plasma (Plasma Cleaner, Harrick Plasma) operated at a high RF level for 60 s. The
separation channel was filled with a protein sample by pipetting the solution into the
entrance reservoir. The channel was filled by capillary action. The isolation channels
were filled with buffer by pipetting directly into the quantitation reservoir, magnetic
microparticles were added by pipetting directly into the quantitation reservoir and held in
place with a flat, cylindrical rare-earth magnet. Bulk flow along the separation channel
was induced by the difference in sample meniscus height between the entrance and exit
reservoirs. A total of 21 μL of sample solution was pipetted into the separation channel.
A total of 30 μL of buffer was pipetted into the isolation channels. Flow rates for all
experiments were held at approximately 10 nL/min. Potential (60 V/cm) was applied
using a LabSmith power supply (Series HV5448, LabSmith Inc., Livermore, CA, USA).
Eight individual potentials were applied to the channel, one to each electrode pad along
the separation channel as well as each isolation channel. A voltage divider was created in
house from 100 kΩ, 120 kΩ, and 1 MΩ resistors as has been discussed elsewhere (Figure
8.3) [16]. Each resistor was connected to a thin wire with a coiled end that would slip
over the leads connected to the microscope slide. Output potentials were monitored using

191
a digital multimeter (Sperry Instruments, Menomonee Falls, WI, USA) throughout the
course of the experiment. Output voltages from the voltage divider ranged from 0 to 16
V, providing electric fields between 0 and 160 V/cm.
Figure 8.3. Voltage divider (bottom) connected to the microscale analysis system (top).
The voltage divider was created from 100 kΩ, 120 kΩ, and 1 MΩ resistors, and each
resistor was connected to a thin wire with a coiled end. The coiled end could slip over the
leads attached to the device and enabled the precise application of electric fields between
0 and 160 V/cm.
Experiments were monitored using an inverted microscope with darkfield and
fluorescence abilities (IX70, Olympus, Center Valley, PA, USA) utilizing a 100 W Hg
lamp as the light source. Light from the Hg lamp passed through a band-pass filter and a
1.25X objective to the device during separations. A 40X objective was used during
quantitation. During quantitation the rare-earth magnet was rotated to produce an
alternating magnetic field and cause formation and rotation of rotors that served as the
solid-surface for the immunoassay. The light emitted passed through a long-pass
dichromatic mirror and a band-pass filter into the camera port on the microscope for

192
black and white images. These images were collected digitally using a QICAM CCD
camera from Q Imaging, Inc. (Surrey, British Columbia, Canada) that was connected to a
computer running Streampix (NorPix, Montreal, Quebec, Canada). Color images were
collected from the eyepiece of the microscope using a mounted Nikon D5000 camera
(Nikon, Melville, NY, USA). ImageJ (NIH, Bethesda, MD, USA) was used to determine
the fluorescence intensity change in the channel reservoirs to assess the extent of
concentration in the channel.
All experiments in the system were performed at a pH of 2.95 in aspartic acid
buffer to eliminate electroosmotic flow (EOF). Neutralization of proteins was required
before binding for quantification, and was performed through the addition of Tris-buffer
(pH 8) to the backfill buffer and quantitation reservoirs.
8.3 Results and Discussion
8.3.1 Device Design
The separation channel/quantitation array design was based off the success of the
initial array device in separating protein samples (Chapter 7). To allow for quantitation of
proteins on chip, additional chamber interfaces were added. Instead of connection in
parallel, five separation reservoirs were connected in series through short channels to an
entrance and exit reservoir. Connected to three of the central separation reservoirs
(reservoirs 1, 3 and 5) were perpendicular isolation channels composed of a single
backfill buffer reservoir above the channel, and two reservoirs below the channel, a
quantitation and exit reservoir. These reservoirs were physically open to the channel
during separations and controlled using voltage gates. Separation reservoirs were
connected in series along a single primary channel instead of in an array design for two

193
reasons; to improve the ability for concentration of each target in a single region of the
device, and to enable the easy connection of quantitation reservoirs adjacent to the
regions of protein concentration. Inclusion of the isolation channels provided, for the first
time, the ability to manipulate and quantify species following their concentration and
isolation through electrophoretic exclusion.
8.3.2 Device Fabrication
Enlarged glass microscope slides (75 x 50 mm) were plated with electrodes to
accommodate the size of the microfluidic system. A PDMS layer having reservoirs
connected through channels was sealed to the glass slide. Due to the ability of the array
described previously (Chapter 7), the same size reservoirs and channels were used in this
design. Because electrode width was not an issue in the protein separations performed on
the original array, allowed for the easier attachment of the copper leads to the electrodes,
and aided in the manual alignment of the PDMS layer, the larger electrode width (500
μm) was again used for this device. The impact of electrode alignment on the separation
of both small molecules and proteins has been previously discussed [17].
8.3.3 Operation of the Microfluidic Device
8.3.3.1 Detection of Species
Fluorescence detection was chosen to monitor both the exclusion and direct
immunoassay quantitation as it was compatible with the singleplex immunoassay design
and allowed highly sensitive detection to be maintained. It also allowed direct
visualization of each step in the PDMS/glass hybrid device. Two species, cTnI and
myoglobin were chosen for evaluation of the microdevice.

194
8.3.3.2 Experimental Design
As discussed in chapter 7, electrophoretic exclusion is achieved when the
electrophoretic velocity (μaE) of a species is greater than or equal to the velocity of
hydrodynamic flow through a channel. Balancing these forces prevents a target species
from entering a channel and allows concentration of that target in the reservoir
immediately upstream of the channel entrance. The microdevice prototype was designed
with a total of six interfaces where exclusion could occur along the separation channel.
Three of these separation reservoirs were directly connected to isolation channels, and
were the intended locations of target protein concentration. The remaining separation
reservoir/channel interfaces could be programmed to minimize the impact of NSB from
potential interfering species in a complex biological sample. The entrance reservoir was
used for the introduction of sample, while isolation channels were used for the
introduction of neutralization and wash buffers. Electrodes plated around the reservoirs
along the separation channel, as well as the backfill buffer and quantitation reservoirs in
the isolation channel, were used as voltage gates to control where individual species were
excluded and concentrated from the bulk solution.
Protein separation experiments were designed so that cTnI would be captured in
separation reservoir 1, while myoglobin would continue to move with bulk flow along
the channel and be captured in separation reservoir 3. A representative sequence of
applied potentials is shown (Figure 8.4).

195
Figure 8.4 Representative values of applied potentials used for the separation of
myoglobin and cTnI. With no voltage applied to the entrance reservoir or the first
reservoir of the separation channel, both species were free to move in the direction of
bulk flow. An applied voltage of 6 V (60 V/cm) was used for reservoirs 2 and 3 of the
separation channel to prevent cTnI from entering separation channel reservoir 2 and to
concentrate it in separation reservoir 1, but allow myoglobin to continue in the direction
of bulk flow. 20 V was then applied to reservoir 4 of the separation channel to
concentrate myoglobin in separation reservoir 3. High potential was applied to all
backfill buffer and quantitation reservoirs to remove all protein from the isolation
channels prior to separation and concentration.
Exclusion of the proteins only occurred when an appropriate electric field was
applied across a channel. In instances where there was no field (between entrance
reservoir and separation reservoir 1, as well as between separation reservoirs 2 and 3),
exclusion was not intended to occur. The progression of a separation experiment is shown
in Figure 8.5.
196
Figure 8.5 Illustrative graphic showing the designed progression of a separation
experiment between myoglobin and cTnI. A. Filling of the device before any electric
potentials are applied. Green indicates the presence of cTnI labeled with NHS-
Fluorescein, red indicates the presence of myoglobin labeled with NHS-Rhodamine,
saturation of color indicates higher concentration of protein. B. Concentration of cTnI in
separation reservoir 1 and myoglobin in separation reservoir 3 after electric potential
was applied to the electrodes. C. Removal of voltage from the quantitation reservoirs and
addition of buffer to the backfill buffer reservoirs, forcing cTnI and myoglobin into the
quantitation reservoirs. D. Observation of fluorescent supraparticle structures (dark red
and green) following the addition of magnetic microparticles to the quantitation reservoir
and application of a magnetic field.
In the quantification experiments performed with cTnI as a target, following
isolation and concentration in separation reservoir 1 using electrophoretic exclusion, the
addition of a basic Tris buffer (pH 8) was used for neutralization. Neutralization allowed
cTnI to bind to magnetic microbeads coated in capture antibodies within the quantitation
reservoir. The addition of Tris buffer to the backfill buffer reservoirs also served to direct
flow of the concentrated protein into the quantitation reservoir. In the quantitation
reservoir, a direct immunoassay was performed analogous to that previously described

197
(Chapter 4), with the exception that convective mixing was used during the incubation as
opposed to agitation in a micro-centrifuge tube. The fluorescence intensity of observed
rotors was used to monitor protein bound to the surface. The designed progression of a
quantitation experiment is demonstrated in Figure 8.6.
Figure 8.6 Illustrative graphic showing the progression of a quantitation experiment
using cTnI. A. Filling of the device before any electric potentials are applied. Green
indicates the presence of cTnI labeled with NHS-Fluorescein, saturation of color
indicates higher concentration of protein. B. Concentration of cTnI in separation
reservoir 1 after electric potential was applied to the electrodes. C. Removal of voltage
from the quantitation reservoir and addition of buffer to the backfill buffer reservoir,
influencing the movement of cTnI into the quantitation reservoir. D. Observation of
fluorescent supraparticle structures (dark green) following the addition of magnetic
microparticles to the quantitation reservoir and application of a magnetic field. The red
box illustrates the approximate location of the data collected for Figure 8.7.
8.3.4 Results of cTnI and Myoglobin Separation Experiments
The exclusion behaviors of cTnI and myoglobin were consistent with results
attained from the array (Chapter 7). With flow directed from right to left across the

198
device an applied potential of 65 V/cm across the channel between separation reservoirs
1 and 2 was used to achieve exclusion of cTnI (and concentration of cTnI in separation
reservoir 1) while myoglobin was able to flow freely toward the exit reservoir (Figure
8.7). Due to sample spreading in the isolation channels prior to voltage application,
electric potentials of 160 V/cm were applied directly to the backfill buffer and
quantitation reservoirs to remove all material during the time of exclusion.
Figure 8.7 Images showing the separation of myoglobin (red) and cTnI (green). Flow is
oriented from right to left across the device. The position of data capture is indicated by
the red box in Figure 8.6. The dark band immediately to the right of the microchannel is
the electrode. A) Channel before voltage is applied, B) separation after 35 s of applied
voltage (65 V/cm), and C) the channel after the applied voltage is removed.
During the time voltage is applied, cTnI is excluded from entering downstream
channel reservoirs and is concentrated in separation reservoir 1. The extent of cTnI
concentration was monitored using a blue filter cube to selectively observe the
fluorescence caused by the NHS-fluorescein used to label the protein. Repeated trials
show consistent results using different preparations of protein and devices over five
experiments. With an applied electric field of 65 V/cm within the separation channel and
fields of 160 V/cm applied to all reservoirs in the isolation channel, cTnI was observed to
concentrate 4- fold with 35 s of applied voltage. Maintaining the applied electric field for
longer time periods increased the protein concentration further. It is observed that after 60
s the fluorescence intensity in the reservoir reaches the maximal pixel intensity that may

199
be captured using the CCD-camera, representing a 7-fold, or greater, increase in
concentration.
8.3.5 Results of cTnI Quantification Experiments
Following the concentration of cTnI in separation reservoir 1, material was forced
into the quantitation reservoir by adding Tris buffer, pH 8.0 to the buffer backfill
reservoir. Control of material in this way was modeled after the pinched sample injection
methods used in microfluidic devices [18-21]. Magnetic microparticles bound to the
cardiac troponin capture antibody were pipetted directly into the quantitation reservoir
and manipulated to achieve convective mixing and promote protein capture (Figure 8.8).

200
Figure 8.8 Images showing the concentration, manipulation, and quantification of cTnI.
A) Separation reservoir 1 before voltage is applied B) separation reservoir 1 after 60 s of
an applied electric field (note that bubbles formed left and right, limiting the solution to
the irregularly shaped center portion, concentration enhancement still occurs) C)
quantitation reservoir 1 after buffer has been added to the backfill buffer reservoir D)
protein bound by the cTnI capture antibody attached to the magnetic microparticles in the
presence of a magnetic field.
The concentration of cTnI can be clearly observed in reservoir 1 of the separation
channel, as evidenced by the increase in fluorescence intensity within the reservoir from
6,600 to 45,000, approximately a 6.7-fold increase (Figure 8.8 A and B), even in the
presence of bubbling (dark zones left and right) due to local electrolysis (Figure 8.8B).
Following the removal of electric potential to quantitation reservoir 1, and the addition of
Tris buffer to backfill buffer reservoir, material is observed to enter the quantitation

201
reservoir. However, flow into the reservoir is slow, and incomplete over the time course
of the experiment (Figure 8.8 C). By increasing the magnification from 1.25 to 20X, the
magnetic chains in the quantitation reservoir, analogous to those seen in the singleplex
immunoassay (Chapter 4) could be observed (Figure 8.8 D).
While some of the cTnI bound to the rotors, based on the fluorescence observed
on the chains, there is still a high background fluorescence intensity that indicates not all
material is binding. This could be caused by interference in binding sites from the NHS-
Fluorescein used to label the cTnI, or the incomplete neutralization of the protein
resulting in denatured protein not binding to the rotors.
8.3.6 Assessment of the Initial Design
8.3.6.1 Observed Challenges Preventing Optimal Function
Similar to the previous array this device was able to achieve separation and
concentration of proteins. However, to prevent the leakage of material into the isolation
channels during separation it was necessary to add floating electrodes directly into the
quantitation and backfill buffer reservoirs to ensure the exclusion of material. These
floating electrodes were created by inserting platinum wire leads connected to the voltage
source directly into the access holes punched in both the quantitation and backfill buffer
reservoirs. Floating electrodes were necessary for several reasons. First, the electrodes
plated around the quantitation reservoirs are connected to those utilized for the
separation reservoirs and may not be articulated independently. Additionally, due to the
close proximity of electrodes surrounding the backfill buffer reservoirs and the reservoirs
within the separation channel, bubble formation occurred to a greater extent than
observed in the previous separation-based array.

202
An additional issue caused by the current device design is that not all of the target
material is concentrated within the desired reservoir of the separation channel. Some of
the material remained in the entrance reservoir, or in the case of myoglobin, in
separation reservoirs upstream of separation reservoir 3, where exclusion and
concentration took place. Several alterations could be made in the fabrication of a next
generation device in order to eliminate these issues and allow the rapid separation,
concentration, and quantification of biomarker panels.
8.3.6.2 Proposed Alterations to Electrode Design
In the initial device used for the separation of proteins, electrode width was not an
issue. The larger width of electrodes (500 μm) facilitated the alignment of the PDMS
layer and attachment of the copper leads to the electrodes. For these reasons the electrode
width was maintained in the design of the current microdevice. However, due to the
issues observed both in the ability to articulate isolation channel reservoirs
independently, bubble formation within the separation channel, alterations to the
electrode design should be made in a future device. While it is advisable to maintain the
width of the electrodes around the reservoirs in the separation channel to conserve the
advantages noted previously, removing electrodes from the isolation channels would
improve the ease of use for the device. Incorporating a physical barrier to prevent sample
leakage into these reservoirs would aid in the ease of operation, as well as ensure a
greater level of purity for the sample detected in each quantitation reservoir.
8.3.6.3 Incorporation of Physical Valves
Incorporation of physical valves as a control element within a microfluidic device
can aid in the improvement of overall performance [22]. Valves can be designed such

203
that they are compatible with soft lithography techniques [22-25], and help to improve
throughput, sensitivity and the dynamic range capabilities of the device [22].
Incorporation of PDMS valves is an attractive alternative to the use of voltage gates
because they are easy to fabricate, maintain a low device fabrication cost, and may easily
be scaled to fit the dimensions of system [22]. While voltage gates are also easy to
incorporate into a device, the ability to physically control the filling of isolation channels
using a physical barrier would improve the overall ease of use for the device and increase
the sensitivity of detection by ensuring fewer contaminants reach isolated quantitation
reservoirs.
8.3.6.4 Sample Introduction to the Microdevice
Presently, a solution of buffer containing the sample is directly added to the
entrance reservoir and used to fill the separation channel. Buffer alone is pipetted into
isolation channels, however, as no physical barrier exists at the time of device filling, the
sample is free to flow throughout the device until an electric potential is applied. By
instead filling the entire device with buffer and using a microscale peristaltic pumping
system to introduce sample at a known flow rate, electric potentials could be applied
prior to sample introduction. It would also allow the valves protecting the isolation
channels to be shut and prevent sample leakage prior to isolation and analysis.
Incorporation of a pump would force samples through the device at a higher rate,
enabling all protein to move through the separation channel and be isolated in the
appropriate reservoir such that even very low concentrations of target species may be
quantified from complex samples.

204
8.4 Concluding Remarks
This chapter described the design, fabrication, and evaluation of a microfluidic
device. The device was intended for the quantification of a biomarker panel from a
complex sample. It was demonstrated that it is possible to isolate and concentrate target
proteins in reservoirs along the separation channel. Results suggest that creation of a
fully optimized device for clinical diagnostics is possible, and this work represents a first
step in that direction. Alterations to the electrode layout and sample introduction
methods, as well as the incorporation of physical valves, could improve the ease of use,
speed, and quantitative ability of the device. By addressing each of these issues
systematically, a future design could allow the full optimization of a clinical diagnostic
platform allowing the rapid and sensitive quantification of biomarker panels using
immunoassay detection in a microscale device.
8.5 References
[1] Cao, Z., Li, H., Lau, C., Zhang, Y., Analytica Chimica Acta, 2011, 698, 44-50.
[2] Lacharme, F., Vandevyver, C., Gijs, M.A.M., Microfluid Nanofluidics, 2009, 7,
479-487.
[3] Li, Z., Zhao, Q.Y., et al., Sci. China Chem., 2010, 53, 812-819.
[4] Proczek, G., Gassner, A.L., Busnel, J.M., Girault, H.H., Anal. Bioanal. Chem.,
2012, 402, 2645-2653.
[5] Song, S.Y., Han, Y.D., Kim, K., Yang, S.S., Yoon, H.C., Biosens. Bioelectron.,
2011, 26, 3818-3824.
[6] Fu, Z., Shao, G., Wang, J., Lu, D., Wang, W., Lin, Y., Anal. Chem., 2011, 83,
2685-2690.
[7] Ziegler, J., Zimmermann, M., Hunziker, P., Delamarche, E., Analytical
Chemistry, 2008, 80, 1763-1769.

205
[8] Zimmermann, M., Hunziker, P., Delmarche, E., Biomed. Microdevices, 2009, 11,
1-8.
[9] Lee, B.S., Lee, J.N., Park, J.M., et al., Lab Chip, 2009, 9, 1548-1555.
[10] Shao, G., Wang, J., Li, Z., Saraf, L., Wang, W., Lin, Y., Sens. Actuators B
Chemistry, 2011, 159, 44-50.
[11] Wang, H., Ou, L.M.L, Suo, Y., Yu, H.Z., Analytical Chemistry, 2011, 83, 1557-
1563.
[12] Yu, H.Z., Li, Y., Ou, L.M.L., Accounts of Chemical Research, 2013, 46, 258-268.
[13] Tamarit-Lopez, J., Morais, S., Manuis, M.J., Puchades, R., Maquieira, A.,
Analytical Chemistry, 2010, 82, 1954-1963.
[14] Pallapa, M., Ou, L.M.L., Parameswaran, M., Yu, H.Z., Sensors and Actuators B,
2010, 148, 620-623.
[15] Seia, M.A., Pereira, S.V., Fontan, C.A., DeVito, I.E., Messina, G.A., Raba, J.,
Sens. Actuators B, Chemistry, 2012, 168, 297-302.
[16] Kenyon, S.M., The Development of a Microfluidic Array for Use in
Electrophoretic Exclusion Separations (Adapting Electrophoretic Exclusion to a
Microdevice, Thesis), 2013, 118-140. http://hdl.handle.net/2286/R.A.97689
[17] Kenyon, S.M., Weiss, N.G., Hayes, M.A., Electrophoresis, 2012, 33, 1227-1235.
[18] Thomas, C.D., Jacobson, S.C., Ramsey, J.M., Analytical Chemistry, 2004, 76,
6053-6057.
[19] Bai, X., Lee, H.J., Rossier, J.S., Reymond, F., Schafer, H., Wossner, M., Girault,
H.H., Lab on a Chip, 2002, 2, 45-49.
[20] Alarle, J.P., Jacobson, S.C., Culbertson, C.T., Ramsey, J.M., Electrophoresis,
2000, 21, 100-106.
[21] Ermakov, S.V., Jacobson, S.C., Ramsey, J.M., Analytical Chemistry, 2000, 72,
3512-3517.
[22] Araci, I.E., Quake, S.R., Lab on a Chip, 2012, 12, 2803-2806.

206
[23] Weaver, J.A., Melin, J. Stark, D. Quake, S.R., Horowitz, M.A., Nature Physics,
2010, 6, 218-223.
[24] Studer, V., Hang, G., Pandolfi, A., Ortiz, M., Anderson, W.F. Quake, S.R., J.
Appl. Phys., 2004, 95, 393-398.
[25] Unger, M.A., Chou, H.P., Thorsen, T., Scherer, A. Quake, S.R., Science, 2000,
288, 113-116.

207
CHAPTER 9
CONCLUDING REMARKS
9.1 Fundamental Limitations of Quantification for Immunoassay
The sandwich immunoassay is generally considered the most sensitive
immunoassay detection platform and has been a fundamental tool for the sensitive
detection of proteins for several decades. While several studies have recently claimed
single-molecule sensitivity capabilities, all have failed to reach that mark. There exists a
fundamental statistical limitation to quantification abilities for immunoassay regardless of
sample volume, imposed by molecular shot noise. The development of the theory
addressing ultimate quantitation capability has been previously discussed (Chapter 5).
Also demonstrated are the other potential influences on the LOQ of experimental
immunoassay; NSB and the instrumental background. Ultimate limitations of
quantification lie around 131 molecules in a sample (3.7 aM in 50 μL).
9.2 Current Commercial and Experimental Capabilities for Bioanalysis
Many experimental and commercial methods for bioanalysis have been explored
in recent years. These methods have improved upon abilities of an immunoassay
technique according to one, or more, of the six metrics described for a fully optimized
assay; high sensitivity, rapid analysis, cost effective, simple to operate, use of low sample
volumes, and the ability to multiplex for parallel detection. While the field has seen
general improvements over the last several years, with various assays reaching aM
sensitivity, analysis times under a minute, the ability for multiplexed detection, sample
volumes around 10 μL, and minimal sample manipulations with the movement to
microchip platforms, no single assay has attained complete optimization in all aspects.

208
9.3 Immunoassay Quantitation of Individual Targets
Although separation and detection of multiple targets in a total analysis system
was defined as the ultimate goal, the immunoassay and protein separation studies
presented in this dissertation focused mainly on the sensitive detection of individual
targets. Earlier work described the use of a microscale batch incubation immunoassay
technique sensitively quantify myoglobin, cTnI, and H-FABP individually (Chapter 4).
Microchip experiments demonstrated the ability of dielectrophoresis to provide sample
preparation, as well as electrophoretic exclusion to separate individual targets (Chapters 6
and 7). These results indicated that the use of electrophoretic exclusion in a separations
based device would be useful to isolate targets prior to quantitation using a sandwich
immunoassay.
9.4 Potential for Multiplex Immunoassay Utilizing a Microscale Total Analysis
System
In addition to the off-chip immunoassay quantitation of individual targets, as well
as quantitation of the enrichment of those proteins within an electrophoretic separation
array, studies utilizing multiple proteins in the device suggest that electrophoretic
exclusion is capable of separating proteins (Chapter 7). A microscale analysis system was
designed and tested (Chapter 8) based on the parameters used for the separations based
array. Studies indicate that proteins may be manipulated within the channel using
electrophoretic exclusion, allowing both the separation and concentration of target
species. Further refinement of the system, including incorporation of physical valves to
prevent sample leakage into quantification reservoirs prior to analysis, holds the potential

209
for the development of a system optimized for clinical diagnostics utilizing immunoassay
quantitation techniques.
9.5 Future Directions
Rapid analysis of complex biological samples requires the use of sample
simplification techniques in combination with sensitive and selective quantitation of
specific targets. Immunoassay techniques are attractive for incorporation into total
analysis systems because they afford the sensitive detection of target molecules through
the specific interaction between antibody and antigen. In terms of sensitivity, techniques
exist that are nearing the fundamental limitations of the technique, and significant
improvements in this area are unlikely to be realized. However, many challenges remain
before an assay fully optimized for clinical diagnostics will exist. These challenges can
be addressed through the incorporation of immunoassay detection methods into
microscale total analysis systems, allowing the separation and concentration of target
species through electrophoretic exclusion prior to detection. This can afford both the
ability for multiplexed detection, as well as low sample consumption per analyte
investigated. Incubations that rely on convective mixing can combat the long assay times
required of traditional, static assays.
In altering the system in which an immunoassay is incorporated many of the
obstacles remaining in the early, multiplexed detection of biomarker panels can be
eliminated. It is feasible to envision a μTAS system in which an untreated complex
sample can be separated as it is introduced and target species may be isolated and
concentrated along an initial separations channel. Following rapid separation and
concentration, immunoassay detection methods may be employed for rapid quantitation

210
without necessitating additional sample handling steps. These modifications could allow
for near real-time blood testing to take place both in remote settings as well as clinically,
achieving rapid diagnostic and disease intervention abilities.
211
REFERENCES
CHAPTER 1
[1] Zuskin, E., Lipozencic, J., Pucarin-Cvetkovic, J., Mustajbegovic, J., Schachter,
N., Mucic-Pucic, B., Neralic-Meniga, I., Acta Dermatovenerol Croat, 2008, 16,
149-157.
[2] Vecchio, I., Tornali, C., Rampello, L., Rigo, G.S., Rampello, L., Migliore, M.,
Castellino, P., Malta, R., Armocida, G., Acta Medica Mediterranea, 2013, 29,
363-367.
[3] Papavramidou, N., Fee, E., Christopoulou-Aletra, H., J. Gastrointest. Surg.,
2007, 11, 1728-1731.
[4] Loukas, M., Tubbs, R.S., Louis Jr., R.G., Pinyard, J., Vaid, S., Curry, B.,
International Journal of Cardiology, 2007, 120, 145-149.
[5] Berche, P., Clinical Microbiology and Infection, 2012, 18, 1-6.
[6] Koch, R., Investigations into the Etiology of Traumatic Infective Diseases (The
Relations of Micro-Organisms to Traumatic Infective Diseases), 1880, 19-39.
[7] Beale, L.S., Disease Germs: Their Supposed Nature, an Original Investigation,
with Critical Remarks (Disease Germs), 1870, 1-13.
[8] Morrow, D. A., Cannon, C. P., Jesse, R. L., Newby, L. K., Ravkilde, J., Storrow,
A. B., Wu, A. H. B., Christenson, R.H., Clinical Chemistry, 2007, 53, 552-574.
[9] Dimov, I.K., Basabe-Desmonts, L., Garcia-Cordero, J.L., Ross, B.M., Ricco,
A.J., and Lee, L.P., Lab on a Chip, 2011, 11, 845-850.
[10] Woolley, C. F., Hayes, M. A., Bioanalysis, 2013, 5, 245-264.
[11] Cheung, K.T., Trevisan, J., Kelly, J.G., Ashton, K.M., Stringfellow, H.F., Taylor,
S.E., Singh, M.N., Martin-Hirsch, P.L., Martin, F.L., Analyst, 2011, 136, 2047-
2055.
[12] Policar, C., Birgitta Waern, J., Plamont, M.A., Clede, S., Mayet, C., Prazeres, R.,
Ortega, J.M., Vessieres, A., Dazzi, A., Angew. Chem. Int. Ed., 2011, 50, 860-
864.
[13] Huth, F., Schnell, M., Wittborn, J., Ocelic, N., Hillenbrand, R., Nature
Materials, 2011, 10, 352-356.

212
[14] Song, S. Y., Han, Y. D., Kim, K., Yang, S. S., and Yoon, H. C., Biosensors and
Bioelectronics, 2011, 26, 3818-3824.
[15] Garcia-Valdecasas, S., Ruiz-Alvarez, M.J., Garcia De Tena, J., De Pablo, R.,
Huerta, M. Barrionuevo, I., Coca, C., Arribas, I., Acta Cardiol, 2011, 66, 315-
321.
[16] Liao, J., Chan, C.P., Cheung, Y., Lu, J., Luo, Y., Cautherley, G.W.H., Glatz,
J.F.C., Renneberg, R., International Journal of Cardiology, 2008, 133, 420-423.
[17] Berson, S. A., Yalow, R. S., Nature, 1959, 184, 1648-1649.
[18] Long, F., Zhu, A., Shi, H., Sheng, J., Zhao, Z., Chemosphere, 2015, 120, 615-
620.
[19] Allinson, J. L., Bioanalysis, 2011, 3, 2803-2816.
[20] Verch, T., Bakhtiar, R., Bioanalysis, 2012, 4, 177-188.
[21] Bellei, E., Bergamini, S., E. Monari, S., Fantoni, L.I., Cuoghi, A., Amino Acids,
2011, 40, 145-156.
[22] Anderson, N.L., Anderson, N.G., Molecular and Cellular Proteomics, 2002,
1.11, 845-867.
[23] Fan, R., Vermesh, O., Srivastava, A., Yen, B.K.H., Qin, L., Ahmad, H., Kwong,
G.A., Liu, C.C., Gould, J., Hood, L., Heath, J.R., Nature Biotechnology, 2008,
26, 1373-1378.
[24] Tirumalai, R.S., Chan, K.C., Prieto, D.A., Issaq, H.J., Conrads, T.P., and
Veenstra, T.D., Molecular and Cellular Proteomics, 2006, 2.10, 1096-1103.
[25] Mitchell, P., Nature Biotechnology, 2010, 28, 665-670.
[26] Ohmura, N., Lackie, S. J, Saiki, H., Anal. Chem. 2001, 73, 3392-3399.
[27] Diamandis, E. P., Christopoulos, T. K., Immunoassay (Theory of Immunoassays
CH 3, Interfaces in Immunoassays CH 7), 1996, 25-187.
[28] Duhau, L., Grassi, J., Grouselle, D., Enjalbert, A., Grognet, J. M., Journal of
Immunoassay, 1991, 12, 233-250.
[29] Boever, J. D., Kohen, F., Bouve, J., Leyseele, D., Vandekerckhove, D., Clinical
Chemistry, 1990, 36, 2036-2041.

213
[30] Kratzsch, J., Ackermann, W., Keilacker, H., Besch, W., Keller, E., Experimental
and Clinical Endocrinology and Diabetes, 1990, 95, 229-236.
[31] Werthen, M., Nygren, H., Journal of Immunological Methods 1988, 115, 71-78.
[32] Stenberg, M., Nygren, H., Journal of Immunological Methods 1988, 113, 3-15.
[33] Stenberg, M., Stiblert, L., Nygren, H., J. theor. Biol. 1986, 120, 129-140.
[34] Nygren, H., Werthen, M., Stenberg, M., Journal of Immunological Methods
1987, 101, 63-71.
[35] Nygren, H., Stenberg, M., Immunology 1989, 66, 321-327.
[36] Ekins, R., Kelso, D., Clin. Chem. 2011, 57, 372-375.
[37] Ishikawa, E., Hashida, S., Kohno, T., Hirota, K., Clinica Chimica Acta 1990,
194, 51-72.
[38] Tian, J., Zhou, L., Zhao, Y., Wang, Y., Peng, Y., Hong, X., Zhao, S., J Fluoresc,
2012.
[39] Lee, G. Y., Choi, Y. H., Chung, H. W., Ko, H., Cho, S., Pyun, J. C., Biosensors
and Bioelectronics, 2013, 40, 227-232.
[40] Casolari, S., Roda, B., Mirasoli, M., Zangheri, M., Patrono, D., Reschiglian, P.,
Roda, A., Analyst, 2013, 138, 211-219.
[41] Schiel, J. E., Tong, Z., Sakulthaew, C., Hage, D. S., Analytical Chemistry, 2011,
83, 9384-9390.
[42] Fu, X., Meng, M., Zhang, Y., Yin, Y., Zhang, X., Xi, R., Analytica Chimica
Acta, 2012, 722, 114-118.
[43] Sakamaki, N., Ohiro, Y., Ito, M., Makinodan, M., Ohta, T., Suzuki, W.,
Takayasu, S., Tsuge, H., Clinical and Vaccine Immunology, 2012, 19, 1949-
1954.
[44] Lee, W.B., Chen, Y.H., Lin, H.I., Shiesh, S.C., Lee, G.B., Sensors and Actuators
B: Chemical, 2011, 157, 710-721.
[45] Song, S. Y., Han, Y. D., Kim, K., Yang, S. S., Yoon, H. C., Biosensors and
Bioelectronics, 2011, 26, 3818-3824.
[46] Lee, S., Kang, S.H., Talanta, 2012, 99, 1030-1034.

214
[47] Sloan, J. H., Siegel, R. W., Ivanova-Cox, Y. T., Watson, D. E., Deeg, M. A.,
Konrad, R. J., Clinical Biochemistry, 2012, 45, 1640-1644.
[48] Vashist, S. K., Biosensors and Bioelectronics, 2013, 4, 297-302.
[49] Lacharme, F., Vandevyver, C., Gijs, M. A. M., Microfluid Nanofluidics, 2009, 7,
479-487.
[50] Lacharme, F., Vandevyver, C., Gijs, M. A. M., Analytical Chemistry, 2008, 80,
2905-2910.
[51] Petkus, M. M., McLauchlin, M., Vuppu, A. K., Rios, L., Garcia, A. A., Hayes,
M. A., Analytical Chemistry, 2006, 78, 1405-1411.
[52] Hayes, M. A., Petkus, M. M., Garcia, A. A., Taylor, T., Mahanti, P., Analyst,
2008, 134, 533-541.
[53] Mahanti, P., Taylor, T., Hayes, M. A., Cochran, D., Petkus, M. M., Analyst,
2011, 136, 365-373.
[54] Woolley, C.F., Hayes, M.A., Anal. Methods., submitted.
[55] Macdonald, S.P.J., Nagree, Y., Fatovich, D.M., Phillips, M., Brown, S.G.A.,
Emergency Medicine Journal, 2012, 30, 149-154.
[56] Molin, S.Da., Cappellini, F., Falbo, R., Signorini, S., Brambilla, P., Clinical
Biochemistry, 2014, 47, 247-249.
[57] Jayadev, C., Rout, R., Price, A., Hulley, P., Mahoney, D., Journal of
Immunological Methods, 2012, 386, 22-30.
[58] Pereira, A. T., Novo, P., Prazeres, D. M. F., Chu, V., Conde, J. P.,
Biomicrofluidics, 2011, 5, 014102-1-014102-13.
[59] Granger, J.H., Granger, M.C., Firpo, M.A., Mulvihill, S.J., Porter, M.D., Analyst,
2013, 138, 410-416.
[60] Proczek, G., Gassner, A. L., Busnel, J. M., Girault, H. H. , Anal. Bioanal. Chem.
2012, 402, 2645-2653.
[61] Camerini, S., Polci, M. L., Liotta, L. A., Petricoin, E. F., Zhou, W., Proteomics
Clin. Appl., 2007, 1, 176-184.
[62] Joglekar, M., Roggers, R. A., Zhao, Y., Trewyn, B. G., RSC Advances, 2013, 3,
2454-2461.

215
[63] Wang, X., Masschelein, E., Hespel, P., Adams, E., Schepdael, A. V.,
Electrophoresis, 2012, 33, 402-405.
[64] Jubery, T. Z., Hossan, M. R., Bottenus, D. R., Ivory, C. F., Dong, W., Dutta, P.,
Biomicrofluidics, 2012, 6, 016503-1-13.
[65] Startsev, M. A., Inglis, D. W., Baker, M. S., Goldys, E. M., Analytical
Chemistry, 2013, 85, 7133-7138.
[66] Inglis, D. W., Goldys, E. M., Calander, N. P., Angew. Chem. Int. Ed., 2011, 50,
7546-7550.
[67] Kenyon, S. M., Weiss, N. G., Hayes, M. A., Electrophoresis, 2012, 33, 1227-
1235.
[68] Kenyon, S. M., Keebaugh, M. W., Hayes, M. A., Electrophoresis, 2014, 35,
2551-2559.
CHAPTER 2
[1] Moschallski, M., Evers, A., Brandsetter, T., Ruhe, J., Analytica Chimica Acta,
2013, 781, 72-79.
[2] Wang, H., Ou, L.M.L, Suo, Y., Yu, H.Z., Analytical Chemistry, 2011, 83, 1557-
1563.
[3] Farajollahi, M.M., Cook, D.B, Hamzehlou, S., Self, C.H., Scandinavian Journal
of Clinical and Laboratory Investigation, 2012, 72, 531-539.
[4] Tamarit-Lopez, J., Morais, S., Puchades, R., Maquieira, A., Bioconjugate
Chemistry, 2011, 22, 2573-2580.
[5] Zhang, B., Liu, B., Zhou, J., Tang, J., Tang, D., Applied Materials and Interfaces,
2013, 5, 4479-4485.
[6] FAST®
Slide Protein Microarray 2013 KeraFast, Inc. https://www.kerafast.com/c-
1-fast-slide-protein-microarray.aspx
[7] Moschallski, M., Baader, J., Prucker, O., Ruhe, J., Analytica Chimica Acta, 2010,
671, 92-98.

216
[8] Wen, J., Shi, X., He, Y., Zhou, J., Li, Y., Anal. Bioanal. Chem., 2012, 404, 1935-
1944.
[9] Yu, H.Z., Li, Y., Ou, L.M.L., Accounts of Chemical Research, 2013, 46, 258-268.
[10] Imaad, S.M., Lord, N., Kulsharova, G., Liu, G.L., Lab on a Chip, 2011, 11, 1448-
1456.
[11] Tamarit-Lopez, J., Morais, S., Manuis, M.J., Puchades, R., Maquieira, A.,
Analytical Chemistry, 2010, 82, 1954-1963.
[12] Balsam, J., Rasooly, R., Bruck, H.A, Rasooly, A., Biosensors and Bioelectronics,
2014, 51, 1-7.
[13] Cheung, K.T., Trevisan, J., Kelly, J.G., Ashton, K.M., Stringfellow, H.F., Taylor,
S.E., Singh, M.N., Martin-Hirsch, P.L., Martin, F.L., Analyst, 2011, 136, 2047-
2055.
[14] Pita, I., Hendaoui, N., Liu, N., Kumbham, M., Tofail, S.A.M., Peremans, A.,
Silien, C., Optics Express, 2013, 21, 25632-25642.
[15] Huth, F., Schnell, M., Wittborn, J., Ocelic, N., Hillenbrand, R., Nature Materials,
2011, 10, 352-356.
[16] Liao, C.R., Rak, M., Lund, J., Unger, M., Platt, E., Albensi, B.C., Hirschmugi,
C.J., Gough, K.M., Analyst, 2013, 138, 3991-3997.
[17] Nasse, M.J., Walsh, M.J., Mattson, E.C., Reininger, R., Kajdacsy-Balla, A.,
Macias, V., Bhargava, R., Hirschmugl, C.J., Nature Methods, 2011, 8, 413-416.
[18] Reddy, R.K., Walsh, M.J., Schulmerich, M.V., Carney, P.S., Bhargava, R.,
Applied Spectroscopy, 2013, 67, 93-105.
[19] Marcott, C., Lo, M., Kjoller, K., Domanov, Y., Balooch, G., Luengo, G.S.,
Experimental Dermatology, 2013, 22, 417-437.
[20] Policar, C., Birgitta Waern, J., Plamont, M.A., Clede, S., Mayet, C., Prazeres, R.,
Ortega, J.M., Vessieres, A., Dazzi, A., Angew. Chem. Int. Ed., 2011, 50, 860-864.

217
[21] Mudanyali, O., Tseng, D., Oh, C., Isikman, S.O, Sencan, ., I., Bishara, W.,
Oztoprak, C., Seo, S., Khademhosseini, B., Ozcan, A., Lab on a Chip, 2010, 10,
1417-1428.
[22] Tseng, D., Mudanyali, O., Oztoprak, C., Isikman, S.O., Sencan, I., Yaglidere, O.,
Ozcan, A., Lab on a Chip, 2010, 10, 1787-1792.
[23] Zhu, H., Mavandadi, S., Coskun, A.F., Yaglidere, O., Ozcan, A., Analytical
Chemistry, 2011, 83, 6641-6647.
[24] Gallegos, D., Long, K.D., Yu, H., Clark, P.P., Lin, Y., George, S., Nath, P.,
Cunningham, B.T., Lab on a Chip, 2013, 13, 2124-2132.
[25] Balsam, J., Bruck, H.A., Rasooly, A., Sensors and Actuators B: Chemical, 2013,
186, 711-717.
[26] Mudanyali, O., Dimitrov, S., Sikora, U., Padmanabhan, S., Navruz, I., Ozcan, A.,
Lab on a Chip, 2012, 12, 2678-2686.
[27] Pallapa, M., Ou, L.M.L., Parameswaran, M., Yu, H.Z., Sensors and Actuators B,
2010, 148, 620-623.
[28] Zhu, H., Isikman, S.O., Mudanyali, O., Greenbaum, A., Ozcan, A., Lab on a
Chip, 2013, 13, 51-67.
[29] Zeng, Y., Wang, T., Anal. Bioanal. Chem., 2013, 405, 5743-5758.
[30] Zhu, H., Cox, E., Quian, J., Proteomics Clin. Appl., 2012, 6, 548-562.
[31] Walsh, M.J., Reddy, R.K., IEEE Journal of Selected Topics in Quantum
Electronics, 2012, 18, 1502-1513.
[32] Prashanth, G.R., Goudar, V.S., Raichur, A.M., Varma, M.M., Sensors and
Actuators B: Chemical, 2013, 183, 496-503.
[33] Mujawar, L.H., Moers, A., Norde, W., van Amerongen, A., Anal. Bioanal Chem,
2013, 405, 7469-7476.
[34] Mujawar, L.H., Maan, A.A., Khan, M.K.I., Norde, W., van Amerongen, A.,
Analytical Chemistry, 2013, 85, 3723-3729.

218
[35] “ONCYTE® Nitrocellulose Film Slides” Grace Bio-Labs, Inc. 2010.
http://www.gracebio.com/life-science-products/microarray/oncyte-nitrocellulose-
film-slides.html
[36] UniSart® Membranes Consistency by Design http://www.sartorius-
stedim.com.tw/Attachment/FCKeditor/Product/file/PDF/lab/filter&membran/Broc
h_Unisart_Membranes_SL-1522-e.pdf
[37] Zhang, B., Liu, B., Zhou, J., Tang, J., Tang, D., Applied Materials and Interfaces,
2013, 5, 4479-4485.
[38] Peretz-Soroka, H., Pevzner, A., Davidi, G., Naddaka, V., Tirosh, R., Flaxer,
Patolsky, F., NANO Letters, 2013, 13, 3157-3168.
[39] Chandra, P., Abbas Zaidi, S., Noh, H.B., Shim, Y.B., Biosensors and
Bioelectronics, 2011, 28, 326-332.
[40] Wang, J., Morabito, K., Erkers, T., Tripathi, A., Analyst, 2013, 138, 6573-6581.
[41] Lin, Y.H., Yang, Y.W., Chen, Y.D., Wang, S.S., Chang, Y.H., Wu, M.H., Lab on
a Chip, 2012, 12, 1164-1173.
[42] Arnandis-Chover, T., Morais, S., Gonzalez-Martinez, M.A., Puchades, R.,
Maquieira, A., Biosensors and Bioelectronics, 2014, 51, 109-114.
[43] Disc-shaped Point-of-Care platform for infectious disease diagnosis, K.
Mitsakakis, 2014 http://www.imtek.de/laboratories/mems-
applications/projects/projects_overview?projectId=8073
[44] Gyrolab Bioaffy CDs 2013 Gyros AB http://www.gyros.com/products/products-
optimized/gyrolab-bioaffy-cds/
[45] GenePOC 2014, GenePOC, Inc. http://www.genepoc-
diagnostics.com/Technology.shtml
[46] Liu, X.F., Wang, X., Weaver, R.J., Calliste, L., Xia, C., He, Y.J., Chen, L.,
Journal of Pharmacological and Toxicological Methods, 2012, 65, 107-114.
219
[47] Guo, Y.J., Sun, G.M., Zhang, L., Tang, Y.J., Luo, J.J., Yang, P.H., Sensors and
Actuators B: Chemical, 2014, 191, 741-749.
[48] Clede, S., Lambert, F., Sandt, C., Kascakova, S., Unger, M., Harte, E., Platmont,
M.A., Saint-Fort, R., Deniset-Besseau, A., Gueroui, Z., Hirschmugl, C., Lecomte,
S., Dazzi, A., Vessieres, A., Policar, C., Analyst, 2013, 138, 5627-5638.
[49] NeaSNOM Microscope, 2013 Neaspec
http://www.neaspec.com/products/neasnom-microscope/
[50] Amenabar, I., Poly, S., Nuansing, W., Hubrich, E.H., Govyadinov, A.A., Huth, F.,
Krutokhvostov, R., Zhang, L., Knez, M., Heberle, J., Bittner, A.M., Hillenbrand,
R., Nature Communications, 2013, 4, 1-9.
[51] Govyadinov, A.A., Amenabar, I., Huth, F., Carney, P.S., Hillenbrand, R., J. Phys.
Chem. Lett., 2013, 4, 1526-1531.
[52] Kitsommart, R., Ngerncham, S., Wongsiridej, P., Kolatat, T., Jirapaet, K.S., Paes,
B., Eur J Pediatr, 2013, 172, 1181-1186.
[53] StatStrip®
Connectivity and StatStrip Xpress Point-of-Care Glucose/Ketone
Monitoring Systems 2014 Nova Biomedical Corporation
http://www.novabiomedical.com/products/statstrip-glucoseketone-statstrip-
xpress-glucoseketone/
[54] Nadeski, M., Frantz , G., The future of medical Imaging
http://www.ti.com/lit/wp/slyy020/slyy020.pdf
[55] Cnoga Medical develops diagnostics through skin color, G. Weinreb, 2013
Globes http://www.globes.co.il/serveen/globes/docview.asp?did=1000877563
CHAPTER 3
[1] Engvall E, Jonsson K, Perlmann P., Biochimica et Biophysica Acta. 1971, 251,
427-434 .
[2] Hahn YK, Park JK., Lab Chip. 2011, 11, 2045-2048.
[3] Ranzoni A, Sabatte G, van Ijzendoorn LJ, Prins MWJ., ACSnano. 2012, 6, 3134-
3141.

220
[4] Mahanti P, Taylor T, Hayes MA, Cochran D, Petkus MM., Analyst. 2011, 136,
365-373.
[5] Chang B, Gray P, Piltch M, et al., J. Viro. Met. 2009, 159, 15-22.
[6] Ziegler J, Zimmermann M, Hunziker P, Delamarche E., Anal. Chem. 2008, 80,
1763-1769.
[7] Li P, Abolmaaty A, D’Amore C, Demming S, Anagnostopoulos C, Faghri M.,
Microfluid Nanofluid. 2009, 7, 593-598.
[8] Peyman SA, Iles A, Pamme N., Lab Chip. 2009, 9, 3110-3117.
[9] Sasso LA, Under A, Zahn JD., Microfluid Nanofluid. 2010, 9, 253-265.
[10] Shao G, Wang J, Li Z, Saraf L, Wang W, Lin Y, Sensors and Actuators B. 2011,
159, 44-50.
[11] Do J, Ahn CH. , Lab Chip. 2008, 8, 542-549.
[12] Langenhorst RJ, Lawson S, Kittawornrat A, et al., Clin. Vacc. Immunol. 2011, 19,
180-189.
[13] Lawson S, Lunney J, Zuckermann F, et al., Vaccine. 2010, 28, 5356-5364.
[14] Cao Z, Li H, Lau C, Zhang Y. , Analytica Chimica Acta. 2011, 698, 44-50.
[15] Zimmermann M, Hunziker P, Delamarche E., Biomed. Microdevices.2009, 11, 1-
8.
[16] Pesce AJ, Michael JG., J. Immunol. Met. 1992, 150, 111-119.
[17] Lee S, Cho NP, Kim JD, Jung H, Kang SH, Analyst. 2009, 134, 933-938.
[18] Vignali DAA.,. J.Immunol. Met. 2000, 243, 243-255.
[19] Allinson JL., Bioanalysis. 2011, 3, 2803-2816.
[20] Verch T, Bakhtiar R., Bioanalysis. 2012, 4, 177-188.

221
[21] Hayes MA, Petkus MM, Garcia AA, Taylor T, Mahanti P., Analyst. 2009, 134,
533-541.
[22] Watson DS, Reddy SM, Brahmakshatriya V, Lupiani B., J. Immunol. Met. 2009,
340, 123-131.
[23] Kellar KL, Douglass JP., J. Immunol. Met. 2003, 279, 277-285.
[24] Clavijo A, Hole K, Li M, Collignon B., Vaccine. 2006, 24, 1693-1704.
[25] Ravindran R, Khan IH, Krishnan VV, et al., J. Immunol. Met. 2010, 363, 51-59.
[26] Svateck RS, Shah JB, Xing J, et al., Cancer. 2010, 116, 4513-4519.
[27] Smith J, Samons D, Robertson S, Biagini R, Snawder J., Toxic. Mech. Meth.
2010, 20, 587-593.
[28] Kuriakose T, Hilt DA, Jackwood MW. , Avian Diseases. 2012, 56, 90-96.
[29] Pochechueva T, Chinarev A, Spengler M, et al., Analyst. 2011, 136, 560-569.
[30] Ji XH, Cheng W, Guo F, et al., Lab Chip. 2011, 11, 2561-2568.
[31] Talat N, Shahid F, Perry S, et al., Cytokine. 2011, 54, 136-143.
[32] Bin Z, Ke W, Jian J, et al., Food. Anal. Meth. 2011, 4, 228-232.
[33] Cauchon E, Liu S, Percival MD, et al., Anal. Biochem. 2009, 388, 134-139.
[34] Li Z, Zhang QY, Zhao LX, et al., Sci. China. Chem. 2010, 53, 812-819.
[35] Sista RS, Eckhardt AE, Srinivasan V, Pollack MG, Palanki S, Pamola VK., Lab
Chip. 2008, 8, 2188-2196.
[36] Lacharme F, Vandevyver C, Gijs MAM. , Microfluid Nanofluid. 2009, 7, 479-
487.
[37] Dupont EP, Labonne E, Vandevyver C, Lehmann U, Charbon E, Gijs MAM.,
Anal. Chem. 2010, 82, 49-52.

222
[38] Kim JI, Wang C, Kuizon S, et al., Neuroimmunol 2005, 158, 112-119.
[39] Proczek G, Gassner AL, Busnel JM, Girault HH., Anal. Bioanal. Chem. 2012,
402, 2645-2653.
[40] Lacharme F, Vandevyver C, Gijs MAM. , Anal. Chem. 2008, 80, 2905-2910.
[41] Piao Y, Jin Z, Lee D, et al., Biosens.Bioelectron. 2011, 26, 3192-3199.
[42] Soh N, Tanaka M, Hirakawa K, et al., Anal. Sci. 2011, 27, 1069-1076.
[43] Gao D, Li HF, Guo GS, Lin JM., Talanta. 2010, 82, 528-533.
[44] Chen H, Abolmatty A, Faghri M., Microfluid. Nanofluid. 2011, 10, 593-605.
[45] Squires TM, Messinger RJ, Manalis SR., Nat. Biotechnol. 2008, 26, 417-426.
[46] Sivagnanam V, Song B, Vandevyver C, Gijs MAM., Anal. Chem. 2009,81, 6509-
6515.
[47] Sivagnanam V, Bouhmad A, Lacharme F, Vandevyver C, Gijs MAM.,
Microelectron. Eng. 2009, 86, 1404-1406.
[48] Song SY, Han YD, Kim K, Yang SS, Yoon HC., Biosens. Bioelectron. 2011, 26,
3818-3824.
[49] Afshar R, Moser Y, Lehnert T, Gijs MAM., Anal. Chem. 2011, 83, 1022-1029.
[50] Fu Z, Shao G, Wang J, Lu D, Wang W, Lin Y., Anal. Chem. 2011, 83, 2685-2690.
[51] Pfaunmiller E, Moser AC, Hage DS., Methods 2012, 56, 130-135.
[52] Schiel JE, Tong Z, Sakulthaew C, Hage DS., Anal. Chem. 2011, 83, 9384-9390.
[53] Liu Y, Wang H, Huang J, Yang J, Liu B, Yang P., Anal. Chim. Acta 2009, 650,
77-82.
[54] Sinha A, Ganguly R, Puri IK., J. Appl. Phys. 2010, 107, 034907-1-034907-6.
223
[55] Lian W, Wu D, Lim DV, Jin S., Anal. Biochem. 2010, 401, 271-279.
[56] Han KC, Ahn DR, Yang EG., Bioconjugate Chem. 2010, 21, 2190-2196.
[57] Ruckstuhl T, Winterflood CM, Seeger S., Anal. Chem. 2011, 83, 2346-2360.
[58] Kai J, Puntambekar A, Sehy D, Brescia P, Banks P, Gen. Engineer. Biotechnol.
News. 2011, 31, 26-27.
[59] Lee BS, Lee JN, Park JM, et al., Lab Chip. 2009, 9, 1548-1555.
[60] Roman J, Qiu J, Dornadula G, et al., J. Pharm. Toxic. Meth. 2011, 63, 227-235.
[61] Yang Z, Liu H, Zong C, Yan F, Ju H., Anal. Chem. 2009, 81, 5484-5489.
[62] Yang Z, Zong C, Yan F, Ju H., Talanta. 2010, 82, 1462-1467.
[63] Xue C, Zhao H, Liu H, et al., Sens.Actuators B. 2011, 156, 863-866.
[64] Tan W, Huang Y, Nan T, et al., Anal. Chem. 2010, 82, 615-620.
Websites
[101] RNase H1Antibody (5D10). www.novusbio.com/H00246243-M01.
CHAPTER 4
[1] Qureshi, A., Gurbuz, Y., Niazi, J.H., Sensors and Actuators B, 2012, 171-172, 62-
76.
[2] ACC and Cardiac Biomarkers, 2014, http://www.acc.org/education-and-
meetings/image-and-slide-gallery/media-
detail?id=d9c880ce33f3482f993161076a32990a
[3] Vasan, R. S., Circulation, 2006, 113, 2335-2362.
[4] Kakoti, A., Goswam, P. i, Biosensors and Bioelectronics, 2013, 43, 400-411.
[5] Ishii, J., Wang, J.H., Naruse, H., Taga, S., Kinoshita, M., Kurokawa, H., Iwase,
M., Kondo, T., Nomura, M., Nagamura, Y., Watanabe, Y., Hishida, H., Tanaka,
T., Kawamura, K., Clinical Chemistry, 1997, 43, 1372-1378.

224
[6] Huang, C.H., Tsai, M.S., Chien, K.L., Hsu, C.Y., Chang, W.T., Wang, T.D.,
Chen, S.C., Huei-Ming Ma, M., Chen, W.J., Clinica Chimica Acta, 2014, 435, 7-
13.
[7] Glatz, J.F., Renneberg, R., Clinical Lipidology, 2014, 9, 205-220.
[8] Macdonald, S.P.J., Nagree, Y., Fatovich, D.M., Phillips, M., Brown, S.G.A.,
Emergency Medicine Journal, 2012, 30, 149-154.
[9] Liao, J., Chan, C.P., Cheung, Y., Lu, J., Luo, Y., Cautherley, G.W.H., Glatz,
J.F.C., Renneberg, R., International Journal of Cardiology, 2008, 133, 420-423.
[10] Tonomura, Y., Matsushima, S., Kashiwagi, E., Fujisawa, K., Takagi, S.,
Nishimura, Y., Fukushima, R., Torii, M., Matsubara, M., Toxicology, 2012, 302,
179-189.
[11] Inoue, K., Suwa, S., Ohta, H., Itoh, S., Maruyama, S., Masuda, N., Sugita, M.,
Daida, H., Circulation Journal, 2011, 75, 2813-2820.
[12] Molin, S.Da., Cappellini, F., Falbo, R., Signorini, S., Brambilla, P., Clinical
Biochemistry, 2014, 47, 247-249.
[13] Setsuta, K., Seino, Y., Mizuno, K., International Journal of Cardiology, 2014,
176, 1323-1325.
[14] McMahon, C.G., Lamont, J.V., Curtin, E., McConnell, R.I., Crockard, M., Kurth,
M.J., Crean, P., Fitzgerald, S.P., American Journal of Emergency Medicine, 2012,
30, 267-274.
[15] Gnedenko, O.V., Mezentsev, Y.V., Molnar, A.A., Lisitsa, A.V., Ivanov, A.S.,
Archakov, A.I., Analytica Chimica Acta, 2013, 759, 105-109.
[16] Body, R., McDowell, G., Carley, S., Wibberley, C., Ferguson, J., Mackway-
Jones, K., Resuscitation, 2011, 82, 1041-1046.
[17] Song, S. Y., Han, Y. D., Kim, K., Yang, S. S., Yoon, H. C., Biosensors and
Bioelectronics, 2011, 26, 3818-3824.

225
[18] Casolari, S., Roda, B., Mirasoli, M., Zangheri, M., Patrono, D., Reschiglian, P.,
Roda, A., Analyst, 2013, 138, 211-219.
[19] Tian, J., Zhou, L., Zhao, Y., Wang, Y., Peng, Y., Hong, X., Zhao, S., J Fluoresc,
2012.
[20] Lin, D., Wu, J., Wang, M., Yan, F., Ju, H., Analytical Chemistry, 2012, 84, 3662-
3668.
[21] Liang, G., Liu, S., Zou, G., Zhang, X., Analytical Chemistry, 2012, 84, 10645-
10649.
[22] Spindel, S., Sapsford, K.E., Sensors, 2014, 14, 22313-22341.
[23] Ammar, M., Smadja, C., Phuong, G.T., Azzous, M., Vigneron, J., Etcheberry, A.,
Taverna, M., Dufour-Gergam, E., Biosensors and Bioelectronics, 2013, 40, 329-
335.
[24] Caulum, M.M., Murphy, B.M., Ramsay, L.M., Henry, C.S., Analytical Chemistry,
2007, 79, 5249-5256.
[25] Park, M., Bong, J.H., Chang, Y.W., Yoo, G., Jose, J., Kang, M.J., Pyun, J.C.,
Analytical Methods, 2014, 6, 1700-1708.
[26] Han, J., Zhang, J., Xia, Y., Li, S., Jiang, L., Colloids and Surfaces A: Physiochem.
Eng. Aspects, 2011, 379, 2-9.
[27] Proczek, G., Gassner, A. L., Busnel, J. M., Girault, H. H., Anal. Bioanal. Chem.,
2012, 402, 2645-2653.
[28] Ranzoni, A., Sabatte, G., van Ijzendoorn, L. J., Prins, M. W. J., ACS Nano, 2012,
6, 3134-3141.
[29] Hahn, Y. K., Park, J. K., Lab Chip 2011, 11, 2045-2048.
[30] Hayes, M.A., Petkus, M.M., Garcia, A.A., Taylor, T., Mahanti, P., Analyst, 2009,
134, 533-541.
[31] Zhang, Y., Zhou, D., Expert Reviews Ltd, 2012, ISSN 1473-7159, 565-571.

226
[32] Petkus, M.M., McLauchlin, M., Vuppu, A.K., Rios, L., Garcia, A.A., Hayes,
M.A., Analytical Chemistry, 2006, 78, 1405-1411.
[33] Zhu, Y.D., Peng, J., Jiang, L.P., Zhu, J.J., Analyst, 2014, 139, 649-655.
[34] Sakamoto, S., Omagari, K., Kita, Y., Mochizuki, Y., Maito, Y., Kawata, S.,
Matsuda, S., Itano, O., Jinno, H., Takeuchi, H., Yamaguchi, Y., Kitagawa, Y.,
Handa, H., Clinical Chemistry, 2014, 60, 610-620.
[35] Woolley, C.F., Hayes, M.A., Bioanalysis, 2013, 5, 245-264.
[36] Fluorescein-EX Protein Labeling Kit, 2004,
http://tools.invitrogen.com/content/sfs/manuals/mp10240.pdf.
[37] Currie, L.A., Analytical Chemistry, 1968, 40, 586-593.
[38] Cardiac Marker ELISA Kits, 2013, http://www.calbiotech.com/products/elisa-
kits/human-elisa-kits/cardiac-marker-elisa-kits.
CHAPTER 5
[1] Brown, E. N., McDermott, T. J., Bloch, K. J., McCollom, A. D., Clinical
Chemistry 1996, 42, 893-903.
[2] Ekins, R., Kelso, D., Clin. Chem. 2011, 57, 372-375.
[3] Cook, D. B., Selt, C. H., Clinical Chemistry 1993, 39, 965-971.
[4] Miles, L. E. M., Hales, C. N., Nature 1968, 219, 186-189.
[5] Ishikawa, E., Hashida, S., Kohno, T., Hirota, K., Clinica Chimica Acta 1990, 194,
51-72.
[6] Ylander, P. J., Hanninen, P., Biophysical Chemistry 2010, 151, 105-110.
[7] Klenin, K. V., Kusnezow, W., Langowski, J., J. Chem. Phys. 2005, 122, 214715-
1-214715-11.
[8] Rodbard, D., Feldman, Y., Immunochemistry 1978, 15, 71-76.

227
[9] Sadana, A., Chen, Z., Biosensors and Bioelectronics 1996, 11, 17-33.
[10] Werthen, M., Nygren, H., Journal of Immunological Methods 1988, 115, 71-78.
[11] Nygren, H., Werthen, M., Stenberg, M., Journal of Immunological Methods 1987,
101, 63-71.
[12] Nygren, H., Stenberg, M., Immunology 1989, 66, 321-327.
[13] Stenberg, M., Nygren, H., J. theor. Biol. 1985, 113, 589-597.
[14] Stenberg, M., Stiblert, L., Nygren, H., J. theor. Biol. 1986, 120, 129-140.
[15] Beumer, T., Haarbosch, P., Carpay, W., Anal. Chem. 1996, 68, 1375-1380.
[16] Pesce, A. J., Michael, J. G., Journal of Immunological Methods 1992, 150, 111-
119.
[17] Stenberg, M., Nygren, H., Journal of Immunological Methods 1988, 113, 3-15.
[18] Rodbard, D., Feldman, Y., Jaffe, M. L., Miles, L. E. M., Immunochemistry 1978,
15, 77-82.
[19] Jackson, T. M. , Ekins, R. P., Journal of Immunological Methods 1986, 87, 13-20.
[20] Glass, T. R., Ohmura, N., Saiki, H., Anal. Chem. 2007, 79, 1954-1960.
[21] Seth, J., Clinical Chemistry 1990, 36, 178.
[22] Kalman, S. M., Clark, D. R., Moses, L. E., Clin. Chem. 1984, 30, 515-517.
[23] Currie, L. A., Analytical Chemistry 1968, 40, 586-593.
[24] Yalow, R. S., Berson, S. A., Nature 1959, 184, 1648-1649.
[25] Hassibi, A., Vikalo, H., Hajimiri, A., Journal of Applied Physics 2007, 102,
014909-1-014909-12.
[26] Rissin, D. M., Kan, C. W., Campbell, T. G., Howes, S. C., Fournier, D. R., Song,
L., Piech, T., Patel, P. P., Chang, L., Rivnak, A. J., Ferrell, E. P., Randall, J. D.,

228
Provuncher, G. K., Walt, D. R., Duffy, D. C., Nature Biotechnology, 2010, 28,
595-599.
[27] Tessler, L. A., Mitra, R. D., Proteomics 2011, 11, 4731-4735.
[28] Schmidt, R., Jacak, J., Schirwitz, C., Stadler, V., Michel, G., Marme, N., Schutz,
G. J., Hoheisel, J. D., Knemeyer, J. P., Journal of Proteome Research 2011, 10,
1316-1322.
[29] Hashida, S., Ishikawa, E., J. Biochem. 1990, 108, 960-964.
[30] Ohmura, N., Lackie, S. J., Saiki, H., Anal. Chem. 2001, 73, 3392-3399.
[31] Chang, L., Rissin, D. M., Fournier, D. R., Piech, T., Patel, P. P., Wilson, D. H.,
Duffy, D. C., Journal of Immunological Methods 2012, 378, 102-115.
[32] Shalev, A., Greenberg, A. H., McAlpine, P. J., J. Immunol. Meth. 1980, 38, 125-
39.
[33] Harris, C. C., Yolken, R. H., Krokan, H., Hsu, I. C., Proc. Natl. Acad. Sci. USA
1979, 76, 5336-5339.
[34] Hungerford, J. M., Christian, G. D., Anal. Chem. 1986, 58, 2567-2568.
[35] Diamandis, E.P., Christopoulos, T.K., Immunoassay (theory of immunoassays CH
3) 1996, 25-49.
[36] Ezan, E., Tiberghien, C., Dray, F., Clin. Chem. 1991, 37, 226-230.
[37] Yalow, R., Diabetes, 1961, 10, 339-344.
[38] Ractliffe, J. F., Elements of Mathematical Statistics, (the normal distribution CH
7) 1967, 51-68.
[39] Ewing, G.W., Chemical Instrumentation: XXXIX. Signal to Noise Optimization in
Chemistry. Chemical Education, 1968. 45(7): p. A533-A544.
[40] Johnson, J.B., Thermal Agitation of Electricity in Conductors. Physical Review,
1928. 32(1): p. 97-109.

229
[41] Nyquist, H., Thermal Agitation of Electric Charge in Conductors. Physical
Review, 1928. 32(1): p. 110-113.
[42] Abcam plc., 2015,
http://www.abcam.com/index.html?pageconfig=resource&rid=15749&source=pa
getrap&viapagetrap=kd.
[43] Voet, D., Voet, J.G., Pratt, C.W., Fundamentals of Biochemistry (Antibodies
Section 7.3) 2008, 209-215.
[44] Guo, Y., Harel, O., Little, R. J., Epidemiology 2010, 21, S10-S16.
[45] O’Malley, A.J., Deely, J.J., Aust. N.Z. J. Stat., 2003, 45, 43-65.
CHAPTER 6
[1] Fan, R., Vermesh, O., Srivastava, A., Yen, B.K.H., Qin, L., Ahmad, H., Kwong,
G.A., Liu, C.C., Gould, J., Hood, L., Heath, J.R., Nature Biotechnology, 2008,
26, 1373-1378.
[2] Anderson, N.L., Anderson, N.G., Molecular and Cellular Proteomics, 2002,
1.11, 845-867.
[3] Bellei, E., Bergamini, S., Monari, E., Fantoni, L.I., Cuoghi, A., Amino Acids,
2011, 40, 145-156.
[4] Tirumalai, R.S., Chan, K.C., Prieto, D.A., Issaq, H.J., Conrads, T.P., Veenstra,
T.D., Molecular and Cellular Proteomics, 2006, 2.10, 1096-1103.
[5] Yan, S., Zhang, J., Alici, G., Du, H., Zhu, Y., Li, W., Lab Chip, 2014, 14, 2993-
3003.
[6] Moschallski, M., Evers, A., Brandsetter, T., Ruhe, J., Analytica Chimica Acta, 2013,
781, 72-79.
[7] Moschallski, M., Baader, J., Prucker, O., Ruhe, J., Analytica Chimica Acta, 2010,
671, 92-98.

230
[8] Martin, R.M., Patel, R., Oken, E., Thompson, J., Zinovik, A., Kramer, M.S.,
Vilchuck, K., Bogdanovich, N., Sergeichick, N., Foo, Y., Gusina, N., Plos One,
2013, 8, 1-10.
[9] Liang, W., Li, Y., Zhang, B., Zhang, Z., Chen, A., Qi, D., Yi, W., Hu, C.,
Biosensors and Bioelectronics, 2012, 31, 480-485.
[10] Tachi, T., Kaji, N., Tokeshi, M., Baba, T., Lab on a Chip, 2009, 9, 966-971.
[11] Zhang, B., Liu, B., Zhou, J., Tang, J., Tang, D., Applied Materials and
Interfaces, 2013, 5, 4479-4485.
[12] Chandra, P., Abbas Zaidi, S., Noh, H.B., Shim, Y.B., Biosensors and
Bioelectronics, 2011, 28, 326-332.
[13] Svateck, R.S., Shah, J.B., Xin, J., et al., Cancer, 2010, 116, 4513-4519.
[14] Carlo, D.D., Edd, J.F., Irimia, D., Tompkins, R.G., Toner, M., Analytical
Chemistry, 2008, 80, 2204-2211.
[15] Javanmard, M., Emaminejad, S., Gupta, C., Provine, J., Davis, R.W., Howe,
R.T., Sensors and Actuators B, 2014, 193, 918-924.
[16] Dimov, I.K., Basabe-Desmonts, L., Garcia-Cordero, J.L., Ross, B.M., Ricco,
A.J., Lee, L.P., Lab on a Chip, 2011, 11, 845-850.
[17] Li, M., Li, W.H., Zhang, J., Alici, G., Wen, W., Journal of Physics D: Applied
Physics, 2014, 47, 1-30.
[18] Jung, J., Han, K.H., Applied Physics Letters, 2008, 93, 223902-1-3.
[19] Gossett, D.R., Carlo, D.D., Analytical Chemistry, 2009, 81, 8459-8465.
[20] VanDelinder, V., Groisman, A., Analytical Chemistry, 2007, 79, 2023-2030.
[21] Demircan, Y., Ozgur, E., Kulah, H., Electrophoresis, 2013, 34, 1008-1027.
[22] Pethig, R., Biomicrofluidics, 2010, 4, 022811-1-35.

231
[23] Zhu, H., Lin, X., Su, Y., Dong, H., Wu, J., Biosensors and Bioelectronics, 2015,
63, 371-378.
[24] Huang, C., Liu, H., Bander, N.H., Kirby, B.J., Biomed Microdevices, 2013, 15,
941-948.
[25] Sonnenberg, A., Marciniak, J.Y., Skowronski, E.A., Manouchehri, S., Rassenti,
L., Ghia, E.M., Widhopf II, G.F., Kipps, T.J., Heller, M.J., Electrophoresis,
2014, 35, 1828-1836.
[26] Jones, P.V., Staton, S.J.R., Hayes, M.A., Anal Bioanal Chem, 2011, 401, 2103-
2111.
[27] Turgeon, M.L., Clinical Hematology: Theory and Procedures (Principles of
Blood Collection, CH 2), 2004, 18-40.
CHAPTER 7
[1] Morrow, D. A., Cannon, C. P., Jesse, R. L., Newby, L. K., Ravkilde, J., Storrow,
A. B., Wu, A. H. B., Christenson, R.H., Clinical Chemistry, 2007, 53, 552-574.
[2] Macdonald, S.P.J., Nagree, Y., Fatovich, D.M., Phillips, M., Brown, S.G.A.,
Emergency Medicine Journal, 2012, 30, 149-154.
[3] Molin, S.Da., Cappellini, F., Falbo, R., Signorini, S., Brambilla, P., Clinical
Biochemistry, 2014, 47, 247-249.
[4] Fan, R., Vermesh, O., Srivastava, A., Yen, B.K.H., Qin, L., Ahmad, H., Kwong,
G.A., Liu, C.C., Gould, J., Hood, L., Heath, J.R., Nature Biotechnology, 2008, 26,
1373-1378.
[5] Anderson, N.L., Anderson, N.G., Molecular and Cellular Proteomics, 2002, 1.11,
845-867.
[6] Bellei, E., Bergamini, S., Monari, E., Fantoni, L.I., Cuoghi, A., Amino Acids,
2011, 40, 145-156.

232
[7] Tirumalai, R.S., Chan, K.C., Prieto, D.A., Issaq, H.J., Conrads, T.P., Veenstra,
T.D., Molecular and Cellular Proteomics, 2006, 2.10, 1096-1103.
[8] Smits, N.G.E., Ludwig, S.K.J., Van der Veer, G., Bremer, M.G.E.G., Nielen,
M.W.F., Analyst, 2013, 138, 111-117.
[9] Jayadev, C., Rout, R., Price, A., Hulley, P., Mahoney, D., Journal of
Immunological Methods, 2012, 386, 22-30.
[10] Tirumalai, R.S., Chan, K.C., Prieto, D.A., Issaq, H.J., Conrads, T.P., Veenstra,
T.D., Molecular and Cellular Proteomics, 2006, 2.10, 1096-1103.
[11] Mitchell, P., Nature Biotechnology, 2010, 28, 665-670.
[12] Camerini, S., Polci, M. L., Liotta, L. A., Petricoin, E. F., Zhou, W., Proteomics
Clin. Appl., 2007, 1, 176-184.
[13] Joglekar, M., Roggers, R. A., Zhao, Y., Trewyn, B. G., RSC Advances, 2013, 3,
2454-2461.
[14] Wang, X., Masschelein, E., Hespel, P., Adams, E., Schepdael, A. V.,
Electrophoresis, 2012, 33, 402-405.
[15] Jubery, T. Z., Hossan, M. R., Bottenus, D. R., Ivory, C. F., Dong, W., Dutta, P.,
Biomicrofluidics, 2012, 6, 016503-1-13.
[16] Startsev, M. A., Inglis, D. W., Baker, M. S., Goldys, E. M., Analytical Chemistry,
2013, 85, 7133-7138.
[17] Inglis, D. W., Goldys, E. M., Calander, N. P., Angew. Chem. Int. Ed., 2011, 50,
7546-7550.
[18] Kenyon, S. M., Weiss, N. G., Hayes, M. A., Electrophoresis, 2012, 33, 1227-
1235.
[19] Meighan, M.M., Vasquez, J., Dziubcynski, L., Hews, S., Hayes, M.A., Analytical
Chemistry, 2011, 83, 368-373.

233
[20] Kenyon, S.M., The Development of a Microfluidic Array for Use in
Electrophoretic Exclusion Separations (Adapting Electrophoretic Exclusion to a
Microdevice, Thesis), 2013, 118-140. http://hdl.handle.net/2286/R.A.97689
CHAPTER 8
[1] Cao, Z., Li, H., Lau, C., Zhang, Y., Analytica Chimica Acta, 2011, 698, 44-50.
[2] Lacharme, F., Vandevyver, C., Gijs, M.A.M., Microfluid Nanofluidics, 2009, 7,
479-487.
[3] Li, Z., Zhao, Q.Y., et al., Sci. China Chem., 2010, 53, 812-819.
[4] Proczek, G., Gassner, A.L., Busnel, J.M., Girault, H.H., Anal. Bioanal. Chem.,
2012, 402, 2645-2653.
[5] Song, S.Y., Han, Y.D., Kim, K., Yang, S.S., Yoon, H.C., Biosens. Bioelectron.,
2011, 26, 3818-3824.
[6] Fu, Z., Shao, G., Wang, J., Lu, D., Wang, W., Lin, Y., Anal. Chem., 2011, 83,
2685-2690.
[7] Ziegler, J., Zimmermann, M., Hunziker, P., Delamarche, E., Analytical
Chemistry, 2008, 80, 1763-1769.
[8] Zimmermann, M., Hunziker, P., Delmarche, E., Biomed. Microdevices, 2009, 11,
1-8.
[9] Lee, B.S., Lee, J.N., Park, J.M., et al., Lab Chip, 2009, 9, 1548-1555.
[10] Shao, G., Wang, J., Li, Z., Saraf, L., Wang, W., Lin, Y., Sens. Actuators B
Chemistry, 2011, 159, 44-50.
[11] Wang, H., Ou, L.M.L, Suo, Y., Yu, H.Z., Analytical Chemistry, 2011, 83, 1557-
1563.
[12] Yu, H.Z., Li, Y., Ou, L.M.L., Accounts of Chemical Research, 2013, 46, 258-268.
[13] Tamarit-Lopez, J., Morais, S., Manuis, M.J., Puchades, R., Maquieira, A.,
Analytical Chemistry, 2010, 82, 1954-1963.

234
[14] Pallapa, M., Ou, L.M.L., Parameswaran, M., Yu, H.Z., Sensors and Actuators B,
2010, 148, 620-623.
[15] Seia, M.A., Pereira, S.V., Fontan, C.A., DeVito, I.E., Messina, G.A., Raba, J.,
Sens. Actuators B, Chemistry, 2012, 168, 297-302.
[16] Kenyon, S.M., The Development of a Microfluidic Array for Use in
Electrophoretic Exclusion Separations (Adapting Electrophoretic Exclusion to a
Microdevice, Thesis), 2013, 118-140. http://hdl.handle.net/2286/R.A.97689
[17] Kenyon, S.M., Weiss, N.G., Hayes, M.A., Electrophoresis, 2012, 33, 1227-1235.
[18] Thomas, C.D., Jacobson, S.C., Ramsey, J.M., Analytical Chemistry, 2004, 76,
6053-6057.
[19] Bai, X., Lee, H.J., Rossier, J.S., Reymond, F., Schafer, H., Wossner, M., Girault,
H.H., Lab on a Chip, 2002, 2, 45-49.
[20] Alarle, J.P., Jacobson, S.C., Culbertson, C.T., Ramsey, J.M., Electrophoresis,
2000, 21, 100-106.
[21] Ermakov, S.V., Jacobson, S.C., Ramsey, J.M., Analytical Chemistry, 2000, 72,
3512-3517.
[22] Araci, I.E., Quake, S.R., Lab on a Chip, 2012, 12, 2803-2806.
[23] Weaver, J.A., Melin, J. Stark, D. Quake, S.R., Horowitz, M.A., Nature Physics,
2010, 6, 218-223.
[24] Studer, V., Hang, G., Pandolfi, A., Ortiz, M., Anderson, W.F. Quake, S.R., J.
Appl. Phys., 2004, 95, 393-398.
[25] Unger, M.A., Chou, H.P., Thorsen, T., Scherer, A. Quake, S.R., Science, 2000,
288, 113-116.

235
APPENDIX A
PUBLISHED PORTIONS

236
Chapters 2 and 3 were previously published in the journals referenced below.
Woolley, C. F., Hayes, M. A., Analyst. 2014, 139, 2277-2288.
Woolley, C. F., Hayes, M. A., Bioanalysis. 2013, 5, 245-264.
Chapters 4 and 5 were submitted to the journals referenced below.
Woolley, C.F., Hayes, M.A., Analytical Methods, submitted.
Woolley, C.F., Hayes, M.A., Mahanti, P., Gilman, S.D., Taylor, T., Analytical and
Bioanalytical Chemistry, submitted.
Published portions or portions in preparation were included with the permission of all
coauthors.

237
APPENDIX B
SUPPLEMENTAL INFORMATION

238
Technique Applications Sensitivity Analysis
Time
Equipment/Fabrication
Requirements
Single/Poly/
Multiplex
Ref
eren
ces
Non-magnetic
particle assay
FMIA Protein/ drug/
small
molecule
quantification
pg -
ng/mL
70min-
4 hours
Luminex beads; flow
cytometer; Luminex
X-map technology
Multiplex 12,
13,
20,
23-
30
FIA Protein
quantification
~0.1
ng/mL
1-3
hour
Fluorescent
microscope; chip
fabrication
Singleplex/
Polyplex
14,
48,
50
AlphaLISA Protein/ toxin
detection
~0.007
ng/mL
1(+)
hour
EnVision reader;
AlphaScreen beads
Singleplex 32,
33
BD Biosciences Cytokine
quantification
3 pg/mL 3(+)
hours
BD FACS array bio-
analyzer; CBA kit
Multiplex 31
Off-chip
incubation
magnetic bead
assay
FIA Protein/
antibody
quantification
~11.5
pg/mL
1-3
hours
Microchip fabrication;
fluorescent
microscope
Singleplex 4,
21,
36,
39,
101
Electrochemical
Detection
Antibody
quantification
0.19
ng/mL
~3
hours
Electrochemical
sensor; microchip
fabrication
Singleplex 41
Chemiluminescent
Detection
Protein
quantification
0.61
ng/mL
~2
hours
Microchip fabrication Singleplex 34
On-chip
magnetic bead
assay
Manipulation of
particles
DNA,
antibody,
small
molecule
quantification
~250
ng/mL –
0.1
µg/mL
10 min
– 2.5
hours
Fluorescence
microscope;
microchip fabrication
Singleplex 8,
9,
44
Manipulation of
reagents
Protein/
antibody
quantification
3.2 fg/mL
– 16.4
ng/mL
35min
– 3
hours
Microchip fabrication;
electrochemical
detector;
isomagnetophoretic
detector
Singleplex/
Multiplex
2,
11,
40,
43
Flow-based assay
RDIA Protein
quantification
67 µg/mL <10
min
Analog column;
fluorescence detector
Singleplex 51,
52
Electrochemical
Detection
Protein
quantification
1 pg/mL 40 min Three-electrode
electrical system;
microchip fabrication
Singleplex 53
Static solid-
support assay

239
Capillary systems
(CSs)
Protein
quantification
0.9
ng/mL –
3 µg/mL
11 – 25
min
Microchip fabrication;
fluorescence detector
Multiplex 6,
15
Supercritical
angle fluorescence
Cytokine
quantification
4 pg/mL 13 min Microchip fabrication;
fluorescence detector
Singleplex 57
SOFIA Dye/protein
quantification
~10
ag/mL
~3
hours
Lock-in amplifier;
optical fibers; photo-
voltaic diode
Singleplex 5
OLISA Protein
quantification
1 ng/mL ~3
hours
Fluorescence detector;
detection antibodies
with differing
fluorophore/quencher
pairs
Multiplex 56
Portable disk
automated ELISA
Protein/
antibody
quantification
0.51
ng/mL
30 min Micro-disc fabrication Polyplex 59
Gyrolab Protein/
antibody
quantification
5 ng/mL ~1 hour Fluorescent detector;
Gyrolab Bioaffy CDs
Singleplex 60
DRZ chip Protein
quantification
5 ng/mL ~3
hours
Fluorescence detector;
microchip fabrication
Polyplex 10
NP-labeled array Small
molecule/
protein
quantification
10 pg/mL 3(+)
hours
Fluorescence detector;
microchip fabrication
Multiplex 55
TIRFM system Cytokine
quantification
0.13
fg/mL
2 hours Microscope;
microchip fabrication
Singleplex 17
SWIC system Protein
quantification
0.6-0.89
ng/mL
~27
minutes
Chemiluminescence
detector; optical
shutter; microchip
fabrication
Polyplex 62
Microcantelievers Small
molecule
quantification
0.1 – 1
ng/mL
1(+)
hour
Photon sensitive
detector; flow cell;
beam splitter
Singleplex 19,
20
Table 3.1. Provided here is a summary of the techniques described for emerging micro-
immunoassays. While this table provides an overview of technologies in the field, they
represent average values for each category of assay which give only a gross
approximation for the capabilities of each immunoassay technique
