optimization - · pdf file3 sequence databases swiss-prot fast search; not comprehensive;...
TRANSCRIPT

1
Optimization

2
Choices, choices, choices ...
• Which sequence database?
• Which modifications?
• What mass tolerance?
Where to begin?

3
Sequence Databases
Swiss-prot fast search; not comprehensive; consensus sequence; good annotations
MSDB, NCBI nr average speed; comprehensive; non-identical
dbEST slow search; exhaustive & redundant
Species specific ORFS
fast search; exhaustive for one species
Swiss-prot is the highest quality database, but many entries areconsensus sequences, with variants described in the annotations.Mascot searches only the FASTA sequence, so these variants aremissed. Better to use a database where variant sequences areincluded as separate entries.

4
Modifications
• Variable modifications
• Increase search time
• Reduce specificity
• First pass
• Fixed: Cys alkylation
• Variable: Met oxidation
• Watch for
• Multiple variable Cys mods
Modfications should be used sparingly in a first pass search.

5
Mass Tolerances
• Better to be pessimistic
• Accuracy, not precision
• Proportional (%, ppm) or fixed (Da, mmu)?
• Higher accuracy = higher specificity

6
Score vs. Tolerance
0
50
100
150
200
250
300
350
400
0.01% 0.10% 1.00% 10.00%
Full width of peptide mass tolerance window
Sco
re f
or
UV
RB
_TH
ET
H72 values, 36 matches at ± 0.02%
24 values, 13 matches at ± 0.02%
8 values, 5 matches at ± 0.02%
For peptide mass fingerprinting, high mass accuracy is mostimportant when there are only a few mass values. As the data setbecomes larger, high accuracy becomes less critical.
For a data set with 36 matches from72 mass values, a significantmatch can be obtained even when the mass tolerance approaches1%. With a smaller data set, 13 matches from 24, a significantmatch requires a mass tolerance of better than 0.2%. If the dataset is only 5 matches from 8, the match is never significant.

7
Error distribution graph
The best way to decide on the mass tolerance setting is to look atthe error graphs. For peptide mass values, the error graph is onthe protein view report. For fragment ion mass values, the errorgraph is on the peptide view report.
The graphs will also give an indication of whether a constant (Da,mmu) or a fractional (%, ppm) error window is most appropriate.

8
Worst case conditions
• Wide peptide mass tolerance
• Large number of variable modifications
• No enzyme specificity
• Large database
Search time and search specificity are inversely related.
Search time increases proportionately to peptide mass toleranceand database size.
Search time increases geometrically with the number of variablemodifications.
Going from tryptic specificity to no-enzyme will typically increasethe search time by a factor between 100 and 1000

9
Interpreting the results
• What does the score mean?• What does the histogram mean?• Protein View• Peptide summary report vs Protein summary
report for ms-ms data• MS-MS fragment ions identity / homology
threshold• Repeating searches with different parameters• “Tour” of a complex MS-MS results page

10
Probability based scoring:
Compute the probability that theobserved match between theexperimental data and mass valuescalculated from a candidate peptidesequence is a random event.
The correct match, which is not arandom event, has a very lowprobability.

11
Probability based scoringenables standard statisticaltests to be applied to results
Mascot score is -10Log10(P)
In a database of 500,000 entries, a 1 ina 1,000 chance of getting a falsepositive match is a probability of
P = 1 / (1,000 x 500,000)
Equivalent to a Mascot score of 87
The most important advantage of probability based scoring is thatwe can use standard statistical tests to determine significance.That is, we have an objective means of determining whether amatch is strong or weak … or a false positive.
Assigning a significance threshold or confidence level to a matchis extremely simple. Assume we are running a fully automatedsystem and prefer to repeat an experiment rather than get a falsepositive. We might choose a significance threshold of 1 in 1,000.That is, we are only interested in results which have less than a 1in 1,000 chance of being random events.
If the database being searched has 500,000 protein entries, a 1 in1,000 chance of finding a match is simply 1 over 1,000 times500,000. Which converts into a Mascot score of 87.
So, we can have a simple rule in software which looks for matcheswith scores greater than 87.

12
Scores for top 50 matches
At the top of each report, there is a histogram of the scoredistribution for the top 50 matches. Here, out of the top 50 proteinhits, 49 have scores which are below the 5% significance thresholdof 67. The area below the significance threshold is shaded green.One hit has a much higher score, 352. Very much higher whenyou appreciate that this is a logarithmic scale.

13
Protein Summary
• Always used for peptide mass fingerprint
• Option for MS/MS ions search
• Not suitable for complex mixtures
• Lists top scoring protein matches

14
The top of a protein summary report

15
The hit list for a protein summary report

16
The bottom of the report showing the search parameter summary

17
The protein summary report tabulates details of the matches forthe top hits. Here, we can see that hit 2 is not a different protein,it is just a fragment of hit 1.

18
Clicking on the accession number link leads to the protein viewreport.

19
Besides the error graph mentioned earlier, the protein view alsoshows the hits highlighted on the protein sequence and a table ofall the peptides from the in silico digest.

20
If available, the full annotation text is displayed at the bottom ofthe protein view.

21
Repeating searches
• Click on “Re-search all” or “Search Selected”• Repeat to get a better score to ‘validate’ results
- increase number of missed cleavages - look at error graph, is tolerance ‘correct’
• Repeat when no significant match - try different modifications - try increasing the mass tolerance

22
Peptide Summary
• Default for MS/MS ions search
• Lists top scoring peptide matches grouped intoprotein matches
• Tries to answer the question: which minimal setof proteins best accounts for the peptides matchesfound in the experimental data?

23
When we have just a single MS/MS spectrum, life is simple.Either we get a peptide match, or we don’t.

24
If we get a match,and the peptide is unique to one protein family,we have a protein match
25
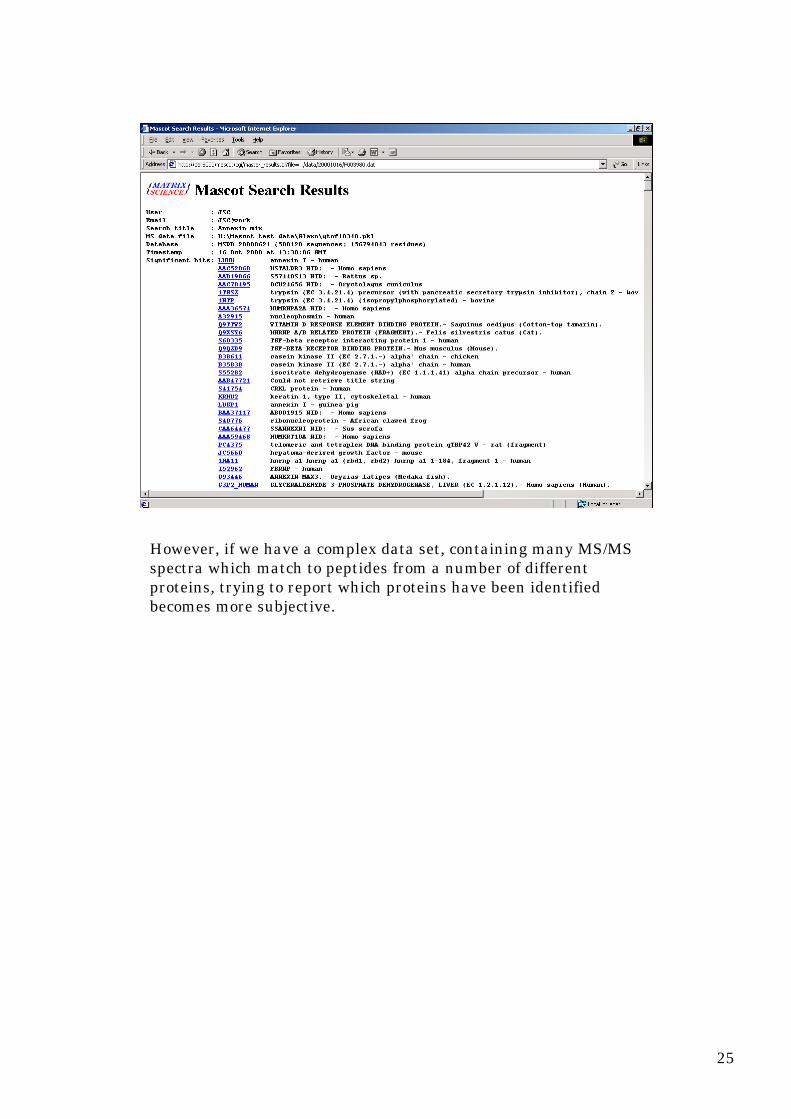
However, if we have a complex data set, containing many MS/MSspectra which match to peptides from a number of differentproteins, trying to report which proteins have been identifiedbecomes more subjective.

26
Pep
tid
esProteins
When Mascot searches MS/MS data, it is getting peptide matches.
Looking at the peptide matches and trying to determine whichproteins were present is a secondary process, which is actuallydone by the report script.
We can think of the results from a Mascot search of an LC-MS/MSsearch as a huge matrix. The columns are proteins and the rowsare peptides.
This isn’t a diagonal matrix, with just one cross in each row orcolumn. In most cases, a peptide match can be found in severalproteins. And, very often, a protein will contain several peptidematches.
To produce a simple, linear list of protein matches, we take thecolumn with the highest score, and call that protein hit number 1.Any other proteins which match the same set of peptides, or asubset, are considered to be equivalent, but inferior matches, andcollapsed into the same hit. These proteins are removed from thematrix, and we then look for the next highest scoring column …and so on.

27
In the reports, we try to provide clues as to the most likelyassignments. We use red to indicate that a peptide match is thetop ranking match. We use bold type to indicate that this is thefirst time in the report that we have listed a match to a particularspectrum.
So, Hit 24 has two nice, top-ranking matches, but they are not inbold face type. This indicates that we have already seen matchesto these spectra in earlier, i.e. higher scoring, proteins, whichprobably means that this protein match is spurious … but onecan’t be sure.

28
Peptide Summary
• Bold face type: First match listed for thisspectrum
• Red type: Top ranking peptide match for thisspectrum
• Protein match without any bold red peptidematches is unlikely to be correct

29
K2C1_HUMAN KRHU2 Query Score Sequence
* * 25 23 TLLEGEESR
* 30 43 AQYEDIAQK
* 56 80 SLDLDSIIAEVK
* * 80 68 WELLQQVDTSTR
* * 104 37 QISNLQQSISDAEQR
The peptide summary report represents one reasonableinterpretation of the results. Sometimes, there are alternativeswhich cannot be resolved. For example, we might have thissituation, where there are four matches to one keratin and fourmatches to another keratin.
It could be that only the left hand keratin was actually present inthe sample, and the match to AQYEDIAQK is unreliable, orbelongs to a different protein. Or, it could be that the keratin inthe sample was a variant, not present in the database, whichcontains all five peptide matches. There are several other possibleinterpretations, and we cannot be certain which is correct.

30
A search of a complete LC-MS/MS run generates a wealth of data,and presenting these results in a complex and intuitive fashion isnot trivial.
Here, we have part of the Mascot report for such a search. Anumber of peptide matches have been assigned to a particulardatabase entry.
For each peptide match listed in the main table, there may bebetter or worse matches to peptides from other entries in thedatabase. These are shown in a pop-up window when the mousecursor is held over a query number link.
In this example, we have one match with a high, and significantscore. The remaining matches are random matches with randomscores.

31
In contrast, here we see several non-random, significant matches,because there are four peptides in the database which are almost,but not quite, identical.
The peptide match to this protein has a very high score, but thereis another sequence with a slightly higher score. Since this proteinhas several other excellent matches, we are faced with a question:which of the top two peptide matches do we believe? Does theanalyte have a variant sequence from that in the database, andthe top match is correct? Or, is the spectrum ambiguous, andthere is insufficient information to differentiate the top twomatches with confidence? Either is perfectly possible.

32
This third example shows a weak match.
Very often, this is because the quality of the MS/MS spectrum ispoor. If the signal to noise ratio is low, a match to the “correct”sequence might not exceed the absolute significance threshold.Even so, the match to the correct sequence could have a relativelyhigh score, well differentiated from the quasi-normal distributionof random scores. In other words, the score is an outlier.
This would indicate that the match was not a random event and,on inspection, such matches are often found to be either thecorrect match or a match to a close homolog. For this reason,Mascot also attempts to characterise the distribution of randomscores, and provide a second, lower threshold to highlight thepresence of any outlier. The lower, relative threshold is reportedas the “homology” threshold while the higher, absolute thresholdis reported as the “identity” threshold.

33
Peptide Summary
• Score exceeds homology threshold:
• Match is not random.
• Spectrum may not fully define sequence
• Sequence may be close but not exact
• Score exceeds identity threshold:
• 5% chance that match is not exact
34
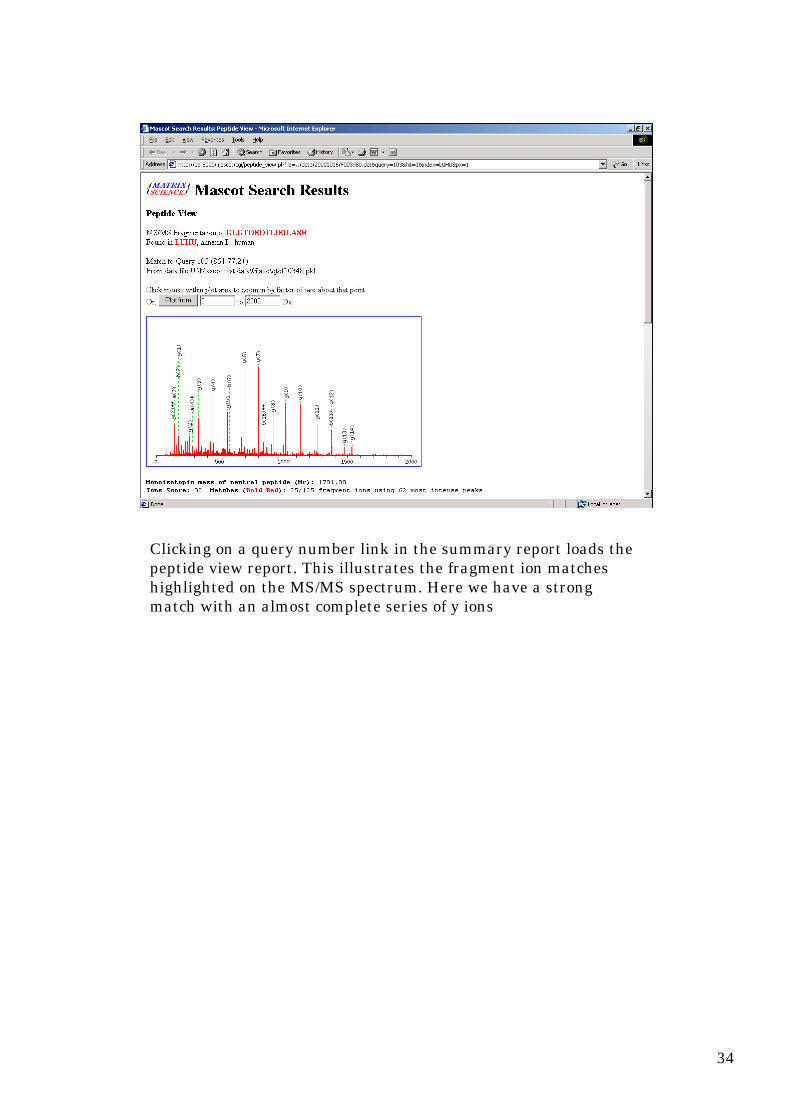
Clicking on a query number link in the summary report loads thepeptide view report. This illustrates the fragment ion matcheshighlighted on the MS/MS spectrum. Here we have a strongmatch with an almost complete series of y ions

35
Further down, the matched peaks are highlighted in a table ofcalculated fragment ion masses. The peptide view is also whereyou can find the new graph of the error distribution for fragmention masses.

36
This is the peptide view for the weak match shown earlier. It canbe seen that there is very little information above the precursor,and the signal to noise is not great

37
The N terminal end of the sequence is pretty much undefined.This is a good example of a spectrum which might get a matchabove the homology threshold, but lacks the information requiredto exceed the identity threshold

38
Finally, a major difference between reports from searching aprotein database and those from searching a nucleic acid databaseis the possibility of frame shifts within the entry.
Thus, in the protein view report, there is a drop down list for thedifferent translation frames. For this particular entry, most of thematches have been found in reading frame 2. But, as so oftenhappens, there is a frame shift in this entry, and there areadditional matches in frame 3.