optimizing test pattern generation using top-off atpg … · 2017-04-28 · atpg is not the most...
TRANSCRIPT

OPTIMIZING TEST PATTERN GENERATION USING TOP-OFF ATPG
METHODOLOGY FOR STUCK–AT, TRANSITION AND SMALL DELAY DEFECT
FAULTS
A Thesis
by
ARJUN SINGH GILL
Submitted to the Office of Graduate Studies of Texas A&M University
in partial fulfillment of the requirements for the degree of
MASTER OF SCIENCE
Approved by:
Chair of Committee, Duncan M. H. Walker Committee Members, Rabi Mahapatra Jiang Hu Head of Department, Duncan M. H. Walker
May 2013
Major Subject: Computer Engineering
Copyright 2013 Arjun Singh Gill

ii
ABSTRACT
The ever increasing complexity and size of digital circuits complemented by
Deep Sub Micron (DSM) technology trends today pose challenges to the efficient
Design For Test (DFT) methodologies. Innovation is required not only in designing the
digital circuits, but also in automatic test pattern generation (ATPG) to ensure that the
pattern set screens all the targeted faults while still complying with the Automatic Test
Equipment (ATE) memory constraints.
DSM technology trends push the requirements of ATPG to not only include the
conventional static defects but also to include test patterns for dynamic defects. The
current industry practices consider test pattern generation for transition faults to screen
dynamic defects. It has been observed that just screening for transition faults alone is
not sufficient in light of the continuing DSM technology trends. Shrinking technology
nodes have pushed DFT engineers to include Small Delay Defect (SDD) test patterns in
the production flow. The current industry standard ATPG tools are evolving and SDD
ATPG is not the most economical option in terms of both test generation CPU time and
pattern volume. New techniques must be explored in order to ensure that a quality test
pattern set can be generated which includes patterns for stuck-at, transition and SDD
faults, all the while ensuring that the pattern volume remains economical.
This thesis explores the use of a “Top-Off” ATPG methodology to generate an
optimal test pattern set which can effectively screen the required fault models while
containing the pattern volume within a reasonable limit.

iii
ACKNOWLEDGEMENTS
I would like to thank my committee chair Dr. Duncan M. “Hank” Walker and
my committee members Dr. Rabi Mahapatra and Dr. Jiang Hu for their guidance and
support throughout the course of this research. I would also like to thank Tom Olsen
who supported and guided me throughout my internship at Advanced Micro Devices,
Inc. (AMD), Fort Collins, CO.
I am also thankful to my friends, colleagues and the department faculty and staff
for making my time at Texas A&M University a great experience.
Finally, thanks to my mother for her encouragement, patience and love.

iv
NOMENCLATURE
ATPG Automatic Test Pattern Generation
DFT Design For Test
SDD Small Delay Defect
DSM Deep Sub Micron
VLSI Very Large Scale Integration
ATE Automatic Test Equipment

v
TABLE OF CONTENTS
ABSTRACT .......................................................................................................................ii
ACKNOWLEDGEMENTS ............................................................................................. iii
NOMENCLATURE .......................................................................................................... iv
TABLE OF CONTENTS ................................................................................................... v
LIST OF FIGURES ........................................................................................................... vi
LIST OF TABLES ...........................................................................................................vii
1. INTRODUCTION ......................................................................................................... 1
2. FAULT MODELING .................................................................................................... 3
2.1 Stuck-At Fault Model ........................................................................................... 3 2.2 Transition Fault Model ......................................................................................... 4 2.3 Small Delay Defects ............................................................................................. 5 2.4 User Defined Fault Model .................................................................................... 6 2.5 Path Delay Fault Model ........................................................................................ 7
3. ATPG METHODS ........................................................................................................ 8
3.1 DC Scan ................................................................................................................ 8 3.2 AC Scan ................................................................................................................ 9 3.3 AC Scan For Transition Faults - Shortcomings For SDD Detection ................. 12
4. TOP-OFF ATPG ......................................................................................................... 15
5. OPTIMIZING TEST PATTERN GENERATION ..................................................... 19
5.1 Hardware Test Compression .............................................................................. 19
5.2 Software Test Pattern Compression ................................................................... 21 5.3 Top-Off ATPG To Reduce Test Pattern Volume ............................................... 21
5.4 SDD ATPG ......................................................................................................... 25 5.5 SDD Top-Off ATPG .......................................................................................... 28 5.6 Fortuitous Detections in 1-Detect Transition Pattern Set ................................... 28
5.7 SDD Coverage Of Faults Based On Detections ................................................. 29
6. CONCLUSIONS AND FUTURE WORK ................................................................. 35
REFERENCES ................................................................................................................. 37

vi
LIST OF FIGURES
Figure 1. Stuck-at Fault. ..................................................................................................... 4
Figure 2. Transition Fault. .................................................................................................. 5
Figure 3. DC Scan. ............................................................................................................. 9
Figure 4. AC Scan using LOC. ........................................................................................ 10
Figure 5. AC Scan using LOS. ......................................................................................... 11
Figure 6. Slack and the Transition Fault Test. ................................................................. 13
Figure 7. Stuck-at Faults Screened by Transition Patterns. ............................................. 15
Figure 8. Top-Off ATPG Flow Chart............................................................................... 18
Figure 9. Hardware Test Compression. ............................................................................ 20
Figure 10. n-Detect Transition ATPG and SDD Coverage. ............................................. 27
Figure 11. Fortuitous Detections of the Faults in the 1-Detect Transition Pattern Set. ... 29
Figure 12. Number of Detects and SDD Coverage for Tool 1. ........................................ 30
Figure 13. Number of Detects and SDD Coverage for Tool 2. ........................................ 33
Page

vii
LIST OF TABLES
Table 1. Results of the Top-Off ATPG methodology explained in Section 4. The values correspond to hardware compression bypassed mode. .......................... 22
Table 2. Traditional ATPG pattern count and test coverage. The values correspond to hardware compression bypass mode. ............................................................... 23
Table 3. Top-Off ATPG results for the design in hardware compression mode.............. 24
Table 4. Traditional ATPG pattern count and coverage for the hardware compression mode. ................................................................................................................ 24
Table 5. Number of patterns for the two ATPG tools for different n-Detects. ................ 27
Table 6. SDD Top-Off ATPG results for the proposed methodology for Tool 1. ........... 31
Table 7. SDD Top-Off ATPG results for the proposed methodology on ATPG Tool 2. 34
Page
1
1. INTRODUCTION
Design for test (DFT) plays a vital role in the successful manufacture and
shipment of defect free VLSI circuits. As technology nodes continue to push towards
smaller feature sizes on chips, the size of circuits that can be accommodated on the
silicon wafer have increased significantly [1][2][3][4][5]. This challenges the designers
to come up with methodologies to test the digital circuits while addressing automated
test equipment (ATE) memory constraints [3]. Typically all of the test patterns needed
to test a chip design must fit into the ATE memory. If the pattern volume exceeds the
tester memory, then we must re-load the tester memory with the remaining patterns
while testing each chip, which will result in a large increase in test time and cost of the
chip. This situation is clearly not desirable in today’s competitive market.
The smaller feature sizes of today’s technology nodes give rise to Deep Sub
Micron (DSM) effects [1][2]. The result is that DFT engineers now need to address not
only the traditional static defects, but also dynamic defects in the chip. A dynamic
defect is the one that will cause the speed of the chip to be different than expected. Test
patterns are shifted in and applied at relatively slow speed (known as DC scan) to screen
out parts with static defects. AC scan or delay test is used to screen out parts with
dynamic defects. Delay test plays a pivotal role in screening out the parts that fail to
work at the specified and expected clock frequencies. The most popular dynamic defect
model used today is the transition fault (TF) model. In a transition fault, the state of a
logic node is slow to rise from a logic zero to a logic one, or fall from a logic one to a

2
logic zero [1]. It has been shown that the transition fault model was good enough to
catch most dynamic defects, but today DSM effects have mandated the use of another
fault model, called the Small Delay Defect (SDD) model [4]. SDD defects are small
enough to escape capture by traditional transition delay fault test but are large enough to
cause circuit failure. The cost of failures increases tenfold after each stage of testing
starting from the wafer level, to package test, to system level test to field test, i.e. it is
much more expensive to catch a failure in the field than it is to catch a failure at the
wafer level [3]. It is thus desirable to catch as many defects as possible during wafer
test. This implies that there is a need to screen out SDDs at wafer level test. To do so
we need to include SDD test patterns in the production wafer test. At the same time we
must ensure that the total test pattern volume meets the stringent ATE memory limits.
In this thesis we explore the options to optimize test pattern generation using
Top-Off ATPG methodologies. A novel technique to do SDD Top-Off ATPG is also
explored, which will result in an overall smaller test pattern volume while still having
reasonable defect coverage.

3
2. FAULT MODELING
A fault model is a logic level abstraction of the electrical behavior of a defect in
an integrated circuit [1][3]. Various fault models are used to identify the static and
dynamic defects in a circuit. The static defects are modeled by the stuck-at fault model
while for dynamic defects, the fault models that can be used include transition, path
delay, small delay defect, and dynamic bridging [3]. Typically a DFT engineer tries to
target stuck-at faults for static defects and transition faults for dynamic defects. The
terms DC scan for static defects and AC scan for dynamic defects is commonly used to
designate the scan methodologies for detecting these defects. The term scan is used
because the flip-flops and latches in a design are configured into shift registers for
scanning test patterns in and test results out of the chip.
2.1 Stuck-At Fault Model
A stuck-at fault model is one which results in a logic node constantly maintaining
a state without being affected by the surrounding state of the design. This means that a
node stuck-at-zero (SA0) will stay at logic value zero regardless of the state of the
surrounding nodes and a node stuck-at-one (SA1) would stay at logic value one
regardless of the state of the surrounding nodes. The stuck-at faults can arise due to
many reasons. If a node is shorted to the ground (GND) rail of the chip, it results in a
SA0 fault, while is the node is shorted to the VCC rail of the chip, a SA1 fault results.
Figure 1 shows the effect of a stuck-at fault on a circuit.

4
Figure 1. Stuck-at Fault.
Figure 1 shows the node which has been shorted to ground having a permanent
stuck 0 on it. This stuck-at-0 will result in the output stuck-at -1 regardless of the inputs.
2.2 Transition Fault Model
A transition fault is used to model dynamic defects in a chip. If a node fails to
change its state within the stipulated amount of time then we say that there is a transition
fault at that node. The transition can be from a logic 0 to 1 (slow-to-rise transition fault)
or from a logic 1 to 0 (slow-to-fall transition fault). A transition fault is assumed to be
large enough that it is detected on any propagation path through the fault site. Transition
faults can occur for various reasons: inconsistent wire length, on chip process variation,
change in doping, resistive short or resistive open [3]. Transition fault test generation is
well developed in the industrial ATPG tools, building on top of stuck-at test
Gnd
0
X
X
X
X
X
1
5
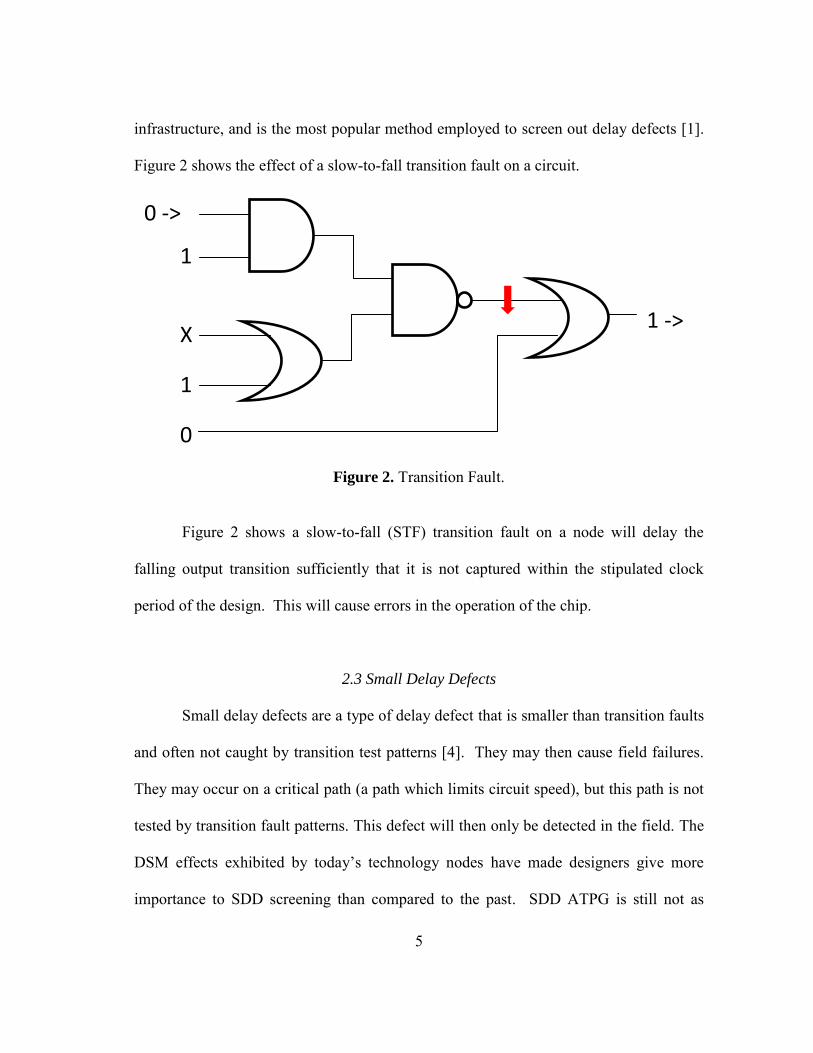
infrastructure, and is the most popular method employed to screen out delay defects [1].
Figure 2 shows the effect of a slow-to-fall transition fault on a circuit.
Figure 2. Transition Fault.
Figure 2 shows a slow-to-fall (STF) transition fault on a node will delay the
falling output transition sufficiently that it is not captured within the stipulated clock
period of the design. This will cause errors in the operation of the chip.
2.3 Small Delay Defects
Small delay defects are a type of delay defect that is smaller than transition faults
and often not caught by transition test patterns [4]. They may then cause field failures.
They may occur on a critical path (a path which limits circuit speed), but this path is not
tested by transition fault patterns. This defect will then only be detected in the field. The
DSM effects exhibited by today’s technology nodes have made designers give more
importance to SDD screening than compared to the past. SDD ATPG is still not as
1
0 -> 1
X
1
0
1 -> ?
6
developed as transition fault ATPG and is very expensive in terms of test generation
CPU time and pattern volume. There is a need to come up with better ways to target
these SDD faults without inflating the pattern count to impractical levels.
2.4 User Defined Fault Model
The User Defined Fault Model (UDFM) is an option provided by commercial
ATPG tool vendors for users to define the tests that they want to apply at the boundary
of logic cells [6][7]. Each design firm uses their own preferred cells and the cell internal
structures are not standard throughout the industry. The cell internals are modeled at the
gate level by the ATPG tool. Faults on this internal model can be targeted by the ATPG
tools. However, the internal model does not necessarily match the internal physical
structure of the cell, and this internal structure may be different for different cells
implementing the same function, and so having the same model. As a result, testing the
internal model may miss defects on the cell internal structure. To effectively target the
cell internal defects, the commercial ATPG tools have the option for the user to
designate tests that they want to apply to the cell boundary. These tests are described by
the UDFM. The ATPG tool reads in a UDFM file, which guides the tool to apply the
right tests at the boundary of the cell, thereby targeting cell internal defects. The UDFM
files are generated in a preprocessing step by the cell library developers, using circuit
simulation to accurately model cell behavior in the presence of defects, such as resistive
shorts or opens. The UDFM ATPG can target either static or dynamic defects, using the

7
existing stuck-at fault and transition fault ATPG infrastructure. UDFM test is also called
Cell Aware ATPG [7].
2.5 Path Delay Fault Model
The path delay fault model, like the transition fault model, is used to model
dynamic defects in a chip [8][9]. Unlike the transition fault model, which tries to catch a
dynamic defect at a node, a path delay fault catches the dynamic defect on a path in the
chip. Transition fault ATPG is much faster than path delay ATPG, and builds on stuck-
at fault ATPG. The path delay fault ATPG requires a separate infrastructure to
incorporate timing information. Path delay fault ATPG is fundamentally more difficult
than transition fault test, since it is targeting the longest paths, rather than any path
through a fault site. Due to the high path delay fault test generation time, transition fault
model is the primary delay test used today, with path delay test limited to the longest
paths in the design.

8
3. ATPG METHODS
The common terms used to designate the ATPG methodologies are DC scan for
detecting static defects and AC scan for detecting dynamic defects.
3.1 DC Scan
DC scan involves loading the scan chains with a test pattern to bring the circuit
nodes to designated values. Then once the scan enable goes low, returning the flip-flops
to functional operation, a capture pulse is employed to capture the response of the circuit
in the flip-flops. These values can then be scanned out while the next test pattern is
scanned in. In this way, the DC scan tests ensure that the circuit is free of static defects
and all the nodes in the circuit can be brought to the required static states for each test.
DC scan is used to apply stuck-at fault tests or low-speed stuck-at-open or bridge fault
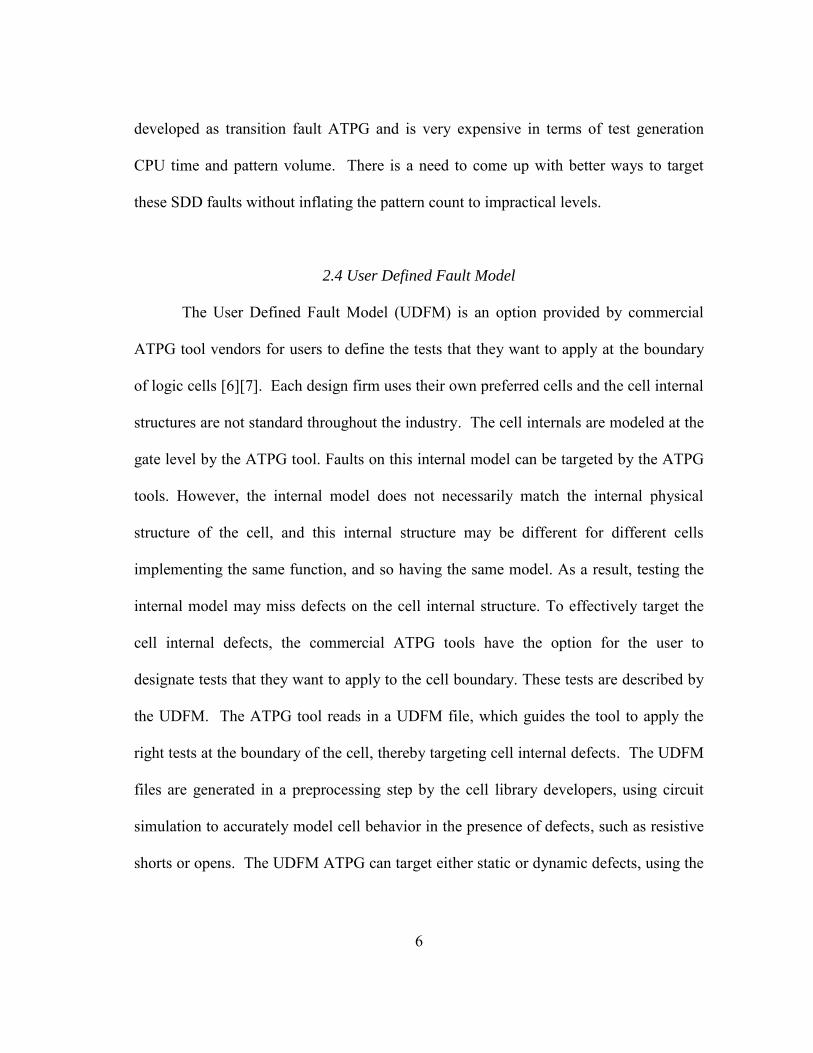
tests. Figure 3 shows the sequence of signal transitions done for DC scan.
9
Figure 3. DC Scan.
Figure 3 shows the DC Scan test where a clock pulse is used to capture the state
of the design. DC scan is used for static defects since only the state of the design can be
captured, i.e. if all the output nodes are at their required logic values for the particular
test.
3.2 AC Scan
AC scan is used to detect any dynamic defects in the circuit. The AC scan ensure
that transitions are able to propagate to the required nodes within the specified amount of
time. If they are late, then there is a dynamic defect in the chip and the chip will not
function at the rated clock frequency. The two popular AC scan methodologies are
Launch On Shift (LOS) and Launch On Capture (LOC).
clk
SE
1 capture pulse
scan mode scan mode capture mode

10
3.2.1 Launch On Capture (LOC)
In LOC, the scan chains are first loaded with the test pattern that initializes the
design to launch the required transitions. Once the initialization is done, then two at-
speed clock pulses are applied to the design. The first pulse launches the input
transitions to the circuit and the second pulse captures the output transitions at the flip-
flops. The captured result can then be scanned out to determine if any dynamic defects
are present in the design. Figure 4 shows the LOC scan waveforms. The two at-speed
capture pulses happen in the functional/capture mode of the design with the scan enable
(SE) low. In LOC the functional path is used to generate the transitions.
Figure 4. AC Scan using LOC.
Figure 4 shows the AC Scan using LOC where two capture pulses are used, the
first one launches transitions into the circuit and the second pulse captures the output
transitions. If the output transitions do not make it to the target flip-flops in time, then a
clk
SE
scan mode scan mode capture mode
2 capture pulses

11
defect has been detected, which causes the circuit to operate at lower than its rated
speed.
3.2.2 Launch On Shift (LOS)
In LOS, the last shift cycle is used to launch the transitions into the circuit. Once
the transitions have been launched, an at-speed capture pulse is used to capture the
response of the design. The result is then scanned out to determine if there are any
dynamic defects present in the chip. In this case only one capture pulse is used in the
functional/capture mode of the design with the scan enable (SE) set to 0. Figure 5 shows
the functional waveforms of the LOS scan. LOS uses the shift path to generate the
transition.
Figure 5. AC Scan using LOS.
Figure 5 shows the AC scan using LOS. Here to launch the transitions the last
shift pulse of the clock is used. After applying the launch pulse the scan enable (SE) is
clk
SE
scan mode scan mode capture mode
1 capture pulse

12
set low and the design comes in the functional/capture mode. The effect of the input
transitions is then captured by an at-speed capture pulse. If the transitions failed to reach
the target flip-flops before the at-speed capture pulse then we can say that the design is
not working at the rated frequency and the AC patterns have failed.
In LOS, the first launch pulse comes in the scan mode of the design. This gives
the ATPG tool total control over all the scan flops in the design. LOS test is therefore
usually easy to generate. In contrast, LOC tests require one sequential test cycle, and so
require more CPU time to generate. In general, LOS tests can target more fault sites than
LOC tests, although these extra sites are functionally-redundant.
The scan enable signal has to go to all the scan flops in the design. This leads to
a heavy capacitive load on this signal, similar to the global clock. The LOS tests require
the scan enable to transition at speed, which involves overhead of routing, power, and
extra design effort to compensate for the heavy load on the scan enable signal. In LOC
the scan enable need not transition at speed, which means timing goals are easier to meet
for LOC, and the extra design effort required by LOS is not needed. For this reason,
LOC test is used for most high-speed designs.
3.3 AC Scan For Transition Faults - Shortcomings For SDD Detection
Transition fault ATPG is the preferred method used by designers to detect
dynamic defects since it is fast and effective. Transition fault test generation is well
developed in the commercial ATPG tools. However, transition fault ATPG is inefficient
when it comes to screening out Small Delay Defects [4]. A transition fault test involves

13
launching and capturing the transition at the rated speed of the circuit. The rated speed
of the circuit is determined by the slowest paths in the circuit, which means many paths
in the circuit have a certain amount of timing slack in them, and the transition fault
ATPG may propagate the test along one of these shorter paths. If an SDD was present at
the target fault site, but was smaller than the timing slack of the chosen path, then it
would escape detection. In order to ensure detection, the longest path through the SDD
fault site must be tested. Figure 6 explains the effect of slack on the transition fault test
path and the SDD fault escape.
Figure 6. Slack and the Transition Fault Test.
Figure 6 explains the relationship between the slack and Transition Fault Test. In
this example, the slow-to-fall transition fault can be targeted by three different paths A,

14
B and C. The transitions arrive time at the capture flop will depend on the length of the
target path. Path A has the highest slack and thus the greatest chance that if there was a
SDD present, then the delay caused by the SDD would not be enough to cause a failure.
Path C is the longest path with minimal slack and least probability of letting a SDD
escape.
Another reason transition fault ATPG is not suitable for SDD screening is that
the Transition fault ATPG algorithm will try and find the easiest/fastest solution to
launching a transition at a node. It cannot be guaranteed that the path chosen by the tool
will be the longest or the most optimal. So if a node can be targeted by multiple paths,
transition fault ATPG will try and target it through a short path, which results in larger
slack on the path, resulting in poor SDD screening.
Commercial ATPG tools today are now able to target SDD faults through
specific algorithms which ensure that the transition faults are targeted through long paths
and thus the chances of SDD faults escaping due to slack on the paths is reduced. This is
called Timing Aware ATPG [9]. The SDD (Timing Aware) ATPG is quite expensive in
terms of CPU time and pattern volume [4]. There is a need to come up with ways to do
SDD ATPG without increasing the pattern count to impractical levels.

15
4. TOP-OFF ATPG
As explained in Section 3.3, AC scan for transition faults will try to launch a
transition at the targeted node and then capture the resulting output transition. This
means that the node goes through a transition of 1 to 0 for a slow-to-fall transition fault.
If there happened to be a stuck-at-0 fault on that node, then the transition would fail to
occur (Figure 7).
Figure 7. Stuck-at Faults Screened by Transition Patterns.
Figure 7 demonstrates the effect of Stuck-at faults on Transition patterns. The
presence of the stuck-at fault on the path of the transition path will prevent the transition
from occurring at the target node. This will cause the transition pattern to fail and detect
the presence of the stuck-at fault.
This means that transition test patterns will fortuitously screen some stuck-at
faults. If we identify the stuck-at faults that are screened by transition test patterns, then
1
0 -> 1
X
1
0
1 -> 1
Gnd
0

16
we need not generate test patterns for these stuck-at faults. To identify the stuck-at
faults detected by transition fault patterns, we need to fault simulate the transition test
patterns against the stuck-at fault list, get the list of stuck-at faults covered and then
generate stuck-at test patterns for the faults that are not covered by the sransition test
patterns. These stuck-at test patterns are called “top-off” test patterns and this
methodology is called Top-Off ATPG.
Top-Off ATPG is very useful in the industrial production scenario where the goal
is to ensure that the chip is working properly. We are not concerned about how or where
the failure is in the design, we just want to make a quick “go/no go” decision on the
manufactured part. In order to determine the location of a defect in a chip, we need to
generate and apply a complete diagnostic test pattern set. This specialized exhaustive
test pattern set will try and target the faults through different paths and then narrow
down on the cause of the failure by analyzing the failing test patterns. Diagnostic tests
are only applied to a small subset of chips, due to its high cost.
Top-Off ATPG can be extended to other fault models in addition to stuck-at and
transition faults. Transition fault patterns target faults on cell boundaries, with no
knowledge of cell internals. Since the cell internals depend on the particular cell library
and technology being used, the transition fault tests may not detect all internal defects.
Static and dynamic UDFM test patterns guarantee application of the cell boundary
conditions that detect static and dynamic cell internal faults.
Dynamic UDFM patterns try to apply user-defined transitions at the cell
boundaries and propagate the results to a scan cell. As was the case with transition

17
patterns, any static defects that suppress the transitions will cause these patterns to fail.
Moreover, a transition fault in the circuit may also cause the dynamic UDFM test to fail,
if it causes a late arrival of the output transition. If we determine the transition and
stuck-at faults that are defected by the UDFM patterns, then we need not separately
generate patterns for these faults. We can do Top-Off ATPG of transition and stuck-at
patterns on top of the base dynamic UDFM pattern set.
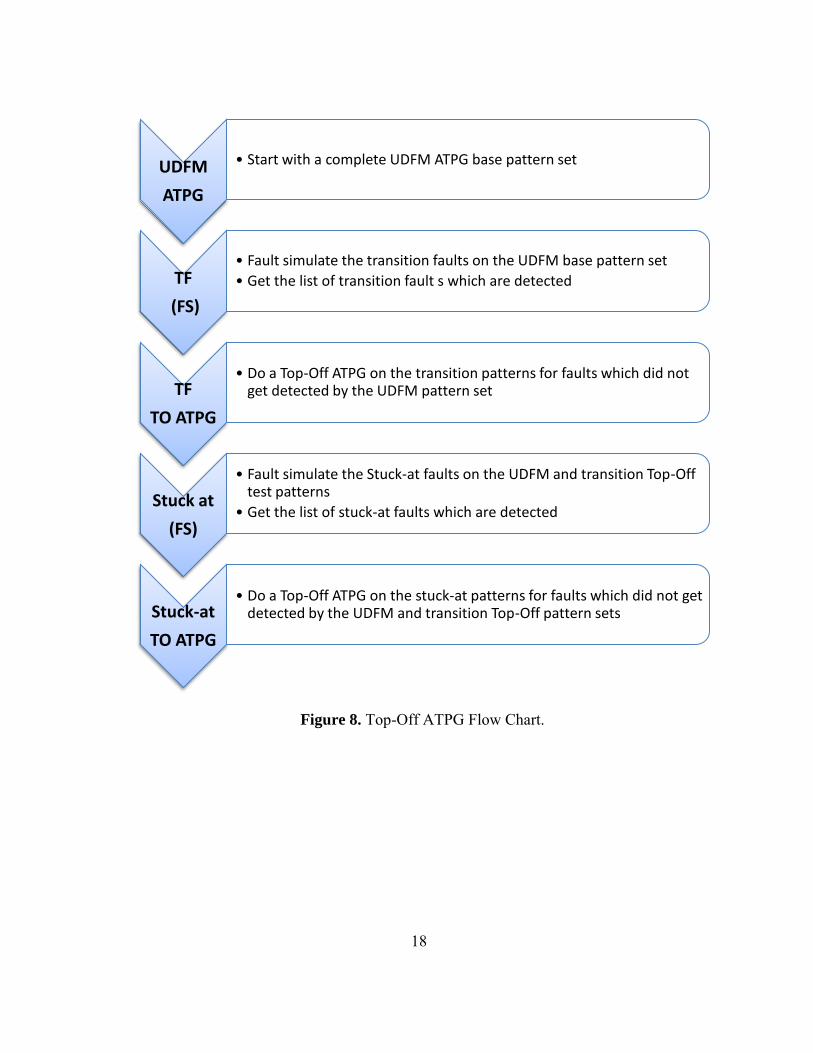
The overall Top-Off ATPG flow is shown in Figure 8. We start off with a base
pattern set targeting dynamic UDFM faults. Then we do top-off ATPG of transition
patterns on this base pattern set followed by top-off ttuck-at ATPG on both of these
UDFM and transition pattern sets.
Figure 8 explains the proposed Top-Off ATPG methodology. We start with a
dynamic UDFM pattern set and generate Top-Off transition patterns followed by Top-
Off stuck-at patterns. Fault simulation is done to determine the faults that are screened
by the previous pattern sets. All of these steps can be performed by commercial ATPG
tools.
18
Figure 8. Top-Off ATPG Flow Chart.
UDFM
ATPG
• Start with a complete UDFM ATPG base pattern set
TF
(FS)
• Fault simulate the transition faults on the UDFM base pattern set
• Get the list of transition fault s which are detected
TF
TO ATPG
• Do a Top-Off ATPG on the transition patterns for faults which did not get detected by the UDFM pattern set
Stuck at
(FS)
• Fault simulate the Stuck-at faults on the UDFM and transition Top-Off test patterns
• Get the list of stuck-at faults which are detected
Stuck-at
TO ATPG
• Do a Top-Off ATPG on the stuck-at patterns for faults which did not get detected by the UDFM and transition Top-Off pattern sets

19
5. OPTIMIZING TEST PATTERN GENERATION
ATPG is an expensive process in terms of both CPU time and the pattern
volume. Today designers must make sure that the patterns are generated in the most
optimal manner (both in terms of CPU time and pattern volume) while ensuring the
exacting fault screening standards are met. Since pattern volume is directly related to
test time, it is desirable to reduce the pattern volume to the minimum in order to
minimize test cost. Pattern compression solutions are use to reduce the pattern volume.
Test pattern compression solutions are available both in hardware and software form.
5.1 Hardware Test Compression
Test compressions solutions are available from ATPG vendors that can be
integrated in the design to reduce test time. The hardware test compression solutions use
multiple parallel short scan chain stumps connected to a limited number of scan inputs
and outputs [10]. The decompression/compression logic is present at the start/end of the
scan stumps (Figure 9). The decompression logic fans out the data from the input scan
chains to the internal scan stumps. The compression logic compresses the data back into
the scan outputs from the internal scan chains. The use of shorter scan chains reduces
the scan shift time of the design by orders of magnitude, and thus reduces test time. The
reason that the scan patterns can be compressed is because the care bit density i.e. the
number of bits that are required to test the targeted faults in the pattern is usually low
compared to the “don’t care” bits. This way the decompression logic is able to fan out

20
the data to the multiple internal scan stumps and the ATPG tool ensures that the non-
conflicting patterns are packed together to reduce the test time.
Figure 9. Hardware Test Compression.
Figure 9 explains the layout of the Hardware Test compression scheme. The
shaded area represents the chip boundary. An “n” bit scan port connects the tester to the
compression logic. The scan in from the tester goes to the decompression logic which
fans out the data to “k” internal scan chains. The internal scan chains then get
“compressed” again into an n-bit scan output port. In the hardware compression bypass
mode, the compression logic is re-configured to connect the “k” internal scan chains in
“n” long bypass chains. The scan shift time is reduced by a factor of around k/n in case
of a balanced scan compression scheme.
Scan in [0:n] Scan out [0:n]
internal scan stumps [0:k]

21
5.2 Software Test Pattern Compression
Since the care bit density of the test patterns is low, it is possible to pack multiple
non-conflicting tests together into one single test pattern. This is done by the ATPG tool
and is a means of software test compression [11]. This is also known as test compaction.
Typically the first test patterns can contain tests for many thousands of faults, and later
patterns can still test for tens or hundreds of harder-to-detect faults.
5.3 Top-Off ATPG To Reduce Test Pattern Volume
The use of software and hardware test compression results in a smaller test
pattern set for the individual fault models. Top-Off ATPG can be employed to reduce
the overall pattern volume for the different fault models being targeted. As explained in
Section 4, in our analysis we started off with a base pattern set of dynamic UDFM faults,
followed by a Top-Off of transition test patterns and a final Top-Off of the stuck-at test
patterns on these two pattern sets. These experiments were run on a portion of an
industrial microprocessor design, comprising approximately 1.1M cells. This is a large
design with enough architectural diversity to increase confidence that these experiments
reflect the results that should be expected from similar designs.

22
Table 1. Results of the Top-Off ATPG methodology explained in Section 4. The values correspond to hardware compression bypassed mode.
Mode Patterns CPU Time (s)
Test Coverage
(%) UDFM 1250 3373 91.18
Transition FS 27.8 95.74 Transition TO 560 104.1 98.24
Stuck FS 6.75 99.41 Stuck TO 97 92.56 99.55
Total 1907 3604.21
In Table 1, the results of the Top-Off methodology explained earlier are
displayed. The design used here is in hardware compression bypass mode, so there are
no input constraints. The compression places constraints on the ATPG. The second row
corresponds to the base UDFM pattern set. The coverage listed is for the UDFM fault
model. The next row corresponds to the fault simulation (FS) of transition faults on the
base UDFM pattern set. Fault simulation is much faster than ATPG. The UDFM patterns
screen 95.74% of the transition faults. The next row corresponds to the transition Top-
Off (TO) ATPG run. The coverage for transition faults jumps with the Top-Off ATPG.
The next row corresponds to the fault simulation of stuck-at faults against the UDFM
and transition Top-Off pattern sets. 99.41% of the stuck-at faults are already screened
by the UDFM and transition Top-Off pattern sets. This is to be expected, since the
requirements to detect UDFM and transition faults are more extensive than stuck-at
faults. The next row corresponds to the stuck-at Top-Off ATPG. The last 0.14% in
stuck-at coverage is recovered by the Top-Off ATPG, using 97 additional patterns. The
last row corresponds to the total pattern count and CPU time for the entire process.

23
To get an idea of how the Top-Off ATPG fares against traditional ATPG, Table 2
collates the results of targeting each fault model separately.
Table 2. Traditional ATPG pattern count and test coverage. The values correspond to
hardware compression bypass mode.
Mode Patterns CPU Time (s)
Test Coverage
(%) UDFM 1250 3373 91.18
Transition 1282 332 98.07 Stuck 347 437 99.59 Total 2879 4142
In Table 2, the three rows correspond to the individual ATPG runs for the three
fault models. The last row is the sum of all the test pattern volume and the CPU time.
By comparing Tables 1 and 2, it can be deduced that the Top-Off ATPG methodology
results in 34% fewer total patterns and takes 13% less CPU time. The final transition
fault coverage is higher for Top-Off ATPG while the final stuck-at coverage is slightly
lower for Top-Off ATPG. These coverage variations are expected, since the ATPG
algorithms are not complete – they will give up on some faults, even though a test may
exist, and some of these faults may be fortuitously detected during fault simulation.
The same experiments when done with hardware compression bypassed,
eliminating the compression constraints. Table 3 shows the corresponding results for
Top-Off ATPG and Table 4 shows the results for traditional ATPG.

24
Table 3. Top-Off ATPG results for the design in hardware compression mode.
Mode Patterns CPU Time (s)
Test Coverage
(%) UDFM 2015 4098.9 92.91
Transition FS 45.7 95.20 Transition TO 991 126.5 97.86
Stuck FS 11 99.11 Stuck TO 157 124.7 99.20
Total 3163 4406.8
The number of patterns is higher in hardware compression mode due to the input
constraints, but since the pattern lengths are smaller, the overall pattern volume is much
less than the hardware compression bypassed mode. The fault coverage is higher for
UDFM but lower for transition and stuck-at faults. As discussed above, this variation is
normal. The results also indicate that the hardware compression in this design leaves
enough flexibility to the ATPG to generate tests for most faults.
Table 4. Traditional ATPG pattern count and coverage for the hardware compression mode.
Mode Patterns CPU Time (s)
Test Coverage
(%) UDFM 2015 4098.9 92.91
Transition 2073 467.6 97.97 Stuck 744 462.4 99.47 Total 4832 5028.6
The overall pattern reduction for Top-Off ATPG in the hardware compression
case is 34.5% while the total CPU time is reduced by 12.4%. The benefit of Top-Off

25
ATPG is easy to see from these experiments. It should be noted that since the Top-Off
ATPG is a sequential process where we have to first generate the UDFM base patterns,
followed by transition and then stuck-at Top-Off. In traditional ATPG we can do all the
steps in parallel. The CPU time reduction should therefore be more carefully analyzed.
If all the runs are executed in parallel, then the traditional ATPG will finish faster than
the Top-Off ATPG, but the overall CPU time used by the methodology would be less for
Top-Off ATPG.
5.4 SDD ATPG
SDD ATPG is expensive in terms of CPU time and pattern volume. EDA
vendors are constantly trying to come up with new methods of optimizing SDD ATPG
in terms of both the pattern volume and the CPU time. The methodologies being
explored include long path delay test, which ensure that the faults are targeted at the
longest paths. Targeting faults through the longest paths ensures that the slack on the
given path is minimum, which results in better SDD screening
[12][13][14][15][16][17][18].
Since SDD ATPG takes a lot more time compared to transition fault ATPG and
both the ATPGs are basically AC scan, experiments have been done to show how we
can use transition fault ATPG to generate patterns which have high SDD fault screening
capability. One such approach has been the use of n-detect transition fault ATPG. The
use of n-detect guarantees that the same fault is targeted at least n times in the pattern
set. Commercial ATPG tools do not guarantee that the fault will be targeted on different

26
paths but with higher n-detect the chances of the fault being detected on different paths
and with different local excitation conditions increases. This means that there is a
greater chance that the transition fault will be detected through a longer path than the
optimal path chosen by basic transition fault ATPG (Figure 6). The detection through
longer paths reduces the slack on the target node, thus improving SDD detection.
In our experiments we generated different n-detect transition fault test patterns
and computed their SDD coverage using two commercial tools. We used an industrial
design with around 970K cells. Paths longer than 90% of the clock cycle time were
targeted for the SDD ATPG. The SDD coverage in both tools points is computed as the
proportion of fault sites that are tested by the longest path through that fault site. An
SDD coverage of 100% would imply that all the transition faults targeted are being
tested through the longest possible paths. These settings were held consistent throughout
the experiments.
Figure 10 shows the plot of SDD coverage for the different n-detect transition
fault test (TFT) pattern sets. We can see that there is a general trend of increasing SDD
coverage with the increase in the value of n. The specific SDD ATPG patterns have
greater SDD coverage than the 1-Detect transition pattern set. The SDD coverage in all
cases is low, however we do not know if this is due to the ATPG algorithms, the
presence of false paths, or other reason that would prevent testing on the longest paths.

27
Figure 10. n-Detect Transition ATPG and SDD Coverage.
The Figure 10 collates the result for two commercial ATPG tools. An increase in
n increases the SDD coverage for both tools.
Table 5 shows the number of patterns for each of the pattern sets listed in Figure
10. The pattern volume increases significantly with an increase in n, particularly for
Tool 1. Clearly n-detect is not a viable option for effectively screening SDDs.
Table 5. Number of patterns for the two ATPG tools for different n-Detects.
Pattern Set Tool 1 Tool 2 TF 1-Detect 2856 2011 TF 3-Detect 25027 2758 TF 5-Detect 41179 4104 TF 7-Detect 56736 5380
SDD 1693 2293
30
32.5
35
37.5
40
42.5
45
47.5
50
TFT n-Detect 1 TFT n-Detect 3 TFT n-Detect 5 TFT n-Detect 7 SDD
SDD
Co
vera
ge
Tool 1
Tool 2

28
5.5 SDD Top-Off ATPG
There is no direct method to do SDD Top-Off ATPG. Efforts of doing an
indirect SDD Top-Off ATPG have been shown where the fault list is trimmed based on
the slack available on the fault path [19][20][21]. This method requires post processing
the fault list and is based on the fact that the SDD pattern volume will reduce if the
number of faults to be targeted is reduced.
5.6 Fortuitous Detections in 1-Detect Transition Pattern Set
Even in a 1-Detect transition pattern set there will be multiple fortuitous
detections of many faults. These are purely fortuitous detections that result due to the
location of the fault and are not intended by the tool. Figure 11 shows the plot of the
number of faults vs. their detections in a 1-Detect transition pattern set on the 970K cell
design.
Figure 11 demonstrates that the number of faults with high number of detects
falls with an increase in the number of detects. Many faults with more than 20 detects
were observed in the 1-Detect Transition pattern set.

29
Figure 11. Fortuitous Detections of the Faults in the 1-Detect Transition Pattern Set.
The number of faults that get detected multiple number of times steadily
decreases with the increase in the number of detections for those faults. It was observed
that 10.3% of all faults were detected 200 or more times, which is an indicator even in a
1-Detect transition fault test set, many faults can have a large number of detections. Such
sites are likely to have high fortuitous detect coverage.
5.7 SDD Coverage Of Faults Based On Detections
In Section 5.4 we explored the relationship of the n-detect ATPG with the SDD
coverage. It was observed that the increase in n-etect increases the SDD coverage of the
pattern set. We also know that there are faults which get detected multiple times in the
1-Detect transition pattern set. There should be a difference in the SDD coverage of
these faults based on the number of detects. To evaluate this, we segregated the faults
1000
10000
100000
1000000
0 10 20 30 40 50 60 70 80 90 100 110 120 130
Nu
mb
er o
f Fa
ult
s
Number of Detects
30
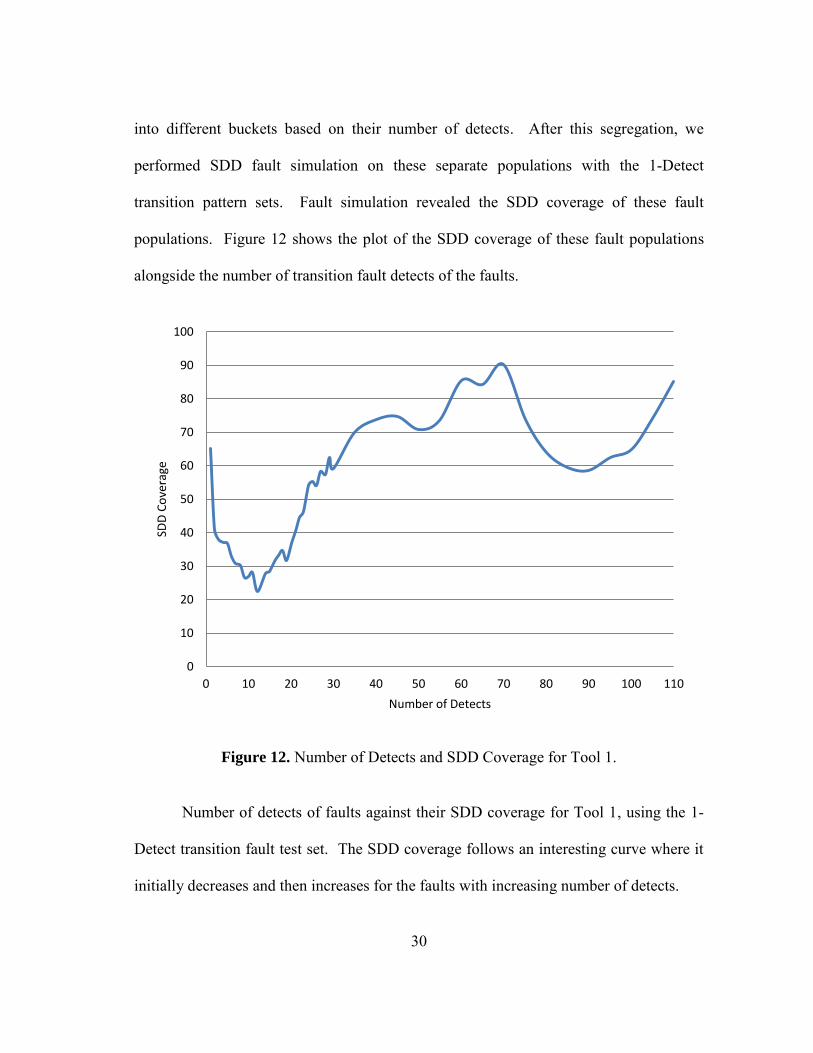
into different buckets based on their number of detects. After this segregation, we
performed SDD fault simulation on these separate populations with the 1-Detect
transition pattern sets. Fault simulation revealed the SDD coverage of these fault
populations. Figure 12 shows the plot of the SDD coverage of these fault populations
alongside the number of transition fault detects of the faults.
Figure 12. Number of Detects and SDD Coverage for Tool 1.
Number of detects of faults against their SDD coverage for Tool 1, using the 1-
Detect transition fault test set. The SDD coverage follows an interesting curve where it
initially decreases and then increases for the faults with increasing number of detects.
0
10
20
30
40
50
60
70
80
90
100
0 10 20 30 40 50 60 70 80 90 100 110
SDD
Co
vera
ge
Number of Detects

31
Figure 12 shows that the 1-Detect transition fault test set achieves good SDD
coverage for most fault buckets. However, the high detect buckets comprise a relatively
small fraction of the faults, as shown in Figure 11. In order to increase overall SDD
coverage, we need to perform SDD ATPG for faults in buckets with low SDD coverage.
Since this is only a subset of all faults, the SDD ATPG will take less CPU time and
produce fewer patterns than SDD ATPG on the entire fault population.
Our proposed SDD Top-Off ATPG methodology is based on the above
assumption that the test pattern count is dependent on the number of faults that are being
targeted.
In our experiments we targeted the SDD ATPG for the faults with the number of
detects from 2 to 25. This corresponds to faults with less than 50% SDD coverage.
Table 6 shows the results of this exercise where we do SDD ATPG for a selective fault
population.
Table 6. SDD Top-Off ATPG results for the proposed methodology for Tool 1.
Pattern Set Patterns SDD Coverage TF 1-Detect 2856 36.80
SDD 1693 38.64 SDD TO 736 34.09
TF + SDD 4549 38.67 TF + SDD TO 3592 37.87
In Table 6, the first data row corresponds to the transition 1-Detect transition
fault pattern set. The second row corresponds to the SDD pattern set targeting all fault
sites. The third row shows the results of the SDD Top-Off (targeting selective fault
population). The SDD coverage is lower than the complete SDD test since only a subset

32
of faults is targeted. The fourth row shows the base 1-Detect transition fault plus the
complete SDD pattern sets combined coverage and the number of patterns. The SDD
coverage is higher than SDD patterns alone due to fortuitous detections. The fifth row
shows the 1-Detect transition fault pattern set plus the SDD Top-Off patterns combined
SDD coverage and the total number of patterns. It can be seen that the Top-Off
methodology produces an SDD pattern set which is 56.5% smaller than the complete
SDD pattern set. The combined coverage for SDD Top-Off and transition faults patterns
is acceptably close to the combined coverage of complete SDD and transition fault
patterns.
It is interesting to note that in Figure 9 the SDD coverage for faults that get
detected only once is around 65% and then it drops off before increasing again. The
faults that get detected only once are possibly a result of targeted fault detection instead
of fortuitous detections. If a fault is detected only once, then quite possibly it can be
detected only through one path. If there is no other path through which it can be
detected, then the single path through which it is detected is the longest path and thus
these faults will have 100% SDD coverage.
The SDD coverage graph experiences dip in SDD coverage at faults with 85 to
90 detections. There are 3000 faults in this bucket. This is a relatively small number
and most of these faults lie in a particular module of the design. It may be that this
module of the design has some design characteristic that prevents it from attaining good
SDD coverage with the ATPG algorithms.

33
We repeated the same experiment using Tool 2. The SDD coverage vs. the
number of fault detects is shown in Figure 13. The pattern is quite different than Tool 1.
The coverage starts lower and then gradually rises, without the large dip. It also has a dip
around 85 detects. Overall, the coverage in any one high-detect bucket is not as high as
Tool 1, but there is not the dip in fewer-detect, but more fault buckets, which leads to
higher overall SDD coverage, as shown in Figure 10.
Figure 13. Number of Detects and SDD Coverage for Tool 2.
SDD coverage against the number of fault detects for Tool 2. Here the initially
high SDD coverage for faults with two detects as observed for Tool 1 is not observed.
The SDD coverage increases until 30 detect, and then experiences a dip at around 85
detects.
20
30
40
50
60
70
80
0 20 40 60 80 100
SDD
Co
vera
ge
Number of Detects

34
We selected the range of 1 to 30 detects for SDD Top-Off ATPG. We chose this
range since the SDD coverage levels off above 30 detects. The results of Top-Off ATPG
for Tool 2 are presented in Table 7.
Table 7. SDD Top-Off ATPG results for the proposed methodology on ATPG Tool 2.
Pattern Set Patterns SDD Coverage ATPG Time (s) TF 1-Detect 2011 46.66 7494
SDD 2293 49.38 10322 SDD TO 1797 43.48 3556
TF + SDD 4304 49.39 17816 TF + SDD TO 3808 48.37 11050
The SDD Top-Off pattern set is 21.63% smaller than the complete SDD pattern
set. The total 1-Detect transition fault plus SDD Top-Off patterns are 11.52% smaller
than the 1-Detect transition fault and complete SDD pattern set. The SDD coverage of
the complete pattern sets is acceptably close to the complete SDD pattern set.
In Tool 2 the SDD coverage steadily increases until 30 detects and then remains
constant until it droops at around the number of detects of 85. This droop in SDD
coverage was also observed in Tool 1. This consistency does point to a design specific
feature which results in these particular faults to have a low SDD coverage.

35
6. CONCLUSIONS AND FUTURE WORK
Design for Test is important in ensuring that the manufactured VLSI chips are
free of defects. The test patterns applied to the design directly result in test cost which
contributes towards the total cost of the chip. It is required in this competitive world to
keep the test cost as low as possible. Reducing the test patterns directly reduces the test
time and consequently the test cost.
Test pattern reduction can be done by pattern compaction schemes which are
available both in hardware and software form. To reduce the overall pattern count Top-
Off ATPG proves beneficial. We explored the Top-Off ATPG experiments on industrial
designs for the common production fault models. Results of Top-Off ATPG on UDFM,
transition and stuck-at faults showed that the total pattern count can be reduced by
approximately 33% for both hardware compressed and bypassed scan configurations.
SDD ATPG is important in the prevalent technology nodes where the small
feature sizes result in DSM effects to interfere with the operation of the circuit. SDD or
timing aware transition fault ATPG results in a high pattern count. There is no direct
way to do Top-Off ATPG for SDD faults. In this thesis we explored the relationship
between the n-detect transition fault patterns and their SDD coverage. This relationship
coupled with the observation of fortuitous multiple detections of faults in the 1-Detect
transition fault pattern set helped us propose a novel SDD Top-Off ATPG methodology.
The SDD Top-Off methodology proposed in this work helped reduce the SDD
test pattern set by around 56% with a loss in overall SDD coverage of only 1%. The

36
methodology was demonstrated on two commercial tools that have quite different SDD
and n-detect transition fault test generation behaviors.
Top-Off ATPG is a very useful technique to reduce the overall test pattern
volume and can help in reducing the total cost of the VLSI circuits. It was shown that
Top-Off ATPG can be done for the cell aware and timing aware ATPG methodologies
as well with exciting results.
In an ideal environment the Top-Off ATPG should produce equal, if not better,
test coverage than the traditional ATPG. This was observed for the direct Top-Off
ATPG experiments for the UDFM, Transition and Stuck-at patterns but the SDD Top-
Off patterns showed a slight decrease in the SDD coverage. One observation which
might explain the decrease in SDD coverage is that for both the ATPG tools we did not
include the faults around 85 detects, which had low SDD coverage. In the future it
would be interesting to experiment with different criteria to select the fault buckets on
which to do SDD Top-Off ATPG. Perhaps inclusion of the low SDD coverage fault
buckets (faults with 85 detects in our example) might improve the SDD coverage of the
Top-Off SDD patterns and the difference between the Top-Off SDD test coverage and
the complete SDD coverage might reduce to zero.

37
REFERENCES
[1] Waicukauski, John A., et al. "Transition fault simulation." Design & Test of
Computers, IEEE 4.2 (1987): 32-38.
[2] Rusu, Stefan, et al. "Trends and challenges in VLSI technology scaling towards 100
nm." Design Automation Conference, 2002. Proceedings of ASP-DAC 2002. 7th
Asia and South Pacific and the 15th International Conference on VLSI Design.
Proceedings.. IEEE, 2002.
[3] Bushnell, Michael, and Vishwani Agrawal. Essentials of electronic testing for
digital, memory, and mixed-signal VLSI circuits. Vol. 17. Springer, 2000.
[4] Devta-Prasanna, Narendra, et al. "Accurate measurement of small delay defect
coverage of test patterns." Test Conference, 2009. ITC 2009. International. IEEE,
2009.
[5] Yilmaz, Mahmut, Krishnendu Chakrabarty, and Mohammad Tehranipoor. "Test-
pattern grading and pattern selection for small-delay defects." VLSI Test
Symposium, 2008. VTS 2008. 26th IEEE. IEEE, 2008.
[6] Hapke, F., et al. "Defect-oriented cell-aware ATPG and fault simulation for
industrial cell libraries and designs." Test Conference, 2009. ITC 2009.
International. IEEE, 2009.
[7] Macemon, Dave, “User Defined Fault Models”, Mentor Graphics White Paper,
Sept 2011

38
[8] Malaiya, Yashwant K., and Ramesh Narayanaswamy. "Modeling and testing for
timing faults in synchronous sequential circuits." Design & Test of Computers,
IEEE 1.4 (1984): 62-74.
[9] Lin, Xijiang, et al. "Timing-aware ATPG for high quality at-speed testing of small
delay defects." Test Symposium, 2006. ATS'06. 15th Asian. IEEE, 2006.
[10] Galke, C., U. Gatzschmann, and H. T. Vierhaus. "Scan-Based SoC Test Using
Space/Time Pattern Compaction Schemes." Digital System Design: Architectures,
Methods and Tools, 2006. DSD 2006. 9th EUROMICRO Conference on. IEEE,
2006.
[11] Roy, Rabindra K., et al. "Compaction of ATPG-generated test sequences for
sequential circuits." Computer-Aided Design, 1988. ICCAD-88. Digest of Technical
Papers., IEEE International Conference on. IEEE, 1988.
[12] Goel, Sandeep Kumar, Narendra Devta-Prasanna, and Ritesh P. Turakhia.
"Effective and efficient test pattern generation for small delay defect." VLSI Test
Symposium, 2009. VTS'09. 27th IEEE. IEEE, 2009.
[13] Noguchi, Koichiro, et al. "A small-delay defect detection technique for dependable
LSIs." VLSI Circuits, 2008 IEEE Symposium on. IEEE, 2008.
[14] Chang, C-JJ, and T. Kobayashi. "Test Quality Improvement with Timing-aware
ATPG: Screening small delay defect case study." Test Conference, 2008. ITC 2008.
IEEE International. IEEE, 2008.
[15] Kajihara, Seiji, et al. "A framework of high-quality transition fault ATPG for scan
circuits." Test Conference, 2006. ITC'06. IEEE International. IEEE, 2006.

39
[16] Lin, Xijiang, et al. "Timing-aware ATPG for high quality at-speed testing of small
delay defects." Test Symposium, 2006. ATS'06. 15th Asian. IEEE, 2006.
[17] Ahmed, Nisar, Mohammad Tehranipoor, and Vinay Jayaram. "Timing-based delay
test for screening small delay defects." Proceedings of the 43rd annual Design
Automation Conference. ACM, 2006.
[18] Turakhia, Ritesh, et al. "Silicon evaluation of longest path avoidance testing for
small delay defects." Test Conference, 2007. ITC 2007. IEEE International. IEEE,
2007.
[19] Hapke, F., et al. "Defect-oriented cell-aware ATPG and fault simulation for
industrial cell libraries and designs." Test Conference, 2009. ITC 2009.
International. IEEE, 2009.
[20] Hapke, F., and J. Schloeffel. "Introduction to the defect-oriented cell-aware test
methodology for significant reduction of DPPM rates." Test Symposium (ETS),
2012 17th IEEE European. IEEE, 2012.
[21] Maxwell, Peter C., et al. "IDDQ and AC scan: The war against unmodelled
defects." Test Conference, 1996. Proceedings., International. IEEE, 1996.