opus.bath.ac.ukopus.bath.ac.uk/50865/1/paper_final_black.docx · web viewprocess intensification is...
TRANSCRIPT

SONO-PHOTO-DEGRADATION OF CARBAMAZEPINE IN A THIN FALLING FILM REACTOR: OPERATION COSTS IN PILOT PLANT
A.J. Expósito1, D.A.Patterson2, J.M. Monteagudo1, A. Durán*1
1Department of Chemical Engineering. ETSII. University of Castilla-La Mancha. Avda. Camilo José
Cela 3. 13071. Ciudad Real (Spain). Fax: 34 926295361. Phone: 34 926295300, ext: 3814. email:
[email protected] Department of Chemical Engineering and Centre for Sustainable Chemical Technologies,
University of Bath, Bath, United Kingdom, BA2 7AY. email: [email protected]
ABSTRACT
The photo-Fenton degradation of carbamazepine (CBZ) assisted with ultrasound
radiation (US/UV/H2O2/Fe) was tested in a lab thin film reactor allowing high TOC
removals (89% in 35 minutes). The synergism between the UV process and the
sonolytic one was quantified as 55.2%.
To test the applicability of this reactor for industrial purposes, the sono-photo-
degradation of CBZ was also tested in a thin film pilot plant reactor and compared with
a 28 L UV-C conventional pilot plant and with a solar Collector Parabolic Compound
(CPC). At a pilot plant scale, a US/UV/H2O2/Fe process reaching 60% of mineralization
would cost 2.1 and 3.8 €/m3 for the conventional and thin film plant respectively. The
use of ultrasound (US) produces an extra generation of hydroxyl radicals, thus
increasing the mineralization rate.
In the solar process, electric consumption accounts for a maximum of 33% of total
costs. Thus, for a TOC removal of 80%, the cost of this treatment is about 1.36 €/m 3.
However, the efficiency of the solar installation decreases in cloudy days and can not be
used during night, so that a limited flow rate can be treated.
Keywords: CPC, economics, pilot plant; radicals; ultrasound; UV
1
1
2
3
4
5
6789
10
11
12
13
14
15
16
17
18
19
20
21
22
23
24
25
26
27
28
29
30
31
32
33
12

1.INTRODUCTION
Process intensification is about providing a chemical process with the precise
environment required which results in better products, and processes which are safer,
cleaner, smaller and cheaper [1]. Some features include moving from batch to
continuous processing, using new emerging technologies (such as ultrasound) and use
of intensive reactor technologies with high mixing and heat transfer rates in place of
conventional stirred tanks [2, 3].
Regarding the first feature, homogeneous advanced oxidation processes (AOPs) have
been largely used to degrade refractory organic pollutants present in water [4-7].
Sonophotocatalysis (consisting of a combination of ultrasonic sound waves, ultraviolet
radiation and a catalyst) has recently emerged as an alternative water treatment method
[8-10] due to several advantages: lower doses of catalysts and reagents, no need for low
turbidity, etc. However, the use of high-frequency ultrasound demands high amounts of
energy, so that an economical study in needed to quantify its applicability in each
reactor type.
A previous research [11] showed the important contribution of •OH radicals during
degradation of carbamazepine under the US-UV-H2O2-Fe system. Under optimum
conditions, mineralization reached 93% in 35 minutes under batch conditions. The
authors also performed a study of the flow pattern inside the reactor, showing that
improvement in mineralization rate with US radiation could not be attributed to a
positive effect in mixing. Thus, the aim of this research is focussed on i) understanding
the effect of US radiation on the formation of hydroxyl radicals to improve
2
34
35
36
37
38
39
40
41
42
43
44
45
46
47
48
49
50
51
52
53
54
55
56
57
58
34

mineralization, ii) to perform mineralization tests at a pilot plant scale and iii) to analyze
the economic viability of the process
Regarding the use of new reactor technologies and in addition to conventional batch
reactors, in the last years several new type of reactors have been developed to remove
pollutants from water effluents including thin film reactors and collector parabolic
compound (CPC). Thin film reactors have a large heat and mass transfer area per unit
liquid volume that make them very efficient in industry. They have low contact time,
low pressure drop, and easy cleaning. The main inconvenience is that high flow rates
induce waves in the falling liquid and the film can be broken. To avoid this trouble, we
can use a smaller tube and ensure the perfect verticality of the tube. The flow in the
form of a thin film also favors heat exchange, obtaining larger coefficients [12], in case
that heating/cooling is necessary in the system. They are also useful when light
penetration is not good in a batch reactor. Unfortunately, they are usually less applied
for photochemical reactions.
On the other hand, solar photo-Fenton in a compound parabolic collector (CPC) reactor
is known to be one of the most environmentally benign and cost-effective systems for
wastewater treatment [13-15].
In this work, a simple experimental falling film pilot plant has been constructed, tested
and compared with a conventional artificial UV cylindrical reactor. Thus, results in the
thin film device have also been compared with those obtained in a solar CPC plant.
Carbamazepine (CBZ), a refractory pharmaceutical organic drug not degraded in
WWTP processes (removal efficiencies below 10%) has been treated as a model
3
59
60
61
62
63
64
65
66
67
68
69
70
71
72
73
74
75
76
77
78
79
80
81
82
83
56

pollutant and a previously optimized photo-Fenton process assisted with ultrasound
radiation (US/UV/H2O2/Fe) has been used as an intensified AOP. The sonophotolytic
degradation of organic compounds has already proved to be effective due to the
synergistic effect of the US and UV irradiation [16].
In order to determine the efficacy of the thin film reactor approach as a process
intensification technology for photocatalytic wastewater treatment, an economical
analysis has also been made. There are many studies using thin film reactors with TiO2
as a heterogeneous wastewater treatment [17-19]. However, to our knowledge no
studies have been made in homogeneous phase comparing technical and economical
efficiencies.
2.EXPERIMENTAL SET-UP
2.1. Laboratory scale device
The experimental set-up consists on two glass pipes bundled as a shell-and-tube heat
exchanger (inner diameter = 2.75cm; length = 28.3 cm). The CBZ solution flows in the
form of a thin film that runs down inside the inner tube where a Heraeus UV immersed
lamp TNN 15/32 is located. A pump is used to regulate the flow rate. A wider element
in the upper part of the column acts as an overflow system which is responsible for the
fluid falling as a film. The optical path lengths in this thin film reactor was obtained to
be 1.23 cm. Due to the small dimensions of the thin film, it is ensured that all the
radiation coming from the lamp is reaching the wastewater, enhancing the efficiency of
the reactor.
4
84
85
86
87
88
89
90
91
92
93
94
9596
97
98
99
100
101
102
103
104
105
106
107
108
78

2.2. Pilot plants
2.2.1. UV-Pilot Plant
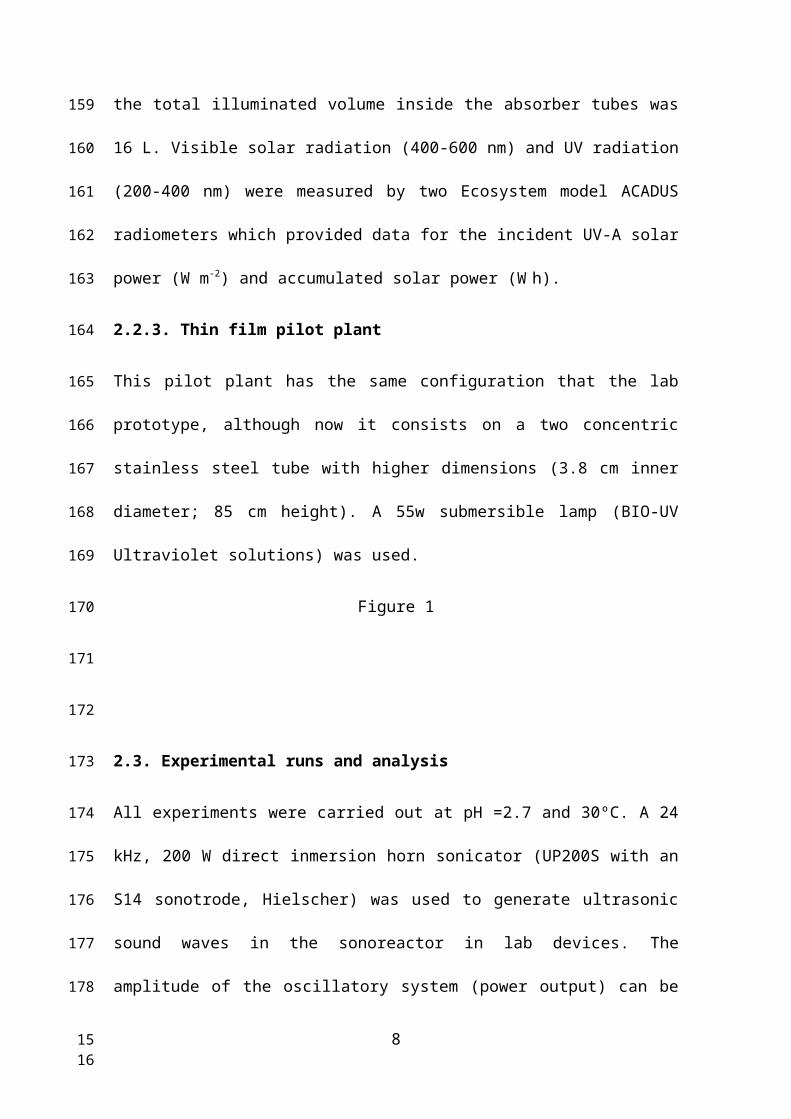
The UV pilot plant (FLUORACADUS-08/2.2) is shown in Figure 1 and is composed by
a 28 L reactor (2240mm x 730mm x 100mm), with four UV-C lamps (280–200 nm)
TUV_TL_D_55W_HO_SLV UV-C PHILIPS. The system is able to treat up to 1400
l/h. Temperature (up to 60ºC) is controlled by a digital Fuji PXR4TAY1-1Vcontroller.
2.2.2. CPC Pilot Plant
The CPC consisted of a tank (50 L), a centrifugal recirculation pump, a solar collector
unit with an area of 2 m2 (concentration factor = 1) in an aluminum frame mounted on a
fixed south-facing platform tilted 39º in Ciudad Real (Spain) with connecting tubing
and valves. The solar unit had 16 borosilicate glass tubes (OD 32 mm) and the total
illuminated volume inside the absorber tubes was 16 L. Visible solar radiation (400-600
nm) and UV radiation (200-400 nm) were measured by two Ecosystem model
ACADUS radiometers which provided data for the incident UV-A solar power (W m-2)
and accumulated solar power (W h).
2.2.3. Thin film pilot plant
This pilot plant has the same configuration that the lab prototype, although now it
consists on a two concentric stainless steel tube with higher dimensions (3.8 cm inner
diameter; 85 cm height). A 55w submersible lamp (BIO-UV Ultraviolet solutions) was
used.
Figure 1
5
109
110
111
112
113
114
115
116
117
118
119
120
121
122
123
124
125
126
127
128
129
130
131
910

2.3. Experimental runs and analysis
All experiments were carried out at pH =2.7 and 30ºC. A 24 kHz, 200 W direct
inmersion horn sonicator (UP200S with an S14 sonotrode, Hielscher) was used to
generate ultrasonic sound waves in the sonoreactor in lab devices. The amplitude of the
oscillatory system (power output) can be steplessly adjusted between 20% and 100%.
The pulse mode factor (cycles) can be continuously varied between 10% and 100%. The
set value equals the acoustic irradiation time in seconds, the difference to 1 s is the
pause time. Thus, a setting of 1 implies that it is continuously switched on, whereas a
setting of 0.6 means a power discharge of 0.6 s and a pause of 0.4 s. Amplitude and
pulse length (cycles) were maintained constant at 60% and 1, respectively according to
literature [11].
On the other hand, a UIP 1000HD230 (Hielscher) with a sound protection box was used
in pilot plants installations (see Figure S1 in supplementary material). The main
characteristics are: ultrasonic frequency of 20kHz, automatic frequency tuning system,
amplitude 25 micron adjustable from 50 to 100%, and dry running protected. The
dimensions of the transducer are (LxWxH) 435x110x71mm. The generator uses 230
Volts, AC, single phase, 8A, 50-60Hz.A sonotrode (BS2d34) titanium, tip diameter
34mm, length 125mm was used.
Figure S1
More details of reactor configurations and ultrasound power are shown in Table 1.
Initial concentration of carbamazepine (CBZ) in deionized water was 78.2 ppm (TOC =
55 ppm). The flow rate was 45 L/h in the thin film lab device, 1140 L/h in the
conventional and solar pilot plants and 150 L/h in the thin film plant.
Table 1
6
132
133
134
135
136
137
138
139
140
141
142
143
144
145
146
147
148
149
150
151
152
153
154
155
1112

CBZ (99%) was obtained from Acros. Analytical grade ferrous sulfate (FeSO4·7H2O),
and 30% w/v hydrogen peroxide (H2O2) were acquired from Merck. The pH of the
wastewater was adjusted with H2SO4 and NaOH solutions. Total organic carbon
concentration was determined using a TOC analyzer (Shimadzu TOC-5000A).
Quantification of hydroxyl radicals was carried out using disodium salt of terephthalic
acid (NaTA) [20]. NaTA (non-fluorescent) is known as an HO• scavenger; it reacts with
HO• to form 2-hydroxyterephthalic acid (HTA, fluorescent). The concentration of HTA
was determined by its fluorescence, which yield is proportional to the HO•
concentration in the solution in the excess of NaTA.
The HTA fluorescence yield was measured with an RF 6000 spectro-fluorophotometer
(Shimadzu). The excitation wavelength was set at 315 nm and the fluorescence spectra
of the solution were collected in the range of 320 nm - 500 nm. The peak intensity was
quantified for each solution at the emission wavelength of 425 nm using a previous
calibration.
3. RESULTS AND DISCUSSION
3.1. Study of UV, US and UV/US processes
Figure 2 shows degradation of CBZ under different processes (UV, US and UV/US) for
the lab falling film device. The values of the photolytic constant (kUV) were 0.0264 min-1
for CBZ degradation and 0.0019 min-1 for mineralization. The values of the sonolytic
constant (kUS) were 0.0044 min-1 for CBZ degradation and 0.002 min-1 for
mineralization. It was proved that hydrogen peroxide was either not formed under these
conditions or it was below detection limits.
Figure 2
7
156
157
158
159
160
161
162
163
164
165
166
167
168
169
170
171
172
173
174
175
176
177
178
179
1314
The synergism between the UV process and the sonolytic one can be quantified using
the pseudo first order degradation rate constants according to equation (1) [21]:
(1)
3.2. Determination of optimal operation conditions (US/UV/H2O2/Fe)
Figure 3a shows the results for CBZ degradation under different initial H2O2
concentrations for the system (US/UV/H2O2). CBZ was practically completely removed
in all the cases, except for at very low hydrogen peroxide concentration (5 ppm).
However TOC removal (Figure 3b) reached a maximum of 46% in 35 minutes when
using 20 ppm of H2O2. Results also showed that the CBZ degradation rate followed a
pseudo-first order rate (Figure 3c) with the pseudo-first order kinetic constant increasing
with the initial concentration of H2O2 from 0.002 to 0.168 min-1, since more radicals are
being formed due to photolysis of hydrogen peroxide:
H2O2 + h 2 OH (2)
Figure 3
According to literature [11] when the value of the initial concentration of hydrogen
peroxide is increased, HO• radicals may recombine or react according to the “well
known” scavenger effect, inhibiting the CBZ degradation rate. Thus, in order to
improve mineralization results,10 ppm of Fe(II) were added to the system. Then, the
mineralization degree increases up to 89% in 35 minutes via generation of extra radicals
according to the following reaction:
Fe (II) + H2O2 Fe(III) + OH + OH- (3)
The kinetic mineralization constant, as shown in Figure 3c, increases more than four
times, up to 0.075 min-1. Under these selected conditions, the whole study outlined next
was developed.
8
Synergy ( %)=kUV +US−(kUV +kUS )
kUV +USx 100= 0 . 0688−(0. 0264+0 .0044 )
0 .0688x 100=55 . 23
180
181
182
183
184
185
186
187
188
189
190
191
192
193
194
195
196
197
198
199
200
201
202
203
204
205
1516

3.3. Study of radicals
Monteagudo at al. [22] studied the sono-photo-Fenton degradation of reactive Blue-4,
showing the importance of the different mechanisms. Radical reaction was found to be
the main mineralization pathway (93.60%), being the contribution of ultrasonically
generated oxidative species to the overall mineralization very low (1.92%). Thus any
improvement in the use of US radiation must be related to the radicals involved in
mineralization.
The main reactions involved in the sono-photo-Fenton degradation are equations (2) to
(8) [23]:
(4)
(5)
(6)
(7)
(8)
where ))) denotes the ultrasonic waves, the subscript ))) denotes the products generated
by US and (·X) denotes all the possible intermediates leading to forming H2O2.
Figure 4 shows a study of the evolution of the concentration of CBZ and hydroxyl
radicals during reaction for different processes at lab scale including: H2O2, Fenton
(H2O2/Fe), photo-Fenton (UV/H2O2/Fe) and sono-photo-Fenton (US/UV/H2O2/Fe).
Hydrogen peroxide and Fenton system allow a low degradation of initial CBZ (6% and
22% respectively), correlated with the concentration of HO• radicals found in solution
(Figure 4b). As expected, the photo-Fenton process improves significantly the CBZ
9
H2 O )⃗))⋅OH )))+¿ H )))
CBZ+¿OH ))) k⃗ US Products+ H 2O
CBZ+hυ k⃗UV Products
2⋅OH )))(⋅X )⃗ H2O2
CBZ+¿OH ⃗ Products+H2O
206
207
208
209
210
211
212
213
214
215
216
217
218
219
220
221
222
223
224
225
226
227
228
229
230
1718

degradation due to generation of extra hydroxyl radicals via reaction (2). Finally, it can
be seen that the sono-photo-Fenton process is the fastest degradation process. The
amount of hydroxyl radicals is slightly higher at the beginning of reaction, favoring
CBZ degradation and later mineralization. This fact confirms that the radical reaction is
the main mineralization pathway.
Figure 4
3.3. Comparing pilot plant devices: economical study
At an industrial scale, high flowrates of effluents must be treated, so that pilot plant tests
are necessary to confirm the above preliminary results. To this end, three pilot plants
were selected: a) thin film, b) a 28 L reactor with four UV-C lamps working as two
concentric tubes in continuous mode and c) a solar compound parabolic collector (CPC)
plant with an area of 2 m2 in order to reduce costs coming from electricity.
Figure 5a shows the results for TOC degradation in both the UV classical pilot plant and
the thin film one. Reactor configurations are summarized in Table 1. 70 % of TOC is
removed in the thin film photo-reactor and 90% in the classical pilot plant after 2.5
hours. However, the classical UV plant uses a higher amount of energy, since four
lamps are being used. An economical approach is thus needed to evaluate the possible
application of a thin film device at an industrial scale.
Figure 5
To this end, prices of materials (reagents and catalyst) and electrical consumption of the
different devices used for calculation of costs are shown in Table 2, whereas Table 3
summarizes the amount of reagents and catalysts consumed in each processes.
Table 2, Table 3
10
231
232
233
234
235
236
237
238
239
240
241
242
243
244
245
246
247
248
249
250
251
252
253
254
1920

The whole economic analysis was carried out considering the mineralization process.
Figure 5b shows operation costs both for the thin film and the UV classical pilot plant in
terms of Euros per cubic meter of treated water. It is confirmed that costs increases
when high percentages of TOC removal are needed in both processes, and dramatically
increases for removals > 80%. Usually, a complete mineralization is not required and
advanced oxidation processes (AOPs) can be designed with the subsequent biological
treatment process that treats products from AOPs [24]. Thus, for a 60% of
mineralization, costs would raise to 2.1 and 3.8 €/m3 for the UV-classical and thin film
plant respectively. However, electricity costs account for the 70 % (thin film) and 50%
(classical device) of total cost (Figure 5c). In order to reduce electricity costs for their
possible use in an industrial application, the following new experiments were
performed:
a) due to the high power consumption cost of the US probe, new tests were made
with the former pilot plants under the photo-Fenton system (UV/H2O2/Fe)
without US radiation (for the case that operation time is not decisive; otherwise
the use of US is mandatory)
b) substitution of artificial UV radiation with solar energy. Thus, a solar CPC pilot
plant was used and compared with the previous results. In this case, oxalic acid
was added to the system (mole ratio Fe:(COOH)2 =3) to form ferrioxalates and
improve degradation rate due to generation of Fe(II) through a well-known
mechanism [8]. Moreover, the use of ferrioxalates implies that a higher portion
of the solar spectrum can be used.
When experiments without US are analyzed (Figure 6a), the time needed to reach the
same mineralization degree increases, as previously explained due to the reduction in
11
255
256
257
258
259
260
261
262
263
264
265
266
267
268
269
270
271
272
273
274
275
276
277
278
279
2122

hydroxyl radicals available for mineralization of CBZ. For example, for 70 % of TOC
removal, 5.5 hours are now needed in the thin film photo-reactor (~2.5
hours with US), whereas 95 min are employed in the UV conventional plant (40 min
with US). However, although the process in clearly faster with US and in the
conventional UV pilot plant, the cost study (Figure 6b) indicates that now the thin film
device is competitive compared to the UV conventional plant (please note that the thin
film plant has just one 55W lamp, whereas the conventional one uses four of them).
Costs around 2 €/m3 are obtained in both systems for a 50% of TOC removal.
Figure 6
Regarding the solar process, and in order to compare experiments over several days, it is
necessary to use a simple equation to normalize the data so that the time used in Figures
comes from the following correlation [25]:
(9)
where tn is the experimental time for each sample, UV is the average solar ultraviolet
radiation ( < 400 nm) measured between tn-1 and tn, and t30W is a normalized
illumination time that refers to a constant solar power of 30 Wm-2 (typical solar UV
radiation on a perfectly sunny day around noon). VT is the total reactor volume and Vi is
the total irradiated volume.
The solar process is definitively faster during the first 30 minutes as shown in Figure 6a
(70% of mineralization in 16 min). Then mineralization is slower because most of
hydrogen peroxide in solution has been consumed. Also costs per unit of volume of
water treated are considerably lower as seen in Figure 6b (around 1.3 €/m3 up to 80 %
of mineralization). This is due to the low electric consumption that in the CPC pilot
12
t 30W , n=t30 W , n−1+Δt nUV30
V i
V T; Δtn= tn−t n−1 ; t0=0 (n=1)
280
281
282
283
284
285
286
287
288
289
290
291
292
293
294
295
296
297
298
299
300
301
302
303
2324

plant accounts for 2-33% of total costs, whereas it varies from 60-90% in the thin film
device and from 5-61% in the conventional UV plant depending on the desired
mineralization degree (Figure 7).
Figure 7
However, the efficiency of the solar installation decreases in cloudy days and it cannot
be used during the night, so that a limited flow rate of effluent can be treated, unless a
mixed installation including artificial UV lamps is used.
Finally, Figure 8 shows that operation cost (€/g TOC removed) gradually decreases as
TOC removal is higher for the three pilot plants studied. In this way we fully benefit
from the reagents that are added in one go at the beginning of the process.
Figure 8
Note that this study intends to be an initial guide only. A bigger thin film plant should
be tested to confirm these preliminary results. For this reason, only operation costs have
been estimated; the investment cost, the salvage value, the estimated useful life,
depreciation expense for year and maintenance are not considered here.
Obviously, the concentration of pollutants reaching a Waste Water Treatment Plant
(WTTP) would be lower than the one treated here and the oxidation processes could be
used as a primary step before the biological process, so that very high mineralization
degrees would not be required. The operational costs obtained here could then be
decreased at an industrial scale and when taking into account all these considerations.
Also, the use of photovoltaic panels could decrease costs when using CPC devices [26].
4. CONCLUSIONS
13
304
305
306
307
308
309
310
311
312
313
314
315
316
317
318
319
320
321
322
323
324
325
326
327
328
2526

An important synergistic effect between sonolysis and UV irradiation of 55.2%
was quantified using the first order rate constants for carbamazepine
degradation.
At a pilot plant scale, a US/UV/H2O2/Fe process reaching 60% of mineralization
would cost 2.1 and 3.8 €/m3 for the conventional and thin film plant
respectively. The use of US makes the process faster, due to extra hydroxyl
radicals generated, but more expensive.
At a pilot plant scale under a UV/H2O2/Fe process, both the thin film device and
the UV conventional plant are comparable in terms of operational costs (~ 2
€/m3 for a 50% of TOC).
The solar process is faster and cheaper (around 1.3 €/m3 up to 80 % of
mineralization), since electric consumption accounts for a maximum of 33% of
total costs. However, the efficiency of the solar installation decreases in cloudy
days and cannot be used during the night, so that a mixed installation including
artificial UV lamps must be used if high flowrates have to be treated.
5. ACKNOWLEDGEMENTS
Financial support from MINECO (CTM2013-44317-R) is gratefully acknowledged.
5. REFERENCES
[1] (http://profmaster.blogspot.com.es/2011/03/process-intensification-1.html).
[2] I.A. Boiarkina, S. Norris, D.A. Patterson, The Case for the Photocatalytic Spinning
Disc Reactor as a Process Intensification Technology: Comparison to an Annular
Reactor for the Degradation of Methylene Blue, Chem. Eng. J. 225 (2013) 752–765
14
329
330
331
332
333
334
335
336
337
338
339
340
341
342
343
344
345
346
347
348
349
350
351
2728

[3] I.A. Boiarkina, S. Pedron, D.A. Patterson, An Experimental and Modelling
Investigation of the Effect of the Flow Regime on the Photocatalytic Degradation of
Methylene Blue on a Thin Film Coated Ultraviolet Irradiated Spinning Disc Reactor.
Appl. Catal. B: Environ. 110, (2011) 14-24.
[4] M.A. Oturan, J.J. Aaron, Advanced Oxidation Processes in Water/Wastewater
Treatment: Principles and Applications. A Review, Crit. Rev. Env. Sci. Tech., 44 (2014)
2577-2641
[5] L. G. Covinich, D. I. Bengoechea, R. J. Fenoglio, M.C. Area. Advanced Oxidation
Processes for Wastewater Treatment in the Pulp and Paper Industry: A Review, Am. J.
Environ. Eng. 4 (2014) 56-70.
[6] I. Oller, S. Malato, J.A. Sánchez-Pérez, Combination of Advanced Oxidation
Processes and biological treatments for wastewater decontamination-A review. Sci.
Total Environ. 409(20) (2011) 4141-4166.
[7] D. Hermosilla, N. Merayo, A. Gascó, A. Blanco, The application of advanced
oxidation technologies to the treatment of effluents from the pulp and paper industry: a
review. Environ. Sci. Poll. Res Int. 22 (2015) 168-191.
[8] W.H. Song, T. Teshiba, K. Rein, K.E. O’Shea, Ultrasonically induced degradation
and detoxification of microcystin-LR (cyanobacterial toxin), Environ. Sci. Technol. 39
(2005) 6300-6305.
[9] C.G. Joseph, G. Li Puma, A. Bono, Y.H. Taufiq-Yap, D. Krishnaiah, Operating
parameters and synergistic effects of combining ultrasound and ultraviolet irradiation in
the degradation of 2,4,6-trichlorophenol, Desalination 276 (2011) 303-309.
[10] A. Durán, J.M. Monteagudo, I. Sanmartín, P. Gómez, Homogeneous
sonophotolysis of food processing industry wastewater: Study of synergistic effects,
mineralization and toxicity removal, Ultrason. Sonochem. 20 (2013) 785-791.
15
352
353
354
355
356
357
358
359
360
361
362
363
364
365
366
367
368
369
370
371
372
373
374
375
376
2930

[11] A. Durán, J.M. Monteagudo, A.J. Expósito, V. Monsalve, Modelling the
sonophoto-degradation/mineralization of in press carbamazepine in aqueous solution,
Chem. Eng. J. (2015) 284, 503-512.
[12] C. Moraga, M. Carmona, A. Durán Assembly of a Thin-Falling-Film Exchanger
for Laboratory Demonstrations: Calculation of the Individual Heat-Transfer Coefficient,
Chem. Educator, 6 (2001) 15–20.
[13] M. Jiménez, I. Oller, M.I. Maldonado, S. Malato, A. Hernández-Ramírez, A.
Zapata, J.M. Peralta-Hernández, Solar photo-Fenton degradation of herbicides partially
dissolved in water, Catal. Today 161 (2011) 214-220.
[14] A.G. Trovó, T.F.S. Silva, O. Gomes, A.E.H. Machado, W.B. Neto, P.S. Muller, D.
Daniel, Degradation of caffeine by photo-Fenton process: Optimization of treatment
conditions using experimental design, Chemosphere 90 (2) (2013) 170-175
[15] T. Velegraki, D. Mantzavinos, Solar photo-Fenton treatment of winery effluents in
a pilot photocatalytic reactor, Catal. Today 240 (2015) 153-159
[16] L.J. Xu, W. Chu, N. Graham, Sonophotolytic degradation of dimethyl phthalate
without catalyst: Analysis of the synergistic effect and modeling, Water Res., 47 (2013)
1996.
[17] O.M. Alfano, D. Bahnemann, A.E. Cassano, R. Dillert, R. Goslich, Photocatalysis
in water environments using artificial and solar light, Catalysis Today 58 (2000) 199–
230.
[18] G. Li Puma, P. L. Yueb, Modelling and design of thin-film slurry photocatalytic
reactors for water purification, Chem. Eng. Sci. 58 (2003) 2269-2281.
[19] G. Li Puma, Modeling of thin-film slurry photocatalytic reactors affected by
radiation scattering, Environ. Sci. & Technol. 37 (2013) 5783-5791.
16
377
378
379
380
381
382
383
384
385
386
387
388
389
390
391
392
393
394
395
396
397
398
399
400
3132

[20] M. Saran, K.H. Summer, Assaying for hydroxyl radicals: hydroxylated
terephthalate is a superior fluorescene marker than hydroxylated benzoate. Free Rad
Res. 31(5) (1999) 429-436.
[21] C.G. Joseph, G. Li Puma, A. Bono, Y.H. Taufiq-Yap, D. Krishnaiah, Operating
parameters and synergistic effects of combining ultrasound and ultraviolet irradiation in
the degradation of 2,4,6-trichlorophenol, Desalination 276 (2011) 303-309.
[22] J. M. Monteagudo, A. Durán, I. Sanmartín, S. García. Ultrasound-assisted
homogeneous photocatalytic degradation of RB4 in aqueous solution. Appl. Catal. B:
Environ., 152-163 (20141) 59-67.
[23] L.J. Xu, W. Chu, N. Graham, Sonophotolytic degradation of dimethyl phthalate
without catalyst: Analysis of the synergistic effect and modeling, Wat. Res., 47 (2013)
1996-2004.
[24] K. J. Howe, D.W. Hand, J.C. Crittenden, R. Rhodes-Trussell, G. Tchobanoglous
Principles of Water Treatment. (2012). Ed. Wiley.
[25] N. Klamerth, L. Rizzo, S. Malato, M.I. Maldonado, A. Agüera, A.R. Fernández-
Alba, Degradation of fifteen emerging contaminants at g L-1 initial concentrations by
mild solar photo-Fenton in MWTP effluents, Wat. Res. 44 (2010) 545-554.
[26] A. Durán, J.M. Monteagudo, I. Sanmartín, A. Valverde, Solar photodegradation of
antipyrine in a synthetic WWTP effluent in a semi-industrial installation, Sol. Ener.
Mat. Sol. C., 125 (2014) 215-222.
17
401
402
403
404
405
406
407
408
409
410
411
412
413
414
415
416
417
418
419
420
421
422
423
424
425
3334

FIGURE CAPTIONS
Figure 1. Pilot plant devices. a) Thin film (units in mm); b) conventional UV reactor; c)
Solar CPC .
Figure 2. Synergic effect of UV and US on CBZ degradation at the lab thin film device.
a) Degradation of CBZ. b) Calculation of kinetic constants
Figure 3. Experiments under US/UV/H2O2 and US/UV/H2O2/Fe systems. a) Evolution
of CBZ degradtion; b) evolution of TOC degradation; c) Fitting of pseudo first-order
mineralization constants
18
426
427
428
429
430
431
432
433
434
435
436
437
438
439
440
441
442
443
444
445
446
447
448
449
450
3536

Figure 4. Formation of hydroxyl radicals under different processes. (Conditions: [H2O2]
= 20 ppm; [Fe(II)] = 10 ppm). a) CBZ degradation; b) Evolution of hydroxyl radicals.
Figure 5. Comparison of different pilot plants for the US/UV/H2O2/Fe process. a) TOC
decrease; b) Operation costs per m3 of treated water vs mineralization degree; c) Main
component of costs in each process for a 60 % of mineralization.
Figure 6. Comparison of different pilot plants for the UV/H2O2/Fe process. a) TOC
decrease; b) Operation costs per m3 of treated water vs mineralization degree.
Figure 7. Operational costs (reagents and electricity) vs TOC removal. a) Thin film; b)
Conventional UV pilot plant; c) Solar CPC. (Process: UV/H2O2/Fe)
Figure 8. Operation costs per g of TOC removed for each process as a function
mineralization degree for pilot plants. (Process: UV/H2O2/Fe)
19
451
452
453
454
455
456
457
458
459
460
461
462
463
464
3738

Table 1. Reactor configurations and mineralization results.
REACTOR Volume (l)
Nominal UV
power (W)
Measured UV power
(W)
US
(W)
Mineralization degree (%) and time needed
(min)
Laboratory deviceThin film 0.43 15 23.2 168.5 90.0 35
Pilot plant devices with USConventional UV Pilot plant
33 55×4 208.4 387.8 87.0 120
Thin film 55 51.8 71.6 150Pilot plant devices without US
Solar CPC
33
-- --
--
80.6 25.9Conventional UV Pilot plant
55×4 208.4 76.7 120
Thin film 55 51.8 77.2 360
20
465466467
468469470471472473
3940

Table 2. Electric power and prices of electricity and reagents
21
ELECTRIC POWER
UV Pilot plant*Lamps 0.208 kWPump 0.050 kWpH-meter 0.006 kWSonotrode 0.387 kW
Solar CPC pilot plant*
Pump 0.050 kW
pH-meter 0.006 kW
Thin Film pilot plant*
Pump 0.050 kW
Lamp 0.0518 kW
pH-meter 0.006 kW
Sonotrode 0.387 kW
ENERGY PRICE (industrial rate) [UNESA, 2011]
0,09122 €/kWh
REAGENTS PRICES
Hydrogen peroxide 0,445 €/LIron (II) sulphate 0,75 €/kgOxalic acid 2,6 €/kgSulphuric acid 0,183 €/L
* consumption of some components like signal transformers has not been estimated due to its low value
474475476
478479480481482483484485486
4142

Table 3. Amount of reagents consumed in each pilot plant
Conventional UV
Solar CPC Thin film
Volume of water treated (L) 33 33 33
H2O2 (L) 0.075 0.075 0.075
FeSO4 (II) (g) 1.64 1.64 1.64
H2C2O4 (g) - - 1.38
H2SO4 (L) 0.013 0.012 0.011
22
487488489490
491492493494495496497498499500501502503504505506507508509510511512513514515516517518519520521522523524525526
4344

a)
b)
c)
FIGURE 1
23
Water tank (33 L)
radiometers
pH-meter
Temperature
Recirculation pump
O2 sensor
CPC Reactor
pouring
sampling
Water tank
Solar radiation
CBZ
H2O2
Fe(II)
(COOH)2
527
528
529
530
531
532
533
534
535
536
537
538
539
540
541
542
543
544
545
546
547
548
549
550
551552
4546

a)
b)
FIGURE 2
24
kUV= 0,0264
kUS= 0,0044
kUV+US = 0,0688
-3
-2,5
-2
-1,5
-1
-0,5
0
0 10 20 30 40
ln [C
BZ]/
[CBZ
] 0
Time (min)
UVUSUV+US
0
20
40
60
80
100
0 10 20 30 40
[CBZ
], pp
m
Time (min)
UVUSUV+US
553554555556557558559560561562563564565566567568569570571572573574575576577578579580581582583584585586587588589590591592
593
594
595
596
597
4748

a)
b)
c)
FIGURE 3
25
0
10
20
30
40
50
60
70
80
90
0 10 20 30 40
CBZ,
mg/
L
Time (min)
5 ppm H2O2
10 ppm H2O2
15 ppm H2O2
20 ppm H2O2
H2O2 /Fe (20/10)
0
10
20
30
40
50
60
0 10 20 30 40
TOC,
mg/
L
Time (min)
5 ppm H2O210 ppm H2O215 ppm H2O220 ppm H2O2H2O2 /Fe (20/10)
kmin = 0.002
kmin = 0.0067
kmin = 0.0095
kmin = 0.0168
kmin = 0.0751-1,4
-1,2
-1
-0,8
-0,6
-0,4
-0,2
00 10 20 30 40 50 60
ln (T
OC/
TOC
0)
Time (min)
5 ppm H2O210 ppm H2O215 ppm H2O220 ppm H2O2H2O2 /Fe (20/10)
598599600601602
603604605606607608609610611612613614615616617618619620621622623624625626627628629630631632633634635636637638639640641642643644645646
4950

a)
b)
FIGURE 4
26
0
0,2
0,4
0,6
0,8
1
0 10 20 30
[CBZ
]/[C
BZ] 0
Time, min
H2O2
Fenton
Photo-Fenton
Sono-photo-Fenton
0
2000
4000
6000
8000
10000
0 10 20 30
[HO
•],
nmol
/L
Time, min
H2O2 Fenton
Photo-Fenton Sono-photo-Fenton
647648649650651652653654655656657658659660661662663664665666667668669670671672673674675676677678679680681682683684685686687688689690691692693694695696
5152

a)
b)
c)
FIGURE 5
27
0
1
2
3
4
5
Thin film UV Pilot plant
€/m
3
Pilot plant
Reagnts
Electricity
0
1
2
3
4
5
6
0 20 40 60 80 100
€/m
3
Mineralization degree, %
Thin film PP
Conventional UV PP
0
0,2
0,4
0,6
0,8
1
0 50 100 150 200
TOC/
TOC
0
Time (min)
Thin film
Conventional UV
697698699700701702703704705706707708709710711712713714715716717718719720721722723724725726727728729730731732733734735736737738739740741742743744745746
5354

a)
b)
FIGURE 6
28
0
0,2
0,4
0,6
0,8
1
0 100 200 300 400
TOC/
TOC
0
Time (min)
Thin Film
Conventional UV PP
Solar CPC
0
1
2
3
4
0 20 40 60 80 100
€/m
3
Mineralization degree, %
Thin FilmConventional UV PPSolar CPC
747748749750751752753754755756757758759760761762763764765766767768769770771772773774775776777778779780781782783784785786787788789790791792793794795796
5556

a)
b)
c)
FIGURE 7
29
0
0,5
1
1,5
2
2,5
3
0,0 28,3 38,3 54,9 69,7 80,3 81,2 82,5
€/m
3
Mineralization degre, %
ReagentsElectricity
Solar CPC
0
0,5
1
1,5
2
2,5
3
0,0 3,2 8,0 17,2 36,0 53,8 65,9 79,7
€/m
3
Mineralization degree, %
Reagents
Electricity
Thin film
0
0,5
1
1,5
2
2,5
3
0,0 0,9 5,0 16,1 30,5 62,9 72,0 76,2
€/m
3
Mineralization degree, %
ReagentsElectricity
Conventional UV
797798799800801802803804805806807808809810811812813814815816817818819820821822823824825826827828829830831832833834835836837838839840841842843844845846
5758

FIGURE 8
30
0
1
2
3
4
5
6
0 20 40 60 80 100
€/g
TOC
rem
oved
Mineralization degree , %
Thin filmConventional UVSolar CPC
847848849850851852853854855856857858859860861862863864865866867868869870871872873874875876877878879880881882883884885886887888889890891
5960