oracle quantitative management and reporting for … · oracle quantitative management and...
TRANSCRIPT
Oracle Quantitative Management and Reporting for Solvency II
Administration / User Guide – 2.0.0 Page 1
Oracle Quantitative Management and Reporting for Solvency II
Administration / User Guide
Release 2.0.0
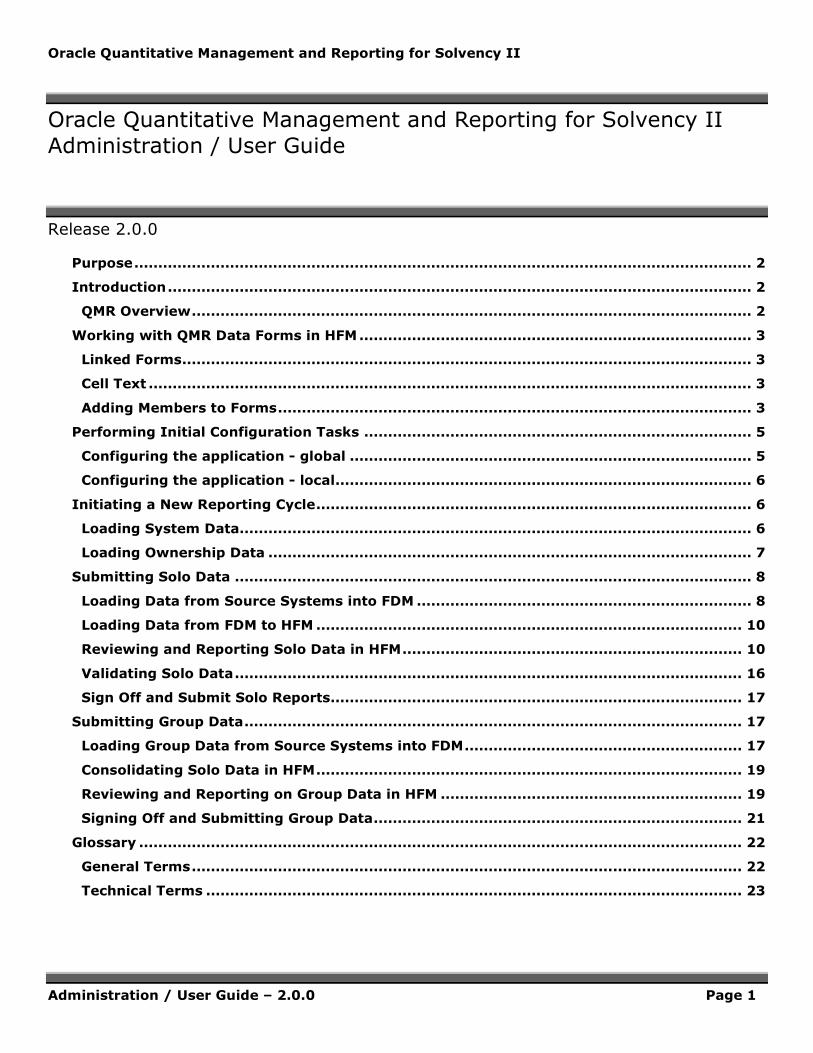
Purpose ................................................................................................................................. 2
Introduction .......................................................................................................................... 2
QMR Overview ..................................................................................................................... 2
Working with QMR Data Forms in HFM .................................................................................. 3
Linked Forms ....................................................................................................................... 3
Cell Text .............................................................................................................................. 3
Adding Members to Forms ................................................................................................... 3
Performing Initial Configuration Tasks ................................................................................. 5
Configuring the application - global .................................................................................... 5
Configuring the application - local ....................................................................................... 6
Initiating a New Reporting Cycle ........................................................................................... 6
Loading System Data........................................................................................................... 6
Loading Ownership Data ..................................................................................................... 7
Submitting Solo Data ............................................................................................................ 8
Loading Data from Source Systems into FDM ...................................................................... 8
Loading Data from FDM to HFM ......................................................................................... 10
Reviewing and Reporting Solo Data in HFM ....................................................................... 10
Validating Solo Data .......................................................................................................... 16
Sign Off and Submit Solo Reports...................................................................................... 17
Submitting Group Data ........................................................................................................ 17
Loading Group Data from Source Systems into FDM .......................................................... 17
Consolidating Solo Data in HFM ......................................................................................... 19
Reviewing and Reporting on Group Data in HFM ............................................................... 19
Signing Off and Submitting Group Data ............................................................................. 21
Glossary .............................................................................................................................. 22
General Terms ................................................................................................................... 22
Technical Terms ................................................................................................................ 23
Oracle Quantitative Management and Reporting for Solvency II
Administration / User Guide – 2.0.0 Page 2
Purpose
This guide is designed for users within an insurer who will access the Oracle Insurance Quantitative
Management and Reporting for Solvency II (QMR) to:
• enter QRT data for transmission to corporate/head office
• consolidate, aggregate and validate risk and capital data and generate QRT reports (Corporate
users)
• create this new application and provide access to users (system administrators)
This guide assumes that users are already familiar with the structure and usage of the Oracle Financial
Close Suite and focuses on how to implement the QMR application. Please refer to the relevant
sections of the Financial Close Suite User's Guides for further information.
Introduction
QMR Overview
The Oracle Insurance Quantitative Management and Reporting for Solvency II (QMR) application is
designed to provide a starting point for a new implementation of Hyperion Financial Management
(HFM).
The current version of the QMR application is designed to produce a validated set of Quarterly
Reporting Template (QRT) report as required by the European Insurance and Occupational Pensions
Authority (EIOPA) for both group and solo reporting. The application provides the capability for users
across the organization to enter QRT source data and submit to group who can then review,
consolidate and aggregate.
The current version of the QMR application is based on the November and December Quantitative
Reporting Template (QRT) consultation packs. At the time at which this version of QMR was released,
EIOPA had not yet completely finalized the content of the QRT reports. The Variance Analysis
templates in particular are expected to change and have not been included in QMR 2.0.0.
Oracle Quantitative Management and Reporting for Solvency II
Administration / User Guide – 2.0.0 Page 3
Working with QMR Data Forms in HFM
You use data forms to review and enter data into the QMR system in Hyperion Financial Management
(HFM). Data Forms enable you to enter data for predefined views, such as specific periods and
accounts. The forms support nested columns and rows for multidimensional analysis, and enable you
to drill into further detail. In, QMR the data forms are organized by category into folders within HFM.
For example, the data forms for Solvency Capital Requirements data are located in the 14_SCR folder.
Linked Forms
Several data forms have links to other data forms that provide a more specific data entry view. When
you access a linked form, the point of view (POV) from the parent form is carried forward into the
linked form. You do not need to specify the POV for the linked forms.
Linked forms are indicated by this icon: .
To access linked forms:
1. Select a row that contains linked forms.
2. Right-click a cell and select Linked Form. The linked form is opened in a separate window.
3. When you are finished using the linked form, you can close the window to return to the original
form.
Many of the linked forms contain additional links to more specific data entry views. You access these
forms in the same way. Each linked form is opened in a separate window.
Cell Text
Cell text provides additional information about the data within a cell. For example, you can use cell
text to get more information about a validation error in a data form. You can also view the basis for a
calculated value by viewing the cell text for that value.
Cell text is indicated by a blue triangle in the corner of the cell.
To view cell text:
1. Locate a cell with a blue triangle in the corner.
2. Right-click the cell, and select Cell Text.
3. Click the Expand button to view the full cell text.
Adding Members to Forms
In some cases, you can add additional members to data forms. For example, you can add additional
currencies, countries, or intercompany partners to a data form.
Forms to which you can add members are indicated by this icon: .

Oracle Quantitative Management and Reporting for Solvency II
Administration / User Guide – 2.0.0 Page 4
To add members to a data form:
1. Click the Add Members button.
2. Select the members that you want to add.
3. Click OK to return to the form.
The form displays the added members.

Oracle Quantitative Management and Reporting for Solvency II
Administration / User Guide – 2.0.0 Page 5
Performing Initial Configuration Tasks
These tasks are required before starting a reporting cycle.
Configuring the application - global
The group administrator can load or enter configuration information for the Standard Model (SM),
Standard Model with USP (SMU), Partial Internal Model (PIM) and Full Internal Model (FIM).
The group administrator can also configure the undertaking type (if not configured at a solo level).
There are three data forms in the document management 01_Configuration_Global folder.
SCR_SetupAuthorizedModel
QMR supports four SCR model types concurrently (SM, SMU, PIM and FIM). Only one of these
models is deemed to be the authorized model. To designate the authorized model, load or enter a non-
zero value (e.g. 1) to the appropriate data-point.
Note that if non-zero data is entered to more than one model type, the least customized model type
will be used, where SM is the least customized and FIM is the most customized.
SCR_SetupPartialandInternalModel
The Partial Internal Model is a combination of Standard Model risk components and extended or
custom risk components.
In order to modify a standard risk component, non-standard correlation factors are entered to the
correlation tables for Partial Internal Model. When data is entered to the PIM correlation factors, the
settings for extended risk components are changed when the entity is calculated.
In order to enable custom risk components, a non-zero value is entered to the relevant risk
component.
MCR_SetupUndertakingTypeGlobal
The type of each base entity must be specified (as defined by EIOPA):
• Life
• Non-Life
• Composite (Life and No-Life)
• IORP
• Regulated Other Financial
• Non-Regulated
• Ancillary
• Holding
For each insurance entity, the classification must also be specified:
• Captive Reinsurance
• Included in Part A of Annex 1 of Directive 2009/138/EC
• Not Included in Part A of Annex 1 of Direction 2009/138/EC)
Oracle Quantitative Management and Reporting for Solvency II
Administration / User Guide – 2.0.0 Page 6
The system administrator has the option of defining these settings on an entity-by-entity basis in the
metadata user defined fields. If these settings have been entered to metadata, then if no entry is
made on a period-by-period basis, the default UD field entry is used. To override the default settings,
enter a non-zero value where required.
Configuring the application - local
The solo administrator can load or enter configuration information for undertaking type (if not
configured at group) and for entity-specific “simplification”.
There are two data forms in the document management 02_Configuration_Local folder.
MCR_SetupUndertakingType
The type of each base entity must be specified (see details above).
SCR_Simplification
EIOPA have specified several risks for which simplified data entry can be used. A Net SCR and a Gross
SCR value can be entered directly instead of entering five data values from which to calculate the Net
and Gross SCR values:
• Assets before shock
• Liabilities before shock
• Assets after shock
• Liabilities after shock
• Liabilities after shock including the loss absorbing capacity of technical provisions
In order to activate simplification for one or more of the permitted risk items, enter a non-zero value.
To revert to the standard entry, remove the data or enter a zero.
For all items for which simplification has been activated, an additional row will be displayed on the
relevant data entry form to allow the direct entry of Net SCR and Gross SCR. Standard entry will not
be prevented but any standard entry will be cleared when the entity is calculated.
Initiating a New Reporting Cycle
These tasks are required to initiate a new reporting cycle.
Loading System Data
The administrator loads the following system data to the global ([None]) entity, either using FDM, a
DAT file load or on-screen entry:
Exchange Rates
There is one data form in the document management 03_Admin_Global folder.
ExchangeRatesEntry
All currencies available in the system are displayed in terms of the application currency for Opening
Rate, Average Rate and Closing Rate. Opening Rate is entered only to the first period of the first year
of the application and is carried forward from the Closing Rate of the prior year.
Oracle Quantitative Management and Reporting for Solvency II
Administration / User Guide – 2.0.0 Page 7
Correlation Factors
There is one data form for each correlation table in the document management 03_Admin_Global
folder.
For each SCR risk category for which a correlation-factor-based diversification calculation is required,
correlation factors must be entered. Both axes of each correlation table contain a list of each individual
risk element across which the diversification effect is calculated. All values entered to the table must
be in the range from -1 to 1, the values on the diagonal of the table must be 1 and the amount for
each combination of risk X and risk Y must equal the amount for risk Y and risk X.
Data is entered only to the lower left half of the table. When the [None] entity is calculated, the
diagonal values will be populated with 1 and the upper right half of the table will be populated with the
amount entered to the diagonally opposite cell. Any invalid entry will be cleared and left unpopulated.
These invalid entries will be listed in the Correlation Table Validation form.
EIOPA-defined standard model correlation table data is available in file:
• QMR_200_EIOPAData2011QA.dat
The file is set for the Actual scenario for period QA of 2011 but the header can be changed to the
period required.
!Scenario = Actual
!Year = 2011
!Period = QA
Scalar Values
There are no data forms for scalar values. These values are pre-set. If scalar values are not loaded to
QMR then the current default settings will be applied. Data can be loaded should EIOPA change the
required scalar values. Not all scalar values are configurable in QMR 2.0.0.
EIOPA-defined scalar data is available in file:
• QMR_200_EIOPAData2011QA.dat
Undertaking Type
During the initial configuration of the application, the type of each undertaking is defined. This can be
reviewed at the beginning of each reporting period if required. The undertaking type is defined either
by the group administrator or by the administrator of each solo entity, depending on the initial setup of
the application when implemented.
Loading Ownership Data
HFM provides an Ownership Management screen to which ownership data can be entered.
Alternatively, data can be loaded using FDM or a DAT file load. Ownership data is entered to the parent
entity with the ICP dimension indicating the entity to which the settings apply. A sample data file
provides examples of ownership settings.
The settings required include the ownership Method (settings for consolidation logic), [PCon]
(consolidation percentage) and [POwn] (ownership percentage). If the consolidation and ownership
percentages are 100% then data need not be entered. A method must be entered for every parent /
child combination of group and solo entities. Consolidation methods are not required for RFF entities.

Oracle Quantitative Management and Reporting for Solvency II
Administration / User Guide – 2.0.0 Page 8
Submitting Solo Data
After the reporting cycle is opened, solo data is submitted. The users responsible for submitting solo
data follow this task flow:
1. Data is imported from source systems into Financial Data Quality Management (FDM) and then
validated.
2. The following schedules are reviewed and reported upon in FDM:
• All Assets schedules
• Technical Provisions (TP3, TP3A, TP3B)
3. All other data is loaded from FDM to Hyperion Financial Management (HFM).
4. The remaining solo schedules are reviewed and reported upon in HFM. These include:
• Financial Stability (FS1)
• Balance Sheet (BS)
• Technical Provisions (other than TP3, TP3A, and TP3B)
• Solvency Capital Requirements (SCR)
• Minimum Capital Requirements (MCR)
• Own Funds (OF)
• Country/Cover
• Reinsurance (Re)
5. After the solo data is reviewed and validated, it is submitted to the solo regulators via Financial
Reporting reports. Future releases of QMR will support XBRL format reporting.
Loading Data from Source Systems into FDM
Data file format
For each set of solo schedules for which reporting is completed in FDM, there is a standard import file
format. For example, all Assets schedules use a single tilde-delimited format specific to Assets
schedules. The Assets schedules all use a single format specific to Assets and Technical Provisions (TP)
schedules have their own format.
The QMR application provides sample data files with the required tilde-delimited formats. In each of
these files, the first row highlights the headings of the columns.
Different columns need to be populated for different schedules within each category. For instance,
Assets-D1 will require that column 37 be populated for “Issue Name”. Assets-D1S will require that
column 8 be populated for “Capital Protection”.
Oracle Quantitative Management and Reporting for Solvency II
Administration / User Guide – 2.0.0 Page 9
You can review what data is required for each schedule by reviewing the Import format screen in the
FDM Web client (MetaData -> Import Format).
Importing Data
Once you have a data file completed for a particular schedule, you can import the data into FDM for
review and reporting.
• Open and log in to FDM Web client.
o EPM -> FDM -> Web Server Components -> Web logon.
• Click Workflow -> Import.
• Select the correct location in the POV bar at the bottom of the screen. Remember that there is one
location for each schedule for each entity.
• Select Upload File.
• Browse to the required file.
• Select between Replace / Append and click Import.
During the import process, FDM will run validations to ensure data quality. If validation errors occur, a
report will be displayed showing all errors and each source record that failed to upload. All records that
passed the validation checks will be imported. The data file should be corrected and re-imported until
all validation errors are cleared.
During subsequent loads, previous validation errors will display. In order to clear the previous
validation error messages, complete the following before re-importing:
• Click Analysis -> Log
• Click the Delete button
• Specify the current date and all prior log entries will be deleted
Running reports
Once data has been validated and imported, QRT reports can be generated. To generate the QRT
reports complete the following steps:
• Open and log in to FDM Web client
o EPM -> FDM -> Web Server Components -> Web logon
• Click Analysis -> Report
• Select Quantitative Management Reporting for Solvency II from the drop down.
• Select the output format
• Select the correct location in the POV bar below (e.g. QMR-LE01-Assets-D1)
• Double click a report or select a report and click the Publish button
• Select the FDM Data Category, select the Accounting Period and click OK to run the report
QMR provides reports in five languages; English (EN), German (DE) Spanish (ES), French (FR) and
Dutch (NL). To view the reports in the required language:
• Select Tools -> User Setting
• Select the required language

Oracle Quantitative Management and Reporting for Solvency II
Administration / User Guide – 2.0.0 Page 10
Return to Analysis -> Report and you will see report group for the selected language.
Loading Data from FDM to HFM
Assets schedules Assets-D1, Assets-D1S, Assets-D2O, Assets-D4 and Assets-D5 are all loaded to HFM
for validation against the Balance Sheet data. Reload these assets data files to the HFM Location for
your entity, validate and export to HFM.
The remaining data required for QRT reporting is also loaded to HFM through the HFM location as setup
by your administrator.
Reviewing and Reporting Solo Data in HFM
Data loaded to HFM for each of the QRT schedules must be reviewed and reported upon. The solo
schedules not reported upon through FDM are processed in HFM using data entry forms and financial
reports.
Balance Sheet - Review
There are four data forms in the document management 11_BS folder:
00_Assets_Summary
The Assets Summary form displays the summary of the data imported from the FDM Assets schedules.
The detailed data in the Assets schedules is aggregated by account to be validated against the balance
sheet entries in the BS-C1 schedule (below). The form presents the data in Read-Only mode. If the
summary data is incorrect then the original source files must be amended and the reports re-created
in FDM.
01_BS_C1 (BS-C1)
This form displays balance sheet data for Solvency II and Statutory valuations. Data is displayed for
the total of third party and intercompany entries. Select the required Custom4 (Data Source) member
from the POV bar in order to enter, review or revise data. If the account supports intercompany entry,
right-click the required cell and select the Linked Form menu item. To add new intercompany
partners to the form, select the Add Members icon and select the required members from the POV
selection screen.
Statutory balance sheet data is either entered and reviewed directly at group or entered at solo level
and consolidated. If statutory balance sheet data is entered at group level then data entry will be
disabled when a solo entity is selected in the POV.
Solvency II asset accounts for which there are matching Assets schedules will be validated against the
summary data imported from the Assets schedules source files. The validations will be executed
whenever the current entity is calculated or updated as part of a group consolidation. The details of
each failed account validation will display on the right-hand side of the data entry form. To see the
details of the validation check, right-click on the error message displayed and select the Cell Text
option. Click the expand icon (+) to see the full details. If there are no validation errors, the error
columns will be hidden.
02_BS_C1B (BS-C1B)
This form displays specified balance sheet data by underlying currency.
To modify or add data, open the linked form for the relevant row.
Oracle Quantitative Management and Reporting for Solvency II
Administration / User Guide – 2.0.0 Page 11
03_BS_C1D (BS-C1D)
This form provides links to forms displaying additional details for specified balance sheet data. No data
is displayed on the initial form.
To modify or add data, open the linked form for the relevant row.
Balance Sheet - Reporting
There are three financial reports in the Workspace Explore 11_BS folder:
BS-C1, BS-C1B, BS-C1D
For each report, select the appropriate scenario, year, period and entity from the POV bar. The reports
can be displayed in HTML format and then printed to PDF for formatted reporting.
Country / Cover - Review
There are five data forms in the document management 12_Cover folder.
01_Country_K1 (Country-K1)
This form provides quarterly and annual premium and related claims information by the country into
which the insurance coverage was sold.
02_Cover_A1A_NonLife (Cover-A1A)
This form provides annual premium and related expenses information by line of business (LOB) for
Non-Life insurance plus premium and claims information by country.
03_Cover_A1A_Life (Cover-A1A)
This form provides annual premium and related expenses information by line of business (LOB) for Life
insurance plus premium and claims information by country.
04_Cover_A1Q_NonLife (Cover-A1Q)
This form provides quarterly premium and related expenses information by line of business (LOB) for
Non-Life insurance plus premium and claims information by country.
05_Cover_A1Q_Life (Cover-A1Q)
This form provides quarterly premium and related expenses information by line of business (LOB) for
Life insurance plus premium and claims information by country.
Country / Cover - Reporting
There are five financial reports in the Workspace Explore 12_Cover folder:
Country-K1, Cover-A1A-NonLife, Cover-A1A-Life, Cover-A1Q-NonLife, Cover-A1Q-Life
For each report, select the appropriate scenario, year, period and entity from the POV bar. The reports
can be displayed in HTML format and then printed to PDF for formatted reporting.
Own Funds - Review
There are three solo data forms in the 13_OF folder.
01_OF_B1_SQ (OF-B1Q Solo Quarterly)
This form provides quarterly Own Funds (Owner’s Equity) information for solo entities and must
balance to the Net Assets in the Balance Sheet.
Oracle Quantitative Management and Reporting for Solvency II
Administration / User Guide – 2.0.0 Page 12
02_OF_B1_SA (OF-B1A Solo Annual)
This form provides annual Own Funds (Owner’s Equity) information for solo entities and must balance
to the Net Assets in the Balance Sheet. Additional information such as movements, tier details and
transactional details are displayed in linked forms.
Validations identify where the totals of alternative details do not balance with each other.
06_OF_B1_NonAvail_Solo_DataEntry (OF-B1A Solo Annual Non Available Funds Data Entry)
Solo own funds might not be available for group use due to regulatory or other restrictions. This form
identifies any solo own funds by category that are not available for group use.
Own Funds - Reporting
There are 11 solo financial reports in the Workspace Explore 13_OF folder:
OF-B1-Solo-Summary - This report is used for quarterly reporting and also provides the summary for
annual reporting.
OF-B1-Solo-Details-01 to OF-B1-Solo-Details-10 - These reports provide the additional detail for
annual reporting.
For each report, select the appropriate scenario, year, period and entity from the POV bar. The reports
can be displayed in HTML format and then printed to PDF for formatted reporting.
Variance Analysis
There are currently no data forms for Variance Analysis pending clarification from EIOPA.
Solvency Capital Requirements (SCR) - Review
There are ten data forms in the document management folder 15_SCR folder.
01_SCR_B2A (SCR-B2A)
This form provides information for the Standard Model, Standard Model with USP and Partial
Internal Model. Linked forms provide further details that comprise the summary information. The
SCR-B2A links to the SCR-B2B and also to all of the SCR-B3<n> forms.
Select the Model from the POV bar to view data for the different models. Note that unless otherwise
specified, all source data is entered to Standard Model and is copied to Standard Model With USP
and to Partial Internal Model.
Note that where the data cell displays a blue triangle in the upper left corner (for all diversification
calculations for example), additional information is provided in Cell Text. Select the cell, select Cell
Text from the right-click menu and then click on the expand button (+) to view the details provided.
The cell text window may need to be expanded to display properly.
02_SCR_B2B (SCRB2B)
This form provides information for the Partial Internal Model where the risk categories differ from
the Standard Model calculations. This form is valid for Partial Internal Model only.
The Net and Gross SCR values calculated in the SCR-B2B carry forward into the SCR-B2A on a single
line. For any standard risk categories included in the SCR-B2B, those standard risk categories will
display no data in the SCR-B2A.

Oracle Quantitative Management and Reporting for Solvency II
Administration / User Guide – 2.0.0 Page 13
03_SCR_B2C (SCR-B2C)
This form provides information for the Full Internal Model. Data for each Internal Model risk category is
calculated externally and entered to the SCR-B2C for reporting purposes.
11_SCR_B3A (SCR-B3A)
This form provides detailed information for the Market Risk category. To enter intercompany data,
open the linked form for each required row.
12_SCR_B3B (SCR-B3B)
This form provides detailed information for the Counter-Party Risk category. To enter intercompany
data, open the linked form for each required row.
13_SCR_B3C (SCR-B3C)
This form provides detailed information for the Life Underwriting Risk category. To enter intercompany
data, open the linked form for each required row.
14_SCR_B3D (SCR-B3D)
This form provides detailed information for the Health Underwriting Risk category. To enter
intercompany data, open the linked form for each required row.
15_SCR_B3E (SCR-B3E)
This form provides detailed information for the Non-Life Underwriting Risk category. To enter
intercompany data, open the linked form for each required row.
16_SCR_B3F (SCR-B3F)
This form provides detailed information for the Non-Life and Health Catastrophe Risk categories.
17_SCR_B3G (SCR-B3G)
This form provides detailed information for the Operational Risk category. To enter intercompany data,
open the linked form for each required row.
Solvency Capital Requirements (SCR) - Reporting
There are 13 financial reports in the Workspace Explore 15_SCR folder, four for the SCR-B3F schedule
and one for each remaining schedule.
For each report, select the appropriate scenario, year, period, entity and model from the POV bar. The
reports can be displayed in HTML format and then printed to PDF for formatted reporting.
Minimum Capital Requirements (MCR) - Review
There is one form in the document management folder 16_MCR.
MCR_B4 (MCR-B4A, MCR-B4B)
This form provides information on the calculation of Minimum Capital Requirements.
The form will display the Life and Non-Life columns based on the Undertaking Type settings previously
entered during the configuration phase. If the undertaking is a composite insurance company, all
columns will be displayed, otherwise either the Life or Non-Life columns only will be displayed.
Note that where the data cell displays a blue triangle in the upper left corner, additional information is
provided in Cell Text. Select the cell, select Cell Text from the right-click menu and then click on the

Oracle Quantitative Management and Reporting for Solvency II
Administration / User Guide – 2.0.0 Page 14
expand button (+) to view the details provided. The cell text window may need to be expanded to
display properly.
Minimum Capital Requirements (MCR) - Reporting
There is one financial report in the Workspace Explore 16_MCR folder:
MCR-B4
Select the appropriate scenario, year, period and entity from the POV bar. The report will display Life
and Non-Life columns for a composite entity, but either Life only columns or Non-Life only columns for
non-composite entities. The report can be displayed in HTML format and then printed to PDF for
formatted reporting.
Technical Provisions - Review
There are fifteen forms in the document management folder 17_TP. Note that Technical Provision
schedules TP3, TP3A and TP3B are processed in FDM.
01_TP_F1Q_Life (TP-F1Q)
This form provides information on quarterly Life technical provisions by LOB.
02_TP_F1Q_Health (TP-F1Q)
This form provides information on quarterly Health (Similar to Life) technical provisions by LOB.
03_TP_F1_Life (TP-F1)
This form provides information on annual Life technical provisions by LOB.
04_TP_F1_Health (TP-F1)
This form provides information on annual Health (Similar to Life) technical provisions by LOB.
05_TP_F2 (TP-F2)
This form provides information on future estimated cash flows for Life insurance policies by LOB.
06_TP_F4 (TP-F4)
This form provides information on annuities stemming from Non-Life insurance obligations.
11_TP_E1Q (TP-E1Q)
This form provides information on quarterly Non-Life technical provisions.
12_TP_E1 (TP-E1)
This form provides information on annual Non-Life technical provisions.
13_TP_E1_Additional (TP-E1)
This form provides information on quarterly Non-Life technical provisions.
14_TP_E2 (TP-E2)
This form provides information on future estimated cash flows for Non-Life insurance policies.
15_TP_E3 (TP-E3)
This form provides information on Non-Life insurance claims information. Select the claims information
category and the LOB from the POV bar.
Oracle Quantitative Management and Reporting for Solvency II
Administration / User Guide – 2.0.0 Page 15
16_TP_E4 (TP-E4)
This form provides information on Reported but not Settled (RBNS) claims by LOB. Select the LOB
from the POV bar.
17_TP_E6 (TP-E6)
This form provides information on the Non-Life Loss Distribution Profile by LOB.
18_TP_E7A (TP-E7A)
This form provides information on Peak Underwriting Risks.
19_TP_E7B (TP-E7B)
This form provides information on Mass Underwriting Risks.
Technical Provisions - Reports
There are eleven financial reports in the Workspace Explore 17_TP folder:
TP-F1-Health, TP-F1-Life, TP-F1Q-Health, TP-F1Q-Life, TP-F2, TP-F4, TP-E1, TP-E1Q, TP-E2, TP-E3,
TP-E4, TP-E6, TP-F7A, TP-F7B
For each report, select the appropriate scenario, year, period, entity and model from the POV bar.
Depending on the report, the Line of Business (LOB) must also be selected in the POV. The reports can
be displayed in HTML format and then printed to PDF for formatted reporting.
Reinsurance - Review
There are five sets of data forms in the document management folder 18_Re.
01_Re_J1_NonLife (Re-J1)
This form provides information on the ten most important Non-Life risks in terms of reinsured
exposure by LOB.
02_Re_J1_Life (Re-J1)
This form provides information on the ten most important Life risks in terms of reinsured exposure by
LOB.
03_Re_J2 (Re-J2)
This form provides information on the Outgoing Reinsurance Program in the next reporting year.
04_Re_J3 (Re-J3)
This form provides information on the Share of Reinsurers.
05_Re_SPV (Re-SPV)
This form provides information on the Special Purpose Insurance Vehicles.
Reinsurance - Reports
There are five financial reports in the Workspace Explore 18_Re folder:
Re-J1-Life, Re-J1-NonLife, Re-J2, Re-J3, Re-SPV
For each report, select the appropriate scenario, year, period, entity and model from the POV bar. The
reports can be displayed in HTML format and then printed to PDF for formatted reporting.
Oracle Quantitative Management and Reporting for Solvency II
Administration / User Guide – 2.0.0 Page 16
Financial Stability
Financial Stability data consists of data drawn from other schedules plus some additional data. There is
also a requirement to enter a limited amount of data for non-insurance companies in the scope of the
group reporting. There are two data forms in the document management folder 10_FS.
01_FS_1 (FS-1)
This form provides information on Financial Stability that is not provided elsewhere.
02_Non_Insurance (data entry for G03)
This form provides information for non-insurance companies required for group reporting.
Validating Solo Data
After the solo data has been calculated, reviewed and corrected as required, the validations can be
reviewed. If there are any errors in the validation process, detailed information regarding the error is
presented in cell text.
There are six data forms in the 98_Validation_Local folder.
01_Validations
This form provides a summary of validations and links to additional forms providing further detail.
02_Validations_DataEntry
This form provides summary validation information on regular data entry and correlation factor entry.
It is assumed that unless specifically identified by the administrator, all regular data is entered as a
positive value and all correlation factors must be in the range from -1 to +1. Cell Text provides the
details of the erroneous data-points.
03_Validations_BS
This form provides information on Balance Sheet validation checks (assets details from the Assets
schedules vs. the matching Balance Sheet account).
04_Validations_OF
This form provides information on Own Funds validation check (matching the totals of the multiple sets
of alternative details entered).
SCRCorr_Validate
This form provides a summary of the errors found in correlation factor data entry. Links are provided
to view specific errors.
SCRCorr_ValidateTable
This form is linked to from the SCRCorr_Validate form and opens the relevant correlation table.
Correcting Validation Errors
If errors are identified during the validation process, these errors should be corrected before the data
is finalized and submitted. After correcting the errors, re-review the validation forms to ensure that all
of the data is properly validated.
Oracle Quantitative Management and Reporting for Solvency II
Administration / User Guide – 2.0.0 Page 17
Sign Off and Submit Solo Reports
After all data has been reviewed and validated, you may be required to sign off on the data by
submitting through HFM Process Control. Once signed off and approved, report as required.
For release 2.0.0 of QMR, Financial Reports are used for reporting. Future releases of QMR will support
XBRL reporting.
Submitting Group Data
After the solo data is reviewed and submitted, you run a consolidation to consolidate it into group
data. You then review and submit this group data to group regulators. To review and submit group
data, you follow this task flow:
1. The group administrator loads the following group data from the source system into FDM.
• Intra-group transactions (IGT)
• Risk Concentration
2. The data in FDM is validated, reviewed, and reported on.
3. The remaining group schedules are reviewed and reported on in HFM. These include
consolidated versions of:
• Financial Stability Reporting (FS1)
• Balance Sheet Reporting (BS)
• Solvency Capital Requirements (SCR)
• Own Funds (OF)
• Group Reporting
4. After the group data is reviewed and validated, it is submitted to the group regulators via
Financial Reporting reports. Future releases of QMR will support the XBRL format.
Loading Group Data from Source Systems into FDM
Data file format
For each set of schedules for which reporting is completed in FDM, there is a standard import file
format. For example, all IGT schedules use a single tilde-delimited format specific to IGT schedules.
The Intra-group transactions (IGT) schedules use an IGT format and the Risk Concentration RC)
schedule has its own format. Note that Assets schedules submitted by group are the same as the solo
schedules submitted by the group holding company.
The QMR application provides sample data files with the required tilde-delimited formats. In each of
these files, the first row highlights the headings of the columns.
Different columns need to be populated for different schedules within each category. For instance,
IGT1 will require that column 13 be populated “Transaction Amount”. IGT2 will require that column 21
be populated for “Value At Report Date”.
Oracle Quantitative Management and Reporting for Solvency II
Administration / User Guide – 2.0.0 Page 18
You can review what data is required for each schedule by reviewing the Import format screen in the
FDM Web client (MetaData -> Import Format).
Importing Data
Once you have a data file completed for a particular schedule, you can import the data into FDM for
review and reporting.
• Open and log in to FDM Web client.
o EPM -> FDM -> Web Server Components -> Web logon.
• Click Workflow -> Import.
• Select the correct location in the POV bar at the bottom of the screen. Remember that there is one
location for each schedule for each group entity.
• Select Upload File.
• Browse to the required file.
• Select between Replace / Append and click Import.
During the import process, FDM will run validations to ensure data quality. If validation errors occur, a
report will be displayed showing all errors and each source record that failed to upload. All records that
passed the validation checks will be imported. The data file should be corrected and re-imported until
all validation errors are cleared.
During subsequent loads, previous validation errors will display. In order to clear the previous
validation error messages, complete the following procedure before re-importing:
• Click Analysis -> Log.
• Click the Delete button.
• Specify the current date and all prior log entries will be deleted.
Running reports
Once data has been validated and imported, QRT reports can be generated. To generate the QRT
reports complete the following steps:
• Open and log in to FDM Web client.
o EPM -> FDM -> Web Server Components -> Web logon.
• Click Analysis -> Report.
• Select Quantitative Management Reporting for Solvency II from the drop down.
• Select the output format.
• Select the correct location in the POV bar below (e.g. QMR-LE01-Assets-D1).
• Double click a report or select a report and click the Publish button.
• Select the FDM Data Category, select the Accounting Period and click OK to run the report.
QMR provides reports in five languages; English (EN), German (DE) Spanish (ES), French (FR) and
Dutch (NL). To view the reports in the required language:
• Select Tools -> User Setting.
• Select the required language.
Oracle Quantitative Management and Reporting for Solvency II
Administration / User Guide – 2.0.0 Page 19
• Return to Analysis -> Report and you will see report group for the selected language.
Consolidating Solo Data in HFM
After solo data is submitted in HFM, the group user must consolidate the data. A consolidation can be
invoked from any data entry form, ad-hoc grid or the Process Control screen. Whenever solo data is
updated, the group data must be re-consolidated.
It is recommended that the Consolidate All consolidation option never be used. This may cause
future consolidations to be more time-consuming. Select the Consolidate option to update only those
solo entities for which data has changed. Select Consolidate All With Data to re-consolidate all
entities for which data has been loaded. The Consolidate All With Data option should only be
necessary if global data such as exchange rates have been changed and all solo data needs to be re-
translated.
Reviewing and Reporting on Group Data in HFM
Review and report on the group consolidated data using data forms and financial reports after solo
data is consolidated to group.
Balance Sheet - Review
There are four data forms in the document management 11_BS folder. These forms are the same as
are used for solo review. The Solvency II group balance sheet data is consolidated from the solo
balance sheet data reviewed and reported upon for each solo entity. Statutory balance sheet data is
either entered and reviewed directly at group or entered at solo and consolidated. If statutory balance
sheet data is entered at group level then data entry will be enabled when a group entity is selected in
the POV.
Balance Sheet - Reports
Refer to solo Balance Sheet reports.
Own Funds - Review
There are three group data forms in the 13_OF folder.
03_OF_B1_GQ (OF-B1Q Group Quarterly)
This form provides quarterly Own Funds (Owner’s Equity) information for group entities based on
consolidated solo Own Funds and must balance to the Net Assets in the Balance Sheet.
04_OF_B1_GA (OF-B1A Group Annual)
This form provides annual Own Funds (Owner’s Equity) information for group entities based on
consolidated solo Own Funds and must balance to the Net Assets in the Balance Sheet. Additional
information such as movements, tier details and transactional details (also consolidated from solo
entry) are displayed in linked forms.
05_OF_B1_NonAvail (OF-B1A Group Annual Non-Available Funds)
Solo own funds might not be available for group use due to regulatory or other restrictions. This form
identifies any solo own funds by category that are not available for group use on an entity-by-entity
basis.
Own Funds - Reports
There are 11 solo financial reports in the Workspace Explore 13_OF folder:

Oracle Quantitative Management and Reporting for Solvency II
Administration / User Guide – 2.0.0 Page 20
OF-B1-Group-Summary - This report is used for quarterly reporting and also provides the summary for
annual reporting.
OF-B1-Group-Details-01 to OF-B1-Group-Details-11 - These reports provide the additional detail for
annual reporting.
For each report, select the appropriate scenario, year, period and entity from the POV bar. The reports
can be displayed in HTML format and then printed to PDF for formatted reporting.
Solvency Capital Requirements (SCR) - Review
There are ten data forms in the document management folder 15_SCR folder.
These forms are the same as are used for solo review. The source solo data (such as Assets Before
Shock / Liabilities Before Shock) are consolidated from solo to group and the SCR calculations are re-
run in order to report “group as solo”.
Simplification entries from solos that use simplification are merged with the more detailed data from
solos not using simplification. USP entries entered by solos for Premium and Reserve Risk Standard
Deviation / Adjustments are not re-used at group. Any Premium and Reserve Risk USPs to be applied
at group must be entered at group.
The exceptions to the consolidation of solo source data are for Deduction and Aggregation (D&A) solo
entities. Based on the consolidation method assigned to the solo entity, the final calculated Net SCR
for any D&A solo entity is consolidated as a single value directly to the SCR-B2A schedule. Two lines
are provided on the SCR-B2A form, one for “D&A entities subject to Article 4” and one line for those
D&A entities not subject to Article 4. A linked form is available to identify each of the D&A entities
reported on the relevant lines. At group level the source D&A entity is recorded in the intercompany
dimension.
Solvency Capital Requirements (SCR) - Reports
Refer to solo SCR reports.
Group - Review
There are five Group data forms in the document management folder 21_Group. Most of the data for
these schedules are consolidated from solo data entry but there are some entries required at group.
01_Group_G01 (G01)
This form provides information on Undertakings in the scope of the group.
This information is compiled from consolidated solo data and entity-specific information stored in the
entity User Defined fields.
02_Group_G03 (G03)
This form provides information on (Re)insurance Solo requirements.
This information is compiled from consolidated solo data and entity-specific information stored in the
entity User Defined fields.
03_Group_G04 (G04)
This form provides information on other regulated entities including holding companies.
Oracle Quantitative Management and Reporting for Solvency II
Administration / User Guide – 2.0.0 Page 21
This information is compiled from consolidated solo data and entity-specific information stored in the
entity User Defined fields.
04_Group_G14 (G14)
This form provides information on solo contributions to group technical provisions.
This information is compiled from consolidated solo data and entity-specific information stored in the
entity User Defined fields.
05_Group_G20 (G20)
This form provides information on the solo Deduction and Aggregation contribution to Group SCR.
This information is compiled from consolidated solo data and entity-specific information stored in the
entity User Defined fields.
Group - Reports
There are five financial reports in the Workspace Explore 21_Group folder:
G01, G03, G04, G14, G20
For each report, select the appropriate scenario, year, period and entity from the POV bar. The reports
can be displayed in HTML format and then printed to PDF for formatted reporting.
Signing Off and Submitting Group Data
After the data has been validated, you sign off on the data and submit it to the regulators who are
responsible for group data. For this release of QMR, you submit the data by using Financial Reporting
documents. Future releases of QMR will support creating XBRL versions of the reports.
Oracle Quantitative Management and Reporting for Solvency II
Administration / User Guide – 2.0.0 Page 22
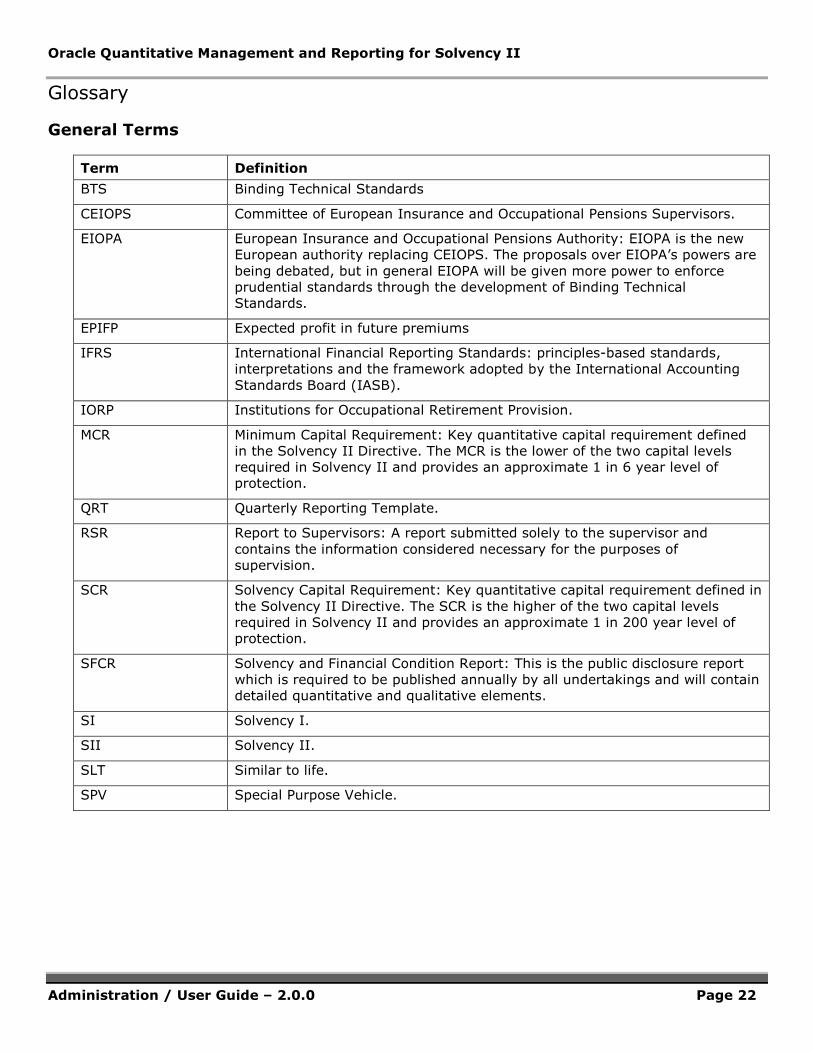
Glossary
General Terms
Term Definition
BTS Binding Technical Standards
CEIOPS Committee of European Insurance and Occupational Pensions Supervisors.
EIOPA
European Insurance and Occupational Pensions Authority: EIOPA is the new
European authority replacing CEIOPS. The proposals over EIOPA’s powers are
being debated, but in general EIOPA will be given more power to enforce
prudential standards through the development of Binding Technical
Standards.
EPIFP Expected profit in future premiums
IFRS International Financial Reporting Standards: principles-based standards,
interpretations and the framework adopted by the International Accounting
Standards Board (IASB).
IORP Institutions for Occupational Retirement Provision.
MCR
Minimum Capital Requirement: Key quantitative capital requirement defined
in the Solvency II Directive. The MCR is the lower of the two capital levels
required in Solvency II and provides an approximate 1 in 6 year level of
protection.
QRT Quarterly Reporting Template.
RSR
Report to Supervisors: A report submitted solely to the supervisor and
contains the information considered necessary for the purposes of
supervision.
SCR
Solvency Capital Requirement: Key quantitative capital requirement defined in
the Solvency II Directive. The SCR is the higher of the two capital levels
required in Solvency II and provides an approximate 1 in 200 year level of
protection.
SFCR
Solvency and Financial Condition Report: This is the public disclosure report
which is required to be published annually by all undertakings and will contain
detailed quantitative and qualitative elements.
SI Solvency I.
SII Solvency II.
SLT Similar to life.
SPV Special Purpose Vehicle.

Oracle Quantitative Management and Reporting for Solvency II
Administration / User Guide – 2.0.0 Page 23
Technical Terms
Term Definition
Best estimate
The probability-weighted average also referred to the mean. The estimation
process is unbiased and based on all currently available information including
information of currently observable trends, but excluding effects from events
not yet occurred.
Best estimate
liability
The expected or mean value (probability weighted average) of the present
value of future cash flows for current obligations, projected over the
contract’s run-off period, taking into account all up-to-date financial market
and actuarial information.
Business risk
Unexpected changes to the legal conditions to which insurers are subject,
changes in the economic and social environment, as well as changes in
business profile and the general business cycle.
Catastrophe risk
The risk that a single event, or series of events, of major magnitude, usually
over a short period (often 72 hours), leads to a significant deviation in actual
claims from the total expected claims.
Claims risk An underwriting risk. A change in value caused by ultimate costs for full
contractual obligations (claims without administration costs) varying from
those assumed when these obligations were estimated.
Compliance risk The risk of legal or regulatory sanctions resulting in a financial loss, or loss of
reputation as a result of an insurer’s failure to comply with laws, regulations,
rules, related self-regulatory organisation standards, and codes of conduct.
Concentration risk The exposure to increased losses associated with inadequately diversified
portfolios of assets and/or obligations
Cost of capital
approach
An approximation through which a risk margin is determined based on the
present value of the cost of capital charge for all future capital requirements
until run-off.
Credit risk The risk of a change in value due to actual credit losses deviating from
expected credit losses due to the failure to meet contractual debt obligations.
Default risk The risk of a change in value caused by the fact that actual default rates
deviate from expected default rates with respect to non-payment of interest
or principle.
Diversification Reduction in risks among assets and/or obligations of an institution by
accumulating risks that are not fully correlated in an aggregated risk position,
for example, the aggregated amount of risks within a product portfolio or at a
company level is smaller compared to the simple addition of the individual
risks.
Economic balance
sheet
Balance sheet statement based on one of those accounting approaches using
market-consistent values for all current assets and current obligations relating
to in-force business, including off-balance sheet items.
Equity risk The risk of a change in value caused by deviations of the actual market values
of equities and/or income from equities from their expected values.
European embedded
value
A method for calculating the embedded value according to the principles and
guidelines set by the CFO Forum.
Oracle Quantitative Management and Reporting for Solvency II
Administration / User Guide – 2.0.0 Page 24
Term Definition
Financial group A group of undertakings deploying financial activities, which consists of a
parent undertaking, its subsidiaries, and the entities in which the parent
undertaking or its subsidiaries hold a significant participation. Or,
undertakings linked to each other by a relationship subject to conditions
defined in EU law.
Foreign exchange
risk
The risk of a change in value caused by the fact that actual foreign currency
exchange rates differ from those expected.
Fungible capital That part of the capital of a group which can be transferred between different
legal entities of the group.
Health insurance Generic term applying to all types of insurance indemnifying or reimbursing
for losses (e.g.. loss of income) caused by illness or disability, or for expenses
of medical treatment necessitated by illness or disability.
Hedgeable risk A risk associated with an asset or an obligation that can be effectively
neutralised by buying or selling a market instrument (or engaging in a
contract with a third party in an arms length transaction under normal
business conditions), whose value is expected to change so as to offset the
change in value of the asset or liability caused by the presence of the risk.
Inflation risk The risk of a change in value caused by a deviation of the actual market-
consistent value of assets and/or liabilities from their expected value, due to
inflation, for example, price inflation, wage inflation, etc., leading to an
unanticipated change in insurance cost and/or impact of an insurance
contract, for example, with respect to contract limits.
Internal model
Risk management system of an insurer for the analysis of the overall risk
situation of the insurance undertaking, to quantify risks and/or to determine
the capital requirement on the basis of the company specific risk profile.
Liquidity risk The risk stemming from the lack of marketability of an investment that cannot
be bought or sold quickly enough to prevent or minimize a loss
Longevity risk Type of biometric risk. A change in value caused by the actual mortality rate
being lower than the one expected.
Market risk The risk of changes in values caused by market prices or volatilities of market
prices differing from their expected values.
Market-consistent
valuation
The practise of valuing assets and liabilities on market values where
observable with a given quality (mark-to-market), where not, on market-
consistent valuation techniques (mark-to-model).
Mark-to-market
valuation
The practice of valuing insurance rights and obligations, or more broadly
security and financial instruments, using current market prices.
Morbidity risk
Type of biometric risk. A change of value caused by the actual disability and
illness rates of the persons insured deviating from the ones expected.
Mortality risk Type of biometric risk. A change in value caused by the actual mortality rate
being higher than the one expected.
Non-SLT Health type business which is not treated as life business.
Oracle Quantitative Management and Reporting for Solvency II
Administration / User Guide – 2.0.0 Page 25
Term Definition
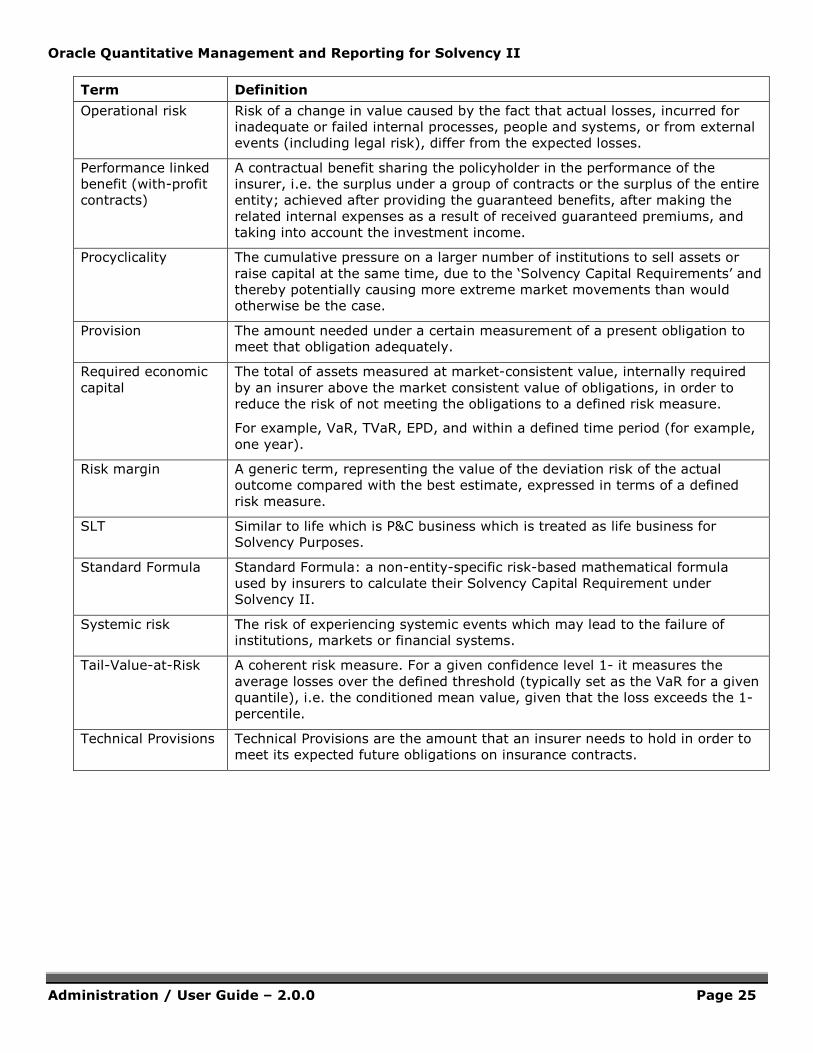
Operational risk Risk of a change in value caused by the fact that actual losses, incurred for
inadequate or failed internal processes, people and systems, or from external
events (including legal risk), differ from the expected losses.
Performance linked
benefit (with-profit
contracts)
A contractual benefit sharing the policyholder in the performance of the
insurer, i.e. the surplus under a group of contracts or the surplus of the entire
entity; achieved after providing the guaranteed benefits, after making the
related internal expenses as a result of received guaranteed premiums, and
taking into account the investment income.
Procyclicality
The cumulative pressure on a larger number of institutions to sell assets or
raise capital at the same time, due to the ‘Solvency Capital Requirements’ and
thereby potentially causing more extreme market movements than would
otherwise be the case.
Provision The amount needed under a certain measurement of a present obligation to
meet that obligation adequately.
Required economic
capital
The total of assets measured at market-consistent value, internally required
by an insurer above the market consistent value of obligations, in order to
reduce the risk of not meeting the obligations to a defined risk measure.
For example, VaR, TVaR, EPD, and within a defined time period (for example,
one year).
Risk margin A generic term, representing the value of the deviation risk of the actual
outcome compared with the best estimate, expressed in terms of a defined
risk measure.
SLT Similar to life which is P&C business which is treated as life business for
Solvency Purposes.
Standard Formula Standard Formula: a non-entity-specific risk-based mathematical formula
used by insurers to calculate their Solvency Capital Requirement under
Solvency II.
Systemic risk The risk of experiencing systemic events which may lead to the failure of
institutions, markets or financial systems.
Tail-Value-at-Risk A coherent risk measure. For a given confidence level 1- it measures the
average losses over the defined threshold (typically set as the VaR for a given
quantile), i.e. the conditioned mean value, given that the loss exceeds the 1-
percentile.
Technical Provisions Technical Provisions are the amount that an insurer needs to hold in order to
meet its expected future obligations on insurance contracts.
Oracle Quantitative Management and Reporting for Solvency II
Administration / User Guide – 2.0.
Term Definition
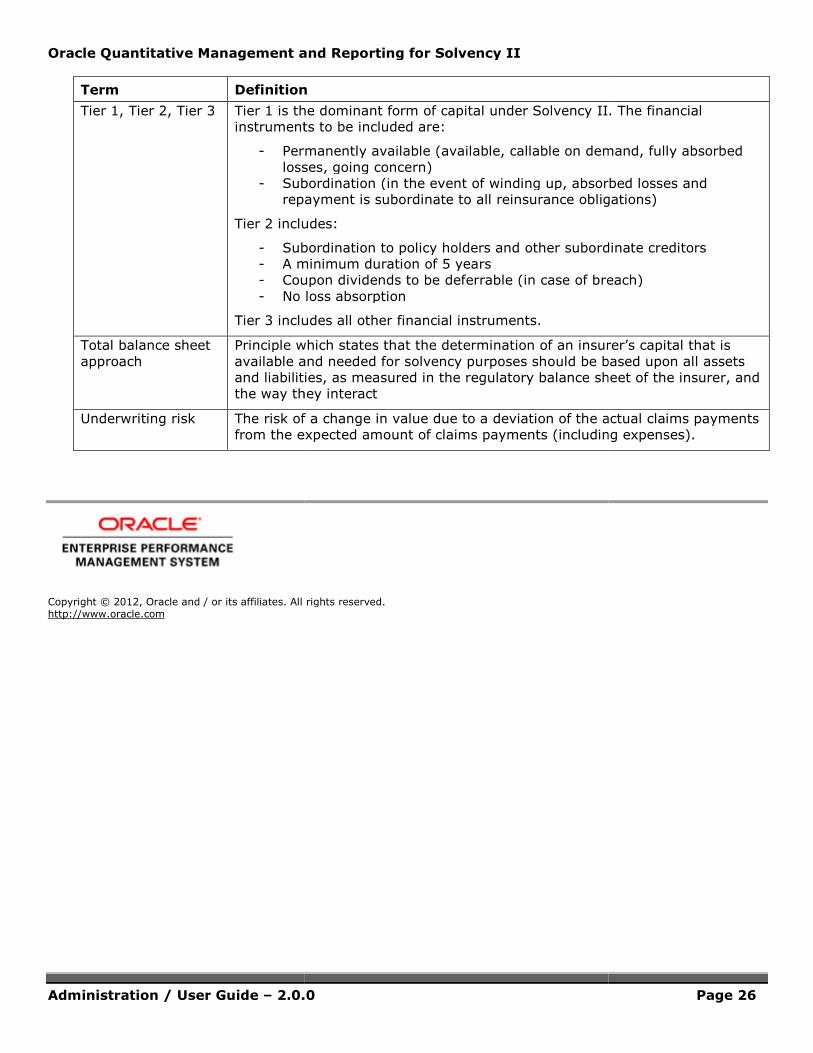
Tier 1, Tier 2, Tier 3 Tier 1 is the dominant form of capital under Solvency II. The financial
instruments to be included are:
- Permanently available (available, callable on demand, fully absorbed
losses, going concern)
- Subordination (in the event of winding up, absorbed losses and
repayment is subordinate to all reinsurance obligations)
Tier 2 includes:
- Subordination to policy holders and other subordinate creditors
- A minimum duration of 5 years
- Coupon dividends to be de
- No loss absorption
Tier 3 includes all other financial instruments.
Total balance sheet
approach
Principle which states that the determination of an insurer’s capital that is
available and needed for solvency purposes should b
and liabilities, as measured in the regulatory balance sheet of the insurer, and
the way they interact
Underwriting risk The risk of a change in value due to a deviation of the actual claims payments
from the expected amount of
Copyright © 2012, Oracle and / or its affiliates. All rights reserved. http://www.oracle.com
t and Reporting for Solvency II
.0.0
Definition
Tier 1 is the dominant form of capital under Solvency II. The financial
instruments to be included are:
Permanently available (available, callable on demand, fully absorbed
losses, going concern)
Subordination (in the event of winding up, absorbed losses and
repayment is subordinate to all reinsurance obligations)
Tier 2 includes:
Subordination to policy holders and other subordinate creditors
A minimum duration of 5 years
Coupon dividends to be deferrable (in case of breach)
No loss absorption
Tier 3 includes all other financial instruments.
Principle which states that the determination of an insurer’s capital that is
available and needed for solvency purposes should be based upon all assets
and liabilities, as measured in the regulatory balance sheet of the insurer, and
the way they interact
The risk of a change in value due to a deviation of the actual claims payments
from the expected amount of claims payments (including expenses).
, Oracle and / or its affiliates. All rights reserved.
Page 26
Tier 1 is the dominant form of capital under Solvency II. The financial
Permanently available (available, callable on demand, fully absorbed
Subordination (in the event of winding up, absorbed losses and
repayment is subordinate to all reinsurance obligations)
Subordination to policy holders and other subordinate creditors
ferrable (in case of breach)
Principle which states that the determination of an insurer’s capital that is
e based upon all assets
and liabilities, as measured in the regulatory balance sheet of the insurer, and
The risk of a change in value due to a deviation of the actual claims payments
claims payments (including expenses).