order flow
DESCRIPTION
Order flow tradingTRANSCRIPT

Order Flow Mindset Introduction Trading is a rather unique enterprise. It would seem that it is the only career field in existence where the people least likely to become successful at it are willing to risk huge portions of their net worth for the right to apply. Yet, year after year, the same kind of people jump into the markets hoping to make it big; never realizing that the chips are stacked against them.
In my experience - and there was a poll conducted on one of the big trading forums a number of years ago that can support the claim - aspiring traders near universally share three defining characteristics:
o They are not happy with their existing career – Let’s be honest; if someone is making ok money doing something they enjoy, they are not likely to be dabbling in speculation as anything other than a hobby. While I am sure many dabblers exist, it has been my observation that the vast majority are looking for a new career because, for one reason or another, they hate the one they have. As a sexy career option with enormous income potential, trading can seem like a good alternative.
o They are predominantly introverted – Nine times in ten, the reason they hate their existing career has something to do with the people they are required to deal with. Whether it is co-workers, clients, customers, or supervisors, they dread going to work every day and talking to people for which they have little respect and/or no rapport. Trading draws them in with the potential for self-sufficiency and the promise of a career that does not require them to deal with people.
o They are highly analytical – Introversion and an analytical mind seem to go hand in hand. Trading is arguably the pinnacle of analytical endeavors with its mass profusion of mathematical algorithms, charts, graphs, spreadsheets, and statistics. The market is one of the most complex puzzles on earth and, once discovered, those with an analytical mind are nearly powerless to avoid trying to solving it.
The problem is not really the possession of these attributes so much as it is the way these attributes influence an aspiring trader’s career path. You see introverted/ analytical types are all about research. Before they can go about doing something, they need to research the best way to do it. This is usually a wise course of action, but in the case of financial market speculation, the research leads to an inappropriate conclusion. That conclusion is that in order to achieve speculative profits, traders must engage in either Fundamental or Technical Analysis. It is inappropriate because, in practice, those disciplines rarely lead to the profits traders are seeking.

Now, I am not suggesting that aspiring traders of the introverted/analytical variety cannot earn profits. I have personally done quite well for myself over the years and I am an introverted/analytical type of the first order. The point I am trying to make is that in doing what appears to be the right thing, most traders set themselves up for failure because the research they do gives them a flawed understanding of the speculative profit making process. To understand why, we need to look at the two disciplines in some detail…
Fundamental Analysis Fundamental analysis is a method of evaluating a security that entails attempting to measure its true value by examining related economic, financial, and other qualitative and quantitative factors.
Fundamental Analysts are practitioners who attempt to study everything that can affect the security's value, including macroeconomic factors (like the overall economy and industry conditions) and company-specific factors (such as financial condition and management). The end goal of performing fundamental analysis is to produce a measure of true value that an investor can compare with the security's current price. The point of that goal is to figure out what sort of position the analyst should take within that security (underpriced = buy, overpriced = sell or short). The implication is that if an aspiring trader can accurately analyze when a security is trading at a price divorced from its true value, they will be able to enter a position and collect any discrepancy through arbitrage.
Once an aspiring trader understands this, the suggested next step is to set off on a quest to discover the aforementioned arbitrage opportunities.
Unfortunately, even if they are successful in determining true value - which the research often fails to mention is only theoretically possible - they are unlikely to turn a mispricing opportunity into a profit. To earn a profit from an arbitrage opportunity, a trader not only needs to know price and true value as they exist today, they also need to predict the price and true value that will exist in the future. This is because neither true value nor price is a fixed variable. Even were price and true value to be divergent today, it will take some measure of time for both values to come together. In the interim, true value may change meaningfully against the trader’s position and/or price can become even more divergent.

One could argue that if a trader possessed the where-with-all to accurately assess true value in the present, they would possess an equally likely ability to do so with future value. There may be some merit to this argument. However, even if we were to accept the argument at face value, the same cannot be said about price because price is more a reflection of the thoughts, fears, and behaviors of the traders participating in the market at that moment in time. So ultimately, determining price in the future requires the prediction of other trader’s behaviors.
Once we start talking about predicting the future behavior of traders, we move away from the clean world of numbers and math, where the introverted/analytical type can excel, and descend into the messy realm of psychology, human nature, and emotional response.
It’s at this point where we begin to realize how the chips are stacked against the average aspiring trader. The problem is that in order for someone to understand what other people are likely to do, he must have a deep understanding of how people think and feel. The sad reality is that traders usually have introverted personalities that often preclude them from having the necessary people skills to make the requisite predictions. Without that prediction, no profits can be made and ultimately, the aspiring trader will fail to reach the intended objective.
I personally slammed into this wall back in 2004. My apparent lack of people skills continuously thwarted my ability to extract consistent profits and instead of facing reality and doing what needed to be done, I dove into the world of technical analysis.
Technical Analysis Technical analysis, by comparison, offers up a neatly organized (and very seductive) solution for overcoming the people problem. However, the complexity involved in the practical application of that solution has afforded very few speculators an opportunity to achieve the desired outcome.
At its core, technical analysis assumes that a securities market price reflects all relevant information. By defining “information” broadly, the theory of technical analysis suggests that a securities price chart not only includes all the known fundamental data, but that of the hopes, fears, thoughts, and idiosyncratic behaviors of market participants as well.

A closely related hypothesis is that price activity tends to repeat itself over time because investors collectively tend toward patterned behavior. Therefore, by searching out repeating patterns in historical price activity, a Technical Analyst can profit from its recurrence in the future.
This is an extremely seductive theory for introverted/analytical types because it not only eliminates the need to understanding economics and the mechanics of financial analysis, it promises to eliminate the need to understand people as well.
Of course, while that sounds great in theory, it fails to account for the sheer volume of potential patterns and data points that the financial markets produce. Not only are there thousands of different securities, each security produces dozens of different charts. Each of those charts can be broken up into an infinite number of data point sequences. And each of those sequences can produce a seemingly never-ending supply of indicators and other derivative calculations. All told, financial markets produce more potential price patterns in a single day then the most powerful supercomputers can analyze in a year. Without the benefit of such machines, Technical Analysis becomes an endless exercise in searching for needles within haystacks.
For those who enjoy such enterprises, I am sure at some point they can turn all that searching into a lucrative trading career. However, after a few months of banging my head against the wall I, like many other aspiring traders out there, chose to attack the problem in a slightly different way.
Interestingly enough, despite the enormous obstacles in the path of replicable pattern discovery, traders throughout history have managed to discover a few seemingly meritable examples. I am not quite sure why these patterns were shared with the larger technical community, but now that they have been, many traders can (and do) avoid the haystack problem through the simple expediency of trading previously discovered patterns.
Unfortunately, in doing so we inevitably ran into the problem that Technical Analysis sought to avoid at its outset. You see, regardless of the original merit, there have been numerous empirical studies conducted on these technical patterns and in every case, the conclusion was that the pattern itself did not produce predictable outcomes to any statistically meaningful degree. How does this jive with the claims of numerous

traders that they are using these patterns to earn profits? Well, if we assume that the claims are credible, the only conclusion that we can make is that they are using some additional analysis techniques to improve the probabilities. While there is little empirical evidence regarding exactly what those techniques are, in talking to individuals who use those patterns profitably, I discovered that most of them utilize an examination of the broader fundamental factors influencing the behavior of market participants.
And this is the reason, I believe, why most introverted/analytical types consistently fail to achieve success in this business. For the introverted/analytical types, analyzing and predicting the behavior of market participants does not come easy. Nevertheless, the research they do suggests that they need to engage in Technical or Fundamental Analysis if they have any hope of success. Unfortunately, in order to turn either Technical or Fundamental Analysis into a profitable trading career, the analyst needs to analyze and predict the behavior of market participants. It is one of those Catch 22 situations and, for most traders it is often easier to give up on the endeavor rather then discover a viable solution to the problem.
They Need a Handbook for Predicting the Future For all the fuss made about it, predicting the future isn’t nearly as hard as the literature makes it out to be. Markets are driven by the expectations, aspirations, and fears of the people who participate in them. All of this is a function of human nature, which is actually quite predictable once you understand humans.
The problem is that when it comes to figuring out why people do the things they do, those who are most likely to be attracted to trading can find it very difficult to determine exactly where to begin. Thanks to their penchant for research, they quickly discover that there are literally a half-dozen different scientific fields dealing with the study of human nature and/or behavior. After they start digging into those fields they discover that there is very little information that is directly applicable to the specific activities of traders. The net result is that without some form of guide to outline what information is important and how it applies to trading, aspiring traders are likely to waste a great deal of time and money just figuring out what they need to know.
When I began my quest to figure out and predict human behavior, there was no such guide. And to be honest, I never expected there would be. Fate, however, was under no such illusion.

On April 30, 2006, in response to a question about the form of trading I was engaging in, I started a forum discussion thread on ForexFactory.com titled “Ohh Sweet Liquidity.” To start the discussion, I decided to walk systematically through a real time stop hunting trade that went on to produce 55 pips of profit in approximately 16 minutes. Over the following 24 hours, I received nearly 100 messages asking for more details. Within a week, it seemed like the only thing anyone was interested in was the thread about the stop hunting methodology I shared.
For many people this outcome would have been a welcome one, but I was not at all happy. As more aspiring traders became aware of what I was doing, I became increasingly concerned about the system’s long-term viability. A great deal of my research led me to believe that the information I had shared would eventually cease to generate profits if too many people found out about it. Therefore, in an effort to protect my income, I chose to delete all traces of the thread.
In hindsight, removing the thread was probably a bad idea. Publishing a trading system that showed excellent profit potential and then removing it when it started to become popular gave it a mystique that only increased its appeal. As a result, interest in “Order Flow Trading” – as it later came to be called – exploded. Shortly after the “Ohh Sweet Liquidity” thread was deleted, hundreds of new threads began springing up all over the forum to discuss what I was doing, how I was doing it, and why.
Most of the ideas people came up with were complete nonsense, but there were a few exceptions. A number of individuals started asking questions about the theory behind my methodology that I had never thought to ask. More importantly, I found the answers they were coming up with were quite insightful and often taught me things about my methodology that I had not previously considered.
Needless to say, when these discussions started wandering off in irrelevant directions, I felt compelled to contribute in order to get it back on track. I never did share my system, but it didn’t seem to make much difference. The global knowledgebase regarding Order Flow Trading was growing and it soon became apparent that my little stop hunting system was only one piece of a much larger concept.
Over time, these discussions - and often my specific contributions - began to have a serious impact on the traders who read them. Hundreds of previously unsuccessful traders (many of them of the introverted/analytical variety) began developing highly

profitable order flow based systems that were of a completely different nature to mine. As those traders gained mastery of the Order Flow Trading concepts, they too began to share insights and inspire discussions of their own. This led to even more aspiring traders achieving profitability and a virtuous cycle ensued.
Today, the seemingly innocuous research I began into the behaviors of market participants all those years ago has somehow turned into a trading discipline in its own right. Many aspiring traders are now choosing to study Order Flow Trading as opposed to Fundamental and Technical Analysis and a decent number of them are achieving great success.
Of course, not everyone has done so.
In my opinion, the main impediment for the traders who fail to achieve their goal is that the key lessons and insights regarding the subject are scattered around various discussion forums on the internet. For those who can dig up the right insights at the right time, there is enough information out there to develop a profitable system. The unfortunate reality for everyone else though, is that the illusiveness of the needed insights can be an insurmountable barrier to success. It is my fervent belief that were someone to develop a guide on how to become a successful Order Flow Trader, many more of those individuals would have been able to achieve success in this business.
With that in mind, I decided to set about the task of creating this program. And while its a constantly changing and improving product, at this stage, it does a pretty good job of meeting that goal.
What is Order Flow Trading? The Order Flow Trading label has been applied to many things. From tape reading… to microstructure analysis… to option and stop hunting… to technical pattern rationalization -- it seems that any time a trader makes a decision based on order mechanics they call it order flow trading. While one could justifiably consider any of these to be “order flow trading,” the reality is that it’s all of them and more.

At its core, Order Flow Trading is a mindset. And not just any mindset! It’s a mindset that exists one level higher in abstraction than the one most other traders in the market think on.
OK… and uh, what in Sam Hill does that mean exactly?
Well, what I’m talking about here is something called the metagame. In short, the metagame is the “game within a game” where players make decisions, not on the basis of an elementary strategy called for by a game’s rules, but on information that exists outside the game.
For example, in the game of chess there is a strategy of play that makes it possible to win a match in just four moves. If Player A watches Player B employ this four-move strategy five times in a row, then acts to thwart that four-move strategy before it becomes evident that Player B is employing it, Player A is “playing the metagame.”
In that example, Player A is not making his decisions based solely on the inherent value of his strategy. What he is really doing is exploiting his knowledge of the other player to gain a strategic advantage. And that’s precisely what the Order Flow Trading discipline attempts to do within the game of financial market speculation.
Of course, the way order flow traders do it is a great deal more complex because the speculation game is so much more complicated. Where chess has two players, a finite game board, and a discrete beginning and end to each game, financial markets have thousands of players, an infinite range of prices, and the game is played across an open-ended time line.
However, even with all these dissimilar aspects, the thought process both metagame strategies employ requires the same three steps:
Step 1 - Learn the Rule Set Metagaming is all about anticipating the choices of one’s opponents. However, before one can realistically anticipate those choices, they need to understand the scope of the choices available. That means understanding the rules.

In a game like chess, the rules are contained in a readily accessible rulebook. That rulebook defines how each game piece can move, the structure of the game board, and the timeframe within which each player is permitted to act.
The financial market corollary to this rulebook is the field of Market Microstructure. Even for a game as complex as financial market speculation, the rules impose clearly defined restrictions on the strategic choices available to each player. Microstructure explores those rules and the restrictions they create. Therefore, before you can play the financial speculation metagame, you need a thorough understanding of the market microstructure.
Step 2 - Study your opponents and determine the strategies they are likely to employ Learning the rules is an important step. But, it isn’t enough to just know what is and isn’t possible. You also have to develop an intimate understanding of the way people play the game.
At first, this might seem like a daunting task. After all, complex games like chess and financial market speculation have a near infinite variety of ways in which they can be played. However, after careful analysis it quickly becomes apparent that even though it CAN be played in an infinite variety of ways, most players tend to consistently employ a number of “elementary strategies.” Once you know those strategies, figuring out which one your opponent is likely to use becomes much easier.
An elementary strategy is one that is well understood, accepted as viable, and consistently used by serious players of the game.
The game of chess has 50 or so of these elementary strategies, including things like the Benko Gambit opening, Pins and Skewers midgame, and the King/Rook endgame. If you know all these strategies, you can not only play a damn good game of chess, you can easily identify which strategies your opponent is using.
In the realm of financial markets, these elementary strategies come in the form of common technical and fundamental trading systems you read about in most trading books and forums. Moving average crosses, support resistance breakouts, and

Fibonacci retracement strategies are a few examples of the elementary strategies of the speculation game.
Once you have familiarized yourself with these strategies, it becomes possible to anticipate how the players who prefer these strategies will act. And that gives you many strategic advantages when playing against them.
Step 3 - Adapt your own strategy to exploit the weaknesses in your opponent’s strategy Once you know the rules, and the strategy your opponent(s) are using, the final step in the process is to exploit that information by tailoring your own strategy to take advantage of the weaknesses in theirs.
If I had to give you a definition for Order Flow Trading, that would be it.
Of course having a definition for the methodology is only a tiny piece of the puzzle. Actually figuring out how it works in the real world is where the profits come from.
Unfortunately, as easy as the three steps that go into Order Flow Trading are to describe, teaching someone how to perform them within the game of financial market speculation is anything but easy. Step 1 requires you to navigate the vast and labyrinthine world of market microstructure. Step 2 requires you to analyze the thought processes of a wide array of dissimilar participants who are all operating simultaneously. Step 3 requires you to think in a way with other than what you are accustomed to. In short, none of these step descriptions are enough to earn profits with. To understand how to employ the metagame mindset to financial markets – and earn Order Flow Trading profits - you need a detailed guide for navigating each step.
Ultimately, that’s what this is designed to do.
However, before we get to the lessons that will help you learn the metagame mindset of Order Flow Trading, I feel I should warn you that this isn’t going to be an easy program. The subjects we are about to cover are often highly abstract and complicated.
In other words, this is not the type of program that can be skimmed. For it to have any value for you, you will need to study hard and think deeply about the things I am going to say. If you do that I know there is enough information here for you to reach your goals. But reaching those goals is entirely dependent on you. Take your time. Take it seriously. And by the end of this program, I promise you that you will not only have an intimate understanding of Order Flow Trading, you will possess the required skills to be a profitable Order Flow Trader.
Lesson Recap In this lesson, we learned that Order Flow Trading is a metagame analysis technique for exploiting the strategies of other market participants. To do it effectively requires 3 steps: learn the rules, determine your opponents strategy, and adapt your own strategy to exploit weaknesses in theirs.
That being said, let’s move on...
What is Market Microstructure? Market Microstructure is the study of how financial markets function. How they are constructed, how the price discovery process occurs, and ultimately, how parties exchange securities with each other.
Unless you are a hard-core nerd, you are most likely thinking that this sounds about as exciting as a migraine headache… and, I must admit that most of the literature on the subject will likely give you one. But, don’t let yourself be frightened off as there is real tangible value in a detailed study of the subject. In fact, I fervently believe that by the end of this program, you will see it as the most fascinating and important subject a speculative investor can study.
Really? Fascinating and important? In a word, yes! You’ll find that it leads to the discovery of market inefficiencies and, as we will learn shortly, enterprising speculators can exploit these inefficiencies for very large, highly consistent trading profits.
But, let’s not get ahead of ourselves. Before we can get into a discussion about market microstructure and the inefficiencies it can help us discover – and we are going to be

discussing this in great detail throughout the remainder of the program - we first need to establish a clear definition of terms.
If you have been studying financial markets for more than a few weeks, you are already familiar with these terms, but I would encourage you to read through this lesson anyway. Some of the terms we will be using carry a slightly different meaning within this program then is commonly understood. Skip this lesson and there is a good chance that things will become confusing later.
The Language of Microstructure There are four main components to market microstructure - Exchanges, Exchange Rules, Participants, and Orders.
Exchanges An exchange is any location where at least two participants can come together to exchange securities.
The term “securities” will appear frequently in this program because, even though we are predominantly concerned with currencies exchanged through the Forex market, many of the concepts and principles you are going to learn can be directly applied to all financial markets. If the term currencies is used too obsessively, it could dramatically limit the scope of your understanding and as a result limit the value you should get from what you are about to read.
Getting back to the topic at hand, there will be times when anyone desiring to trade in a particular security will be required to come together on a single exchange like the NYSE or CME. This is by no means a requirement.
Foreign exchange trades Over the Counter (OTC); meaning that there is no “central” exchange where traders come together. Each participant is free to trade anywhere and everywhere, so long as they can find a willing counterparty for their trade.
This has created some confusion on the part of aspiring speculators by leading them to assume that there are no exchanges in spot Forex. In reality, there are hundreds, if not
thousands, of spot Forex exchanges around the world. Every location where people come together to trade, including retail firms, the local airport currency converter, a bank branch, or the interbank market platform EBS, are all considered individual exchanges.
Each exchange has its own rules, policies, and prices that participants on that exchange are required to accept in order to execute a trade. The one true commonality is that the securities (currencies) traded on each exchange are fundamentally identical.
Exchange Rules Each exchange has a number of rules that define how it will handle transactions. In some cases, these rules will be identical between all exchanges. However, more often than not, they will contain differences. It is important for a trader to understand, especially in the OTC Forex market, that opportunities and systems that work on one exchange may not work on another.
Exchanges generally fall into one of two operating models - broker, or dealer. The choice of model has a profound impact on the rule set that governs transactions conducted on that exchange.
Broker Model In the brokered model, the exchange provides access rights to a number of seat holders. Often these seat holders are brokerage firms. Seat holders are the only participants permitted to trade directly on the exchange and they must pay a small per-trade commission to the exchange for each transaction.
Brokerages then resell their access to their clients. This allows the clients to execute trades using the brokers name with the exchange. Note though, that the brokerage charges a higher per transaction commission in order to pay the exchange its fee and to earn a profit.
On brokered exchanges, the matching of transactions occurs on an “order-driven” basis. In short, order-driven matching rules dictate that the matching of all transactions occurs against the best bid and offer available. For example, if Trader A places a limit buy order between the spread, it will become the new best price. Market

orders will match against the best price, so, in this scenario, if Trader B were to place a market sell order, the exchange would match it with participant A’s limit buy.
In the OTC Forex Market, this model is employed by most of the institutional Electronic Communication Networks (ECNs).
The big advantage of this model is that it allows all market participants to trade directly with each other. Trader A can trade directly with Trader B, which results in a more accurate reflection of prices and liquidity for the securities traded. Additionally, traders are able to reduce the size of the spread they pay on transactions and as such are able to lower their transaction costs.
The downside for Brokered Exchanges is that available liquidity at each price point is finite. If very few participants want to trade at a particular price, it may not be possible to fill an order without slipping prices. (There are also tax consequences, but that is outside the scope of the discussion.)
Dealer Model Dealer model exchanges are altogether different. In a dealer model, a single dealer will provide all the liquidity for an exchange. Anyone can trade on the exchange, but participants are not permitted to trade with each other. By defining a fixed spread between the bid and ask rates the dealer will transact at, each matched transaction will provide the dealer with a small profit. And because the exchange operator earns a profit from the spread, there is no need to charge a commission for each transaction.
Dealer exchange transactions are “quote-driven,” meaning participants must trade at the prices offered by a dealer or dealers. On quote driven exchanges, a market sell order from the previous example would have gone right past the first participants limit order and been filled by the dealers bid. An order would only be filled if (or when) the dealer’s limit ask price moved to the rate our hypothetical participant placed his order at. Both traders had to pay the full spread and their trading costs were higher as a result.
The majority of retail Forex firms operate on this model.

There are some real advantages to this model, including the lack of tax-disadvantaged commissions, ease of access for participants with limited capital, and the ability to engage in medium- to large-size transactions during thin market conditions without slipping prices.
However, the disadvantages are numerous. First, all participants are required to deal with a single dealer. This creates a real opportunity for that dealer to engage in abusive practices. Fortunately, most of the dealers operating these exchanges are reputable, but it is critically important for speculators to conduct due diligence before transacting business with them - just to be sure.
A number of other disadvantages occur because the dealer cannot reasonably expect to match all of its client’s trades internally. In normal market conditions, prices are perpetually changing and there will often be more traders participating on one side of the market rather than the other. This opens the dealer up to substantial portfolio risk because the net exposure he is holding will fluctuate in value as prices change. To offset this risk, the dealer will hedge his net exposure on another exchange.
In order to accomplish this, the dealer must shade its prices by a pip or two. That way, when disequilibrium occurs, the dealer can bring its book back into balance without suffering any reduction in profits. This is obviously good for them, but it leads to higher trading costs for participants.
This disequilibrium risk also forces dealers to widen their spreads dramatically during news events when it can become difficult to hedge their exposure. Consequently, event trading on dealer exchanges is all but impossible.
This is all common knowledge, but it is important that we review it because many of the strategies and tactics we are about to cover will only be viable on one of the two models. Furthermore, while we have covered the basic differences between exchanges, we have only begun to scratch the subject’s surface. Most exchanges have hundreds of pages of rules, policies, and procedures covering every conceivable aspect of trading activity and the content of those pages will have a substantial impact on the microstructure of the exchange.
Participants

The people who want to transact securities are participants. There are many participant types but for the sake of simplicity, I have chosen to break them down by the role they play in the market.
Speculators Speculators seek to earn profits by accurately predicting future price changes. They generally fall into either the fundamental or technical categories we discussed earlier.
Dealers Dealers often operate their own exchanges and provide the liquidity for all participants transacting on it. They are, however, not limited to dealer-based exchanges. Many dealers participate on order driven exchanges and in fact are sometimes the largest liquidity providers on them. The difference is that on order driven exchanges they must compete with all other participants to offer the best price. Regardless of this difference, all dealers seek to earn a profit from the spread between buy and sell rates and will hedge any net exposure that develops in order to eliminate portfolio risk. In general, dealers have limited impact on prices because they hedge all their net exposures.
Brokers Brokers earn commissions from their clients in exchange for permission to trade on order driven markets. Granted, the commissions they earn are small, but the ability to earn one on every transaction allows them to generate huge profits from volume. Furthermore, the profits they earn are nearly risk free so most brokers are more concerned with finding new clients rather than guessing the direction of the next swing in prices. Because of this, they tend to avoid taking positions. And, by not taking on positions, they have zero capacity to impact prices. The long and short of this is that their behavior is functionally invisible to other market participants.
Commercial Hedgers Commercials are the importers/exporters that utilize the currency markets primarily to hedge and settle their everyday international business transactions. Many of these companies generate billions of dollars each quarter in international sales and need to convert the proceeds into their home currency. Usually they have a specific exchange rate that they have built their profit projections on and, provided they can meet or exceed that rate, they are content to transact their business in a small price range.

However, depending on the size of the company and what objective they’re trying to accomplish, they can occasionally have a significant impact on the market.
Sovereign Entities Sovereign entities are the 800-pound gorilla in the currency markets. Mostly they prefer to let markets function as other participants see fit. But if speculative exuberance or economic conditions lead to large swings in currency values they can attack with ferocious impact. Sometimes these entities can allocate hundreds of billions of dollars to a price defense or reserve diversification effort and you can be sure that prices will swing wildly as a result.
Exchange Orders The basic unit of an exchange is the order. Participants wishing to transact a security must place an order with an exchange. There are a number of different order types and each one is designed to accomplish the acquisition or distribution of securities in a specific way. Liquidity is inextricably intertwined with the concept of orders. Liquidity represents the ability for any market participant to get an order filled. Each order type has a distinct impact on the amount of liquidity available at each price point.
Market orders Market orders are the simplest to understand because they contain the least amount of information. In essence, a market order is an order saying, “I want to execute a trade in the specified security, up to a defined quantity of those securities, as soon as possible.”
What is notably missing from this list of properties is the pricing information. In essence, the order issuer has agreed to trade at the best price he can get, so long as it’s done right now. We’ll get to pricing issues in a moment, but for now I want to point out the impact on liquidity.
Market orders demand immediacy of execution. This immediacy has the effect of reducing the existing liquidity in the marketplace by consuming other orders that were available to be filled. This is important to understand because prices only change when the amount of liquidity at the current price is eliminated. As a result, the execution of a market order is the primary mechanism by which prices change.

Limit Orders A limit order is an order to buy or sell a security at a specific price or better. A buy limit order can only be executed at the limit price or lower, and a sell limit order can only be executed at the limit price or higher. There is no guarantee that a limit order will execute because it will only fill if the securities market price reaches the limit price. While limit orders do not guarantee execution, they help ensure that a trader does not pay more than a pre-determined price for a security.
In modern financial markets, the limit order is the foundation upon which all market activity is constructed. Generally, unless there is both a standing limit to buy (the bid) and a standing limit to sell (the ask), there are no reference points from which to determine the current price. ECN’s and other electronic trading platforms rely on limit orders to define the second by second price level as they are the primary store of market liquidity. Limit orders provide liquidity to the market by offering anyone willing to pay the specified price the ability to execute their trade.
Stop Orders A stop order, also referred to as stop-loss or stop-limit orders, is similar to a limit order in that it is an order to buy or sell a security once the price of that security reaches a specified price. However, unlike a limit order, when the stop price is reached, a stop order becomes a market order.
Buy stop orders are entered at a price above the current market rate. Traders generally use a buy stop order to limit a loss or to protect a profit on a trade when they have sold short but they can also be used to enter a long position above the current market rate.
Sell stop orders are entered at a stop price below the current market price. Traders generally use a sell stop order to limit a loss or to protect a profit on a trade where they are long a security but they can also be used to enter a short position below the current market rate.
Stop orders are unique in that they share attributes of both market and limit orders. They offer liquidity to the market as resting orders available for execution. They also affect price change by consuming liquidity when converted to market orders upon execution. This dual nature of stop loss orders creates a vast array of exploitable inefficiencies in the market that clever speculators can exploit.

Some Additional Terms While we are on the subject of definitions, let’s take a few minutes to discuss the subject of value. Value can mean many different things depending on the situation. Because we will be using it in many of our examples and lessons, I think it would be helpful if we have a consistent way to differentiate which type of value we are discussing.
Following are three different forms of value - Current, True and Perceived.
Current Value Current Value is simply the current price at which a security is trading.
True Value In the realm of academia, something called the Efficient Market Hypothesis has gained widespread acceptance as a factually accurate depiction of the nature of financial markets. We are going to discuss this hypothesis in detail later in the program, but for now, all you need to know is that it operates on the premise that a securities price and its “informationally efficient fundamental value” are perpetually in alignment.
You are probably thinking, “informationally efficient fundamental value”? What the heck is that? Well, the long and short of it is that every security has an “intrinsic” value based on all the known and knowable information. In other words, if someone could acquire and digest ALL the known information about a security, and process it perfectly, they would be able to derive what a security is truly worth.
True Value is merely a smaller and easier term that we will use to describe the informationally efficient fundamental value of a security.
Perceived Value Perceived value is simply what traders THINK a security’s True Value is. It is impossible to know True Value as no one can access or process all the known or knowable information about a security. However, that doesn’t stop participants from working with the information they have to come with their own estimation of what the True Value is. Therefore, when we use the term perceived value, what we really mean is the market participants’ estimation of a security’s True Value.
Lesson Recap In this Lesson, we learned that there are four main components to market microstructure, and explored some of the details of those components. We also defined three forms of value that will, hopefully, make the discussions to come easier to understand.
As I mentioned at the beginning of the lesson, it was necessary to get this out of the way before we move forward because some of the terms we will be using have a slightly different meaning then is commonly understood. Now that we have that box checked, we can move on to more interesting and valuable information!
Forex Market Structure Most of Market Microstructure analysis focuses on the microscopic level of exchange mechanics. Here is where we find the meat and potatoes of Order Flow Trading. But first, let’s put things in the proper context by starting at the exchange level and working our way down to the details.
The Forex market is fundamentally different from a centralized exchange like the New York Stock Exchange or Chicago Board of Trade. In traditional stock and commodity exchanges, anyone wishing to trade a particular stock or commodity must do so on a centralized exchange. In the “over the counter” (or OTC) Forex market, there is no central exchange and participants are free to transact anywhere they can find a willing counterparty.
This little fact makes understanding the structure of the Forex market difficult. In turn, this has caused a great deal of confusion for aspiring order flow traders. In this chapter, we going to examine the structure and learn why many of the truths aspiring traders cling to are actually no such thing.
To begin this analysis, we need to recall that dealers operate many of the exchanges that exist in Forex. These dealers maintain their own book of business and seek to keep the net long and short positions they hold in balance. When the book is unbalanced due to more participants wishing to trade in one direction over another, it creates a substantial risk for the dealer. In turn, the dealer will seek to hedge that risk

on another exchange. This basic fact alone has created a multi-tiered market structure for foreign exchange.
Tier 1: The Interbank The top tier of the Forex market is commonly referred to as the Interbank. Contrary to popular belief, the Interbank is not an exchange in the traditional sense. Rather, it is a collection of communication agreements between the world’s largest money center banks.
Understanding the structure of the Interbank market is going to be easier to grasp by way of analogy. For example, consider an office (or maybe even someone’s home) that has multiple computers connected via a network cable. Each computer operates independently of the others until it needs something that exists on another computer. At that point, it will contact the other computer and request access to the necessary resource. If the computer is working properly and its owner has given the requester authorization to do so, the resource can be accessed and the initiating computers request can be fulfilled. By substituting computers for banks and resources for currency, you can easily grasp the relationships that exist on the Interbank.
The problem with a computer network like this is that, without a central server to keep track of who has what resources, it can be very difficult to find something when you need it. The same issue exists on the Interbank market, but with prices and currency inventory instead of files and printers. A bank in Singapore may only rarely transact business with a company that needs to exchange some Brazilian Real (the currency of Brazil) and it can be very difficult to establish what a proper exchange rate should be.
EBS and Reuters (hereafter EBS) established their services to solve this problem.
Layered on top (in a manner of speaking) of the Interbank communication links, the EBS service enables banks to see how much and at what prices all the Interbank members are willing to transact. As we defined earlier, EBS is an exchange because it allows all these participants to come together and exchange securities under a defined set of rules, but it really is quite different from the NYSE or CBOT.

On the NYSE and CBOT all transactions are centrally cleared. In short, this means that every transaction that occurs on the exchange will be routed through an independent third party for settlement.
Pretend for a moment that trader A buys 10 shares of Verizon stock from trader B on the NYSE. Traders A and B are on opposite sides of the country. They have never met and likely never will. How can trader A feel confident that he will actually receive his shares from B? And, how can B be certain he will receive the cash from A? In our world where electronic exchanges and instant transfers are commonplace, this may seem like an irrelevant concept. But the fact is that there is still some level of trust required on the part of both traders as it still takes time for funds to clear a bank and stock certificates to travel through the mail.
In an effort to improve the efficiency of the exchange and the confidence of its participants, just about all of the modern exchanges utilize a central clearing authority.
A central clearing authority acts as an intermediary between traders A and B, guaranteeing that both parties receive what they agreed to on the exchange. This eliminates the concern parties on the exchange might have about transacting with people they don’t know and leads to improved liquidity and lowered transaction costs.
The OTC market, of which EBS is a part, lacks this central clearing authority and because of this it is necessary for participants to determine the trustworthiness of the people with which they choose to transact. Fundamentally, that is what the communication agreements participants on the Interbank market establish are for. Within these agreements are rights and obligations for either party to produce financial statements and/or post margin, in order for both parties to be confident that transactions executed over EBS will be settled as agreed.
Tier 2: Intra-Bank Markets The second tier of the market exists essentially within each individual bank (or intra-bank). By calling the local Bank of America branch, one can exchange any foreign currency they want. More than likely the bank will just move some excess currency from one branch to another. Since this is a dealer exchange with a single counterparty, anyone transacting on this exchange is at the banks mercy as to what exchange rate

will be quoted. The only choice is to accept their offer or shop a different bank. And more often than not, the pricing they offer isn’t very good…
Banks are in the business of collecting spreads. We are going to talk more about spreads in the next chapter, but the long and short of it is that a spread is a discount to current value. For example, if the current value of EUR/USD on the interbank is 1.4000, the bank would “discount” that by charging a 4-500 pip spread. In other words, if you want to exchange some Euros for US Dollars, even though it’s trading at 1.4000 on the interbank, the bank is only going to give you $1.3600 for each Euro. They will then pocket the difference as a fee for exchanging your money.
Tier 3: The Retail Markets Branching off this second tier is the third tier retail market. When brokers like Oanda, Forex.com, FXCM, etc. desire to establish a retail operation the first thing they need is a liquidity-providing bank. This bank will agree to provide liquidity if and only if they can hedge it on EBS inclusive of their desired spread. Because the volume will be significantly higher than a single bank patron will transact, the spreads will be much more competitive. But, by no means should it be expected that these tier 3 providers will be quoting precisely what exists on the Interbank. Remember, the liquidity provider is in the business of collecting spreads and no agreement is going to suspend that priority. Retail Forex dealing is almost akin to running a casino. The majority of the dealers’ customers have zero understanding of how to trade effectively. As a result, most are consistent losers. The spread system combined with a standard probability distribution of returns gives the dealer a built-in house advantage of a few percentage points. So just like the casinos in Las Vegas, they have all built internal order matching systems that play one loser off against a winner and collect the spread. On the occasions when disequilibrium exists within the internal order book, the dealer hedges any exposure with their tier 2 liquidity provider.
As bad as this sounds, there are significant advantages for speculators that choose to trade with these retail dealers. Because it’s an internal order book, retail dealers can provide many features that are unavailable when trading on traditional exchanges. Non-standard contract sizes, high leverage on tiny account balances, and the ability to transact in a commission-free environment are just a few examples.

An Electronic Communications Network (or ECN) operates similar to a Tier 2 bank, but still exists on the third tier. An ECN will generally establish agreements with several tier 2 banks for liquidity. However, instead of matching orders internally, it will just pass through the quotes from the banks to be traded on, as is. That makes it sort of an EBS for the little guys. There are many advantages to the model, but it is still not the Interbank. The banks are going to make their spread or they’re not going to waste their time. Depending on the bank, this will take the form of price shading or widened spreads.
For its trouble, the ECN collects a commission on each transaction.
One extremely important distinction between the traditional retail firm exchange and an ECN like Currenex or FxAll, is that true ECNs are almost always order-based exchanges. Throughout the remainder of this program, we will be focusing on tactics and strategies that can be employed on both quote and order based exchanges. However, as you progress through your career as an order flow trader, you will find that some opportunities only manifest themselves on a particular exchange type. If you try to capture them on the wrong type of exchange, it’s going to end badly. Something to keep in mind…
Exchange Interaction Liquidity distribution across the OTC Forex market takes on some interesting characteristics. The best way to visualize these characteristics is to model how a hypothetical transaction would occur in the real world. With that in mind, pretend that Deutsche Bank has a client, BMW, who needs to convert $200m US Dollars to Euros.
This is a rather large order, so we can safely assume that someone at BMW will call up his representative at Deutsche Bank in order to execute the trade. In the call, the BMW agent will explain how much they want to sell and at what price they are looking to get. For the sake of simplicity, let’s just say that they will accept the current price.
Deutsche Bank will accept this trade and affect a forward deliverable with BMW.

A forward deliverable is basically an agreement between the two parties to exchange one currency for another on some future date. It is not important that you understand what that means though. I only mention it because I am trying to make this example as realistic as possible…
Anyway, after executing the forward deliverable contract, Deutsche Bank is holding a $200m short EUR/USD position. This is not a good position for them to be in because any rise in the Euro will eat into their profits on the trade. To get this position hedged, they will need to make a $200m EUR/USD buy from someone.
Deutsche Bank operates its own exchange. Technically, they operate multiple exchanges, but let’s keep it simple. In order to get the buy order executed, they will place a limit buy order on their local exchange in the hopes that one of their many customers will take over the risk.
This would work out nice for them, as it would allow them to capture the complete spread. But, a $200m position represents $20k per pip in risk. The sooner they can get the position hedged, the better. With that in mind, they will simultaneously place a $200m limit buy order onto EBS.
With the order now available on EBS, any bank holding a counterparty agreement with Deutsche Bank can hit that bid and complete the trade. In all likelihood, someone would. But I am trying to make a point, so let’s assume that Deutsche is the only interbank party with position exposure.
That being the case, combined with the lack of Deutsche Bank’s internal customers desiring to take the trade, some effort needs to be made to find a willing counterparty in the lower tiers. For that to happen, one of Deutsche Bank’s interbank counterparties must “show” the limit buy to their customers.
To solidify this concept, let’s assume that UBS has a counterparty agreement with Deutsche Bank and that they have liquidity agreements with Oanda (a retail Forex firm), a Currenex Brokerage firm, and Man Financial (a large institutional brokerage firm). UBS can safely “show” the $200m limit buy to Oanda, Currenex, and Man Financial, knowing that if any of them hit the order, it can be instantly hedged on EBS.

Oanda, the Currenex Broker, and Man Financial are either brokers or dealers and as such have no desire to hold the position themselves. On the other hand though, because UBS is showing them a $200m limit buy, there is little risk in them offering that same liquidity to their customers. And, this is precisely what UBS hopes will happen.
Now, the interesting part of this is that even though there is really only $200m in available liquidity, if you could step back and see all the exchanges at one time, you would notice $1 billion in notional liquidity offered. And, this is only in looking at the small slice of the market we have outlined. In reality, there are hundreds of banks on the Interbank, and all of them could be offering the same $200m to their clients. Figure 3.1 is a graphic representation of the process we outlined.
Figure 3.1: Shows how a single offer to trade is aggregated to multiple exchanges
A more interesting situation occurs because many of the ECN’s utilize multiple liquidity providers. The result is that there are frequently situations where two or more of these liquidity providers will show this same liquidity on a particular exchange. Therefore, if UBS and Deutsche Bank are both providing liquidity to Currenex, Currenex participants could see $400m in notional liquidity from this single $200m order from BMW.
The Fallacy of the $5 Trillion Market

Everyone bandies about the “$5 trillion per day”, “most liquid market in the world”, never realizing that the vast majority of the transactions are nothing more than risk being laid off from one tier to another. To illustrate this, let’s have a speculator on Currenex take that $200m buy limit and follow the hedging process back to Deutsche Bank.
As noted, Deutsche Bank took the deliverable forward trade with BMW. This trade counted as $200m in notional transaction volume. When the Currenex speculator hits the limit order offered by UBS, it counts as another $200m in notional volume. UBS was simply offering the same liquidity it saw on EBS, so it immediately hedges with Deutsche Bank’s $200m limit on EBS. That makes $600m in notional volume. In reality, all that happened was the Currenex speculator made a trade with BWM. We can see the relationship of these transactions in Figure 3.2.
Figure 3.2:Shows how intermarket hedging consumes liquidity
The long and short of this is that: A) transaction volumes appear much higher than they actually are; and B) there appears to be far more liquidity then there actually is. This is important because (as we will see in chapter 7) low liquidity leads to slippage and slippage has a direct impact on the profitability of a trading system.
Lesson Recap

In this lesson, we learned that the Forex market is actually a collection of many different exchanges, and that the way participants transfer risk organizes the exchanges into a number of tiers. None of this is earth-shattering information. And, if you have been around the Forex market for a while, you are probably already quite familiar with it.
The important takeaway is that when you analyze the structure, you realize that there is far less liquidity and “true” transaction volume then would be expected based on the available statistics. We are going to explore all the ramifications of that realization later in the program, but first we need to dig into the heart of microstructure to answer the question of “why prices change”. And that’s the next lesson!
Price Change Mechanics Understanding how liquidity and transactions flow between the various exchanges is important. But sadly, the complexity it introduces also makes any reasonable discussion about the mechanics of price change very difficult to grasp.
To get around that problem, one has to realize that there are embedded incentives for the transaction intermediaries to maintain limited exposures. Therefore, we can conceptually distill the OTC Forex market into a single exchange. In other words, instead of considering that each trade will go from trader A, to their broker, to the tier 2 bank, to EBS, and back down again to find a willing counter party, we can just say that 2 traders (regardless of where they might be in the system) will exchange securities. Along the way, the various intermediaries will cancel each other out for zero net impact on price.
That will help us simplify this discussion, but we still have another problem. Because there are so many moving parts, looking at price change within the context of an existing market is extremely complex. All those parts make it hard to identify exactly what part is causing what effect. We must separate the two. If we don’t, it will be nearly impossible to learn the necessary lessons we will need in order to identify the market inefficiencies we are after.
Back when I was learning all this stuff, I suffered for a long time with this complexity problem and had to find a way to get around it. I decided to simplify market

interactions down to one security, and three participants. Once I did that, it became very easy to puzzle out how all the different microstructure processes work.
Since I fail to see any need to reinvent the wheel, I am going to set up a little theoretical market with the same parameters. Once we have that in place, we will begin our exploration of price change.
The Security Assuming you read babypips.com, like I suggested in the Introduction, you already know that foreign exchange securities represent the relative value of two countries monetary units. Therefore, if we are going to create a virtual currency pair, we first need to define two imaginary countries within which the monetary units will be used.
Country 1: The Sun Republic o Population: 10 million o Primary Exports: Industrial Metals, o Textiles, and Consumer Electronics o Political Environment: Pure form laissez faire o capitalism. Small Government o Effective Tax rate: 10% o Currency Name: Sunbuck o Currency Code: SUN Country 2: The Peoples Democratic Republic of Moon o Population: 10 million o Primary Exports: Machine Tools, Aircraft, and Automobiles o Political Environment: Socialist Economic Policy. Large Entitlement State o Effective Tax rate: 65% o Currency Name: Moonbuck o Currency Code: MOO For the sake of simplicity, let’s assume that Sunbucks and Moonbucks are only traded on a single exchange and that the security is quoted as SUN/MOO. Let’s also assume that the initial exchange rate for SUN/MOO is 1.000. In other words, one Sunbuck is equal to one Moonbuck.
The Participants

First, you might wonder why we need three participants. After all, when most people think about a transaction they see only a buyer and a seller. The fact is, while transactions on Main Street only need two participants, modern financial markets need three: the buyer, the seller, and the third participant who the buyer and/or seller (depending on whether they have an open position or not) assume will allow them to close their positions.
This is not only important for our pending discussion, but you need to commit the premise to memory because it will likely save you a great deal of cash someday. Every asset bubble in the history of the world has been predicated on the assumption that a third participant would be there to take the other side of a trade. Every market implosion in the history of the world occurred precisely because that third participant failed to materialize. If the buyers at the peak of any bubble had taken a minute to consider who was left to take the other side of their closing trade, they might not have been the ones left holding the bag.
Anyway, as I said, we need three participants.
Participant 1: Frank Frank is a full time financial market speculator. He knows his stuff when it comes to fundamental analysis and has been doing it profitably for many years. As a result, he has a substantial trading account and can easily move prices if he chooses to.
Participant 2: Jane Jane is also a full time, fundamentally based financial market speculator. She hasn’t been trading as long as Frank, but in her short career, she has managed to accumulate a substantial trading stake. The size of her account is also sufficiently large enough to alter pricing when necessary.
Participant 3: Tom Tom is an aspiring technical trader. He recently inherited a sizable chunk of cash from a relative and has decided to use the money to pursue his dream of becoming a full-time speculator. He has not been around the market for long, but has done a fair amount of research and knows what he should do in a wide range of situations.

Now that we have our security and our participants, we can set about the task of analyzing the many important lessons that a study of market microstructure has to offer.
An Exploration of Price Change Frank and Jane have done their analysis of the two countries. However, they categorically disagree on the true value of SUN/MOO. Frank thinks that the laissez faire regulatory structure in Sun makes for a substantially better investment climate than Moon and because of this, puts the SUN/MOO fundamental value at 1.500. Jane on the other hand, thinks that the Moon government’s socialized medicine program will produce happier and more efficient employees, which will increase productivity, negating the tax advantages found in Sun. She thinks that 1.000 is a fair price for SUN/MOO.
Tom doesn’t have an opinion about fundamental value and doesn’t concern himself with such things. As far as Tom knows, all value information is contained in the price chart. What he’s looking for is some form of pattern or a signal on one of his many indicators. Right now, there are none to be found and as such, he has no interest in trading.
From Frank’s perspective, there is a real opportunity for profit here. If he is right, he is looking at a 50% return on his money (unleveraged).
As you can imagine, this analysis makes him very excited to buy at these levels.
Frank has a problem though. For him to buy at 1.000 there has to be someone willing to sell him some SUN/MOO. Unfortunately at the moment, the only other trader in this market is Jane. And she thinks SUN/MOO is fairly valued at 1.000. What benefit would she gain by selling Frank SUN/MOO at 1.000 if she had no hope of earning a profit?
One could argue that six months from now things might change and Moon might outperform Sun, allowing fundamental value to move down to the 0.900 level. While that is true, it is also gambling. Jane is not a gambler - she is a fundamental speculator

and until her analysis tells her that there is an existing mispricing of fundamental value, she is not willing to trade.
If Frank wants to pick up some SUN/MOO on (what he considers) the cheap, he is going to need to offer Jane a price that she can earn a profit on. This is the purpose of the spread.
Contrary to popular belief, the spread is not some nonsensical creation cooked up by brokers or dealers to bilk unsuspecting speculators out of their money. It serves a legitimate purpose in financial markets by providing anyone willing to transact with a discount to current value.
If we assume for a second that everyone believes the true value of SUN/MOO is 1.000, nobody within the speculator community would be willing to transact at that price. There is no profit potential, so why bother?
Speculators need compensation for their efforts and the risks they take. That compensation comes in the form of a slight discount to the current price or, in other words, a spread between price and current value.
Anyways, after a quick chat in the trading pit, Jane agrees to sell one contract of SUN/MOO to Frank at 1.050.
Obviously, Frank would have preferred to pick up SUN/MOO at 1.000, but with his assessment of fair value at 1.500, he still received a substantial discount.
Jane feels good about her trade too. In her eyes, she just picked up a risk free 50 pips - assuming she can find someone to take it off her hands at 1.000. With that objective in mind, Jane places a limit buy order at 1.000.
Figure 4.1 is a representation of what has gone on so far.

Figure 4.1: A depth of market representing Jane's offers to buy and sell
With Jane agreeing to sell at 1.050 and to buy at 1.000, she is effectively “making the market.” It would behoove you to notice the dashed line between the bid and ask prices Jane is offering. This is the “current value” (as we defined it back in Lesson 1) and in this scenario, it is 1.025.
So far, we have assumed that everyone wanted to trade just one contract. In reality, Frank wants to buy as many contracts as possible, up to a price of 1.500. Jane is willing to sell as many contracts as the market will support, so long as they are willing to offer her more then 1.000.
To give this reality a reference point in our example, let’s pretend that Frank has the ability to transact 75 contracts of SUN/MOO and Jane can transact up to 50. If Jane allocates all her capital to limit sell orders at 1.050, and Frank has more capital, what would happen to price when Frank consumes all of the contracts Jane offers?
If your answer was that current value would move higher, give yourself a gold star.
If you didn’t know the correct answer, you will need to pay particularly close attention to the next few paragraphs because this is the central point of this lesson and the foundation of all things microstructure-related.
Current value – which is more commonly referred to as price - shifted higher because the limit orders Jane was offering at the bid and ask were the best bid and ask available. When Frank’s market order consumed all Jane’s limit orders at the ask rate, it caused the ask rate to move higher. By definition, current value is the midpoint between the best bid and ask, so if you change the ask rate, you have to recalculate current value to account for the change. Therefore, as the ask rate moves higher, current value will move higher as well.
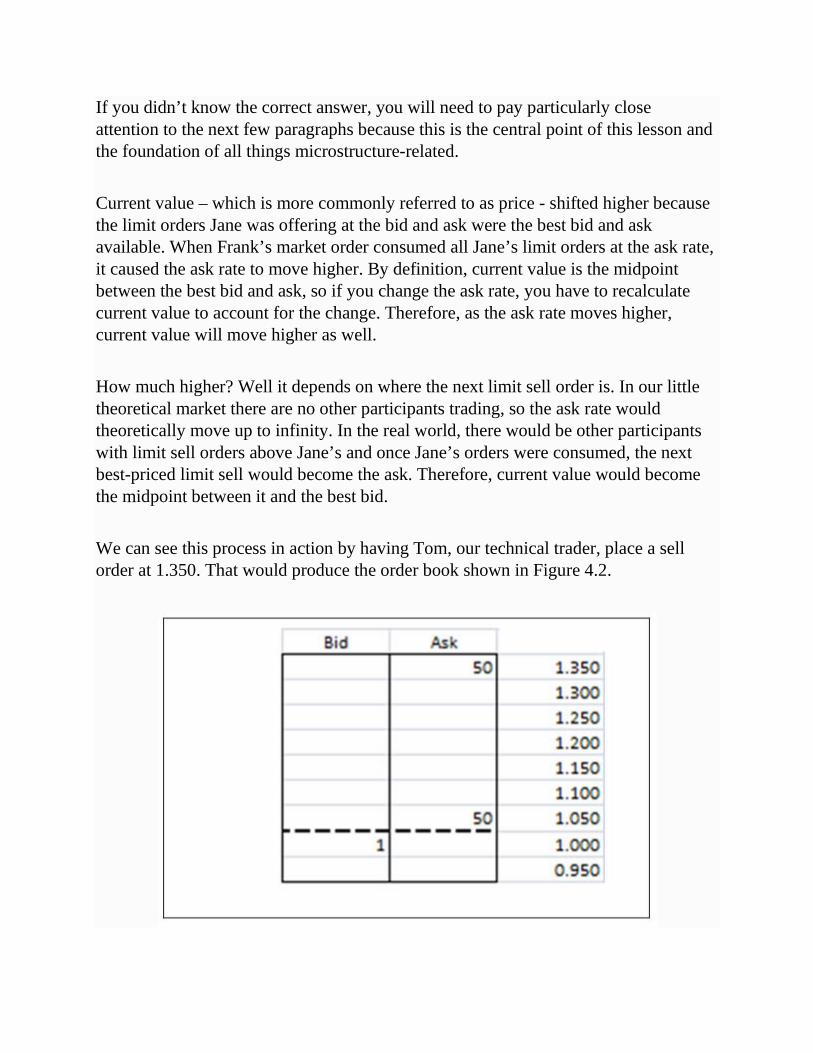
How much higher? Well it depends on where the next limit sell order is. In our little theoretical market there are no other participants trading, so the ask rate would theoretically move up to infinity. In the real world, there would be other participants with limit sell orders above Jane’s and once Jane’s orders were consumed, the next best-priced limit sell would become the ask. Therefore, current value would become the midpoint between it and the best bid.
We can see this process in action by having Tom, our technical trader, place a sell order at 1.350. That would produce the order book shown in Figure 4.2.
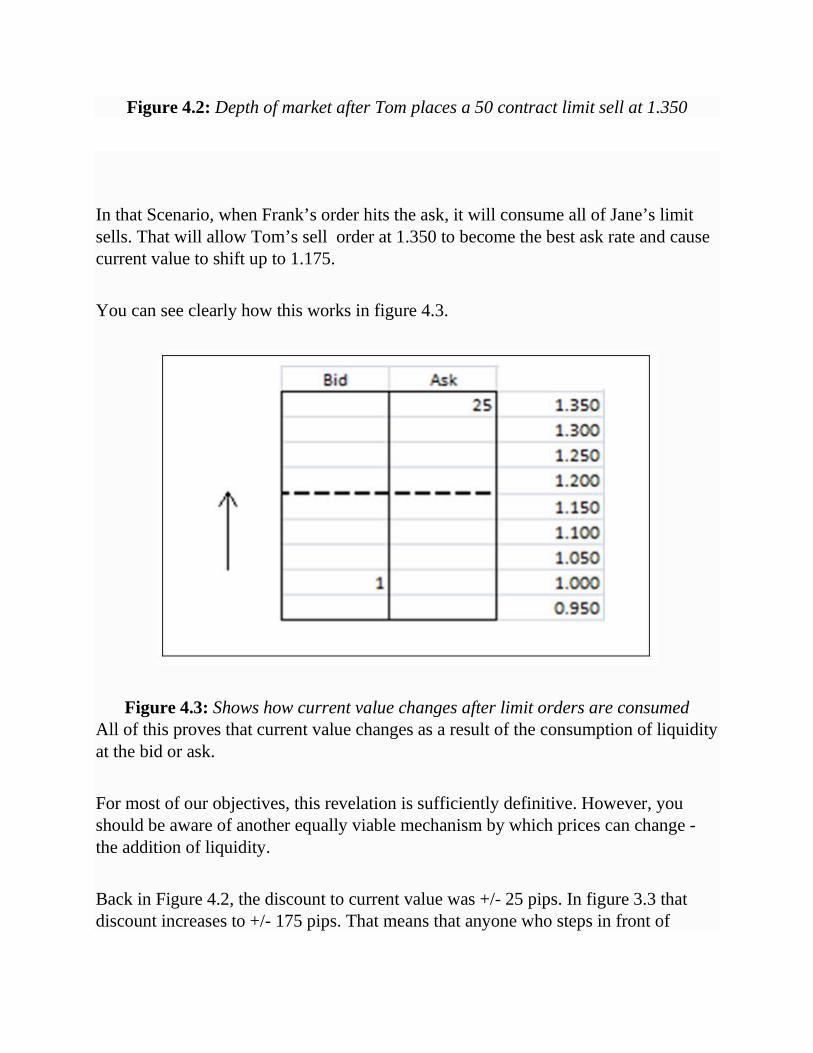
Figure 4.2: Depth of market after Tom places a 50 contract limit sell at 1.350
In that Scenario, when Frank’s order hits the ask, it will consume all of Jane’s limit sells. That will allow Tom’s sell order at 1.350 to become the best ask rate and cause current value to shift up to 1.175.
You can see clearly how this works in figure 4.3.
Figure 4.3: Shows how current value changes after limit orders are consumed All of this proves that current value changes as a result of the consumption of liquidity at the bid or ask.
For most of our objectives, this revelation is sufficiently definitive. However, you should be aware of another equally viable mechanism by which prices can change - the addition of liquidity.
Back in Figure 4.2, the discount to current value was +/- 25 pips. In figure 3.3 that discount increases to +/- 175 pips. That means that anyone who steps in front of

Jane’s 1.000 limit buy or Toms 1.350 limit sell stands to acquire a highly advantageous position.
To see why that position would be advantageous, you must first understand that most traders do not think in terms of bid/ask rates. If you were to ask 100 traders for a price on EUR/USD, 99 of them would quote you current value. This is mainly because that’s the rate they are seeing everywhere they turn. Their price charts are constructed with it, all the cable news programs quote it, and for the most part, it’s just easier to think in terms of a single figure. If 99% of traders are thinking in terms of current value, they are going to consider any price above or below it to be advantageous.
In other words, any position a trader can capture above or below current value is going to seem like a good deal because they think in terms of current value. So, as a result, when a large discount develops, many traders are going to feel compelled to step in front of the existing limits in order to capture the opportunity.
In our little theoretical market, there are no more participants to work with, but in the real world a discount of this size would surely compel additional participants to step in. When they do, the bid and ask will change and alter current value in the process. We can see the impact in Figure 4.4.

Figure 4.4: Shows how current value changes as limit orders are entered between the spread
This proves that prices can also change when liquidity is added between the bid and ask.
The key lesson you should take with you is that prices change as a result of fluctuations in liquidity at the bid and ask. When all the liquidity at one of them is consumed, price will change. Then when additional participants step in to capture the increased discount opportunity, it will change again.
This is important to understand because you cannot earn a profit as a speculator unless price changes in your favor after taking on a position. If you don’t understand why and how prices change, you have no hope of consistently entering positions that will benefit when it does.
Lesson Recap In this lesson, we established a theoretical market for the SUN/MOO currency pair. We are going to be using this theoretical market extensively throughout the remainder of our microstructure discussion, so it is important that you familiarize yourself with the details of the currency security and the participants who trade it.
After we established our theoretical market, we learned that modern financial markets require a minimum of three participants and that each of those participants needs a profit opportunity to take on the risks of trading.
The important take away from this lesson is that, prices change when participants execute orders. But lets move on...
The Liquidity Distribution Model In the previous lesson, we simplified the market down to its minimum required components. This was useful in helping us to learn the core mechanics of price change, but it has its limitations. The main limitation is that it does not scale very well to more than a handful of participants. If our objective is to eventually exploit inefficiencies in real world markets, we are going to need something a bit more powerful.

It goes without saying that if price change is the result of participant orders consuming all the available liquidity at a given price, then knowing the distribution of liquidity across a range of prices would be of paramount importance in any prediction of future price change.
Unfortunately, “knowing” how liquidity is distributed is impossible because very little of the actual order information is available for analysis.
Thankfully, speculators are not the only people who experience this problem. Practitioners in the realm of theoretical finance often have problems testing their hypotheses against real world markets because isolating specific cause and effect relationships within the chaos of price change is exceedingly difficult.
One of the more creative methods practitioners have developed to get around this problem is to construct a computer simulation where they can model various assumptions and hypothesis. The benefit of this approach is that all the data produced by the simulation is readily accessible, and so isolating the specific information needed to validate an idea is rather simple.
However, designing an artificial market is not as easy it may seem. Before one can test how their ideas might influence a market, it is necessary to develop a market that behaves in a realistic way.
There are literally thousands of different components in these models. And, the only way to know if the assumptions underlying those components are valid is if the behavior of the model conforms to the statistically observed properties of the real thing. When it accurately replicates those statistical properties, it’s a good bet that the underlying assumptions used in its construction are at least tangentially valid. If the model produces behavior that correlates poorly with those properties, there is a strong likelihood that the assumptions are false.
Now, I won’t delve into a detailed dissertation about market modeling because unless you plan to write academic papers, market modeling is a complete waste of time! What I will say is that even though there are a great many flawed assumptions that practitioners need to feed into these models to get them to perform properly, at this point they do tend to produce a realistic distribution of liquidity. And that is precisely what we need if we are going to discuss real world order flow.

After thousands of hours digging through complex formulas and haughty academic prose, I managed to derive what those liquidity distributions look like and I can sum it up for you in Figure 5.1.
Figure 5.1: The Liquidity Distribution Model There is a lot going on here, so let’s break it up into some constituent parts and discuss what each one is supposed to represent.
The first thing to notice is that there are numbers on the X and Y axes of the chart. The Y-axis (left side) is the number of contracts. The X-axis (bottom) is the different price points.
Directly in the center of the graph is the current price of the security.
Each column represents the total interest that exists at a particular price point.
Each column is comprised of some combination of four interest types. Those four interest types consist of MM orders, Pending Limit Orders, Technical Trader Orders, and, finally, Latent Demand Interest.
You may not be familiar with all of these terms, so let’s take a few minutes to examine what they are and why they exist.

MM Orders Starting from the centerline equilibrium value, note that there are two large columns labeled “MM.” These orders represent the bids and offers of the Market Makers participating in this particular security.
Pending Limit Orders If you have ever looked at a depth of market screen, you know that the majority of limit orders cluster close to the current price. As you move away from the current price, the quantity of those limit orders grows progressively smaller. The pending limit orders you see on this chart represents the actual limit orders that participants have placed into the market.
Technical Player Orders The big spikes scattered across the liquidity distribution represent the pending limit orders of technical traders. Technical traders, in the aggregate, tend to cluster their orders at specific price levels because those levels are readily identifiable on a price chart.
Latent Interest The final component represents latent order interest.
Latent order interest is simply an accounting of participants who can/will trade if price were to move to a specific price level. But, due to the costs associated with managing orders, remain on the sideline until it does.
An example of how this manifests itself in the real world would be to imagine that you are a fundamental trader with an analysis showing security A to be with 1.000. If price is currently hovering around 1.000, you likely have very little interest in participating in the market. However, if price suddenly moves down to .500 without a change in the underlying fundamentals, you are going to have a great deal of interest in buying. In essence, your desire to trade at .500 would be latent order interest.
Latent order interest is predominantly comprised of fundamental traders, so it tends to remain constant as long as the information related to fundamental value remains
unchanged. When new information becomes available, this curve will shift up or down to reflect the aggregate opinion of what that new information means for fundamental value.
Generally, however, the opinions formed by fundamental traders are slow to materialize. It may take a number of hours, or even days, for this new information to show up as a change in latent interest. In the interim, the latent demand curve will become somewhat wider and flatter due to the variability of interpretations regarding the data.
Price, Time, and Interest Type Interaction Our model of liquidity has a very clean and logical dispersion. But, bear in mind that this represents only a snapshot in time and, more consequentially, it shows a market in perfect equilibrium. In the real world, the interplay between these components will change as price moves and participants alter their opinions about the appropriateness of that change.
There are a number of basic premises, which underlie these interactions.
1) MM interest will remain fairly constant, regardless of what happens to price. As we know, dealers and market makers seek to earn a spread from traders by offering liquidity at the bid and ask. The expectation is that price will move against them often. They also know that it will move in their favor with near equal frequency. If they simply built up positions when price moves in one direction, and liquidate those positions as price reverses the other way, they can pocket the spread.
This strategy necessitates that the dealer or MM place their orders as close to the current price as possible. And given that the strategy is both high profit and low risk, there is a real incentive to offer as much liquidity at those prices as possible.
The net effect of all this is that MM orders will perpetually reside directly above and below current value, regardless of where it goes.

2) Latent interest will become pending interest as price proximity increases. This should be self-explanatory, but look at the following graphic that makes the point succinctly.
3) Pending interest will convert to Latent interest as price proximity decreases This is the exact opposite of premise #2.
4) Technical interest will remain fairly constant at specific price levels.
Most Technical Traders utilize Support/Resistance levels, 50- and 100-day moving averages, Fibonacci Projections, and/or some form of Trend Line. All of these tools produce specific price points where technical traders should place orders. In most instances, these price points will remain constant for an extended period and are easily identifiable on the price chart. Therefore, Technical Traders will frequently enter orders at the specified level as soon as they realize its existence and leave them there until executed.
The consequence is that orders will build up at these levels and remain there regardless of any changes in current value that may occur.
5) Latent interest will shift along with the perception of true value As mentioned previously, Latent interest is predominantly comprised of Fundamental Traders aiming to exploit a deviation from true value. That being the case, it is only logical to assume that any change in perceived value will alter the distribution of Latent interest as it changes.
Lesson Recap In this lesson, we discovered that the liquidity distribution model is an advanced tool for visualizing large numbers of market participants and modeling how they interact across time. We also learned that the model is comprised of four components including Market Maker (or MM) Orders, Technical Player Orders, Pending Limit Orders, and Latent Interest. And last, we explored how each component behaves in relation to changes in current and perceived value.
If you are having trouble grasping how this thing works or why we need it, don’t be alarmed - keep reading. In the next lesson, we will begin exploring how different market scenarios influence the model. Once you see it in action, all your questions about it will be answered.
Moreover, by the time you finish this program, you will wonder how you ever managed to trade without it!

Liquidity Distribution Model The liquidity model is a powerful tool for visualizing how price and liquidity interact. To appreciate its power you need to realize that the amount of liquidity at a price point, and the ease with which price change can occur, are inversely correlated.
To understand what this means, imagine for a second that we have a purely random market. Within this random market, we have a noticeable disequilibrium in the number of contracts available on either side of current value. Hypothetically speaking, let’s say there are 5 contracts on the bid and 13 on the ask.
In a purely random market, there is a 50-50 probability of the next order being either a buy or a sell. To keep it simple, let’s say that the size of that order can be anywhere between 1 contract and 100. From this, we can calculate the probability of the next price change.
To calculate the probability, we first need to realize that there are 200 possible direction/size combinations - 100 on the buy side + 100 on the sell. Additionally, on the buy side it will take an order of at least 13 contracts to consume the available liquidity and cause price to change. That means that of the 200 possible direction/size combinations, 87 of them have the ability to consume all the liquidity at the ask and shift prices higher. Therefore, we can calculate the probability of a move higher as:
87 / 200 = .435 or 43.5% On the sell side, only five contracts are required to move price lower. Following the same logic, we get:
95 / 200 = .475 or 47.5% What this tells us, all things being equal, is that price has a higher likelihood of changing in the direction of lower liquidity.
To see how disequilibrium like this might form, let’s revisit our friends Frank and Jane.
When we left them, Frank had just executed a 75-contract market buy order, which consumed all Jane’s limit order liquidity, and catapulted price higher.

Now that scenario may have been useful for understanding the mechanics of price change, but it was not very realistic. In the real world, there would be thousands of traders participating in a market for many different reasons.
It would be extremely complicated to try to detail even a small number of these participants individually. But thanks to our new liquidity model, we don’t have to. One of the strengths of working with a model like this is that it gives us a manageable way to understand how large numbers of traders would interact with each other by analyzing them in aggregate.
Now, imagine that there are a large number of participants in the SUN/MOO market. In aggregate, these participants believe that the current price of 1.000 is the correct fundamental value. To make it a little more realistic, we can also assume that there are a few key technical levels near the current price. Taken together, all these participants would produce the distribution shown in Figure 6.1
Figure 6.1: A focused view of the liquidity distribution model I‘ve taken the liberty of focusing in on a much smaller subset of the range here to make it easier to see what is happening. That doesn’t mean the rest of the distribution doesn’t exist, only that we have no need to look at it right now.
Now that we have our distribution, let’s re-run Frank’s 75 contract market buy order scenario and see what happens…

Figure 6.2 shows us what the distribution would look like the instant his order is completed.
Figure 6.2: Shows Frank's 75-contract market buy order consuming liquidity Once the order has been executed, we notice that several things have changed. Since this is the first scenario we’re examining, it is well worth taking a few minutes to discuss what each of those changes are and why things have played out the way they have.
The most obvious change that has occurred is that the offer price has shifted from 1.000 up to 1.008. What may not be evident is exactly why it moved to 1.008 instead of 1.006, as would be assumed by looking at the total interest on Figure 6.1. We need to look at the interim steps between the first figure and the second to understand the discrepancy.
In the first figure (6.1), there are five contracts offered by the market maker, and 10 by other participants in the form of pending interest at 1.000. If Frank executed 75 and there are only 15 here, 75-15= 65 and price shifts to the next price point of 1.001.
At 1.001, our original chart showed nine pending contracts, and one latent. Since our rules for the model say that latent interest will become pending interest as price moves closer, we would assume that the one latent would become pending once price eclipsed 1.000. Subsequently ten more of the contracts would fill as price changed to 1.002.
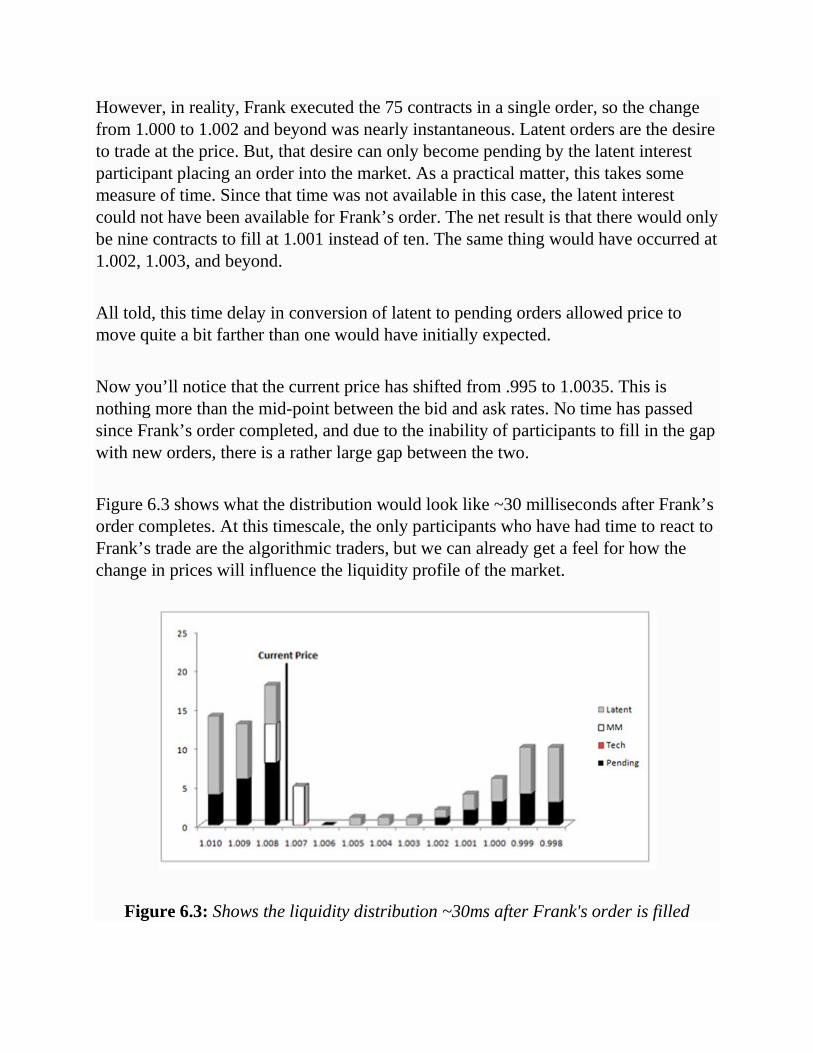
However, in reality, Frank executed the 75 contracts in a single order, so the change from 1.000 to 1.002 and beyond was nearly instantaneous. Latent orders are the desire to trade at the price. But, that desire can only become pending by the latent interest participant placing an order into the market. As a practical matter, this takes some measure of time. Since that time was not available in this case, the latent interest could not have been available for Frank’s order. The net result is that there would only be nine contracts to fill at 1.001 instead of ten. The same thing would have occurred at 1.002, 1.003, and beyond.
All told, this time delay in conversion of latent to pending orders allowed price to move quite a bit farther than one would have initially expected.
Now you’ll notice that the current price has shifted from .995 to 1.0035. This is nothing more than the mid-point between the bid and ask rates. No time has passed since Frank’s order completed, and due to the inability of participants to fill in the gap with new orders, there is a rather large gap between the two.
Figure 6.3 shows what the distribution would look like ~30 milliseconds after Frank’s order completes. At this timescale, the only participants who have had time to react to Frank’s trade are the algorithmic traders, but we can already get a feel for how the change in prices will influence the liquidity profile of the market.
Figure 6.3: Shows the liquidity distribution ~30ms after Frank's order is filled

In most cases, the first to react will be the Market Makers. Market makers are usually in close physical proximity to the exchange, so their algorithms experience the lowest execution latency. MM’s follow price change, so we can expect them to move their orders in accordance with the consumption of liquidity. As such, the MM bid will move to 1.007 with the offer at 1.008. With the bid rate moving to 1.007, current value shifts up to 1.0075.
The change in current value has induced some algorithmic participants to execute limit orders at .002, 001, and .000. It has also caught the attention of a number of other participants who now consider various prices within the gap to be a good place to buy a pullback.
It is important to note that these other participants take the form of Latent interest because they still need time to manually execute their orders.
Regardless, while all this is happening, the relationship between latent and pending interest is also changing. Participants are converting Pending orders at .999 and .998 to latent because price is moving away. Simultaneously, other participants are converting latent to pending at .008, .009, and .010 for the opposite reason.
Now here is where it starts to get interesting.
You’ll notice that behind this change in prices, there is still a large gap in the liquidity distribution.
This gap is important for you to notice because back in the beginning of this lesson we learned that, all things being equal, price has a higher likelihood of changing in the direction of lower liquidity. If you compare the quantity of contracts available on either side of current value, you can quite easily see that price will have a much easier time retracing the move then it will have trying to progress.
There is an important lesson to learn here, so please pay attention while I walk you through some calculations.

You can see in Figure 6.3 that a move from 1.0075 to 1.0080 – a move of 0.5 pips - would require 18 contracts. Using our probability distribution from earlier we can calculate the chance of that ½ pip move to be 41% ( 82 / 200 = .41 or 41%)
We can further see that it will only take five contracts to move price to 1.0065, which would be a move of one full pip. Probability? 95 / 200 = .475 or 47.5%
Now if you are a math nerd like me, that info is enough to get you pretty excited.
Unfortunately, most people don’t enjoy math, so let me phrase it in a slightly different context.
It takes 18 contracts to move current value 0.5 pips higher. We can equalize the probabilities by figuring out how big a move would occur on the downside with 18 contracts.
In the scenario we outline, there are:
o 5 contracts at 1.007. o 0 at 1.006 o 1 at 1.005 o 1 at 1.004 o 1 at 1.003 o 2 at 1.002 o 4 at 1.001 o 6 at 1.000 So if someone executed an 18-contract market sell order right now, the bid price would move to 1.000 (leaving two contracts on the bid). That would shift current value to 1.004 for a total of 3.5 pips.
What this all means is that there is a 41% chance of a 0.5 pip move higher. In addition, there is an identical 41% chance of a 3.5 pip move lower. Therefore, if you could manage to capture one of the contracts sitting at 1.007, your probability of losing 0.5 pips on the trade would be identical to gaining 3.5 pips.
That is a seven to one risk/reward ratio. And, it’s not even the whole story!

If you have been paying attention, you likely recall that back in figure 6.1, there were a number of latent interest contacts between 1.001 and 1.008. When Frank’s order hit the market, there wasn’t enough time for the latent order participants to execute anything so we disregarded them from our calculations of liquidity consumption. However, that does not mean they just disappeared!
In a situation like this, most of those latent orders will convert to market orders. The whole point of using a limit order is so that you can get in at a specified price or better. If price is already better than your specified price, it’s kind of pointless to use a limit order when a market order will get you in quicker. So while latent interest usually converts to limit orders, when price eclipses the latent participants entry price, they are more apt to just use a market order.
When they do, price will usually slingshot back the other way. And depending upon the size of the latent interest and the speed at which different participants act, that will often drive price beyond where it started. You can see what I mean in Figure 6.4.
Figure 6.4: Shows the effect of latent interest hitting the liquidity distribution Now obviously, some of that latent interest will still convert to limit orders. Furthermore, some of the latent interest participants won’t be paying attention and will completely miss the move. But for the most part, whenever a big order hits the market, the combination of low liquidity within the vacuum area, and the high percentage of latent interest converting to market orders, will cause the above described behavior.

So even though an entry at 1.007 calls for a 7 to 1 reward risk ratio, the reality is that there is zero risk. You are pretty much guaranteed a 3.5 pip win because the subsequent order flow from the latent conversion will easily drive price beyond your target exit.
Of course actually capturing that 3.5 pips would require you to have a multi-million dollar algorithmic trading operation, which is probably not something you’ll have access to any time soon, but that misses the point. It is important to realize that price change creates a vacuum behind it. That vacuum tends to skew the probability toward reversion after a price change.
Lesson Recap In this lesson, we learned how the Liquidity Distribution Model works and how you can use it to find high probability phenomena within price change mechanics. Unfortunately, unless you are willing to spend inordinate amounts of time and money on an ultra low latency algorithm, none of what we have covered thus far is going to put any money in your pocket.
Don’t let this discourage you though. In the next lesson, we are going to build on the concepts we have examined and start exploring some inefficiencies that traders of all sizes and skill sets can exploit.
The Large Order Problem One of the more important implications of our analysis of liquidity is that it highlights the problem of large orders. Looking further at the details of Frank’s order, we realize that after all was said and done, the average entry price on his 75 contracts came out to 1.0035. This is noticeably different from the 1.000 ask rate that the market was showing just prior to the order execution. In the business of trading, this phenomenon is known as slippage, and as we are about to see, it can present serious problems for traders as the size of their account grows.
Contrary to popular belief, slippage is not the result of some shady practice by a broker or a thief in the night. Rather, it is simply the natural byproduct of the mechanics of price change. All the complaining in the world will not make it go away!

As pointless as the incessant whining about slippage may be, there is good reason to be concerned about its impact on profitability. To understand why, you must first realize that all profit opportunities are the result of market inefficiencies.
Inefficiencies The purpose of financial markets is to discover the informationally efficient price of market securities. I think I’ve beaten to death the idea that they frequently fail to do so, but that doesn’t negate the fact.
The heart of the speculative enterprise is to locate opportunities when the market deviates from this purpose and to extract a profit from that deviation. This is a somewhat broader definition then the academic literature presents, but in my humble opinion, it is more accurate. While it is easy to understand the idea of arbitraging a deviation from true value from a fundamental trader’s perspective, they do not hold an exclusive right to produce a more efficient market.
Technical traders may care little about the underlying true value of the securities they transact, but the repeatable patterns of human behavior they seek to exploit can only be the result of a failure of markets to reflect the accurate true value. Look at it this way - if markets were operating properly, the moment participants discovered information about true value, price would instantly change to reflect it. It would also remain at that price until new information became available. It’s blatantly evident that if this were true, there would be no patterns to exploit.
In the process of exploiting these patterns, technical traders are in effect arbitraging away the repeating behaviors. The result is that the repeating behaviors that cause a market to deviate from its purpose are eliminated, thus making that market more efficient.
The consequence of this insight is that all profitable opportunities are subject to the limitations of the liquidity produced by the cause of the inefficiency. As more speculators allocate capital to the capture of a particular inefficiency, the profitability of that inefficiency will become lower due to slippage.
Slippage and Expectancy

To understand how slippage interacts with the profitability of inefficiency, let’s examine a hypothetical system.
Imagine we have a breakout system – one that tries to capture a move after a support/resistance level is broken - that calls for an entry three pips beyond a support level. The take profit level is 40 pips with the stop at 20 pips. Just for giggles let’s say this system has a win rate of 50% and let’s further assume all of this is achievable when trading a single contract.
We can calculate the mathematical expectation of this system with the following equation:
E = (WR X AW ) - (LR X AL) Where: o E = Expectancy o WR= Percentage of Trades That Produce a Profit o AW= Average Size of a Winning Trade o LR= Percentage of Trades That Produce a Loss o AW= Average Size of a Losing Trade The expectation (or mean value) over a large number of trades is what you would expect the outcome of each trade to be on average.
Plugging our imaginary system into the equation, we get the following:
10 = (50% X 40) - (50% X 20) This means that each trade the system produces has an average yield (expectation) of ten pips. Since this is a positive number, we can expect this system to help our account grow over time.
Now, imagine if we have been trading this system for a few months. The profit from all the trades has swelled our account to the point where we decide to up the number of contracts we trade to ten. In most markets, this would not be much of an increase, so it probably would not produce much slippage. However, I am trying to make a point, so let’s pretend that this new larger size is causing price to slip three pips.

Three pips of slippage may not seem like much, but it affects both the entry and exit on winning and losing trades. So, what once was a 50% win rate/40 pip win/20 pip loss system becomes a 50% win rate/34 pip win/26 pip loss system. The effects of this on the expectation of our system are profound:
4 = (50% X 34) - (50% X 26) It is still a profitable system, but the slippage has lessened it by 60%. Moreover remember, that was on a measly three pips!
If we take this analysis to its next logical step, we can see that it would only take an additional seven contracts to turn our highly profitable inefficiency into a loser. 17 contracts = 5.1 pips of slippage:
- 0.4 = (50% X 29.8) - (50% X 30.2) The point of all this is to show you that market mechanics and the distribution of liquidity act as an upward limit on the amount of money that can chase an opportunity. Whether one person traded this system with 17 contracts, or 17 traders attacked it with one contract each, the result is the same. Namely, that the inefficiency the system was designed to exploit has been eliminated from the market.
One way to get around this problem is to trade systems that capture larger price movements. To illustrate this, imagine a system with the same win rate of 50%, but with wins of 200 pips and losses of 100.
Our expectancy profile on one contract would be:
50 = (50% X 200) - (50% X 100) Going to 10 contracts that produced three pips of slippage, we would see:
44 = (50% X 194) - (50% X 106) Slippage still reduces the profitability, but because the average win and loss were so much higher to start with, the impact of the slippage was only 12% instead of the 60% we witnessed earlier. Subsequently, all things being equal, a speculator could trade this system with up to 84 contracts before it became unprofitable.

There are many important implications for this, but generally, you can expect that the larger ones account balance is, the larger the inefficiency needed to produce a meaningful profit.
There is, however, a problem with this line of thought.
The Distribution of Inefficiencies It should be obvious that the larger the inefficiency, the easier it will be for participants to discover it. Large inefficiencies also provide a great deal of incentive for traders to try to exploit them. As a result, there is significant competition to capture those inefficiencies. And because of that, we can expect that small inefficiencies occur with far greater frequency than larger ones.
Figure 7.1: Shows this distribution of inefficiencies in relation to size. With so many large traders vying for so few opportunities, it should come as no surprise that large trader profits are quite small compared to what is possible for the smaller and more nimble speculator.
Lesson Recap The long and short of it is, that no matter how you slice it, as your account grows in size, it becomes increasingly difficult to extract a high return on equity from the market due to slippage. And, it is for this fundamental reason that small speculators can generate much better returns (on a percentage basis) then large traders.
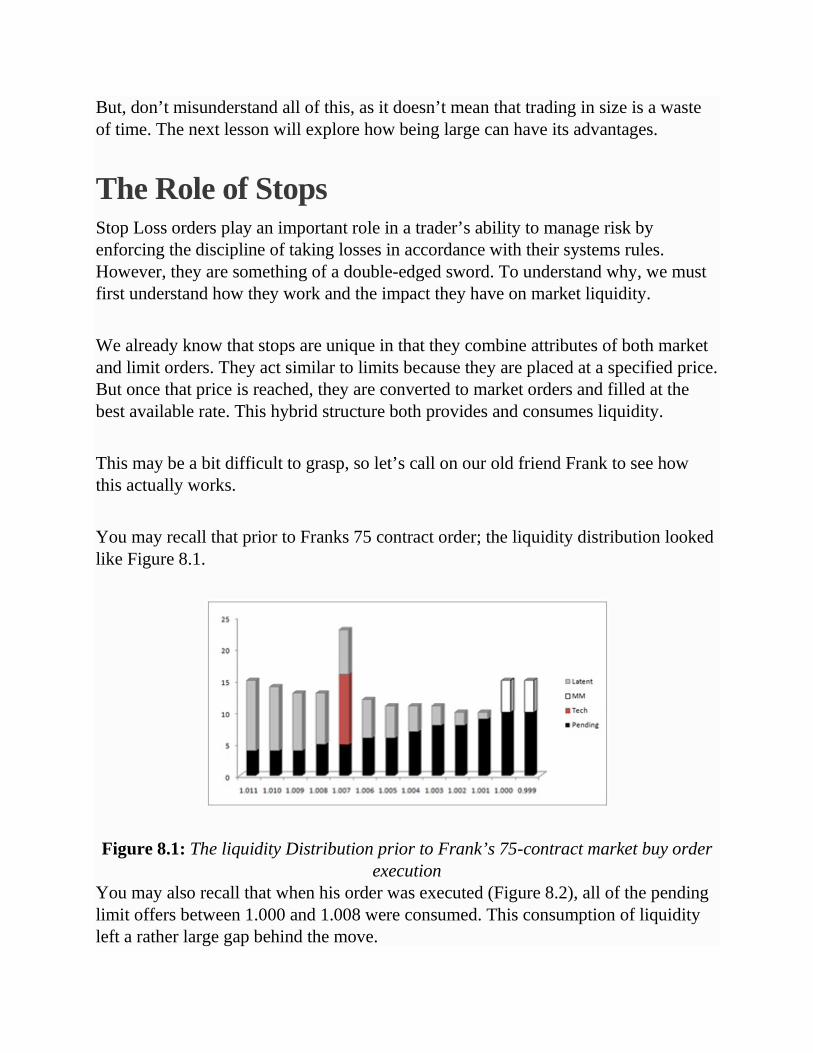
But, don’t misunderstand all of this, as it doesn’t mean that trading in size is a waste of time. The next lesson will explore how being large can have its advantages.
The Role of Stops Stop Loss orders play an important role in a trader’s ability to manage risk by enforcing the discipline of taking losses in accordance with their systems rules. However, they are something of a double-edged sword. To understand why, we must first understand how they work and the impact they have on market liquidity.
We already know that stops are unique in that they combine attributes of both market and limit orders. They act similar to limits because they are placed at a specified price. But once that price is reached, they are converted to market orders and filled at the best available rate. This hybrid structure both provides and consumes liquidity.
This may be a bit difficult to grasp, so let’s call on our old friend Frank to see how this actually works.
You may recall that prior to Franks 75 contract order; the liquidity distribution looked like Figure 8.1.
Figure 8.1: The liquidity Distribution prior to Frank’s 75-contract market buy order execution
You may also recall that when his order was executed (Figure 8.2), all of the pending limit offers between 1.000 and 1.008 were consumed. This consumption of liquidity left a rather large gap behind the move.

Figure 8.2: Franks order consumes the liquidity There were many important lessons in that example, but we can learn several more by altering things just a tiny bit. Imagine that many traders have identified 1.007 as a significant resistance level. That would not only give some context to those technical orders, but more to the point, you should know from reading any of the basic literature on technical analysis that it is common practice for market participants to place their stop orders just beyond support and resistance. With that in mind, let’s assume that there are ten contracts worth of stop loss orders sitting at 1.008.
When we execute Frank’s 75 contracts in this scenario, we get a markedly different result. You can see what I mean in Figure 8.3.
Figure 8.3: Frank’s order triggers the stops What’s shown is that Frank’s order still consumes all the liquidity up to 1.007. But once he acts, 1.008 becomes the market ask rate. This is important because the stops

placed at 1.008 are set to execute when the market ask rate hits that price. Once the stops are triggered, they become market orders and begin consuming any available liquidity until they are filled. As a result, price will be propelled even further, finally coming to rest at 1.010.
The liquidity provision side of the equation is a bit more of an abstract concept because it flips the provision/consumption dynamic on its head.
Normally we think of limit orders as providing liquidity because they allow traders the option to execute market orders if they so desire. With stops, this dynamic is reversed because the stops give traders the option of executing their limit orders at the specified stop placement price.
Now this is all a bit esoteric, but it does have implications for order flow traders, so let’s use Frank to see how this part works as well.
Let’s pretend that Frank knows there are ten stops sitting at 1.008. Knowing this information gives Frank the option to fill a limit order up to the maximum size of the stops at that price. It’s an option for Frank because whether he chooses to execute at that price or not, the stops are going to fire off.
Who cares right? Well my friend, you should and here’s why - first, let’s go ahead and have Frank place a limit sell at 1.008 for 5 contracts.
When we run the scenario this time (Figure 8.4) we notice that the price move terminates at 1.009 instead of 1.010 because there are now more limit sells for the stops to chew through. But that’s not what’s important here.

Figure 8.4: Shows a smaller price impact of the stop loss order execution due to Frank’s placement of a 5 contract limit order at 1.008
What is important is what just happened to Frank’s positioning. In Lesson 6 we established that after Frank’s order completed, he would have an average entry price of 1.0035 on his 75 contracts. In the current scenario, Frank still fills at an average price of 1.0035, but by placing a limit at 1.008 for five contracts, he managed to book 4.5 pips of profit on each of those five contracts. When you figure in the profits he has already booked, the net cost of his position is reduced to 1.00325. That’s not a huge cost reduction, but he was only exploiting five stop contracts. Had there been 100 contracts worth of stops at 1.008, Frank could have placed a limit sell for his full 75 contracts at 1.008 and liquidated his entire position with 4.5 pips profit on each.
Hunting Stops What Frank accomplished in the previous example is what order flow traders refer to as “stop hunting.”
Novice traders generally assume that stop hunting is something completely different. Most of them think stop hunting occurs when brokers and dealers push artificial prices to their clients in order to trigger the stops and earn more spread. Putting aside the fact that if brokers and dealers shaded the price like that, enterprising speculators could arbitrage those fake prices against the real ones on another market and bankrupt the broker/dealer in short order. In lessons 1 and 2, we noted that practices like this are

unnecessary as the brokers and dealers earn plenty of profits without needing to resort to strategies that would likely drive away their golden geese.
On the other hand, large speculators don’t have a riskless business model to worry about. They need every opportunity they can get and hunting stops is a reliable way to generate profits. But, we have only begun to scratch the surface.
For instance, imagine a market that is biased lower. When I say biased lower, I mean that the latent demand curve is disproportionally skewed toward a downward move in current value. We could come up with a fundamentally justifiable reason for this bias, but let’s keep it simple and ignore it for now.
We can see what this set of variables would look like on the liquidity model by examining figure 8.5.
Figure 8.5: An example of a liquidity distribution for a market biased toward lower prices
In this type of environment, large traders, who usually have a good pulse for such biases, will see a short position as a valuable asset to have. However, acquiring that position is going to generate a great deal more slippage on entry then an equally sized position would if the market was in equilibrium, as the bid sizes are going to be relatively small.
This is obviously a problem, but imagine there are a huge number of stops sitting at 1.005. To keep the example simple, we’ll use 60 contracts worth of stops.
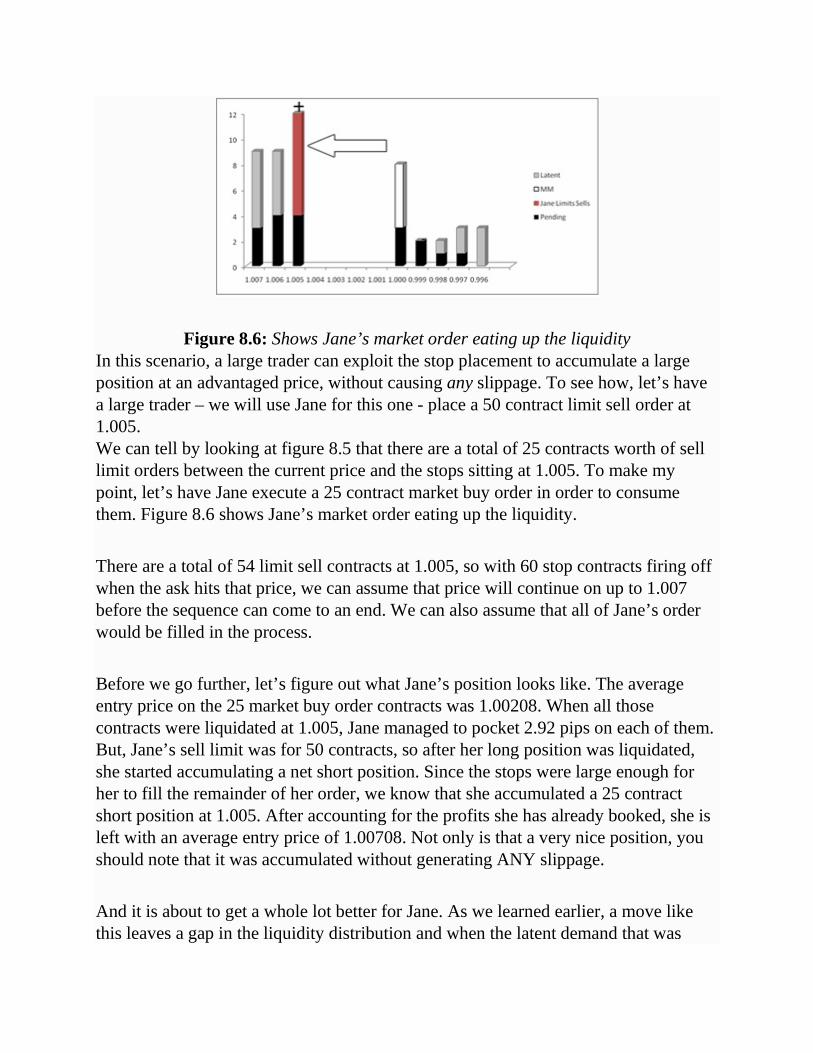
Figure 8.6: Shows Jane’s market order eating up the liquidity In this scenario, a large trader can exploit the stop placement to accumulate a large position at an advantaged price, without causing any slippage. To see how, let’s have a large trader – we will use Jane for this one - place a 50 contract limit sell order at 1.005. We can tell by looking at figure 8.5 that there are a total of 25 contracts worth of sell limit orders between the current price and the stops sitting at 1.005. To make my point, let’s have Jane execute a 25 contract market buy order in order to consume them. Figure 8.6 shows Jane’s market order eating up the liquidity.
There are a total of 54 limit sell contracts at 1.005, so with 60 stop contracts firing off when the ask hits that price, we can assume that price will continue on up to 1.007 before the sequence can come to an end. We can also assume that all of Jane’s order would be filled in the process.
Before we go further, let’s figure out what Jane’s position looks like. The average entry price on the 25 market buy order contracts was 1.00208. When all those contracts were liquidated at 1.005, Jane managed to pocket 2.92 pips on each of them. But, Jane’s sell limit was for 50 contracts, so after her long position was liquidated, she started accumulating a net short position. Since the stops were large enough for her to fill the remainder of her order, we know that she accumulated a 25 contract short position at 1.005. After accounting for the profits she has already booked, she is left with an average entry price of 1.00708. Not only is that a very nice position, you should note that it was accumulated without generating ANY slippage.
And it is about to get a whole lot better for Jane. As we learned earlier, a move like this leaves a gap in the liquidity distribution and when the latent demand that was

sitting between 1.001 and 1.005 hits the market, we should see price slingshot back towards the downside. In addition, remember that the liquidity distribution was already skewing to the downside. That means the conversion of latent demand is going to have an even larger impact on price then it did in lesson 5. The end result is that after a minute or two – as we can see in Figure 8.7 – current value actually drops BELOW the original starting price.
Figure 8.7: Shows the liquidity distribution 1-2 minutes after the stop hunt event we examined
Now all Jane has to do is let the weight of the latent demand interest drive price lower. Eventually it will reach a new equilibrium level. When it does, she can run a stop hunt in the opposite direction to close the position slippage free.
Is it any wonder why prices seem to gravitate toward trader’s stops?
Lesson Recap In this lesson, we learned how stop loss orders work and why traders use them. In addition, we explored the concept of stop hunting and how it really works, as opposed to the way most traders think it does. And lastly, we examined how large traders can get around the problem of large orders by hunting stops.
After reading this lesson, you probably have some good ideas on how you can piggyback on the activity of these large traders to generate profits, but I feel I should caution you. There are many risks involved in these strategies and if you are not careful, they can cause you to blow-out your account.

In the next lesson, we will explore some of these risks, how you can protect yourself from catastrophe, and how to turn those risks into additional profit opportunities.
Stop Cascades At this point, you might be thinking that hunting stops is all sex and candy. The reality is that it can be a very dangerous enterprise for the uninformed. There is something called a stop cascade, and as we are about to see, it can destroy your account in seconds if you’re not careful.
A stop cascade occurs when the quantity of stops at one level are large enough to consume all the pending limits and trigger the stops at another. An example of how a situation similar to this might occur with a liquidity distribution is shown in figure 9.1.
Figure 9.1: Shows a depth of market distribution leading to a stop cascade event With 75 contracts of stops sitting at 0.998, we can expect that a 25-contract market sell order at the current price would cause the bid to shift down to 0.995.
Once the bid rate reaches .995, the 20 contracts worth of stops at that level will execute as well. Figure 9.1 above shows that these 20 stop contracts are enough to drive the bid rate off the edge of the chart, yet still not completely fill. How far it will run depends on how much liquidity exists beyond the chart we presented. However, exploring the details of precisely where it would stop is not the point of this exercise.
The important thing to realize is that a stop cascade will cause prices to continue falling until all the stop orders fill. If the bid rate happens to reach another stop level before doing so, still more stops will execute and price will cascade even further away.
This can become particularly dangerous. As we know, pending limit orders tend to decrease as you move farther away from current value. Additionally, most traders place their stop orders when they enter a position, regardless of where those stop orders are in relation to the current price level. This helps them ensure that a loss will be taken when necessary, but it also means that as you move farther away from current value, the relationship between pending limits and stops will grow progressively more divergent. Taken together, if a cascade is large enough to trigger several successive stop levels, there is a good chance it will begin feeding upon itself. When that happens, it is not unrealistic to see a price move in the hundreds of pips.
This is important for neophyte stop hunters to consider as they can find themselves positioned the wrong way when a cascade occurs and lose their entire account if they aren’t careful.
To protect yourself from this risk, the first thing you should do is keep tight controls on your leverage. If you cannot withstand a 200 or 300 pip move against you without taking a margin call, a stop cascade is eventually going to wipe you out.
Second, you should figure out how to spot a cascade before it occurs. The good news is that with a little bit of experience and the information you will learn in Section 3 of this program, this is not only possible, it is actually pretty easy to do. More importantly, if you know when/where a stop cascade is likely to occur, you can actually get in ahead of it and book some enormous profits from the move!
But, the sad reality is that we actually need to cover the information in Section 3 before we can get into the details. At this point, I just want you to be aware of the stop cascade concept and have a general idea of how they occur. We’re going to need that information in the next lesson.
Lesson Recap
In this lesson, we learned about the phenomena known as stop cascades. We explored what they are, how they form, and what consequences they have for aspiring order flow traders.
The key takeaway is that stop cascades occur when stops at one price level are large enough to trigger an additional level of stops. This can produce large price changes in a short period of time.
Lamentably, we will have to postpone more than a general overview of this subject until after a discussion about Episodic Volatility…
Episodic Volatility Stop cascades are merely one manifestation of a larger concept known as Episodic Volatility.
Episodic Volatility is a Microstructure term that’s used to define a gross divergence between the demand for immediacy and the availability of liquidity to service that demand. What does this mean? Under normal market conditions, periods of low liquidity will generally have low transaction volume. Conversely, periods of high liquidity will usually see high transaction volume. When volume is high and liquidity is low, Episodic Volatility is the result. And, as you are about to discover, the inefficiencies it produces are not only crazy profitable, but nearly infinite in number too!
There are a number of different scenarios that can lead to Episodic Volatility. I’d like to start with an example with which you are most likely already familiar: the Flash Crash of May 6, 2010.
The Flash Crash

Figure 10.1: Timeline of the May 6, 2010 “Flash Crash” The morning of May 6 was ugly. The Dow Jones Industrial Average was down ~200 points by 2 pm and traders around the world were on edge. Then, at ~2:30, an ugly day suddenly and inexplicably turned into a horror show as the Dow collapsed another 800 points over the course of a few brief minutes. More interestingly, after a few more minutes passed, the DOW spiked back up to recover nearly all the lost ground.
There have been many suggestions of fundamental and/or technical justifications for this move, but according to the September 30, 2010 report by the CFTC and SEC to the Joint Advisory Committee on Emerging Regulatory Issues, there were none. According to this report, the true cause of the Flash Crash was a confluence of microstructure and liquidity-related factors that produced episodic volatility.
To summarize the report, it all began with speculators fearing a possible debt contagion from a Greek default.
Now I don’t want to get into a detailed discussion of the Greek default and subsequent Euro Zone debt crisis because it’s a complicated situation and doesn’t really matter for our purposes. All you really need to know is that the Greek government was at risk of defaulting on its debt; that this would be bad; and that the fear it created produced a situation where sell side interest for the E-mini S&P500 futures contract was high, while buy side liquidity was limited.

At approximately 2:30 pm, a trader executed 75,000 E-Mini S&P500 contracts (valued at ~$4.1 billion) as a hedge to an existing equity position. That was a VERY large order for that market and it kicked off the following chain of events:
1) The market makers on the S&P futures exchange picked up many of these 75,000 contracts, which caused their net exposure to shift deeply long.
This is not a good position for them to be in, and in an effort to prevent their situation from getting any worse, the market makers reduced or eliminated the limit buy orders they offered to the market.
2) Even though the market makers picked up most of the contracts, the E-mini trade was still large enough to cause prices to spike lower.
3) This in turn caused participants, who were already concerned about the situation, to decide it was time to sell.
4) When they did, their orders consumed the limited available liquidity and pushed price into a level containing a sizable number of sell stops.
5) The execution of those stops quickly blew through the limited remaining buy side liquidity, and triggered a stop cascade on the e-mini.
6) Had the E-mini existed as a standalone contract, the cascade that occurred would likely have been an isolated event. Unfortunately, however, there is a precise mathematical relationship between the e-mini, the full S&P500 futures contract, and a whole host of S&P 500 index instruments. That being the case, as the E-mini fell, arbitrage speculators (and their automated algorithms) began selling these other instruments in an effort to maintain the mathematical relationship.
7) As the arbitragers orders hit these other markets, prices on those markets began to fall.
8) Once prices started to fall, it was inevitable that they would run into large blocks of stop orders on those markets as well.

9) As one market cascaded, it led to a cascade on another, and another, until the entire buy side order book on each of these markets were empty. 10) The only thing that prevented the S&P 500 from dropping to zero was the various circuit breakers that regulators had put in place to halt all transactions when a large market move occurs. Once those circuit breakers kicked in, the latent demand of participants who saw a 1000-point drop in the DOW as excessive could quickly fill the huge vacuum that developed behind the move. Subsequently, price quickly returned to near pre-event levels.
You might be tempted to think that the Flash Crash was caused by the order for 75,000 S&P futures contracts. The truth is that if there hadn’t already been a gross imbalance of buy and sell interest, the outcome would have been quite different. Yes, it would have caused a spike lower in prices, but there would have been plenty of latent and pending liquidity to arrest the slide. This would have prevented the e-mini market from getting too far unbalanced with the other exchanges, and the arbitragers would never have triggered the stop cascade. In all likelihood, without the gross imbalance, May 6, 2010 would have ended like any other market day.
The key point and lesson of the story is that it was a gross imbalance in the supply of liquidity and the immediacy of demand that led to the flash crash. That imbalance was caused by the heightened level of fear, which led to a strong downward bias in sentiment.
The Flash Crash may have been a prominent example of that, but you should know that episodic volatility is not limited to times of heightened fear or to a strong directional bias. The fact is that Episodic Volatility occurs nearly every day, granted to a far smaller degree, across a wide range of securities in the form of data releases and other headline news events.
News Events We need to understand how news events relate to Episodic Volatility. Lets imagine an important employment report is about to be released by our theoretical Sun government.

As you no doubt know, employment reports are a key variable in determining the future trajectory of a country’s economy and as such, can have a significant impact on the value of that country’s currency.
Most participants have substantial incentive to withdraw liquidity from the market when heading into a news release like this. Fundamental traders, for example, earn the majority of their annual profits from accurately predicting the outcome of the various news events that occur. In the hours and days leading up to the event, fundamental traders will be accumulating positions in line with their expected outcome. Presumably, as the event becomes immanent, they will be fully positioned. That being the case, there is no reason for them to maintain standing limit orders when the news breaks.
Technical Traders also have an incentive to remove liquidity ahead of news. They have systems built on the probability distribution of repeating patterns in nearly random price behavior. News events may be unpredictable, but they are far from random and the general wisdom is that it is wise to close all positions and cancel all pending limit orders ahead of news events.
Dealers are usually required to offer liquidity to the market, but they can use their own discretion as to the exact quantity to offer. Dealers predominantly work with limit orders and are by nature accumulating positions contradictory to any market move. With the risk of substantial price changes occurring during news events, dealers are wise to reduce the amount of liquidity they offer going into these events.
The effect of these incentives is that both the latent interest and pending orders (which normally populate the liquidity distribution of the market), are withdrawn ahead of the release.
Once the news drops, if it is substantially different from expectations, there is going to be a great need for execution immediacy from fundamental traders who were positioned the wrong way, and from event traders, who will try to arbitrage the time delay in new information distribution.
This combination of low liquidity and high demand for immediacy will frequently set off episodic volatility events. While those events will rarely be as large as the flash crash, they will produce similar results.

Other Causes and the Core Lesson Weekends, holidays, and political press conferences scheduled between market sessions are a few other situations that can lead to Episodic Volatility. But truthfully, any time there is an opportunity for the immediacy of demand to outstrip the supply of liquidity, Episodic Volatility can present itself. When it does occur, you can expect that price change will be very large and very fast.
Episodic Volatility and Market Inefficiency Episodic Volatility events are important for order flow traders to understand. Even though the markets do a spectacular job of efficiently matching the demand for immediacy with liquidity, when there is a gross divergence between the two, markets can, and frequently do, produce unexpected behavior. More importantly, all of this unexpected behavior can be exploited for enormous profits once you know how.
Unfortunately, there are literally thousands of different high-value trading opportunities related to Episodic Volatility. Any attempt to provide such an exhaustive list would be prohibitively time consuming. However, we can at least explore a few common themes and highlight how you would go about profiting from them.
1) Fundamental Arbitrage At the nadir of the Flash Crash move, many securities were trading at prices so fundamentally divorced from reality, that one cannot help concluding that the price discovery process was broken.
One of the more prominent examples of this mispricing was Accenture, a Fortune Global 500 management-consulting firm that, despite a book value of assets around $5.36/share, saw thousands of its shares traded at $0.01.
Even if the company’s $1.6b annual profits had dropped to zero, speculators who bought shares at that price could have sold off the assets at a 53,000% ROI!
Speculators may not have known what the true value of Accenture was. But, it would have been a safe bet speculating that it was at least equivalent to the book value of its

assets. And that is precisely what you want to look for in Episodic Volatility based fundamental arbitrage trades. Once you find one of those opportunities, buy the security and wait for the market to return to rationality. The minute it does, close your position and enjoy your nearly risk-free profits.
2) Relationship Arbitrage Many securities have either a precise or a statistically significant mathematical relationship with some other security. In the case of currencies, this takes the form of the triangular relationship between three cross rates that should always remain in perfect alignment.
I am not going to dwell on this strategy because most aspiring speculators are already familiar with how it works. The part that I do want to draw attention to though, is that Episodic Volatility frequently causes the relationships to break down. Therefore, by focusing your relationship arbitrage trading activities on periods and securities that have a high likelihood of experiencing Episodic Volatility, you can dramatically improve the frequency and magnitude of your risk-free profit opportunities.
3) Inter-Market Arbitrage In Chapter 4 we learned that the OTC Forex market consists of a number of exchanges, interlinked through the order activity of various participants. The distributed nature of that structure can sometimes cause delays in price change across the exchanges during periods of Episodic Volatility.
Just like the relationship between related securities on a single exchange, identical securities on different exchanges must maintain a fixed price relationship.
Episodic Volatility can cause the prices on one market to move faster than on another. When that happens, you can buy on the overpriced exchange and sell on the underpriced for risk-free arbitrage profits.
Lesson Recap Episodic Volatility is a term used to describe vary fast and very large movements in prices that occur when volume is high and liquidity is low. When it occurs, it can

produce all manners of unexpected behaviors and many of them are exploitable for profits. The trick to exploiting these events is in predicting when and where they are likely to happen and hopefully this chapter has given you enough information to figure that out.
This lesson brings us to the end of the market microstructure discussion. Throughout this section, we examined some of the many ways that speculators can discover market inefficiencies by studying microstructure processes and thinking about the consequences for price action.
However, we have only really scratched the surface of this topic.
The objective of this program is to teach you the core concepts of order flow trading and help you achieve profitability in a short period of time. The inefficiencies we have explored will provide ample opportunity for us to reach that goal, but you need to know that there are many more inefficiencies out there to be discovered.
Some inefficiencies can be found by playing around with the liquidity model. Others will require that you explore the rule sets that govern the various exchanges. And there is a treasure trove of opportunities within the many great academic papers on microstructure written by Carol Osler, Maureen O'Hara, and Richard Lyons. I encourage you to explore all of these resources because they will all improve your profitability and bring you closer to fulfilling your dreams.
All of this being said though, I feel that I should issue a warning in advance: While exploring these additional resources, you are going to come across many blind alleys and dead ends. For every 1,000 hours you spend researching, you might come across one profitable idea. But, I can happily report that the profits from that one idea will more than make up for the disappointments encountered along the way.
Next up: Reading Order Flow and Reverse Engineering the Order Book.
Reading Order Flow Exploiting microstructure inefficiencies often requires some advanced knowledge of order placement before they can become profitable trading opportunities. Critics are

quick to point out that it is impossible to acquire this knowledge for a number of reasons, such as:
o Exchange operators closely guard this information and will not allow anyone to access it.
o If you COULD find an exchange operator to agree to give it to you, their order book would only represent a small slice of the actual orders because (as we learned in lesson 2) the OTC Forex market is fragmented.
o Utilizing the depth of market is not an option either. Stop orders are hidden from all participants and many participants use iceberg orders that make the limit order info unreliable.
These are all valid criticisms, but those who offer them are operating with the mistaken assumption that Order Flow Analysis is some sort of mathematical science.
It isn’t.
Sure, it would be nice to know how much liquidity exists at each price point. With information like that in hand, earning profits would be like shooting fish in a barrel. Tragically, the critics are correct and wishing for it to be otherwise is futile.
But, just because we can’t know everything, doesn’t mean that we are completely blind. We have to work with what IS knowable. And fortunately, we do know a great deal about what other traders are likely to do. The fact is it doesn’t matter if we have access to the order book or not. There is enough information freely available to reconstruct the majority of the order book on our own.
The concepts of cognitive empathy and inductive inference are central to the solution of how we can accomplish this.
Cognitive Empathy The human mind has a remarkable ability to almost instantly reconstruct the mental state of other individuals. For most people this is a subconscious process. However, after extensive research into the subject, psychoanalysts have determined that this

sophisticated imaginative process can be broken down into two distinct subcomponents.
The first step in the process is called cognitive empathy. Cognitive empathy, sometimes referred to as Perspective-Taking, is comprised of rebuilding the thought processes of others.
To understand what this means, imagine you are at a comedy club and the performer on stage is failing miserably. Nobody is laughing at his punch lines and he is starting to sweat.
Unless you are a sociopath, you’ll notice that your mind almost instantly transported your frame of reference to that of the comedian standing on stage. You saw the crowd through his eyes and felt the anxiety he felt standing there.
The first part of that process, when you transported yourself into his shoes and reconstructed what was going though his head, was your cognitive empathy skills in action.
The second stage of the process, when you identified the emotional state of anxiety that he must be feeling, is called emotive empathy. That is the part of your brain that allows you to infer another’s emotional state once the thought process has been reconstructed.
Working in conjunction, these two processes are what allow you to empathize with others and function properly within mainstream human society.
This is important to understand because it shows that we all possess the innate ability to “put ourselves in the shoes” of other traders. It also indicates that we should be able to project with some accuracy what they are likely to be thinking in various situations. And, even more importantly, though it is predominately a subconscious process, one’s ability to empathize with others has been proven developable with practice. In other words, you can improve your accuracy of behavior prediction by actively engaging in the process.
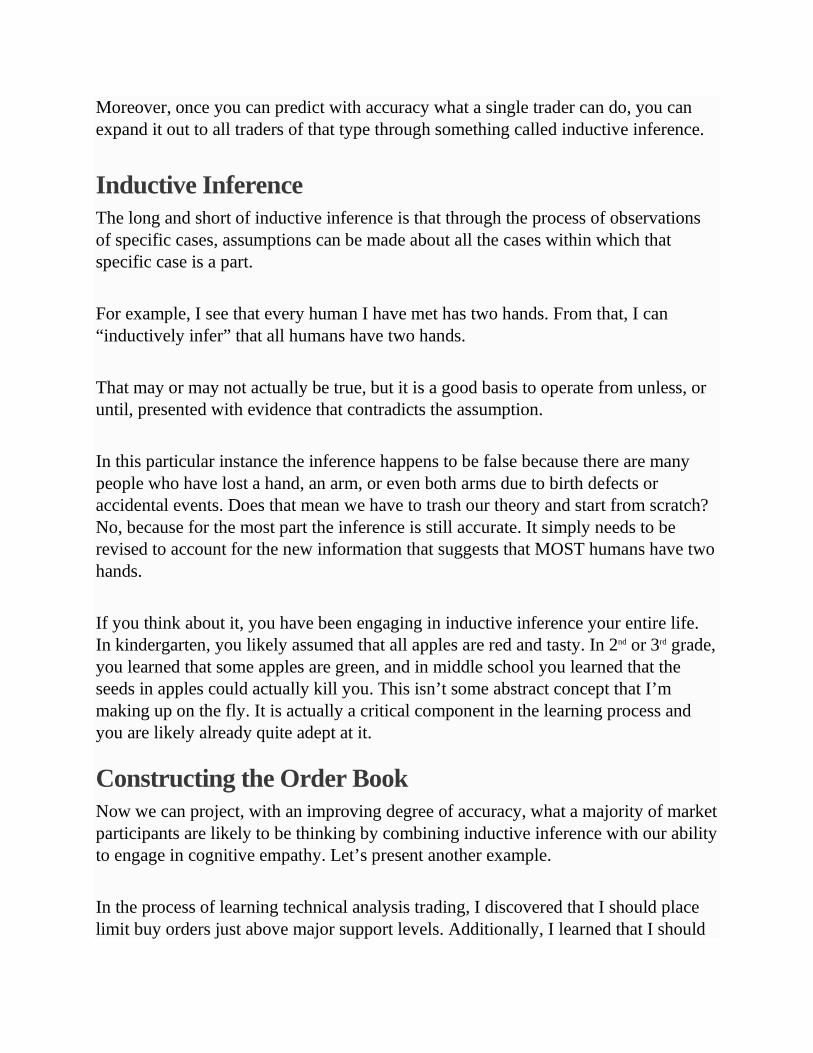
Moreover, once you can predict with accuracy what a single trader can do, you can expand it out to all traders of that type through something called inductive inference.
Inductive Inference The long and short of inductive inference is that through the process of observations of specific cases, assumptions can be made about all the cases within which that specific case is a part.
For example, I see that every human I have met has two hands. From that, I can “inductively infer” that all humans have two hands.
That may or may not actually be true, but it is a good basis to operate from unless, or until, presented with evidence that contradicts the assumption.
In this particular instance the inference happens to be false because there are many people who have lost a hand, an arm, or even both arms due to birth defects or accidental events. Does that mean we have to trash our theory and start from scratch? No, because for the most part the inference is still accurate. It simply needs to be revised to account for the new information that suggests that MOST humans have two hands.
If you think about it, you have been engaging in inductive inference your entire life. In kindergarten, you likely assumed that all apples are red and tasty. In 2nd or 3rd grade, you learned that some apples are green, and in middle school you learned that the seeds in apples could actually kill you. This isn’t some abstract concept that I’m making up on the fly. It is actually a critical component in the learning process and you are likely already quite adept at it.
Constructing the Order Book Now we can project, with an improving degree of accuracy, what a majority of market participants are likely to be thinking by combining inductive inference with our ability to engage in cognitive empathy. Let’s present another example.
In the process of learning technical analysis trading, I discovered that I should place limit buy orders just above major support levels. Additionally, I learned that I should

protect myself from losses by placing a stop loss order just beyond that support. I took that to mean placing my limit five pips ahead of the support and my stop five to ten pips below it.
With that information, I can cognitively empathize with another technical trader. It doesn’t take a leap of imagination to assume that if “I” feel like I should place my orders in those ranges that another technical trader will as well.
From there I can inductively infer that MOST technical traders (who have all learned the same things I did) will behave similarly. Obviously I can’t know for sure, but unless, or until I am presented with evidence that contradicts those assumptions, it’s a pretty good bet that they will.
This is of course only a simple example from one type of participant. But now that we know how to do it for one, we should be able to it for all. It’s a given that some market participants will be easier to analyze then others (and some, like commercials, can’t be analyzed at all), but I can tell you from experience that once you learn how to do this, you can have an accurate “enough” order book to trade with profitably.
Lesson Recap In this lesson, we explored some of the criticisms leveled against order flow trading and introduced the concepts of cognitive empathy and inductive inference. We also learned that cognitive empathy and inductive inference are innate human abilities and when combined, can become a powerful tool for the reconstruction of a real time order book.
Thus far, we have seen how these concepts work at a theoretical level. Over the course of the next several lessons, we are going to explore the different participant types and work through some of their common behaviors. In the process, we will construct a theoretical order book so that you can see how this would work in the real world.
Technical Traders

Before we can get into how Technical Traders place orders, we’ll need to take a few minutes and explore how they think. By this time, chances are that you are beginning to think with the “order flow mindset,” which is precisely what we want! But, you need to remember that most market participants do not share your newly enhanced level of understanding and actually, if the truth be known, most traders have deeply flawed ideas about how and why prices change.
In this lesson, we are going to explore the Technical Traders mindset and why it causes them problems...
The Fallacy of Technical Analysis At the heart of technical analysis is something called the “cum hoc ergo propter hoc” logical fallacy. In short, this fallacy can be expressed as: A occurs in correlation with B. Therefore, A causes B. In this type of logical fallacy, a premature conclusion is made about causality after observing only a correlation between two or more factors. Generally, if one factor, (A), is observed to only be correlated with another factor (B), it is sometimes taken for granted that A is causingB even when no evidence supports it. This is a logical fallacy because there are at least five possibilities: 1. A may be the cause of B. 2. B may be the cause of A. 3. Some unknown third factor C may actually be the cause of both A and B. 4. There may be a combination of the above three relationships. For example, B may be the cause of A at the same time as A is the cause of B (contradicting that the only relationship between A and B is that A causes B). This describes a self-reinforcing system. 5. The "relationship" is a coincidence – or it is so complex or indirect that it is more effectively called a coincidence (i.e. two events occurring at the same time that have no direct relationship to each other besides the fact that they are occurring at the same time).
You can see an example of a Technical Trader engaging in this logical fallacy in Figure 12.1.

Figure 12.1: A common example of the logical fallacy technical traders engage in This chart was presented to the members of Forex Factory on June 15th, 2010, along with the prediction that within 90 days the Dow Jones Industrial Average was going to drop, from its then current level of 10,402, to below 4,000. What was the prognosticator’s justification for such an epic move? Quite simply, it was his assessment that a Head and Shoulders Pattern was forming on the monthly price chart. I’d like to think that most people can appreciate, even if only on an intuitive level, that there is something wrong with this type of prediction. However, given the quantity of responses agreeing with the prediction (and the vociferousness with which those agreeing with the prediction defended their position), we need to explore precisely why this prediction is flawed.
The head and shoulders pattern is well regarded among technical analysis proponents because there have been many instances in the past where a major market turn was preceded by one. DOW 4000 guy took this to mean that there must be a causal relationship between the pattern and the outcome. This then led him to believe that his prediction had a high probability of coming true.
What he failed to realize is that price change is exclusively the result of market participants executing orders. For his prediction to come true, it would have required a majority of market participants to believe that the DOW was overvalued by ~6400 points. Furthermore, his prediction would have required that those participants actually execute orders in an effort to bring the DOW down to 4000.
At this point, an astute reader will quickly point out that many market participants look for and execute orders based on Technical Analysis patterns that will cause some technical patterns to become a self-fulfilling prophecy. I won’t dispute this because

you will soon discover that profitable order flow trading is heavily dependent upon that premise being true.
However, in this particular instance, the prediction made was for an abnormally large change in price. The argument that the pattern could induce Technical Traders to execute orders and drive price that far could only be valid if huge numbers of participants subscribed to the same outcome. If financial market participants were exclusively engaged in Technical Analysis, that might be possible. But the simple fact is that technical traders are only one subset of the market. Moreover, while I do not have any hard numbers to back it up, I would venture to say that technical traders actually represent a small subset at that.
Fundamental trading is a sizable component of the market in any case. So, for a prediction like that to come true, it would have been necessary for fundamental traders to participate in the move. Unfortunately for our prognosticator, there were very few fundamental justifications for a move of that magnitude. As a result, his glorious prediction failed to materialize.
Now, the point of all this really isn’t to poke holes in the theory of technical analysis. The nonsensical nature of their behavior is an important insight that you should take from this lesson, but what I really want you to understand is that most technical traders do in fact believe that the squiggly lines on their charts causes prices to behave in predictable ways.
The key lesson to take from all this is that, if they believe price will react to their squiggly lines in predictable ways, we can have a high degree of confidence that they will place orders in accordance with those predictions. And that gives us a valuable insight for reading their order flow.
Lesson Recap In this lesson we learned how Technical Traders think and how certain logical fallacies cause them to behave. In the next lesson we will build on this knowledge to figure out where they are likely to place their orders.
Reading Technical Order Placement

Now that we know Technical Traders actually believe technical factors influence prices, the next step is figuring out how they think prices will be influenced. This is actually quite a bit easier than it sounds. If you read through babypips.com (as suggested back in the orientation), you already know how the various technical factors SHOULD impact price. With that in hand, all we have to do is analyze the market the same way a tech trader would and we can discover where they will place their orders
This might be a bit difficult to visualize, so let’s look at a few examples.
Figure 13.2 is a basic price chart. At first glance, it would appear this chart is missing a lot of important information. For example, we have no idea what security this is, what the time frame is, or the price range over which the activity is occurring. This was not a mistake - I did it on purpose.
Figure 13.2: A basic high-low-close price chart Reading order flow does not require any of that information and the sooner you realize this, the better off you’ll be. I see far too many aspiring order flow traders getting hung up on irrelevant details and taking way too long for this stuff to sink in. The truth is that there is a ton of order flow information contained in that seemingly simple price chart. All we need to do is start applying common technical principles to see it. Babypips.com starts its technical trading discussion with support and resistance. I think this is as good a place as any to begin, so let’s throw up some S&R levels on our chart (Figure 13.3).

Figure 13.3: A price chart with support and resistance levels marked I realize there are additional S&R levels that can be constructed from this chart and that my levels do not precisely match the suggested methodology for S&R level construction. Try not to get hung up in those details… this isn’t a study of tech analysis. Instead, I’m trying to show you how technical factors allow one to construct an order book and being close is good enough for that goal.
Anyway, according to baby pips and technical lore, there are two ways to play support and resistance.
First, you can assume that price will bounce off the support or resistance level. In that scenario, you would want to place limit orders ahead of the level with your stop just beyond it.
Second, you can assume that once the support or resistance is broken, price will continue moving in the same direction until it reaches the next support or resistance level. This second option is known as a breakout strategy, and the suggested tactic is to place a stop limit entry just beyond the support or resistance.
Ironically, no matter which way technical traders decide to play S&R, the order flow consequences are nearly identical. Stops will accumulate above resistance and below support, while limit orders will accumulate below resistance and above support. We can clearly see this in figure 13.4.

Figure 13.4: Shows how to mark off the stop and limit order placement for support and resistance levels
Note that this is the same price information and S&R levels from Figure 13.3. However, due to the limitations of this format, I had to chop off a bunch of the left side in order to make room for the order info.
That’s all there really is to this process. We look at a technical strategy, figure out how it should be played, then block off the places where technical traders playing that strategy are supposed to place their orders. It should be becoming self-evident at this point, but I’ll give you one more example.
On baby pips, the next strategy discussed is trend line trading. For Technical traders to draw a trend line, they simply need to connect two major tops or bottoms. We have two major tops in our chart, so our next step would be to draw a trend line like the one in Figure 13.5.

Figure 13.5: Marks a trend line on a basic price chart Once we mark the trend line, we follow the same logic process again.
According to technical trading lore, trend lines cause price to reverse direction. Technical participants subscribe to this lore and subsequently take positions with an expectation that price will do just that. This gives us limit sell orders ahead of the trend line.
If a technical trader enters a position based on the expectation that price will bounce off the trend line, and if price penetrates that line, it would invalidate the trade. As a result, we can expect that trader to place his stop just beyond the failure point.
These two principles detail where we can expect trend traders to place their orders. Figure 13.6 illustrates what that would look like.

Figure 13.6: Shows how to mark the stop and limit orders for a trend line As you can see, determining the placement of technical trader orders is a simple affair. I could go on to cover all the technical patterns and tools that are out there, but I don’t want to waste your time. We still have a lot to cover and as long as you follow the general logic process outlined above, you should be able to easily work them out on your own.
Lesson Recap In this lesson we learned that with a basic knowledge of how technical analysis patterns SHOULD be played, we can reverse engineer the location of technical trader orders. Of course, this is only half of the information we need to construct our virtual order book. With that in mind, let’s turn to a far more important topic…
Determining Technical Order Size Knowing that traders will place orders at a specific price level is only one piece of the puzzle. The second step in constructing our virtual order book is to figure out how large those orders will be at each level.
Unfortunately, we have no way of “knowing” how large the orders are at each price level because we don’t know how many participants are trading a particular strategy or how large their accounts are.

But that’s ok. We can still do well with some rough approximations.
Making an approximation relies on three general principles:
1) The higher the timeframe a technical signal manifests itself on, the larger you can expect the orders to be. For example, a support level on the daily chart will have significantly more stop and limit orders than a support level on a 15-minute chart.
This occurs because longer time frame charts have more people following them. It’s common practice for traders of all stripes to consider higher timeframe charts in their trading decisions. So, a trader who focuses on 15-minute charts will generally check the hourly and daily charts for major technical factors that might influence his positions. An hourly chart trader will usually check the daily and weekly charts for the same reason. All in all, this means that there are many more traders looking at longer term charts and that when technical factors presents on them, many more traders will have an opportunity to participate.
2) When a number of technical factors line up at a particular price level, you can expect that the total number of orders at the level will be larger. For example, when a Fibonacci retracement, Moving Average, and a support level all line up at a particular price level, you can expect the associated stop and limit orders at that level will be huge.
This predominantly occurs because not all technical traders utilize every technical strategy. Traders who trade Fibonacci retracements often avoid moving averages. Traders who use moving averages often don’t care about support and resistance levels. So, when you have a confluence of technical factors at a price point, all of these traders – who are often scattered around the price range - will be looking to trade at the same level. As a result, the confluence will produce a great deal more order activity than any strategy would normally cause on its own.
3) The longer a technical factor is in play, the larger the quantity/size of the positions it will have pursuing its intended outcome. While points 1 and 2 are pretty straight forward, number 3 requires a bit more explanation… Take a look at Figure 14.1.

Figure 14.1: Shows how limit orders begin to build once a resistance level has been established
Figure 14.1 is a simple example of a resistance level on an average-price line-chart. At this moment in time, there are no stops beyond the resistance level because price has not reached the point where limit orders could be filled.
Figure 14.2 shows that as price moves into the limit orders, those limit orders are consumed. If participants are expecting a bounce off resistance, they will place their stops just beyond the level to protect the position.
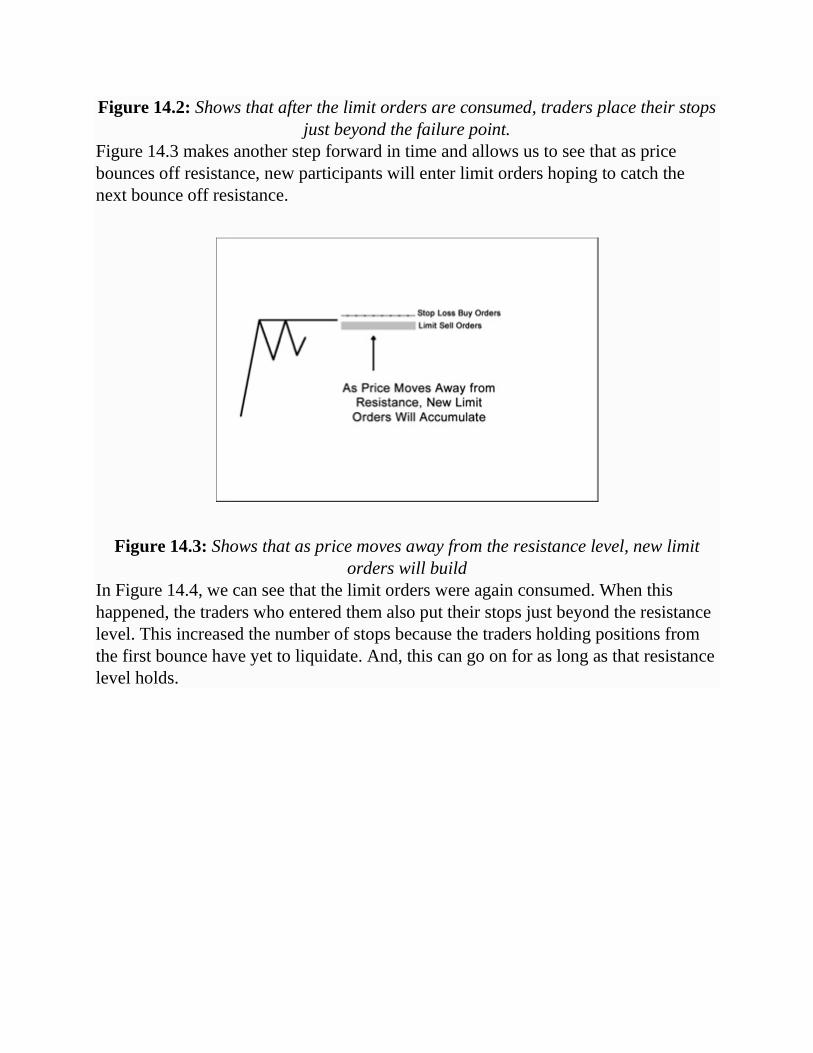
Figure 14.2: Shows that after the limit orders are consumed, traders place their stops just beyond the failure point.
Figure 14.3 makes another step forward in time and allows us to see that as price bounces off resistance, new participants will enter limit orders hoping to catch the next bounce off resistance.
Figure 14.3: Shows that as price moves away from the resistance level, new limit orders will build
In Figure 14.4, we can see that the limit orders were again consumed. When this happened, the traders who entered them also put their stops just beyond the resistance level. This increased the number of stops because the traders holding positions from the first bounce have yet to liquidate. And, this can go on for as long as that resistance level holds.

Figure 14.4: Shows that on each successive bounce off resistance, the stops grow larger
It’s important to realize that the longer this goes on, the larger the stops will become. And since our primary concern in order flow trading is the placement of stops, this is critically important to understand and account for.
It is especially relevant for our purposes because over time the ratio of stops to limits for a technical factor will grow progressively larger. On the first bounce off resistance, for every one limit order contract that was consumed, one stop order contract was entered. On the second bounce, there were (hypothetically) two stop contracts for every one limit. On a third bounce, it would (again hypothetically) rise to three for one.
If a large trader pushed through resistance on the first bounce, there would have been no opportunity to accumulate or distribute a position because there were only enough stops to liquidate the position accumulated during the stop hunt. On the second bounce, there was enough to liquidate the stop hunt accumulation plus a little extra. The third would allow for more. Each bounce after that gives a large trader progressively more incentive to blow though and trigger the stops, so it’s important that we figure out where the large stop concentrations are. And that’s primarily what this third principle allows us to do.
Taken together, these three principles allow us to approximate the relative size of orders at various price levels.

Lesson Recap In this lesson we learned how to estimate the size of various technical trader orders. In the next lesson, we will combine all the insight we've gained into the technical trader order behavior toward building our virtual order book.
Building the Order Book Now that we know how to find order placements and we have some principles for determining the size, we can look at a real life chart and apply what we have learned about constructing a real-time Technical Trader order book.
Figure 15.1 is a Daily chart of EUR/USD as of Saturday July 9, 2011.
Figure 15.1: Daily chart of EUR/USD The first thing we want to do is Mark off the Major Support and Resistance levels as has been done in Figure 15.2.

Figure 15.2: Mark the support and resistance levels
When we have those in place, we can mark the location of stop order placements as I have done in Figure 15.3.
Figure 15.3: Market the support and resistance stops
I don’t waste my time marking limit orders because: a) they clutter up the chart; and b) they have limited value for reaching our trading objectives. From principle three of our size approximation discussion, we learned that stops grow over time to become larger than the limits. From this we can surmise that if price gets close enough to a meaningful large stop placement, the incentive a large trader has to blow through the

limits will overcome any that happen to be there. Because of this, I don’t even consider the limit orders in my trading decisions.
But, just because I don’t use them in my trading decisions doesn’t mean that you can’t. If you develop a strategy that relies on them in your studies of microstructure, feel free to mark them off on the chart… Anyway, once we have the S&R stops marked, we can remove the S&R levels and move forward to the next technical tool. In figure 15.4 I have marked the trend line stops.
Figure 15.4: Mark the trend lines and related stops
When the trend lines are complete, I move on to the next technical factor, then the next, then the next, until I have all the relevant stop placements marked off on my chart. I’m not going to go through them all here because the space limitations of this format force me to use tiny graphics and it is quickly getting cluttered. Just be aware that you should do this process for all the major technical factors including SMA’s, Fibonacci Retracements/Projections, Pivot Points, any major technical patterns, and when dealing with a JPY pair the “Ichimoku Kinko Hyo” stuff.
When that’s done, I step down to the next lower timeframe. Now I am not a big fan of three- and four-hour charts because there is very little consistency for them across brokers and time zones. For that reason, I tend to bypass them and go with the hourly charts.

Figure 15.5 is the hourly chart of EUR/USD for the same date and time. Notice that as you scale down in the time frame, the stop placements at higher levels will still be visible. This is ultimately why we start out on the high time frames and work our way downward.
Figure 15.5: Higher timeframe stops should still be visible Once we get to the lower time frame, we start the process all over again. Figure 15.6 shows the S&R levels on the one-hour chart and how we would mark off the stop placements.
Figure 15.6: Start the process all over again…
When that’s done, we move on to trend lines, Fibonacci Retracements/Projections, etc.
One thing that you may notice is that the stop placements on the 1-hour chart are marked in a different color than the ones from the daily chart. This is a really important step because, as we noted in the previous lesson, higher time frame technical factors will have larger order placements than shorter timeframe factors. By using a different color for each timeframe, we can quickly see the relative size of stops at the various price points.
It’s also a good idea to mark confluence areas in their own special color. Confluence areas usually have especially large stop placements (regardless of the timeframe they manifest on) and are thus ripe for exploitation by large participants. The easier it is to see these confluence areas, and the relative size of stops in their vicinity, the easier it will be for you to anticipate which levels large traders will target.
And that’s really all there is to reverse engineering the Technical Trader order book.
Lesson Recap In this lesson we combined the information we've learned over the last several lessons to reverse engineer the Technical Trader Order Book. All in all, I think you will agree that figuring out what Technical traders are doing is actually pretty easy once you know what to look for.
Unfortunately, technical traders are only a small subset of the total market participant population, and for this to really have practical application we need to know what everyone else is doing. So let's jump to the next lesson...
Fundamental Traders Reading the order flow of fundamental traders requires an altogether different approach. Unlike the technical traders we examined earlier, fundamental participants rely heavily on information outside the price charts when making trading decisions. This creates a major problem for us, because unlike a price chart, fundamental traders analyze economic reports that are open to a wide degree of interpretation. That variability prevents us from anticipating the conclusions a fundamental trader will develop from the information. Without an ability to anticipate the conclusion they will reach, we have no idea when, where, or even why they will place orders into the market.

This is a problem with no solution.
However, as you are about to discover, there is another way to analyze the activity of these fundamental participants. And it will allow us to accomplish something far more valuable… the ability to determine the directional bias of prices.
But, first things first! Before we can get into a thorough discussion of how to determine that directional bias, we must first dispel a few misunderstandings about the nature of fundamental participant strategies.
Fundamental Trading Strategy Up to this point we have been working with the academic assertion that fundamental traders seek to arbitrage any discrepancy between current and true value. It was useful to work with this academic assertion in our microstructure discussion because it provided us with a simplified way of understanding the impact of fundamental trader’s orders. However, in reality very few (if any) fundamental traders actually trade this way.
The fact is, learning fundamental analysis is a complex enterprise and, in order for fundamental traders to understand the concepts it utilizes, they have had to spend an inordinate amount of time in school studying economic theory.
This is pertinent to the discussion because nearly all college professors subscribe to the Efficient Market Hypothesis and, being the good instructors they are, make every effort to teach their students that current and true value are always in alignment. That being the case, it is fair to assume that most fundamental traders eventually became indoctrinated in that belief. More importantly, it is a good bet that many of those indoctrinated traders have since gone on to develop their trading strategies around it.
At first glance, you might think that this belief in the Efficient Market Hypothesis would make earning trading profits impossible. After all, one of the central tenants of this theory is that speculative profits are unattainable because inefficient prices do not exist. But, once you acquire a deep understanding of the theory, you will come to realize that there is an interesting loophole.

The loophole is that even if you accept that prices reflect all the knowable information, there is an implicit acknowledgement that prices cannot and will not reflect unknown or unknowable information.
There are many examples of unknowable information. The one that has the most relevance for our discussion of fundamental trader strategies relates to time. A dedicated fundamental trader can know everything about a company or a country as it exists today. But, it is impossible for them to know what is going to happen in the future.
To give you some relevant examples, as I sit here now in 2011:
1. Traders have no idea what is going to happen to the U.S. employment report next month
2. They have no idea what France and Germany are going to decide with regard to the Greek Debt Crisis
3. They have no idea if Obamacare is going to be overturned by the U.S. Supreme Court
4. They have no idea what the outcome of the next U.S. presidential election will be
And this is just what I could come up with in a few minutes. There a thousand more macro events like this and we haven’t even mentioned the inconceivably high number of issues at the micro level.
Every one of these unknowable events will have a major impact on asset prices. But in the present, market participants can only guess about the outcome. And when an outcome is unknowable, it is impossible for market prices to reflect that outcome before it actually occurs.
This does not mean that the market completely ignores these events though. One of the core tenants of economic theory (and, by proxy, the Efficient Market Hypothesis) is that market prices will reflect the “potentiality” of various outcomes.
For example, it is impossible to know the outcome of the Greek debt crisis. However, a thorough analysis of the situation can lead to a conclusion that there is a 15% chance that Greece will actually default on its debt. This is knowable information, so one can expect that participants will account for that 15% chance of default in the price of the euro. As a result, the euro will reflect a price 15% lower than it would if the Greek default risk did not exist.
I don’t think it takes a genius to realize that there are only two possible outcomes to this example situation. Either Greece defaults on its debt, or it doesn’t.
What may not be as evident is that in the present, the euro is grossly mispriced no matter what happens because, in reality, one option has a 100% chance of occurring while the other has 0%. If the issue is resolved with a sustainable debt repayment plan, the euro is underpriced because it was accounting for a 15% potentiality that did not occur. If Greece defaults, the euro is overpriced by the 85% chance that it would NOT default.
According to the Efficient Market Hypothesis this isn’t a problem because markets don’t need to produce perfect pricing. They merely need to reflect all the known information. As long as prices reflect the 15% chance before the outcome as well as the 100% actual default (or 0% non-default) after the outcome, they are fulfilling that objective and can be considered efficient.
This loophole allows a fundamental trader to believe in the Efficient Market Hypothesis while simultaneously exploiting mispricing it says should not exist. The fact is, even if prices always reflect true value in the present, they are mispriced for tomorrow’s outcomes because the future is always unknown. If a fundamental trader chooses the correct outcome, places a trade, and waits until the outcome occurs, he can arbitrage the mispricing that existed the day before.
Ultimately, this is how most fundamental traders approach the game of speculation.
You can find plenty of examples of fundamental traders doing this by spending a few hours watching CBNC or Bloomberg TV. By paying particular close attention to the various guests that offer up their asset purchase suggestions, you’ll quickly notice that only about one in ten talk about the asset in a context of being undervalued in the present tense. The remainder will have some explanation for why the fundamental

data related to the asset will change in the future and go on to say that this future change will improve the value of the recommended asset.
Expectation Skew It was important for us to explore how fundamental participants actually trade because the consequence of their behavior is what gives us the opportunity to determine the directional bias of prices.
To explain that consequence I need you to imagine a fundamental trader looking at the stock of Apple, Inc.
You are probably wondering why I am having you look at a stock when we are discussing the currency markets. Well, there are two valid reasons.
One: I told you in the beginning of the program that the principles we are discussing are universal to all financial markets. My fear is that if I spend too much time focusing on currencies, you will limit your search for opportunities to the Forex market and thus lower your profit potential.
Two: Stocks have a number of well-defined price/value relationships that will allow me to make my point in the clearest possible way.
So, imagine our trader – let’s call him Peter - has scoured the available data for Apple, Inc. and concluded that there is an opportunity for the company’s next generation iJunk product to substantially increase earnings. This is an opportunity for Peter because, as we just learned, fundamental traders like him seek to arbitrage changes in true value across time.
Since Apple has not yet released the new version of iJunk, it is impossible for the market to reflect the actual impact it will have on earnings.
Sure, there will likely be some accounting of the outcome in the current price, but unlike our Greek debt/euro example from earlier, this is not an either/or proposition. Earnings could rise by 1% or 20% or 100%. Hell, they could even fall if the new iJunk product has a defect and needs to be recalled. This many possibilities make

defining a potentiality for any particular one outcome functionally impossible for all but the slickest of mathematicians.
I’m not that slick myself. Besides, the truth is, we don’t need to know the probabilities anyway. Fundamental traders like Peter are not concerned with such things. And, if they aren’t concerned with them, you needn’t be either. The only reason I bring it up is so that you can appreciate how the two situations are related.
Getting back on track… Peter sees this opportunity for earnings to rise in the future. Now he has to answer the questions of how much, and what impact they will have on the stock price. To answer them, he first needs to know what Apple is doing now.
o Current Stock Price: $100.00 o Current Earnings: $6.25 per share From this, Peter can divide the stock price by its earnings per share and determine that Apple is trading at 16 times earnings. This is important for Peter to know because he is going to need a reference point for the next step.
Now, let’s just say that Peter’s analysis suggests the new iJunk product will be increasing earnings by $1 per share. With all the requisite info in hand, Peter can calculate his future expected value by multiplying the future earnings figure by the current earnings multiple.
o 16 X $7.25 = $116 That $116 is what he can expect Apple shares will be with if his expected outcome occurs.
Peter sees a 16% return as worth his risk, so he plunks down the cash and buys Apple stock with an eye toward arbitraging the future.
In the process of buying that stock, we know his order is going to consume liquidity and in effect push price higher. What we have yet to realize is that in doing so, our fundamental trader is going to skew the expectations of all the traders who follow him. And this is the key point I want you to understand.

Let’s say that Peter’s order was large enough to increase the price of apple stock by $2.
Now, imagine that a second fundamental trader looks at Apple stock and comes to the exact same conclusion about future earnings that Peter did. You might be tempted to believe that he will see a smaller opportunity because price has increased. However, he has no idea why Peter took his position, or even if he took one. The only information he has to work with is the current price and his expected earnings.
After Peter’s order hit the market, the price of apple stock increased to $102. When we divide $102 by the $6.25 earnings per share, we see that the current earnings multiple has increased to 16.32. This is important to notice because even if our second trader sees the exact same $1 per share increase in earnings that Peter did, he is going to come up with a higher target price.
o 16.32 X $7.25 = $118.32 When he places an order, it is going to again raise the price and further increase the earnings multiple. Subsequent traders will then calculate their expectations against the new, higher multiple and push price and the multiple even further.
Now the point of all this is not to teach you about stock valuations or to poke holes in the strategies of fundamental traders. What I want you to see is that even though every trader we have analyzed is looking at the same data and coming to the same conclusion, their behavior is perpetually “skewing” the expectations of everyone who follows them. More importantly, this expectation skew will cause prices to drift in the same direction. This is important. We have no way of knowing what any of the fundamental trader’s actual expectations are. Peter could just as easily have seen a $10 increase in earnings per share and unless we connected with him telepathically, we would have no way of knowing that he did. However, once we realize that the future arbitrage strategy that fundamental traders employ causes prices to drift in the direction of expectations, we no longer need to care. All we need to do in order to determine the directional bias of prices is figure out the prevailing market sentiment.
Market Sentiment

Long story short, market sentiment is a term that describes the distribution of participants holding positive and negative expectations about the future of asset prices. At any point in time, some participants will expect that prices will fall, while others will expect them to rise. When the number of participants who have positive expectations exceeds the number of participants with negative expectations, sentiment is considered good. Conversely, when negative expectations exceed positive, sentiment is considered bad.
If the number of participants on either side is equal, price will not move because one buy order will be offset with an oppositely placed sell order. However, if the participants are unequal, expectation skew will cause prices to drift in the direction of the dominant side. And given the fact that Fundamental traders make up the lion’s share of speculative order activity, we can expect that price drift to overcome any obstacle in its path.
Lesson Recap The easy explanation is, the way fundamental traders approach the game of speculation creates a phenomenon I like to call expectation skew. That expectation skew causes prices to gravitate in the direction of sentiment. Know the sentiment and you know the inherent directional bias of the market.
The pertinent question to ask now is, “how does one figure out the prevailing market sentiment?” Thankfully, that's the subject of our next lesson.
Reading Sentiment Sentiment is defined as the overall feeling that market participants have about the future. Its sort of an emotional reaction that traders experience when they think about the markets, where the economy is headed, and how various trends in asset prices are evolving.
Now, when I have written about it in other venues, I somewhat summarized the PROCESS of reading sentiment by indicating that you should follow the news. I then went on to say that while following the news, you should pay attention to the emotional state of the news anchors and analysts that your tracking. In doing so, you

would eventually learn how to gauge sentiment from the way those anchors and analysts responded to the events as they unfold.
And to a certain extent, this is all true. But its also less then clear how one should actually proceed.
So today were going to attack the problem from a different perspective. Instead of focusing on the emotional state - which is really a byproduct of events - were going to start from the news and work our way up to the point where we can anticipate how the news anchors and analysts will respond. And as a byproduct, how the market will react as well.
Now what you have to understand is that ones ability to read sentiment is heavily dependent upon knowing whats going on. You need to know what market participants are worried about. What their hopes and dreams about the future are. And as most of you probably know, this is where the subject of news and data enters the picture.
What you probably DON'T know is precisely how to utilize the information a typical news feeds contains.
So were going to take a few minutes here to discuss the two major components of a typical news feed... and how they relate to the hopes and dreams of market participants.
First up, we have data releases.
Data Releases Data releases are your scheduled economic reports like non farm payrolls, and GDP.
Now I'd like to make an important point, that data in and of itself doesn't mean anything. To give you an example of what I'm talking about, lets use GDP.
If you've paid attention to market prices when a GDP report is released, you've probably noticed that a big expectations miss can cause some wild swings in prices.

But why? After all, by the time we get an economic report like GDP, its already old information. All its telling you is what happened LAST quarter.
The purpose of financial markets is to discount the FUTURE value of asset prices. In the grand scheme of things, an under or over performance of expectations in data shouldn't really have any impact, because it says nothing about what the FUTURE prints - and subsequently the future value of assets - will be.
However, in practice market participants are not gods. They are in no way clairvoyant and as such have no choice but to make decisions based on what they CAN know. And since they cant know what tomorrows GDP print will be, they really have no choice but to look at the current data, and use that to make assumptions about where things are likely to go in the future.
And this is probably the best starting point for thinking about sentiment.
There are many things that influence sentiment. But data is probably the easiest to start with because its consistently available, and there are some fairly straigh forward rules for how it influences participants expectations about the future.
To understand how it will influence them, you first need to appreciate the concept of something called the business cycle.
Now you're probably noticing were descending deeper and deeper down a bit of a rabbit hole. Where before one thing can be explained, we first need to look at another. And we can’t explain that thing without first looking at something else. Putting aside the fact that this was why I found it so hard to explain sentiment in the past... Id ask that you just humor me and try to follow along. I promise this will all lead back to where we started before I'm done.
OK so, the business cycle is, in simple terms, an observed pattern of business activity.
It runs on a continuum, but for our purposes let’s assume that it begins, as the following graphic shows, in the depths of recession, at a point known as the trough.

From there it moves to recovery... then expansion... and eventually boom where it peaks... before returning to a new period of recession... Which terminates back at a trough. At that point the process starts all over again.
What you need to understand is that each one of these stages occurs for material reasons. I don't necessarily want to get into all the reasons here, as the information is only tangentially relevant for our purposes. But I would encourage all of you too look into it further in your spare time. The information is widely available and thus should be easy to find with a basic Google search of the term "Business Cycle".
What IS relevant for our purposes, is for you to understand that asset prices have a high correlation with the business cycle. In other words, when the economy is in recovery, risk assets will begin rising as well. When the economy is hitting boom times, risk assets such as equities will likely also be experiencing a bit of froth. And the discussion of bubbles will everywhere... As the economy passes the peak and turns toward recession, risk markets will soon follow.
Now we could debate the reason for this correlation, but there is no disputing the fact that the correlation exists. And because it exists, there should be little debate that market participants have a strong desire to know precisely where an economy is in the business cycle across time.
The problem is, while this is all easy to explain in the abstract, its often difficult to know where an economy is in the business cycle until months, or even years later.
One need only go back to the 2007 to 2008 time period to appreciate the difficulty. Literally until the day Lehman Brother collapsed, there was great confidence on the part of market participants that the economy was still in a boom period; and that the issues with subprime mortgages would be well contained.
Everyone knew that the boom would eventually end of course. But very few expected it to happen until at least several months into the future. Of course what we know now, is that the recession actually began around 6 months BEFORE Lehman collapsed. Only nobody had noticed.
Now Ive gone off on a bit of a tangent here. But the point is, market participants are constantly trying to assess an economies place in the business cycle, and there are literally trillions of dollars riding on trying to determine something that is basically unknowable until after the fact.
And ultimately, this is why things like the latest print of last quarters GDP are so important. Nobody can know next quarters GDP - not today anyway - but they can look at the trend in GDP for the last 3 quarters, and try to marry that info with how GDP should be trending, given their assessment of an economies current place in the business cycle.
If the two line up, they can feel pretty good about their market positions.
However, when they don’t, there’s a good chance they'll be a bit concerned about it.
And while Ive used GDP in my examples here, you should know that ALL the data events that market participants pay attention to are evaluated in the same light. Of course each one has its own purpose, and thus its own bearing on the indication for an

economies place in the cycle. But again, I don’t want to turn this into an econ lesson. All the relevant info for what a data print means in the context of the business cycle is available elsewhere and I encourage you to look it up because it is important to understand.
The key point here is that, the data is important because market participants are trying to determine where an economy is in the business cycle.
How closely the data matches up to where he assumes the economy is in the cycle will influence his emotional reaction to the data. And the bigger the disparity between the two, the stronger his emotional reaction will be.
Now it should now be evident how this releates back to sentiment. After all, as we learned earlier sentiment is simply the aggregate emotional state of market participants with regard to the future.
But to really drive this point home, let me give you an example
Times are pretty decent right now. They're not great, but i think for the most part all can see that things are fairly stable with the economy. For those who have a job - or have a spouse that works - you likely feel pretty comfortable that the job is safe. At least from the influences of the broader economy anyway...
So you... personally... your sentiment about the economy is moderately positive
Now lets say that tomorrow employment figures start tanking. i mean really bad numbers. If you're smart you're going to develop some measure of concern that you or your spouse might lose their job in the future. As a result you're probably going to cut back on your discretionary spending
In other words, the employment data has negatively influenced your sentiment about the economy, which then caused you to alter your plans.
And THAT'S what I'm trying to get across here. Everyone in the market feels that the current economy is not great. But its not on the verge of collapse either. As a result they are making economic decisions in line with that assessment.
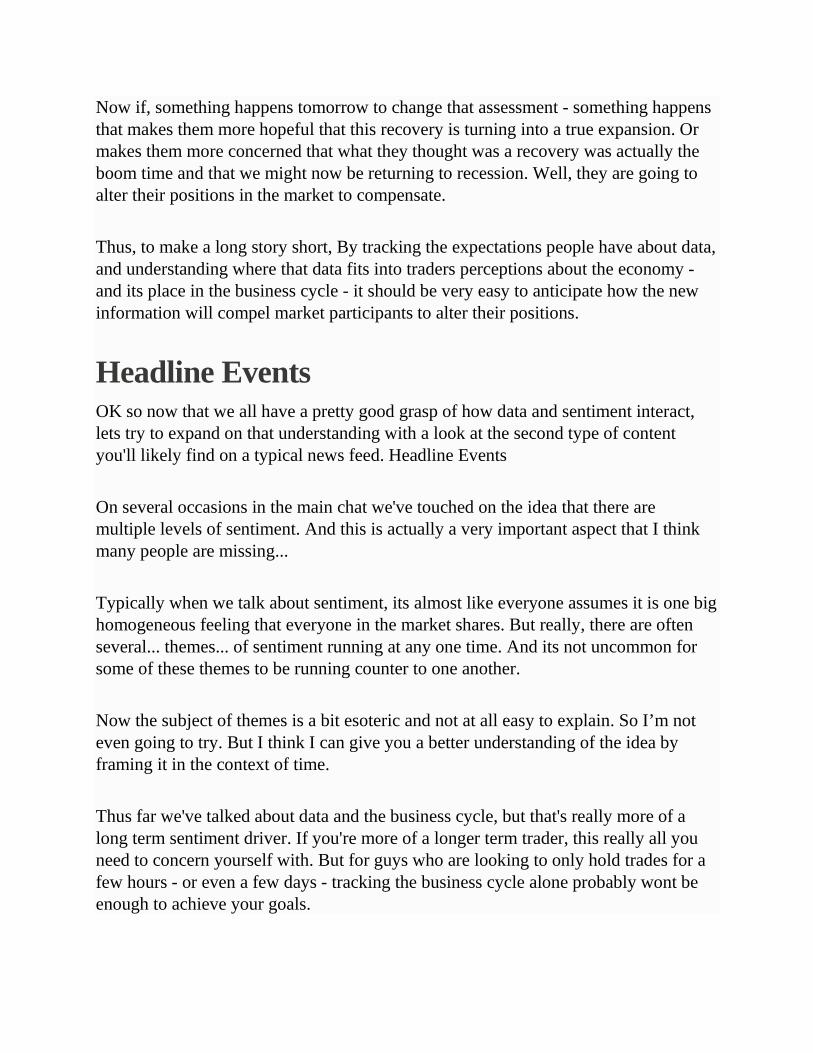
Now if, something happens tomorrow to change that assessment - something happens that makes them more hopeful that this recovery is turning into a true expansion. Or makes them more concerned that what they thought was a recovery was actually the boom time and that we might now be returning to recession. Well, they are going to alter their positions in the market to compensate.
Thus, to make a long story short, By tracking the expectations people have about data, and understanding where that data fits into traders perceptions about the economy - and its place in the business cycle - it should be very easy to anticipate how the new information will compel market participants to alter their positions.
Headline Events OK so now that we all have a pretty good grasp of how data and sentiment interact, lets try to expand on that understanding with a look at the second type of content you'll likely find on a typical news feed. Headline Events
On several occasions in the main chat we've touched on the idea that there are multiple levels of sentiment. And this is actually a very important aspect that I think many people are missing...
Typically when we talk about sentiment, its almost like everyone assumes it is one big homogeneous feeling that everyone in the market shares. But really, there are often several... themes... of sentiment running at any one time. And its not uncommon for some of these themes to be running counter to one another.
Now the subject of themes is a bit esoteric and not at all easy to explain. So I’m not even going to try. But I think I can give you a better understanding of the idea by framing it in the context of time.
Thus far we've talked about data and the business cycle, but that's really more of a long term sentiment driver. If you're more of a longer term trader, this really all you need to concern yourself with. But for guys who are looking to only hold trades for a few hours - or even a few days - tracking the business cycle alone probably wont be enough to achieve your goals.

I mean sure, you can play the daily deviation in data from expectations. And I encourage all of you to do that whenever possible. But at best that's only going to give a handful of trading opportunities a month.
In other words, those trades can put some nice spending money in your pocket, but they're probably not going to be enough to replace your day job on their own.
Thankfully there is usually other stuff going on that people are concerned about, and more often than not these things are of a more immediate nature.
Some examples of this would include - Last years European debt crisis - the recent sequester and debt ceiling nonsense - and the current Fed tapering and normalization of interest rates debate.
These are all factors that market participants were - and in many cases still are - keenly concerned with. But they all have a bit more of an immediate day to day relevance.
You'll liked notice that all of these examples share something else in common as well; they are all headline events. And this is kind of a key line of thought that I want to discuss.
While long term sentiment is driven by data and the business cycle, the short term is dominated by headline events.
I've given you a few examples, but what are headline events in the abstract? What universally identifiable characteristics do they share? Well, after considerable thought on the matter, I can say that as a general rule, they are political in nature.
And just as a quick side note. You know, its easy to assume that the constant influence of politics on economic outcomes is a modern problem - due to the seemingly inevitable march of liberalization in political institutions across the globe - but in fact, politics and economics have always been intertwined.
In Adam Smiths influential 1776 work, The wealth of nations - which is a classic piece of economic literature - he frequently uses the term political economy to refer to

what we in the modern world know simply as economics. Not because he was trying to make some sort of revolutionary era inspired point. He used that term because in his day, that's what economics was called, by anyone and everyone who was involved in the subject. And they did so with good reason.
The truth of the matter is, money and politics are inextricably intertwined. They have been since the invention of money, and they likely will be until the light of humanity is snuffed out on this world. By Ive digressed...
Were talking about sentiment, and to get back to that topic... most of what influences sentiment in the short run is politically driven headline events.
But so what?.. Who cares if headlines are political or economic?.. What are we supposed to do with that information? All good questions, and I'm about to give you the answers.
Its important to realize that headlines are politically driven because it gives us a starting point for understanding how to read their impact on market participants. See, behind every headline is a set of political decisions. And behind every political decision is one or more political actors.
This is important to note because unlike cold, hard, economic data - and the business cycle - the decisions of political actors... ie- human beings.. are simultaneously predictable yet prone to irrationality. And this gets to the heart of why headlines are such an important and frequently frustrating factor for the sentiment of market participants.
See, economic outcomes are frequently at the mercy of important politic actors, like the members of FOMC board.
The decisions of these actors can have such a profound impact on outcomes that financial market participants really have no choice but to worry deeply about what sort of decisions the political actors will make. And while its a fairly straightforward process to game out the most likely outcome given the known information a political actor has to work with, as all humans are prone to irrational decisions its impossible to know with any real certainty what will actually happen until after the fact.

Not only does this create deep stress for market participants; it can often leads to wild swings in sentiment - and thus asset prices - when an expected outcome fails to materialize.
But more to the point, it will also tend to swing wildly every time new information enters the pool from which a political actor will draw when making his decision. Thus, a single political decision to be made weeks, or even months into the future can create trading opportunities day... after day... after day.
Now I've kinda belabored the point here, so let me summarize what I'm trying to say.
Once you realize that sentiment can be altered by headline events, and headline events are generally politically driven, you must also realize that the key to determining sentiment in the short and intermediate term, is figuring out:.
a) what economically important political decisions are pending
b) what the possible outcomes are
and c) what outcome is expected by market participants.
With that in hand, all that's left to do is either look for new information that will alter the markets perception of the most likely outcome, or wait for the decision itself to deviate from the one expected by market participants. Then you get in when the new information hits the market, and out after the information becomes embedded in price.
And THAT my friends is about the best explanation for the process of not only reading, but exploiting sentiment that you are ever likely to hear.
However, to really drive the point home, let me give you an example. Well use an FOMC interest rate decision because its both easy to follow - you should all already know the dynamics behind them to some degree - and its likely to be something all of you will experience many times over your trading career. So lets run through our model.

a... what economically important political decisions is pending?
Obviously the interest rate decision itself
b... What are the possible outcomes?
Well, lets look at it logically. The fed can either
1) raise rates
2) lower rates
or 3) leave rates where they are.
And c... what outcome is expected by market participants?
In the real world, you would need to pay attention to what people are saying about this event to figure out what the expectation is. But since were working with a bit of a theoretical event here, I'll just make it up and say that they are expecting option 3, that the fomc will make no change to interest rates.
Now as I said, with this information in hand, all we need to do is wait for some new piece of info to hit the market.
What sort of information could that be? Well, there are lots of things. It could be comments by the FOMC board members. Or maybe a really strong, or really weak employment report. Maybe GDP has been trending toward slower growth and a new print showing a slight contraction would tip the scales toward a fed interest rate cut. Who knows. The fact is there are lots of things that COULD cause market participants to reevaluate their expectations.
To figure out what they are you would need to follow the news, and the associated articles, to get more details about what factors are most important for that decision at that particular moment in time. But for the sake of this example lets assume there is a

non farm payrolls report due in the near future, and that it will have a big impact on the feds decision.
Going into this event you would build out a plan for all the potential scenarios.
Now lets assume you want to trade the US dollar for this event.
If the NFP report prints a good number, this will increase the probability that the fed will raise rates. This will typically be good for the dollar, so you would want to get long.
The market already expects rate to remain on hold in the next fed meeting, and they are also expecting a specific number for the NFP report. So if the print lands at or close to that number, it wouldn't have any material impact on the rate decision theme, and thus you wouldn't want to take a trade.
And finally, a bad NFP print would compel the fed to lower rates. Which would be bad for the dollar. Thus you would want to sell.
Now, with your plan in hand all there is left to do is wait for the print to hit the wires. If it comes out strong, you go long, and ride the wave of repricing demand into the next round of stops. If its bad, you do the opposite. If its as expected, you just follow your plan of doing nothing.
And that's really all there is to it.
Now this was a really simple example, but you should know that playing all political events can be done in the exact same way. From interest rate decisions, to debt ceiling showdowns, to the decision of one third world shit hole in Africa to go to war with another. As long as you can figure out a... what decisions need to be made... b... what the options are.. and c... what people are expecting... you can exploit every new piece of information related to that event as it becomes available. Day after day after day, until its permanently resolved one way or another.
And THAT my friends, is enough opportunity for anyone to build a very profitable trading career around.

Intermarket Analysis For many of you, the discussion we just concluded on sentiment will likely help you make huge strides in your effort to master the subject.
However, there is one more component that I think can be of use. Historically, one of the biggest problems aspiring traders had with sentiment was determining which headlines were important, which should be ignored, and how the important ones should be played.
In this segment Id like to share with you a powerful tool for answering all those questions and more; Intermarket analysis.
What is intermarket analysis you ask? Good question. Intermarket analysis is the process of analyzing the relationships between disparate financial market asset classes, in an effort to glean what, if anything, market participants are thinking.
And how does it allow you to determine which headlines are important? Well, what you have to understand is that every asset in the world has its own unique set of fundamental drivers. This is important to understand because each headline has its own unique set of fundamental implications. As such, depending on the nature of the headline it can cause asset correlations to take on some very interesting characteristics. And when you marry that bit of insight with the order flow mindset you realize that you can use that correlation behavior to infer all sorts of useful things about market participant thinking.
Let me show you what I mean...
Lets assume we have two simultaneous headline events. Now i dont want to muddy up the discussion with any particular events at this stage. Its more important that you understand the CONCEPT of what im trying to show you. So to keep it simple, lets call them headline one and headline two.
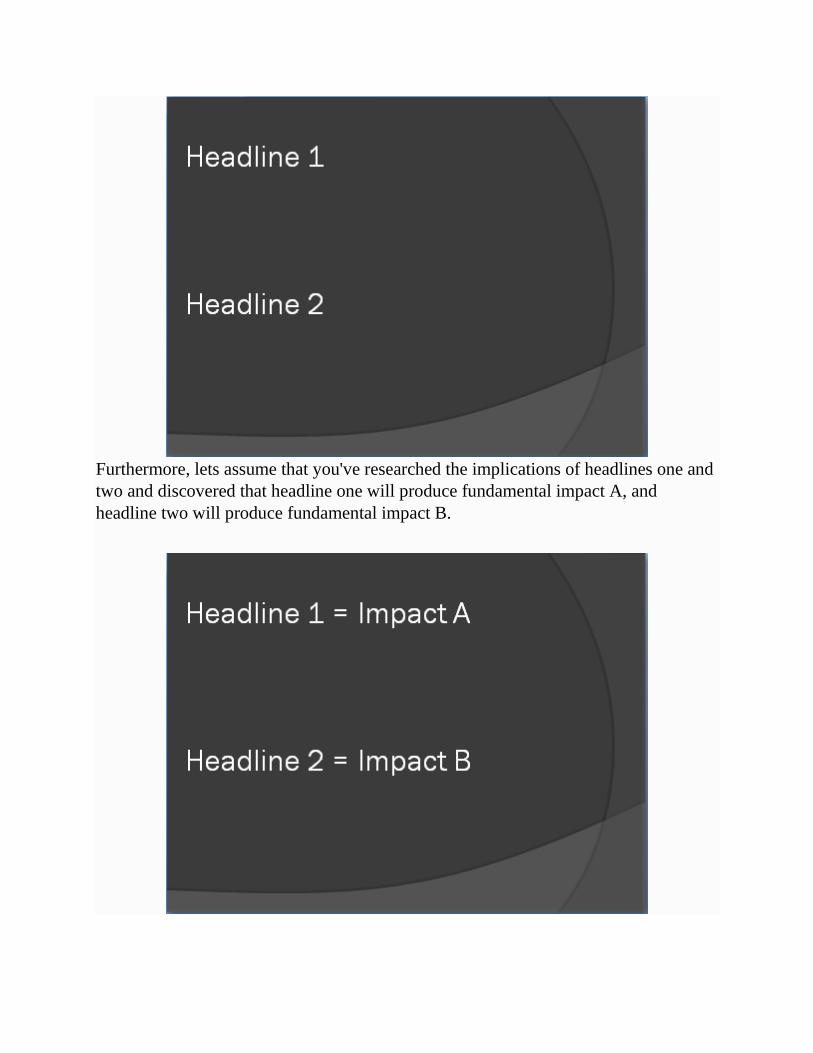
Furthermore, lets assume that you've researched the implications of headlines one and two and discovered that headline one will produce fundamental impact A, and headline two will produce fundamental impact B.

And again, to keep things simple so you can focus on the core point, lets just say that fundamental impact A will cause stock and bond prices to rise and that fundamental impact B will cause stocks to rise and bonds to fall.
Armed with this little model, after these two headlines hit, if we see equity and bonds rising we can infer that markets are more concerned with headline one then they are with headline two. In other words, headline one is the dominant driver of sentiment.

Of course this begs the question, why is headline 1 more important. Well... Who knows? You would have to dig into the news of the day to see what people are saying about the subject. But that isn't really the point.
Not at this stage anyway.
No. What's important is that we now know for sure that market participants are more concerned with headline one then they are with two. And this gives you an important clue about where to look when trying to figure out whats driving sentiment. It also gives you an important data point that you can evaluate the information you discover against.
Now hopefully this is opening your eyes to how powerfull a tool this is, but honestly this is really only the tip of the iceberg when it comes to the information you can gain from Intermarket analysis.
For example: imagine there is a big crude oil inventory surprise tomorrow. Its fairly obvious that it would impact crude pretty strongly. But since crude is a component of the broader energy commodity space, a big deviation from expectations would also hit Nat Gas, RBOB gasoline, and Ethanol futures as well.

And that's not all. Depending on how big the deviation was - and how big an impact it made on the broader energy space - it could also produce some price movement in equities and gold and the US dollar.
Well get into why these seemingly unrelated assets would move on a deviation in crude oil inventories in a minute, but I think its important to point out that anyone paying attention to USD and Equities after a big deviation hit the crude oil inventories would have received some important information regarding how much traders were concerned about oil supplies.
As another example: you can use Intermarket correlations to judge where an economy is in the business cycle. Here is a useful chart that shows the standard business cycle asset correlations.

Now armed with this clever piece of information, and a look at recent price trends across the major asset classes, one can quickly derive where a majority of market participants think we are in the cycle.
And when you really get good at analyzing these intermarket correlations, you can even use them to determine the expectations market participants have for future events. That's more of an advanced concept, and I fear you may already be getting overwhelmed with information, so well set it aside for now. But the point is, you can get a derive wide array of useful information from Intermarket analysis. And as such it would behoove you to pay attention to what is happening with asset correlations.

Of course, paying attention to them will only get you so far. In order to really get them to work for you, you need to know about the five key asset groups and what factors drive them from a fundamental perspective.
So what are these key asset groups? Well in broad terms they consist of Equities, Bonds, Currencies, Gold... and Oil. But lets break these asset classes down and determine what the key drivers for each of them are.
Equity Markets First up we have Equities. Or stocks if you prefer that term. Equities are primarily driven by Corporate earnings and the dividend yield. As corporate earnings - and the dividend yield they produce - are highly dependent upon the performance of the underlying economy, equities rise and fall in line with market participants expectations for the business cycle. Furthermore, Interest Rates can have a big impact on expectations for the business cycle, so interest rate policy is an important driver as well. But to keep things simple, I would encourage you to think of equities as the quintessential risk on asset. IE- when people feel good about the future, they buy stocks. So stocks tend to go up on good news.
Bond Markets Then there are Bonds. Bonds are also driven by expectations for the business cycle. All be it in a completely different way. Unlike stocks, which produce income via a constantly fluctuating dividend yield. Bonds pay a fixed interest payment. That means bonds are great when an economy is doing poorly because when an economy is doing poorly, equity dividend income may be reduced or eliminated by the underlying companies. But bonds will continue to deliver a steady stream of income.
This is great when an economy does poorly, but that fixed income aspect cuts both ways. So when an economy is doing well - and companies are raising their dividend yields - bonds will under perform stocks. As a result, bonds are the de facto risk off asset. IE- when people feel bad about the future they buy bonds because they are a safer investment.
There's one other important aspect with regard to bonds that you should be aware of. Bond prices and yields are inversely correlated. In other words, when people buy bonds, the price goes up but the yield on those bonds falls.
I don't want to get into why here - its not that important for our purposes. If you really want to understand all that just google bond yield calculations and you'll find more then you'll even need. The key point is just to know that prices and yields move opposite to each other. It's key to know this because it also means that when interest rates change - due to central bank policy for example - it will have a direct impact on bond prices. IE- when the central bank raises interest rates, bond prices will drop. Which means bonds will also fluctuate with inflation Expectations and expectations for changes to central bank policy.
Gold Market Ok, next up we have Gold. Gold is almost purely driven by inflation EXPECTATIONS. I emphasis the word expectations because I don't want you to fall into the trap of thinking gold has some intrinsic value and that it will rise perpetually in an inflationary environment, because it wont. Gold will rise on the expectation of future inflation, and fall on expectations that future inflation will slow. So even if inflation is currently high, you can see gold fall, because investors will see future inflation moderating.
Oil Market Oil, the fourth of our five key assets, is an important one. As a pure commodity, it is most influenced by the supply and demand metrics of inventory and consumption data. But that can encompass a wide variety of factors. Things like geopolitical risk in the middle east, or brisk economic growth in china, can have profound implications on the supply and demand for oil. As a result, its a powerful tool for deriving the relevance of all manner of headline events.
Foreign Exchange Market And finally we have currencies, which are traded in the Foreign Exchange, or Forex markets. Forex is mostly driven by the relative opportunity for growth between countries. In other words, money flows from countries with bad prospects into countries with good prospects as investors chase the best yield. That flow causes the value of the good prospect countries to rise vs the bad prospect countries.

Domestic NET bond yields - or yield minus inflation - is a good proxy for a countries growth prospects. So money tends to flow from countries with low net bond yields, into countries with high net bond yields. Which is known as the carry trade.
Forex is a very complex asset class because its heavily influenced by portfolio capital flows of investors trying to chase yield and minimize risk. The currency itself is valueless, and cant be fundamentally appraised, so the key to anticipating FX movement is to figure out which countries are likely to attract the most foreign investment.
We could probably spend a full month discussing all the various FX drivers, but the above concepts can be used to puzzle out the most important of them on your own.
The How To Now, my suggestion would be to pick one security from each of these asset groups and track them constantly.
How do you know which one to pick? Well, it sort of depends on what your primary trading asset is.
To give you an example, I personally prefer to focus my trading on the Dow Jones Industrial Average futures contract - ticker symbol YM - during the New York trading session. Since my primary trading asset is tied to US Equities, during the US session, I'm primarily concerned with whats going on with US markets. As a byproduct, I have hourly charts of the following additional securities up on my screen over my entire trading day:
o For Bonds I watch The 10yr US treasury Futures Contract.. ZN. o For FX, the USD Index Futures Contract... DX o The Gold Futures Contract... GC.. covers that area. o And of course for Oil I track the granddaddy of them all, the WTI Crude Futures
Contract... CL Now Id like to note that, while I almost never trade those other assets, I still keep them up on my screen 24 hours per day because with one glance they allow me to see how the entire universe of US assets is reacting in real time to the events of the day.

Of course, while this works for me, it isn't likely to work for you or anyone else. The fact is this collection of securities was chosen because it meets my preferred trading vehicle, the jurisdiction I trade from, my time zone, and the data subscription package I have perfectly. But it probably wont do an Australia based, Aussie Yen FX trader operating in the Asian session a lick of good.
Once we have our tracking assets, how do we analyze them day to day? Well look. I could give you some grand theoretical model, but I think you have had enough of that for one day, and its probably not the easiest way to learn this anyway.
No. I think this will be much easier to explain via an example. For this example we're going to use the events of November 7th, 2013.
We're going to start with German Industrial production, which came out at 6am est. with a rather substantial miss. Expectation was for a 0.20% rise and it came in at a 0.9% decline. As germany is a member of the European Monetary Union, this should have been bad for the euro. However, as you can see in teh chart below, Euro dollar barely wiggled with a 9 pip excursion before returning to near pre event levels.

This tells us one of two things. Either a) German industrial production just isnt important given the key themes driving markets, or b) it may be important, but there are scheduled events later in the day that are more important for those themes.
Unfortunately, given large number of still pending items on the calendar that day, its impossible to know which one it is at this stage. Thus the proper course of action here would be to make notes in our journal about the reaction so that we can try to get closer to an answer the next time this event rolls around.
Still, if this big miss in German data can't move euro more then a handful of pips, its safe to conclude we needn't concern ourselves with it as being part of any major themes at this stage.
Now lets contrast that with an event that DOES matter: At 7:45am est, the European central bank was due to release a decision on interest rates. Expectations were for the ECB to leave rates unchanged at 0.50%. However, Mario Draghi surprised the market by cutting by 25 basis points, which produced an immediate, and very large impact.
Lets run through some charts and see what we can use our intermarket analysis skills to learn...
To continue with our previous example, lets see what it did with the euro.

Now before we go any further, I'd just like to point out that the little nub of a move on the following chart was the German industrial production numbers we discussed earlier.

Even if you know absolutely nothing about economics, interest rates, or industrial production, I think after looking at this chart it would become plainly evident that interest rates are WAY more important to market participants right now then industrial production is.
But putting that aside, what does this move tell us about the event itself?
Well, it tells us that this cutting of interest rates is somehow bad for the euro. But why? Well, lets bust our our trusty asset cheat sheet from earlier and see if it can help.
We learned earlier that Forex is primarily driven by the relative growth rates between countries, and that net present bond yields are a good proxy for that metric. By definition a lowering of interest rates reduces a countries net present bond yield because the yield itself falls. So this euro move makes complete sense given what we know about Forex.
Now i'd like to point out that what we just did is use the price action an event produces to validate if an asset is performing inline with our understanding of the

event. This is one way to use the information we have discussed to gain useful info, but its not the only way.
To make the point, lets switch over to gold.
After a brief period of uncertainly:
The event caused a fairly strong move higher in gold:

What does that mean? Flipping to our cheat sheet for gold, which tells us that gold is primarily driven by inflation expectations, we can conclude that market participants see this event as increasing the risk of inflation. From this we can conclude that, one way or another, a lowering of interest rates increases the risk of inflation. Which even if you know nothing about interest rates, or inflation, is powerful information that you can use in the future...
But what if you wanted to know WHY a reduction in interest rates would cause market participants to fear an uptick in inflation? Putting aside the fact that this is a ridiculously well informed question to ask - one that many of you would likely never have thought to ask prior to reading this lesson - its a question that you could very easily find an answer to on Google. So easy in fact that Google will save you from typing out the whole question...
Now I'm not going to get into the inflation discussion here as that wasn't the point. What I wanted you to see is that by analyzing the markets in this way, it can lead you to ask the type of questions that can lead you toward a much greater understanding of

economics, markets, and how the world of finance really works. Which is only going to help you in your trading career.
And still we haven't even begun to scratch the surface with whats possible here!
Looking at oil we can see that this decision has produced an uptick in prices, which we can use to conclude that a lowering of rates is stimulative of global growth and the demand for oil.
Look at equities, we can see that it stimulates corporate profits and the demand for risk.

But to really see the magic of this tool, lets move forward to another event that was scheduled for that day: Preliminary united states 3rd quarter GDP, which came out approximately 45 minutes after the ECB decision at 8:30 am est.
The expectation for this event was a print of 2.0%. However, it also surprised the market, coming in at a much stronger 2.8%, with upward revisions to the previous month.
This was actually a blockbuster report which nobody expected. Prior to the close of the 3rd quarter, there was a great deal of concern that a government shutdown, scheduled to begin on October 1st, would cause consumers and businesses to hold off on spending. Spending is a large component of GDP, so this should have produced a fairly weak number and everyone was anticipating that outcome.
With such a big beat, it was inevitable that market participants would give this number strong consideration within the context of existing market themes.
Now before I get into a review of what happened, I'd like to point out that this event SHOULD have been good for equities, because it meant more people were spending and that would be good for corporate profits. Good for oil on increased demand. Good
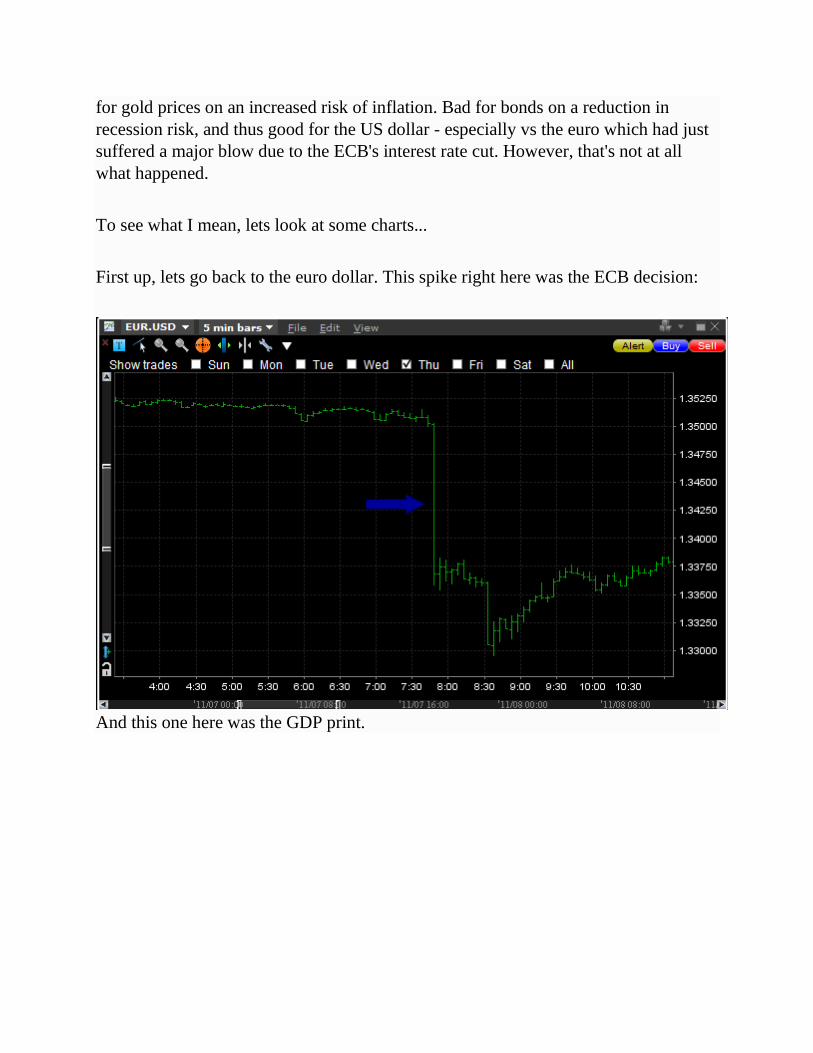
for gold prices on an increased risk of inflation. Bad for bonds on a reduction in recession risk, and thus good for the US dollar - especially vs the euro which had just suffered a major blow due to the ECB's interest rate cut. However, that's not at all what happened.
To see what I mean, lets look at some charts...
First up, lets go back to the euro dollar. This spike right here was the ECB decision:
And this one here was the GDP print.
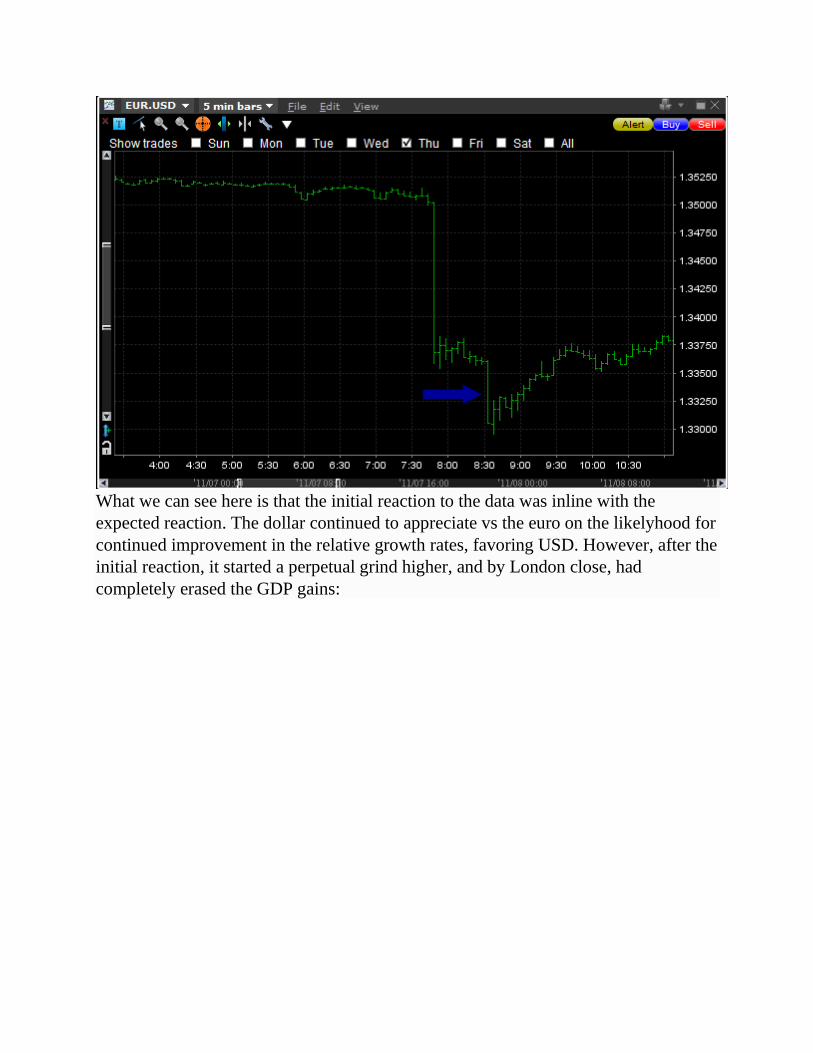
What we can see here is that the initial reaction to the data was inline with the expected reaction. The dollar continued to appreciate vs the euro on the likelyhood for continued improvement in the relative growth rates, favoring USD. However, after the initial reaction, it started a perpetual grind higher, and by London close, had completely erased the GDP gains:

And while this chart doesn't show it, the grind higher actually continue late into the US afternoon.. meaning that somehow, this fantastically good GDP number had actually been better for the euro then it had been for the USD.
Here's a chart of gold showing the pop on the ECB:
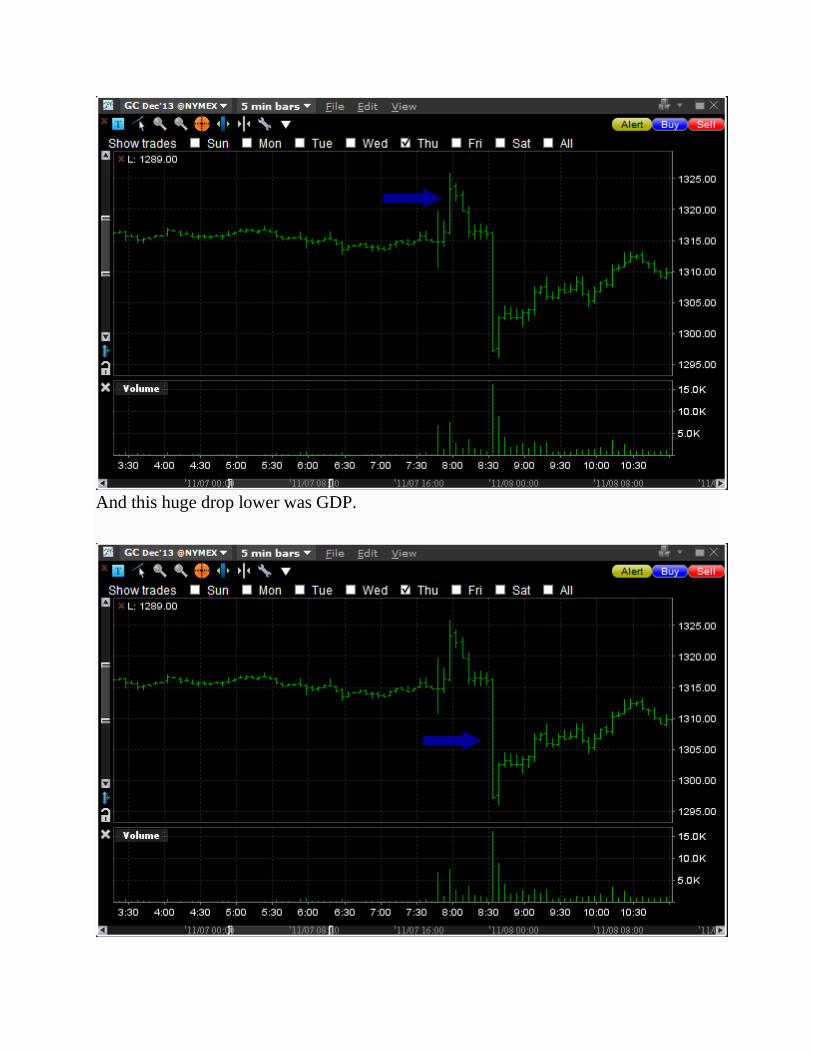
And this huge drop lower was GDP.
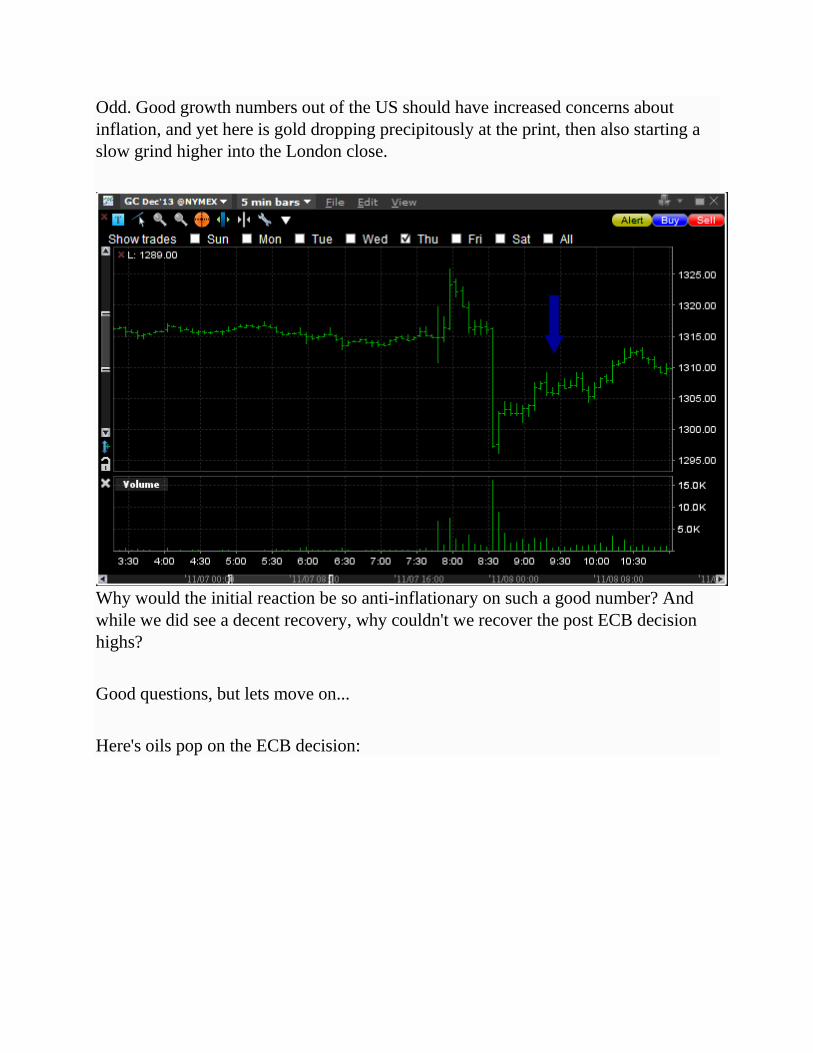
Odd. Good growth numbers out of the US should have increased concerns about inflation, and yet here is gold dropping precipitously at the print, then also starting a slow grind higher into the London close.
Why would the initial reaction be so anti-inflationary on such a good number? And while we did see a decent recovery, why couldn't we recover the post ECB decision highs?
Good questions, but lets move on...
Here's oils pop on the ECB decision:
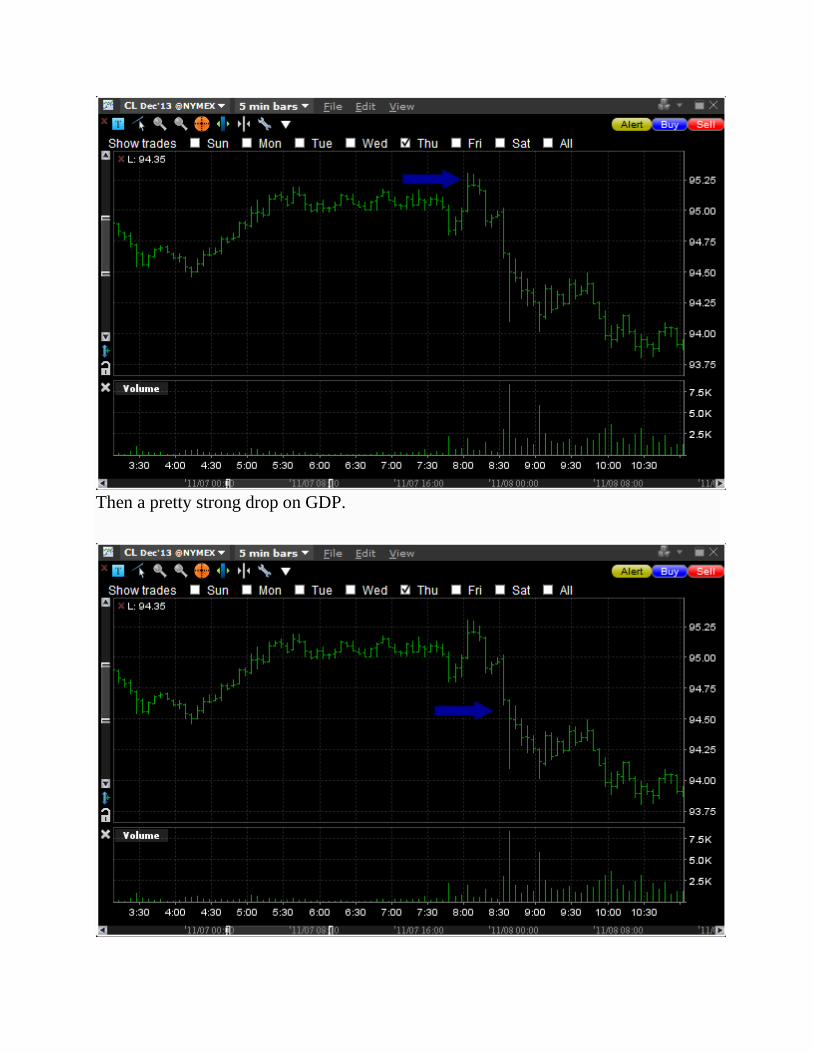
Then a pretty strong drop on GDP.

Again, it doesn't make sense because if the US is growing so strongly, oil demand should be increasing and prices should be higher, yet it drops hard and continues falling all morning.
Here are 10 yr us treasury bonds ECB spike:
GDP print.

The initial reaction here makes sense given the lower risk of recession, but then it seems to chop around all morning with no clear direction.

Maybe equities can shed some light on the situation? Nope. Here's the ECB:
Little spike on GDP:

But lower? This should be a great number for corporate profits, yet we get no real movement for nearly an hour, and then it starts selling off - which by London close had turned a DOW +100 morning into a down day.

So lets just recap: USD is lower vs euro, gold is telling us inflation risk has declined, oil tells us global growth is likely to slow and demand weaken, bonds are confused, and equities are telling us that traders would prefer to shed risk. Almost the polar opposite of what SHOULD have happened given the strength of the report.
Looking at the news of the day, we can see that, though the headline GDP report was solid, the internals may not have been as good as it first seemed. Heres an excerpt from a Reuters daily recap article:
...Separately, data showed the U.S. economy grew 2.8 percent in the third quarter, but that estimate, which will be revised, was affected by a larger-than-expected build-up of inventories, which tends to subtract from growth later on. Initial jobless claims fell 9,000 to a seasonally adjusted 336,000 last week, roughly in line with expectations.
But that doesn't really explain the price action. It was a big beat on the headline.. so even if we were to account for the larger then expected inventories, we would have to conclude that the report is in line to slightly positive. That shouldn't have caused the sell off in risk that it did.

That having been said, if you continue down a bit further in that article, you get your first solid clue:
...Those reports, as well as Friday's much-anticipated jobs numbers, will give investors some insight into how long the Fed will keep buying $85 billion a month in bonds. The central bank's stimulus has been a key component of the 24.1 percent year-to-date gain in the S&P 500, putting the index on pace for its best yearly performance since 2003.
For those of you who haven't been living under a rock these past 3 years, you know what they are talking about here is the Fed's Quantitative easing program. And while this article isn't the most articulate at referencing the subject, what their saying is that the GDP report relates to a market theme known as the Fed Taper.
For a much clearer hint on what was up, you could have looked at the pro news feed at the order flow trading website. A quick perusal of the mornings news would have turned up these gems of insight:
Literally 1 minute after the event hit we told you what key theme this event would impact, and gave you a solid clue on what impact it would have.
Now I really can't fault Reuters for not telling you explicitly what was going on because, after all, this is been a rather clear theme for several years now. Anyone who has been paying attention SHOULD know what quantitative easing, and the fed taper are all about.
We go a bit of an extra mile because our feed is designed to help aspiring traders learn and apply the order flow trading concepts, but whatever. That's not really the point here.
Even if you didn't know anything about QE, or the taper, or what it meant for financial markets, armed with your intermarket analysis of the GDP impact, one way or another you would eventually come across the terms. And with some quick research you would be able to glean that a reduction in quantitative easing by the fed

would lead to slower growth, lower inflation risk, and a sell off in bonds. Which, interestingly enough, lines up almost perfectly with what we saw throughout the morning post GDP.
And why would GDP increase the taper risk? Because the Fed is basing its decision for when to taper on the strength of US data like growth and employment.
Now look, I know this example is a little hard to follow here, so let me just try to sum it up: Looking at the price action we got post GDP data, we can conclude 2 things. 1... for some reason the GDP report was quite a bit more important then the ecb rate cut. In many cases our intermarket assets not only erased the ECB move, but actually went beyond where they started. And 2... this GDP report didn't behave like a typical GDP report should, given the strength of the numbers.
Armed with that info you would need to dig into the news in an effort to uncover what sort of themes people are talking about which could line up with the results we saw.
That, or you could cheat and just ask some the many professionals that hang our on ourtrading floor. But regardless, if you search anywhere long enough, you'll likely stumble across the theme within which the observed price action makes sense. In this case it happened to be the QE taper theme, and thus we know that QE taper is a much bigger deal then an ECB interest rate decision, but no matter what the price action or theme in play, by engaging in this process you will be able to build up a solid pool of understanding for which themes are important, their precedence, and the typical impact they are likely to produce given various outcomes.
And once you can do that, you can start trading these type of events in some impressive ways. Just as I did that day with a YM short in the face of an impressive GDP beat at a time when the ECB is cutting rates.

It wasn't the cleanest trade I've ever done. Took 3 failed attempts before I finally caught a entry that stuck, but it still exemplifies the point that there IS practical value in learning how to analyze these relationships.
Lesson Recap In this lesson we learned that by analyzing the ever changing correlations between different asset classes, we can derive which sentiment themes are important, their precedence, and their likely impact given different outcomes. It was a long lesson and you'll probably want to reexamine it a few times over the next week or two, but don't stress if it isn't making much sense because in the next lesson I'm going to tell you about a powerful shortcut you can take to simplify the process.
Sentiment Made Easy In the preceding lessons I outlined a methodology for deriving the key market themes driving sentiment, and honestly I think it’s about the best theoretical explanation anyone could ever come up with for doing so. However, that still doesn’t make it easy.

Historically reading sentiment has been the hardest part of this program for aspiring order flow traders to master and, as you’ll learn when we start discussing system development, mastering it is a critical part of long term success as an order flow trader. Unfortunately I don’t think there is any easier way to explain the concept.
However, I’ve recently discovered a powerful tool that really helps to simply the day to day process of reading sentiment.
While there is a cost involved, I think that given its ability to simplify what is otherwise a very complex task, its well worth the investment.
What is this wonderful tool? It’s called MetaStock Xenith.
Now before you go clicking that link Let me explain how and why it’s so effective at helping aspiring traders figure out sentiment.
The first thing you need to understand is that Xenith is a professional news and data platform, very similar to a Bloomberg or Reuters Eikon Terminal. In fact it kind of IS a Reuters Eikon Terminal as it’s basically the same software, just packaged for retail traders and priced accordingly; which is a big deal because the standard Eikon Terminals cost upwards of $2,000 per month. Xenith, by comparison, starts at just $99 per month and allows you to access (almost) all the same content, tools, and features of the much more expensive professional tools.
In any event, the key feature it offers for our sentiment reading needs are the “top news” pages that look this:

Foreign Exchange Top-News Page
Regardless what asset you’re trading, you can very easily figure out what’s driving it because the analysts at Reuters prioritize current events for you:

Theme Prioritization
Instead of having to reverse engineer what the most important themes are via Intermarket analysis and google, all you need to do is look at the top news page for the market you’re trading, read the first three articles listed, and boom! you know exactly what the markets are focused on at that moment in time.
And that’s really just the tip of the iceberg for features that will make your life easier!
The Fastest Access to Data Releases Available The Economic Events Monitor will give you instant access to data releases like non-farm payrolls and GDP. And when I say instant, I mean instant. You’ll get the numbers at the exact same moment that the largest and most powerful bank and hedge fund traders do. Complete with pre-calculated deviation from expectations, and all the historical data you need to put it in context.

Economic Events Monitor
Breaking News The Real-Time Streaming News widget gives you instant access to the headlines and political events that will impact prices. Whether it’s a speech from an important government official, an unexpected natural disaster, or the latest updates on an evolving political theme, you’ll get the up to the minute info you need as its happening.

Streaming News Widget
And tons more. The truth is, I could go on and on about all the amazing things you can find with Xenith, but even if you only used it for the above features, it will more than pay for itself every month.
It won’t give you much in the way of order info (you’d still want to use the Order Flow News Feed for that stuff), but if you’re having difficulty figuring out how to read sentiment, this is by far the easiest way to do it.
Now you can even get it at a discount! We have a great relationship with the guys over at MetaStock. Our news team uses Xenith to get super fast access to all the latest market moving information, so have quite a few of these subscriptions for internal use.

Having this great relationship with them has allowed us to broker a deal where our site users can get 3 months of Xenith for the price of one! That means you can get your first 3 months of Xenith for as little as $33 per month, and all you have to do to get the discount is signup via this form, or call 801-265-8886 and mention promo code “orderflow3for1”. It really is a powerful tool and can save you tons of time. So I strongly encourage you to at least give it a try. And if you do get a subscription, let us know via the admissions office and we’ll email you detailed instructions on how you can set it up to make sentiment reading super fast and easy.
Lesson Recap Now that you have a pretty firm grasp on how to read sentiment and Intermarket correlations, you should have everything you need to exploit fundamental trader order flow.
There are still a few more participants to cover though. So let's wrap up this stage of your development with a look at other participants.
Other Participants The Technical and Fundamental participant activity that we have thus far analyzed makes up maybe 70-80% of daily order flow, and now that you know how to read that activity, you likely have enough information to start earning consistent profits from the market. However, without knowing what drives that remaining 20-30%, you are not going to achieve the type of staggeringly impressive income that is available to you.
Making up that 20-30% are a number of “other participants.” These other participants include option players, commercial hedgers, and sovereign entities. Each of these participant types not only employ a wide range of analysis and trading techniques, but often have alternative motivations for participating in the markets.
In this lesson, we are going to explore these other participants, learn what motivational factors drive them, and ultimately, discover how their behavior influences the order book.

Option Players Of the three participant types we will outline in this lesson, the most important for our purposes are the option players.
Now I am not about to start detailing the near infinite variety of option strategies that exist because for the most part, they have little impact on spot market prices. Options trade on their own exchanges and while they are intrinsically connected to spot and futures market prices, they are fundamentally a separate security type. Option exchanges have their own dealers, their own prices, and their own order flow. There are however, two option varieties that you will want to understand: No Touch and Knock Out options.
No Touch, NT, or DNT options provide a payout to the buyer if a securities spot market price does not penetrate a specific level. For example, if the price of EUR/USD is at 1.4000 and I believe price will remain below 1.4100 for the next week, I can buy a one-week NT option with a strike of 1.4100. If I am right, the option will pay off after one week and I will earn two or three times my investment. Alternatively, if I am wrong and price reaches 1.4100, even for one second, my option expires worthless and I lose the money I spent on it.
Knock Out or KO options are the exact opposite. They pay out only if price reaches the strike price prior to expiration. For example, again EUR/USD is at 1.4000, only this time I expect price will move up to and beyond 1.4100 in one week. Buying a one week KO option with a 1.4100 strike will pay out if price reaches 1.4100, even if it is only for one second. If it remains below 1.4100 for the week, my option expires worthless.
These options have a profound impact on spot market activity because they create large incentives for both the option buyer and seller to try to influence prices. Mind you, when I say large incentives, I’m not exaggerating. The average NT or KO option payout is ~$250 Million and it is not unheard of to see $1-3 BILLION payouts now and again. There is serious money riding on the target price points and when you are talking about that kind of cash, you can expect to see some serious effort put into ensuring an outcome.

To work out the likely outcome, all we have to do is analyze the incentives of each participant in the transaction. I think you can see this clearly with an example, so let us put one together…
Imagine I sell you a $100 million NT option on EUR/USD with a strike at 1.4100. For the opportunity to earn that payout, you are going to give me $50 million as option premium.
At this point, I have a $100million incentive for price to reach 1.4100. You have a $100million incentive for it to remain at or below 1.4099.
Now with price at 1.4000, neither of us can really do anything. Its far enough away from the strike that you needn’t worry about it, and it’s too far away for me to justify trying to take it out.
However, if price were to move up to say 1.4070, things would change dramatically. At that point there would only be 30 pips separating me from a $100million payday. That works out to about $3.3 million per pip.
If you put yourself in my shoes, you would quickly realize that I have a substantial incentive to try and push price up to the strike level. From there its only a hop, a skip, and a jump to realizing that I can lose up to $3.3million on each incremental pip, and as long as I actually triggered the strike, I would still come out ahead.
To risk $3.3million per pip on a EUR/USD, I would need $33 BILLION position. In other words, I can spend up to $33 billion pushing prices up 30 pips, and as long as I triggered the strike, I would still make money on the deal.
Of course, you would have identical incentives to defend the strike rate from being reached. You could deploy $33 billion in limit sell orders at 1.4070 and as long as that was enough to prevent the strike from triggering, you would come out ahead.
Tragically – for you, the option buyer – that isn’t the whole story. See, unlike me, you have a finite point at which the trade no longer makes sense to defend. Once price touches 1.4100, you have lost and any position accumulated defending that level becomes a liability, exacerbating your losses. As such, you have a clearly defined
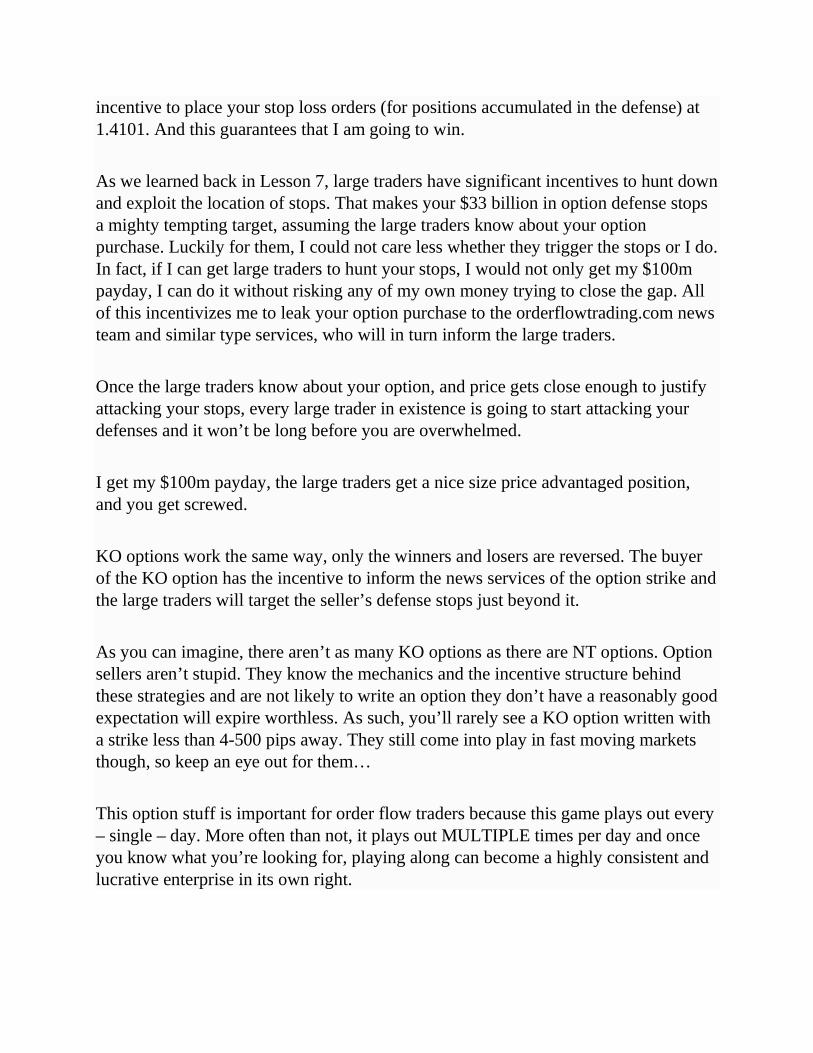
incentive to place your stop loss orders (for positions accumulated in the defense) at 1.4101. And this guarantees that I am going to win.
As we learned back in Lesson 7, large traders have significant incentives to hunt down and exploit the location of stops. That makes your $33 billion in option defense stops a mighty tempting target, assuming the large traders know about your option purchase. Luckily for them, I could not care less whether they trigger the stops or I do. In fact, if I can get large traders to hunt your stops, I would not only get my $100m payday, I can do it without risking any of my own money trying to close the gap. All of this incentivizes me to leak your option purchase to the orderflowtrading.com news team and similar type services, who will in turn inform the large traders.
Once the large traders know about your option, and price gets close enough to justify attacking your stops, every large trader in existence is going to start attacking your defenses and it won’t be long before you are overwhelmed.
I get my $100m payday, the large traders get a nice size price advantaged position, and you get screwed.
KO options work the same way, only the winners and losers are reversed. The buyer of the KO option has the incentive to inform the news services of the option strike and the large traders will target the seller’s defense stops just beyond it.
As you can imagine, there aren’t as many KO options as there are NT options. Option sellers aren’t stupid. They know the mechanics and the incentive structure behind these strategies and are not likely to write an option they don’t have a reasonably good expectation will expire worthless. As such, you’ll rarely see a KO option written with a strike less than 4-500 pips away. They still come into play in fast moving markets though, so keep an eye out for them…
This option stuff is important for order flow traders because this game plays out every – single – day. More often than not, it plays out MULTIPLE times per day and once you know what you’re looking for, playing along can become a highly consistent and lucrative enterprise in its own right.

And just as a side note, this is precisely what I was doing in that Ohh Sweet Liquidity thread I told you about back in orientation. It was my first consistently profitable system and I continue to use it to this day. So its definitely something worth paying attention to...
Of course the next question your likely to ask is, how do I locate these options?
It’s a pertinent question because this information isn’t on the charts.
Well it is on the charts, but it takes a trained eye to see them…
A much easier method involves reading the “order board” information that our news team distributes every day via the Trading Floor. The order board is a hugely valuable resource for option placements because it hands you all the pertinent information on a silver platter. Size, strike, and type are all neatly laid out in a nice little grid format at least once per day. With that in hand, all you have to do is mark the strikes on your charts (preferably in their own color) and you can go to work exploiting them. Now we’re going to talk more about hunting options – and a bunch of other order flow trading strategies – when we get to the system development lessons. However, at the moment, we still have a couple more participants to get through, so I’ll humbly ask that you indulge me just a little more…
Commercials As we learned back in the beginning, commercials are the importers/exporters that utilize the currency markets primarily to hedge and settle their everyday international business transactions. For the most part we needn’t concern ourselves with what the commercials are doing.
While it is true that they frequently transact billions of dollars in a day, they usually try to do so with the smallest impact on price possible. More importantly, like fundamental participants, commercials execute their orders based on information that exists outside the chart. In the case of fundamental participants, we have a mechanism for extrapolating their aggregate behavior, but there is no such opportunity for us with commercials. Commercials trade based on their internal company needs and these needs often have little, if anything, to do with identifiable economic factors. Therefore, we cannot read their order information, even if we want to.

We can occasionally get “some” information about commercial order activity from our news contacts, but to be honest, I do not think it is detailed enough to do anything with. So while commercials are often big players in the markets, I find it isn’t worth considering them. On rare occasions, ignoring them has come back to bite me in the form of lost trades, but I think it’s a small price to pay for the easy profits that can be made focusing on everyone else.
In short, I suggest you just ignore the commercials. There are much easier rows to hoe.
Sovereign Entities Unlike commercial – who you can safely ignore – sovereign entities like central banks, (quasi or traditional) government agencies, and government sponsored enterprises require your utmost vigilance. It is important that you pay attention to these participants because they are by far the largest players in any market within which they participate. And if you find yourself caught on the wrong side of their trading activity, you can find your account emptied in the blink of an eye.
The primary concern of sovereigns is market stability. They generally prefer to let markets function as other participants see fit because, for the most part, markets are pretty stable. As such, it’s quite rare to see a sovereign participating in a financial market. However, when speculative exuberance or economic conditions lead to large swings in asset values, sovereigns can attack with ferocious impact.
By following our news team;and other news sources, you can generally track the concerns sovereigns have, but it’s important that you realize no matter how much you believe you know what they will do, sovereigns are totally unpredictable entities.
I have seen people enter positions on expectations a sovereign will defend a price level. I have also seen them step in front of an intervention once its begun – no doubt by traders with aspirations of reenacting the heroic story of George Soros breaking the Bank of England. But no matter what strategy I have seen employed, every trader I know who has tried to play a sovereign intervention event has lost money. And tragically, more often than not, those losses extended to a complete blowout of the account.

In my younger years, I too tried to play sovereign events but it always ended in losses. After countless failed attempts, I finally concluded that the best course of action when it comes to sovereigns is to get the hell out of their way. And if you’re wise, you’ll follow my suggestion and do the same.
How does one do that, you ask? Again, by following our news feed.
Our news feed is great on so many levels, but I think one of its most valuable aspects is that it gives you access to all the latest sovereign rumors. Most of the rumors will take the form of X or Y Government Sponsored Entity (GSE) is on the bid at Z price. And in my experience, as with commercial players, they can be safely ignored.
However, and this is critically important, when you start hearing direct quotes from Central Bank leaders, Finance Ministers, Treasury Department officials, and their equivalents, related to “excessive” price changes, it’s time to start lightening positions. Shortly after those comments start, you’ll begin hearing rumors of intervention or “price checking” by one or more sovereign entities. Once those rumors start, IT IS TIME TO GET THE HELL OUT! Close any positions related to the currency in question and either switch securities or stay on the sidelines for the foreseeable future.
It won’t be easy to do. Usually heading into intervention there will be some extreme one way price action and you’ll fear leaving a bunch of money on the table. It will require a level of discipline that few other situations in life call for… but that is what separates the long-term winners in the business from the other 95%.
Remember, long-term success in this business is heavily dependent, not on the size of your wins, but on the number and size of the losses you avoid. Keep your losses small and infrequent and, over time your winnings will become the envy of your peers.
Lesson Recap A great deal of the strategies and tactics other market participants employ will forever remain invisible to us. But that doesn’t mean we should ignore them. Some of their strategies are highly exploitable while others can have a substantial impact on the markets. As you come to the end of these lessons and begin implementing what you
have learned, I would suggest that you initially focus on reading the fundamental and technical order flow because it really has the most bang for the buck. Then, once you have a firm grasp of the easy stuff, start digging into the mountain of information about these other guys. Who knows, you may be able to find new ways to exploit them.
Now, this lesson brings us to the end of the order flow mindset discussion. Again, by no means is this a comprehensive analysis of every detail in this subject. I could go on and on and on with examples of participant strategies and the order flow consequences, but I fervently believe that there is enough information here for you to figure the majority of it out on your own. Just apply the principles we have explored to any strategy you’re curious about, and you should be able to quickly surmise the consequences.
I'd also like to strongly encourage you to follow our news feed. The primary reason I built the news feed service was so that traders like you, who have gone through these lessons and developed the order flow mindset, could have a real time analysis tool that they can compare their own analysis to. In other words, at this point you should have a general idea of the processes for reverse engineer the order book and reading market sentiment. However, there is a wide gap between having a general idea and mastering the day to day execution of those processes. My team of analysts and traders who run the news feed have become masters of these processes and provide real time updates on both order placements and market sentiment for a wide range of assets. My suggestion would be to do your own analysis, then compare your analysis to what is posted on our news feed. That will allow you to identify what your doing right, and what areas might still need work. And that's going to dramatically shorten your timeline to profitability.
When you feel like you have a decent grasp of this stuff, and your ready to turn your mindset and order flow analysis skills into a profitable trading system, you'll want to move on to the next lesson.
Playing the Metagame At this point you should have a fairly good working knowledge of order flow theory. Hopefully you’ve taken my advice and spent some time reverse engineering the order book, analyzing sentiment, and comparing your analysis to that provided in the news service.

If you’ve followed that advice, you no doubt appreciate how powerful this stuff is, and how it can help you get closer to profitability. But you’re probably also cognizant of the fact that, in and of itself, theory can only take you so far.
In order to actually achieve long term profitability, you need some sort of structure for managing your day to day trading activity. And this is where we need to get into the subject of trading systems.
There are literally thousands of trading systems you can employ based on the information you’ve learned in this program, but most of them will rely on one of three core tactics.
Over the proceeding lessons we’re going to look at each of these 3 tactics in detail, but first I’d like to make a few important points.
There are basically 4 questions that all systems must addressed, and they must be answered in a way that leads to long term profitable trading.
What are these questions that every system must answer?
Let’s take a look:
o Question 1 - Which direction is price going to go? o Question 2 - What is the target? o Question 3 - When do I get in? o Question 4 - How do I protect myself if things go bad? That’s it. If you can answer those 4 questions on a trade by trade basis, and get it right more than 50% of the time, you have a long term, consistently profitable trading system. And the great thing is, if you’ve read through the previous lessons, you already know the answers to half of these questions.
How do you know which direction price is going to go? Easy! By reading Sentiment. Price is going to gravitate in the direction of sentiment and you want to be positioned to take advantage of that directional bias.

How do you know where it’s going to go? Even easier! In the lessons you learned that prices gravitate toward large concentrations of stops. That makes them a pretty solid target.
So really, the big unanswered questions are, a) when do you get in and b) how do you protect yourself when you do.
In other words, what are the entry criteria, and where should you put your stop?
The good news is, those questions are a lot easier to answer then you might think.
Now, I'm going to let you in on a little secret. For all the shit that has been said, or written, broadcast, or produced, ALL trading systems can be boiled down into 1 of 3 basic types. What I like to call tactics 1, 2, and 3.
All three of these tactics can be expressed via this very simple graphic:
Now you might notice that this as a basic 1-2-3 or a-b-c price pattern, and while it may be hard to believe, the entire universe of profitable trading systems can be explained via this simple chart.
For those who may not have seen this before, this first blue line, is a directional move:

That move terminates at point 1, setting up the second blue line, which is known as a pullback:
The pullback terminates at point two, setting up the continuation move:

Hopefully, the continuation move breaks beyond the previous moves termination point, as expressed by the dashed line in the following graphic, to reach point 3, where the process can start over again:
All pretty simple stuff, but as I said, you can use this very simple graphic to represent the entire universe of viable system options. So let's take a look at them.
Here is Tactic 1:
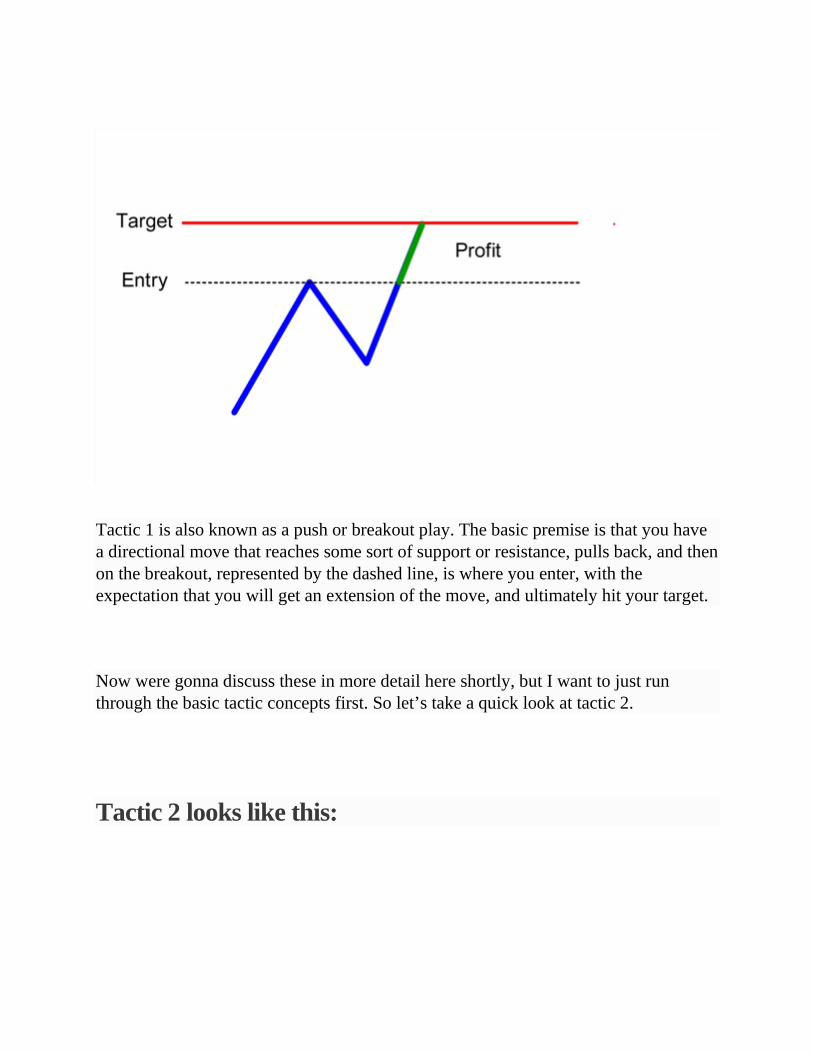
Tactic 1 is also known as a push or breakout play. The basic premise is that you have a directional move that reaches some sort of support or resistance, pulls back, and then on the breakout, represented by the dashed line, is where you enter, with the expectation that you will get an extension of the move, and ultimately hit your target.
Now were gonna discuss these in more detail here shortly, but I want to just run through the basic tactic concepts first. So let’s take a quick look at tactic 2.
Tactic 2 looks like this:

Tactic 2 is the pullback tactic. Again you have your directional move, which terminates at point 1, and then pulls back. By leveraging some sort of trigger, the systems built on this tactic seek to enter at or near the apex of that move, represented here by the dashed line, with the idea that you will capture the extension move.
Finally we have Tactic 3:

Tactic 3 is known as a ranging or mean reversion play. The idea here is that you’re looking for a direction move that has, for one reason or another, become over extended. By identifying that overextension, and some sort of trigger point at which price is likely to reverse, you can enter at the dashed line and capture the shift back to normalcy, or some sort of calculated mean rate. And that’s pretty much it for viable systems.
Of course the mechanics of how you figure out where the various reversal and termination points occur are all the subject of much debate. That’s really what makes the millions of systems out there different from one another, but it doesn’t change that fact that every viable system idea, that you’ve ever heard about, or are likely to hear about in the future, will fit into one of these 3 broad categories. And the ideas I’m going to talk to you about over the next few lessons are no different.
What IS different, is that I’m not going to pretend that my particular tactic or rule setup is the best collection of rules on earth and that you’d be a fool not to follow my

lead. No, I’m gonna show you how you can use these basic tactics, combined with the information you’ve learned thus far, to construct the best system for YOU.
So with that goal in mind, let’s hop over to the next lesson and take another look at tactic 1.
Lesson Recap In this lesson we learned that there are 4 basic questions every profitable trading system must be able to answer; what is the direction, entry trigger, target, and protective stop? We also learned that all profitable systems can be expressed via a basic a-b-c or 1-2-3 price pattern and discussed what that pattern looks like.
In the next lesson were going to examine the first of three core tactics that you can use to build a highly profitable order flow trading system around.
OFT Tactic 1 System

Now as you can see, this is same general premise we’ve outlined for tactic 1 already… only this time we have some additional details.
First, instead of some nebulous “target” you’ll notice that we’re looking to exit our position at a cluster of stops.
Second, we have that big green arrow labeled sentiment, and this is a key aspect of an order flow based tactic 1 play.
The problem with most technical based systems is that they rely exclusively on chart patterns. As such, they frequently throw off signals for both long and short trades.
And sometimes even give you both signals at the same time.
But the reality is, prices generally have some sort of directional bias. When you take trades in the direction of that bias you tend to win, while trades against that bias tend to lose. So by taking trades based solely on the chart patterns, you tend to, net net, break even over time.
And to be perfectly honest, if I sent you out in the world to play breakouts with stops as your target, you’d very quickly find that the systems perform about as good as any tech based strategy. In other words, you wouldn’t do better than about break even.
However, when you confine your trading activity to periods of strong directional sentiment bias, and only trade in the direction of that bias, well now you’ve got something that is going to produce far more wins than losses. And ultimately, that’s what you’re going to need in order to make serious money in this business.
So look, let me summarize what I’m saying here. To effectively trade a OFT tactic 1 play, you want to locate an opportunity where sentiment is strongly biased in a direction. When you have that, you look for some juicy stop levels to target. Then you can start looking for an entry.
The entry criteria are that you have a pullback of some sort, and the moment you break the previous swing point (the dashed line), you enter in the direction of sentiment, with the juicy stop level as your target.

Of course, if you’re paying attention you’ll notice we’re still missing an answer to one of our 4 key questions. Namely, where do we put out protective stop?
You really only have two choices with this.
First, you can put your stop behind some sort of protection, like the apex of the pullback:
Alternatively, you can use some sort of fixed stop:

Both options have their benefits and drawbacks. Putting your stop behind protection will increase your win rate, but your risk reward ratio will be relatively low. Going with a fixed stop will increase the risk reward ratio, but your win rate will decline.
However, both scenarios can and do work so it really comes down to your personal preferences.
Now, if you notice, I haven’t given you any sort of hard numbers or details for any of these targets or stops. And that’s by design.
The fact is, you can trade this tactic to scalp the 1 minute chart, swing intraday, as I do with my personal trading system, or use it to enter and exit multiday holds, and really anything in between.
And that’s really a core point I want to make to you.
Order flow trading is not a system! It’s a mindset and a methodology for looking at speculative opportunities. As such, it is capable of generating a near infinite number of specific systems. And ultimately that’s what you’re going to need in order to be successful at this business because every trader is a little bit different.

What I want and need out of my system is likely completely different from what you need. My personality is different. My capital base is different. My timezone, and the assets I trade, and a million other little details are all unique to me. My trading system needs to account for them or I’m not going to have any hope of using it to achieve success.
And you’re in that same boat. So for me to tell you “target hourly stops, for a minimum 30 pip profit, with a fixed 10 pip stop” isn’t really going to help you. You need to figure out what rules are going to work for YOUR situation, so that YOU can be successful trading it.
That having been said, you don’t need to reinvent the wheel either. You can take this tactic 1 concept and use it to give you what you need by starting with some basic premises, testing the result, and tweaking from there.
What are those basic premises? Well, first of all, keep it simple.
Start with a basic tactic play where you know you’re going to enter on the breakout in the direction of sentiment. With those pieces locked in, all you really need to figure out is which stops to target, and how to position your protective stop.
My suggestion there would be, if you’re going to put your stop behind protection, target stops with a 1:1 risk reward or better. If you go with a fixed size stop, target 3:1 or better.
While I realize that still doesn’t give you hard rules to work with, honestly, it’s good enough to get started, and that’s all that you really need to worry about at this stage. After you do a 100 trades with WHATEVER you decide here, you’re going be in a much better place to tweak it for perfection. And that’s all there is to building a viable system. There is no holy grail. You already know that, so don’t waste your time looking for it.
Just figure out your timeframe, look for stops that show up on a higher timeframe, set a logically reasonable distance you need between your entry and the target, and then work out a basic stop strategy - fixed or protected - and go from there.

I promise you if you just put that in place, and start testing, in a VERY short period of time, you’ll find the profitability you’re looking for.
But what if you don’t like playing breakouts? Some people do have an aversion to that sort of thing, and that’s completely ok, because there are still two more tactics to choose from…
Lesson Recap In this lesson we explored the details of an order flow based tactic 1 trading strategy.
In the next lesson, we’ll explore Tactic 2.
OFT Tactic 2 System
If you recall, the tactic 2 play is a pullback play, and if you’re the type who just hates buying highs and selling lows - if you’re the type who wants to get some kind of discount pricing - it can be a very profitable option.

Again, the big difference between the basic tactic 2 and the oft version is the additional of stop targets and sentiment.
What you want to look for is a move that pulls back against the sentiment bias.
What you’ll find when you start looking at these sort of plays is that price pullbacks frequently shake out the weak hands before a continuation move can occur.
What this means in practice is that after price hits some sort of support or resistance, it will pull back to the previous breakout level to trigger the stops:
What you’re going to notice going forward - if you haven’t already - is that price tends to crack just beyond that breakout level so that it can trigger all the stops. This is going to be your entry area.
You want to get in once the stops are triggered because, with the weak handed breakout players knocked out of the market, the sentiment bias can resume its influence and pull you into profit.
You actually have a couple options with this tactic.

First, you can look to capture the move extension by targeting the next level of stops:
Or you could target the stops of all the people who were selling into this move by setting your target at the previous swing here:

There are good and bad aspects to either option, so the choice of which level of stops to target really comes down to personal preference. The first option will give you a better risk reward ratio, the second will give you a better winrate, but the fundamental strategy is the same either way as you’re looking to capture the continuation move.
You’re probably going to want to use a fixed pip stop way because the next level of protection is usually going be too far away.
As with tactic 1, the exact details are going to come down to your personal preferences for time frame, asset, and your individual needs, but I do want to mention something about tactic 2.
Tactic 2 is generally a harder strategy to become successful with initially, because you really need to have excellent sentiment reading skills in order to pull it off. All of your trades are happening in the middle of the range, and you’re trying to catch the turning point in a move that is running the other way.
As you start out with this stuff, your sentiment skills are going to be weak. You’re frequently going to miss sentiment shifts, and if you think sentiment is biased in one direction but it shifted without you noticing, your trade has zero hope of success.
Still, once you get proficient at it, you can pull of some crazy impressive trades with this tactic. And make no mistake, this basic tactic concept can be used very effectively to earn consistent trading profits. You just have to spend a bit of time working out some logical details for your individual situation.
Lesson Recap In this lesson we learn the details of an OFT Tactic 2 play. This is a slightly more difficult tactic to become successful with, but it has the potential to deliver some truly impressive wins.
In the next lesson we will look at our final tactic option; Tactic 3.
OFT Tactic 3 System

Finally we have Tactic 3, or the “range fade” tactic.
Now, there’s actually a lot of different ways that you can employ this tactic, but I’m just going to discuss a basic version here so that you can get the general idea.
Again, the addition of sentiment and stops are the key differentiator between the OFT version and everything else.
The big thing to notice is that the sentiment arrow is sideways! What I’m trying to convey here is that there is NO direction bias to sentiment. In other words, there is no good reason to expect that price will move one direction or the other and range trading should dominate.
That being the case, you’d look for price to make an excursion outside the existing range. A move like this is more often than not completely fabricated by large market participants in an effort to trigger stops. And the idea is that once that artificial demand subsides, price will naturally revert back into the range.
You’ll want use that premise to enter once the stops are triggered, in the direction of the range, and close somewhere within it.

For that take profit target, I’ve seen people use VWAP, SMA’s, and previous swing points. There really are a lot of options there, but my suggestion would be, if this sort of trading appeals to you start with either an eyeball guestimation of the range midpoint, or a 10 period simple move aaverage. From there you can make revisions as you see fit.
Now I don’t want to get too deep into the weeds with this one because to be completely honest, I don’t think it’s a good idea for anyone new to these concepts to start out with this tactic. There are a lot of options to choose from, and if you recall, my objective with this program is to get you to profitability quickly. The simpler your system options are, the easier it’s going to be for you to start making money.
With that in mind, I would strongly advocate you focus your effort on either tactic 1 or tactic 2 plays.
What you’ll notice is that tactic 3 is a bit different from the others in that it only works when there is no sentiment bias. As such, you can start out developing a tactic 1 or 2 strategy. Use it to develop skills and start making some money. Then work on adding one of the many tactic 3 variants as a second system to be traded when markets are ranging. This will allow you to make money in multiple market conditions without forcing trades.
I do want to STRONGLY warn against trying to develop both systems at once though. Make no mistake, it’s probably going to take you 6-12 months to really master any system you come up with based on this program, and that’s assuming you focused exclusively on it. If you try to develop more than one system at a time, that timeline is going to be an order of magnitude larger.
So don’t shoot yourself in the foot. Focus on tactic 1 or 2 initially. Just know that this tactic 3 is an option that you can look into down the road.
Now look. I know there are still a ton of questions to answer. How far away should the profit target be? How big should the stop be in relation to it? Should you re-enter if you get stopped out? Should you close the trade ahead of the target if you don’t think it’s going to go? And they are all good questions to ask, and ultimately seek answers to, but unless you let it none of that shit is going to prevent you from implementing a 100% viable strategy that you can start trading immediately.

And that’s a key point I want to make before we move on.
These details are NOT as important as you think they are.
As long as your core strategy makes some measure of rational sense - and by that I mean your risk reward is 1:1 or better and you’re not running some crazy martingale nonsense - the strategy WILL work because it has a built in edge.
That edge comes, not from the choice of stop size, or the minimum distance to the target stops. It comes from your ability to filter trades based on sentiment, and as long as you have that aspect down you could almost enter and exit at random and still make sick money. So don't get too hung up on that stuff. Just pick something that makes sense; Tactic 1 or tactic 2 with a reasonable stop and 1:1 risk reward or better. That’s all you need to move forward and start making money.
Lesson Recap In this lesson we learned about Tactic 3 and some of the many options that can be used to construct a system based on it. We also learned that its probably not the best tactic to start out with.
There were some important lessons about the importance of sentiment for the success of any system developed.
Now that we have a good overview of the various tactics avaialble to us, the next lesson will discuss how to test and optimize our system so that we can use it to generate consistent profits across time.
Testing and Next Steps Once you have your entry and exit rules down there are still a few more steps that you should take before you start trading.
The first thing you’re going to want to do is clearly define your rules. What is your sentiment reading process and how will you know if you have an opportunity to trade

each day? Are you trading tactic 1 or 2? Are you using a fixed stop or putting it behind protection? If it’s a fixed size, how many pips will it be? Etc.
As I mentioned in the previous lesson, you don’t necessarily need to have every possible question about your trade plan answered to get started, but you should have the 4 basic questions every system must answer clearly covered.
Unfortunately, when you first start trading based on those rules, you’re not going to know whether what you’ve decided on will deliver what you need or not. So one way or another, you’re going to have to test the rules. And that’s where the subject of demo accounts enters the picture.
Demo Trading There are lots of opinions out there about demo trading and unfortunately most of them aren't very well informed. Many will tell you that demo is a waste of time because it doesn’t give you any real world experience.
They are wrong.
Demo actually serves several very important functions for aspiring and pro traders alike.
First of all, until you have a viable trading system there is no point in trading live because you have no idea whether the investment you’re making has any hope of turning a profit.
Demo trading allows you to test your system ideas to ensure that they actually work before committing your valuable trading capital to them.
Now I realize that there is an argument to be made that unless you have real money invested in a system, you don’t know how well YOU will be able to trade it, because the psychological impact of having money at risk isn’t there, but that’s precisely WHY you should run systems on demo FIRST.

Demo can be used to show how the system would perform with perfect trading psychology. And let’s be honest, if the system can’t make money when you’re trading it with perfect psychology, it sure as hell isn’t going to perform better when you don’t. So why waste your cash testing things that have no hope of success?
In other words, you should use demo to prove that a system actually works, before you waste your money on it.
But that’s not the only benefit of demo trading your system ideas. Once you have a system that you know works, you can use the results it generated in demo as a baseline to figure out how much of an impact any psychological or disciplinary issues you possess are having on your real world returns.
What I mean is that; If you run a demo and the system generates X, then you switch to real money and the result is Y, well then you can attribute the spread between X and Y directly to psychology.
That’s a powerful tool for improving your psychology because it shows the contrast in black and white, which will allow you to start looking at WHY you’re not getting the same results, and more often than not, it will highlight specific issues that you can then improve upon.
Now it’s easy to tell someone “test the system on demo” but the truth is, most aspiring traders really don’t know how to leverage demo for maximum result. More often than not, a guy will setup a demo account, click buttons for a month, and then after they see a week of positive returns, they’ll jump over to real money and blow up their account.
Understanding how to use a demo account properly requires an appreciation of benchmarking and performance metrics. I’m not going to get too deep in the weeds on either of them, because to be honest, I could probably create a whole course on each one, and that would obscure the core idea I’m trying to get across here.
However, it’s worth it to take a quick look at what they are and how you should use them in your testing process.

Benchmarking One of the things that ALL serious pros, and almost none of the retails guys do, is benchmark their trading.
In short, benchmarking is comparing your trading system performance to some sort of relevant index - like the s&p500 for example - so that you can see you’re trading performance relative to other investment options.
It’s important to see this comparison because it allows you to evaluate your performance against the alternative investments you could potentially make. Which is not an irrelevant question to ask yourself.
At the end of the day, you’re (hopefully) in this business to make money. So it only makes sense that you would deploy your capital wherever you can get the best yield.
Hopefully when you get good at this, the returns you generate will far exceed the other investment options available, but until your trading performance can at least beat the S&P 500, your money would be better deployed by investing in the index.
In other words, benchmarking your trading gives you something of a trigger point to know WHEN it’s viable to move your capital out of wherever it’s sitting into your trading account to be traded.
More importantly, however, it’s been my experience that aspiring traders have little to no appreciation for what long term performance actually looks like. For many aspiring traders, they assume that success will produce a return profile with a perfectly upward sloping line. Something that looks like this:

That’s just not reality. More often than not, long term profitable returns are better represented like this:
This is a chart of the s&p500 for the last two years. And here’s the thing; you don’t need a return profile that has a clean upward slope to be successful. As long as you’re

consistently outperforming the benchmark, which typically has a return profile that looks like the above chart, you’re going to make good money at this business. So I would encourage you to study up on the subject of benchmarking, and pick one to start comparing your performance to.
Performance metrics Of course that begs the question, what are you comparing?
It’s tempting to just compare net returns, but that’s actually not very useful. The fact is, as traders we have access to obscene amounts of leverage, so a straight comparison of your returns to that of the S&P500 isn’t going to tell you much about how well you’re actually performing.
Fortunately, there are a number of performance metrics you can use to make a much more informed comparison.
What I’m talking about here are things like, win rate, risk to reward ratio, standard deviation, and the Sharpe and Sortino ratios. We have a great article that covers what they are and how to use them to evaluate your trading system, so I’m not going to dig into them here. Just know that what you’re ultimately trying to do is figure out how good your system actually is. You want to do that because it’s going to have a huge impact on the kind of net returns you can ultimately produce.
How so? In a word; leverage.
Leverage There’s a bit of conventional wisdom among aspiring traders that one should never risk more than 1% of their account balance on any trade. This is generally good advice because it helps slow the rate of capital burn during the time people are learning this business.
I would personally argue that while you’re learning, even 1% is too high, but I don’t want to get off on a tangent.
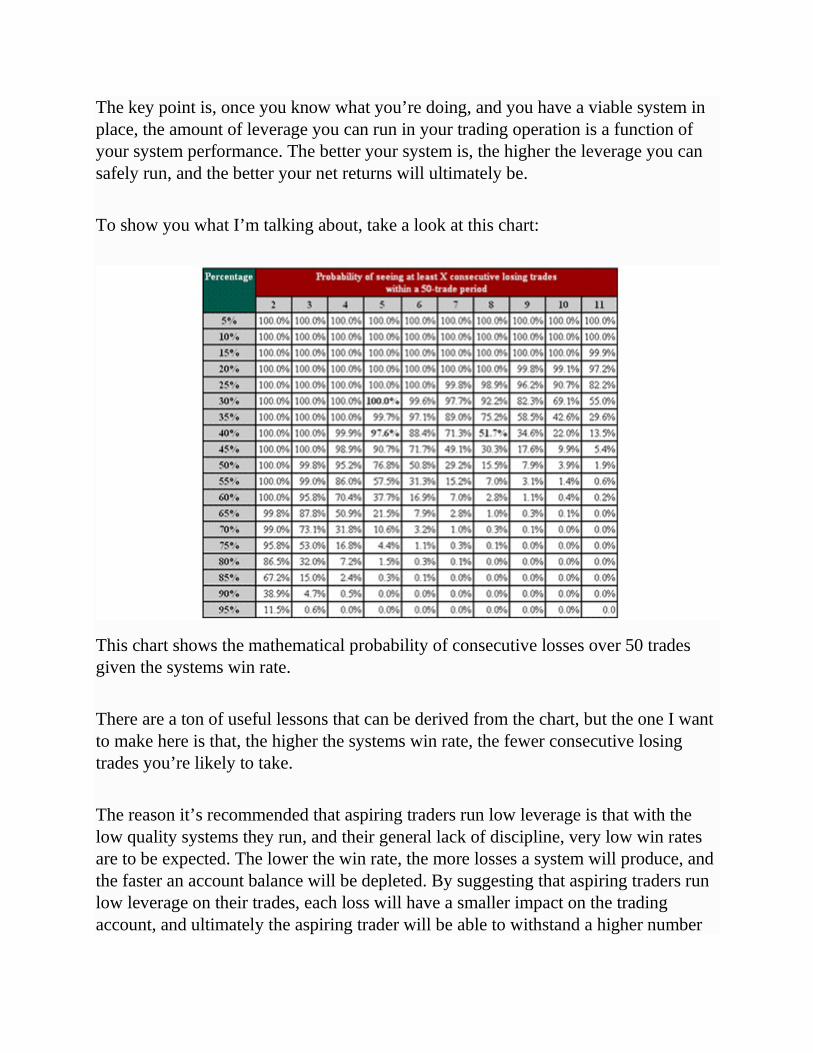
The key point is, once you know what you’re doing, and you have a viable system in place, the amount of leverage you can run in your trading operation is a function of your system performance. The better your system is, the higher the leverage you can safely run, and the better your net returns will ultimately be.
To show you what I’m talking about, take a look at this chart:
This chart shows the mathematical probability of consecutive losses over 50 trades given the systems win rate.
There are a ton of useful lessons that can be derived from the chart, but the one I want to make here is that, the higher the systems win rate, the fewer consecutive losing trades you’re likely to take.
The reason it’s recommended that aspiring traders run low leverage is that with the low quality systems they run, and their general lack of discipline, very low win rates are to be expected. The lower the win rate, the more losses a system will produce, and the faster an account balance will be depleted. By suggesting that aspiring traders run low leverage on their trades, each loss will have a smaller impact on the trading account, and ultimately the aspiring trader will be able to withstand a higher number

of losing trades. Which will hopefully keep them in business long enough to figure everything out.
However, once you have a system with a win rate that exceeds 60%, a risk per trade rate of 1% is not the most efficient use of capital.
Again I don’t want to get too deep in the weeds here, but as a general rule for each 5% increase of your win rate above 60%, you should increase your risk per trade by 50 basis points. So at 70% you should risk 2% per trade. At 75% you should risk 2.5%, and so on.
And that’s really just one aspect of why you should analyze your trading performance via these trading metrics.
But I digress... We were talking about how to properly use a demo account, so let me get back to that.
In short, I would suggest you pick a benchmark. Then set a minimum benchmark delta for the system to be considered viable. In other words, set a target to beat it by X%. Then start demoing your system with the rules you defined.
Run it on demo for 30 days to generate some trade statistics. Then compare you results to the benchmark.
Did you achieve your target?
If the answer is no, try to figure out why and what you can do to improve the performance. Then test those changes over another 30 days.
If you DO hit the target, run it over another 30 days for good measure.
Now you have a baseline and some measure of faith that what you’re doing works.
At that point you can start looking at the other metrics.

What was the win rate on your trades? That’ll give you an idea what kind fo leverage you can run.
How much standard deviation was there in the returns? That should give you an idea how much volatility you’ll see in the return profile.
What’s the sharpe ratio? If its low, there is a good chance all your alpha is being generated via leverage and the system may need some further improvement before its traded live.
Etcetera.
The point is, you’ll want to really dig into the internals of the system so that you can see a) if its good enough to trade with real money and b) how you might be able to tweak the rules for further optimization.
In any event, once you have 60 days of profitable trading with a given set of rules, you’ll want to start trading a small real money account. I would suggest starting with maybe 1/5th or 1/10th of your per trade risk, and do it for an additional 30 days.
After 30 days you should check to make sure the real money results are still comparable to the baseline you generated on demo.
If it’s not, the reason is likely psychological. Keep the size small and focus on that.
Eventually, when you’re comfortable with the system, and your real money results are performing similar to your baseline, you can up your leverage to the full size per trade risk.
Now I should mention that, if you’re doing it right, this process will take a minimum 2-3 months to complete. And my advice would be: Don’t shoot yourself in the foot by rushing it.
Sure you may get to see your bad psychology faster, but without a decent pool of example trades, you won’t know if it’s you or the system that needs work. And figuring out which one it is will take way more then 2-3 months.
Next Steps Now obviously, you still have some work to do. You’re going to want to dig into the various concepts you learned about here in more detail. Things like the performance metrics and benchmarking. And you’re going to need to start trading these systems on demo to test the functionality. Then you need to develop your baseline stats. And if all goes well, you should then be ready to start trading these systems with real money.
However, I should probably warn you that, even when you’re done with all this, and you have a profitable trading system in hand, you’re probably NOT going to instantly become hugely successful trader.
The great irony is that for all the stress and work people put into finding a viable system, that’s really the easy part.
Conquering your personal demons is where the real work is, and no matter how good your system is, it’s going to take you a while to slay those demons.
One of the most powerful tools you can leverage to slay those demons is the Trading Floorchat service here at the site. There are many experienced professionals who hang out in there and no matter what your discipline or psychology sticking points are, there is likely someone in there who can help. Your best bet is to jump in there after you have defined you rules and just start calling your trades. Not only will you get additional insights on the specific opportunities your trying to exploit, but over time, as people see you making the same sort of mistakes over and over again, they’ll be able to offer actionable advice on how you can improve your overall results.
I’m not even joking, for the people who actively participate on the Trading Floor the success rate is around 3 times what it is for people who don’t. So you should definitely try to take advantage of it.

I’d also like to mention that there is a follow up course that you may want to check out. It’s called the Ultimate Trader Immersion Program and if you’re serious about developing a career as a professional trader, it can help you make a meaningful leap in that direction. How? Well, while the program you just completed is great for teaching you the theory of order flow trading, and helping you understand the process of developing a system based thereon, Ultimate Trader takes it to the next level. Students who sign up for the program will be taken under my wing for an entire month of one-on-one mentorship. They’ll be given a tested and proven trading system with an ~80% winrate, all the tools and knowledge required to trade that system on a specific asset, and an opportunity to join my proprietary trading firm; Predator Trading Group.
But putting all that aside, there is now zero doubt in my mind that you have all the INFO you need to achieve your goal of profitable trading success. The above suggestions can help you do it a bit quicker, but even without them you should definitely be able to join that magical 5%. Its just going to take some time, and some good old hard work to iron out the inevitable kinks. But as they say, nothing worthwhile in life is ever easy. Achieving your objectives via trading certainly won’t be, but I promise you it IS 100% doable. And I sincerely hope this program has helped you get a bit closer to your goals.
I'd like to thank you for participating in this program, and I wish you all the best in your journey.
May luck be with you.