ordinal-to-interval scale conversion tables and national...
TRANSCRIPT
RESEARCH ARTICLE
Ordinal-To-Interval Scale Conversion Tables
and National Items for the New Zealand
Version of the WHOQOL-BREF
Christian U. Krageloh1*, D. Rex Billington1, Patricia Hsien-Chuan Hsu1, Xuan
Joanna Feng1, Oleg N. Medvedev1, Paula Kersten2, Jason Landon1, Richard J. Siegert1
1 Auckland University of Technology, Auckland, New Zealand, 2 University of Brighton, Brighton, United
Kingdom
Abstract
The World Health Organisation Quality of Life (WHOQOL) questionnaires are widely used
around the world and can claim strong cross-cultural validity due to their development in
collaboration with international field centres. To enhance conceptual equivalence of quality
of life across cultures, optional national items are often developed for use alongside the
core instrument. The present study outlines the development of national items for the New
Zealand WHOQOL-BREF. Focus groups with members of the community as well as health
experts discussed what constitutes quality of life in their opinion. Based on themes
extracted of aspects not contained in the existing WHOQOL instrument, 46 candidate
items were generated and subsequently rated for their importance by a random sample of
585 individuals from the general population. Applying importance criteria reduced these
items to 24, which were then sent to another large random sample (n = 808) to be rated
alongside the existing WHOQOL-BREF. A final set of five items met the criteria for national
items. Confirmatory factor analysis identified four national items as belonging to the psy-
chological domain of quality of life, and one item to the social domain. Rasch analysis vali-
dated these results and generated ordinal-to-interval conversion algorithms to allow use of
parametric statistics for domain scores with and without national items.
Introduction
TheWorld Health Organisation defined health as “a state of complete physical, mental andsocial well-being and not merely the absence of disease and infirmity” (p.1315) [1]. Unlike tra-ditional indicators of health, such as mortality, morbidity, and clinical appraisals [2], theWHO’s definition of health implies that assessment of health and effects of health care shouldnot only include an indication of changes in frequency and severity of symptoms but also anestimation of quality of life (QOL) [3]. In the last two to three decades, the increasingly wide-spread use of health-related QOL (HRQOL) instruments reflects this appreciation of the needto gather the patient’s perspective of their wellbeing.
PLOS ONE | DOI:10.1371/journal.pone.0166065 November 3, 2016 1 / 15
a11111
OPENACCESS
Citation: Krageloh CU, Billington DR, Hsu PH-C,
Feng XJ, Medvedev ON, Kersten P, et al. (2016)
Ordinal-To-Interval Scale Conversion Tables and
National Items for the New Zealand Version of the
WHOQOL-BREF. PLoS ONE 11(11): e0166065.
doi:10.1371/journal.pone.0166065
Editor: Jacobus van Wouwe, TNO, NETHERLANDS
Received: May 25, 2016
Accepted: October 22, 2016
Published: November 3, 2016
Copyright: © 2016 Krageloh et al. This is an open
access article distributed under the terms of the
Creative Commons Attribution License, which
permits unrestricted use, distribution, and
reproduction in any medium, provided the original
author and source are credited.
Data Availability Statement: All data files are
available from the journal’s website as supporting
information.
Funding: The authors acknowledge the financial
support from the Faculty of Health and
Environmental Sciences, Auckland University of
Technology. The funder had no role in study
design, data collection and analysis, decision to
publish, or preparation of the manuscript.
Competing Interests: The authors have declared
that no competing interests exist.
TheWHO definedQOL as “individuals’ perception of their position in life in the context ofthe culture and value systems in which they live, and in relation to their goals, expectations,standards, and concerns” (p.1405) [4]. In 1991, theWHO initiated an international collabora-tive project to develop a generic cross-culturally valid measure of HRQOL [5]. Representingdiverse cultures around the world, 15 collaborative centres in 14 countries contributed data tothis project. This included qualitative data from focus groups that inquired which facets ofQOL were considered important by individuals, as well as quantitative data from testing thesuitability of candidate items that had been developed from the emerging focus group themes.The resultingWHOQOL-100 instrument contains 24 facets that yield a six-domain profile ofQOL: physical QOL, psychological QOL, level of independence, social relationships, environ-mental QOL, and spiritual/religious and personal beliefs [3]. Each of the 24 facets is assessedusing four questions, and an additional general facet contains another four questions on overallQOL or health. Tests of the universality of theWHOQOL-100 support the assertion that theWHOQOL is applicable and comparable across cultures [6]. To reduce response burden, theWHOQOL-100 was later shortened to a 26-item version named theWHOQOL-BREF [7]. TheWHOQOL-BREF contains one item from each of the 24 WHOQOL-100 facets and two globalitems each of QOL and health.
Even though theWHOQOLwas developed by collaborating centres from a range of coun-tries, there could be instances where items do not fully cover the entire range of importantaspects of HRQOL for a particular culture, in which case additional national items are permit-ted [3]. By including national items, relevant facets for certain cultural groups could beincluded, thus improving the conceptual equivalence of QOL. Of the 15 originalWHOOQLfield centres, nine centres (Bangkok, Bath, Beer Sheva, Harare, Madras, New Delhi,St. Petersburg, Tokyo, and Zagreb) selected national items [8]. The subsequently establishedWHOQOL centres in Mainland China, Hong Kong, and Taiwan also selected national items[8–10]. One of the 12 national items of the Hong Kong version, for example, was “How satis-fied are you with your destiny?” and another one “How is your appetite?” [9].
TheWHOQOL-BREFhas previously been validated for use in New Zealand samples fromthe general population [11], but more precision may be gained if facets relevant to New Zea-land are also included. The purpose of the present study was to investigate to what extent theWHOQOL captures the range of facets considered important by New Zealanders for theirQOL and to develop national items if necessary. This investigation proceeded in three stages.Study 1 involved 12 focus groups that explored the range of QOL issues deemed important byNew Zealanders. This produced 16 themes beyond those already contained in the genericWHOQOL,which then led to the development of 46 potential national items. Study 2 was apostal surveywith a large sample from the general population that asked respondents to ratethe importance of the existingWHOQOL facets as well as the facets expressed in the 46 candi-date national items. Of these, a set of 24 items met several importance criteria and was selectedfor further testing. In Study 3, these 24 items and theWHOQOL-BREFwere sent as a postalsurvey to another large sample of individuals randomly selected from the general population.Only 5 of the 24 items met theWHOQOL criteria for suitable national items. A series of analy-ses including ordinal-level confirmatory factor analysis then tested the psychometric propertiesof the instrument with these new national items. Finally, Rasch analysis confirmed these resultsand provided ordinal-to-interval conversion algorithms for the domain scores with and with-out national items. An ordinal scale will not become an interval scale simply because of its pop-ularity or by adding individual Likert-scale items scores together [12,13]. Using the ordinal-to-interval conversion tables presented here will increase precision of WHOQOLdomains andpermit statistical analysis without the need to break assumptions of parametric statistics.
National Items for the New Zealand Version of the WHOQOL-BREF
PLOS ONE | DOI:10.1371/journal.pone.0166065 November 3, 2016 2 / 15
Study 1 (Focus Groups)
The purpose of this study was to investigate which aspects New Zealanders consider importantto their QOL and particularly any aspects that are currently not assessed by theWHOQOL.Such additional facets would then be developed into importance questions to be tested for theirpotential to be suitable New Zealand national WHOQOL items.
Method for Study 1
Participants and Procedure. Recruitment for focus groups occurred betweenNovember2008 and May 2009. Participants were recruited using a variety of different methods. Adver-tisements were distributed in university newsletters and noticeboards as well as by directlyapproaching various community groups and local and national organisations providinghealth services. Participants were also recruited through word-of-mouth, snowballing, e-maillists, universities, and health rehabilitation institutes. In total, 12 focus groups were con-ducted. Each focus group was intended to have six to eight individuals. However, due to latecancellations, some of the focus groups contained smaller numbers, the lowest being three.The total number of participants was 61, and efforts were made to ensure that the partici-pants were demographically representative of New Zealand population in terms of gender,age, marital status, educational background, and ethnic identity. Four groups were outpa-tients with chronic health conditions and informal caregivers, three groups consisted ofhealth professionals and academics working in health fields, one group comprised of mem-bers from the general population with no specifically identified health condition, one groupconsisted of university students, two groups were older adults, and one group consisted ofrecent immigrants to New Zealand.
The focus groups were conducted by two of the researchers following the standard protocolrecommended by theWHOQOLGroup [14]. Each focus group started with a brief introduc-tion to the purpose of the research as well as handing out and explanation of relevant docu-ments such as participant information sheets and consent forms. Participants were then askedto describe and discuss what they thought was important to their QOL and that of New Zealan-ders. Following that, discussions took place about what participants thought were importantdeterminants of the QOL of people who were not well. Lastly, participants were given the exist-ingWHOQOL facets to rate for their importance to QOL. The focus groups sessions lastedbetween 90 and 120 minutes and were audio taped. One of the researchers also took notes dur-ing the focus groups. Participants were provided with a detailed information sheet about thestudy and provided written consent to participate. The study was approved by the AucklandUniversity of Technology Ethics Committee.
Data Analysis. After all the focus groups were completed, the researchers met on repeatedoccasions in groups of three to listen to the tapes, take notes, discuss the content of the taperecordings, and compare notes. The purpose of these meetings was to discern possible facets ofQOL that could be tested for their generality later on. Sometimes the tape was stopped to per-mit clarification and discussion of points beingmade by participants. Any QOL facets thatarose from the focus group discussions that were not in the existingWHOQOLwere identifiedas new themes in this study. Consensus among the research team was not necessary:A poten-tial facet could be proposed by an analyst even if the other analysts did not agree. However, thisdid not occur. Most of the new themes that were proposed in this study were revealed in atleast three different focus groups. The research team then proposed and composed importancequestions, based on the identified new themes. The resulting list of new items was then pre-sented to two English language experts to review for grammar and comprehensibility, whichresulted in some small changes.
National Items for the New Zealand Version of the WHOQOL-BREF
PLOS ONE | DOI:10.1371/journal.pone.0166065 November 3, 2016 3 / 15
Results and Discussion
Detailed results for the various focus groups are presented elsewhere [15]. Overall, all groupsparticipated in an enthusiastic manner and contributed to interesting and rewarding discus-sions. All participants accepted theWHO’s definition of QOL and saw its relevance to humanexperience.Much of the discussions centered around different nuances expressed in the exist-ingWHOQOL facet, although almost all of the existingWHOQOL facets were rated as impor-tant to a person’s QOL.Many of the new themes that emerged were raised by the differenttypes of focus groups (outpatients, health experts, general population, older adults, and recentimmigrants). The recent immigrant focus group was slightly different in the sense that a largeamount of discussionwas dedicated to comparing their country of origin with New Zealand.Such discussionwas generally about medical care and education systems, as prompted by someof the existingWHOQOL facets. Aspects emphasised in this focus group were acceptance ofone’s culture and having freedom to do things.
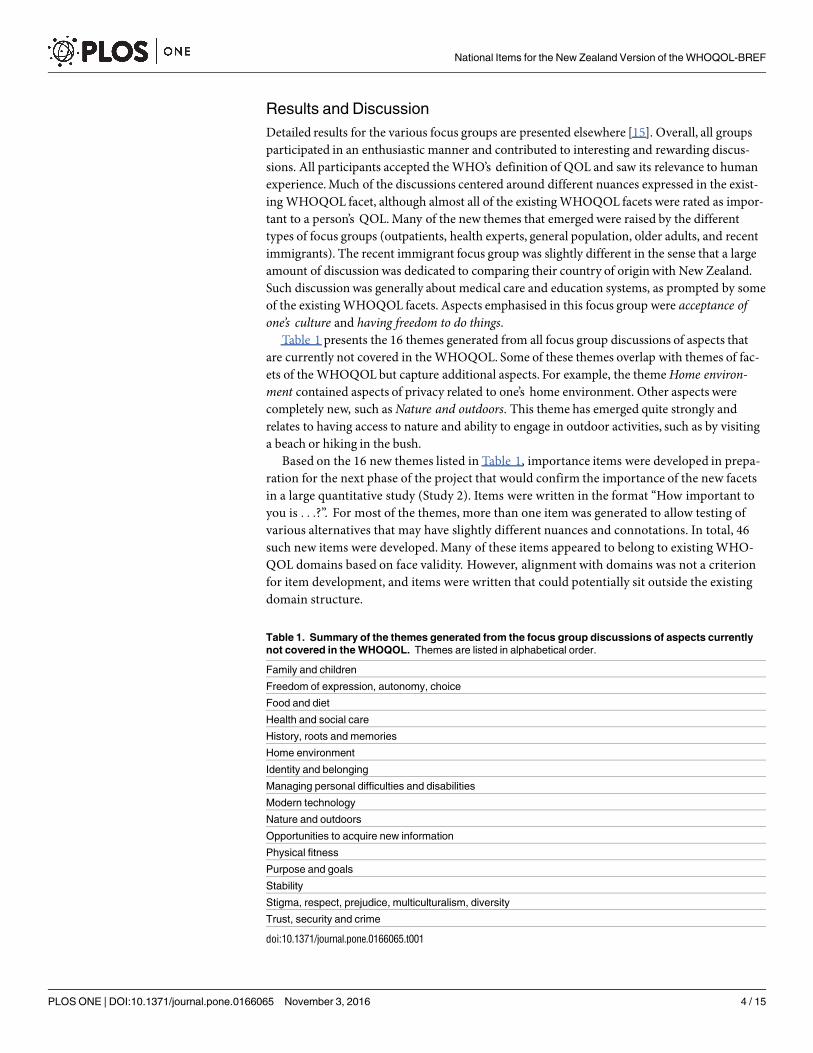
Table 1 presents the 16 themes generated from all focus group discussions of aspects thatare currently not covered in theWHOQOL. Some of these themes overlap with themes of fac-ets of theWHOQOL but capture additional aspects. For example, the themeHome environ-ment contained aspects of privacy related to one’s home environment. Other aspects werecompletely new, such as Nature and outdoors. This theme has emerged quite strongly andrelates to having access to nature and ability to engage in outdoor activities, such as by visitinga beach or hiking in the bush.
Based on the 16 new themes listed in Table 1, importance items were developed in prepa-ration for the next phase of the project that would confirm the importance of the new facetsin a large quantitative study (Study 2). Items were written in the format “How important toyou is . . .?”. For most of the themes, more than one item was generated to allow testing ofvarious alternatives that may have slightly different nuances and connotations. In total, 46such new items were developed.Many of these items appeared to belong to existingWHO-QOL domains based on face validity. However, alignment with domains was not a criterionfor item development, and items were written that could potentially sit outside the existingdomain structure.
Table 1. Summary of the themes generated from the focus group discussions of aspects currently
not covered in the WHOQOL. Themes are listed in alphabetical order.
Family and children
Freedom of expression, autonomy, choice
Food and diet
Health and social care
History, roots and memories
Home environment
Identity and belonging
Managing personal difficulties and disabilities
Modern technology
Nature and outdoors
Opportunities to acquire new information
Physical fitness
Purpose and goals
Stability
Stigma, respect, prejudice, multiculturalism, diversity
Trust, security and crime
doi:10.1371/journal.pone.0166065.t001
National Items for the New Zealand Version of the WHOQOL-BREF
PLOS ONE | DOI:10.1371/journal.pone.0166065 November 3, 2016 4 / 15

Some limitations of the focus groups need to be acknowledged. Firstly, due to illness andother unforeseen circumstances, two of the focus groups only had three participants, thussomewhat limiting the richness of discussions. Secondly, the research was conducted during atime when a recent legislative change was being debated in New Zealand. Dubbed by commu-nity groups and the media as the anti-smacking law, a legislative change in 2007 repealed a sec-tion from the Crimes Act 1961, which provided a statutory defence for adults prosecuted forassaulting a child if it was parental force for the use of correction [16]. Various lobby groupswere strongly opposed to the anti-smacking law and forced a citizen-initiated referendum in2009, which happened to occur around the time this research was being conducted. Partici-pants in the present study made occasional references to government control and relatedissues. Some of this discussionmay thus have been a reflection of the political circumstances atthe time rather than a representation of relatively stable and long-term perceptions of QOL.
Study 2 (Importance of WHOQOL Facets)
The purpose of this study was to assess to what extent the existingWHOQOL facets includingthose new emerging themes from Study 1 (Table 1) are judged by New Zealanders as importantto their QOL. Using a large sample of the general population, importance ratings of the 46items generated in Study 1 were rated alongside the existingWHOQOL items.
Importance ratings of the existingWHOQOL items were published elsewhere [17] and willnot be presented here. Krägeloh et al. [17] comparedWHOQOL importance ratings of NewZealanders with ratings from participants in Australia and other countries around the world.The present study focuses on importance ratings of the 46 items generated in Study 1 and howa final set of candidate items was selected for further testing.
Method
Participants and Procedure. Detailed information about recruitment and the participantsis presented elsewhere [17]. Using a random sample of the general population, 2,000 question-naires were posted by mail with a pre-paid return envelope. Participants rated the importanceof 46 items developed in Study 1 in the format “How important to you is . . .?”. Responseoptions were on a 5-point Likert scale ranging from 1 = “not important” to 1 = “extremelyimportant”. These items were presented together with a section requesting demographic infor-mation and a section that asked participants to rate the importance of the 26 existing items oftheWHOQOL-BREF. Two versions of the questionnaire with different question ordering weresent out to control for order effects. The number of valid returned questionnaires was 585, thusa response rate of 29%.
Data analysis. Analyses were conducted using the software Statistical Package for theSocial Sciences (SPSS). The selection criteria for candidate national items were that the meanimportance rating had to be 4 or greater on the 5-point scale or a mean marginally below 4 butwith a median value of at least 4. Inferential statistics were used to examine the relationshipbetween importance ratings and the demographic variables gender, age, and self-reportedhealth state. The percentage of missing data was 0.001.
Results and Discussion
The overall mean of the importance ratings for existingWHOQOLquestions was 4.07. Formost items, mean importance ratings were above 4 or close to 4. Exceptions were Chances ofgetting new information and knowledge (3.61), Bodily image and appearance (3.54), Supportfrom others (3.50), and Sexual life (3.09). For the 46 candidate items, the mean importance
National Items for the New Zealand Version of the WHOQOL-BREF
PLOS ONE | DOI:10.1371/journal.pone.0166065 November 3, 2016 5 / 15
ratings ranged from 3.07 (Having diverse culture) to 4.61 (Immediate family). Other items withvery low scores were Living in a multicultural society (3.18) and Being part of a group (3.22).
Ten of the 46 items were rated significantly differently by individuals who consideredthemselves as ill versus those considering themselves well. For 18 items, there were signifi-cant differences in rating by age, and for 36 items there were gender differences.WHOQOLimportance ratings are known to be different by these demographic variables [17], and inthis case no particular pattern was evident. The main criterion applied to reduce the numberof items was that mean ratings were at least 4, or when close to 4 that the median was 4. Addi-tionally, when considering items with similar meanings, such as Good healthy food, Eatingsensibly, and Proper diet, the item with the highest importance rating was chosen and theother discarded. Another example includesHave natural surroundings, New Zealand naturalenvironment, and Access to outdoor activities. This way, the number of items was reducedfrom 46 to 24.
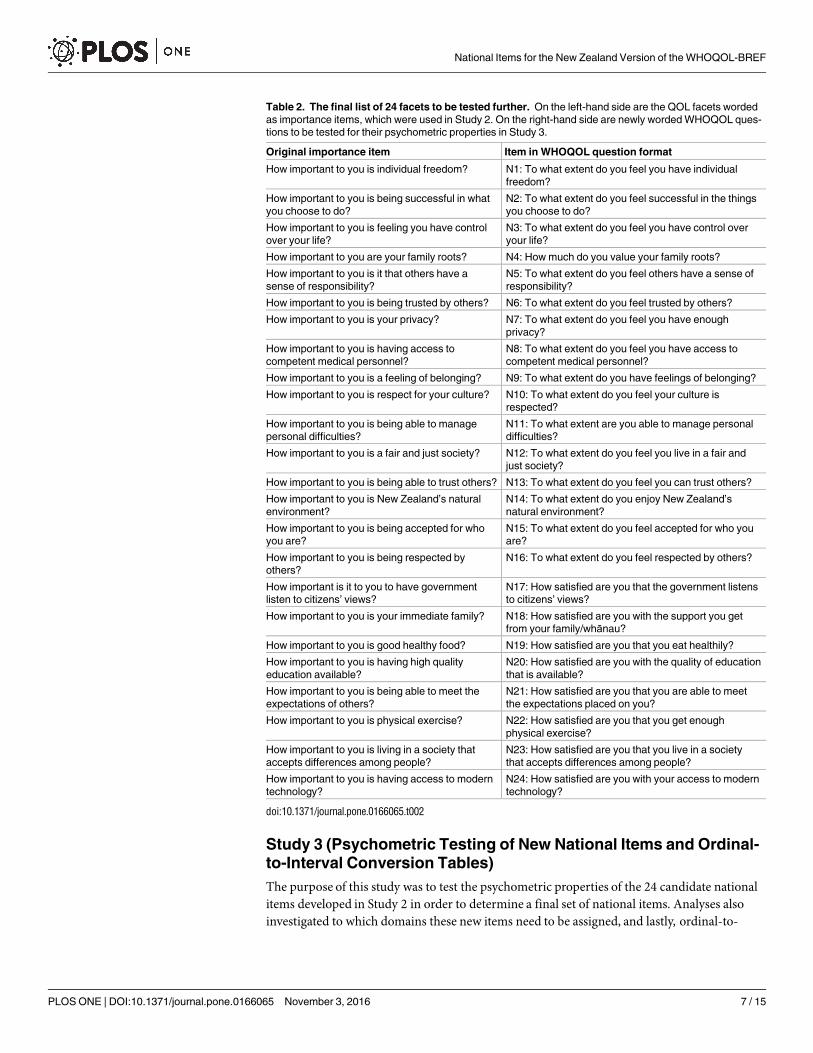
In preparation for Study 3 (testing the psychometric properties of national items), impor-tance items were now re-written in the standard WHOQOL item format of either intensity(e.g., “How much do you. . .?”), frequency (e.g., “How often do you have. . .?”), capacity (e.g.,“How well are you able to. . .?”), or evaluation (e.g., “To what extent do you feel. . .?”). Thiswriting was done by one of the researchers and edited by two independent advisors, one beinga lawyer and another one a journalist. The research team then examined the written questionsand chose the best format for each item. Some items that closely related to a particular culturalissue in New Zealandwere altered slightly in order to accentuate cultural aspects. For example,the item asking about the importance of one’s immediate family was reformatted into “Howsatisfied are you with the support you get from your family/whānau?” to capture the specialmeaning of the Māori word whānau (extended family). Another item was edited to achievegreater generalisability to all people throughout their lifespan and not just a particular time intheir life. For example, the importance item asking “How important to you is having high qual-ity education available?” could be interpreted as only applying to an individual’s personal edu-cation needs. This item was rephrased to “How satisfied are you with the quality of educationthat is available?”, which means that it could apply to others the individual is involved with.Table 2 lists the final set of 24 items in their original importance format and the rewordedWHOQOLquestion format to be tested in Study 3.
Overall, the results from this quantitative study confirm the relevance of the themesbrought up in the focus groups of Study 1. The range of the mean importance ratings of the46 importance items (3.07 to 4.61) that were derived from the focus group themes was com-parable with that of the existingWHOQOL items, which was 3.09 to 4.50 [17]. Nevertheless,stringent criteria were applied for the selection of candidate national items even if that meantdiscarding items with importance ratings that were higher than some of the ratings of theexistingWHOQOL items. Given the previous work demonstrating the universality of theWHOQOL facets and the cross-cultural validity of the scale [6], the present study aimed toleave the core instrument in its original format. Instead, however, the precision of measuringQOL in New Zealandmay be enhanced by careful selection of national items and thus inclu-sion of facets that are considered particularly important to New Zealanders. To achieve suchincreased precision, it was necessary to include only items that were clearly considered suit-able. The subsequent psychometric testing in Study 3 aimed to reduce the number of itemseven further as 24 optional national items are not practical. The abbreviated 26-itemWHO-QOL-BREF is attractive because of its reduced response burden compared to the WHOQOL-100 –an advantage that would be eliminated if almost the same number of national itemswere added.
National Items for the New Zealand Version of the WHOQOL-BREF
PLOS ONE | DOI:10.1371/journal.pone.0166065 November 3, 2016 6 / 15
Study 3 (Psychometric Testing of New National Items and Ordinal-
to-Interval Conversion Tables)
The purpose of this study was to test the psychometric properties of the 24 candidate nationalitems developed in Study 2 in order to determine a final set of national items. Analyses alsoinvestigated to which domains these new items need to be assigned, and lastly, ordinal-to-
Table 2. The final list of 24 facets to be tested further. On the left-hand side are the QOL facets worded
as importance items, which were used in Study 2. On the right-hand side are newly worded WHOQOL ques-
tions to be tested for their psychometric properties in Study 3.
Original importance item Item in WHOQOL question format
How important to you is individual freedom? N1: To what extent do you feel you have individual
freedom?
How important to you is being successful in what
you choose to do?
N2: To what extent do you feel successful in the things
you choose to do?
How important to you is feeling you have control
over your life?
N3: To what extent do you feel you have control over
your life?
How important to you are your family roots? N4: How much do you value your family roots?
How important to you is it that others have a
sense of responsibility?
N5: To what extent do you feel others have a sense of
responsibility?
How important to you is being trusted by others? N6: To what extent do you feel trusted by others?
How important to you is your privacy? N7: To what extent do you feel you have enough
privacy?
How important to you is having access to
competent medical personnel?
N8: To what extent do you feel you have access to
competent medical personnel?
How important to you is a feeling of belonging? N9: To what extent do you have feelings of belonging?
How important to you is respect for your culture? N10: To what extent do you feel your culture is
respected?
How important to you is being able to manage
personal difficulties?
N11: To what extent are you able to manage personal
difficulties?
How important to you is a fair and just society? N12: To what extent do you feel you live in a fair and
just society?
How important to you is being able to trust others? N13: To what extent do you feel you can trust others?
How important to you is New Zealand’s natural
environment?
N14: To what extent do you enjoy New Zealand’s
natural environment?
How important to you is being accepted for who
you are?
N15: To what extent do you feel accepted for who you
are?
How important to you is being respected by
others?
N16: To what extent do you feel respected by others?
How important is it to you to have government
listen to citizens’ views?
N17: How satisfied are you that the government listens
to citizens’ views?
How important to you is your immediate family? N18: How satisfied are you with the support you get
from your family/whānau?
How important to you is good healthy food? N19: How satisfied are you that you eat healthily?
How important to you is having high quality
education available?
N20: How satisfied are you with the quality of education
that is available?
How important to you is being able to meet the
expectations of others?
N21: How satisfied are you that you are able to meet
the expectations placed on you?
How important to you is physical exercise? N22: How satisfied are you that you get enough
physical exercise?
How important to you is living in a society that
accepts differences among people?
N23: How satisfied are you that you live in a society
that accepts differences among people?
How important to you is having access to modern
technology?
N24: How satisfied are you with your access to modern
technology?
doi:10.1371/journal.pone.0166065.t002
National Items for the New Zealand Version of the WHOQOL-BREF
PLOS ONE | DOI:10.1371/journal.pone.0166065 November 3, 2016 7 / 15

interval conversion tables were produced using Rasch analysis to enable use of domain scoresin parametric statistics.
Method
Participants and Procedure. Detailed information about participants and procedure ispublished elsewhere [11]. Using the national electoral roll, 3,000 individuals from the gen-eral population were randomly selected and sent a mail survey with a pre-paid return enve-lope. The questionnaire contained the 26 items of the core WHOQOL-BREF instrument aswell as the 24 items developed in Study 2 (Table 2) and a demographics section. Two ver-sions of the questionnaire with different question ordering were used to control for ordereffects. Due to underrepresentation of younger persons, a supplementary sample of youngeradults was obtained using purposive sampling [11]. The total number of valid question-naires was 808.
Data analysis. Inferential statistical analyses were conducted using SPSS. Based on previ-ous WHOQOL studies [8,9], the following criteria were used to determine the suitability ofnational items:
• Item means are between 2 to 4 on the 5-point Likert scale.
• Correlations of the item are above 0.30 with a) total QOL, b) the g facet (sum of the globalQOL and health items), and c) the global QOL and health items separately.
• The item discriminates between ill and well participants.
• The item does not duplicate any of the other candidate national items.
• The item does not duplicate any of the existingWHOQOL items.
• Correlation above 0.40 with the likely parent domain (physical, psychological, social or envi-ronmental QOL) of the item.
• The overall Cronbach’s alpha is above 0.70 at the domain level with candidate national itemadded, and overall Cronbach’s alpha decreases when candidate national item is removed.
• The national items significantly predict total QOLwhen other existingWHOQOL itemsfrom the same domain are controlled for.
• A factor structure with the national items provides an acceptable fit.
• An item has an acceptable fit to the Raschmodel (fit residuals ±2.5).
Factor structure was assessed using confirmatory factor analysis. Here, asymptotic distri-bution-free confirmatory factor analysis was conducted using LISREL v. 8.80 [18] in thesame way as outlined by Krägeloh et al. [11]. Three indices were used to evaluate goodness offit: root mean square error of approximation (RMSEA), comparative fit index (CFI) andstandardised root mean square residual (SRMR). Following frequently quoted guidelines[19], model fits were considered acceptable if RMSEA< 0.06, CFI> 0.90, and SRMR< 0.08.Subsequent Rasch analysis using the software RUMM2030 [20] was conducted to confirmthe results by exploring item functioning and the unidimensionality of each domain. Theapproach taken in the Rasch analysis is outlined in great detail elsewhere [21]. Provided thedata fits the Raschmodel, the present study aimed to produce ordinal-to-interval conversionalgorithms to allow the use of domain scores (original domain scores and domain scores withoptional national items) without the need to break fundamental assumptions of parametricstatistics.
National Items for the New Zealand Version of the WHOQOL-BREF
PLOS ONE | DOI:10.1371/journal.pone.0166065 November 3, 2016 8 / 15
Results and Discussion
The means of the 24 candidate national items (N1 to N24, see Table 2) ranged from 2.65 (Gov-ernment listens to views) to 4.20 (Value family roots), and most were between 3.00 and 4.00.Most items had acceptable levels of skewness kurtosis, with only two items (Value family rootsand Access modern technology) marginally outside the normal range of -1.00 to 1.00 [22] forskewness, and two items (Access modern technology andMeet expectations) marginally outsidethe range for kurtosis.
The following analyses investigated concurrent validity by correlating each national itemwith a total QOL score and the score on the g facet. Item N4 had an item-total and item-g facetcorrelation of less than 0.30. This item was therefore discarded, together with items N5, N6,N7, N14, N17, N18, N20 and N23, which had correlations of less than 0.30 with the g facet.The remaining items N1, N2, N3, N8 N9, N10, N11, N12, N13, N15, N16, N19, N21, N22, andN24 were then examined for their correlations with the two general items (global QOL andglobal health) of theWHOQOL-BREF. Only items N1, N2, N3, N9, N11, N16, N19 and N21had correlations over 0.30 with both general items and were thus retained.
The next step was to examine the discriminant validity of the candidate national items thathad met the above criteria for concurrent validity. When controlling for gender, the scores forill people were significantly (p< .01) different from those of well people, except for item N19(Eat healthily) (F(1, 788) = 3.52, p>.05), which was then discarded. Correlation coefficientswere calculated for the remaining seven candidate national items (N1, N2, N3, N9, N11, N16,and N21) to investigate whether there are any item duplications. Items N1 (Individual free-dom), N2 (Successful in things), and N3 (Control over life) were identified as having coefficientsabove 0.60. Since N3 had the highest correlations of all three items with the global QOL andhealth items as well as the g facet, N3 was retained and the redundant items N1 and N2 werediscarded. Finally, correlation coefficientswere calculated for the remaining five items (N3,N9, N11, N16, and N21) to assess whether these candidate items duplicate any of the existingWHOQOL items. As none of the correlations were above 0.60, this was not the case. A finalsemantic check of the items also verified that none of the remaining five candidate nationalitems covered the same content as the existingWHOQOL items.
Items N3, N9, N11, N16, and N21 also met the criterion of correlations above 0.40 withdomain scores. All items were most highly correlated with the psychological domain (range0.58 to 0.63). While Item N9 had a marginally higher correlation (0.60) with the psychologicaldomain than with the social domain (0.55), this item (Feelings of belonging) appeared to belong(no pun intended) more to the social domain based on face validity. However, the subsequentconfirmatory factor analysis did explore the assignment of this item to either of the twodomains.
Cronbach’s alpha for the items of the psychological domain of theWHOQOL-BREF andthe four proposed national items for this domain (N3, N11, N16, and N21) was 0.89, whichindicated good internal consistency. The corrected item-total correlation for the four proposednational items ranged from 0.61 to 0.65, suggesting that the proposed national items were con-sistent with theWHOQOL-BREF psychological items. Each potential national item made apositive contribution to the reliability of the psychological domain, as demonstrated by thedecreased overall Cronbach’s alpha when each national item was deleted. Similarly, Item N9met the reliability criteria for the social domain. Cronbach’s alpha with Item N9 was 0.76, indi-cating adequate internal consistency. The corrected item-total correlation was 0.55 and thusabove the cut-off value of 0.40, and Cronbach’s alpha decreased to 0.72 if the item is removed.
A series of hierarchical multiple linear regressions were conducted to examine the predic-tion validity of the candidate national items. In the case of the psychological domain, Items N3,
National Items for the New Zealand Version of the WHOQOL-BREF
PLOS ONE | DOI:10.1371/journal.pone.0166065 November 3, 2016 9 / 15

N11, N16, and N21 significantly predicted the total QOL score when existing items of the psy-chological domain were controlled for in the first block of the regression. Standardised betacoefficients ranged from 0.05 to 0.12. Similarly, Item N9 significantly predicted (standardisedbeta coefficient of 0.32) total QOL when the other social domain items were controlled for.
After the above-mentioned criteria have been applied, a final set of five national itemsremained: N3 (“To what extent do you feel you have control over life?”), N9 (“To what extentdo you have feelings of belonging?”), N11 (“To what extent are your able to manage personaldifficulties?”),N16 (“To what extent do you feel respected by others?”), and N21 (“How satis-fied are you that you are able to meet the expectations placed on you?”). Table 3 provides asummary of correlations of the national items with the criterion variables, as discussed above.
The adequacy of the proposed factor solutions was tested using confirmatory factor analysis.A diagonally-weighted least-squares confirmatory factor analysis with polychoric correlationstested three alternative models. Model A was the originalWHOQOL-BREFdomain structurewithout the national items. Model B assigned all five national items to the psychologicaldomain, which was the domain that these items had the highest correlations with. Model Cassigned all national items to the psychological domain except for the national item N9 (Feel-ings of belonging), which was assigned to the social relationships domain based on face validity.BothModels B (RMSEA = 0.067, CFI = 0.974, SRMR = 0.067) and C (RMSEA = 0.066,CFI = 0.974, SRMR = 0.065) provided improved fit indices over the originalWHOQOL-BREFfactor structure tested in Model A (RMSEA = 0.079, CFI = 0.962, SRMR = 0.077). Model Cprovided the best factor structure and thus confirmed that the national item N9 is best to beassigned to the social relationships domain.
The results from Rasch analyses of the four domains of the NZWHOQOL-BREFwerereported elsewhere [11]. The present study conducted additional analyses of the fit of the psy-chological and social domains to the Raschmodel when the new national items were added.For the psychological domain, none of the items had disordered threshold. The initial modeldid not fit the Raschmodel, with χ2(60) = 98.04, p< .001. Similar to Krägeloh et al. [11], localdependencywas evident, which was dealt with by creating two sub-tests. The solution resultedin an adequate fit, with χ2(42) = 41.99, p>.05. The adequacy of the fit was further indicated bya PSI of 0.87 (criterion>0.70) and means and standard deviations of fit residuals close to 0.00and 1.00, respectively. Lastly, no DIF was evident, and unidimensionality was confirmed by thefact that the lower bound of a binominal confidence interval computed for the number ofobserved significant t tests overlapped the 5% cutoff point.
Table 3. National item means and correlations (Pearson’s r) with criterion variables, namely total QOL score, g facet (sum of the global QOL and
health items), global QOL item, global health item, and parent domain total). The parent domain was the psychological domain for items N3, N11,
N16, and N21 and the social domain for N9. The item to parent domain coefficients were calculated with domain scores when the national items had not
been added.
Final national items Mean Item to total
QOL
Item to g
facet
Item to global QOL
item
Item to global health
item
Item to parent
domain
N3. Control over life 3.79 .63** .47** .47** .36** .63**
N9. Feelings of belonging 3.77 .61** .40** .39** .32** .55**
N11. Manage personal
difficulties
3.78 .62** .45** .44** .36** .60**
N16. Respected by others 3.72 .59** .38** .35** .31** .63**
N21. Meet expectations 3.78 .59** .46** .40** .41** .58 **
** p < .01
doi:10.1371/journal.pone.0166065.t003
National Items for the New Zealand Version of the WHOQOL-BREF
PLOS ONE | DOI:10.1371/journal.pone.0166065 November 3, 2016 10 / 15

Rasch analysis of the social domain with the additional national item N9 revealed the sameissues with disordered thresholds of Items 20 and 21 as reported by Krägeloh et al. [11]. Re-scoring the two items by collapsing response categories 2 and 3 resulted in an adequate fit(χ2(24) = 36.23, p>.05), but significant DIF was evident by age for Item 21 (Sexual life). Split-ting the item by age improved the fit slightly, with χ2(29) = 40.63, p>.05 and PSI = 70. Themeans and standard deviations of the fit residuals were adequate, and unidimensionality of thedomain was also confirmed.
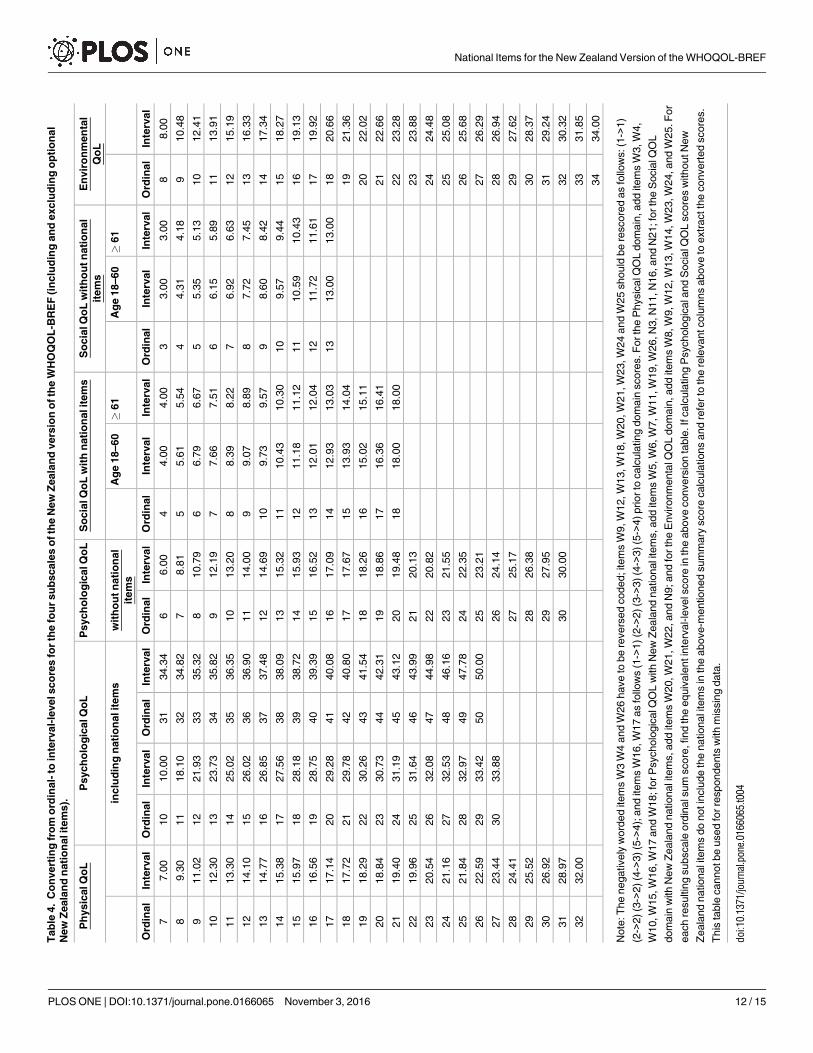
Lastly, ordinal-to-interval rescoring algorithms were generated for the four WHOQOL--BREF domains without the national items as well as the psychological and social domain withthe optional national items added (Table 4). Due to the DIF by age for one of the items in thesocial domain, separate scoring algorithms need to be applied for individuals between 18 to 60years of age and those above 60 years. Using the conversion table presented in Table 4, theordinal scores from adding item scores to domain sum scores can now be converted to inter-val-level scores, thus making the domain scores suitable for parametric statistics.
General Discussion
The present paper outlined a project to develop optional national items for the New Zealandversion of theWHOQOL-BREF. Using focus groups, 16 themes were identified of aspects thatare not covered by existingWHOQOL facets. From the themes, 46 items were generated whichwere rated by a large sample of individuals from the New Zealand general population for theimportance to their QOL. The number of items was then reduced to 24, which were then sentout to another large general population to be rated alongside the existingWHOQOL-BREFquestions. Applying a series of criteria to test psychometric robustness, the number of itemswas finally reduced to five: Control over life, Feelings of belonging,Manage personal difficulties,Respected by others, andMeet expectations. Confirmatory factor analyses provided evidencethat Feelings of belonging is part of the social domain, while the remaining items are best placedin the psychological domain. Rasch analysis confirmed these results and further provided ordi-nal-to-interval conversion algorithms that increase precision of measurement and enable theuse of domain scores in parametric statistics.
Five national items were selected out of a set of 24 proposed items for the New ZealandWHOQOL-BREF questionnaire. Previously, 41 national items were selected from 138 pro-posed items by the 10 early establishedWHOQOL centres, ranging from one national itemselected by the Bath, Harare and ZagrebWHOQOL centres to 10 items selected by the StPetersburg WHOQOL centre [8]. No national items were selected out of 11 items proposed bythe Beer Sheva centre. The national items selected by other early established centres were 4items (Bangkok, Tokyo), 5 items (New Delhi), 6 items (Madras) and 9 items (Hong Kong).The average number of items selectedwas four, which is one item less than that for the NewZealand national items. The newWHOQOLTaiwan centre has selected 12 items from 20national items proposed for theWHOQOL-100 [9], which together with the 12 items for theHong Kong version [10] is by far the most national items selected.
By including items unique to New Zealand culture, the conceptual equivalence of WHO-QOL domains is expected to be improved for QOL comparisons across cultures. The additionalitem N3 (Feelings of belonging) will increase the number of items in the social domain fromthree items to four items. As three items are generally considered the bare minimum for a sub-scale, the psychometric robustness of the social domain has improved with this new additionalitem. However, it is important to note that anyone using the national items as part of a domainscore will need to state this explicitly, so that no comparisons will be made with domain scoresfrom studies reporting domain scores that do not contain the national items.
National Items for the New Zealand Version of the WHOQOL-BREF
PLOS ONE | DOI:10.1371/journal.pone.0166065 November 3, 2016 11 / 15
Tab
le4.
Co
nvert
ing
fro
mo
rdin
al-
toin
terv
al-
levelsco
res
for
the
fou
rsu
bscale
so
fth
eN
ew
Zeala
nd
vers
ion
ofth
eW
HO
QO
L-B
RE
F(i
nclu
din
gan
dexclu
din
go
pti
on
al
New
Zeala
nd
nati
on
alit
em
s).
Ph
ysic
alQ
oL
Psych
olo
gic
alQ
oL
Psych
olo
gic
alQ
oL
So
cia
lQ
oL
wit
hn
ati
on
alit
em
sS
ocia
lQ
oL
wit
ho
ut
nati
on
al
item
s
En
vir
on
men
tal
Qo
L
inclu
din
gn
ati
on
alit
em
sw
ith
ou
tn
ati
on
al
item
s
Ag
e18–60�
61
Ag
e18–60�
61
Ord
inal
Inte
rval
Ord
inal
Inte
rval
Ord
inal
Inte
rval
Ord
inal
Inte
rval
Ord
inal
Inte
rval
Inte
rval
Ord
inal
Inte
rval
Inte
rval
Ord
inal
Inte
rval
77.0
010
10.0
031
34.3
46
6.0
04
4.0
04.0
03
3.0
03.0
08
8.0
0
89.3
011
18.1
032
34.8
27
8.8
15
5.6
15.5
44
4.3
14.1
89
10.4
8
911.0
212
21.9
333
35.3
28
10.7
96
6.7
96.6
75
5.3
55.1
310
12.4
1
10
12.3
013
23.7
334
35.8
29
12.1
97
7.6
67.5
16
6.1
55.8
911
13.9
1
11
13.3
014
25.0
235
36.3
510
13.2
08
8.3
98.2
27
6.9
26.6
312
15.1
9
12
14.1
015
26.0
236
36.9
011
14.0
09
9.0
78.8
98
7.7
27.4
513
16.3
3
13
14.7
716
26.8
537
37.4
812
14.6
910
9.7
39.5
79
8.6
08.4
214
17.3
4
14
15.3
817
27.5
638
38.0
913
15.3
211
10.4
310.3
010
9.5
79.4
415
18.2
7
15
15.9
718
28.1
839
38.7
214
15.9
312
11.1
811.1
211
10.5
910.4
316
19.1
3
16
16.5
619
28.7
540
39.3
915
16.5
213
12.0
112.0
412
11.7
211.6
117
19.9
2
17
17.1
420
29.2
841
40.0
816
17.0
914
12.9
313.0
313
13.0
013.0
018
20.6
6
18
17.7
221
29.7
842
40.8
017
17.6
715
13.9
314.0
419
21.3
6
19
18.2
922
30.2
643
41.5
418
18.2
616
15.0
215.1
120
22.0
2
20
18.8
423
30.7
344
42.3
119
18.8
617
16.3
616.4
121
22.6
6
21
19.4
024
31.1
945
43.1
220
19.4
818
18.0
018.0
022
23.2
8
22
19.9
625
31.6
446
43.9
921
20.1
323
23.8
8
23
20.5
426
32.0
847
44.9
822
20.8
224
24.4
8
24
21.1
627
32.5
348
46.1
623
21.5
525
25.0
8
25
21.8
428
32.9
749
47.7
824
22.3
526
25.6
8
26
22.5
929
33.4
250
50.0
025
23.2
127
26.2
9
27
23.4
430
33.8
826
24.1
428
26.9
4
28
24.4
127
25.1
729
27.6
2
29
25.5
228
26.3
830
28.3
7
30
26.9
229
27.9
531
29.2
4
31
28.9
730
30.0
032
30.3
2
32
32.0
033
31.8
5
34
34.0
0
Note
:T
he
negatively
word
ed
item
sW
3W
4and
W26
have
tobe
revers
ed
coded;item
sW
9,W
12,W
13,W
18,W
20,W
21,W
23,W
24
and
W25
should
be
rescore
das
follo
ws:(1
->1)
(2->
2)(3
->2)(4
->3)(5
->4);
and
item
sW
16,W
17
as
follo
ws
(1->
1)(2
->2)(3
->3)(4
->3)(5
->4)priorto
calc
ula
ting
dom
ain
score
s.F
orth
eP
hysic
alQ
OL
dom
ain
,add
item
sW
3,W
4,
W10,W
15,W
16,W
17
and
W18;fo
rP
sycholo
gic
alQ
OL
with
New
Zeala
nd
nationali
tem
s,add
item
sW
5,W
6,W
7,W
11,W
19,W
26,N
3,N
11,N
16,and
N21;fo
rth
eS
ocia
lQO
L
dom
ain
with
New
Zeala
nd
nationalitem
s,add
item
sW
20,W
21,W
22,and
N9;and
for
the
Environm
enta
lQO
Ldom
ain
,add
item
sW
8,W
9,W
12,W
13,W
14,W
23,W
24,and
W25.F
or
each
resultin
gsubscale
ord
inals
um
score
,find
the
equiv
ale
ntin
terv
al-le
vels
core
inth
eabove
convers
ion
table
.If
calc
ula
ting
Psycholo
gic
ala
nd
Socia
lQO
Lscore
sw
ithoutN
ew
Zeala
nd
nationalitem
sdo
notin
clu
de
the
nationali
tem
sin
the
above-m
entioned
sum
mary
score
calc
ula
tions
and
refe
rto
the
rele
vantcolu
mns
above
toextr
actth
econvert
ed
score
s.
This
table
cannotbe
used
forre
spondents
with
mis
sin
gdata
.
doi:10.1
371/jo
urn
al.p
one.
0166065.t004
National Items for the New Zealand Version of the WHOQOL-BREF
PLOS ONE | DOI:10.1371/journal.pone.0166065 November 3, 2016 12 / 15
Four of five New Zealand national items belong to the psychological domain, indicating theimportance of psychological aspects of QOL to New Zealanders. Similar to the Taiwanese andHong Kong versions [10], one such item asks about the respect received from other people.Another item (Feelings of belonging) that was assigned to the social relationships domain couldbe a reflection of the influence of collectivismof Māori culture [23] on the dominant individu-alistic British culture [24]. Similarly, the itemMeeting expectation may also be a reflection ofMāori and Polynesian culture, where values and obligations are centred around the extendedfamily and community [25].
While more than half of themes from the focus groups of Study 1 related to physical andenvironmental aspects, none of the new items generated from these themes remained after thevarious psychometric criteria had been applied. No new national items were therefore devel-oped for the physical and environment domains. One theme that had emerged very strongly inthe focus groups was access to New Zealand’s natural environment. Most New Zealanders areproud of the country’s landscape, with a clean and green image being part of the collective psy-che [26]. However, none of the items about the natural environment and outdoor activities cor-related with QOL or health and could therefore not be justified to be included. This does notnecessarily imply that outdoor activities or activities in natural surroundings are not beneficialto quality of life and health as no information was gathered on actual frequency of such activi-ties. Additionally, the importance of these facets was assessed in the context of many others,and there is the possibility that participants may have tended to take access to outdoors andnature for granted.
A general limitation of the two quantitative surveyswas certainly the low response rate andrepresentativeness of the sample. The response rates of 29% for Study 1 and 24% for Study 2are not ideal but certainly not uncommon for health research of that kind in New Zealand [27].Another issue was the demographic distribution in the two surveys. In both surveys, youngeradults were underrepresented, which led to the decision to purposively target younger peoplefor additional data. On a final note, these results should only be taken as preliminary and areonly published here as work in progress. While we were able to make comparisons betweenparticipants who considered themselves as well and those who considered themselves asunwell, further testing of the national items will be required with populations that are clearlyidentified as unhealthy. This will provide a more stringent test of discriminant validity.
The New ZealandWHOQOLGroup [28] monitors the use of theWHOQOL instrumentsin New Zealand. Please contact the first author for formal registration, or refer to cpcr.aut.ac.nz/new-zealand-whoqolor whoqol.org.nz.Users are encouraged to share their anonymiseddatasets to be added to an ongoing database of reference values, which all registered users areable to access and use for comparative purposes. The New ZealandWHOQOLGroup also pro-vides a user manual with reference values that are updated regularly. The authors may also becontacted for access to the dataset reported on in the present article. These files are also avail-able on the journal’s website as supporting information (S1 and S2 Files).
Supporting Information
S1 File. Data for Study 2. This SPSS file contains ratings from a sample of 585 New Zealandersof importance data for the candidate national items shown in Table 2 as well as for the globalQOL and health items.(SAV)
S2 File. Data for Study 3. This SPSS file contains ratings from a sample of 808 New Zealandersof WHOQOL-BREF items as well as the five national items listed in Table 3. Item columns arearranged by QOL domains. Also shown are the g facet scores and total QOL as well as the age
National Items for the New Zealand Version of the WHOQOL-BREF
PLOS ONE | DOI:10.1371/journal.pone.0166065 November 3, 2016 13 / 15
categories used in Rasch analysis to explore DIF.(SAV)
Acknowledgments
The data for Study 1 were collected in partial fulfilment of one of the authors’ (P.H.-C.H.)degree of Master of Health Science. Parts of the data of Study 2 were analysed by one of theauthors (X.J.F.) in partial fulfilment of the degree Bachelor of Health Science (Hons) and pre-sented at a postgraduate symposium: Feng J, Krägeloh C, Billington R, Hsu P. Selection ofnational items for the New ZealandWorld Health Organisation Quality of Life Questionnaire:Preliminary analyses [working paper]. In Scherman R, Krägeloh C. (Eds.),Walking the talk:The 2011 collection of oral presentations from the AUT School of Public Health and PsychosocialStudies (pp. 87–95). Auckland University of Technology. Auckland, New Zealand; 2011.
Author Contributions
Conceptualization:CUKDRB JL.
Data curation:CUKDRB ONM PH-CH XJF.
Formal analysis:CUKDRB JL PH-CHONM PK XJF.
Funding acquisition:CUKDRB JL.
Investigation: CUKDRB JL PH-CH XJF.
Methodology:CUKDRB JL ONM PH-CH PK RJS XJF.
Project administration:DRB.
Resources:CUKDRB JL PK RJS.
Software:CUKONM PK RJS.
Supervision:CUKDRB.
Validation: CUK PH-CHONMXJF.
Visualization: CUKONM.
Writing – original draft:CUKDRB ONM PH-CH XJF.
Writing – review& editing:CUKDRB JL ONM PH-CH PK RJS XJF.
References1. WHO. Constitution of the World Health Organization. Am J Public Health Nations Health. 1946; 36
(11):1315–1323. PMID: 18016450
2. WHOQOL Group. Development of the WHOQOL: Rationale and current status. Int J Ment Health.
1994; 23(3):24–56.
3. WHOQOL Group. The World Health Organization quality of life assessment (WHOQOL): Development
and general psychometric properties. Soc Sci Med. 1998; 46(12):1569–1585. PMID: 9672396
4. WHOQOL Group. The world Health Organisation quality of life assessment (WHOQOL): position
paper from the world health organisation. Soc Sci Med. 1995; 41(10):1403–1409. PMID: 8560308
5. Skevington SM. Advancing cross-cultural research on quality of life: Observations drawn from the
WHOQOL development. Qual Life Res. 2002; 11(2):135–144. PMID: 12018737
6. Power M, Bullinger M, Harper A, WHOQOL Group. The World Health Organisation WHOQOL-100:
tests of the universality of quality of life in fifteen different cultural groups worldwide. Health Psychol.
1999; 18(5):495–505. PMID: 10519466
National Items for the New Zealand Version of the WHOQOL-BREF
PLOS ONE | DOI:10.1371/journal.pone.0166065 November 3, 2016 14 / 15
7. WHOQOL Group. Development of the WHOQOL-BREF quality of life assessment. Psychol Med.
1998; 28:551–558. PMID: 9626712
8. Skevington SM, Bradshaw J, Saxena S. Selecting national items for the WHOQOL: Conceptual and
psychometric considerations. Soc Sci Med. 1999; 48(4):473–487. PMID: 10075173
9. Yao G, Wang JD, Chung CW. Cultural adaptation of the WHOQOL questionnaire for Taiwan. Journal
of the Formosan Medical Association. 2007; 106(7):592–597. doi: 10.1016/S0929-6646(07)60012-6
PMID: 17660151
10. Yao G, Wu CH. Similarities and differences among the Taiwan, China, and Hong-Kong versions of the
WHOQOL questionnaire. Soc Indic Res. 2009; 91(1):79–98.
11. Krageloh CU, Kersten P, Billington DR, Hsu PH-C, Shepherd D, Landon J, et al. Validation of the
WHOQOL-BREF quality of life questionnaire for general use in New Zealand: Confirmatory factor anal-
ysis and Rasch analysis. Qual Life Res. 2013; 22(6):1451–1457. doi: 10.1007/s11136-012-0265-9
PMID: 22983781
12. Allen M., Yen WM. Introduction on to Measurement Theory. Brooks/Cole. Monterey, CA; 1979.
13. Stucki G, Daltroy L, Katz JN, Johannesson M, Liang MH. Interpretation of change scores in ordinal clin-
ical scales and health status measures: The whole may not equal the sum of the parts. J Clin Epide-
miol. 1996; 49(7):711–717. PMID: 8691219
14. WHOQOL Group. WHOQOL study protocol: The development of the World Health Organization Qual-
ity of Life assessment instrument. World Health Organization. Geneva; 1993.
15. Hsu P. Development of a New Zealand Version of the World Health Organisation Quality of life Survey
Instrument (WHOQOL) (unpublished Masters thesis). Auckland University of Technology. Auckland,
New Zealand; 2009.
16. Dittman CK, Sibley CG, Farruggia SP. Attitudes toward smacking in a New Zealand probability sample:
Psychological and demographic correlates. NZ J Psychol. 2013; 42(1):67–76.
17. Krageloh CU, Billington R, Hsu PH-C, Landon J. What New Zealanders find important to their quality of
life: Comparisons with international WHOQOL data from 14 other countries. A NZ J Public Health.
2015; 39(4):384–388.
18. Joreskog KG, Sorbom D. LISREL 8: Structural equation modelling with the SIMPLIS command lan-
guage. Erlbaum Associates. Hillsdale, NJ; 1993.
19. Hu L, Bentler PM. Cutoff criteria for fit indexes in covariance structure analysis: Conventional criteria
versus new alternatives. Structural Equation Modeling. 1999; 6(1):1–55.
20. Andrich D, Sheridan B, Luo G. RUMM 2030. RUMM Laboratory. Perth, Australia; 2009.
21. Medvedev ON, Siegert RJ, Feng XJ, Billington DR, Jang JY, Krageloh CU. Measuring trait mindful-
ness: How to improve the precision of the Mindful Attention Awareness Scale using a Rasch model.
Mindfulness. 2016; 7(2):384–395.
22. Muthen B, Kaplan D. A comparison of some methodologies for the factor analysis of non-normal Likert
variables. Br J Math Stat Psychol. 1985; 38(2):171–189.
23. Harrington L, Liu JH. Self-enhancement and attitudes towards high achievers: A bicultural view of the
independent and interdependent self. J Cross-Cult Psychol. 2002; 33(1):37–55.
24. Hofstede G. Cultures’ consequences: International differences in work-related values. Sage. Beverly
Hills, CA; 1980.
25. Capstick S, Norris P, Sopoaga F, Tobata W. Relationship between health and culture in Polynesia–A
review. Soc Sci Med. 2009; 68(7):1341–1348. doi: 10.1016/j.socscimed.2009.01.002 PMID:
19195751
26. Egoz S. Clean and green but messy: The contested landscape of New Zealand’s organic farms. Oral
History. 2000; 28(1):63–74.
27. Hill EM, Billington R, Krageloh C. Noise and diminished health: testing moderators and meditators of
the relationship. Noise Health. 2014; 16(68):47–56. doi: 10.4103/1463-1741.127855 PMID: 24583680
28. Billington R, Landon J, Krageloh CU, Shepherd D. The New Zealand WHOQOL Group. N Z Med J.
2010; 123:65–70.
National Items for the New Zealand Version of the WHOQOL-BREF
PLOS ONE | DOI:10.1371/journal.pone.0166065 November 3, 2016 15 / 15