oregon investment council · 6/3/2020 · 9:10 am real estate consultant recommendation, l.p. –...
TRANSCRIPT

Oregon Investment Council
June 3, 2020
John Russell Chair Rex Kim Chief Investment Officer Tobias Read State Treasurer

John Russell Patricia Moss Cara M. Samples Tobias Read Kevin Olineck Chair Vice-Chair Member State Treasurer PERS Director
OREGON INVESTMENT COUNCIL
Agenda
June 3, 2020
9:00 AM
Oregon State Treasury Investment Division
16290 SW Upper Boones Ferry Road Tigard, OR 97224
Time A. Action Items Presenter Tab 9:00-9:05 1. Review & Approval of Minutes John Russell 1 April 22, 2020 OIC Chair 9:05-9:15 2. Committee Reports and Opening Remarks Rex Kim 2 Chief Investment Officer 9:15-10:00 3. Market Environment Greg Jensen 3 Co-Chief Investment Officer, Bridgewater Associates 10:00-10:30 4. Asset Allocation, Capital Markets Assumptions Karl Cheng 4 Senior Investment Officer, Portfolio Risk & Research Janet Becker-Wold Senior Vice President, Callan LLC Allan Emkin Managing Principal, Meketa Investment Group, Inc. 10:30-10:55 5. Fixed Income Manager Recommendation Geoff Nolan 5 Senior Investment Officer, Fixed Income B. Information Items 10:55-11:00 6. Asset Allocation & NAV Updates Rex Kim 6 a. Oregon Public Employees Retirement Fund b. SAIF Corporation c. Common School Fund d. Southern Oregon University Endowment Fund

John Russell Patricia Moss Cara M. Samples Tobias Read Kevin Olineck Chair Vice-Chair Member State Treasurer PERS Director
OIC Meeting Agenda June 3, 2020 Page 2
7. Calendar — Future Agenda Items Rex Kim 7 11:00 8. Open Discussion OIC Members Staff Consultants C. Public Comment

TAB 1 – REVIEW & APPROVAL OF MINUTES
April 22, 2020 Regular Meeting

Oregon Investment Council
State of Oregon Office of the State Treasurer
16290 SW Upper Boones Ferry Road Tigard, Oregon 97224
OREGON INVESTMENT COUNCIL April 22, 2020
Meeting Minutes
Members Present: John Russell, Tobias Read, Patricia Moss, Cara Samples and Kevin Olineck
Staff Present: Rex Kim, Tony Breault, Karl Cheng, May Fanning Staff Participating virtually: Jennifer Peet, Scott Robertson, Faith Sedberry, Paul Koch, Tyler Bernstein, Eric
Messer, Aliese Jacobsen, Meredith Coba, John Hershey, Krystal Korthals, Dmitri Palmateer, Jeremy Knowles, Caitlyn Wang, Chris Ebersole, Sommer May, Michael Langdon, Will Hampson, Robin Kaukonen, Jen Plett, Michael Viteri, Amanda Kingsbury, Kaellen Hessel, Jo Recht, Dana Millican, Tiffany ZhuGe, Monique Sadegh, Geoff Nolan, Mohammed Quraishi, Claire Illo, Perrin Lim, Kelly Cook, Ahman Dirks, James Sinks, Ben Mahon, Ryan Mann, Angela Schaffers, Joe Hutchinson, Sam Spencer, Sabra Purifoy ,Ian Huculak, Deena Bothello, Wil Hiles, Mark Selfridge, David Randall, Steve Kruth, Roy Jackson, Austin Carmichael, Mike Mueller, Andrey Voloshinov, Michael Kaplan, Debra Day, Anna Totdahl, Amy Bates, Lisa Pettinati, Kristi Jenkins, David Elott, Kenny Bao,
Consultants Present: Allan Emkin (Meketa Investment Group, Inc.); Janet Becker-Wold and Jim
Callahan (Callan LLC)
Legal Counsel Present: Steven Marlowe, Department of Justice Before proceeding with the OIC meeting, Chief Investment Officer, Rex Kim provided a disclosure pertaining to the first-time virtual set-up of this OIC meeting, informing those in attendance (virtual and in person) of the guidelines in which this meeting will proceed. The April 22nd, 2020 OIC meeting was called to order at 9:02 am by John Russell, OIC Chair. After doing the roll call, Mr. Russell wanted to acknowledge the shift that recently occurred in the Council, with Treasurer Read appointing Vice Chair, Rex Kim as the new OST, Chief Investment Officer. He went on to express the appreciation that both Council and Staff have in this regard. I. 9:03 am Review and Approval of Minutes
MOTION: Chair Russell asked for approval of the March 11, 2020 OIC regular meeting minutes. Treasurer Read moved approval at 9:04 am, and Ms. Moss seconded the motion which then passed by a 4/0 vote.

OREGON INVESTMENT COUNCIL April 22, 2020
Meeting Minutes
Oregon Investment Council
2
II. 9:04 am Special Officer Election MOTION: Treasurer Read nominated Patricia Moss as the OIC, Vice Chair, and Mr. Russell seconded the motion at 9:05 am, which then passed by a 3/0 vote.
III. 9:05 am Committee Reports and Opening Remarks Committee Reports: Mr. Kim, gave an update on the following committee actions taken since the March 11, 2020 OIC meeting:
Private Equity Committee March 20, 2020 Mayfield XVI, L.P. $30M Mayfield Select II, L.P. $20M April 13, 2020 Francisco Partners VI, L.P. $250M Francisco Partners Agility II, L.P. $50M Alternatives Portfolio Committee February 11, 2020 LS Power Bolt Energy LLC top-off $11m (Per INV 702 and ORS 293.736, John Skjervem approved the above add-on investment with recommendation from the Director of Alternative Investments and TorreyCove, the Advisor to the Alternatives Portfolio.) Real Estate Committee None
Opportunity Portfolio Committee None
Mr. Kim also, provided opening remarks which started with his expressed appreciation for the opportunity to work with everyone in his new role at OST. He then provided a quick OIC agenda overview which included, the Market Commentary from Meketa and Callan, Real Estate Consultant Recommendation, and Strategic Policy for Risk Parity, in addition to the Asset Allocation, NAV and forward calendar.
IV. 9:10 am Real Estate Consultant Recommendation, L.P. – OPERF
Tony Breault, Senior Investment Officer, Real Estate, along with the Committee, recommends that the Oregon Investment Council pursue a non-discretionary, full retainer consulting contract with Meketa Investment Group, Inc (“Meketa”) beginning July 1, 2020 for the OPERF Real Estate Portfolio. The Committee further recommends pursuing an initial three-year contract term with two, pre-negotiated 24-month extensions available at the Council’s discretion
With the contract expiring in June 2020, a Committee was formed to undertake a formal Request for Proposals process to identify candidate firms to provide Real Estate Portfolio consulting services. The Committee commenced a formal search process by issuing an RFP for Real Estate Portfolio consulting services on August 27, 2019. The RFP was posted to the Treasury website and advertised in various institutional real estate media publications, for eight weeks, and seven qualified firms submitted proposals by the stipulated October 24, 2019 deadline. A sub-group of the Committee, independently reviewed and scored
OREGON INVESTMENT COUNCIL April 22, 2020
Meeting Minutes
Oregon Investment Council
3
all qualifying proposals. Scoring was based on many factors including key person backgrounds, firm history and experience, proposed service plan, monitoring, and the proposed retainer-based fee schedule. After this evaluation process, the sub-group recommended the Committee interview two semi-finalists.
On February 6, 2020 the two semi-finalists presented to the Committee at OST’s Tigard office, after which the Committee identified Meketa as the most attractive candidate relative to Council objectives and Staff needs.
MOTION: Treasurer Read, moved approval at 9:13 am to pursue a non-discretionary, full retainer consulting contract with Meketa Investment Group, Inc, beginning July 1, 2020 for the OPERF Real Estate Portfolio. Ms. Samples, seconded the motion which then passed by a 4/0 vote.
V. 9:13 am Strategic Policy for Risk Parity – OPERF Karl Cheng, Senior Investment Officer, Portfolio Risk & Research, recommends approval of the new policy, INV 610 Strategic Role of Risk Parity for OPERF, governing the OPERF Risk Parity Portfolio.
At its April 2019 meeting, the Oregon Investment Council approved a staff recommendation for a 2.5% allocation to Risk Parity during the Strategic Asset Allocation & Capital Markets Assumptions Update. As the name suggests, “Risk Parity” balances the risk contributions in a portfolio equally among the portfolio’s component asset classes, which typically includes public equity, fixed income and commodities. Moreover, in order to provide a level of return commensurate with that of the traditional “60/40” portfolio, risk parity strategies are levered through various means, including the use of exchange-traded futures contracts. Comprising a collection of long-only beta exposures, Risk Parity is positively correlated to public equity and fixed income. Nevertheless, and due primarily to its levered fixed income exposures (as expressed through U.S. Treasury and other sovereign bond futures), Risk Parity can still serve as an effective diversifier within an otherwise broad asset allocation strategy. The Council approved investments in three risk parity strategies in subsequent meetings, the latest approval at its January 2020 meeting. Given the onboarding process for these strategies are near completion, staff recommends approval of a governing policy for the OPERF Risk Parity Portfolio. Since this new Portfolio resides in Capital Markets, the proposed policy shares many attributes with those for the Public Equity and Fixed Income Portfolios, including staff discretion to rebalance and terminate managers.
MOTION: Member Moss, moved approval of the new policy, INV 610 Strategic Role of Risk Parity for OPERF at 9:15 am. Treasurer Read, seconded the motion which then passed by a 4/0 vote.
VI. 9:15 am Market Environment Review Allan Emkin, Managing Principal, Meketa Investment Group, Inc. provided a short presentation on the market environment within the context of the evolution of the OPERF investment program. As he went through the presentation, he discussed the historical U.S. equity prices and long-term interest rates, historical U.S. equity market declines and recoveries, OST evolution, belief statements, challenges and looking head. Thereafter, Jim Callahan, President, Callan LLC and Janet Becker, Senior Vice President, Callan LLC, gave the Council their presentation which included, the Quarter 2020 and YTD through April 10, Market Snapshot, and an OST portfolio update.

OREGON INVESTMENT COUNCIL April 22, 2020
Meeting Minutes
Oregon Investment Council
4
VII. 10:23 am Asset Allocation & NAV Updates Mr. Kim reviewed asset allocations and NAVs across OST-managed accounts for periods ended March 31, 2020.
VIII. 10:24 am Calendar – Future Agenda Items A calendar listing of future OIC meetings and scheduled agenda topics was included in the Council’s meeting material.
IX. 10:25 am Open Discussion Treasurer Read made a general comment regarding the outcome of the first virtual OIC meeting, stating that things went well and it’s reasonable to assume the next meeting will be similar to this format. He encouraged the virtual participants to share their thoughts and feedback, if any, to help make improvement to this platform moving forward. Chair Russell also made a comment pertaining to the current global situation. He observed how different the macro environment is even when compared to the first of the year. Chair Russell emphasized in particular the growing federal deficit, which begs the question, whether the dollar will continue to be the reserve currency for the world. He wanted to raise this issue to encourage discussion that provides thoughts and ideas on how to better deal with this possible worldwide change. 10:28 am Public Comments None
Mr. Russell adjourned the meeting at 10:29 am. Respectfully submitted,
May Fanning Executive Support Specialist

TAB 2 – Opening Remarks and Committee Reports

Opening RemarksRex T. Kim, Chief Investment Officer
Oregon Investment CouncilJune 3, 2020

Agenda:
• Market Commentary from Greg Jensen, Co-CIO at Bridgewater Associates
• Action Items: Asset Allocation & Capital Markets Assumptions; Fixed Income Manager Recommendation
• Asset Allocation, NAV, and a look into future meetings

Tobias ReadOregon State Treasurer
oregon.gov/treasury350 Winter St NE, Suite 100Salem, OR 97301-3896

TAB 3 – Market Environment
CONFIDENTIAL
TAB 4 – Asset Allocation, Capital Markets Assumptions

OPERF Capital Market Assumptions Update
Purpose Provide the OIC with updated Capital Market Assumptions and revised estimates of OPERF’s long-term, forward-looking risk and return.
Background OST staff work with the Council’s general consultant to annually update risk and return expectations for OPERF based on a) the consultant’s Capital Market Assumptions and b) OPERF’s strategic asset allocation targets. Every three to five years, the assumptions are incorporated in a rigorous study of OPERF’s assets and liabilities. The Capital Market Assumptions are also more prominent every odd-number year, e.g., 2019, since they coincide with the Public Employees Retirement System (PERS) Board’s biannual setting of the assumed rate of investment return. During those sessions, the PERS Board considers OPERF’s asset allocation and the Capital Market Assumptions, alongside their actuary’s analysis, and approves an assumed rate of return. At their July 2019 meeting, the PERS Board reaffirmed an assumed rate of 7.2%.
The Capital Market Assumptions provided by the general consultant, Callan LLC, are mostly unchanged from last year. However, they lowered the expected return for Fixed Income from 3.75% to 2.75% and lowered the expected returns for Risk Parity and Diversify Strategies by 0.25% and 0.15%, respectively. Accordingly, the ex-ante, average annual estimate of OPERF’s “beta” return is reduced from 7.30% to 7.10%. The expected volatility (Standard Deviation) was moderately reduced from 12.5% to 12.4%.
Asset Class Target Allocation (%)
Rebalancing Range (%)
Expected Annual Policy
Return (%) Public Equity 32.5 27.5 – 37.5
Broad U.S. Equity 16.3 7.2 Global ex-U.S. Equity 16.3 7.3
Private Equity 17.5 14.0 – 21.0 9.2 Fixed Income 20.0 15.0 – 25.0 2.8 Real Estate 12.5 9.5 – 15.5 7.0 Alternatives 15.0 7.5 – 17.5
Illiquid 7.5 7.4 Diversifying Strategies 7.5 6.0
Risk Parity 2.5 0.0 – 2.5 6.3 Total Fund 100.0 7.1
Staff Recommendation Approve staff’s proposed revision to INV 1203 (Statement of Investment Objectives and Policy Framework for OPERF) with updated Capital Market Assumptions and other edits.
0OPERF 2020 Asset Allocation UpdateKnowledge. Experience. Integrity.
Oregon Public Employees’ Retirement Fund
2020 Asset Allocation Update
June 3, 2020
Jason Ellement, CFA, FSASenior Vice President
Kevin Machiz, CFA, FRMVice President

1OPERF 2020 Asset Allocation UpdateKnowledge. Experience. Integrity.
Outline
● 2020 – 2029 Callan Capital Market Assumptions– Callan Process– Return and Risk Expectations
● Long-Term Strategic Policy– Expected Return and Risk– Investment Return Assumption
● Standard Deviation– A Wide Range of Outcomes Possible
● Correlations– Benefits of Diversification
● Appendix

2OPERF 2020 Asset Allocation UpdateKnowledge. Experience. Integrity.
Callan Capital Market Process
● Every year, Callan establishes a 10-year forward looking capital market outlook– Capital market expectations are primarily developed by Capital Markets Research with assistance from
other Callan subject matter experts– 10-year expectations are ultimately vetted by Callan’s Client Policy Review Committee (CPRC)
● Purpose of capital market expectations is to guide long-term strategic planning– Typically, don’t vary substantially from year to year but must acknowledge recent performance – Critical inputs for all asset allocation/asset-liability studies– Forward-looking but anchored in long-term history
● Callan annual process to update 10-year projections1. Evaluate current environment and economic outlook
– Explore topical issues/themes that are pertinent to today2. Examine long-term history
– Relationships between asset class assumptions are as important as the individual asset class level of assumptions3. Develop 10-year expectations for risk, return and correlations based on steps 1 and 24. Test expectations for reasonable results
● The capital market process incorporates both quantitative models as well as qualitative input of Callan consulting professionals– Bond and equity models– Scenario Analysis

3OPERF 2020 Asset Allocation UpdateKnowledge. Experience. Integrity.
2020 – 2029 Capital Market Assumptions
● Callan 2020 – 2029 capital market assumptions were developed in late 2019 and are intended for long-term strategic planning
● All return expectations are net of fees.
Asset Class IndexExpected
ReturnStandard
Deviation (Risk)Equities
Broad US Equity Russell 3000 7.15% 18.10%Global ex-US Equity MSCI ACWI ex USA 7.25% 20.50%Private Equity OPERF Benchmark 9.20% 26.30%
Fixed IncomeUS Fixed Income Barclays Aggregate 2.75% 3.75%
Real EstatePrivate Real Estate1 OPERF Benchmark 7.00% 12.20%
OtherRisk Parity OPERF Benchmark 6.25% 11.00%
AlternativesIlliquid Alternatives2 OPERF Benchmark 7.40% 12.60%Diversifying Strategies3 OPERF Benchmark 6.00% 11.00%
Inflation CPI-U 2.25% 1.50%
1 - 55% Core Real Estate / 20% Value Add / 20% Opportunistic / 5% REITs 2 - 42% Private Infrastructure / 58% Private Energy3 - 67% Risk Premia / 33% Trend Following

4OPERF 2020 Asset Allocation UpdateKnowledge. Experience. Integrity.
Economic Outlook
● GDP and inflation– GDP forecasts provide a very rough estimate of future earnings growth.– Inflation forecasts provide an approximate path for short-term yields.– Inflation is added to the real return forecasts for equity and fixed income.
● GDP forecasts– 2% to 3.0% for the U.S.– 1.5% to 2.5% for developed ex-U.S. markets– 2% to 5% for emerging markets– All forecasts are below long-term averages.– Path to longer-term growth will include cycles with recessions
● Inflation forecasts– 2% to 2.5% for the U.S.– 1.75% to 2.25% for developed ex-U.S. markets– 2.0% to 3.0% for emerging markets

5OPERF 2020 Asset Allocation UpdateKnowledge. Experience. Integrity.
2020 – 2029 Capital Market Assumptions
10-Year Equity Return Expectations
● Broad U.S. equity– Earnings growth likely to
moderate–Coming off strong period of
gains, despite modest GDP growth
–Benefited from expansive economic policies
– Dividend yield consistent with recent history–Yields stable for 20 years in
the face of changing interest rates
● Broad global ex-U.S. equity– Earnings growth likely to be
moderate–Significant uncertainty in
future economic policies– Relatively high dividend yields
will support returns

6OPERF 2020 Asset Allocation UpdateKnowledge. Experience. Integrity.
10-Year Fixed Income Return Expectations
Fixed Income Return = Income + Capital gain/(loss) + Credit Default + Roll Return
Broad U.S. fixed incomeReturn = 2.75%, Risk = 3.75%
– Expectation of higher yields over 10-year horizon– Yield curve expected to gradually steepen as we return to a “normal” term structure– Capital losses expected as yields increase– Little impact from changing credit spreads– Roll return expected to provide modest tailwind
Income Return +
Capital Gain/loss +
Credit Default + Roll Return =
Expected Return
Cash 2.25% 0.00% 0.00% 0.00% 2.25%
Core Fixed Income (Aggregate) 3.40% -0.80% -0.10% 0.25% 2.75%Government 3.05% -0.90% 0.00% 0.25% 2.40%Securitized 3.25% -0.50% 0.00% 0.25% 3.00%Credit 3.95% -0.90% -0.30% 0.25% 3.00%
Emerging Market Sovereign Debt 6.70% -1.20% -1.40% 0.25% 4.35%
High Yield 7.30% -0.70% -2.20% 0.25% 4.65%

7OPERF 2020 Asset Allocation UpdateKnowledge. Experience. Integrity.
Current Long-Term Strategic Policy
● The Expected 10-year return for the portfolio is 7.1% with a standard deviation of 12.4%– The current Investment Return Assumption used for valuing liabilities is 7.20%.
US Fixed Income20.00%
Real Estate12.50%
Private Equity17.50%
Risk Parity2.50%
Public Equity32.50%
Alternatives15.00%

8OPERF 2020 Asset Allocation UpdateKnowledge. Experience. Integrity.
Peer Group: Public Investment Return Assumptions
Source: NASRA, excerpted from February 2020 NASRA Issue Brief: Public Pension Plan Investment Return Assumptions
● Oregon investment return assumption of 7.20% is close to the median of a peer group of other U.S. Public Pension Plans.
9OPERF 2020 Asset Allocation UpdateKnowledge. Experience. Integrity.
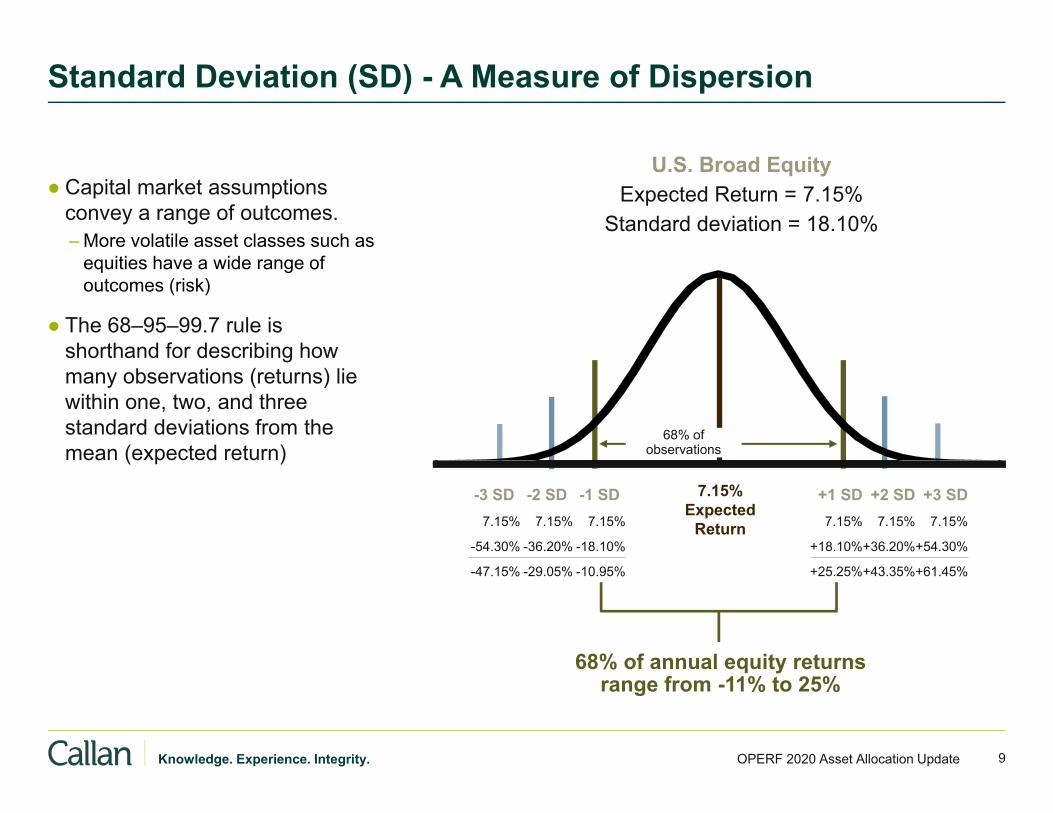
Standard Deviation (SD) - A Measure of Dispersion
● Capital market assumptions convey a range of outcomes.– More volatile asset classes such as
equities have a wide range of outcomes (risk)
● The 68–95–99.7 rule is shorthand for describing how many observations (returns) lie within one, two, and three standard deviations from the mean (expected return)
U.S. Broad EquityExpected Return = 7.15%
Standard deviation = 18.10%
68% of observations
-3 SD -2 SD -1 SD +1 SD +2 SD +3 SD7.15% 7.15% 7.15% 7.15% 7.15% 7.15%
-54.30% -36.20% -18.10% +18.10%+36.20%+54.30%
-47.15% -29.05% -10.95% +25.25%+43.35%+61.45%
7.15% Expected
Return
68% of annual equity returns range from -11% to 25%

10OPERF 2020 Asset Allocation UpdateKnowledge. Experience. Integrity.
Public Equity Private Equity US Fixed Income Real Estate Alternatives Risk Parity(10%)
0%
10%
20%
30%
Projection Period: 10 YearsRange of Projected Rates of Return
Ann
ual R
ates
of R
etur
n (%
)
10-Year (2020 – 2029) Return Projections
● Range of outcomes is wide for most asset classes – the expected return is one possible outcomeover 10 years
5th Percentile 18.42 25.25 4.78 14.03 12.29 12.5825th Percentile 11.68 15.62 3.60 9.94 9.17 8.89Expected 7.33 9.20 2.75 7.00 7.08 6.2575th Percentile 3.14 2.97 1.96 4.43 5.08 3.9695th Percentile -2.57 -5.00 0.83 0.64 2.19 0.37

11OPERF 2020 Asset Allocation UpdateKnowledge. Experience. Integrity.
Callan 2020 – 2029 CorrelationsBroad US
EquityGlobal ex-US
EquityFixed
Income Real EstatePrivate Equity
Illiquid Alternatives
Diversifying Strategies Risk Parity
Broad US Equity 1.00 0.85 -0.11 0.69 0.92 0.43 0.23 0.55
Global ex-US Equity 0.85 1.00 -0.14 0.66 0.88 0.40 0.20 0.55
Fixed Income -0.11 -0.14 1.00 -0.06 -0.23 0.02 0.15 0.45
Real Estate 0.69 0.66 -0.06 1.00 0.77 0.56 0.20 0.54
Private Equity 0.92 0.88 -0.23 0.77 1.00 0.55 0.15 0.40
Illiquid Alternatives1 0.43 0.40 0.02 0.56 0.55 1.00 0.17 0.29
Diversifying Strategies2 0.23 0.20 0.15 0.20 0.15 0.17 1.00 0.33
Risk Parity 0.55 0.55 0.45 0.54 0.40 0.29 0.33 1.001 - 42% Private Infrastructure and 58% Private Energy2 - 67% Risk Premia and 33% Trend Following
● Correlation measures the degree to which two asset classes move in relation to each other– Positive correlation – the pair of asset classes tend to move in the same direction– Negative correlation – the pair of asset classes tend to move in the opposite direction
● Correlations that are negative (red) or low positive correlation (orange) are expected to provide good diversification for the portfolio.
● Important to note that correlations are also point estimates that may not be realized.
12OPERF 2020 Asset Allocation UpdateKnowledge. Experience. Integrity.
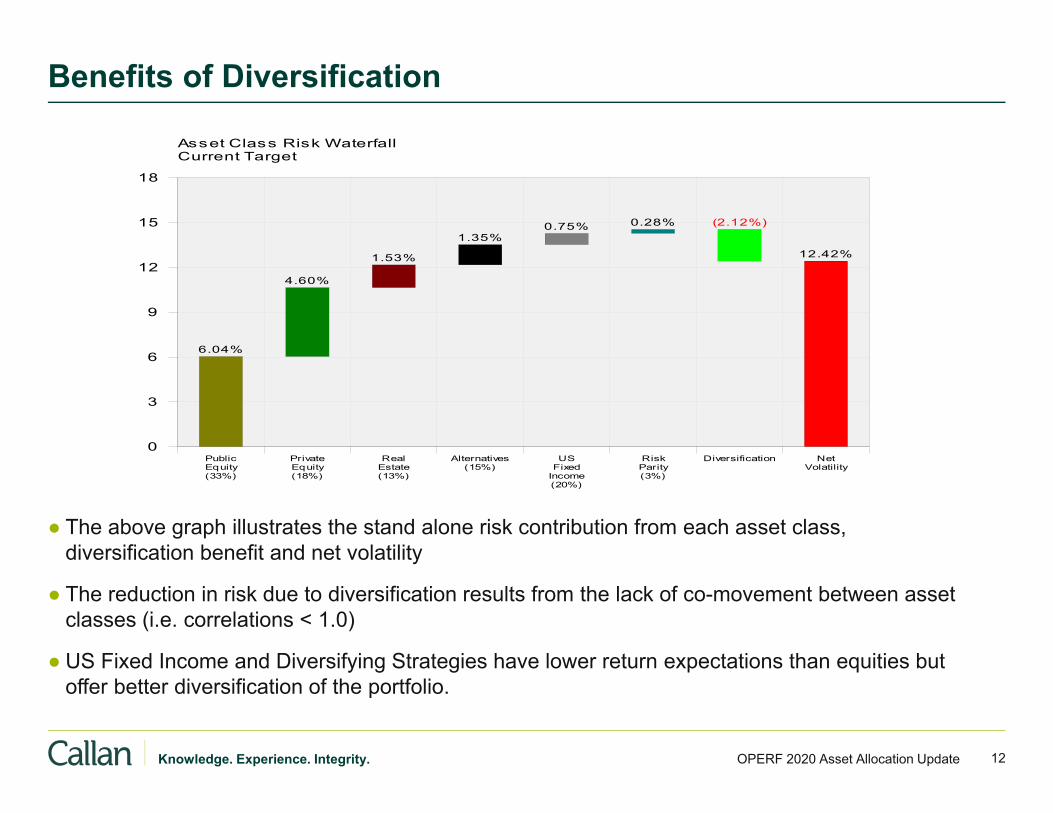
Benefits of Diversification
● The above graph illustrates the stand alone risk contribution from each asset class, diversification benefit and net volatility
● The reduction in risk due to diversification results from the lack of co-movement between asset classes (i.e. correlations < 1.0)
● US Fixed Income and Diversifying Strategies have lower return expectations than equities but offer better diversification of the portfolio.
14.1%
(33%)EquityPublic
(18%)EquityPrivate
(13%)EstateReal
(15%)Alternatives
(20%)IncomeFixedUS
(3%)ParityRisk Diversification
VolatilityNet
0
3
6
9
12
15
18
Current TargetAsset Class Risk Waterfall
6.04%
4.60%
1.53%
1.35%0.75% 0.28% (2.12%)
12.42%

13OPERF 2020 Asset Allocation UpdateKnowledge. Experience. Integrity.
Equity Beta
● The above graph illustrates the observed equity beta of the OPERF portfolio over the last 20 years. (Actual equity beta could be higher than historically observed).
● Equity risk is lower today than it was in the Global Financial Crisis (GFC).
0.00
0.10
0.20
0.30
0.40
0.50
0.60
0.706/1/20
021/1/20
038/1/20
033/1/20
0410
/1/200
45/1/20
0512
/1/200
57/1/20
062/1/20
079/1/20
074/1/20
0811
/1/200
86/1/20
091/1/20
108/1/20
103/1/20
1110
/1/201
15/1/20
1212
/1/201
27/1/20
132/1/20
149/1/20
144/1/20
1511
/1/201
56/1/20
161/1/20
178/1/20
173/1/20
1810
/1/201
85/1/20
1912
/1/201
9
Obs
erve
d Eq
uity
Bet
aRolling 20-Qtr OPERF Equity Beta to MSCI ACWI IMI
GFC

14OPERF 2020 Asset Allocation UpdateKnowledge. Experience. Integrity.
Absolute versus Relative Performance
● In 2018, OPERF had a low return = 0.48%, and ranked 9th percentile (only 9% of Funds in the Wilshire TUCS Universe* performed better).
● In 2019, OPERF had a very strong return + 13.56% but ranked 99th percentile.
● Why the dramatic difference in rankings?– OPERF does not look like the peer universe– OPERF has a higher weight to private assets than peers – real estate and private equity– In years where public equity outperforms private, OPERF’s rankings will be weaker
–E.g. 2019, Domestic Equity = +29% while Private Equity returned+11%
● 2020 Q1 is another example of divergence between publicly traded equity and private markets– Terrible market for public equities – OPERF returned -7.1% (9th percentile) versus the median return of -11.8% in Callan’s Very Large Public Fund
> $10 billion peer group.– For the year ending March 2020, OPERF gained +1.2% - ranking in the 8th percentile– For 2020 Q1, public equities underperformed private equity– Caveat: private equity and real estate returns will likely come down over the coming quarters as appraisal
valuations catch up with the market decline
* Wilshire Trust Universe Comparison Services (TUCS) public funds > $10 billion peer group, gross of fees.

Appendix

16OPERF 2020 Asset Allocation UpdateKnowledge. Experience. Integrity.
-20%
25%
-30%
-20%
-10%
0%
10%
20%
30%
1 2
One
-Yea
r Ret
urn
Year
$100 $80
$100
$-
$20
$40
$60
$80
$100
$120
Year 0 Year 1 Year 2
Portf
olio
End
ing
Valu
e
End of Year
Arithmetic vs. Geometric Return
● What is the better measure of return performance over the two year period?– If you start with $100 and end with $100 at the end of
two years your investment return is 0%!
● For purposes of conveying forward-looking return expectations to asset owners, Callan defines the “Expected Return” as a 10-year annualized (geometric) return, sometimes called compound return
Arithmetic Return = ( -20% + 25%) / 2 = 2.5%
Geometric Return = (1- 20%) * (1 + 25%) -1 = 0%
17OPERF 2020 Asset Allocation UpdateKnowledge. Experience. Integrity.
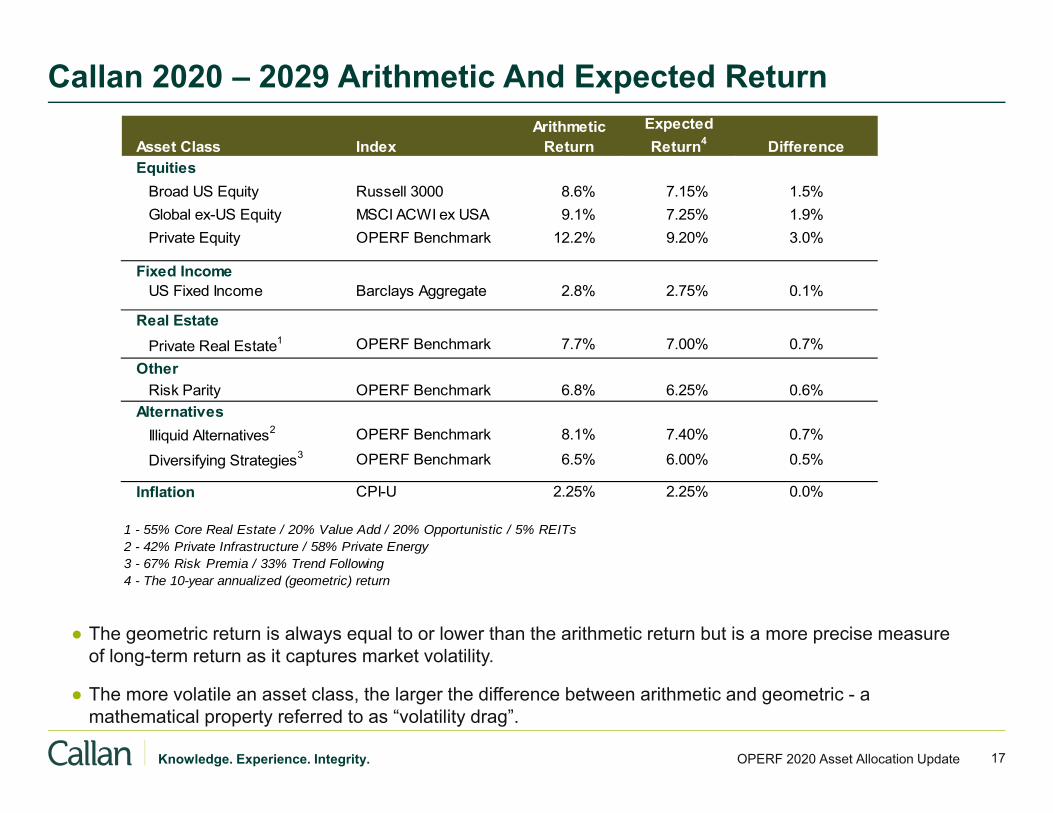
Callan 2020 – 2029 Arithmetic And Expected Return
● The geometric return is always equal to or lower than the arithmetic return but is a more precise measure of long-term return as it captures market volatility.
● The more volatile an asset class, the larger the difference between arithmetic and geometric - a mathematical property referred to as “volatility drag”.
Asset Class IndexArithmetic
ReturnExpected Return4 Difference
EquitiesBroad US Equity Russell 3000 8.6% 7.15% 1.5%Global ex-US Equity MSCI ACWI ex USA 9.1% 7.25% 1.9%Private Equity OPERF Benchmark 12.2% 9.20% 3.0%
Fixed IncomeUS Fixed Income Barclays Aggregate 2.8% 2.75% 0.1%
Real EstatePrivate Real Estate1 OPERF Benchmark 7.7% 7.00% 0.7%
OtherRisk Parity OPERF Benchmark 6.8% 6.25% 0.6%
AlternativesIlliquid Alternatives2 OPERF Benchmark 8.1% 7.40% 0.7%
Diversifying Strategies3 OPERF Benchmark 6.5% 6.00% 0.5%
Inflation CPI-U 2.25% 2.25% 0.0%
1 - 55% Core Real Estate / 20% Value Add / 20% Opportunistic / 5% REITs 2 - 42% Private Infrastructure / 58% Private Energy3 - 67% Risk Premia / 33% Trend Following4 - The 10-year annualized (geometric) return

INTRODUCTION & OVERVIEW
Summary Policy Statement This Statement of Investment Objectives and Policy Framework (the "Statement") summarizes the philosophy, objectives and policies approved by the Oregon Investment Council (the "OIC" or the "Council") for the investment of Oregon Public Employees Retirement Fund ("OPERF" or the "Fund") assets.
1. The Statement has been prepared with six audiences in mind: 1) incumbent, new and prospective Council members; 2) Oregon State Treasury ("OST") staff; 3) the Public Employees Retirement Board ("PERB"); 4) active and retired Oregon Public Employees Retirement System (PERS) members; 5) the Oregon State Legislature and Governor; and 6) agents engaged by the Council to manage and administer Fund assets.
2. The Council approved these objectives and framework after careful consideration of PERS benefit provisions, and the implications of alternative objectives and policies.
3. The Statement summarizes more detailed policy and procedure documents prepared and maintained by staff, and numerous other documents that govern the day-to-day management of OPERF assets including agent agreements, individual investment manager mandates and limited partnership documents.
4. The Council regularly assesses the continued suitability of its approved investment objectives and policies, initiates change as necessary and updates these documents accordingly.
Applicability Classified represented, management service, unclassified executive service.
Authority ORS Chapter 293.
POLICY PROVISIONS
Definitions Actuarial Discount Rate ("ADR"): The interest rate used to calculate the present value of a defined benefit plan's future obligations and determine the size of the plan sponsor's annual contribution. The ADR currently approved by the PERB is 7.2%.
Alternatives: Investments that are considered non-traditional or emerging in nature. Presently, the following investment types are included within the OPERF alternatives allocation: hedge funds; infrastructure; natural resources; and commodities.
Asset Class: A collection of securities that have conceptually similar claims on income streams and have returns that are highly correlated with each other. The most frequently referenced asset classes include equities, fixed income, real estate and cash.
Bank of America Merrill Lynch U.S. High Yield Master II Index: This index tracks the performance of publicly-issued, U.S. dollar-denominated, below investment-grade corporate debt. Its constituents are capitalization-weighted based on their current amount outstanding times the market price plus accrued interest that conform to specific parameters.
Bloomberg Barclays U.S. Aggregate Index: This index covers the U.S. investment-grade fixed rate bond market, and includes government, corporate, mortgage pass-through and asset-backed securities. These

major sectors are subdivided into more specific indices that are calculated and reported on a regular basis. Its constituents are SEC-registered, taxable, dollar-denominated securities that conform to specific parameters.
Bloomberg Barclays U.S. Treasury Index: This index is a sub-component of the Bloomberg Barclays Aggregate Index and includes public obligations of the U.S. Treasury with remaining maturities of more than one year that conform to specific parameters.
Basis Point: This refers to a common unit of financial measurement. One basis point equals 0.01%. One hundred basis points equal 1% or one percentage point.
Benchmark: A standard by which investment performance can be measured and evaluated. For example, the performance of U.S. equity managers is often measured and evaluated relative to the Russell 3000 Index. In this case, the Russell 3000 Index serves as or represents the U.S. equity benchmark.
Benchmark Exposure: The proportion that a given stock represents within a benchmark, such as the Russell 3000 Index of U.S. equity securities. Allows investors to measure the extent to which a portfolio or specific investment strategy is over- or under-exposed to a particular stock or investment characteristic (e.g., market capitalization) relative to a benchmark.
Bloomberg Barclays U.S. Aggregate Index: This index covers the U.S. investment-grade fixed rate bond market, and includes government, corporate, mortgage pass-through and asset-backed securities. These major sectors are subdivided into more specific indices that are calculated and reported on a regular basis. Its constituents are SEC-registered, taxable, dollar-denominated securities that conform to specific parameters.
Bloomberg Barclays U.S. Treasury Index: This index is a sub-component of the Bloomberg Barclays Aggregate Index and includes public obligations of the U.S. Treasury with remaining maturities of more than one year that conform to specific parameters.
Co-investment: Although used loosely to describe any two parties that invest alongside one another in the same company, this term has a special meaning in the context of an investment fund's limited partners. By having co-investment rights, a limited partner can invest directly in a company that is simultaneously backed by the fund's general partner. In this way, the limited partner has two separate stakes in the company: the first, an indirect investment through its participation in the general partner's fund; the second, a direct investment alongside the general partner. While the direct, co-investment opportunity is usually offered at terms and conditions more favorable than the fund investment, the direct, concentrated nature of the co-investment opportunity implies higher risk for the limited partner.
Core: Real estate investment strategies which exhibit "institutional" qualities, such as superior location, high occupancy and premium design and construction quality.
Credit: Used most often in a fixed income context, the measure of an organization's ability to re-pay borrowed money. Organizations with the highest credit rating (i.e., those most likely to re-pay borrowed money) are assigned a AAA credit rating.
Distressed Debt: A private equity investment strategy that involves purchasing discounted bonds of a financially-distressed firm. Distressed debt investors frequently convert their holdings into equity and become actively involved in the management of the distressed firm.
Diversifying Strategies: Investment strategies that attempt to systematically capture certain risk premia beyond traditional equity and fixed income market exposures using alternative investment techniques.
Diversification: Reducing risk without a commensurate reduction in expected return by combining assets and/or investment strategies with low or uncorrelated return and volatility profiles. For example, a decline in the price of one asset (e.g., oil stocks) is offset by an increase in the price of another asset (e.g., airline

stocks). In lay terms, this principal is often described as "putting your eggs in more than one basket".
Diversifying Strategies: Investment strategies that attempt to systematically capture certain risk premia beyond traditional equity and fixed income market exposures using alternative investment techniques.
Duration: A financial measure used by investors to estimate the price sensitivity of a fixed income security relative to changes in interest rates. For example, if interest rates increase by 1 percentage point, a 5-year duration bond will decline in price by approximately 5 percent.
Efficient Market: A market in which security prices rapidly reflect all information germane to the price discovery process. A primary implication of an efficient market is that active management efforts often fail to produce results that consistently beat the performance of an index fund or other passive strategy net of fees, transactions costs and other expenses.
Equities: Investments that represent ownership in a company and therefore a proportional share of company profits.
Fixed Income: Debt obligations that specify the precise repayment of previously borrowed money. Typically, repayment takes the form of a series of fixed-amount, semi-annual interest payments and a single, final repayment of principal.
Funded Status: A comparison of a pension plan's assets and liabilities where the latter are often referred to as the plan's projected benefit obligation ("PBO"). When a plan's assets exceed its PBO, the plan is considered overfunded. Conversely, if a plan's assets are less than its PBO, the plan is considered underfunded and the plan sponsor has a net liability position with respect to its pension plan.
Fund-of-funds: Often organized by an investment advisor or investment bank, a fund that invests in other funds rather than directly in securities, operating firms or other assets.
Growth Stock: Stocks exhibiting faster-than-average earnings growth with expectations that such growth will continue. Growth stocks usually have high price-to-earnings ratios, high price-to-book ratios and low to no dividend yields.
Hedged: A term applied to one, more or an entire portfolio of assets indicating that the base country value of such assets is partially or wholly protected from foreign currency fluctuations. Forward currency contracts are typically used to hedge or offset the effects of these fluctuations.
Index Fund: A portfolio management strategy that seeks to match the composition and performance of a select index such as the Russell 3000 or S&P 500.
Leverage Buyout (LBO): A strategy in which debt financing is use to acquire a firm or business unit, typically in a mature industry. LBO debt is usually repaid according to a strict schedule that absorbs most of the acquired firm's cash flow.
Liability: A claim on assets by individuals or companies. In a pension context, liabilities represent the claim on fund assets by active and retired plan beneficiaries.
MSCI All Country World Investable Market Index (ACWI-IMI): A capitalization-weighted index that includes approximately 9,000 publicallypublicly-traded equity securities and is designed to measure equity market performance across developed and emerging markets. This index consists of over 40 separate developed and emerging market country indices.
MSCI World Ex-U.S. Index: A subset of the MSCI All Country World Index that contains only securities from developed market countries, excluding those from the U.S.
Market Capitalization: The value of a corporation as determined by multiplying the price of its shares by

the number of shares outstanding. In general, the share prices of smaller capitalized companies are more volatile than those of larger capitalized companies.
Mezzanine: Either a private equity financing undertaken shortly before an initial public offering, or an investment strategy that employs subordinated debt (which has fewer privileges than bank debt but more standing than equity) and often is issued with attached equity warrants.
NCREIF Fund Index – Open End Diversified Core Equity (NFI-ODCE): The NFI-ODCE is an investment performance composite published quarterly by the National Council of Real Estate Investment Fiduciaries (NCREIF). This index is a capitalization-weighted index of approximately 30 open-ended, commingled funds pursuing a "core" investment strategy and conform to specific parameters.
Oregon State Treasury: Headed by the State Treasurer, the Oregon State Treasury is responsible for managing the day to day investment operations of the state pension fund (and other funds), issuing all state debt, and serving as the central bank for state agencies. Within the Oregon State Treasury, the Investment Division also manages investment programs for the state's deferred compensation and college savings plans, and serves as staff to the Oregon Investment Council.
Opportunistic: Higher risk but higher expected return real estate investments that are usually illiquid, produce little or no current income and are often focused on distressed and/or highly leveraged properties.
Opportunity Portfolio: Includes non-traditional and/or concentrated investment strategies that may provide enhanced diversification and/or unique sources of return relative to the other asset classes included in the OIC's approved policy mix. The Opportunity Portfolio's objectives are pursued by investing in strategies that fall outside the boundaries of "strategic" or approved policy mix allocations including new or innovative strategies across a wide range of potential investment opportunities and with few limitations or constraints.
Oregon Investment Council: Oregon Revised Statutes ("ORS") 293.706 establishes the OIC, which consists of five voting members, four of whom are appointed by the Governor and subject to Senate confirmation (the Treasurer serves as an ex-officio member, and is therefore not subject to confirmation). The members appointed by the Governor must be qualified by training and experience in the field of investment or finance. In addition, the Director of the Oregon Public Employees Retirement System is a non-voting ex-officio member of the OIC. ORS 293.721 and 293.726 establish the OIC's investment objectives and standards of judgment and care. .
Oregon Public Employees Retirement Fund: Holds the assets of beneficiaries of PERS, which is a state-wide, defined benefit retirement plan for units of state government, political subdivisions, community colleges and school districts. PERS is administered under ORS chapters 237, 238, 238A, and applicable provisions of the Internal Revenue Code by the PERB. Participation by state government units, school districts, and community colleges is mandatory. Participation by most political subdivisions is optional, but irrevocable if elected. All system assets accumulated for the payment of benefits may legally be used to pay benefits to any of the plan members or beneficiaries of the system. PERS is responsible for administrating the management of the plan's liability and participant benefits.
Oregon Short Term Fund (OSTF): The state's commingled cash investment pool managed internally by Treasury staff. The OSTF includes all excess state agency cash, as required by law, as well as cash invested by local governments on a discretionary basis. The OSTF is invested in accordance with investment guidelines recommended by the state's Oregon Short Term Fund Board and approved by the OIC.
Overlay Manager: An investment advisor retained by the OIC to monitor daily cash balances in OPERF and execute trades in the equity and fixed income futures markets to adjust OPERF's overall asset allocation closer to its OIC-approved targets.
Overweight: A stock, sector or capitalization exposure that is higher than the corresponding exposure in a

given asset class benchmark, such as the Russell 3000 Index.
Private Equity: Venture Economics ("VE") uses the term to describe the universe of all venture investing, buyout investing and mezzanine investing. Fund-of-funds investing and secondaries are also included in this term's broadest interpretation. VE is not using the term to include angel investors or business angels, real estate investments or other investing scenarios outside of the public market. See also Alternatives.
Real Estate Investments: Investments in land, buildings or other real property.
Real Estate Investment Trusts ("REITs"): A real estate portfolio managed by an investment company for the benefit of the trust unit holders. The units of most REITs are publicallypublicly traded.
Regular Account: That portion of OPERF that excludes the Variable Account (defined below). A diversified investment portfolio for which the asset allocation and general investment policies are established and approved by the OIC. Tier One participants are guaranteed a minimum rate of return based on the long-term interest rate used by the actuary. Tier Two participants have no guaranteed rate of return and receive benefits that reflect the Regular Account's actual or realized investment return.
Return: The gain or loss in value of an investment over a given period of time expressed as a percentage of the original amount invested. For example, an initial investment of $100 that grows to $105 over one year has produced a 5% return.
Risk: The probability of losing money or not achieving the expected investment outcome.
Russell 3000 Index: Measures the investment performance of a composite comprised of stocks issued by the approximately 3,000 largest U.S. companies. Based on total market capitalization, this index represents approximately 98% of the investable U.S. equity market.
S&P/LSTA Leveraged Loan Index: This index is designed to mirror the market-weighted performance of the largest institutional leveraged loan portfolios based on market weightings, spreads and interest payments. Facilities are eligible for inclusion in the index if they are senior secured institutional term loans with a minimum initial spread of 125 basis points and minimum one-year term. Facilities are retired from the index when there is no bid posted on the facility for at least 12 successive weeks or when the loan is repaid.
S&P Risk Parity Index – 12% Target Volatility: An index designed to proxy the performance of a generic risk parity strategy using public equity, fixed income, and commodity exchange-traded futures, levered to target a 12% return volatility. Because there is no widely-accepted approach to risk parity, this index is not representative of the “market” but can still serve as a benchmark.
Secondaries: The purchase and sale of existing limited partnership commitments to other limited partners and/or fund sponsors.
Sector: A particular group of stocks or bonds that usually characterize a given industry or economic activity. For example, "pharmaceuticals" is the name given to stocks issued by companies researching, manufacturing and selling over-the-counter and prescription medicines. "Corporates" is the name given to fixed income instruments issued by private and public companies.
Sector Funds: A pooled investment product that focuses on a particular industry or economic activity. For example, pooled funds that invest principally in technology stocks would be termed a technology sector fund.
Tracking Error: The amount by which an investor's investment performance differed from a corresponding or assigned benchmark. Usually measured and expressed as the standard deviation of returns relative to a pre-specified benchmark.

Unhedged: A term indicating that the value of one, more or an entire portfolio of assets may be affected by foreign currency fluctuations and that no deliberate attempt has been made to protect against such fluctuations.
Value Added: As used in real estate, may include office, retail, industrial and apartment properties, but may target structured investments in alternative property types such as hotels, student housing, senior housing and specialized retail uses. Portfolios or strategies that are positioned as Value Added are expected to produce returns between Core and Opportunistic portfolios/strategies. For example, a Value Added property may exhibit some "institutional" qualities such as good location and high design and construction quality, but may need significant leasing improvements to stabilized and enhance its value. Value Added investments may also include development opportunities with balanced risk/return profiles.
Value Stock: Stocks that appear to be undervalued for reasons other than low potential earnings growth. Value stocks usually have low price-to-earnings ratios, low price-to-book ratios and a high dividend yield.
Variable Account: An account established for a PERS member who participated in the VAP (defined below).
Variable Annuity Program ("VAP"): a program that allowed active PERS members to allocate a portion of their yearly, employee retirement contributions to a domestic equity portfolio. No such contributions were allowed after December 31, 2003. Active members who participated in the VAP had part of their balance invested in the Regular Account and part invested in the Variable Account. Unless a member explicitly elected to participate in the VAP, all of that member's employee contributions were invested in the Regular Account. This "primary" election allowed members to place 25 percent, 50 percent or 75 percent of their employee contributions in the Variable Account. Variable Account balances increase or decrease depending on the investment performance of the variable fund, and individual participant accounts are credited for any amount (gain or loss) available for distribution. The OIC's asset allocation policy purview only applies to the Regular Account since the OIC cannot control the investment option elections of VAP participants.
Venture Capital: Independently managed, dedicated pools of capital that focus on equity or equity-linked investments in privately held, high growth companies. Outside of the United States, the term venture capital is used as a synonym for all types of alternative or private equity.
Vintage Year: The calendar year in which an investment fund's first closing occurs. For example, the 1995 vintage year for venture capital includes all venture capital funds that held a first closing in 1995.
POLICY STATEMENTS
Introduction 1. Subject to ORS 293.721 and 293.726, the Council believes, based on the assumptions outlined
herein, that the investment policies summarized in this document will provide the highest possible return at a level of risk that is appropriate for active and retired OPERF members. The Council evaluates risk in terms of both short-term asset price volatility and long-term plan viability.
2. This objective further contemplates a consecutive ten-year forecast horizon, and the Council also understands that estimates of forward-looking OPERF returns are a primary consideration during PERB's biennial determination of its ADR.
3. Historically, PERS members were allowed to direct up to 75% of their annual, employee retirement contributions to the Variable Account. While no longer receiving new contributions, the Variable Account's objective remains investment performance consistent with the MSCI All Country World Investable Market Index.
4. The Council has established investment objectives for individual asset classes that are also summarized in this Statement.

Policy Asset Mix, Diversification, and Return Expectations 1. The OIC undertakes a rigorous study of OPERF's assets and liabilities every three to five years (or
more frequently, if desired). These asset-liability studies include the following elements for OIC consideration: 1) capital market assumptions by asset class, which include expected returns, volatilities and correlations; 2) proposed asset mixes using various portfolio modeling/construction techniques; 3) OPERF's liability structure, funded status and liquidity needs; and 4) recommended strategic asset allocation targets and a rebalancing framework. The Council's approved asset mix policy for the Regular Account is summarized in Exhibit 1., and its active management return expectations are summarized in Exhibit 2.
2. Of total Fund assets, 55 50 percent of OPERF is targeted for investment in equities, inclusive of private equity. Equity investments have generated the highest returns over long time periods, but can also produce low and even negative returns over shorter time periods. The risk of low returns over shorter time periods makes 100% equity policies unsuitable for most pension funds, including OPERF. By investing across multiple equity asset classes, and in lower return but less risky fixed income, real estate and alternatives asset classes, the Council manages and diversifies the Fund's overall risk.
3. Specific asset class exposures are maintained within the ranges outlined in Exhibit 1. Exhibit 1: Policy Mix and Return Expectations for the OPERF Regular Account
Asset Class Target Allocation (%)
Re-balancing Range (0%)
Expected Annual Policy Return1 (%)
Public Equity
32.5 27.5-37.5 7.3
Private Equity
17.5 14.0-21.0 9.2
Total Equity
50.0 45.0-55.0
Fixed Income
20.0 15.0-25.0 3.82.8
Risk Parity 2.5 0.0-2.5 6.53
Real Estate 12.5 9.5-15.5 7.0
Alternatives 15.0 7.5-17.5 6.97.0
Total Fund2
100.0 7.31
1. Based on capital market forecasts developed by the Council's investment consultant, Callan
IncLLC. 2. Total Fund expected returns are calculated geometrically using the investment consultant's
forecasts for the arithmetic returns and co-variances of the asset classes. Accordingly, the Total Fund's expected returns are not equivalent to the weighted average of individual asset class returns listed in Exhibit 1.

4. The policy mix's 7.31% average annual return expectation was developed with reference to observed long-term relationships among major asset classes, adjusted to account for current market conditions. The Council believes this return expectation is reasonable, but recognizes that realized returns can deviate significantly from expectations – both positively and negatively.
5. The OIC has allocated up to 35.0% of total Fund assets for investment in an Opportunity Portfolio, the objective of which is to enhance OPERF returns and/or diversification. Investments in the Opportunity Portfolio are expected to comprise a combination of both shorter-term (1-3 year) and longer-term holdings. The Opportunity Portfolio has no strategic target since, by definition, eligible investments are only pursued on an opportunistic or episodic basis; moreover, the Opportunity Portfolio allocation shall not result in an allocation range breach for any of the other five, primary asset class allocations.
6. OPERF cash balances are invested in the Oregon Short Term Fund and managed to levels that are deliberately minimized but still sufficient to cover OPERF's short-term cash flow needs.
7. In an effort to minimize cash balances at both the Fund and manager level, the OIC has retained an overlay manager to more closely align the actual Fund portfolio with the approved policy mix, generally through the purchase and sale of futures contracts to increase or decrease specific asset class exposures, as necessary.
8. The Council shall review, at least biennially, its expectations for asset class and active management performance, and assess how the updated expectations affect the probability that the Regular Account will achieve its investment objective.
Rebalancing 1. In the absence of any other considerations, the optimal rebalancing strategy would suggest
continually rebalancing back to OPERF's strategic asset allocation targets. Rebalancing ensures that the return objectives and risk tolerance parameters approved by the OIC are consistently and effectively reflected in the Fund. However, rebalancing involves transactions costs such as brokerage fees and market impact. As a result of these costs, ranges are established around the strategic asset allocation targets in order to balance the desirability of achieving precise target allocations with the various and often material transactions costs associated with these same rebalancing activities. In addition, the overlay manager is expected to minimize cash exposures at both the Fund and individual manager level.
2. With OIC oversight, OST staff implements the approved rebalancing framework, although the illiquid nature of many private market assets may exempt those assets from staff's short-term rebalancing activities. Rebalancing should be implemented by the most cost-effective means available. For example, cash flows into and out of OPERF will first be used to rebalance back toward asset class targets, whenever possible.
3. A breach of any of the established asset allocation ranges triggers a review and possible rebalancing back to established targets with due consideration given to the liquidity of the affected investments, all anticipated transaction costs and the current portfolio structure within each asset class.
Passive and Active Management 1. Passive management uses lower cost index funds to access the return streams available from the
world's capital markets. Active management tries to earn higher returns than those available from index funds through the application of manager skill in the form of sector and security selection as well as market and/or asset mix timing decisions.
2. The Council uses passive management to control costs, evaluate active management strategies, capture exposure to efficient market segments, manage tracking error and facilitate policy mix re-balancing activities.
3. The Council approves active management of Fund assets when proposed active strategies offer sufficiently high expected incremental returns, net of fees, and when the magnitude of potential under-performance can be estimated, monitored and managed.
4. Public equity and fixed income asset classes are managed using both passive and active management strategies. Active management of the Fund's public market equity and fixed income

allocations is expected to earn annual return premiums of 0.50% and 0.2515%, respectively, over rolling, consecutive five-year periods (and relative to those allocation's respective benchmarks). The Council recognizes that unsuccessful active management can reduce total Fund returns.
5. The Council must accept active management in those asset classes for which there are no passive management alternatives; in particular, private real estate, private equity and other alternative and opportunistic investment strategies.
6. At the aggregate, Regular Account level, and as outlined in Exhibit 2, active management strategies authorized by the Council are expected to add 0.3% of annualized excess return, net of fees, over rolling, consecutive five-year periods. \
7.6. Exhibit 2: Active Return Expectations for the OPERF Regular Account by Asset Class
Asset Class
Target Allocation (%)
Target Active Return (%)
Target Active Contribution (%)
Public Equity
32.5 0.50 0.19
Fixed Income
20.0 0.25 0.05
Real Estate
12.5 0.50 0.06
Total Fund
0.28
Public Equity Strategy 1. OPERF's public equity allocation is managed with the objective of earning at least 50 basis points
in annualized net excess return relative to the MSCI All Country World Investable Market Index (ACWI IMI – net) (unhedged) over rolling, consecutive five-year periods. Relative to that same benchmark, active risk shall be managed to a 0.75 to 2.0 percent annualized tracking error target.
2. Key elements of the strategy include the following: a. In an effort to enhance return, strategy will include maintaining an over-weight to small
capitalization stocks and other well supported sources of return premia. These strategic overweights or "tilts" are based on and supported by robust empirical research that historically links persistent and pervasive evidence of excess returns to systematic "factor exposures" such as size (i.e., small cap), value and momentum. Implementation of other factor tilts may be considered at the manager, strategy or mandate level upon approval of both the Chief Investment Officer (CIO) and OIC.
b. Multiple, specialist active managers with complementary investment styles are employed. For example, some OPERF managers focus on growth stocks, some on value stocks, some on large capitalization stocks and others on small capitalization stocks. This diversified approach produces more excess return opportunities and minimizes the Fund's exposure to any single investment organization.
c. Aggregate exposures to countries, economic sectors, investment styles and market capitalization tiers are monitored and managed relative to corresponding benchmark exposures.
Fixed Income Strategy 1. OPERF's fixed income allocation is managed with the objective of earning 25 15 basis points in

annualized, net excess returns relative to the a blended benchmark comprised of 46% Bloomberg Barclays U.S. Aggregate Index, 37% Bloomberg Barclays U.S. Treasury Index, 13% S&P/LSTA Leveraged Loan Index and 4% Bank of America Merrill Lynch High Yield Master II Index over rolling, consecutive five-year periods. Relative to the above-describedthat same benchmark, active risk within the OPERF fixed income allocation is managed to a 0.5 up to 1.0 percent annualized tracking error target.
2. Key elements of the strategy include the following: a. A significant proportion of the OPERF fixed income allocation is actively managed due to
performance and cost considerations. Specifically, excess returns from active fixed income management are likely as many investors hold fixed income securities to meet regulatory and liability matching objectives, and hence are not total return oriented. This market dynamic produces systematic opportunities in fixed income securities that skilled investment managers can exploit. Active fixed income management fees are also much lower than active equity management fees.
b. Aggregate exposures to duration, credit and sectors are monitored and managed relative to corresponding exposures in the fixed income allocation benchmark.
Risk Parity Strategy 1. OPERF's risk parity allocation will be managed with the objective of earning a net total return
comparable to an equal risk weighting of traditional asset class indices such as Bloomberg Barclays U.S. Treasury Index and the MSCI ACWI IMI, using the S&P Risk Parity Index – 12% Target Volatility as the policy benchmark over rolling, consecutive five-year periods.
2. Key elements of the strategy include the following: a. Risk Parity is 100% actively managed because there is no widely-accepted definition of a
passive implementation of risk parity. a.b. Risk parity strategies provide long-only levered exposures to major publicly-
traded asset classes, such as public equity, fixed income (sometimes separating credit from interest rate), and commodities. Since risk parity strategies typically balance asset class exposures by risk versus nominal exposures, they are levered to target some return objective comparable to a generic balanced portfolio. Because each asset class in a risk parity portfolio delivers approximately the same level of risk, as opposed to equity providing the vast majority of the risk in a generic balanced portfolio, the expectation is a risk parity portfolio would deliver a higher risk-adjusted return over a full market cycle.
Real Estate Strategy 1. OPERF's real estate allocation is managed with the objective of earning at least 50 basis points in
annualized, net excess returns relative to the NCREIF Fund Index – Open End Diversified Core Equity (NFI-ODCE), net of management fees, over rolling, consecutive five-year periods.
2. Key elements of the strategy include the following: a. Real Estate is 100% actively managed because a passive replication of the full breadth and
depth of the real estate asset class is not viable. b. Core property investments represent 55% of the Fund's real estate allocation, with a range
of 45% to 65%. Risk is diversified by investing across the following major property types: office; apartments; retail; and industrial. The OPERF real estate allocation may also include structured investments in alternative property types with Core-like risk and return attributes.
c. Exchange-traded real estate investment trusts (REITs) represent 5% of the Fund's real estate allocation, with a range of 0% to 10%. Up to 50% of the REIT exposure may be invested in markets outside the United States.
d. Value Added property investments represent 20% of the OPERF real estate allocation, with a range of 10% to 30%, and may include direct investments in each of the property types listed above, as well as structured investments in alternative property types. Risk is diversified by property type and geography.
e. Opportunistic property investments represent 20% of the OPERF real estate allocation, with a range of 10% to 30%. Relative to Core and Value Added strategies, real estate

investments will be characterized as "opportunistic" based on higher risk/return expectations and other prevailing market conditions.
f. Within its real estate allocation, the Fund may participate in co-investment opportunities.
Private Equity Strategy 1. OPERF's private equity allocation is managed with the objective of earning at least 300 basis
points in annualized, net excess returns relative to the Russell 3000 Index over very long time horizons, typically rolling, consecutive 10-year periods.
2. Key elements of the strategy include the following: a. Private Equity is 100% actively managed because private equity index funds are not
available. b. Risk within OPERF's private equity allocation is diversified by investing across different
fund types and strategies including venture capital, leverage buyout, mezzanine debt, distressed debt, sector funds, secondaries and fund-of-funds.
c. OPERF's private equity allocation is further diversified by investing across vintage year, industry sectors, investment size, development stage and geography.
d. OPERF's private equity investments are managed by external managers operating as general partners. Considerations for private equity manager selection include access to transactions (i.e., "deal flow"), specialized areas of operating expertise, established or promising net of fees performance track records, unique or differentiated investment methodologies and transparent/verifiable reporting processes.
e. Within its private equity allocation, the Fund may participate in co-investment opportunities.
Alternatives Strategy 1. OPERF's allocation to Alternatives is managed with the objective of earning at least 400 basis
points in annualized, net excess returns relative to CPI over rolling, consecutive ten-year periods. 2. Key elements of the strategy include the following:
a. Alternatives are 100% actively managed because index funds replicating the broad alternatives market are not available.
b. Infrastructure investments represent 20% of the Fund's alternatives allocation, with a range of 15% to 25%. Risk is diversified by investment type, size and geography. Specific infrastructure sector exposures will likely include energy, transportation, ports and water in both domestic and international markets and comprising both mid-size and large capitalization enterprises.
c. Natural Resource investments represent 30% of the Fund's alternatives allocation, with a range of 25% to 35%. Risk is diversified by investing across multiple industry sectors including oil and gas, agriculture, timberland, mining and commodities.
d. Diversifying Strategies represent 50% of the Fund's alternatives allocation, with a range of 45% to 55%. Diversifying Strategies investments may include relative value, macro, arbitrage and long/short equity strategies. The objective of this sleeve is to invest in strategies with returns uncorrelated with those of the broader Fund. Risk is diversified by investing in multiple managers and across several strategies.
e. Other investments may represent 5% of the Fund's alternatives allocation, with a range of 0% to 10%. Investment strategies will be characterized as "other" based on prevailing market conditions as well as a specific strategy's unique "value proposition" or investment thesis.
f. Within its alternatives allocation, the Fund may also participate in co-investment opportunities.
Performance Monitoring and Evaluation 1. The Council and OST staff use a variety of verification and performance measurement tools to
monitor, measure and evaluate the management of OPERF assets. Monitoring, reporting and evaluation frequencies range from daily to annually, although quarterly is the most commonly

used reporting frequency. 2. The Council directs staff to develop a performance monitoring and evaluation system that
validates whether the assets are prudently managed. More specifically, whether Fund investment performance improved benefit security, and capital market risk in general and active management in particular have been sufficiently rewarded.
3. One of many reports used by the Council to satisfy the above requirements is a simple comparison of Regular Account investment performance relative to the Council's assigned total Fund benchmark over rolling, consecutive multi-year periods. Other reports help the Council assess whether or not the Fund was rewarded for its allocations to higher return, higher risk equity investments and whether or not the active management strategies utilized added or subtracted from policy returns on a net of fees basis.
4. The reporting described in this section gives the Council a consolidated or "big picture" view of Regular Account investment performance. Regular Account investment performance across primary asset allocation categories will also be reported to the OIC. Upon request and if available, staff will also provide the Council more granular performance reporting, e.g., at the individual manager level.
5. The OST Compliance program will a) monitor and evaluate portfolios and asset classes and determine compliance with OST policies and contractual obligations; b) identify instances of non-compliance and develop and execute appropriate resolution strategies; c) provide relevant compliance information and reports to OST management and the Fund, as appropriate; and d) when applicable, verify resolution by the appropriate individual or manager within the appropriate time frame.
Exceptions None.
Failure to Comply Failure to comply with this policy may be cause for disciplinary action up to and including dismissal.
PROCEDURES and FORMS None.
ADMINISTRATION
Review Annually.
Feedback Your comments are extremely important to improving the effectiveness of this policy. If you would like to comment on the provisions of this policy, you may do so by e-mailing the Policy Analyst. To ensure your comments are received without delay, please list the policy number and name in your e-mail's subject. Your comments will be reviewed during the policy revisions process and may result in changes to the policy.

INTRODUCTION & OVERVIEW Summary Policy Statement This Statement of Investment Objectives and Policy Framework (the "Statement") summarizes the philosophy, objectives and policies approved by the Oregon Investment Council (the "OIC" or the "Council") for the investment of Oregon Public Employees Retirement Fund ("OPERF" or the "Fund") assets.
1. The Statement has been prepared with six audiences in mind: 1) incumbent, new and prospective Council members; 2) Oregon State Treasury ("OST") staff; 3) the Public Employees Retirement Board ("PERB"); 4) active and retired Oregon Public Employees Retirement System (PERS) members; 5) the Oregon State Legislature and Governor; and 6) agents engaged by the Council to manage and administer Fund assets.
2. The Council approved these objectives and framework after careful consideration of PERS benefit provisions, and the implications of alternative objectives and policies.
3. The Statement summarizes more detailed policy and procedure documents prepared and maintained by staff, and numerous other documents that govern the day-to-day management of OPERF assets including agent agreements, individual investment manager mandates and limited partnership documents.
4. The Council regularly assesses the continued suitability of its approved investment objectives and policies, initiates change as necessary and updates these documents accordingly.
Applicability Classified represented, management service, unclassified executive service.
Authority ORS Chapter 293.
POLICY PROVISIONS Definitions Actuarial Discount Rate ("ADR"): The interest rate used to calculate the present value of a defined benefit plan's future obligations and determine the size of the plan sponsor's annual contribution. The ADR currently approved by the PERB is 7.2%.
Alternatives: Investments that are considered non-traditional or emerging in nature. Presently, the following investment types are included within the OPERF alternatives allocation: hedge funds; infrastructure; natural resources; and commodities.
Asset Class: A collection of securities that have conceptually similar claims on income streams and have returns that are highly correlated with each other. The most frequently referenced asset classes include equities, fixed income, real estate and cash.
Basis Point: This refers to a common unit of financial measurement. One basis point equals 0.01%. One hundred basis points equal 1% or one percentage point.
Benchmark: A standard by which investment performance can be measured and evaluated. For example, the performance of U.S. equity managers is often measured and evaluated relative to the Russell 3000 Index. In this case, the Russell 3000 Index serves as or represents the U.S. equity benchmark.

Benchmark Exposure: The proportion that a given stock represents within a benchmark, such as the Russell 3000 Index of U.S. equity securities. Allows investors to measure the extent to which a portfolio or specific investment strategy is over- or under-exposed to a particular stock or investment characteristic (e.g., market capitalization) relative to a benchmark.
Bloomberg Barclays U.S. Aggregate Index: This index covers the U.S. investment-grade fixed rate bond market, and includes government, corporate, mortgage pass-through and asset-backed securities. These major sectors are subdivided into more specific indices that are calculated and reported on a regular basis. Its constituents are SEC-registered, taxable, dollar-denominated securities that conform to specific parameters.
Bloomberg Barclays U.S. Treasury Index: This index is a sub-component of the Bloomberg Barclays Aggregate Index and includes public obligations of the U.S. Treasury with remaining maturities of more than one year that conform to specific parameters.
Co-investment: Although used loosely to describe any two parties that invest alongside one another in the same company, this term has a special meaning in the context of an investment fund's limited partners. By having co-investment rights, a limited partner can invest directly in a company that is simultaneously backed by the fund's general partner. In this way, the limited partner has two separate stakes in the company: the first, an indirect investment through its participation in the general partner's fund; the second, a direct investment alongside the general partner. While the direct, co-investment opportunity is usually offered at terms and conditions more favorable than the fund investment, the direct, concentrated nature of the co-investment opportunity implies higher risk for the limited partner.
Core: Real estate investment strategies which exhibit "institutional" qualities, such as superior location, high occupancy and premium design and construction quality.
Credit: Used most often in a fixed income context, the measure of an organization's ability to re-pay borrowed money. Organizations with the highest credit rating (i.e., those most likely to re-pay borrowed money) are assigned a AAA credit rating.
Distressed Debt: A private equity investment strategy that involves purchasing discounted bonds of a financially-distressed firm. Distressed debt investors frequently convert their holdings into equity and become actively involved in the management of the distressed firm.
Diversification: Reducing risk without a commensurate reduction in expected return by combining assets and/or investment strategies with low or uncorrelated return and volatility profiles. For example, a decline in the price of one asset (e.g., oil stocks) is offset by an increase in the price of another asset (e.g., airline stocks). In lay terms, this principal is often described as "putting your eggs in more than one basket".
Diversifying Strategies: Investment strategies that attempt to systematically capture certain risk premia beyond traditional equity and fixed income market exposures using alternative investment techniques.
Duration: A financial measure used by investors to estimate the price sensitivity of a fixed income security relative to changes in interest rates. For example, if interest rates increase by 1 percentage point, a 5-year duration bond will decline in price by approximately 5 percent.
Efficient Market: A market in which security prices rapidly reflect all information germane to the price discovery process. A primary implication of an efficient market is that active management efforts often fail to produce results that consistently beat the performance of an index fund or other passive strategy net of fees, transactions costs and other expenses.
Equities: Investments that represent ownership in a company and therefore a proportional share of company profits.
Fixed Income: Debt obligations that specify the precise repayment of previously borrowed money.

Typically, repayment takes the form of a series of fixed-amount, semi-annual interest payments and a single, final repayment of principal.
Funded Status: A comparison of a pension plan's assets and liabilities where the latter are often referred to as the plan's projected benefit obligation ("PBO"). When a plan's assets exceed its PBO, the plan is considered overfunded. Conversely, if a plan's assets are less than its PBO, the plan is considered underfunded and the plan sponsor has a net liability position with respect to its pension plan.
Fund-of-funds: Often organized by an investment advisor or investment bank, a fund that invests in other funds rather than directly in securities, operating firms or other assets.
Growth Stock: Stocks exhibiting faster-than-average earnings growth with expectations that such growth will continue. Growth stocks usually have high price-to-earnings ratios, high price-to-book ratios and low to no dividend yields.
Hedged: A term applied to one, more or an entire portfolio of assets indicating that the base country value of such assets is partially or wholly protected from foreign currency fluctuations. Forward currency contracts are typically used to hedge or offset the effects of these fluctuations.
Index Fund: A portfolio management strategy that seeks to match the composition and performance of a select index such as the Russell 3000 or S&P 500.
Leverage Buyout (LBO): A strategy in which debt financing is use to acquire a firm or business unit, typically in a mature industry. LBO debt is usually repaid according to a strict schedule that absorbs most of the acquired firm's cash flow.
Liability: A claim on assets by individuals or companies. In a pension context, liabilities represent the claim on fund assets by active and retired plan beneficiaries.
MSCI All Country World Investable Market Index (ACWI-IMI): A capitalization-weighted index that includes approximately 9,000 publicly-traded equity securities and is designed to measure equity market performance across developed and emerging markets. This index consists of over 40 separate developed and emerging market country indices.
MSCI World Ex-U.S. Index: A subset of the MSCI All Country World Index that contains only securities from developed market countries, excluding those from the U.S.
Market Capitalization: The value of a corporation as determined by multiplying the price of its shares by the number of shares outstanding. In general, the share prices of smaller capitalized companies are more volatile than those of larger capitalized companies.
Mezzanine: Either a private equity financing undertaken shortly before an initial public offering, or an investment strategy that employs subordinated debt (which has fewer privileges than bank debt but more standing than equity) and often is issued with attached equity warrants.
NCREIF Fund Index – Open End Diversified Core Equity (NFI-ODCE): The NFI-ODCE is an investment performance composite published quarterly by the National Council of Real Estate Investment Fiduciaries (NCREIF). This index is a capitalization-weighted index of approximately 30 open-ended, commingled funds pursuing a "core" investment strategy and conform to specific parameters.
Oregon State Treasury: Headed by the State Treasurer, the Oregon State Treasury is responsible for managing the day to day investment operations of the state pension fund (and other funds), issuing all state debt, and serving as the central bank for state agencies. Within the Oregon State Treasury, the Investment Division also manages investment programs for the state's deferred compensation and college savings plans, and serves as staff to the Oregon Investment Council.

Opportunistic: Higher risk but higher expected return real estate investments that are usually illiquid, produce little or no current income and are often focused on distressed and/or highly leveraged properties.
Opportunity Portfolio: Includes non-traditional and/or concentrated investment strategies that may provide enhanced diversification and/or unique sources of return relative to the other asset classes included in the OIC's approved policy mix. The Opportunity Portfolio's objectives are pursued by investing in strategies that fall outside the boundaries of "strategic" or approved policy mix allocations including new or innovative strategies across a wide range of potential investment opportunities and with few limitations or constraints.
Oregon Investment Council: Oregon Revised Statutes ("ORS") 293.706 establishes the OIC, which consists of five voting members, four of whom are appointed by the Governor and subject to Senate confirmation (the Treasurer serves as an ex-officio member, and is therefore not subject to confirmation). The members appointed by the Governor must be qualified by training and experience in the field of investment or finance. In addition, the Director of the Oregon Public Employees Retirement System is a non-voting ex-officio member of the OIC. ORS 293.721 and 293.726 establish the OIC's investment objectives and standards of judgment and care.
Oregon Public Employees Retirement Fund: Holds the assets of beneficiaries of PERS, which is a state-wide, defined benefit retirement plan for units of state government, political subdivisions, community colleges and school districts. PERS is administered under ORS chapters 237, 238, 238A, and applicable provisions of the Internal Revenue Code by the PERB. Participation by state government units, school districts, and community colleges is mandatory. Participation by most political subdivisions is optional, but irrevocable if elected. All system assets accumulated for the payment of benefits may legally be used to pay benefits to any of the plan members or beneficiaries of the system. PERS is responsible for administrating the management of the plan's liability and participant benefits.
Oregon Short Term Fund (OSTF): The state's commingled cash investment pool managed internally by Treasury staff. The OSTF includes all excess state agency cash, as required by law, as well as cash invested by local governments on a discretionary basis. The OSTF is invested in accordance with investment guidelines recommended by the state's Oregon Short Term Fund Board and approved by the OIC.
Overlay Manager: An investment advisor retained by the OIC to monitor daily cash balances in OPERF and execute trades in the equity and fixed income futures markets to adjust OPERF's overall asset allocation closer to its OIC-approved targets.
Overweight: A stock, sector or capitalization exposure that is higher than the corresponding exposure in a given asset class benchmark, such as the Russell 3000 Index.
Private Equity: Venture Economics ("VE") uses the term to describe the universe of all venture investing, buyout investing and mezzanine investing. Fund-of-funds investing and secondaries are also included in this term's broadest interpretation. VE is not using the term to include angel investors or business angels, real estate investments or other investing scenarios outside of the public market. See also Alternatives.
Real Estate Investments: Investments in land, buildings or other real property.
Real Estate Investment Trusts ("REITs"): A real estate portfolio managed by an investment company for the benefit of the trust unit holders. The units of most REITs are publicly traded.
Regular Account: That portion of OPERF that excludes the Variable Account (defined below). A diversified investment portfolio for which the asset allocation and general investment policies are established and approved by the OIC. Tier One participants are guaranteed a minimum rate of return based on the long-term interest rate used by the actuary. Tier Two participants have no guaranteed rate of return and receive benefits that reflect the Regular Account's actual or realized investment return.

Return: The gain or loss in value of an investment over a given period of time expressed as a percentage of the original amount invested. For example, an initial investment of $100 that grows to $105 over one year has produced a 5% return.
Risk: The probability of losing money or not achieving the expected investment outcome.
Russell 3000 Index: Measures the investment performance of a composite comprised of stocks issued by the approximately 3,000 largest U.S. companies. Based on total market capitalization, this index represents approximately 98% of the investable U.S. equity market.
S&P Risk Parity Index – 12% Target Volatility: An index designed to proxy the performance of a generic risk parity strategy using public equity, fixed income, and commodity exchange-traded futures, levered to target a 12% return volatility. Because there is no widely-accepted approach to risk parity, this index is not representative of the “market” but can still serve as a benchmark.
Secondaries: The purchase and sale of existing limited partnership commitments to other limited partners and/or fund sponsors.
Sector: A particular group of stocks or bonds that usually characterize a given industry or economic activity. For example, "pharmaceuticals" is the name given to stocks issued by companies researching, manufacturing and selling over-the-counter and prescription medicines. "Corporates" is the name given to fixed income instruments issued by private and public companies.
Sector Funds: A pooled investment product that focuses on a particular industry or economic activity. For example, pooled funds that invest principally in technology stocks would be termed a technology sector fund.
Tracking Error: The amount by which an investor's investment performance differed from a corresponding or assigned benchmark. Usually measured and expressed as the standard deviation of returns relative to a pre-specified benchmark.
Unhedged: A term indicating that the value of one, more or an entire portfolio of assets may be affected by foreign currency fluctuations and that no deliberate attempt has been made to protect against such fluctuations.
Value Added: As used in real estate, may include office, retail, industrial and apartment properties, but may target structured investments in alternative property types such as hotels, student housing, senior housing and specialized retail uses. Portfolios or strategies that are positioned as Value Added are expected to produce returns between Core and Opportunistic portfolios/strategies. For example, a Value Added property may exhibit some "institutional" qualities such as good location and high design and construction quality, but may need significant leasing improvements to stabilized and enhance its value. Value Added investments may also include development opportunities with balanced risk/return profiles.
Value Stock: Stocks that appear to be undervalued for reasons other than low potential earnings growth. Value stocks usually have low price-to-earnings ratios, low price-to-book ratios and a high dividend yield.
Variable Account: An account established for a PERS member who participated in the VAP (defined below).
Variable Annuity Program ("VAP"): a program that allowed active PERS members to allocate a portion of their yearly, employee retirement contributions to a domestic equity portfolio. No such contributions were allowed after December 31, 2003. Active members who participated in the VAP had part of their balance invested in the Regular Account and part invested in the Variable Account. Unless a member explicitly elected to participate in the VAP, all of that member's employee contributions were invested in the Regular Account. This "primary" election allowed members to place 25 percent, 50 percent or 75

percent of their employee contributions in the Variable Account. Variable Account balances increase or decrease depending on the investment performance of the variable fund, and individual participant accounts are credited for any amount (gain or loss) available for distribution. The OIC's asset allocation policy purview only applies to the Regular Account since the OIC cannot control the investment option elections of VAP participants.
Venture Capital: Independently managed, dedicated pools of capital that focus on equity or equity-linked investments in privately held, high growth companies. Outside of the United States, the term venture capital is used as a synonym for all types of alternative or private equity.
Vintage Year: The calendar year in which an investment fund's first closing occurs. For example, the 1995 vintage year for venture capital includes all venture capital funds that held a first closing in 1995.
POLICY STATEMENTS Introduction
1. Subject to ORS 293.721 and 293.726, the Council believes, based on the assumptions outlined herein, that the investment policies summarized in this document will provide the highest possible return at a level of risk that is appropriate for active and retired OPERF members. The Council evaluates risk in terms of both short-term asset price volatility and long-term plan viability.
2. This objective further contemplates a consecutive ten-year forecast horizon, and the Council also understands that estimates of forward-looking OPERF returns are a primary consideration during PERB's biennial determination of its ADR.
3. Historically, PERS members were allowed to direct up to 75% of their annual, employee retirement contributions to the Variable Account. While no longer receiving new contributions, the Variable Account's objective remains investment performance consistent with the MSCI All Country World Investable Market Index.
4. The Council has established investment objectives for individual asset classes that are also summarized in this Statement.
Policy Asset Mix, Diversification, and Return Expectations 1. The OIC undertakes a rigorous study of OPERF's assets and liabilities every three to five years (or
more frequently, if desired). These asset-liability studies include the following elements for OIC consideration: 1) capital market assumptions by asset class, which include expected returns, volatilities and correlations; 2) proposed asset mixes using various portfolio modeling/construction techniques; 3) OPERF's liability structure, funded status and liquidity needs; and 4) recommended strategic asset allocation targets and a rebalancing framework. The Council's approved asset mix policy for the Regular Account is summarized in Exhibit 1.
2. Of total Fund assets, 50 percent of OPERF is targeted for investment in equities, inclusive of private equity. Equity investments have generated the highest returns over long time periods, but can also produce low and even negative returns over shorter time periods. The risk of low returns over shorter time periods makes 100% equity policies unsuitable for most pension funds, including OPERF. By investing across multiple equity asset classes, and in lower return but less risky fixed income, real estate and alternatives asset classes, the Council manages and diversifies the Fund's overall risk.
3. Specific asset class exposures are maintained within the ranges outlined in Exhibit 1. Exhibit 1: Policy Mix and Return Expectations for the OPERF Regular Account
Asset Class Target Allocation (%)
Re-balancing Range (0%)
Expected Annual Policy Return1
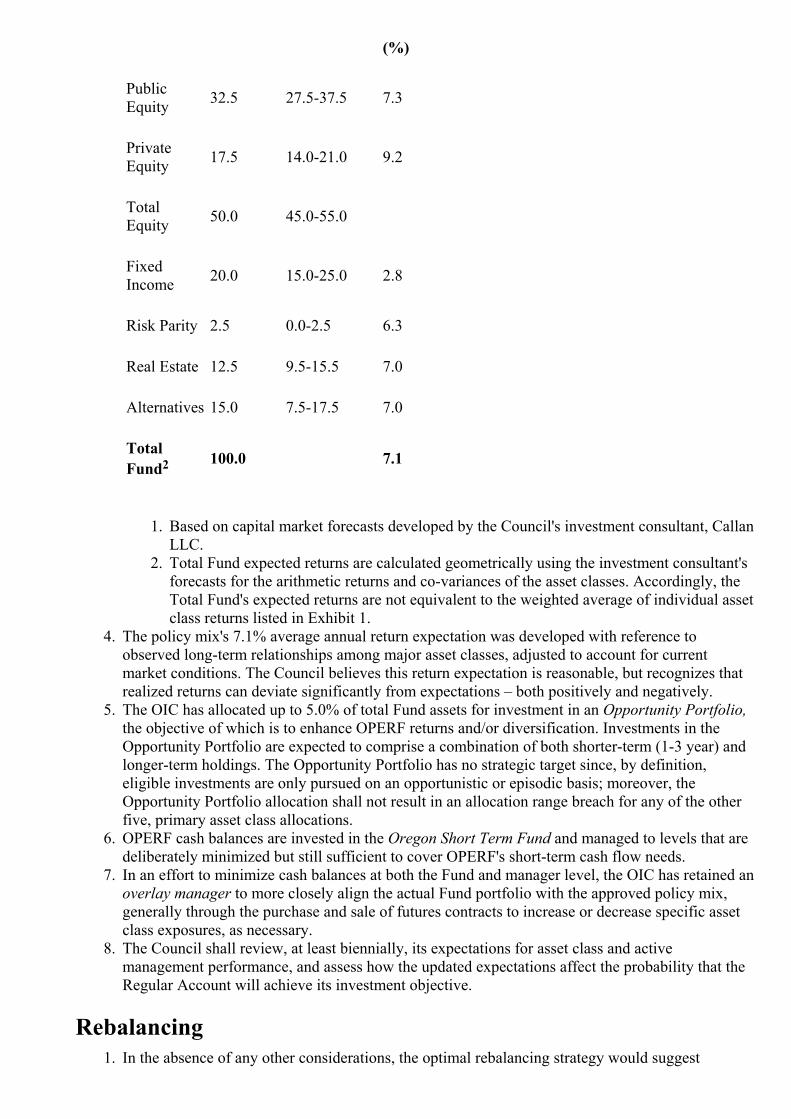
(%)
Public Equity 32.5 27.5-37.5 7.3
Private Equity 17.5 14.0-21.0 9.2
Total Equity 50.0 45.0-55.0
Fixed Income 20.0 15.0-25.0 2.8
Risk Parity 2.5 0.0-2.5 6.3
Real Estate 12.5 9.5-15.5 7.0
Alternatives 15.0 7.5-17.5 7.0
Total Fund2 100.0 7.1
1. Based on capital market forecasts developed by the Council's investment consultant, Callan
LLC. 2. Total Fund expected returns are calculated geometrically using the investment consultant's
forecasts for the arithmetic returns and co-variances of the asset classes. Accordingly, the Total Fund's expected returns are not equivalent to the weighted average of individual asset class returns listed in Exhibit 1.
4. The policy mix's 7.1% average annual return expectation was developed with reference to observed long-term relationships among major asset classes, adjusted to account for current market conditions. The Council believes this return expectation is reasonable, but recognizes that realized returns can deviate significantly from expectations – both positively and negatively.
5. The OIC has allocated up to 5.0% of total Fund assets for investment in an Opportunity Portfolio, the objective of which is to enhance OPERF returns and/or diversification. Investments in the Opportunity Portfolio are expected to comprise a combination of both shorter-term (1-3 year) and longer-term holdings. The Opportunity Portfolio has no strategic target since, by definition, eligible investments are only pursued on an opportunistic or episodic basis; moreover, the Opportunity Portfolio allocation shall not result in an allocation range breach for any of the other five, primary asset class allocations.
6. OPERF cash balances are invested in the Oregon Short Term Fund and managed to levels that are deliberately minimized but still sufficient to cover OPERF's short-term cash flow needs.
7. In an effort to minimize cash balances at both the Fund and manager level, the OIC has retained an overlay manager to more closely align the actual Fund portfolio with the approved policy mix, generally through the purchase and sale of futures contracts to increase or decrease specific asset class exposures, as necessary.
8. The Council shall review, at least biennially, its expectations for asset class and active management performance, and assess how the updated expectations affect the probability that the Regular Account will achieve its investment objective.
Rebalancing 1. In the absence of any other considerations, the optimal rebalancing strategy would suggest

continually rebalancing back to OPERF's strategic asset allocation targets. Rebalancing ensures that the return objectives and risk tolerance parameters approved by the OIC are consistently and effectively reflected in the Fund. However, rebalancing involves transactions costs such as brokerage fees and market impact. As a result of these costs, ranges are established around the strategic asset allocation targets in order to balance the desirability of achieving precise target allocations with the various and often material transactions costs associated with these same rebalancing activities. In addition, the overlay manager is expected to minimize cash exposures at both the Fund and individual manager level.
2. With OIC oversight, OST staff implements the approved rebalancing framework, although the illiquid nature of many private market assets may exempt those assets from staff's short-term rebalancing activities. Rebalancing should be implemented by the most cost-effective means available. For example, cash flows into and out of OPERF will first be used to rebalance back toward asset class targets, whenever possible.
3. A breach of any of the established asset allocation ranges triggers a review and possible rebalancing back to established targets with due consideration given to the liquidity of the affected investments, all anticipated transaction costs and the current portfolio structure within each asset class.
Passive and Active Management 1. Passive management uses lower cost index funds to access the return streams available from the
world's capital markets. Active management tries to earn higher returns than those available from index funds through the application of manager skill in the form of sector and security selection as well as market and/or asset mix timing decisions.
2. The Council uses passive management to control costs, evaluate active management strategies, capture exposure to efficient market segments, manage tracking error and facilitate policy mix re-balancing activities.
3. The Council approves active management of Fund assets when proposed active strategies offer sufficiently high expected incremental returns, net of fees, and when the magnitude of potential under-performance can be estimated, monitored and managed.
4. Public equity and fixed income asset classes are managed using both passive and active management strategies. Active management of the Fund's public market equity and fixed income allocations is expected to earn annual return premiums of 0.50% and 0.15%, respectively, over rolling, consecutive five-year periods (and relative to those allocation's respective benchmarks). The Council recognizes that unsuccessful active management can reduce total Fund returns.
5. The Council must accept active management in those asset classes for which there are no passive management alternatives; in particular, private real estate, private equity and other alternative and opportunistic investment strategies.
Public Equity Strategy 1. OPERF's public equity allocation is managed with the objective of earning at least 50 basis points
in annualized net excess return relative to the MSCI All Country World Investable Market Index (ACWI IMI – net) (unhedged) over rolling, consecutive five-year periods. Relative to that same benchmark, active risk shall be managed to a 0.75 to 2.0 percent annualized tracking error target.
2. Key elements of the strategy include the following: a. In an effort to enhance return, strategy will include maintaining an over-weight to small
capitalization stocks and other well supported sources of return premia. These strategic overweights or "tilts" are based on and supported by robust empirical research that historically links persistent and pervasive evidence of excess returns to systematic "factor exposures" such as size (i.e., small cap), value and momentum. Implementation of other factor tilts may be considered at the manager, strategy or mandate level upon approval of both the Chief Investment Officer (CIO) and OIC.
b. Multiple, specialist active managers with complementary investment styles are employed. For example, some OPERF managers focus on growth stocks, some on value stocks, some

on large capitalization stocks and others on small capitalization stocks. This diversified approach produces more excess return opportunities and minimizes the Fund's exposure to any single investment organization.
c. Aggregate exposures to countries, economic sectors, investment styles and market capitalization tiers are monitored and managed relative to corresponding benchmark exposures.
Fixed Income Strategy 1. OPERF's fixed income allocation is managed with the objective of earning 15 basis points in
annualized, net excess returns relative to the Bloomberg Barclays U.S. Aggregate Index over rolling, consecutive five-year periods. Relative to that same benchmark, active risk within the OPERF fixed income allocation is managed to up to 1.0 percent annualized tracking error target.
2. Key elements of the strategy include the following: a. A significant proportion of the OPERF fixed income allocation is actively managed due to
performance and cost considerations. Specifically, excess returns from active fixed income management are likely as many investors hold fixed income securities to meet regulatory and liability matching objectives, and hence are not total return oriented. This market dynamic produces systematic opportunities in fixed income securities that skilled investment managers can exploit. Active fixed income management fees are also much lower than active equity management fees.
b. Aggregate exposures to duration, credit and sectors are monitored and managed relative to corresponding exposures in the fixed income allocation benchmark.
Risk Parity Strategy 1. OPERF's risk parity allocation will be managed with the objective of earning a net total return
comparable to an equal risk weighting of traditional asset class indices such as Bloomberg Barclays U.S. Treasury Index and the MSCI ACWI IMI, using the S&P Risk Parity Index – 12% Target Volatility as the policy benchmark over rolling, consecutive five-year periods.
2. Key elements of the strategy include the following: a. Risk Parity is 100% actively managed because there is no widely-accepted definition of a
passive implementation of risk parity. b. Risk parity strategies provide long-only levered exposures to major publicly-traded asset
classes, such as public equity, fixed income (sometimes separating credit from interest rate), and commodities. Since risk parity strategies typically balance asset class exposures by risk versus nominal exposures, they are levered to target some return objective comparable to a generic balanced portfolio. Because each asset class in a risk parity portfolio delivers approximately the same level of risk, as opposed to equity providing the vast majority of the risk in a generic balanced portfolio, the expectation is a risk parity portfolio would deliver a higher risk-adjusted return over a full market cycle.
Real Estate Strategy 1. OPERF's real estate allocation is managed with the objective of earning at least 50 basis points in
annualized, net excess returns relative to the NCREIF Fund Index – Open End Diversified Core Equity (NFI-ODCE), net of management fees, over rolling, consecutive five-year periods.
2. Key elements of the strategy include the following: a. Real Estate is 100% actively managed because a passive replication of the full breadth and
depth of the real estate asset class is not viable. b. Core property investments represent 55% of the Fund's real estate allocation, with a range
of 45% to 65%. Risk is diversified by investing across the following major property types: office; apartments; retail; and industrial. The OPERF real estate allocation may also include structured investments in alternative property types with Core-like risk and return attributes.
c. Exchange-traded real estate investment trusts (REITs) represent 5% of the Fund's real

estate allocation, with a range of 0% to 10%. Up to 50% of the REIT exposure may be invested in markets outside the United States.
d. Value Added property investments represent 20% of the OPERF real estate allocation, with a range of 10% to 30%, and may include direct investments in each of the property types listed above, as well as structured investments in alternative property types. Risk is diversified by property type and geography.
e. Opportunistic property investments represent 20% of the OPERF real estate allocation, with a range of 10% to 30%. Relative to Core and Value Added strategies, real estate investments will be characterized as "opportunistic" based on higher risk/return expectations and other prevailing market conditions.
f. Within its real estate allocation, the Fund may participate in co-investment opportunities.
Private Equity Strategy 1. OPERF's private equity allocation is managed with the objective of earning at least 300 basis
points in annualized, net excess returns relative to the Russell 3000 Index over very long time horizons, typically rolling, consecutive 10-year periods.
2. Key elements of the strategy include the following: a. Private Equity is 100% actively managed because private equity index funds are not
available. b. Risk within OPERF's private equity allocation is diversified by investing across different
fund types and strategies including venture capital, leverage buyout, mezzanine debt, distressed debt, sector funds, secondaries and fund-of-funds.
c. OPERF's private equity allocation is further diversified by investing across vintage year, industry sectors, investment size, development stage and geography.
d. OPERF's private equity investments are managed by external managers operating as general partners. Considerations for private equity manager selection include access to transactions (i.e., "deal flow"), specialized areas of operating expertise, established or promising net of fees performance track records, unique or differentiated investment methodologies and transparent/verifiable reporting processes.
e. Within its private equity allocation, the Fund may participate in co-investment opportunities.
Alternatives Strategy 1. OPERF's allocation to Alternatives is managed with the objective of earning at least 400 basis
points in annualized, net excess returns relative to CPI over rolling, consecutive ten-year periods. 2. Key elements of the strategy include the following:
a. Alternatives are 100% actively managed because index funds replicating the broad alternatives market are not available.
b. Infrastructure investments represent 20% of the Fund's alternatives allocation, with a range of 15% to 25%. Risk is diversified by investment type, size and geography. Specific infrastructure sector exposures will likely include energy, transportation, ports and water in both domestic and international markets and comprising both mid-size and large capitalization enterprises.
c. Natural Resource investments represent 30% of the Fund's alternatives allocation, with a range of 25% to 35%. Risk is diversified by investing across multiple industry sectors including oil and gas, agriculture, timberland, mining and commodities.
d. Diversifying Strategies represent 50% of the Fund's alternatives allocation, with a range of 45% to 55%. Diversifying Strategies investments may include relative value, macro, arbitrage and long/short equity strategies. The objective of this sleeve is to invest in strategies with returns uncorrelated with those of the broader Fund. Risk is diversified by investing in multiple managers and across several strategies.
e. Other investments may represent 5% of the Fund's alternatives allocation, with a range of 0% to 10%. Investment strategies will be characterized as "other" based on prevailing market conditions as well as a specific strategy's unique "value proposition" or investment

thesis. f. Within its alternatives allocation, the Fund may also participate in co-investment
opportunities.
Performance Monitoring and Evaluation 1. The Council and OST staff use a variety of verification and performance measurement tools to
monitor, measure and evaluate the management of OPERF assets. Monitoring, reporting and evaluation frequencies range from daily to annually, although quarterly is the most commonly used reporting frequency.
2. The Council directs staff to develop a performance monitoring and evaluation system that validates whether the assets are prudently managed. More specifically, whether Fund investment performance improved benefit security, and capital market risk in general and active management in particular have been sufficiently rewarded.
3. One of many reports used by the Council to satisfy the above requirements is a simple comparison of Regular Account investment performance relative to the Council's assigned total Fund benchmark over rolling, consecutive multi-year periods. Other reports help the Council assess whether or not the Fund was rewarded for its allocations to higher return, higher risk equity investments and whether or not the active management strategies utilized added or subtracted from policy returns on a net of fees basis.
4. The reporting described in this section gives the Council a consolidated or "big picture" view of Regular Account investment performance. Regular Account investment performance across primary asset allocation categories will also be reported to the OIC. Upon request and if available, staff will also provide the Council more granular performance reporting, e.g., at the individual manager level.
5. The OST Compliance program will a) monitor and evaluate portfolios and asset classes and determine compliance with OST policies and contractual obligations; b) identify instances of non-compliance and develop and execute appropriate resolution strategies; c) provide relevant compliance information and reports to OST management and the Fund, as appropriate; and d) when applicable, verify resolution by the appropriate individual or manager within the appropriate time frame.
Exceptions None.
Failure to Comply Failure to comply with this policy may be cause for disciplinary action up to and including dismissal.
PROCEDURES and FORMS None.
ADMINISTRATION Review Annually.
Feedback Your comments are extremely important to improving the effectiveness of this policy. If you would like to comment on the provisions of this policy, you may do so by e-mailing the Policy Analyst. To ensure your comments are received without delay, please list the policy number and name in your e-mail's

subject. Your comments will be reviewed during the policy revisions process and may result in changes to the policy.

TAB 5 – Fixed Income Manager Recommendation

June 3, 2020
Geoff Nolan, Senior Investment Officer
Fixed Income PortfolioStrategic Review Implementation Update andGlobal Sovereign and EMD Manager Selections

Agenda
2. 2019 Strategic Review: Background/Objectives
3. 2019 Strategic Review: Executive Summary
4. 2019 Strategic Review: What Was Approved
5. 2019 Strategic Review: Asset Allocation Portfolios
Fixed Income Strategic Review Implementation Update
6. 2020: Current Implementation Status
7. 2020: Global Sovereign and EMD Manager Selection
8. 2020: External Manager Overviews
9. Appendix
1. Agenda Overview

Agenda Overview
• Presentation Overview:
• Where Did We Start• December 2019 Fixed Income Strategic Review – Brief Refresher
• Roadmap from December 2019 to Today• Implementation Process and Current Status
• Oregon State Treasury Fixed Income Staff Manager Selections• Global Sovereign and Emerging Market Debt Mandate Awards• Brief Manager Overviews
Fixed Income Strategic Review Implementation Update
Agenda
2. 2019 Strategic Review: Background/Objectives
3. 2019 Strategic Review: Executive Summary
4. 2019 Strategic Review: What Was Approved
5. 2019 Strategic Review: Asset Allocation Portfolios
Fixed Income Strategic Review Implementation Update
6. 2020: Current Implementation Status
7. 2020: Global Sovereign and EMD Manager Selection
8. 2020: External Manager Overviews
9. Appendix
1. Agenda Overview

2019 Strategic Review: Background / Objectives
Fixed Income’s Role: Providing Diversification and Liquidity for OPERF
• Oregon Investment Council (OIC) Oversight The OIC sets policy and is ultimately responsible for the Investment Program
The OIC is a policy-setting council that largely delegates investment management activities to the OregonState Treasury (OST) and qualified external fiduciaries.
The OIC has authority to set and monitor portfolio risk. Both short term and long term risks are critical.
• Role of Fixed Income in Oregon Public Employees Retirement Fund (OPERF) = Diversification & Liquidity The role of fixed income investments, pursuant to policy INV 401, is to:
provide diversification to the OPERF portfolio in general and to equity securities in particular; and provide liquidity to help meet OPERF’s cash flow needs.
• Fixed Income Strategic Review Objective = Enhance Diversification & Liquidity Objective: determine whether the fixed income portfolio asset allocation can be enhanced to improve upon
current diversification & liquidity benefits.
OST staff worked with BlackRock on the Strategic Review OST provided inputs, feedback & guidance on preferred model portfolios. BlackRock ran the asset allocation analytics given OST’s guidance. Callan and Guggenheim Partners also undertook an independent analysis.
Putting Fixed Income in Context
Fixed Income Strategic Review Implementation Update

Agenda
2. 2019 Strategic Review: Background/Objectives
3. 2019 Strategic Review: Executive Summary
4. 2019 Strategic Review: What Was Approved
5. 2019 Strategic Review: Asset Allocation Portfolios
Fixed Income Strategic Review Implementation Update
6. 2020: Current Implementation Status
7. 2020: Global Sovereign and EMD Manager Selection
8. 2020: External Manager Overviews
9. Appendix
1. Agenda Overview
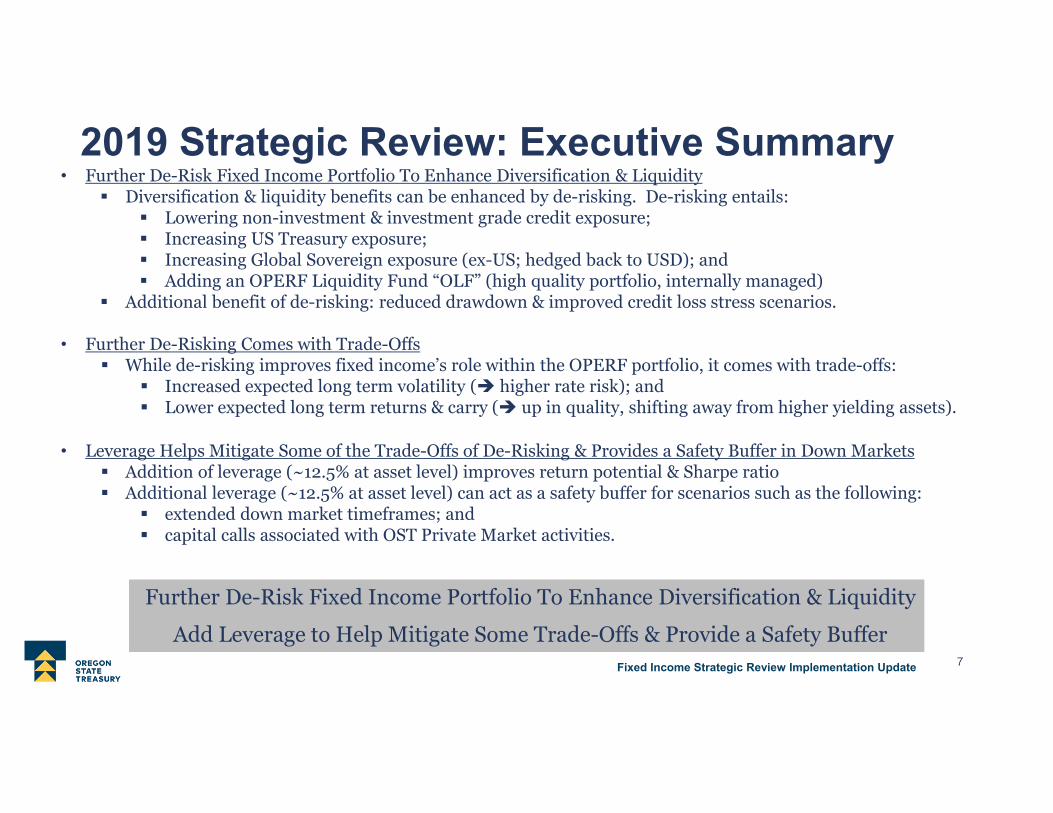
2019 Strategic Review: Executive Summary
Further De-Risk Fixed Income Portfolio To Enhance Diversification & Liquidity
Add Leverage to Help Mitigate Some Trade-Offs & Provide a Safety Buffer
• Further De-Risk Fixed Income Portfolio To Enhance Diversification & Liquidity Diversification & liquidity benefits can be enhanced by de-risking. De-risking entails:
Lowering non-investment & investment grade credit exposure; Increasing US Treasury exposure; Increasing Global Sovereign exposure (ex-US; hedged back to USD); and Adding an OPERF Liquidity Fund “OLF” (high quality portfolio, internally managed)
Additional benefit of de-risking: reduced drawdown & improved credit loss stress scenarios.
• Further De-Risking Comes with Trade-Offs While de-risking improves fixed income’s role within the OPERF portfolio, it comes with trade-offs:
Increased expected long term volatility ( higher rate risk); and Lower expected long term returns & carry ( up in quality, shifting away from higher yielding assets).
• Leverage Helps Mitigate Some of the Trade-Offs of De-Risking & Provides a Safety Buffer in Down Markets Addition of leverage (~12.5% at asset level) improves return potential & Sharpe ratio Additional leverage (~12.5% at asset level) can act as a safety buffer for scenarios such as the following:
extended down market timeframes; and capital calls associated with OST Private Market activities.
Fixed Income Strategic Review Implementation Update

Putting Fixed Income in Context – Current Portfolio Composition
2019 Strategic Review: OST Fixed Income Program Overview
Fixed Income & OST-Managed Funds Represent a Significant Portion of OST Assets As of October 31, 2019 Source: State Street, OST
Fixed Income Strategic Review Implementation Update
Agenda
2. 2019 Strategic Review: Background/Objectives
3. 2019 Strategic Review: Executive Summary
4. 2019 Strategic Review: What Was Approved
5. 2019 Strategic Review: Asset Allocation Portfolios
Fixed Income Strategic Review Implementation Update
6. 2020: Current Implementation Status
7. 2020: Global Sovereign and EMD Manager Selection
8. 2020: External Manager Overviews
9. Appendix
1. Agenda Overview

2019 Strategic Review: What Was ApprovedPortfolio Asset Allocation
• Target Portfolio 2 (Please see page 12 for details)• Additional Leverage of 12.5% (total 25% at asset class level)
• Remaining leverage (~12.5%) to be reserved for scenarios such as the following:• extended down market timeframes; and• capital calls associated with OST Private Markets activities.
• Use of leverage above 12.5% would require the approval of:• Chief Investment Officer; and• Director of Capital Markets.
Policy Benchmark• Bloomberg Barclays US Aggregate Bond Index for Portfolio 2 (Leveraged 12.5%) with a return
target expectation of 15 basis points above the Policy Benchmark over a market cycle.
OST Policy INV 401• Amend “Section A, Policy Statement” return target expectation to 15 from 25 basis points over a
market cycle.• Amend “Section A, Policy Statement” Policy Benchmark per the above.• Amend “Section B, (1)” limiting portfolio risk, as measured by tracking error, to “up to 1.0
percent” from “0.5-1.0 percent”.Fixed Income Strategic Review Implementation Update

Agenda
2. 2019 Strategic Review: Background/Objectives
3. 2019 Strategic Review: Executive Summary
4. 2019 Strategic Review: What Was Approved
5. 2019 Strategic Review: Asset Allocation Portfolios
Fixed Income Strategic Review Implementation Update
6. 2020: Current Implementation Status
7. 2020: Global Sovereign and EMD Manager Selection
8. 2020: External Manager Overviews
9. Appendix
1. Agenda Overview

Fixed Income Asset Classes Unlevered Leveraged 12.5% Leveraged 25%
1 2 3Cash / OPERF Liquidity Fund (OLF) 0.0% 4.9% 18.9% 24.1% 28.8%ABS (Credit cards, Autos, Student Loans) 0.2% 4.4% 1.9% 1.6% 1.8%Agency MBS 12.8% 13.7% 3.7% 5.5% 6.2%CMBS 1.0% 2.4% 5.7% 5.6% 5.7% Subtotal Securitized 14.0% 20.5% 11.3% 12.8% 13.7%IG Corporate 1‐5 5.5% 5.6% 0.6% 1.3% 1.5%IG Corporate 5‐10 3.8% 5.9% 1.3% 1.7% 1.6%IG Corporate 10+ 4.3% 2.8% 0.0% 0.0% 0.0% Subtotal IG Corporate 13.5% 14.2% 2.0% 3.0% 3.1%US Treasuries 1‐10 45.7% 32.4% 35.9% 38.6% 43.8%US Treasuries 10+ 9.6% 10.2% 15.0% 14.3% 14.0% Subtotal US Treasuries 55.3% 42.6% 50.9% 52.9% 57.8%TIPS 0.0% 1.3% 1.4% 1.6% 1.6%Global Sovereign (ex‐US) (USD Hedged) 0.0% 1.0% 5.7% 8.1% 9.3%High Yield 4.0% 3.9% 5.2% 4.8% 5.1%Bank Loans 13.0% 11.2% 2.1% 2.5% 2.7% Subtotal Non Investment Grade 17.0% 15.2% 7.4% 7.3% 7.8%EM Debt (Hard Dollar) 0.0% 0.4% 2.6% 2.7% 2.8%Total 100% 100% 100.0% 112.5% 125.0%
Policy Benchmark
Actual Portfolio
2019 Strategic Review: Asset Allocation Portfolios
Note: Policy Benchmark refers to the Portfolio's disaggregated benchmark per OIC policies.
Reduce Non-IG exposure from ~15% to ~7%.
Reduce IG exposure from ~14% to ~2-3%.
Increase US Treasury exposure from ~43% to ~51-53%.
Exposure movements refer to changes from Actual Portfolio to Unlevered and
Leveraged 12.5% allocations, respectively.
Increase Global Sovereign exposure from ~1% to ~6-8%.
Add OPERF Liquidity Fund exposure of ~14% to ~19%.
Further De-Risking the Fixed Income Portfolio Fixed Income Strategic Review Implementation Update
Portfolio 2 was Approved with ability to move to portfolio 3, subject to certain conditions.
(Please see Appendix for details.)

Agenda
2. 2019 Strategic Review: Background/Objectives
3. 2019 Strategic Review: Executive Summary
4. 2019 Strategic Review: What Was Approved
5. 2019 Strategic Review: Asset Allocation Portfolios
Fixed Income Strategic Review Implementation Update
6. 2020: Current Implementation Status
7. 2020: Global Sovereign and EMD Manager Selection
8. 2020: External Manager Overviews
9. Appendix
1. Agenda Overview

• Manager searches initiated shortly after Fixed Income Strategic Review was approved in December 2019.
• Evaluation Process:• Throughout 1Q20 & into 2Q20, the team:
• Utilized eVestment database screens to determine the initial broad potential manager pool;• Applied finer eVestment screens to create a list of managers to have initial discussions with;• Shortlisted managers post those initial calls;• Sent out / reviewed due diligence questionnaires from each shortlisted manager; and,• Conducted final due diligence discussions before making award selection for each manager.
• Managers reviewed with Callan.• Due diligence focus: portfolio management, investment philosophy & process, risk management and operations.
• Searches:• In keeping with the implementation guidelines and expected funding order (please see Appendix for details), manager searches
were initiated as follows:• Initial Search and Selections Presented Today: Global Sovereign and Emerging Market Debt.• Search in Process: Securitized.
• Expect to present selected managers at next OIC meeting.• Next Up: Investment Grade & High Yield.
• OPERF Fixed Income Portfolio Realignment Temporarily Suspended:• As a result of the corona virus pandemic and resulting market disruptions, while manager searches are continuing, the actual
realignment of the fixed income portfolio (i.e., de-funding existing portfolios to fund approved Strategic Review mandates) istemporarily suspended pending a more stable economic and market outlook.
2020: Current Implementation Status
Portfolio Realignment to Occur Over the Next 3-6 Quarters
Fixed Income Strategic Review Implementation Update

Agenda
2. 2019 Strategic Review: Background/Objectives
3. 2019 Strategic Review: Executive Summary
4. 2019 Strategic Review: What Was Approved
5. 2019 Strategic Review: Asset Allocation Portfolios
Fixed Income Strategic Review Implementation Update
6. 2020: Current Implementation Status
7. 2020: Global Sovereign and EMD Manager Selection
8. 2020: External Manager Overviews
9. Appendix
1. Agenda Overview

• Global Sovereign Manager Selections:• Mandate: global sovereign ex-US Treasuries (hedged to USD).
• Morgan Stanley Investment Management (MSIM) and PIMCO.• Total Mandate Funding Amount:
• Combined up to 8.1% of OPERF fixed income AUM.• $1.117BN based upon OPERF 4/30/20 AUM.
• Split evenly between MSIM and PIMCO.• Up to $585MM to each manager.
• Emerging Markets Debt Manager Selections:• Mandate: emerging markets debt (hard dollar).
• Global Evolution, PGIM and Ashmore.• Total Mandate Funding Amount:
• Combined up to 2.7% of OPERF fixed income AUM.• $390MM based upon OPERF 4/30/20 AUM.
• Split evenly amongst Global Evolution, PGIM and Ashmore.• Up to $130MM to each manager.
Notes:• Selections subject to satisfactory negotiation of all terms and conditions.• Percentage funding amounts are from the approved asset allocation portfolio (portfolio 2).• Funding amounts not to exceed the percentage amounts noted above, but absolute dollar amounts may be less depending upon funding requirements to meet
OPERF needs and capital calls associated with OST private markets activities.
2020: Global Sovereign and EMD Manager Selections
Portfolio Realignment to Occur Over the Next 3-6 Quarters
Fixed Income Strategic Review Implementation Update

Agenda
2. 2019 Strategic Review: Background/Objectives
3. 2019 Strategic Review: Executive Summary
4. 2019 Strategic Review: What Was Approved
5. 2019 Strategic Review: Asset Allocation Portfolios
Fixed Income Strategic Review Implementation Update
6. 2020: Current Implementation Status
7. 2020: Global Sovereign and EMD Manager Selection
8. 2020: External Manager Overviews
9. Appendix
1. Agenda Overview

OIC Board Members have additional manager background information included in their packets.
Global SovereignManagers
• Morgan Stanley Investment Management• Firm:
• $584BN AUM (3/31/20) with $4.5BN in global sovereign AUM.• 718 investment professionals in 44 offices and 23 countries around the world.
• Team:• 13 specialized macro investors and researchers supported by broader Global Fixed Income team.• Lead PM is Jim Caron (Head of Macro; NYC) with Eric Baurmeister (co-PM, EMD; NYC).
• Mandate Strategy:• Global Sovereign mandate looking across both developed and emerging markets to best express overall macro views while
incorporating views on areas such as duration, yield curve, relative value and spreads.• PIMCO
• Firm:• $1.78TN AUM (3/31/20) with $113BN in global sovereign AUM.• 2800+ investment professionals in 14 offices and 12 countries around the world.
• Team:• 14 dedicated global investors integrated within the broader 260+ fixed income team.• Lead PM is Sachin Gupta (Head of Global; Newport Beach, CA) with Yacov Arnopolin (co-PM, EMD; London).
• Mandate Strategy:• Global Sovereign mandate looking across both developed and emerging markets with a focus on producing consistent, risk-
adjusted outperformance over a market cycle. Strategy seeks to build diversified/resilient portfolios with severaluncorrelated alpha themes (e.g., duration, yield curve, country/FX, sector/security selection) informed by PIMCO’s Globaland EM top down, bottom up and structural views.
2020: External Manager Overviews
Fixed Income Strategic Review Implementation Update

OIC Board Members have additional manager background information included in their packets.
Emerging Markets Debt Managers
• Global Evolution• Firm:
• $12BN AUM (4/30/20) with ~$6BN in hard currency AUM.• Boutique emerging markets (EM) debt investment firm with 55 professionals in 4 offices.
• Team:• 16 dedicated EM debt investment professionals.• Lead PM is Morten Bugge (CIO; Denmark) with Kristian Wigh and Sofus Asboe (co-PMs, Hard Dollar; Denmark).
• Mandate Strategy:• EM mandate looking across hard dollar markets to provide competitive risk-adjusted long term returns utilizing a
diversified, conviction-based and benchmark agnostic investment approach.• PGIM
• Firm:• $868BN AUM (3/31/20) with $22BN in hard currency AUM.• 126 investment professionals in 5 offices around the world.
• Team:• 15 dedicated EM debt investors.• Lead PM is Cathy Hepworth (Head of Emerging Markets Debt; New Jersey) with Mariusz Banasiak (co-PM; New Jersey).
• Mandate Strategy:• EM mandate looking across hard dollar markets incorporating high conviction, contrarian views to capture attractive,
undervalued opportunities. Portfolios, while diversified, utilize a “barbell approach” by investing in higher yielding, shorttenor securities (hold to maturity expectation) complemented by high conviction, higher quality longer tenor securities.
2020: External Manager Overviews
Fixed Income Strategic Review Implementation Update

OIC Board Members have additional manager background information included in their packets.
Emerging Markets Debt Managers
• Ashmore• Firm:
• $77BN AUM (3/31/20) AUM with $29BN in hard currency sovereign AUM.• 99 investment professionals in 8 countries.
• Team:• 33 specialist emerging market debt investors.• Committee based investment decision with all portfolio managers participating. No lead PM.
• Mandate Strategy:• Emerging market (EM) mandate looking across hard dollar EM debt to provide excess returns using macro top down views
(long term and tactical) along with active assessment of country conditions to determine credit risk.
2020: External Manager Overviews
Fixed Income Strategic Review Implementation Update

Agenda
2. 2019 Strategic Review: Background/Objectives
3. 2019 Strategic Review: Executive Summary
4. 2019 Strategic Review: What Was Approved
5. 2019 Strategic Review: Asset Allocation Portfolios
Fixed Income Strategic Review Implementation Update
6. 2020: Current Implementation Status
7. 2020: Global Sovereign and EMD Manager Selection
8. 2020: External Manager Overviews
9. Appendix
1. Agenda Overview

Putting Fixed Income in Context – Current Portfolio Composition
April 30, 2020: OST Fixed Income Program Overview
Fixed Income & OST-Managed Funds Represent a Significant Portion of OST Assets Fixed Income Strategic Review Implementation Update
As of April 30, 2020 Source: State Street, OST

• Given the complexity of and amount of fund movements involved in the portfolio realignment, implementation of changes from theStrategic Review would take place at a measured pace over the next 3-6 quarters.
• Internally-managed mandates:• US treasuries; US treasury futures; and US TIPS and OPERF Liquidity Fund.
• Step 1 – Manager Searches• Initiate searches for new mandates: Global Sovereign /EMD (Hard Currency); Securitized (ABS, Agency MBS, CMBS); and High
yield / bank loan. Incumbent managers may be included in searches.• Step 2 - Funding New Mandates (without using leverage)
• Depending on timing of onboarding of new managers, funding of mandates may be run in parallel.• Global Sovereign / EMD expected to be largely funded with proceeds from reduction in high yield / bank loan mandates.• Securitized, OPERF Liquidity Fund, US Treasuries & TIPS expected to be funded with proceeds from a combination of a
reduction in investment grade core mandates.• Step 3 – Leverage
• Leverage to be added through use of US treasury futures.• Given current cash allocation to US treasuries (internally managed and embedded within external core manager portfolios), sales
of US treasuries to reach the asset allocation target may be modest.• Leverage would be added upon completion of ramp in of US treasury cash portfolio.
• Other• To minimize the costs of the realignment, in-kind transfers (to internal or new external managers) and arms-length crossing
trades within managers may be considered.
2019 Strategic Review: Implementation Guidelines
Portfolio Realignment to Occur Over the Next 3-6 Quarters
Fixed Income Strategic Review Implementation Update

2019 Strategic Review: Additional Leverage Guidelines
Fixed Income Portfolio 2019 Strategic Review
• Utilization of Additional Leverage beyond 12.5%• Remaining leverage of ~12.5% to be reserved for scenarios such as the following:
• extended down market timeframes; and• capital calls associated with OST Private Markets activities.
• For governance and control purposes, use of leverage above 12.5% would require the approval of:• Chief Investment Officer; and• Director of Capital Markets.
• Leveraging Sequencing Guidelines• Given the uncertainty surrounding forecasting down markets (e.g., timing, depth, duration, etc.), OPERF plan
needs at the time as well as future fixed income and OPERF portfolio composition, a pre-set proscribedleveraging sequence is not advisable.
• However, in an extended down market scenario, the following factors would need to be considered:• Expected length and/or severity of the downturn;• Amount of US treasuries (most liquid, easily sold assets) as well as leverage to hold in reserve in case
market downturn extends and/or becomes more severe;• Ease and practicality of selling cash securities vs. leveraging via US treasury futures; and• Maintaining a reasonable risk level at the asset class and total plan level.
Additional Use of Leverage Warrants Appropriate Controls by Senior Management

Fixed Income Portfolio 2018 Annual Review and 2019 Plan
Lorem ipsum dolor sit amet, consectetur adipiscing elit. Nam condimentum vulputate gravida. Fixed Income Portfolio 2019 Strategic Review

Tobias ReadOregon State Treasurer
oregon.gov/treasury350 Winter St NE, Suite 100Salem, OR 97301-3896

TAB 6 – Asset Allocation & NAV Updates
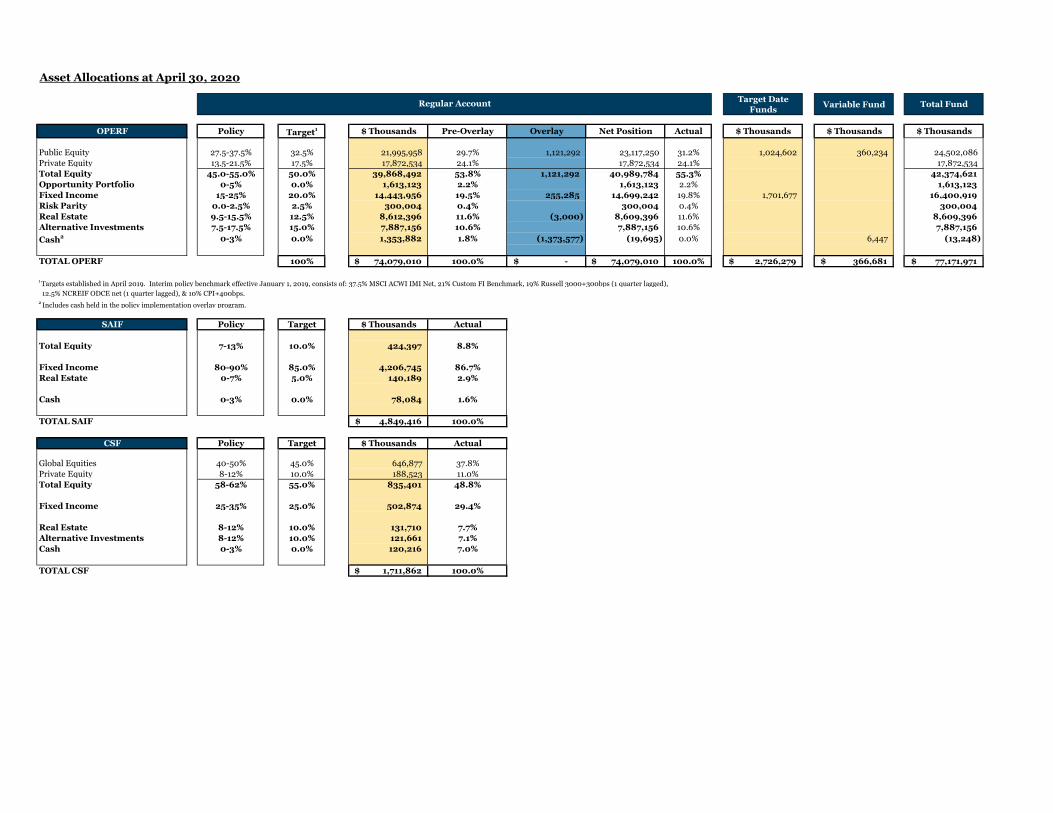
Asset Allocations at April 30, 2020
Target Date Funds Variable Fund Total Fund
OPERF Policy Target1 $ Thousands Pre-Overlay Overlay Net Position Actual $ Thousands $ Thousands $ Thousands
Public Equity 27.5-37.5% 32.5% 21,995,958 29.7% 1,121,292 23,117,250 31.2% 1,024,602 360,234 24,502,086 Private Equity 13.5-21.5% 17.5% 17,872,534 24.1% 17,872,534 24.1% 17,872,534 Total Equity 45.0-55.0% 50.0% 39,868,492 53.8% 1,121,292 40,989,784 55.3% 42,374,621 Opportunity Portfolio 0-5% 0.0% 1,613,123 2.2% 1,613,123 2.2% 1,613,123 Fixed Income 15-25% 20.0% 14,443,956 19.5% 255,285 14,699,242 19.8% 1,701,677 16,400,919 Risk Parity 0.0-2.5% 2.5% 300,004 0.4% 300,004 0.4% 300,004 Real Estate 9.5-15.5% 12.5% 8,612,396 11.6% (3,000) 8,609,396 11.6% 8,609,396 Alternative Investments 7.5-17.5% 15.0% 7,887,156 10.6% 7,887,156 10.6% 7,887,156 Cash2 0-3% 0.0% 1,353,882 1.8% (1,373,577) (19,695) 0.0% 6,447 (13,248)
TOTAL OPERF 100% 74,079,010$ 100.0% -$ 74,079,010$ 100.0% 2,726,279$ 366,681$ 77,171,971$
1 Targets established in April 2019. Interim policy benchmark effective January 1, 2019, consists of: 37.5% MSCI ACWI IMI Net, 21% Custom FI Benchmark, 19% Russell 3000+300bps (1 quarter lagged), 12.5% NCREIF ODCE net (1 quarter lagged), & 10% CPI+400bps. 2 Includes cash held in the policy implementation overlay program.
SAIF Policy Target $ Thousands Actual
Total Equity 7-13% 10.0% 424,397 8.8%
Fixed Income 80-90% 85.0% 4,206,745 86.7%Real Estate 0-7% 5.0% 140,189 2.9%
Cash 0-3% 0.0% 78,084 1.6%
TOTAL SAIF 4,849,416$ 100.0%
CSF Policy Target $ Thousands Actual
Global Equities 40-50% 45.0% 646,877 37.8%Private Equity 8-12% 10.0% 188,523 11.0%Total Equity 58-62% 55.0% 835,401 48.8%
Fixed Income 25-35% 25.0% 502,874 29.4%
Real Estate 8-12% 10.0% 131,710 7.7%Alternative Investments 8-12% 10.0% 121,661 7.1%Cash 0-3% 0.0% 120,216 7.0%
TOTAL CSF 1,711,862$ 100.0%
Regular Account

32.5%
17.5%
0.0%
20.0%
2.5%
12.5%15.0%
0.0%
31.2%
24.1%
2.2%
19.8%
0.4%
11.6% 10.6%
0.0%
-5%
0%
5%
10%
15%
20%
25%
30%
35%
Public Equity PrivateEquity
OpportunityPortfolio
Fixed Income Risk Parity Real Estate AlternativeInvestments
Cash
TargetActual
OPERF Asset Allocation
10.0%
85.0%
5.0%0.0%
8.8%
86.7%
2.9% 1.6%0%
10%
20%
30%
40%
50%
60%
70%
80%
90%
100%
Total Equity Fixed Income Real Estate Cash
TargetActual
SAIF Asset Allocation
45.0%
10.0%
25.0%
10.0% 10.0%
0.0%
37.8%
11.0%
29.4%
7.7% 7.1% 7.0%
0.0%
5.0%
10.0%
15.0%
20.0%
25.0%
30.0%
35.0%
40.0%
45.0%
50.0%
Global Equities Private Equity Fixed Income Real Estate AlternativeInvestments
Cash
TargetActual
CSF Asset Allocation

-
10,000
20,000
30,000
40,000
50,000
60,000
70,000
80,000
90,000
Apr
-05
Jul-
05O
ct-0
5Ja
n-06
Apr
-06
Jul-
06O
ct-0
6Ja
n-07
Apr
-07
Jul-
07O
ct-0
7Ja
n-08
Apr
-08
Jul-
08O
ct-0
8Ja
n-09
Apr
-09
Jul-
09O
ct-0
9Ja
n-10
Apr
-10
Jul-
10O
ct-1
0Ja
n-11
Apr
-11
Jul-
11O
ct-1
1Ja
n-12
Apr
-12
Jul-
12O
ct-1
2Ja
n-13
Apr
-13
Jul-
13O
ct-1
3Ja
n-14
Apr
-14
Jul-
14O
ct-1
4Ja
n-15
Apr
-15
Jul-
15O
ct-1
5Ja
n-16
Apr
-16
Jul-
16O
ct-1
6Ja
n-17
Apr
-17
Jul-
17O
ct-1
7Ja
n-18
Apr
-18
Jul-
18O
ct-1
8Ja
n-19
Apr
-19
Jul-
19O
ct-1
9Ja
n-20
Apr
-20
OPERF NAV15 years ending April 30, 2020
($ in Millions)
IAP OPERF

-
1,000
2,000
3,000
4,000
5,000
6,000
Apr
-05
Jul-
05O
ct-0
5Ja
n-06
Apr
-06
Jul-
06O
ct-0
6Ja
n-07
Apr
-07
Jul-
07O
ct-0
7Ja
n-08
Apr
-08
Jul-
08O
ct-0
8Ja
n-09
Apr
-09
Jul-
09O
ct-0
9Ja
n-10
Apr
-10
Jul-
10O
ct-1
0Ja
n-11
Apr
-11
Jul-
11O
ct-1
1Ja
n-12
Apr
-12
Jul-
12O
ct-1
2Ja
n-13
Apr
-13
Jul-
13O
ct-1
3Ja
n-14
Apr
-14
Jul-
14O
ct-1
4Ja
n-15
Apr
-15
Jul-
15O
ct-1
5Ja
n-16
Apr
-16
Jul-
16O
ct-1
6Ja
n-17
Apr
-17
Jul-
17O
ct-1
7Ja
n-18
Apr
-18
Jul-
18O
ct-1
8Ja
n-19
Apr
-19
Jul-
19O
ct-1
9Ja
n-20
Apr
-20
SAIF NAV15 years ending April 30, 2020
($ in Millions)

-
200
400
600
800
1,000
1,200
1,400
1,600
1,800
2,000
Apr
-05
Jul-
05O
ct-0
5Ja
n-06
Apr
-06
Jul-
06O
ct-0
6Ja
n-07
Apr
-07
Jul-
07O
ct-0
7Ja
n-08
Apr
-08
Jul-
08O
ct-0
8Ja
n-09
Apr
-09
Jul-
09O
ct-0
9Ja
n-10
Apr
-10
Jul-
10O
ct-1
0Ja
n-11
Apr
-11
Jul-
11O
ct-1
1Ja
n-12
Apr
-12
Jul-
12O
ct-1
2Ja
n-13
Apr
-13
Jul-
13O
ct-1
3Ja
n-14
Apr
-14
Jul-
14O
ct-1
4Ja
n-15
Apr
-15
Jul-
15O
ct-1
5Ja
n-16
Apr
-16
Jul-
16O
ct-1
6Ja
n-17
Apr
-17
Jul-
17O
ct-1
7Ja
n-18
Apr
-18
Jul-
18O
ct-1
8Ja
n-19
Apr
-19
Jul-
19O
ct-1
9Ja
n-20
Apr
-20
CSF NAV15 years ending April 30, 2020
($ in Millions)

TAB 7 Calendar – Future Agenda Items

2020/21 OIC Forward Calendar and Planned Agenda Topics July 22, 2020 OSGP Annual Review Operations Update Corporate Governance Update Securities Lending Update September 9, 2020 Alternatives Portfolio Review ESG Update SAIF Annual Review Q2 Performance & Risk Report October 28, 2020 Public Equity Program Review Opportunity Portfolio Review Currency Overlay Review CEM Benchmarking December 9, 2020 Fixed Income Program Review Q3 Performance & Risk Report Policy Updates January 28, 2021 2022 OIC Calendar Approval Private Equity Program Review Placement Agent Report IAP Update March 10, 2021 Real Estate Portfolio Review CSF Annual Review Q4 Performance & Risk Report April 21, 2021 Asset Allocation & Capital Market Assumptions Update Overlay Review June 2, 2021 Q1 Performance & Risk Report