oreilly energy lieracy webcast - 092302009
TRANSCRIPT
Two stories : one global, one personal.
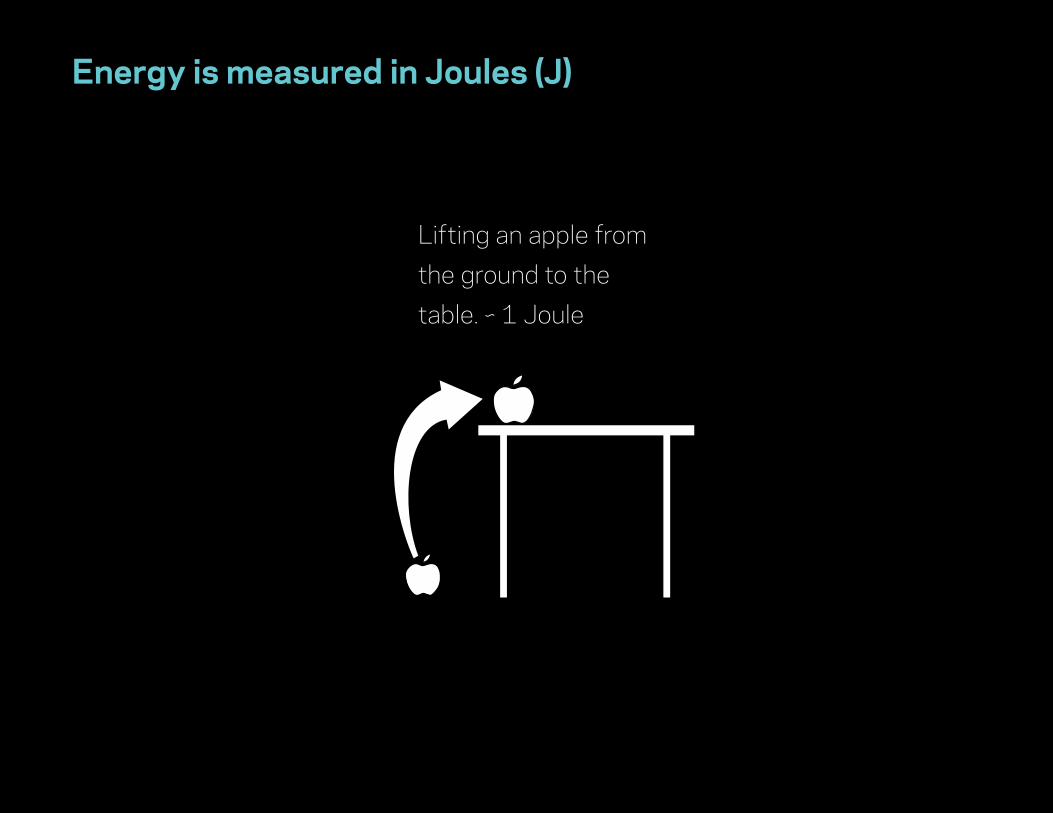
Energy is measured in Joules (J)
Lifting an apple from the ground to the table. ~ 1 Joule
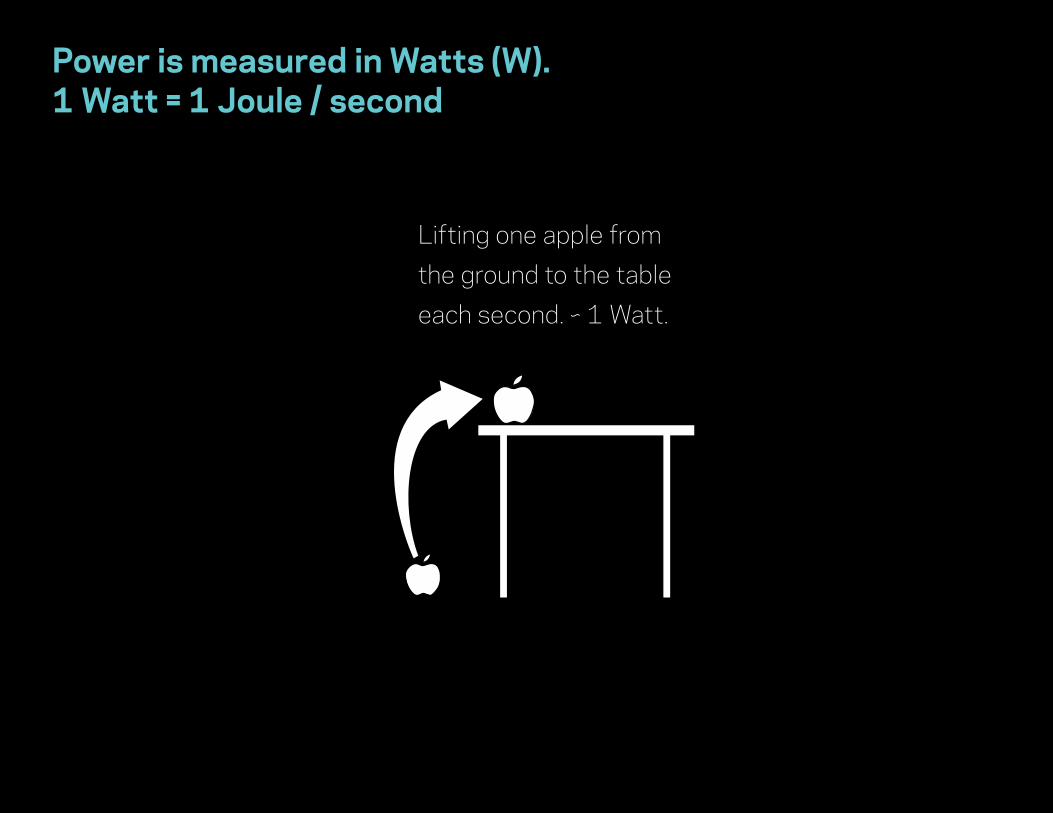
Lifting one apple from the ground to the table each second. ~ 1 Watt.
Power is measured in Watts (W). 1 Watt = 1 Joule / second
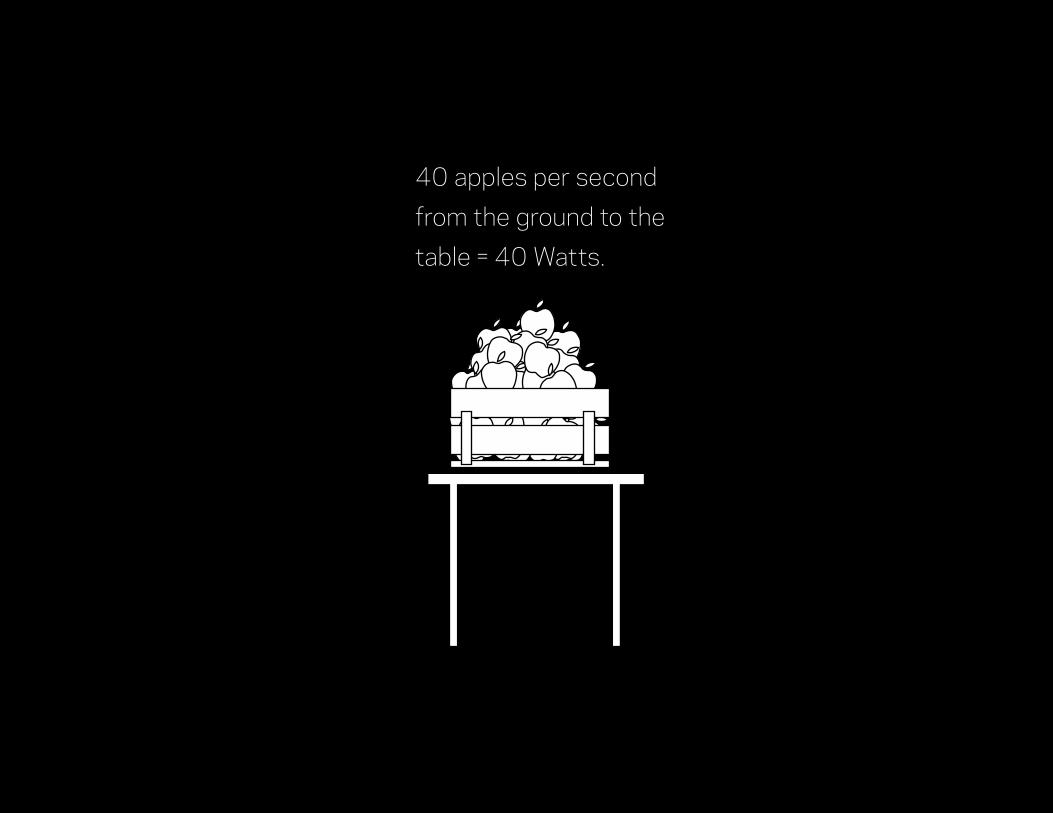
40 apples per second from the ground to the table = 40 Watts.

Running this Apple laptop takes 40 Watts.
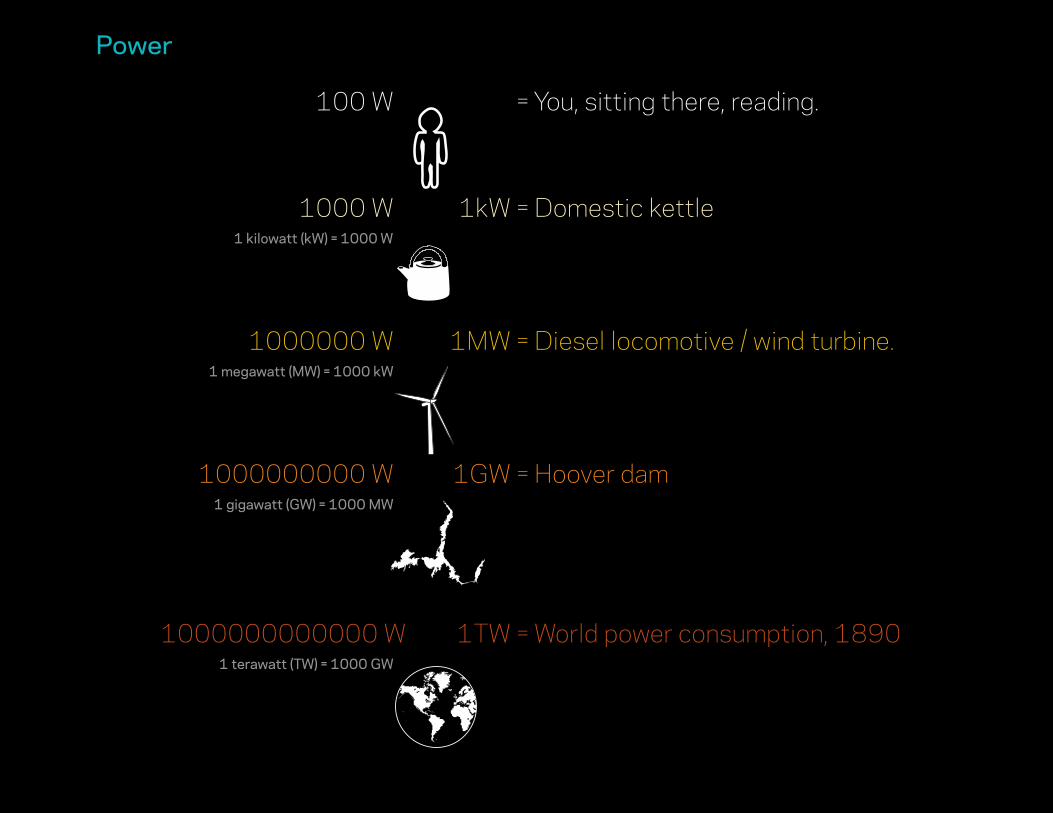
100 W = You, sitting there, reading.
1000 W 1kW = Domestic kettle 1 kilowatt (kW) = 1000 W
1000000 W 1MW = Diesel locomotive / wind turbine. 1 megawatt (MW) = 1000 kW
1000000000 W 1GW = Hoover dam 1 gigawatt (GW) = 1000 MW
1000000000000 W 1TW = World power consumption, 1890 1 terawatt (TW) = 1000 GW
Power
HOW MUCH POWERDO I USE?
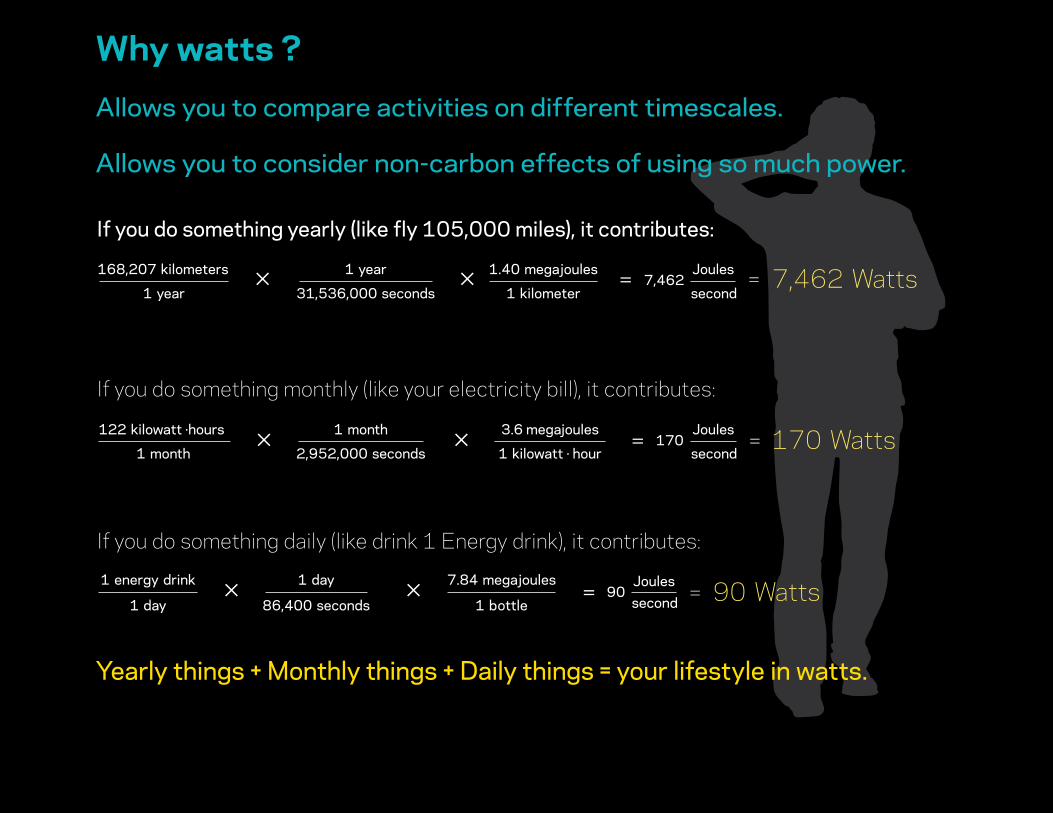
Yearly things + Monthly things + Daily things = your lifestyle in watts.
Why watts ?
Allows you to compare activities on different timescales.
Allows you to consider non-carbon effects of using so much power.
168,207 kilometers
1 year� �
� �
� �
1 year
31,536,000 seconds
1.40 megajoules
1 kilometer� 7,462
Joules
second=
=
7,462 Watts
122 kilowatt ·hours
1 month
1 month
2,952,000 seconds
3.6 megajoules
1 kilowatt · hour170
Joules
second170 Watts
1 energy drink
1 day
1 day
86,400 seconds
7.84 megajoules
1 bottle90
Joulessecond 90 Watts=
If you do something yearly (like fly 105,000 miles), it contributes:
If you do something monthly (like your electricity bill), it contributes:
If you do something daily (like drink 1 Energy drink), it contributes:
�
�
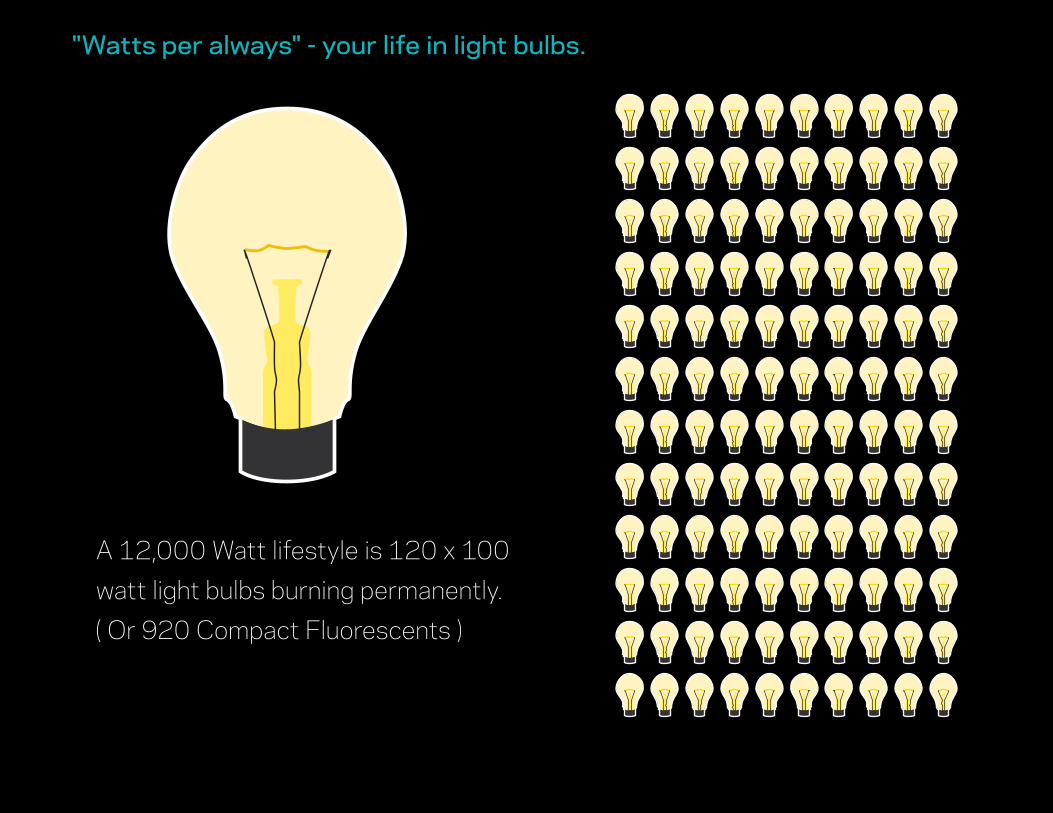
A 12,000 Watt lifestyle is 120 x 100 watt light bulbs burning permanently.( Or 920 Compact Fluorescents )
100W
"Watts per always" - your life in light bulbs.
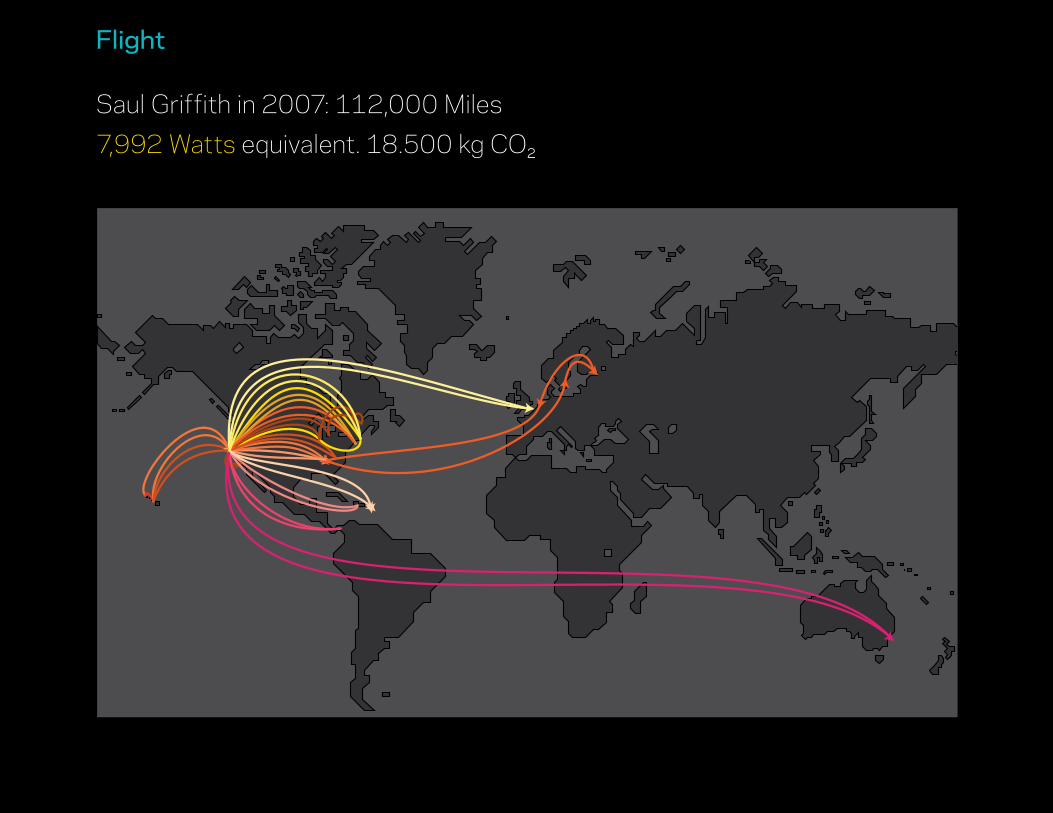
Flight
Saul Griffith in 2007: 112,000 Miles7,992 Watts equivalent. 18.500 kg CO2
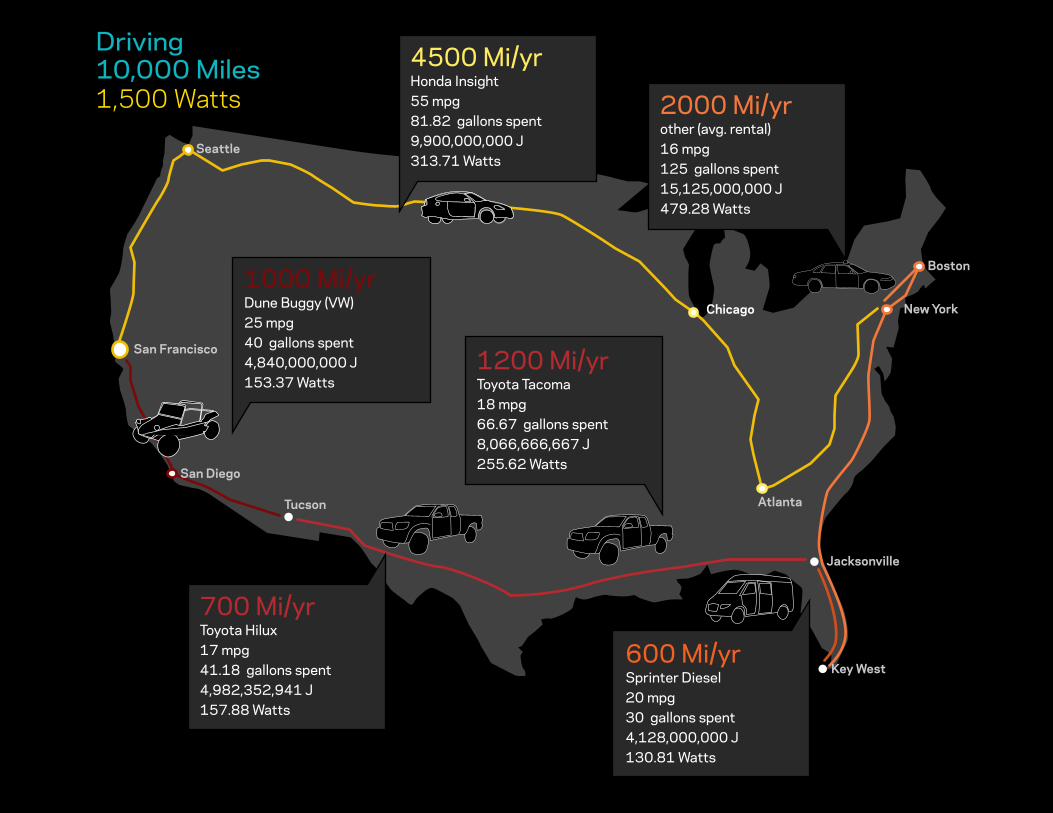
1200 Mi/yrToyota Tacoma18 mpg66.67 gallons spent8,066,666,667 J255.62 Watts
Driving10,000 Miles1,500 Watts
San Francisco
Seattle
Chicago New York
Atlanta
Jacksonville
Key West
Tucson
San Diego
1000 Mi/yrDune Buggy (VW)25 mpg40 gallons spent4,840,000,000 J153.37 Watts
Boston
4500 Mi/yrHonda Insight55 mpg81.82 gallons spent9,900,000,000 J313.71 Watts
600 Mi/yrSprinter Diesel20 mpg30 gallons spent4,128,000,000 J130.81 Watts
700 Mi/yrToyota Hilux17 mpg41.18 gallons spent4,982,352,941 J157.88 Watts
2000 Mi/yrother (avg. rental)16 mpg125 gallons spent15,125,000,000 J479.28 Watts
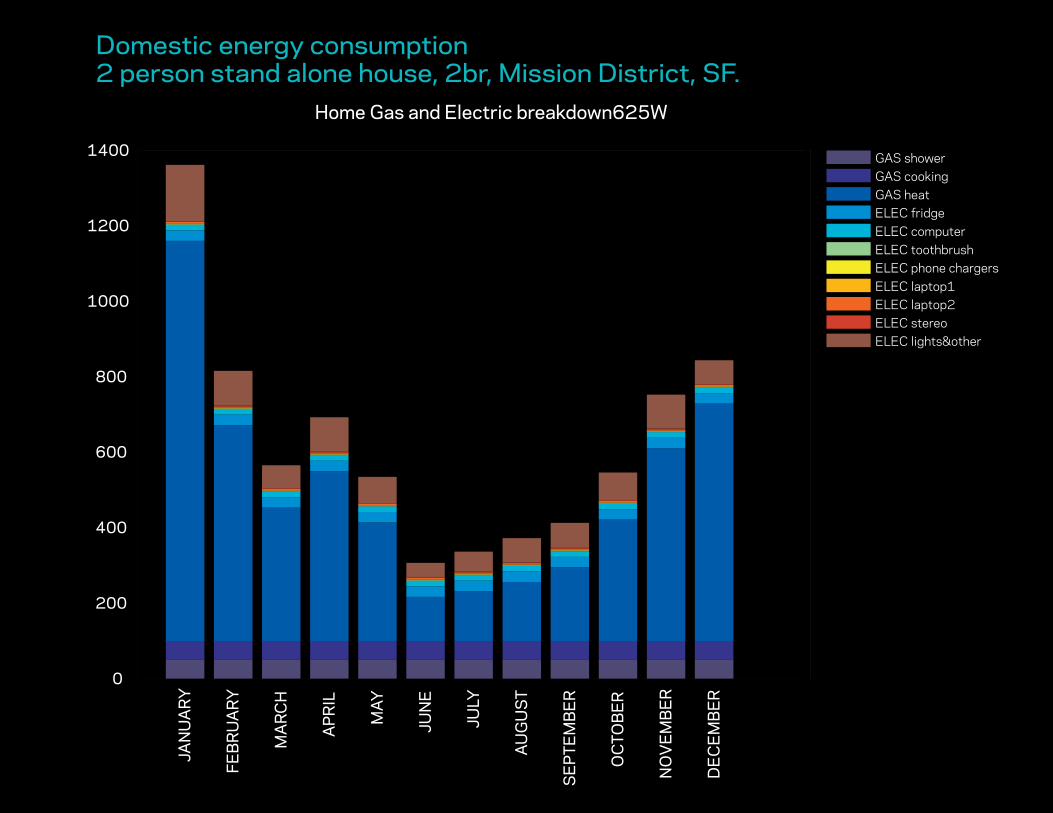
Domestic energy consumption 2 person stand alone house, 2br, Mission District, SF.
0
200
400
600
800
1000
1200
1400
JAN
UA
RY
FEB
RU
ARY
MA
RCH
APR
IL
MAY
JUN
E
JULY
AU
GU
ST
SEP
TEM
BER
OC
TOB
ER
NO
VEM
BER
DEC
EMB
ER
Home Gas and Electric breakdown625W
GAS showerGAS cookingGAS heatELEC fridgeELEC computerELEC toothbrushELEC phone chargersELEC laptop1ELEC laptop2ELEC stereoELEC lights&other
0
250
500
750
1000
1250
Jan feb mar apr may jun jul aug sep oct nov dec
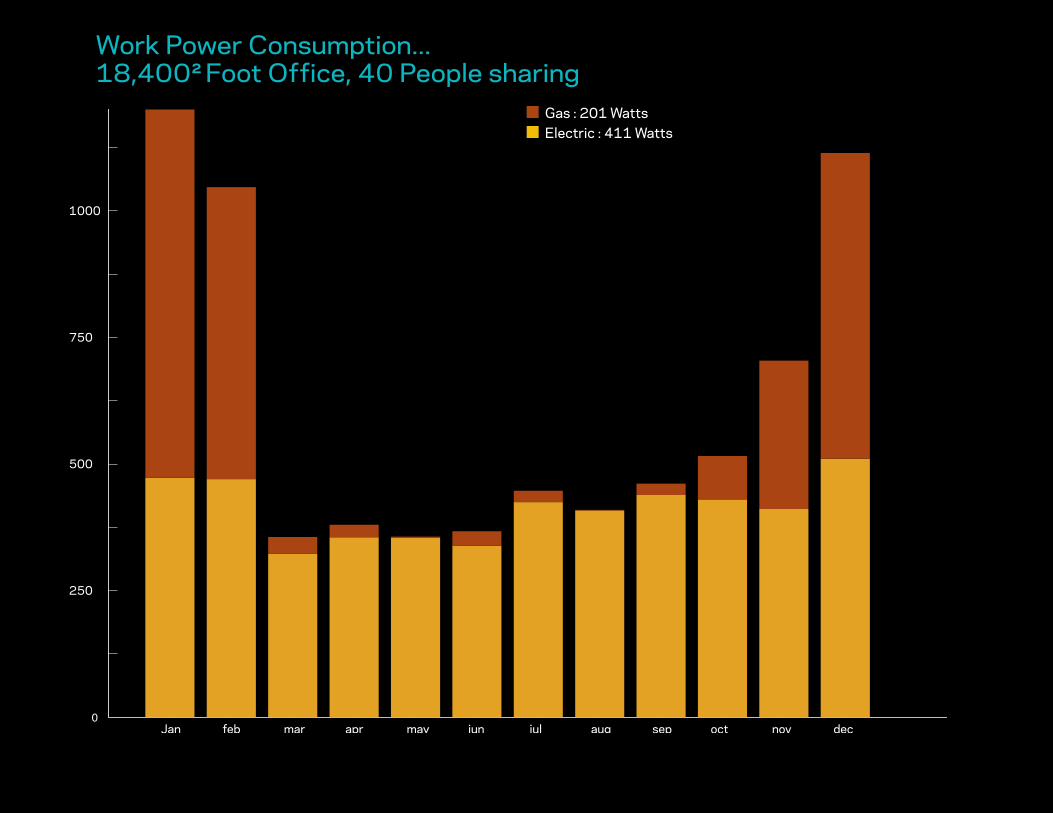
Work Power Consumption... 18,400² Foot Office, 40 People sharing
Gas : 201 WattsElectric : 411 Watts
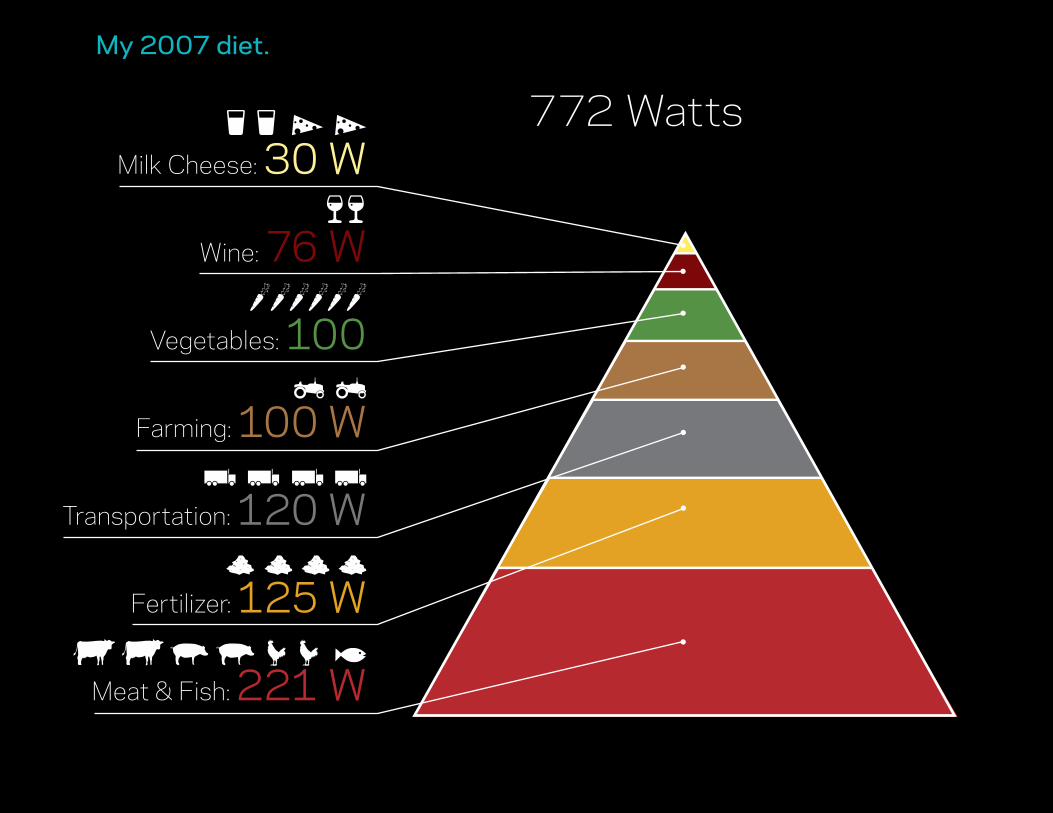
Milk Cheese: 30 W
Wine: 76 W
Vegetables: 100
Farming: 100 W
Transportation: 120 W
Fertilizer: 125 W
Meat & Fish: 221 W
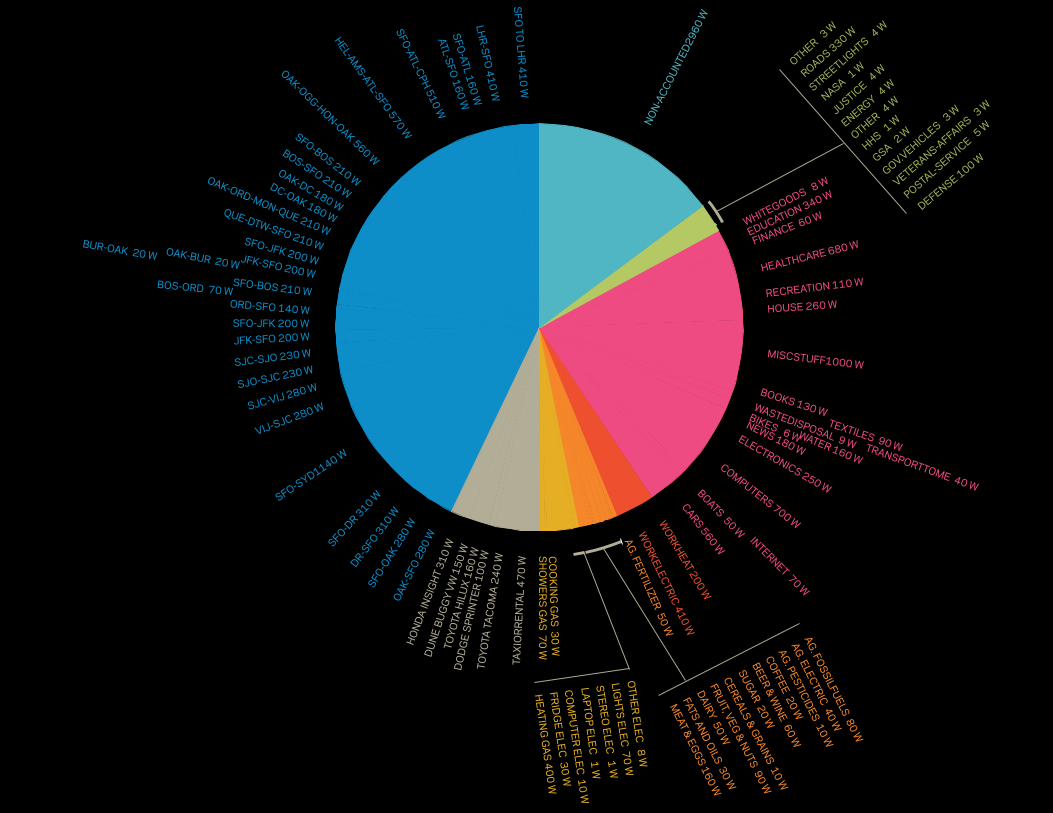
772 Watts
My 2007 diet.
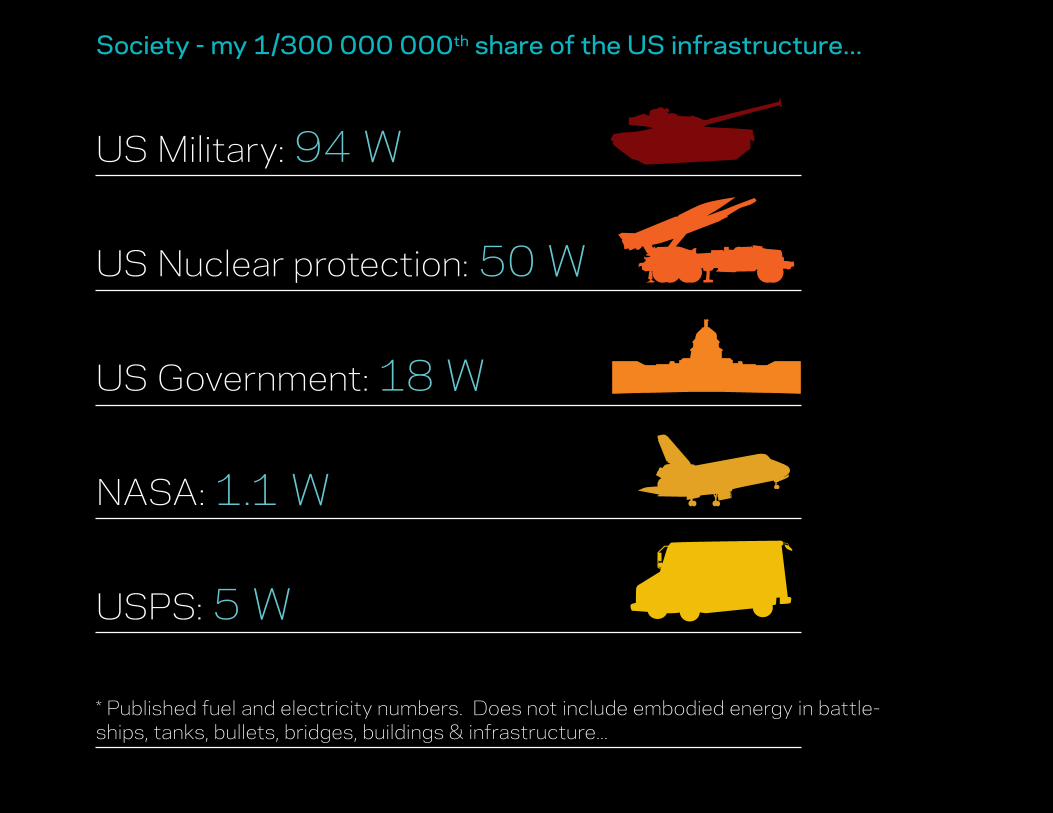
Society - my 1/300 000 000th share of the US infrastructure...
US Military: 94 W
US Nuclear protection: 50 W
US Government: 18 W
NASA: 1.1 W
USPS: 5 W
* Published fuel and electricity numbers. Does not include embodied energy in battle-ships, tanks, bullets, bridges, buildings & infrastructure...
Book
sheetsofpaper
framed art
CD
jewelcase
boardgame
New
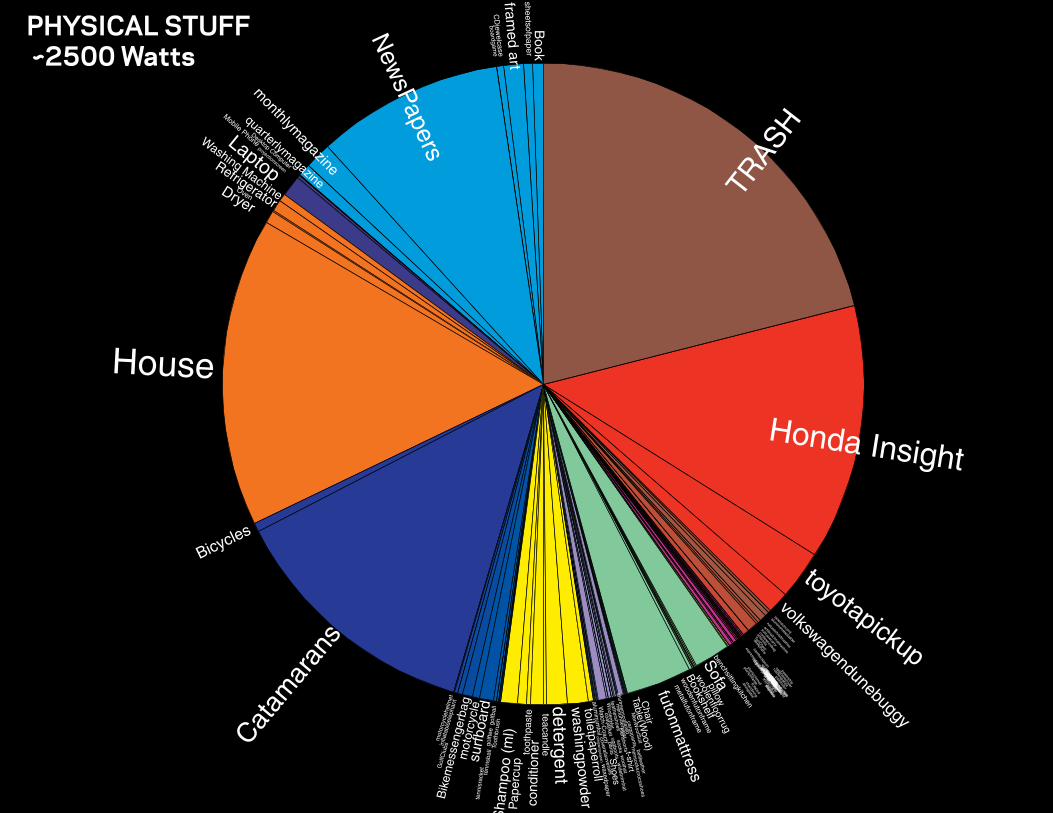
sPapers
monthlym
agazine
quarterlymagazine
projectionscreen
Mobile Phone
Desktop Computer
Laptop
Washing Machine
Refrigerator Oven
Dryer
House
Bicycles
Catam
aran
s
mot
orcy
cleh
elm
et
Gol
fClu
bs infla
tabl
eele
phan
t
Bik
emes
seng
erba
g m
otor
cycl
e su
rfbo
ard
golfb
all
golft
ee
tenn
isba
ll
tenn
isra
cket
Toot
hbru
sh
Sha
mpo
o (m
l) P
aper
cup
toot
hpas
te
cond
ition
er
teacandle detergentw
ashingpowder
toiletpaperroll clingw
rapsaran
aluminum
foil w
axedpaper S
hoes
Watch-C
oach W
oolenHat
t-shirt
pants coatjacket
socks woolhat
uggboots
crocsshoes
leathershoes w
idebrimhat
mensocks
menunderw
ear m
enshorts
shirtmenscollared
cargopants
coverallsoveralls
beltleather
MenW
oolSuit
Table(Wood)
Chair
futonmattress
metalfutonfram
e
woodenfutonfram
e
Bookshelf
woolenfloorrug
pillow
Sofabenchsittingkitchen
diningtable
chairdining sofabed
plantpotlarge
plantpotsmall stepstool
sidetable
KitchenPot
ricecooker
copperfryingpan
coppersaucepan kitchenknife
espressomachine
knifeblock
cuttingboard rollingpin
canopener
bottleopener
kitchenknives
coffeemug
tableknife
tablefork
teaspoon
soupspoons teapot
teakettle
sixcupFrench
butcherblock steelm
ug
ceramicm
ug
waterglass
saladplate bowl
dinnerplate
WineG
lass
cakestand
saladbowl
carvingset
woodenspoon
bamboospoon m
etalspatula rubberspatula
whisk key
paintroller
cellphonecover
powerstrip
deskphone
ToolChest
umbrella
conferencebag
suitcasecarry
artificialchristmastree
naturalchristmastree
aluminum
stepladder
extensioncord
volkswagendunebuggy
toyotapickup
Honda Insight
TRAS
H
PHYSICAL STUFF ~2500 Watts
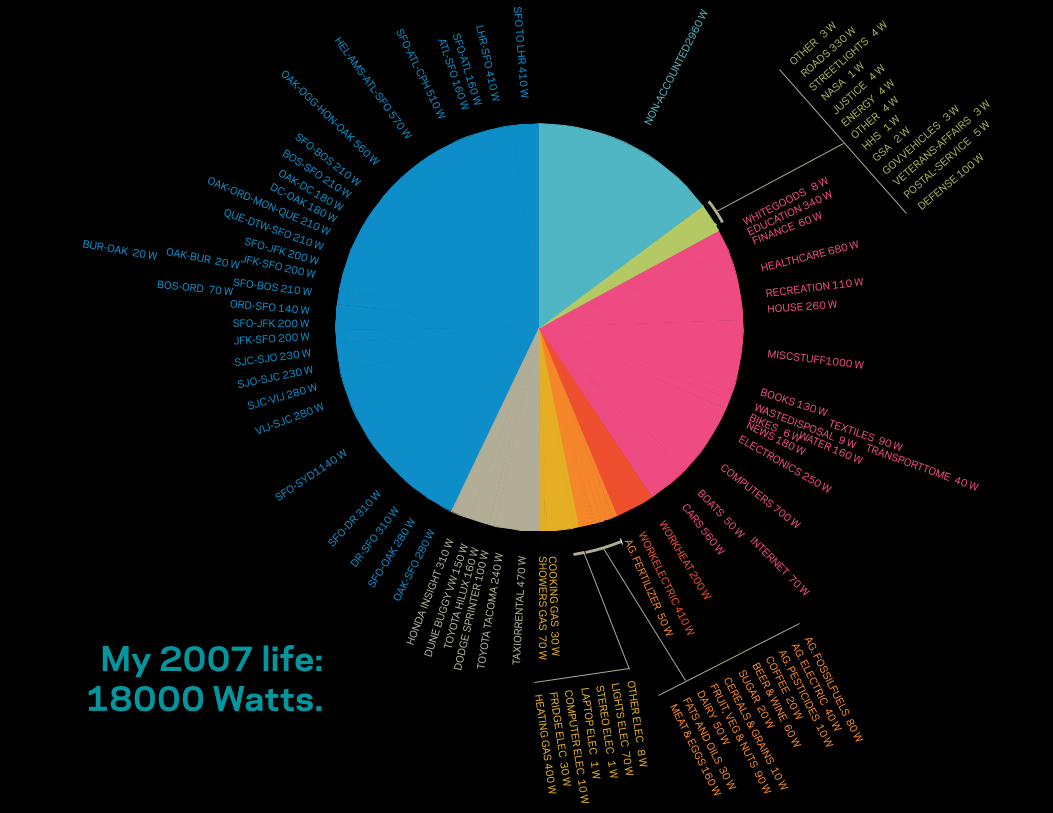
SFO
TO LH
R 4
10
W
LHR-S
FO 410 W
SFO-ATL 160 W
ATL-SFO 160 W
SFO-ATL-CPH 510 W
HEL-AMS-ATL-SFO 570 W
OAK-OGG-HON-OAK 560 W
SFO-BOS 210 W
BOS-SFO 210 W
OAK-DC 180 W
DC-OAK 180 W
OAK-ORD-MON-QUE 210 WQUE-DTW-SFO 210 WSFO-JFK 200 WJFK-SFO 200 W
OAK-BUR 20 W
BUR-OAK 20 W
SFO-BOS 210 WBOS-ORD 70 W
ORD-SFO 140 WSFO-JFK 200 W
JFK-SFO 200 W
SJC-SJO 230 W
SJO-SJC 230 W
SJC-VIJ 280 W
VIJ-SJC 280 W
SFO-SYD1140 W
SFO-DR 310 W
DR-SFO 3
10 W
SFO-O
AK 280 W
OAK
-SFO
280
W
'SFO TO LHR' 'LHR-SFO' 'SFO-ATL' 'ATL-SFO' 'SFO-ATL-CPH' 'HEL-AMS-ATL-SFO' 'OAK-OGG-HON-OAK' 'SFO-BOS' 'BOS-SFO' 'OAK-DC' 'DC-OAK' 'OAK-ORD-MON-QUE' 'QUE-DTW-SFO' 'SFO-JFK' 'JFK-SFO' 'OAK-BUR' 'BUR-OAK' 'SFO-BOS' 'BOS-ORD' 'ORD-SFO''SFO-JFK' 'JFK-SFO' 'SJC-SJO' 'SJO-SJC' 'SJC-VIJ' 'VIJ-SJC''SFO-SYD' 'SFO-DR' 'DR-SFO' 'SFO-OAK' 'OAK-SFO'
HO
ND
A IN
SIG
HT
310
W
DU
NE
BUG
GY
VW 1
50 W
TOYO
TA H
ILU
X 1
60 W
DO
DG
E S
PRIN
TER
100
WTO
YOTA
TA
CO
MA
240
W
TAX
IOR
REN
TAL
47
0 W
SH
OW
ERS
GA
S 7
0 W
CO
OK
ING
GA
S 3
0 W
HEATIN
G G
AS
400 WFR
IDG
E ELEC 30 W
CO
MPU
TER ELEC
10 WLA
PTOP ELEC
1 W
STER
EO ELEC
1 WLIG
HTS
ELEC 70 W
OTH
ER ELEC
8 W
MEAT & EG
GS 160 W
DAIRY 50 W
FATS AND OILS 30 W
FRUIT, VEG & NUTS 90 W
CEREALS & GRAINS 10 W
SUGAR 20 WBEER & W
INE 60 W
COFFEE 20 W
AG. PESTICIDES 10 W
AG. FERTILIZER 50 W
AG. ELECTRIC 40 W
AG. FO
SSILFUELS 80 W
WO
RKELECTRIC 410 W
WORKHEAT 200 W
CARS 560 W
BOATS 50 W
INTERNET 70 W
COMPUTERS 700 W
ELECTRONICS 250 W
NEWS 180 W
BIKES 6 WWATER 160 W
WASTEDISPOSAL 9 W TRANSPORTTOME 40 W
TEXTILES 90 W
BOOKS 130 W
MISCSTUFF1000 W
HOUSE 260 WRECREATION 110 W
HEALTHCARE 680 WFINANCE 60 WEDUCATION 340 W
WHITEGOODS 8 W
DEFENSE 100 W
ENERGY 4 W
GSA 2 W
HHS 1 W
JUSTICE 4
W
NASA 1 W
POSTAL-SERVIC
E 5 W
VETERANS-AFFAIRS 3 W
OTHER 4 W
STREETLIGHTS 4
W
GOV.VEHICLES 3
W
ROADS 330 W
OTHER 3 W
NON-
ACCO
UNTED
2960
W
My 2007 life:18000 Watts.
11333 7800
16800 6248
11300 12040
8783 12000 10167
2887 8067
17433 23600 11420
18000 25000
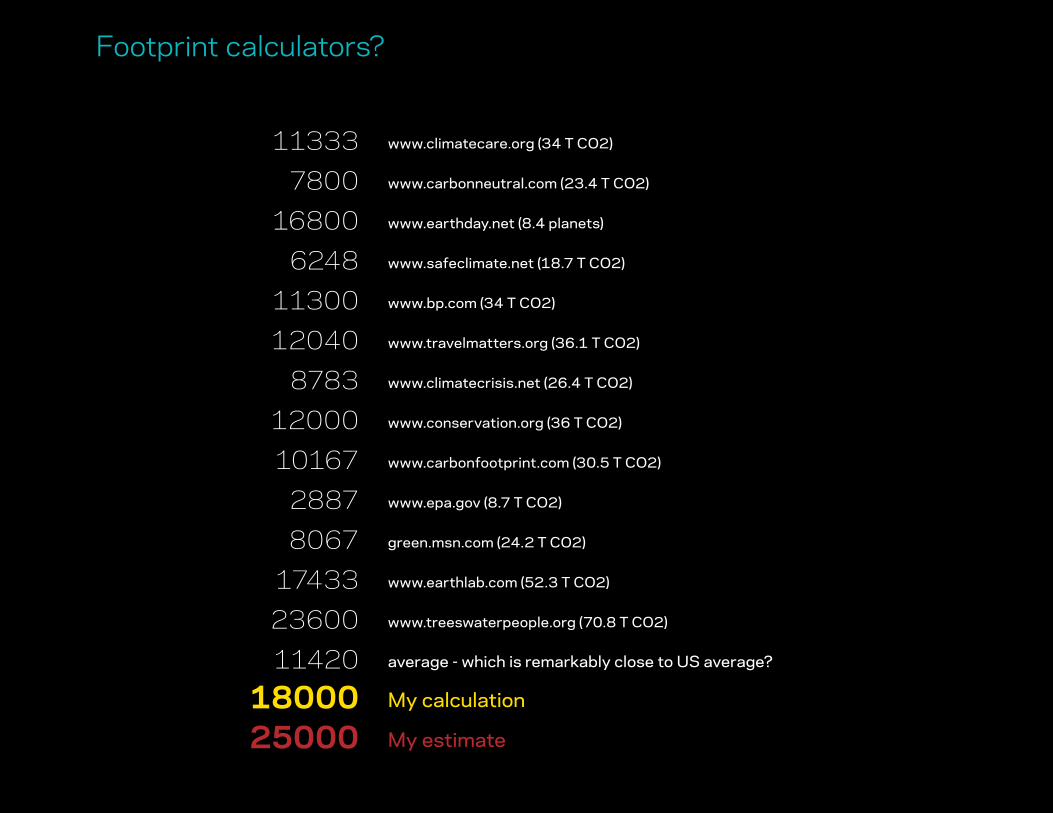
Footprint calculators?
www.climatecare.org (34 T CO2)
www.carbonneutral.com (23.4 T CO2)
www.earthday.net (8.4 planets)
www.safeclimate.net (18.7 T CO2)
www.bp.com (34 T CO2)
www.travelmatters.org (36.1 T CO2)
www.climatecrisis.net (26.4 T CO2)
www.conservation.org (36 T CO2)
www.carbonfootprint.com (30.5 T CO2)
www.epa.gov (8.7 T CO2)
green.msn.com (24.2 T CO2)
www.earthlab.com (52.3 T CO2)
www.treeswaterpeople.org (70.8 T CO2)
average - which is remarkably close to US average?
My calculation
My estimate

Me
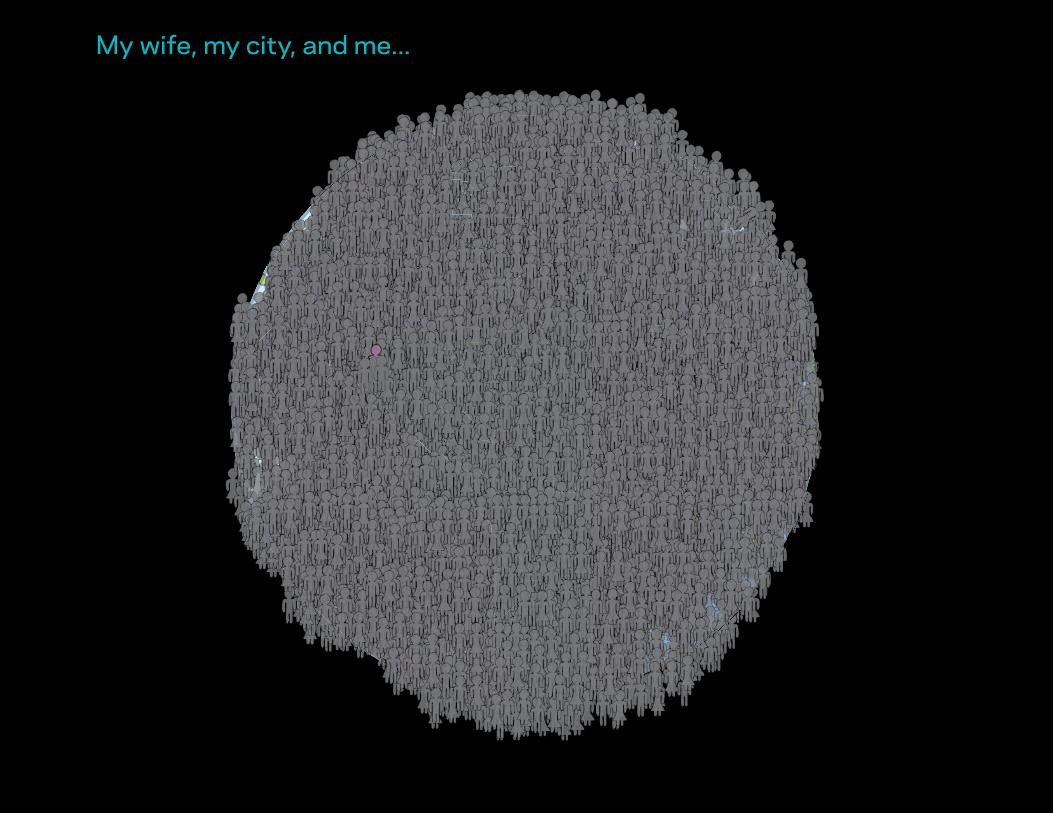
My wife, my city, and me...
0 10 20 30 40 500
5
10
15
20
25
30
35
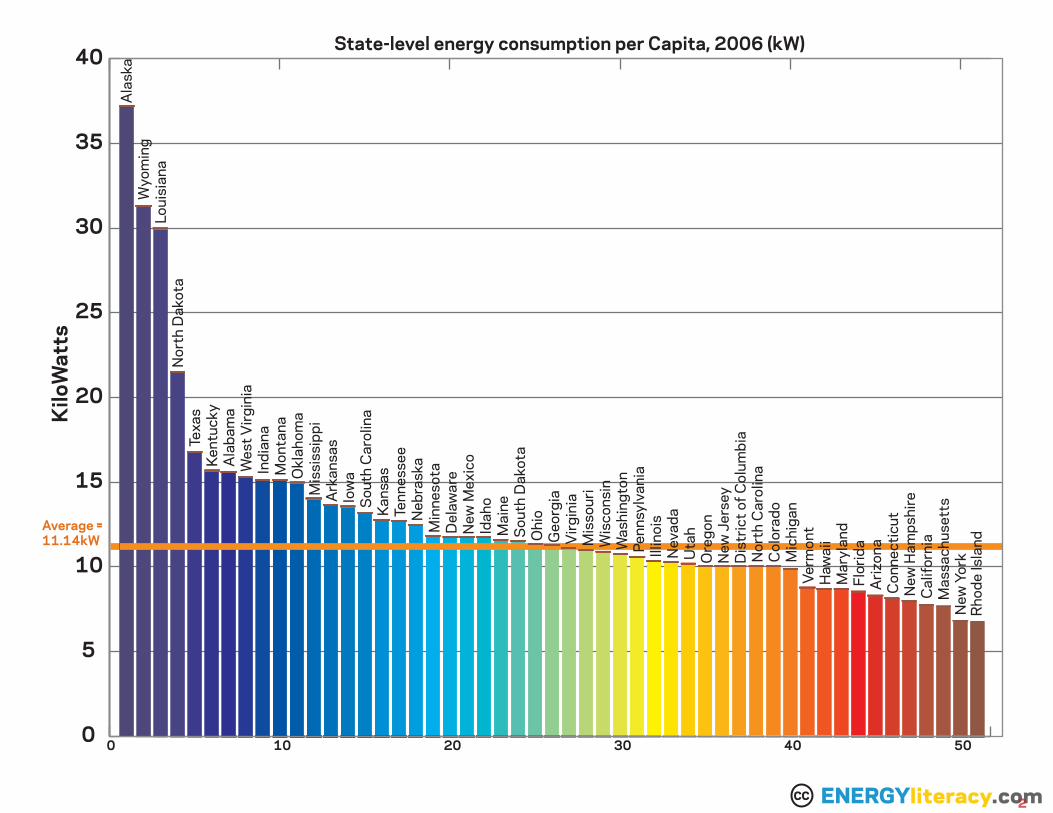
40State-level energy consumption per Capita, 2006 (kW)
Kilo
Wat
ts
Ala
ska
Wyo
min
gLo
uisi
ana
Nor
th D
akot
aTe
xas
Kent
ucky
Ala
bam
aW
est V
irgin
iaIn
dian
aM
onta
naO
klah
oma
Mis
siss
ippi
Ark
ansa
sIo
wa
Sou
th C
arol
ina
Kans
asTe
nnes
see
Neb
rask
aM
inne
sota
Del
awar
eN
ew M
exic
oId
aho
Mai
neS
outh
Dak
ota
Ohi
oG
eorg
iaV
irgin
iaM
isso
uri
Wis
cons
inW
ashi
ngto
nPe
nnsy
lvan
iaIll
inoi
sN
evad
aU
tah
Ore
gon
New
Jer
sey
Dis
tric
t of C
olum
bia
Nor
th C
arol
ina
Col
orad
oM
ichi
gan
Verm
ont
Haw
aii
Mar
ylan
dFl
orid
aA
rizon
aC
onne
ctic
utN
ew H
amps
hire
Cal
iforn
iaM
assa
chus
etts
New
Yor
kR
hode
Isla
nd
ENERGYliteracy.com2CC
Average = 11.14kW
0 10 20 30 40 50
5
10
15
20
25
30
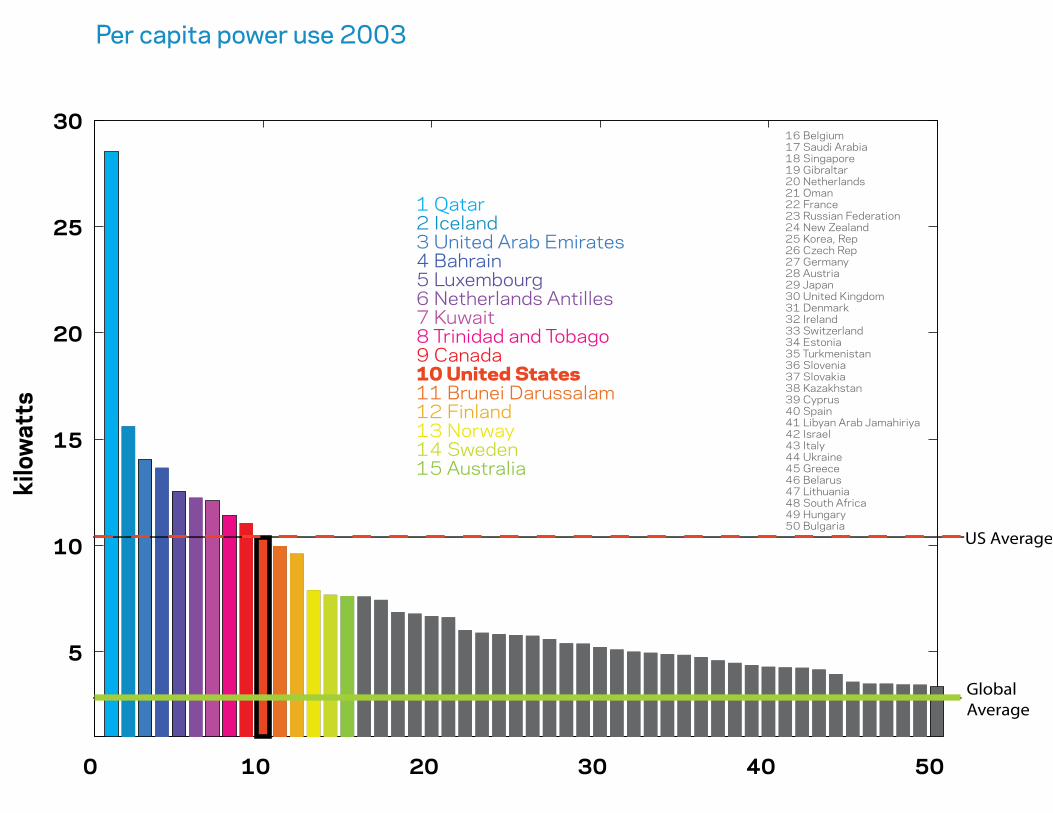
1 Qatar2 Iceland3 United Arab Emirates4 Bahrain5 Luxembourg6 Netherlands Antilles7 Kuwait8 Trinidad and Tobago9 Canada10 United States11 Brunei Darussalam12 Finland13 Norway14 Sweden15 Australia
16 Belgium17 Saudi Arabia18 Singapore19 Gibraltar20 Netherlands21 Oman22 France23 Russian Federation24 New Zealand25 Korea, Rep26 Czech Rep27 Germany28 Austria29 Japan30 United Kingdom31 Denmark32 Ireland33 Switzerland34 Estonia35 Turkmenistan36 Slovenia37 Slovakia38 Kazakhstan39 Cyprus40 Spain41 Libyan Arab Jamahiriya42 Israel43 Italy44 Ukraine45 Greece46 Belarus47 Lithuania48 South Africa49 Hungary50 Bulgaria
kilo
wat
tsPer Capita Energy Use 2003
US Average.
Global Average
Per capita power use 2003
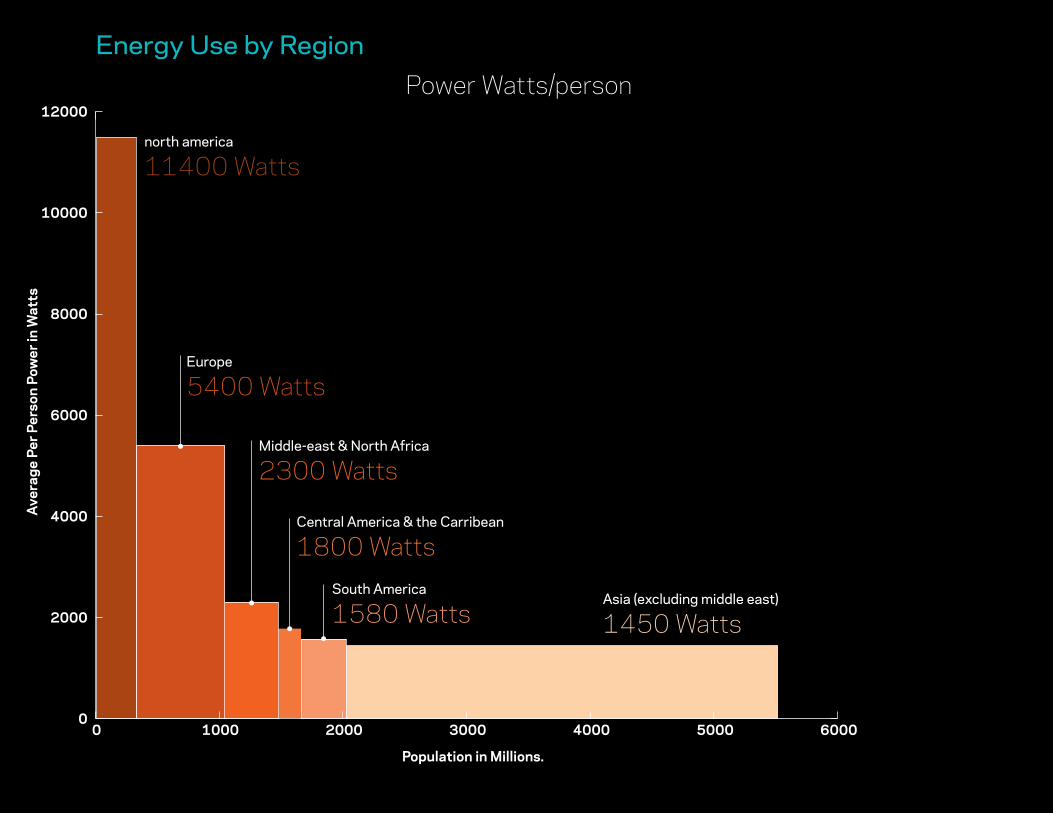
0 1000 2000 3000 4000 5000 60000
2000
4000
6000
8000
10000
12000
energy by region [NorAmer-Eur-MiddEast + NorAfr-CenAme & Car+SouAme+Asia(ex MidEst) ]
Ave
rage
Per
Per
son
Pow
er in
Wat
ts
Population in Millions.
Asia (excluding middle east)
1450 Watts
Central America & the Carribean
1800 WattsSouth America
1580 Watts
Middle-east & North Africa
2300 Watts
Europe
5400 Watts
north america
11400 Watts
Energy Use by RegionPower Watts/person
"The Game Plan" slideset release 1.01, March 21 2008 203
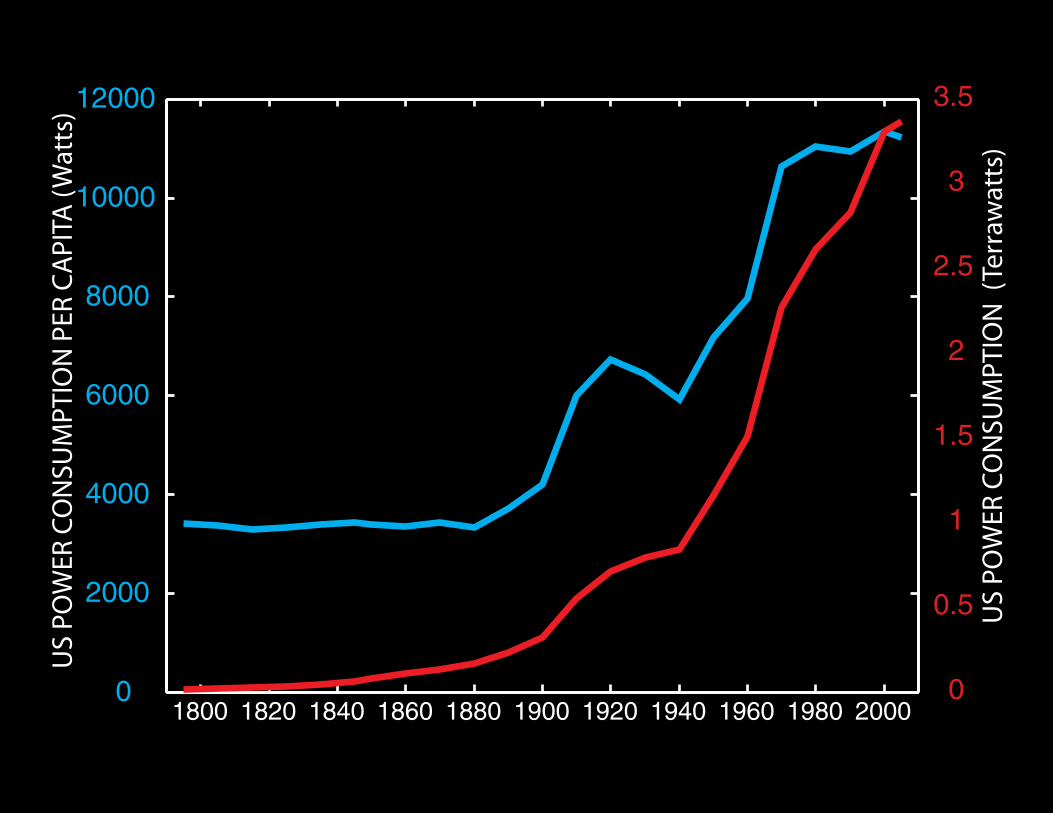
1800 1820 1840 1860 1880 1900 1920 1940 1960 1980 20000
2000
4000
6000
8000
10000
12000
0
0.5
1
1.5
2
2.5
3
3.5U
S PO
WER
CO
NSU
MPT
ION
PER
CA
PITA
(Wat
ts)
US
POW
ER C
ON
SUM
PTIO
N (
Terr
awat
ts)
"The Game Plan" slideset release 1.01, March 21 2008 205
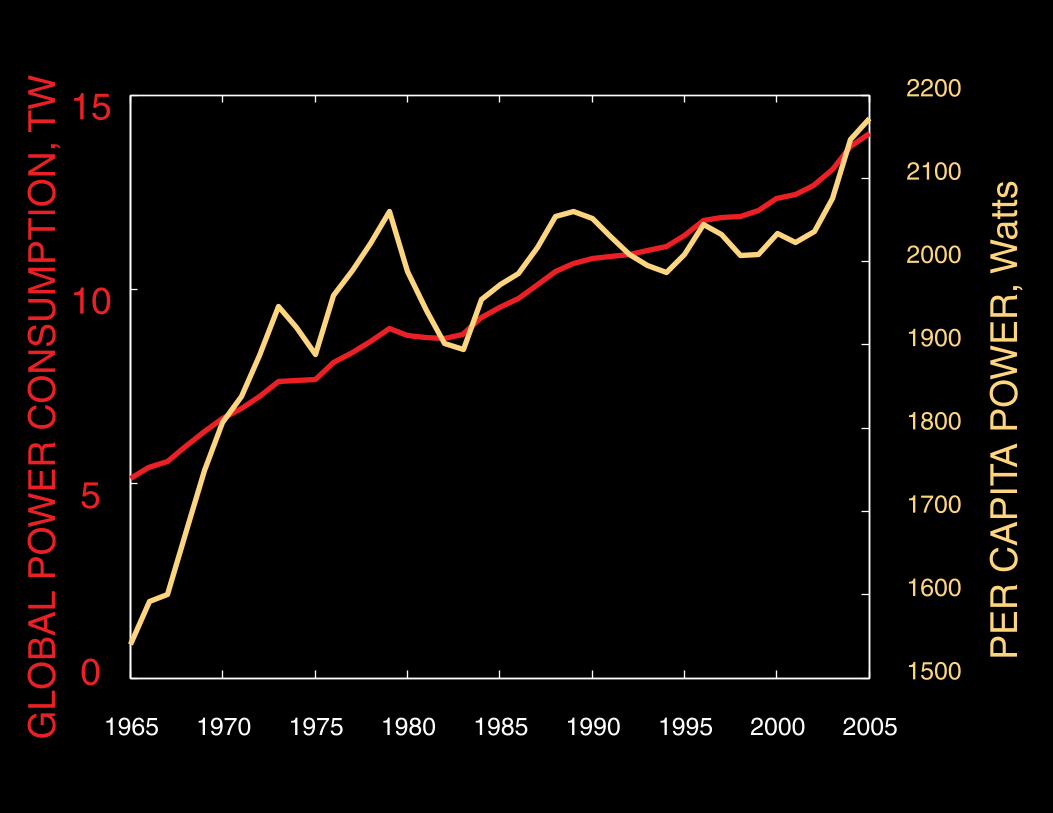
1965 1970 1975 1980 1985 1990 1995 2000 2005
0
5
10
15
1500
1600
1700
1800
1900
2000
2100
2200
GLO
BA
L P
OW
ER
CO
NS
UM
PT
ION
, TW
PE
R C
AP
ITA
PO
WE
R, W
atts
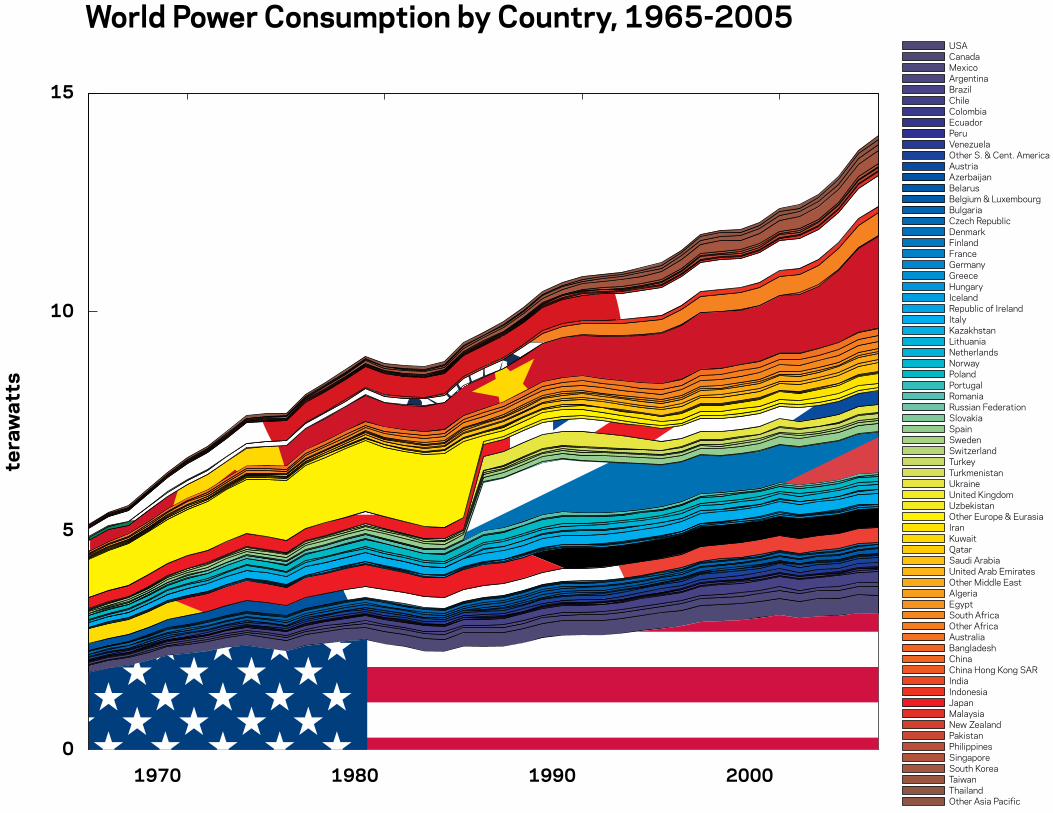
1970 1980 1990 20000
5
10
15
year
tera
wat
tsWorld Power Consumption by Country, 1965-2005
USACanadaMexicoArgentinaBrazilChileColombiaEcuadorPeruVenezuelaOther S. & Cent. AmericaAustriaAzerbaijanBelarusBelgium & LuxembourgBulgariaCzech RepublicDenmarkFinlandFranceGermanyGreeceHungaryIcelandRepublic of IrelandItalyKazakhstanLithuaniaNetherlandsNorwayPolandPortugalRomaniaRussian FederationSlovakiaSpainSwedenSwitzerlandTurkeyTurkmenistanUkraineUnited KingdomUzbekistanOther Europe & EurasiaIranKuwaitQatarSaudi ArabiaUnited Arab EmiratesOther Middle EastAlgeriaEgyptSouth AfricaOther AfricaAustraliaBangladeshChinaChina Hong Kong SARIndiaIndonesiaJapanMalaysiaNew ZealandPakistanPhilippinesSingaporeSouth KoreaTaiwanThailandOther Asia Pacific
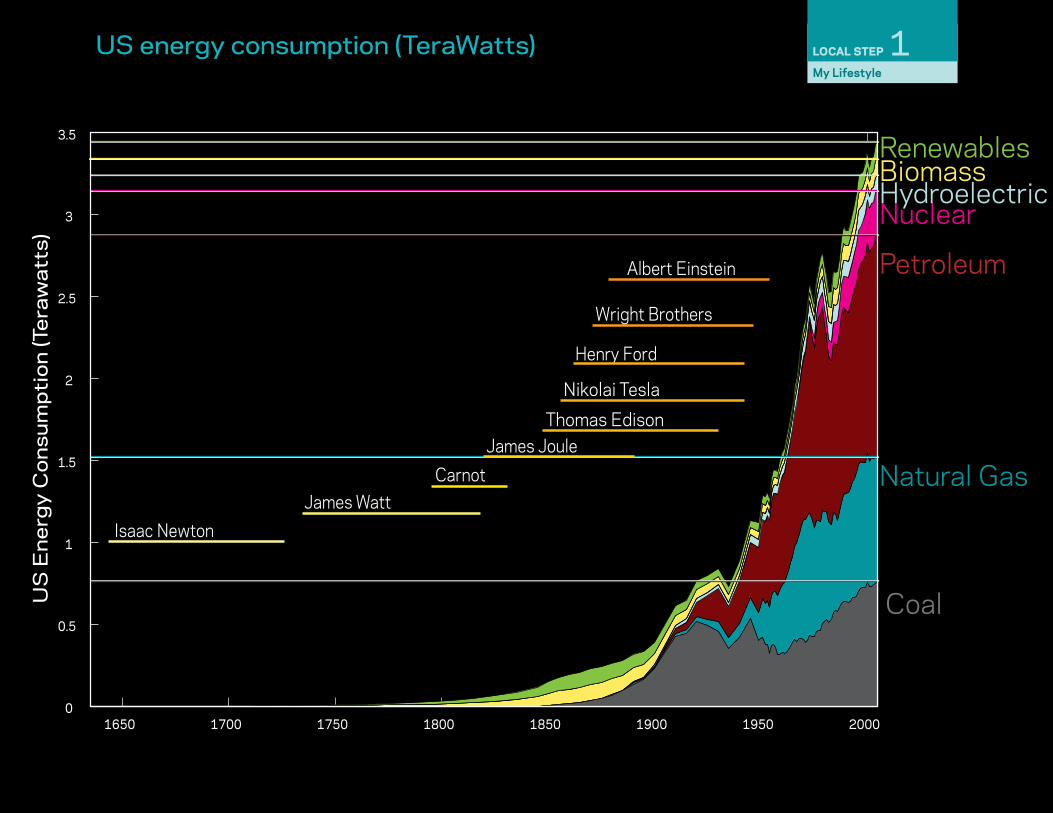
1650 1700 1750 1800 1850 1900 1950 20000
0.5
1
1.5
2
2.5
3
3.5
US
Ene
rgy
Con
sum
ptio
n (T
eraw
atts
)
Isaac Newton
CarnotJames Watt
Henry Ford
Wright Brothers
Albert Einstein
Nikolai TeslaThomas Edison
James Joule
US energy consumption (TeraWatts)
Coal
Natural Gas
Renewables
Petroleum
NuclearHydroelectricBiomass
My Lifestyle
LOCAL STEP 1
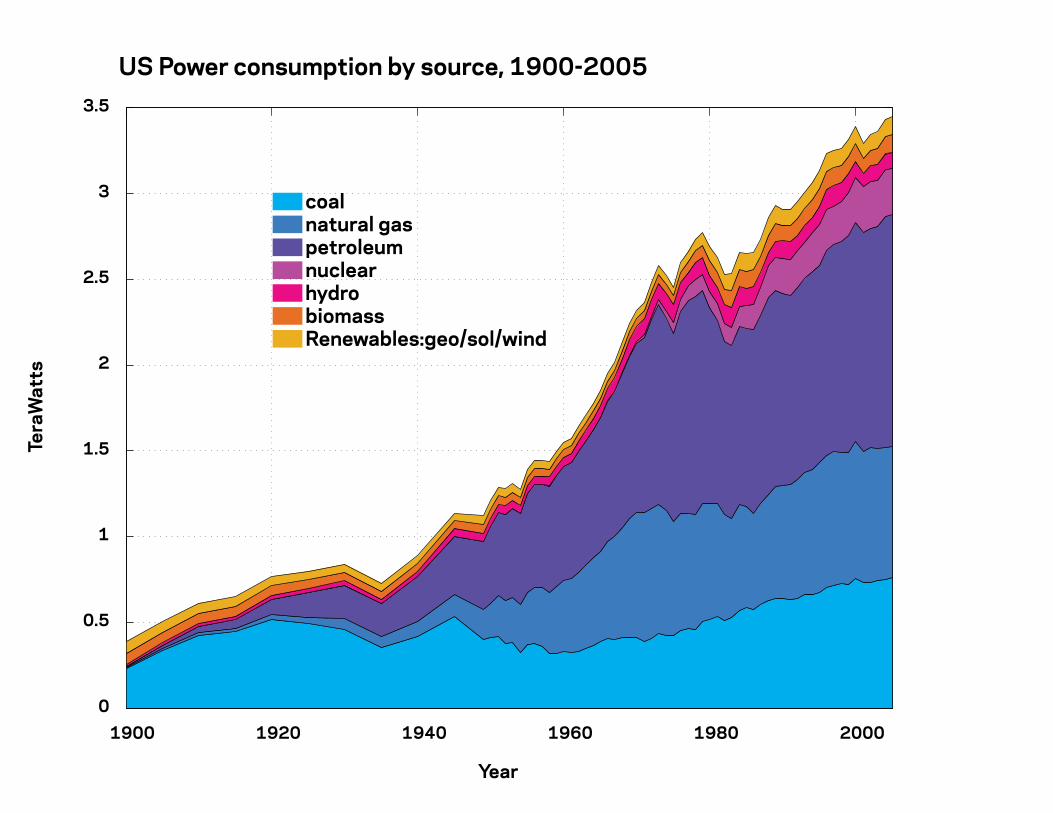
1900 1920 1940 1960 1980 20000
0.5
1
1.5
2
2.5
3
3.5
US Power consumption by source, 1900-2005
Year
Tera
Wat
ts
coalnatural gaspetroleumnuclearhydrobiomassRenewables:geo/sol/wind
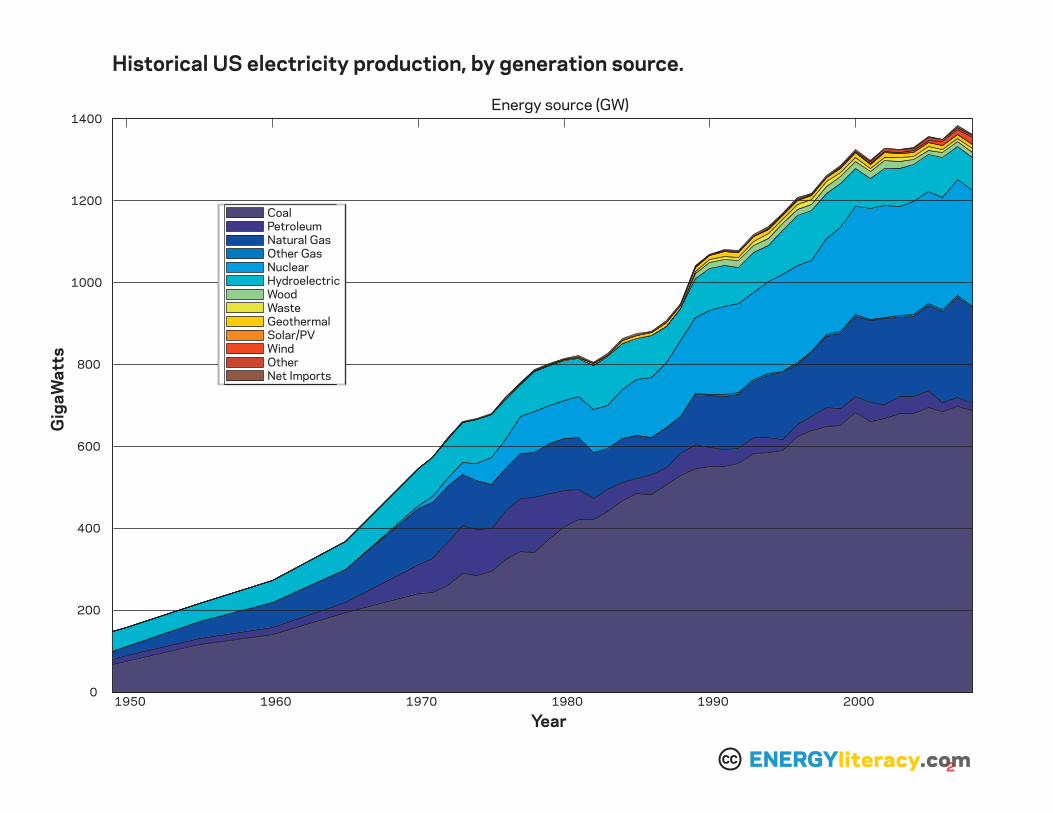
1950 1960 1970 1980 1990 20000
200
400
600
800
1000
1200
1400Energy source (GW)
Gig
aWat
ts
Year
Historical US electricity production, by generation source.
ENERGYliteracy.com2CC
CoalPetroleumNatural GasOther GasNuclearHydroelectricWoodWasteGeothermalSolar/PVWindOtherNet Imports
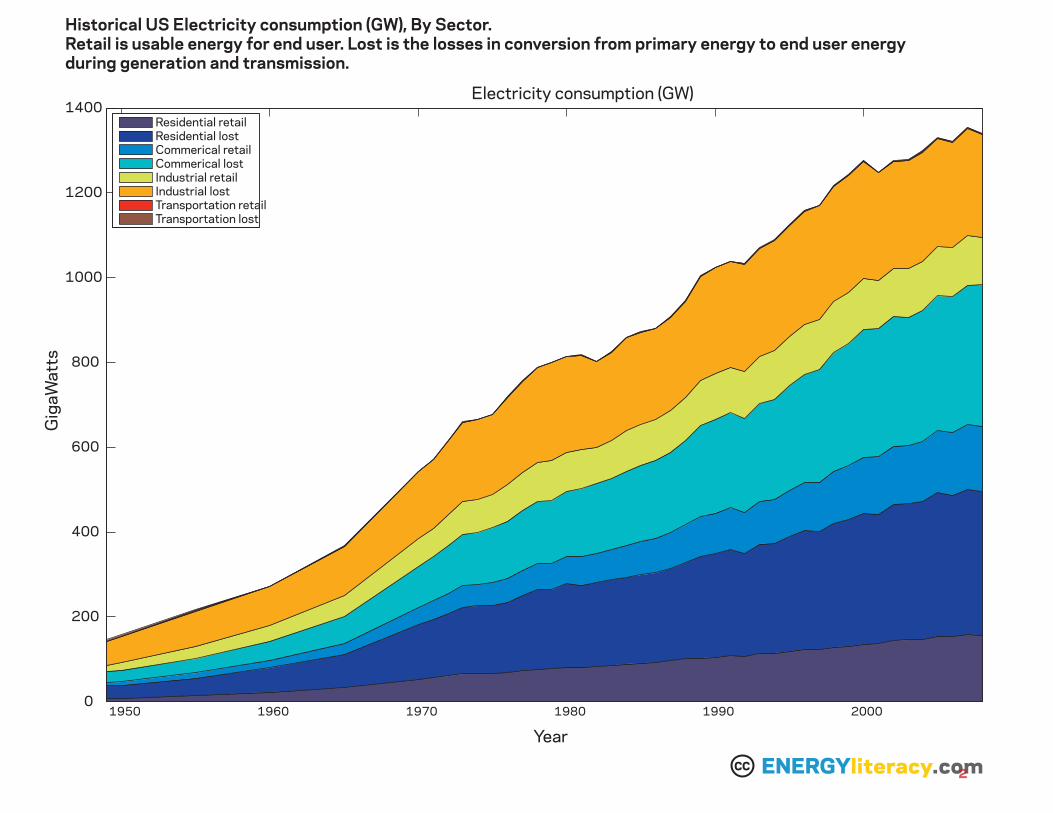
1950 1960 1970 1980 1990 20000
200
400
600
800
1000
1200
1400Electricity consumption (GW)
Gig
aWat
ts
Year
Residential retailResidential lostCommerical retailCommerical lostIndustrial retailIndustrial lostTransportation retailTransportation lost
ENERGYliteracy.com2CC
Historical US Electricity consumption (GW), By Sector.Retail is usable energy for end user. Lost is the losses in conversion from primary energy to end user energy during generation and transmission.
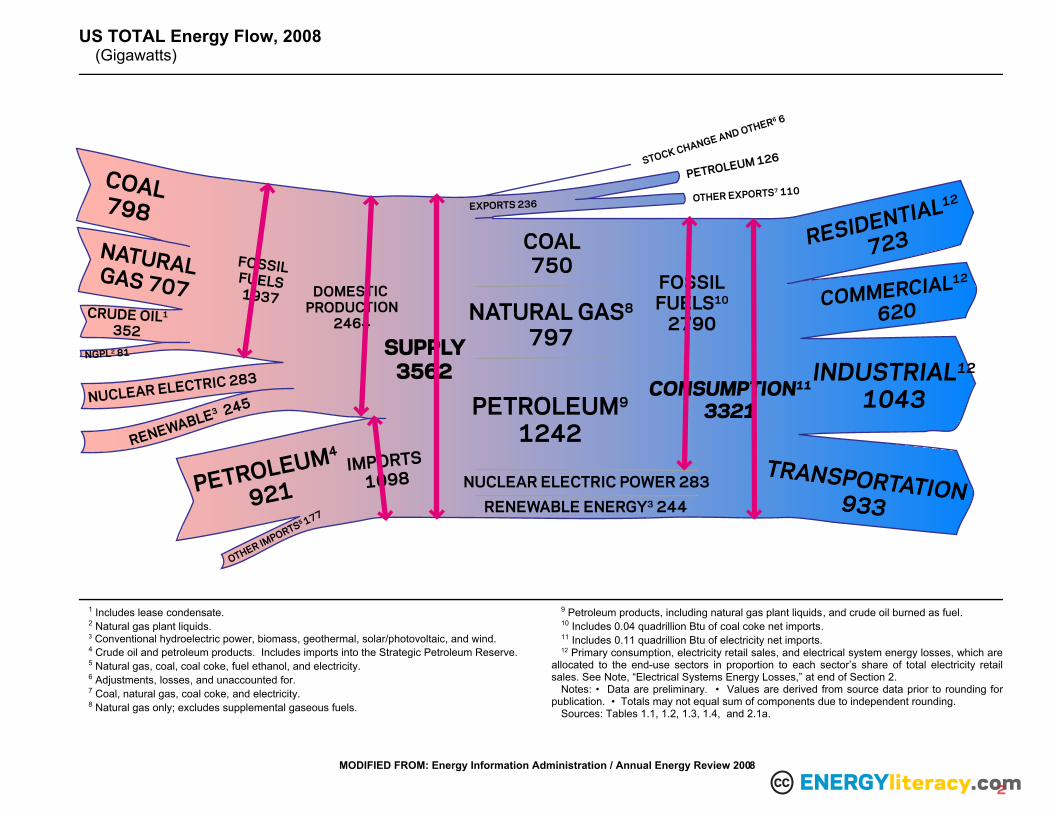
US TOTAL Energy Flow, 2008(Gigawatts)
MODIFIED FROM: Energy Information Administration / Annual Energy Review 2008
1 Includes lease condensate.2 Natural gas plant liquids.3 Conventional hydroelectric power, biomass, geothermal, solar/photovoltaic, and wind.4 Crude oil and petroleum products. Includes imports into the Strategic Petroleum Reserve.5 Natural gas, coal, coal coke, fuel ethanol, and electricity.6 Adjustments, losses, and unaccounted for.7 Coal, natural gas, coal coke, and electricity.8 Natural gas only; excludes supplemental gaseous fuels.
9 Petroleum products, including natural gas plant liquids, and crude oil burned as fuel.10 Includes 0.04 quadrillion Btu of coal coke net imports.11 Includes 0.11 quadrillion Btu of electricity net imports.12 Primary consumption, electricity retail sales, and electrical system energy losses, which are
allocated to the end-use sectors in proportion to each sector’s share of total electricity retailsales. See Note, “Electrical Systems Energy Losses,” at end of Section 2.
Notes: • Data are preliminary. • Values are derived from source data prior to rounding forpublication. • Totals may not equal sum of components due to independent rounding.
Sources: Tables 1.1, 1.2, 1.3, 1.4, and 2.1a.
COAL798
NATURALGAS 707CRUDE OIL1
352NGPL2 81
NUCLEAR ELECTRIC 283
RENEWABLE3 245
PETROLEUM4
921
OTHER IMPORTS5 177
IMPORTS
1098
FOSSIL FUELS 1937 DOMESTIC
PRODUCTION2464
SUPPLY3562
EXPORTS 236
COAL750
NATURAL GAS8
797
PETROLEUM9
1242
NUCLEAR ELECTRIC POWER 283RENEWABLE ENERGY3 244
STOCK CHANGE AND OTHER6 6
PETROLEUM 126
OTHER EXPORTS7 110
FOSSILFUELS10
2790
CONSUMPTION113321
RESIDENTIA
L12
723
COMMERCIAL12
620
INDUSTRIAL121043
TRANSPORTATION933
ENERGYliteracy.com2CC
MODIFIED FROM : Energy Information Administration / Annual Energy Review 2008
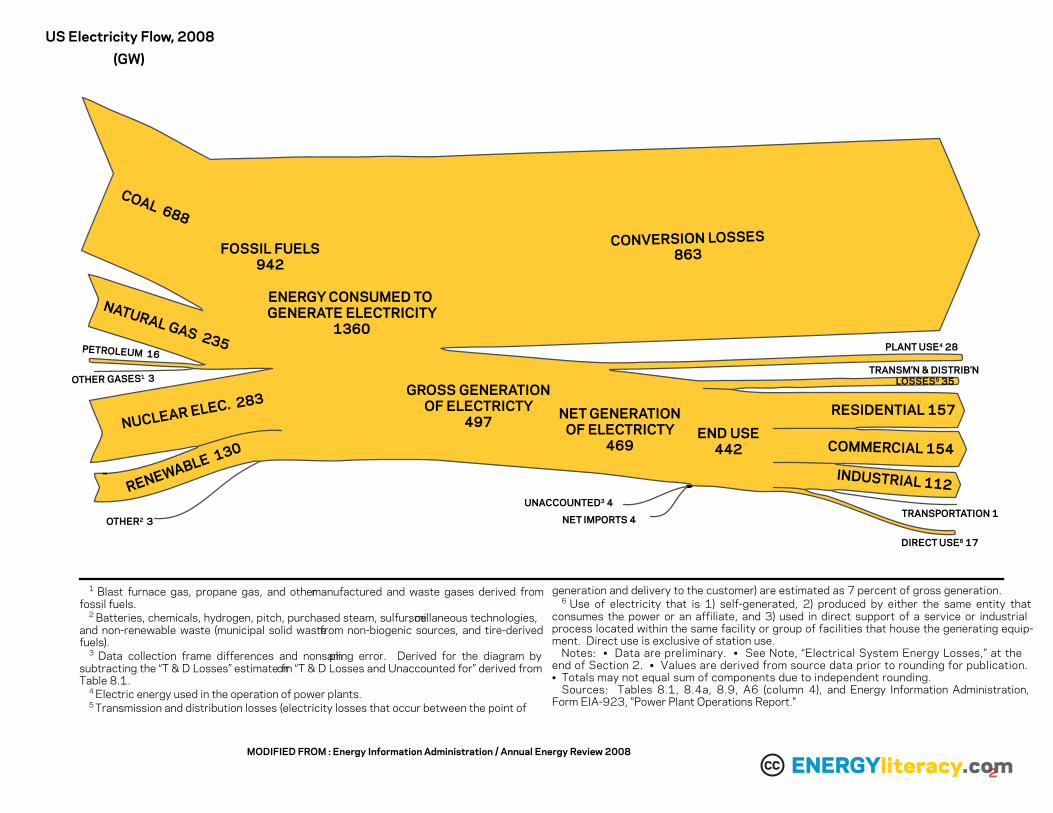
1 Blast furnace gas, propane gas, and other manufactured and waste gases derived fromfossil fuels.
2 Batteries, chemicals, hydrogen, pitch, purchased steam, sulfur, miscellaneous technologies,and non-renewable waste (municipal solid waste from non-biogenic sources, and tire-derivedfuels).
3 Data collection frame differences and nonsampling error. Derived for the diagram bysubtracting the “T & D Losses” estimate from “T & D Losses and Unaccounted for” derived fromTable 8.1.
4 Electric energy used in the operation of power plants.5 Transmission and distribution losses (electricity losses that occur between the point of
generation and delivery to the customer) are estimated as 7 percent of gross generation.6 Use of electricity that is 1) self-generated, 2) produced by either the same entity that
consumes the power or an affiliate, and 3) used in direct support of a service or industrialprocess located within the same facility or group of facilities that house the generating equip-ment. Direct use is exclusive of station use.
Notes: • Data are preliminary. • See Note, “Electrical System Energy Losses,” at theend of Section 2. • Values are derived from source data prior to rounding for publication.• Totals may not equal sum of components due to independent rounding.
Sources: Tables 8.1, 8.4a, 8.9, A6 (column 4), and Energy Information Administration,Form EIA-923, "Power Plant Operations Report."
ENERGYliteracy.com2CC
US Electricity Flow, 2008(GW)
COAL 688
NATURAL GAS 235 PETROLEUM 16
OTHER GASES1 3
NUCLEAR ELEC. 283
RENEWABLE 130
OTHER2 3
FOSSIL FUELS942
ENERGY CONSUMED TO GENERATE ELECTRICITY
1360
CONVERSION LOSSES863
GROSS GENERATIONOF ELECTRICTY
497 NET GENERATIONOF ELECTRICTY
469END USE
442
UNACCOUNTED3 4
NET IMPORTS 4
RESIDENTIAL 157
DIRECT USE6 17
TRANSPORTATION 1
INDUSTRIAL 112
COMMERCIAL 154
TRANSM’N & DISTRIB’N LOSSES5 35
PLANT USE4 28
0
200
400
600
800
1000
1200
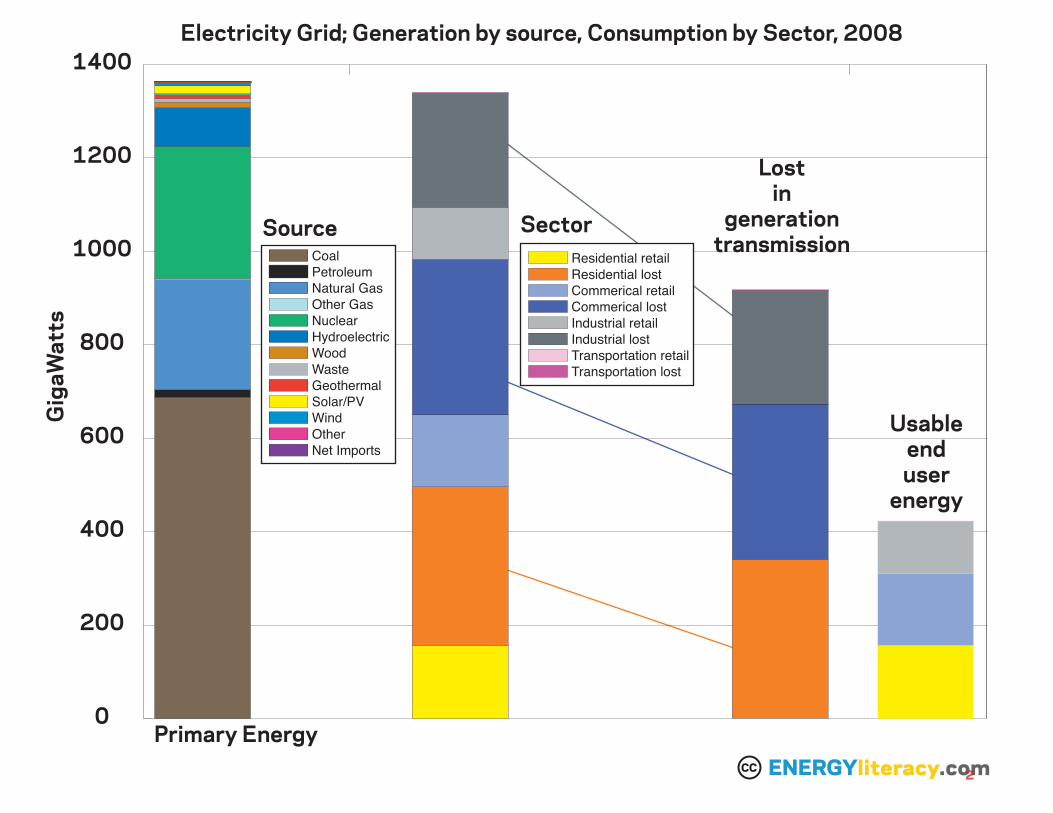
1400Electricity Grid; Generation by source, Consumption by Sector, 2008
Gig
aWat
ts
Residential retailResidential lostCommerical retailCommerical lostIndustrial retailIndustrial lostTransportation retailTransportation lost
CoalPetroleumNatural GasOther GasNuclearHydroelectricWoodWasteGeothermalSolar/PVWindOtherNet Imports
Lostin
generationtransmission
Usableenduser
energy
Source Sector
Primary EnergyENERGYliteracy.com2CC
0
1
2
3
4
5E
nerg
y (T
W)
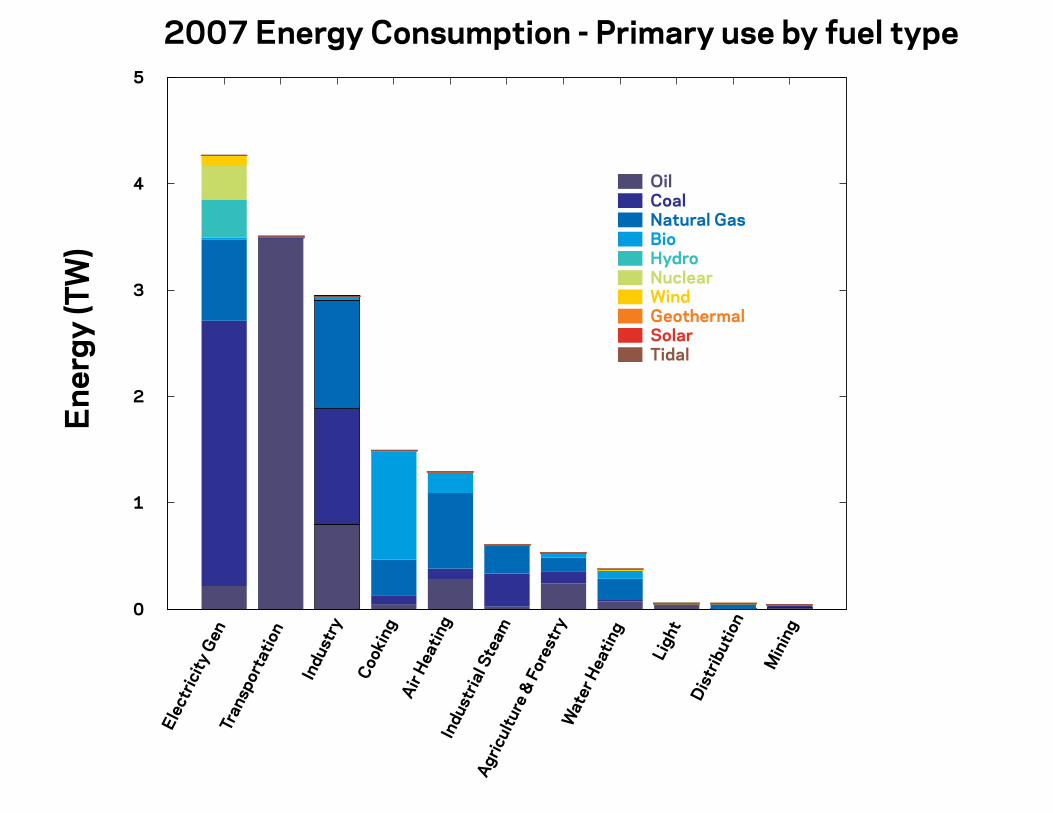
2007 Energy Consumption - Primary use by fuel type
Elec
tric
ity G
enTr
ansp
orta
tion
Indu
stry
Cooki
ngAir
Heatin
gIn
dust
rial S
team
Agric
ultu
re &
For
estr
yW
ater
Hea
ting
Ligh
tDis
trib
utio
n
Min
ing
OilCoalNatural GasBioHydroNuclearWindGeothermalSolarTidal
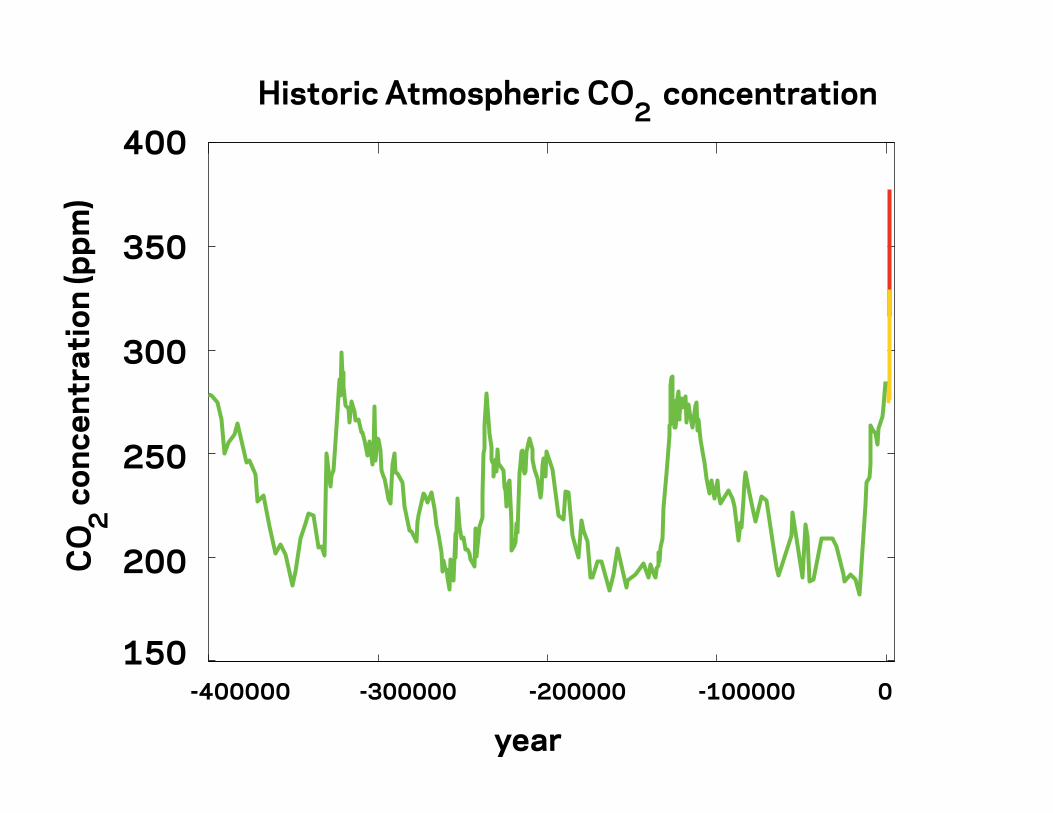
-400000 -300000 -200000 -100000 0150
200
250
300
350
400
year
CO 2 c
once
ntra
tion
(ppm
)Historic Atmospheric CO2 concentration
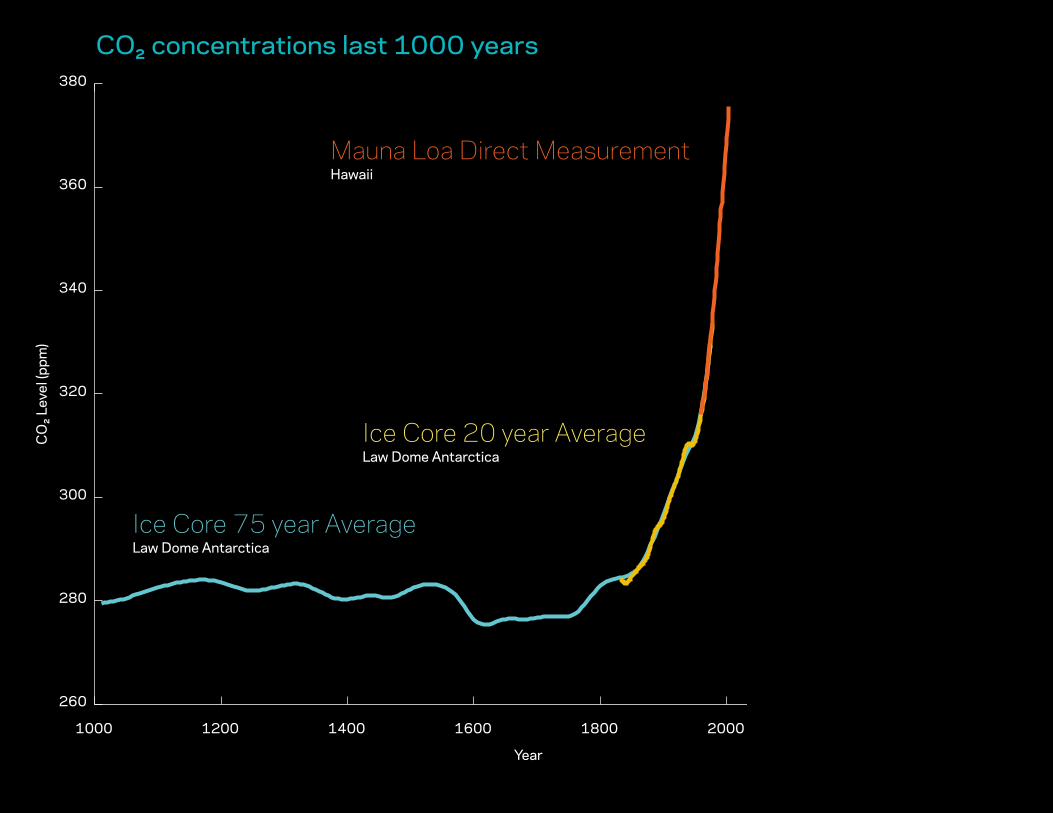
1000 1200 1400 1600 1800 2000 2200
260
280
300
320
340
360
380
time
CO
2 Lev
el (p
pm)
CO2 concentrations last 1000 years
Ice Core 75 year AverageLaw Dome Antarctica
Ice Core 20 year AverageLaw Dome Antarctica
Mauna Loa Direct MeasurementHawaii
CO
2 Lev
el (p
pm)
Year
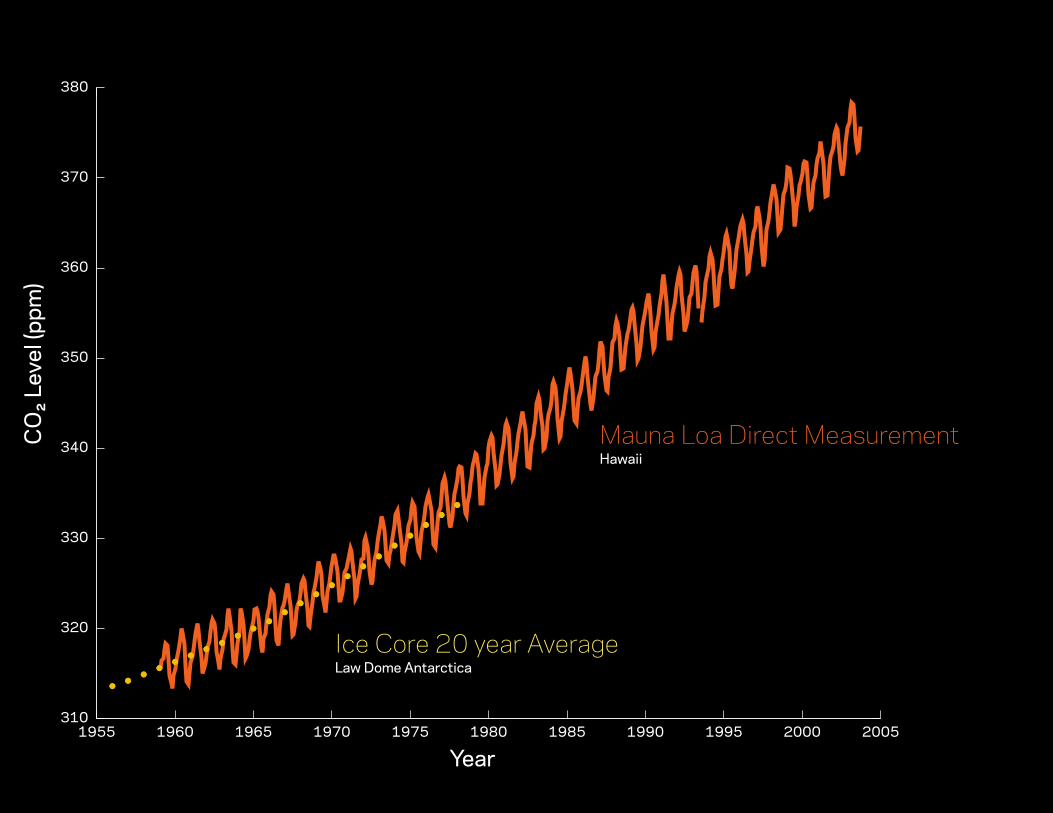
1955 1960 1965 1970 1975 1980 1985 1990 1995 2000 2005310
320
330
340
350
360
370
380
year
CO
2 co
ncen
trat
ion
(ppm
)C
O2 L
evel
(ppm
)
Year
Ice Core 20 year AverageLaw Dome Antarctica
Mauna Loa Direct MeasurementHawaii
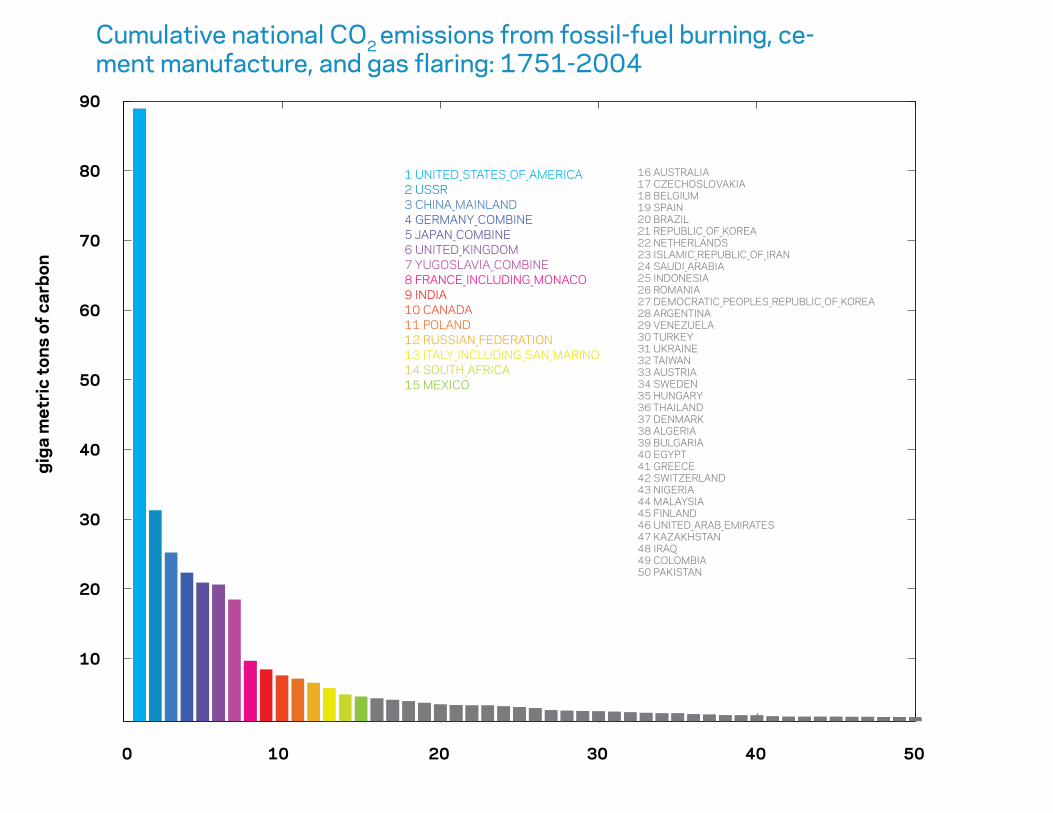
0 10 20 30 40 50
10
20
30
40
50
60
70
80
90
1 UNITED_STATES_OF_AMERICA2 USSR3 CHINA_MAINLAND4 GERMANY_COMBINE5 JAPAN_COMBINE6 UNITED_KINGDOM7 YUGOSLAVIA_COMBINE8 FRANCE_INCLUDING_MONACO9 INDIA10 CANADA11 POLAND12 RUSSIAN_FEDERATION13 ITALY_INCLUDING_SAN_MARINO14 SOUTH_AFRICA15 MEXICO
16 AUSTRALIA17 CZECHOSLOVAKIA18 BELGIUM19 SPAIN20 BRAZIL21 REPUBLIC_OF_KOREA22 NETHERLANDS23 ISLAMIC_REPUBLIC_OF_IRAN24 SAUDI_ARABIA25 INDONESIA26 ROMANIA27 DEMOCRATIC_PEOPLES_REPUBLIC_OF_KOREA28 ARGENTINA29 VENEZUELA30 TURKEY31 UKRAINE32 TAIWAN33 AUSTRIA34 SWEDEN35 HUNGARY36 THAILAND37 DENMARK38 ALGERIA39 BULGARIA40 EGYPT41 GREECE42 SWITZERLAND43 NIGERIA44 MALAYSIA45 FINLAND46 UNITED_ARAB_EMIRATES47 KAZAKHSTAN48 IRAQ49 COLOMBIA50 PAKISTAN
Cumulative National CO2 Emissions from Fossil-Fuel Burning,Cement Manufacture, and Gas Flaring: 1751-2004
giga
met
ric
tons
of c
arbo
n Cumulative national CO2 emissions from fossil-fuel burning, ce-ment manufacture, and gas flaring: 1751-2004
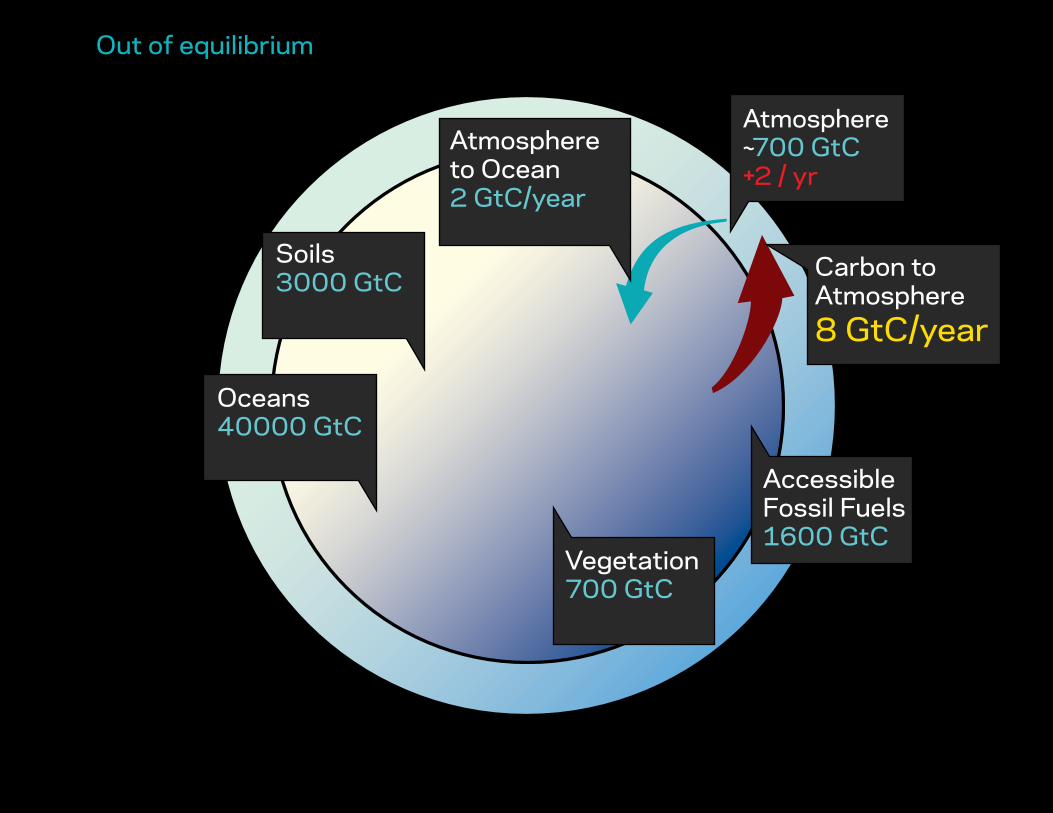
Out of equilibrium
AccessibleFossil Fuels1600 GtC
Soils3000 GtC
Vegetation700 GtC
Oceans40000 GtC
Atmosphere ~700 GtC +2 / yr
Atmosphere to Ocean 2 GtC/year
Carbon to Atmosphere 8 GtC/year
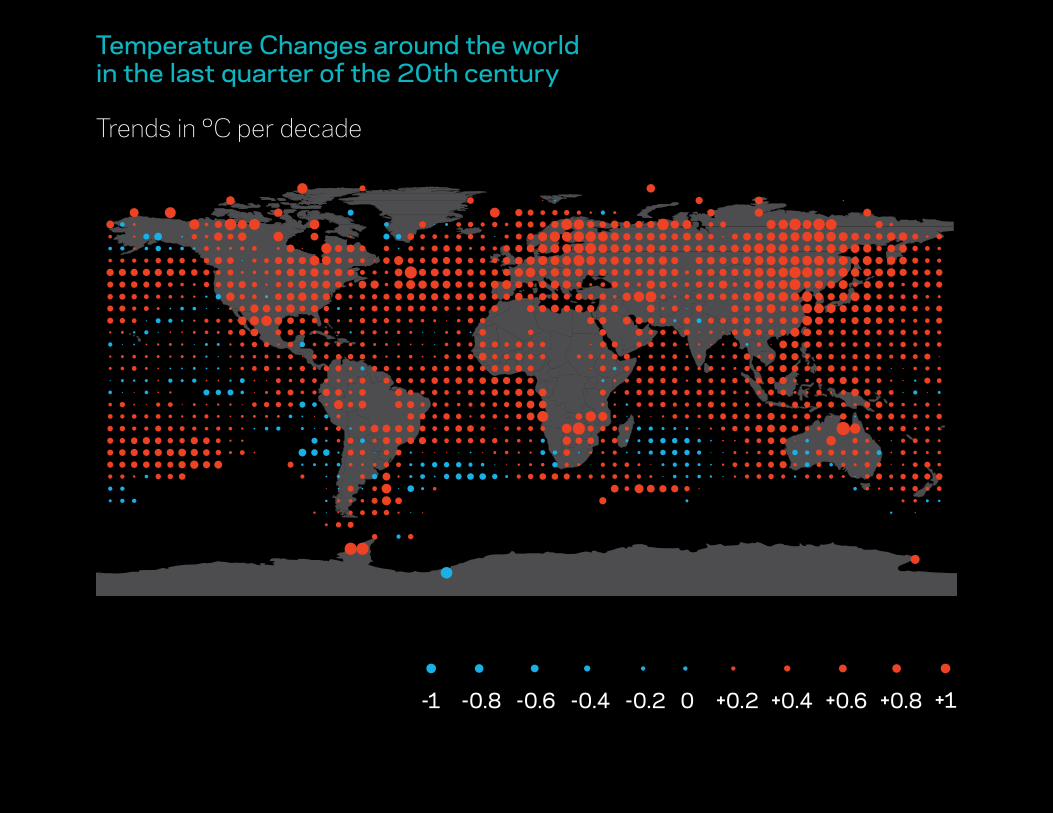
Temperature Changes around the world in the last quarter of the 20th century
- 1 - 0.8 - 0.6 - 0.4 - 0.2 0 + 0.2 + 0.4 + 0.6 + 0.8 + 1
Trends in °C per decade
-1 -0.8 +0.8-0.6 +0.6-0.4 +0.4-0.2 +0.20 +1
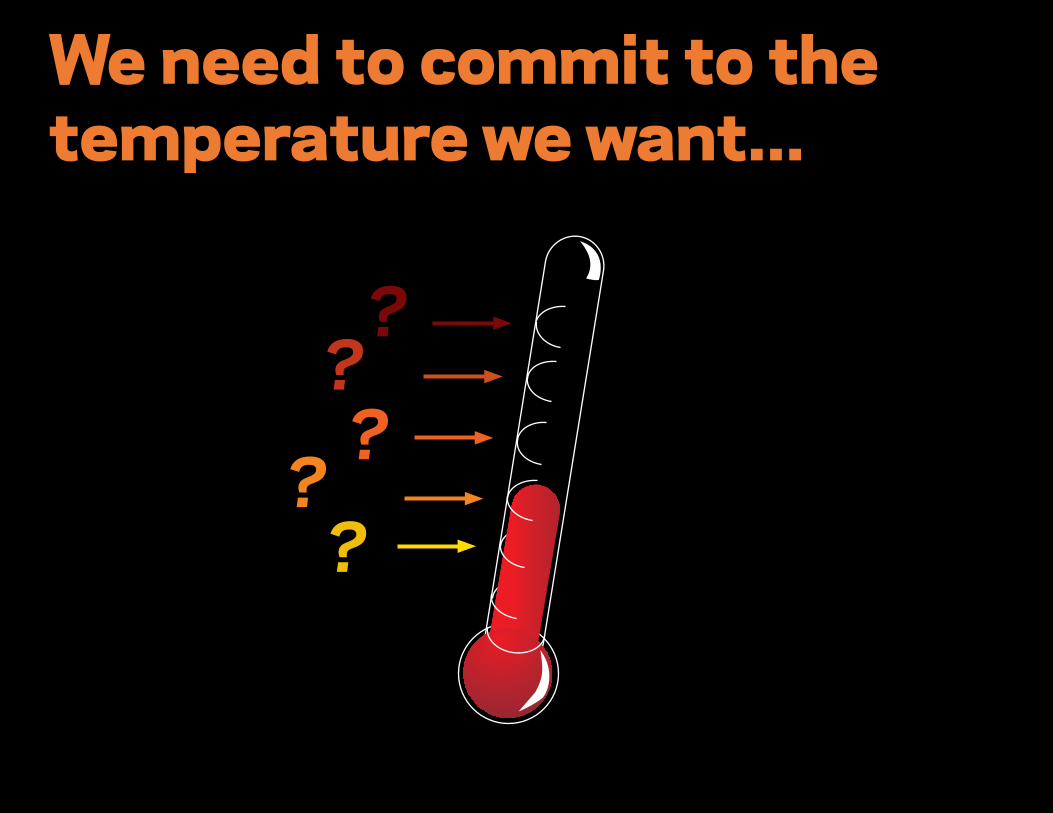
?????
We need to commit to the temperature we want...
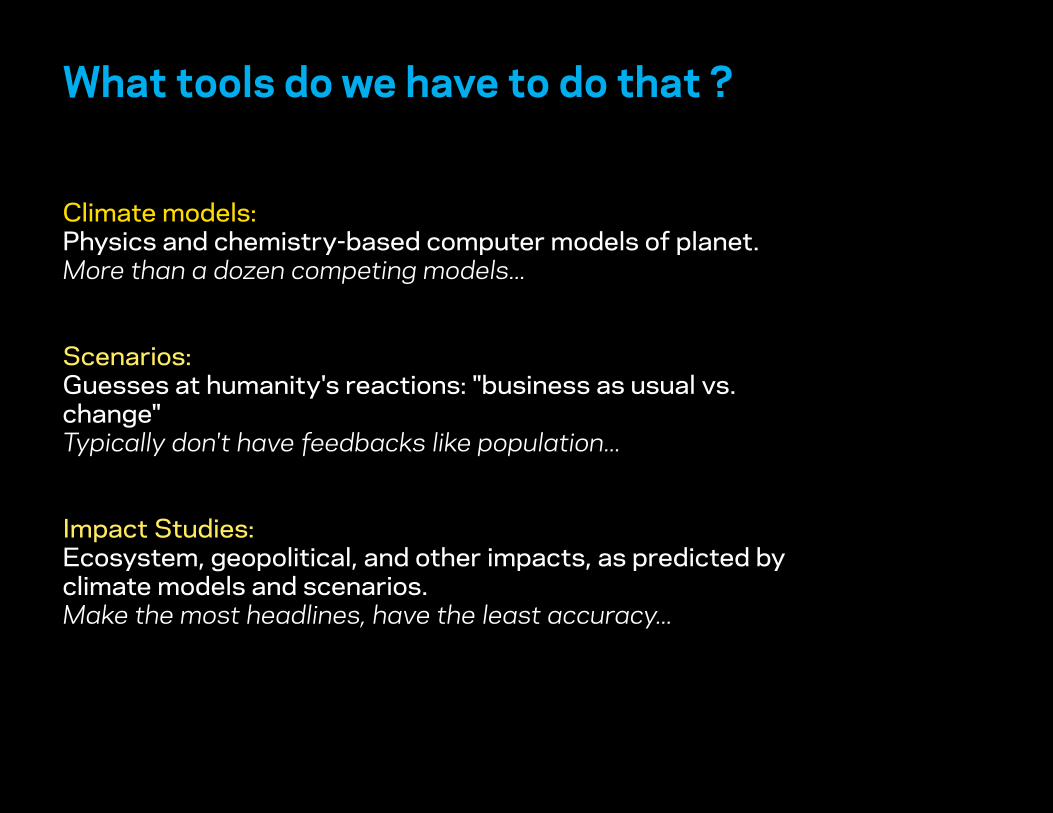
What tools do we have to do that ?
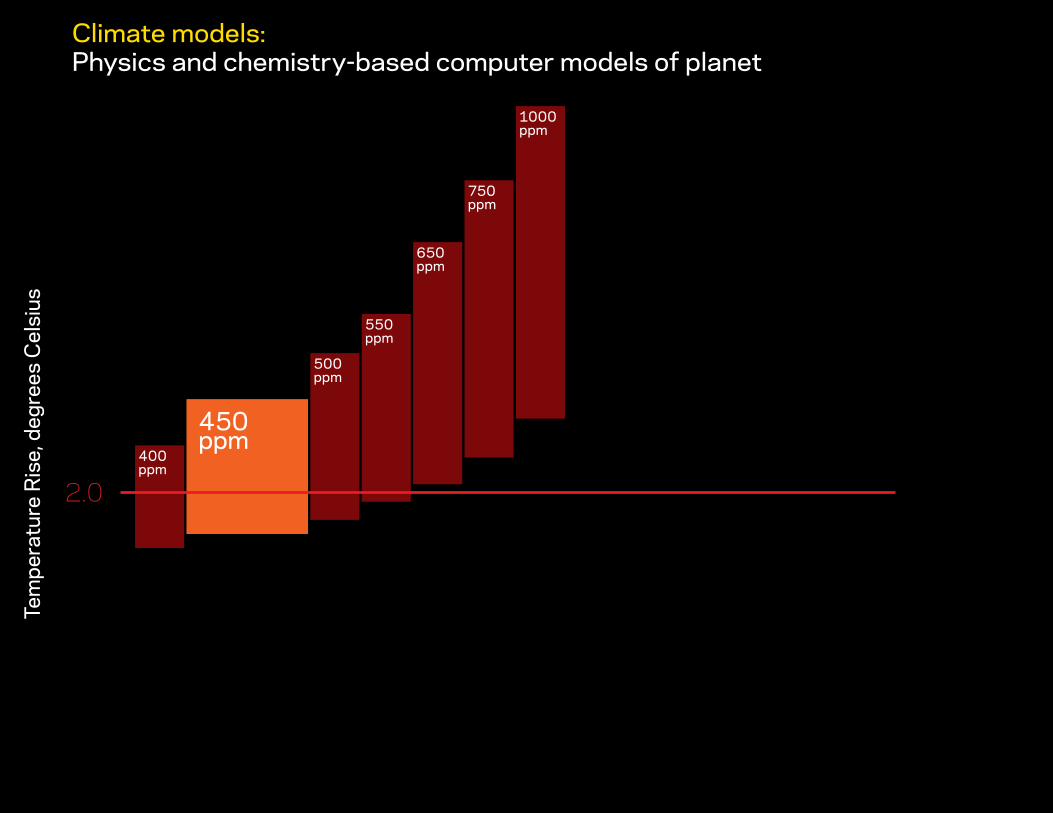
Climate models:Physics and chemistry-based computer models of planet.More than a dozen competing models...
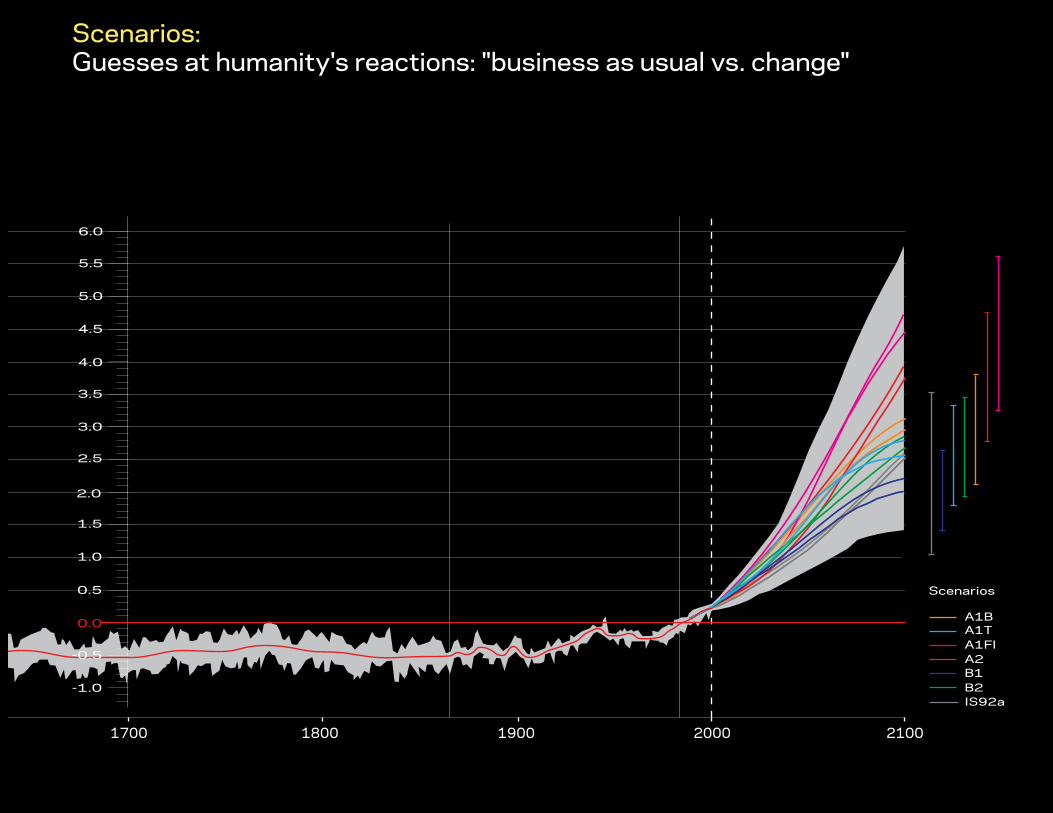
Scenarios:Guesses at humanity's reactions: "business as usual vs. change"Typically don't have feedbacks like population...
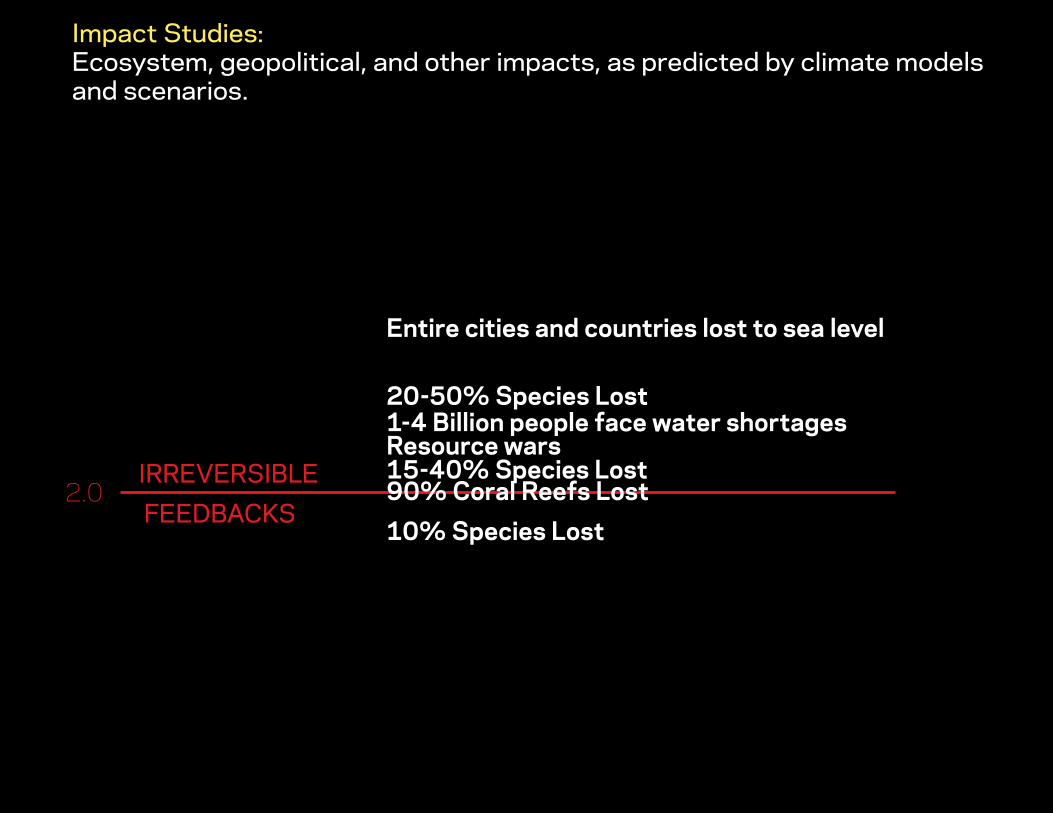
Impact Studies:Ecosystem, geopolitical, and other impacts, as predicted by climate models and scenarios.Make the most headlines, have the least accuracy...
A1BA1TA1FIA2B1B2IS92a
Scenarios
21002000190018001700
-0.5
0.0
-1.0
0.5
1.0
1.5
2.0
2.5
3.0
3.5
4.0
4.5
5.0
5.5
6.0
10% Species Lost
Entire cities and countries lost to sea level
20-50% Species Lost1-4 Billion people face water shortages
15-40% Species Lost
1000ppm
750ppm
650ppm
550ppm
500ppm
450ppm
400ppm
2.0
Climate models:Physics and chemistry-based computer models of planet
Tem
pera
ture
Ris
e, d
egre
es C
elsi
us
Tem
pera
ture
Ris
e, d
egre
es C
elsi
us
15-40% Species Lost
10% Species Lost
1-4 Billion people face water shortages
Entire cities and countries lost to sea level
20-50% Species Lost
450ppm
1000ppm
750ppm
650ppm
550ppm
500ppm
400ppm
Scenarios:Guesses at humanity's reactions: "business as usual vs. change"
A1BA1TA1FIA2B1B2IS92a
Scenarios
21002000190018001700
-0.5
0.0
-1.0
0.5
1.0
1.5
2.0
2.5
3.0
3.5
4.0
4.5
5.0
5.5
6.0
1000ppm
750ppm
650ppm
550ppm
500ppm
450ppm
400ppm
A1BA1TA1FIA2B1B2IS92a
Scenarios
21002000190018001700
-0.5
0.0
-1.0
0.5
1.0
1.5
2.0
2.5
3.0
3.5
4.0
4.5
5.0
5.5
6.0
Tem
pera
ture
Ris
e, d
egre
es C
elsi
us
10% Species Lost
Entire cities and countries lost to sea level
20-50% Species Lost1-4 Billion people face water shortages
15-40% Species Lost2.0
Impact Studies:Ecosystem, geopolitical, and other impacts, as predicted by climate models and scenarios.
90% Coral Reefs Lost
Resource warsIRREVERSIBLE FEEDBACKS

Climate Wars:
- China backed Pakistan vs US backed India, over the Indus river glacial melt and catchment area.
- China and Russia over climate refugees crossing over into Siberia (note the severe drought at present in north central China)
- Persian Gulf countries sending in troops to enforce their property rights after land they'd brought in East African countries to feed their own populations gets overun by lo-cals desperate for their own land
- Tidal surges flood the Nile Delta forcing millions to try and cross borders into Lybia, Sudan, and Israel
- Civil War in Nigeria (again) as the densely populated delta turns saline after regular flooding
- Gunboat diplomacy in the Arctic as Russia and Canada try to enforce economic exclusion zones against the US and EU.
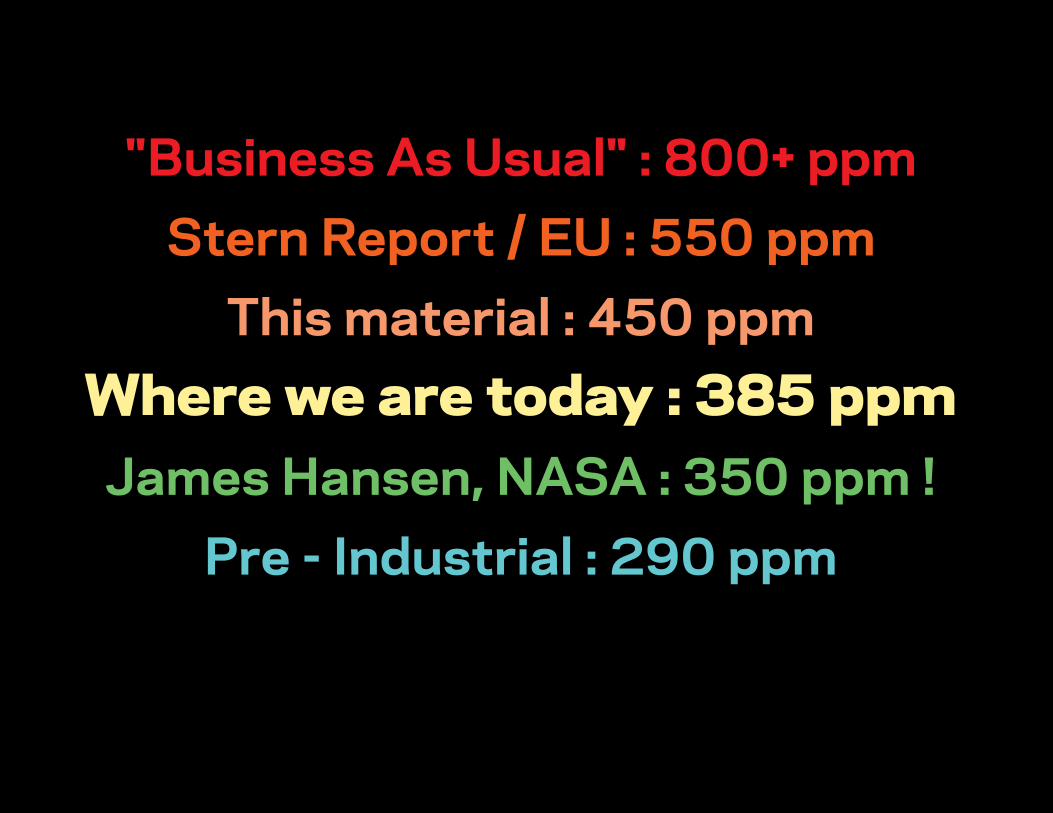
"Business As Usual" : 800+ ppmStern Report / EU : 550 ppm
This material : 450 ppmWhere we are today : 385 ppmJames Hansen, NASA : 350 ppm !
Pre - Industrial : 290 ppm
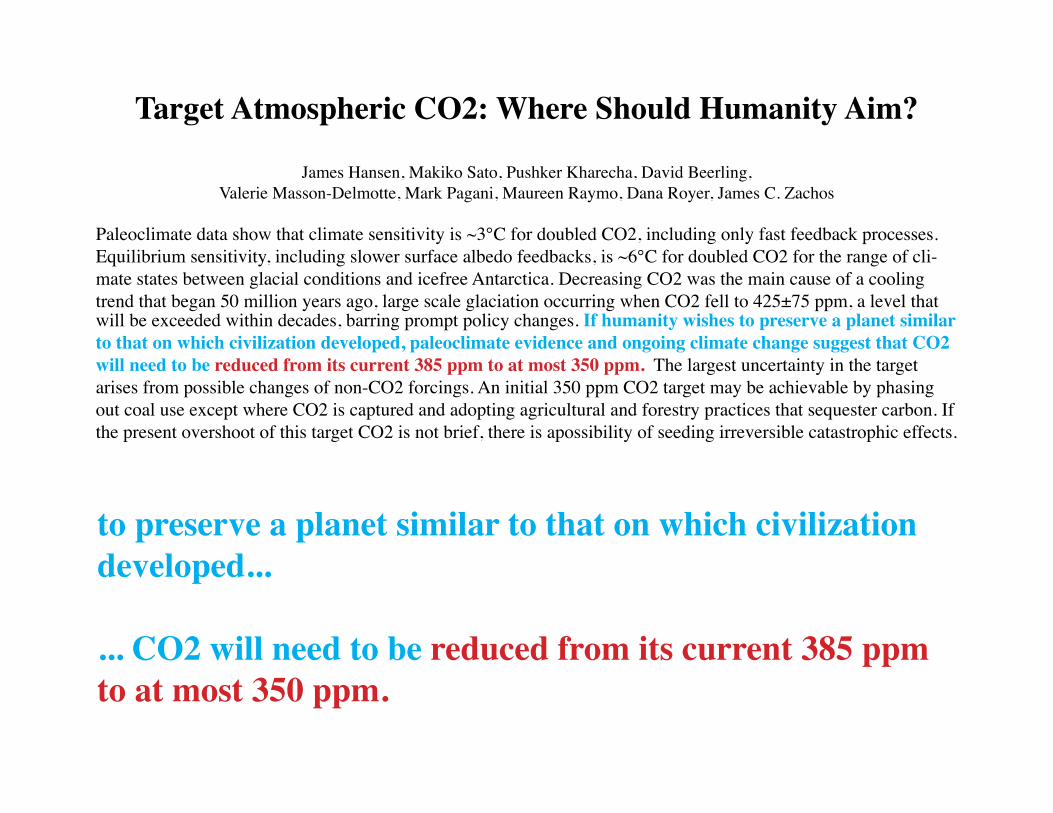
Target Atmospheric CO2: Where Should Humanity Aim?
James Hansen, Makiko Sato, Pushker Kharecha, David Beerling,Valerie Masson-Delmotte, Mark Pagani, Maureen Raymo, Dana Royer, James C. Zachos
Paleoclimate data show that climate sensitivity is ~3°C for doubled CO2, including only fast feedback processes. Equilibrium sensitivity, including slower surface albedo feedbacks, is ~6°C for doubled CO2 for the range of cli-mate states between glacial conditions and icefree Antarctica. Decreasing CO2 was the main cause of a cooling trend that began 50 million years ago, large scale glaciation occurring when CO2 fell to 425±75 ppm, a level that will be exceeded within decades, barring prompt policy changes. If humanity wishes to preserve a planet similar to that on which civilization developed, paleoclimate evidence and ongoing climate change suggest that CO2 will need to be reduced from its current 385 ppm to at most 350 ppm. The largest uncertainty in the target arises from possible changes of non-CO2 forcings. An initial 350 ppm CO2 target may be achievable by phasing out coal use except where CO2 is captured and adopting agricultural and forestry practices that sequester carbon. If the present overshoot of this target CO2 is not brief, there is apossibility of seeding irreversible catastrophic effects.
to preserve a planet similar to that on which civilization developed...
... CO2 will need to be reduced from its current 385 ppm to at most 350 ppm.

Which would be nice but...
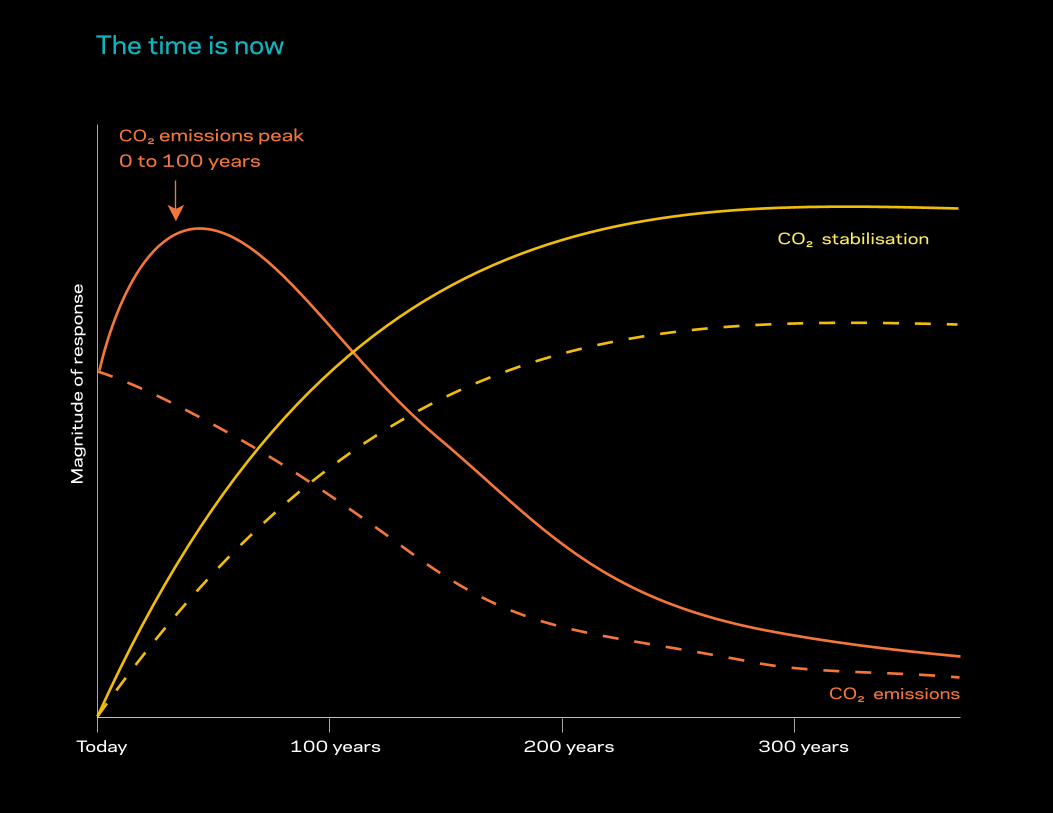
The time is now
CO2 emissions peak0 to 100 years
Today 100 years
Ma
gn
itu
de
of
resp
on
se
Time taken to reachequilibrium
CO2 emissions
200 years 300 years
CO2 stabilisation
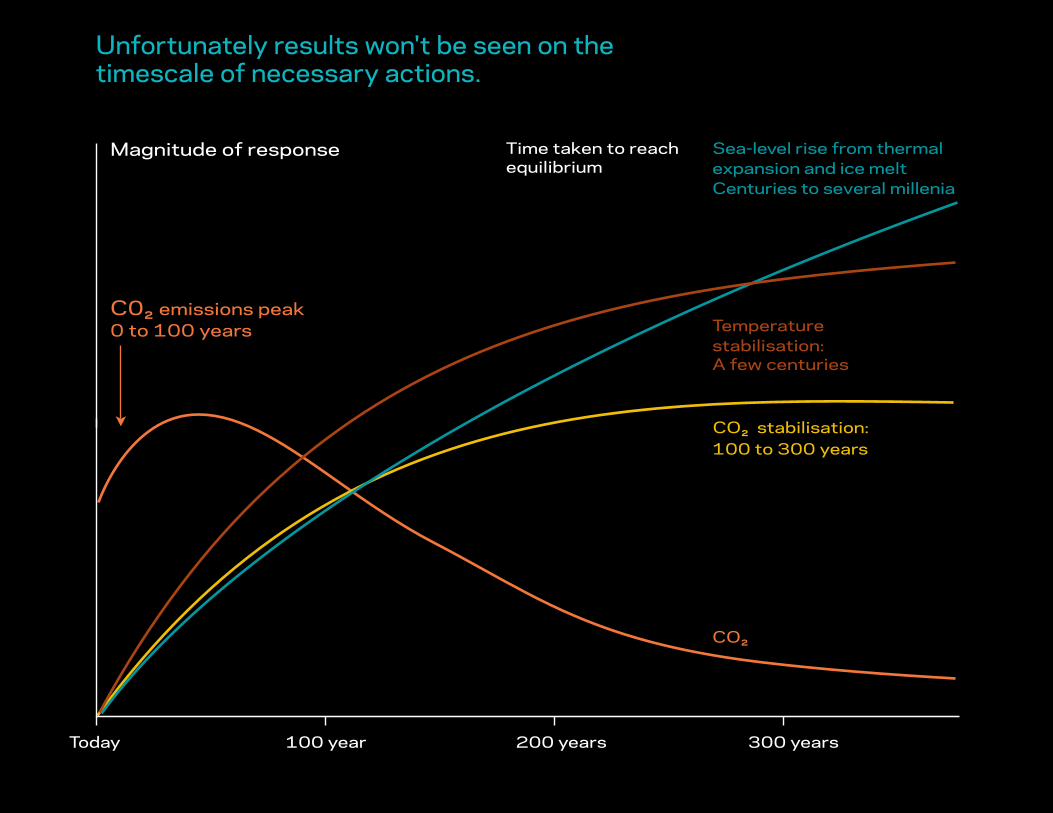
Unfortunately results won't be seen on the timescale of necessary actions.
C02 emissions peak 0 to 100 years
Today
Magnitude of response
CO2 stabilisation:100 to 300 years
Temperature stabilisation:A few centuries
Sea-level rise from thermal expansion and ice meltCenturies to several millenia
Time taken to reachequilibrium
CO2
Long-term trends and planetary risks
300 years200 years100 year
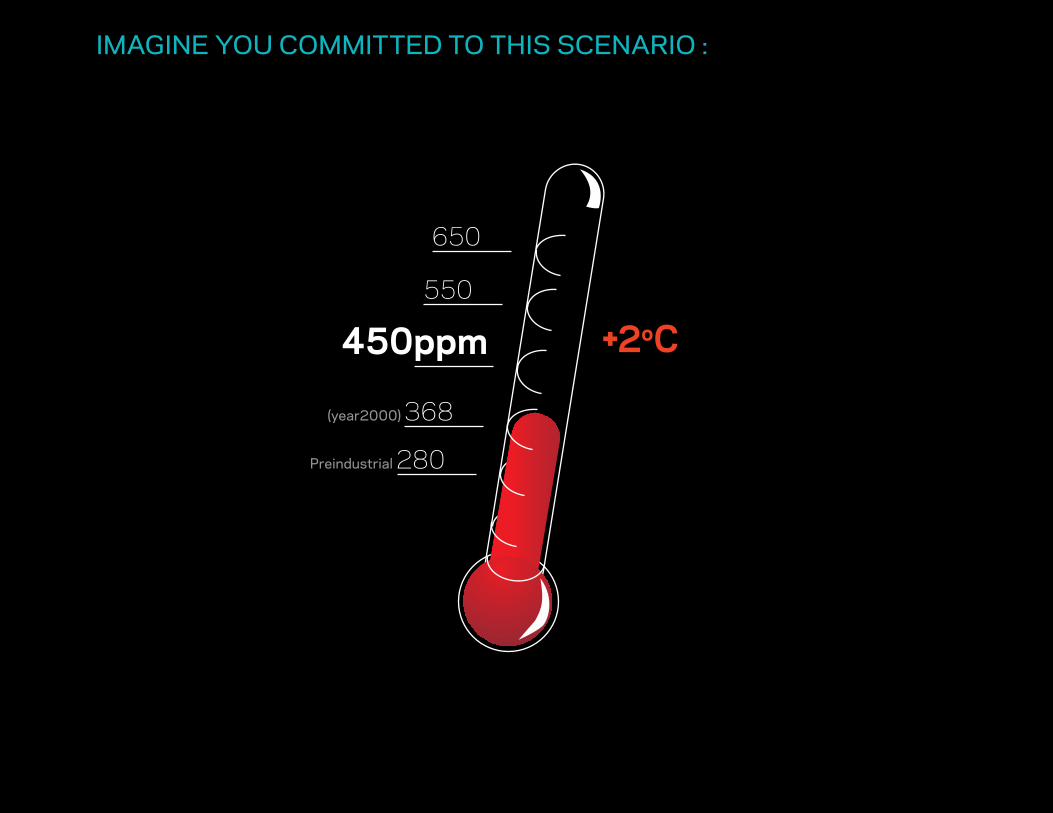
650
550
450ppm
(year2000) 368
Preindustrial 280
IMAGINE YOU COMMITTED TO THIS SCENARIO :
+2oC
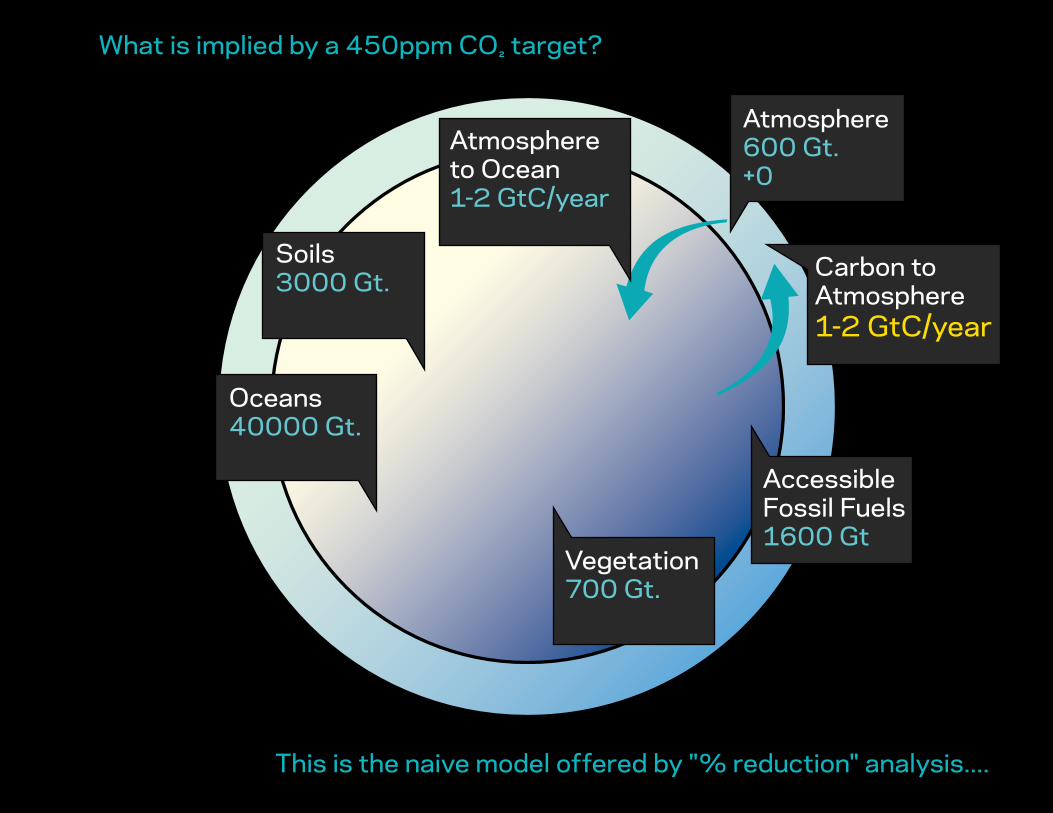
AccessibleFossil Fuels1600 Gt
Soils3000 Gt.
Vegetation700 Gt.
Oceans40000 Gt.
Atmosphere 600 Gt.+0
Carbon to Atmosphere 1-2 GtC/year
Atmosphere to Ocean 1-2 GtC/year
What is implied by a 450ppm CO² target?
This is the naive model offered by "% reduction" analysis....
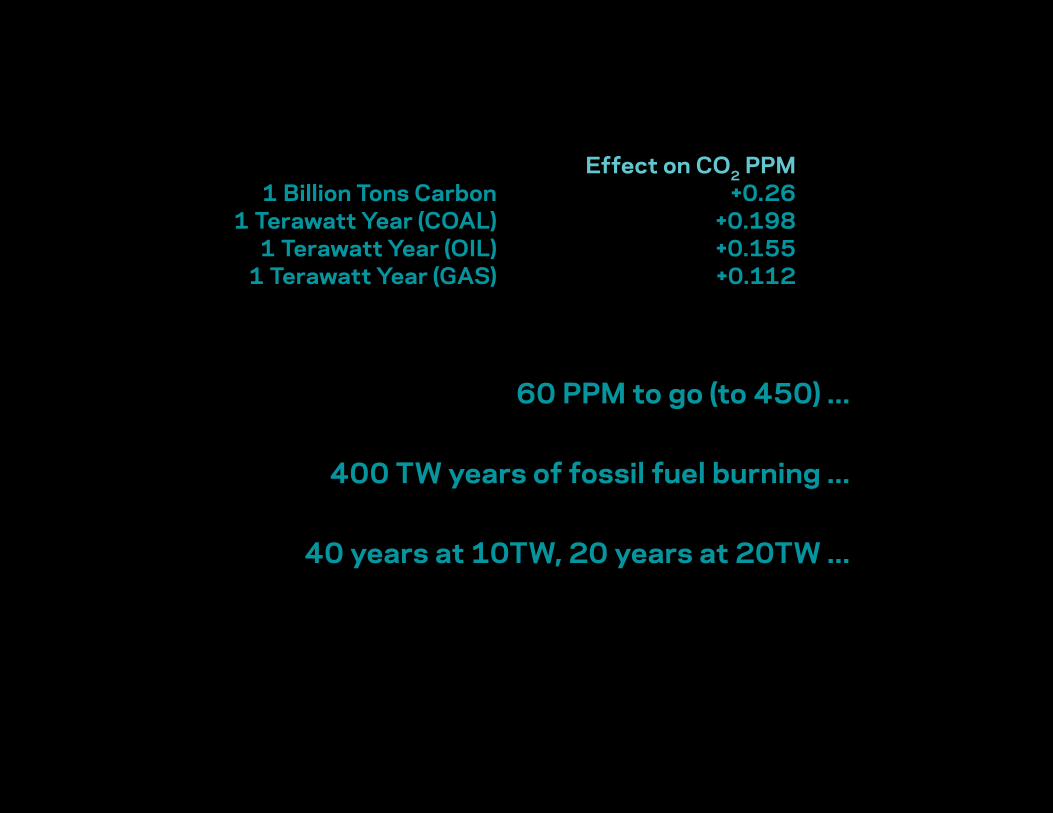
Effect on CO2 PPM1 Billion Tons Carbon +0.26
1 Terawatt Year (COAL) +0.1981 Terawatt Year (OIL) +0.155
1 Terawatt Year (GAS) +0.112
60 PPM to go (to 450) ...
400 TW years of fossil fuel burning ...
40 years at 10TW, 20 years at 20TW ...
METHODS SUMMARY
To relate emissions of GHGs, tropospheric ozone precursors and aerosols to gas-
cycle and climate system responses, we employ MAGICC 6.016, a reduced com-
plexity coupled climate–carbon cycle model used in past IPCC assessment
reports for emulating AOGCMs. Out of more than 400 parameters, we vary 9
climate response parameters (one of which is climate sensitivity), 33 gas-cycle
and global radiative forcing parameters (not including 18 carbon-cycle para-
meters, which are calibrated separately16 to C4MIP carbon-cycle models8), and
40 scaling factors determining the regional 4 box pattern of key forcings
(Supplementary Table 1). Other parameters are set to default values16.
To constrain the parameters, we use observational data of surface air temper-
ature9 in 4 spatial grid boxes from 1850 to 2006, the linear trend in ocean heat
content changes10 from 1961 to 2003 and year 2005 radiative forcing estimates
Table 1 | Probabilities of exceeding 2 6C
Indicator Emissions Probability of exceeding 2 uC*
Range Illustrative default case{
Cumulative total CO2
emission 2000–49 886 Gt CO2
8–37% 20%1,000 Gt CO
210–42% 25%
1,158 Gt CO2
16–51% 33%1,437 Gt CO
229–70% 50%
Cumulative Kyoto-gas emissions 2000–49 1,356 Gt CO2
equiv. 8–37% 20%1,500 Gt CO
2equiv. 10–43% 26%
1,678 Gt CO2
equiv. 15–51% 33%2,000 Gt CO
2equiv. 29–70% 50%
2050 Kyoto-gas emissions 10 Gt CO2
equiv. yr21
6–32% 16%(Halved 1990) 18 Gt CO
2equiv. yr21
12–45% 29%(Halved 2000) 20 Gt CO
2equiv. yr21
15–49% 32%36 Gt CO
2equiv. yr21
39–82% 64%2020 Kyoto-gas emissions 30 Gt CO
2equiv. yr21 (8–38%){ (21%){
35 Gt CO2
equiv. yr21 (13–46%){ (29%){40 Gt CO
2equiv. yr21 (19–56%){ (37%){
50 Gt CO2
equiv. yr21 (53–87%){ (74%){
*Range across all priors reflecting the various climate sensitivity distributions with the exception of line 12 in Fig. 3a.{Note that 2020 Kyoto-gas emissions are, from a physical perspective, a less robust indicator for maximal twenty-first century warming with a wide scenario-to-scenario spread (Supplementary Fig. 1c).{ Prior chosen to match posterior of ref. 19 with uniform priors on the TCR.
0 500 1,000 1,500 2,000 2,500
Pro
bab
ility
of e
xcee
din
g 2
°C
100%
0%
10%
20%
30%
40%
50%
60%
70%
80%
90%
Pro
bab
ility
of s
tayi
ng b
elow
2 °
C
Very likely
Like
lyU
nlik
ely
Less
like
ly
than
no
tM
ore
like
ly
than
no
t
Very unlikely
Cumulative total CO2 emissions 2000–49 (Gt CO2)
Emitted, available carbon (Gt CO2)
0 500 1,000 1,500 2,000 2,500
a
b
6 Illustrative SRESSRES A1FI
35 SRES7 EMF reference14 EMF reference3 Stern / EQW948 EQWHALVED-BY-2050
Diff. CS priors
Illustrative defaultCMIP3 and C4MIPemulation
8162
Scenarios:
Climate uncertainties:
CO
2 em
issi
ons
2000
to
200
6
d useLanL
Gas
Oil
Coal
Total proven fossil fueel reserves
1
3
15
14
13
12
11
10
1716
19
18
9
87
6
5
4
2
A1B
A1FI
A1T
A2
B1
B2
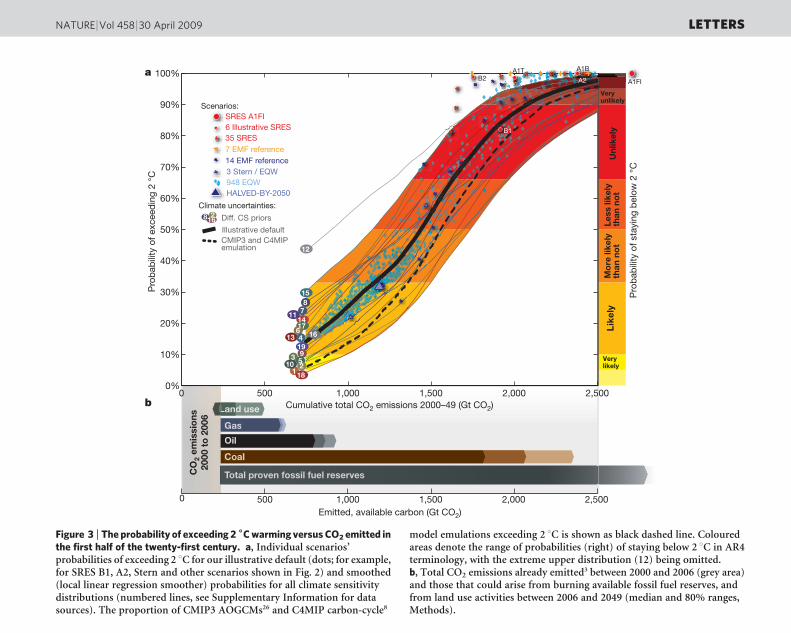
Figure 3 | The probability of exceeding 2 6C warming versus CO2 emitted inthe first half of the twenty-first century. a, Individual scenarios’probabilities of exceeding 2 uC for our illustrative default (dots; for example,for SRES B1, A2, Stern and other scenarios shown in Fig. 2) and smoothed(local linear regression smoother) probabilities for all climate sensitivitydistributions (numbered lines, see Supplementary Information for datasources). The proportion of CMIP3 AOGCMs26 and C4MIP carbon-cycle8
model emulations exceeding 2 uC is shown as black dashed line. Colouredareas denote the range of probabilities (right) of staying below 2 uC in AR4terminology, with the extreme upper distribution (12) being omitted.b, Total CO2 emissions already emitted3 between 2000 and 2006 (grey area)and those that could arise from burning available fossil fuel reserves, andfrom land use activities between 2006 and 2049 (median and 80% ranges,Methods).
NATURE | Vol 458 | 30 April 2009 LETTERS
1161 Macmillan Publishers Limited. All rights reserved©2009
LETTERS
Warming caused by cumulative carbon emissionstowards the trillionth tonneMyles R. Allen1, David J. Frame1,2, Chris Huntingford3, Chris D. Jones4, Jason A. Lowe5, Malte Meinshausen6
& Nicolai Meinshausen7
Global efforts to mitigate climate change are guided by projectionsof future temperatures1. But the eventual equilibrium global meantemperature associated with a given stabilization level of atmo-spheric greenhouse gas concentrations remains uncertain1–3,complicating the setting of stabilization targets to avoid poten-tially dangerous levels of global warming4–8. Similar problemsapply to the carbon cycle: observations currently provide only aweak constraint on the response to future emissions9–11. Here weuse ensemble simulations of simple climate-carbon-cycle modelsconstrained by observations and projections from more compre-hensive models to simulate the temperature response to a broadrange of carbon dioxide emission pathways. We find that the peakwarming caused by a given cumulative carbon dioxide emission isbetter constrained than the warming response to a stabilizationscenario. Furthermore, the relationship between cumulativeemissions and peak warming is remarkably insensitive to the emis-sion pathway (timing of emissions or peak emission rate). Hencepolicy targets based on limiting cumulative emissions of carbondioxide are likely to be more robust to scientific uncertaintythan emission-rate or concentration targets. Total anthropogenic
emissions of one trillion tonnes of carbon (3.67 trillion tonnes ofCO2), about half of which has already been emitted since indus-trialization began, results in a most likely peak carbon-dioxide-induced warming of 2 6C above pre-industrial temperatures, witha 5–95% confidence interval of 1.3–3.9 6C.
Under conventional climate stabilization scenarios, greenhouse gasemissions are reduced until atmospheric composition approaches astabilization level consistent with a desired equilibrium warming andare then adjusted to hold concentrations stable thereafter5. If climatesystem and carbon cycle properties were known, this would bestraightforward: we could reliably map emissions to temperaturesand vice versa. For example, if the climate system were to follow theresponse of a simple model with most likely values of key parameters(see Methods Summary and Supplementary Information), the emis-sions scenario highlighted by the solid red line in Fig. 1a would bringatmospheric carbon dioxide (CO2) concentrations towards 490 p.p.m.(parts per million) by the end of the twenty-first century (solid red linein Fig. 1b). Under the ‘490 p.p.m. stabilization scenario’ shown by thedotted red lines, rapid reductions cease after 2070, with smaller sub-sequent adjustments causing concentrations to converge to 490 p.p.m.
1Department of Physics, University of Oxford, OX1 3PU, UK. 2Smith School of Enterprise and the Environment, University of Oxford, OX1 2BQ, UK. 3Centre for Ecology and Hydrology,Wallingford, OX10 8BB, UK. 4Met Office Hadley Centre, FitzRoy Road, Exeter, EX1 3PB, UK. 5Met Office Hadley Centre (Reading Unit), Department of Meteorology, University ofReading, RG6 6BB, Reading, UK. 6Potsdam Institute for Climate Impact Research, 14412 Potsdam, Germany. 7Department of Statistics, University of Oxford, OX1 3TG, UK.
25
800
6
5
4
3
2
1
0
CO
2 co
ncen
trat
ion
(p.p
.m.)
Like
lihoo
d
CO
2-in
duc
ed w
arm
ing
(°C
)
700
600
500
400
300
Gig
aton
nes
of c
arb
on p
er y
ear
Year Year Year
20
15
10
5
02000 2020 2040 2060 2080 2100 1900 2000 2100 2200 2300 2400 2500 1900 2000 2100 2200 2300 2400 2500
a Idealized CO2 emission profiles b Composition response to benchmark c Temperature response to benchmark
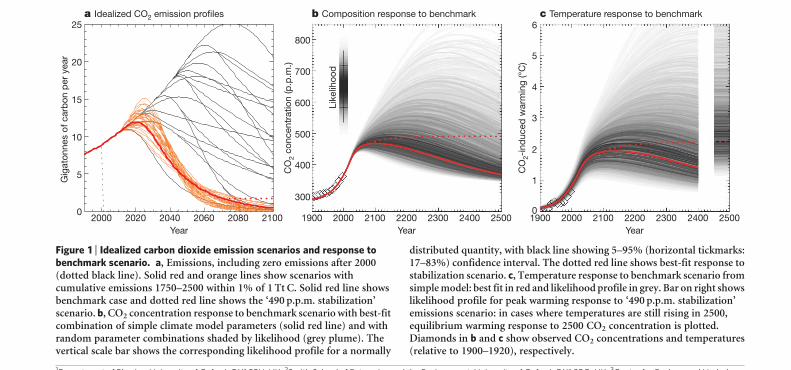
Figure 1 | Idealized carbon dioxide emission scenarios and response tobenchmark scenario. a, Emissions, including zero emissions after 2000(dotted black line). Solid red and orange lines show scenarios withcumulative emissions 1750–2500 within 1% of 1 Tt C. Solid red line showsbenchmark case and dotted red line shows the ‘490 p.p.m. stabilization’scenario. b, CO2 concentration response to benchmark scenario with best-fitcombination of simple climate model parameters (solid red line) and withrandom parameter combinations shaded by likelihood (grey plume). Thevertical scale bar shows the corresponding likelihood profile for a normally
distributed quantity, with black line showing 5–95% (horizontal tickmarks:17–83%) confidence interval. The dotted red line shows best-fit response tostabilization scenario. c, Temperature response to benchmark scenario fromsimple model: best fit in red and likelihood profile in grey. Bar on right showslikelihood profile for peak warming response to ‘490 p.p.m. stabilization’emissions scenario: in cases where temperatures are still rising in 2500,equilibrium warming response to 2500 CO2 concentration is plotted.Diamonds in b and c show observed CO2 concentrations and temperatures(relative to 1900–1920), respectively.
Vol 458 | 30 April 2009 | doi:10.1038/nature08019
1163 Macmillan Publishers Limited. All rights reserved©2009
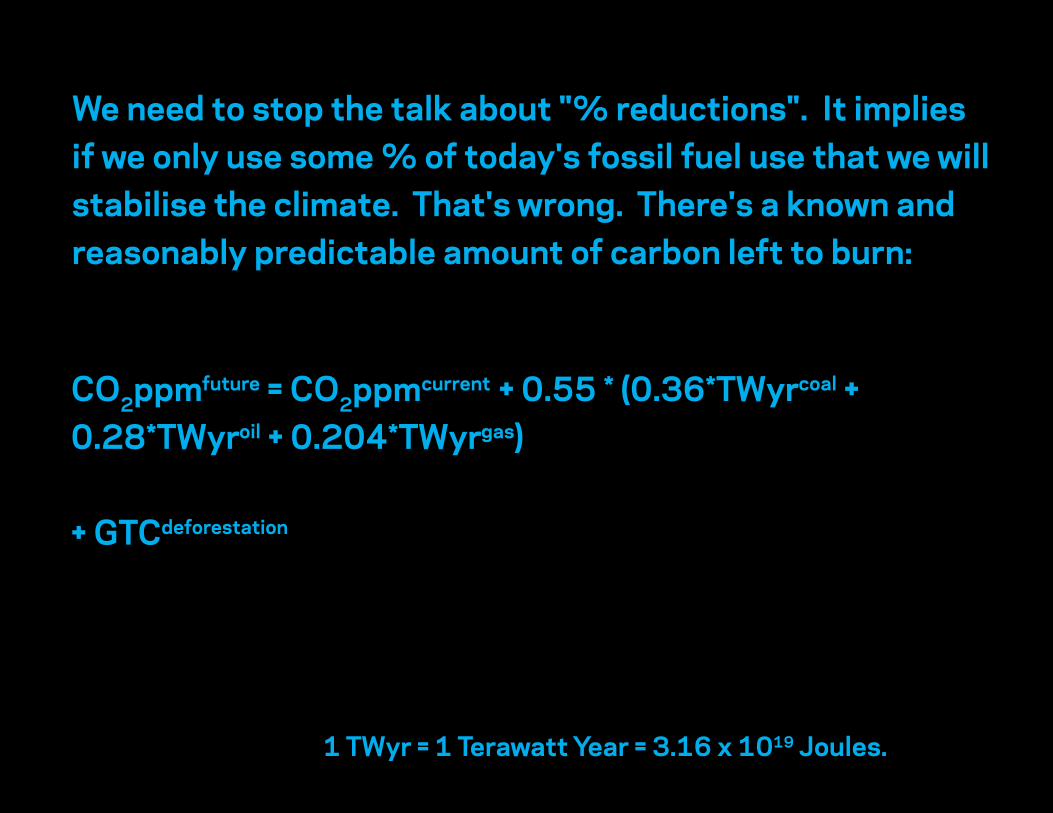
CO2ppmfuture = CO2ppmcurrent + 0.55 * (0.36*TWyrcoal + 0.28*TWyroil + 0.204*TWyrgas)
+ GTCdeforestation
We need to stop the talk about "% reductions". It implies if we only use some % of today's fossil fuel use that we will stabilise the climate. That's wrong. There's a known and reasonably predictable amount of carbon left to burn:
1 TWyr = 1 Terawatt Year = 3.16 x 10¹⁹ Joules.
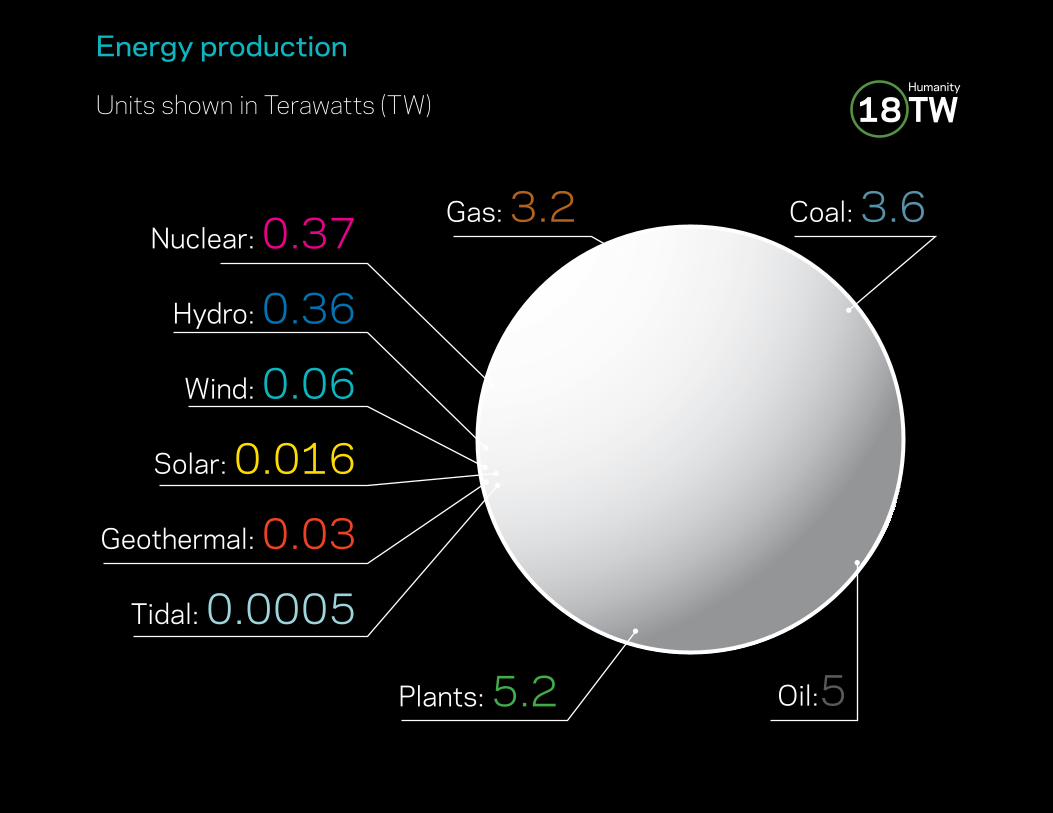
Units shown in Terawatts (TW)
Energy production
Plants: 5.2
Tidal: 0.0005
Solar: 0.016
Wind: 0.06
Gas: 3.2 Coal: 3.6
Geothermal: 0.03
Nuclear: 0.37
Hydro: 0.36
Oil:5
18 TWHumanity
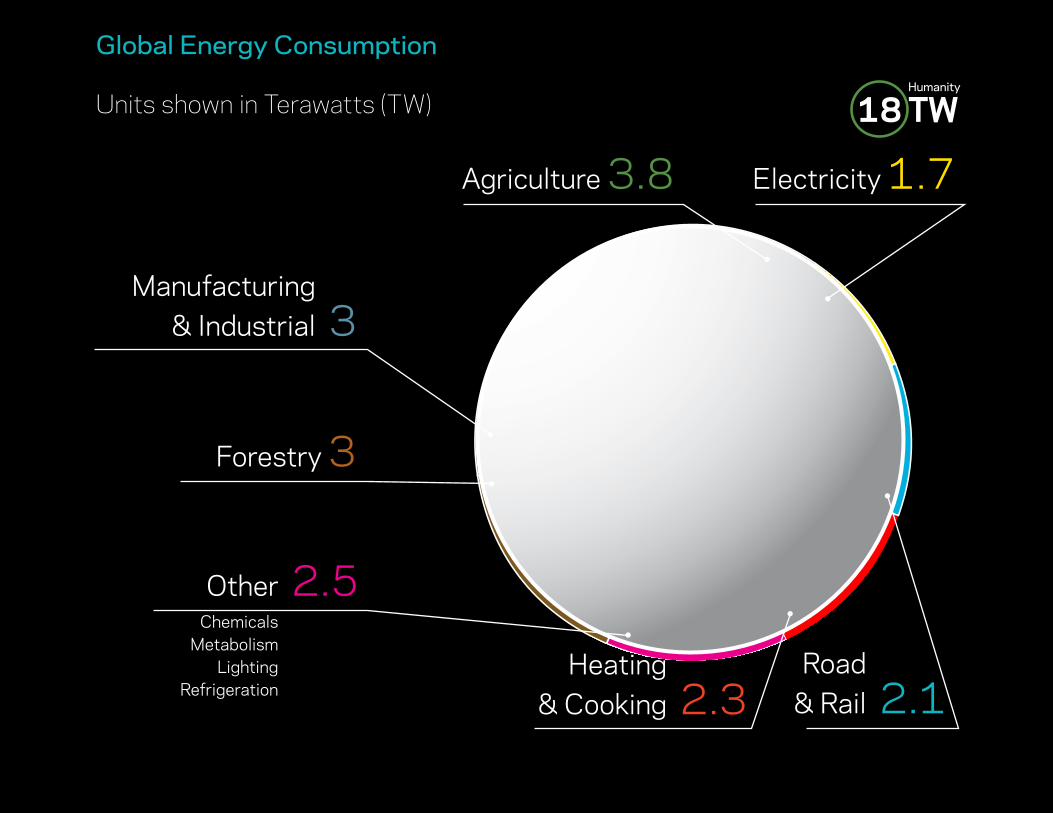
Global Exergy ConsumptionUnits shown in Terawatts
Other 2.5 Chemicals Metabolism Lighting Refrigeration
Electricity 1.7
Manufacturing & Industrial 3
Road & Rail 2.1
Heating & Cooking 2.3
Forestry 3
Global Energy Consumption
Agriculture 3.8
Units shown in Terawatts (TW) 18 TWHumanity
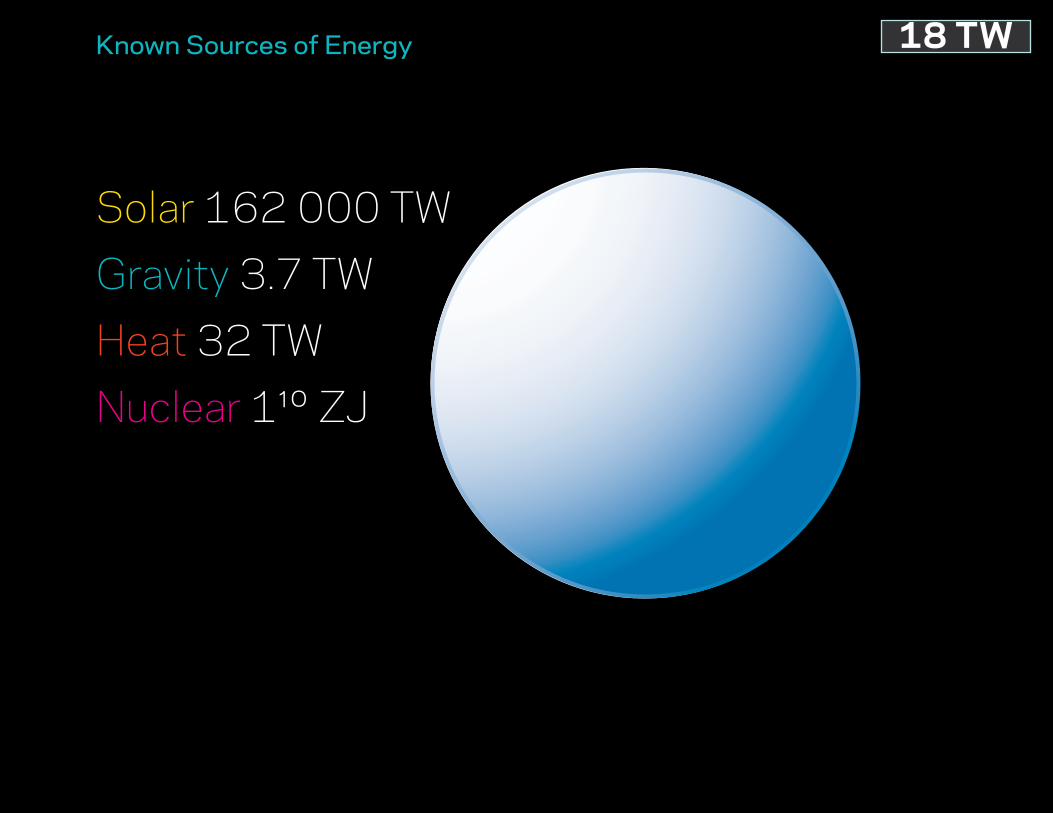
Solar 162 000 TWGravity 3.7 TWHeat 32 TWNuclear 1¹º ZJ
Known Sources of Energy 18 TW
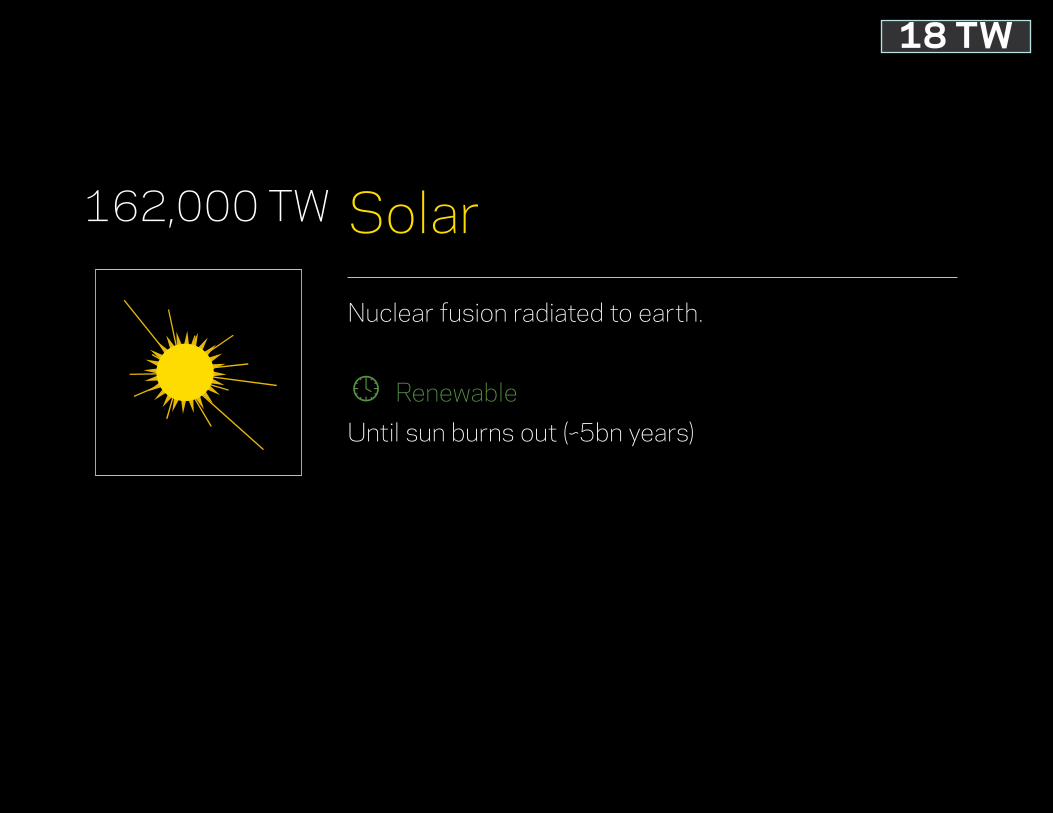
Nuclear fusion radiated to earth.
e Renewable Until sun burns out (~5bn years)
Solar162,000 TW
18 TW
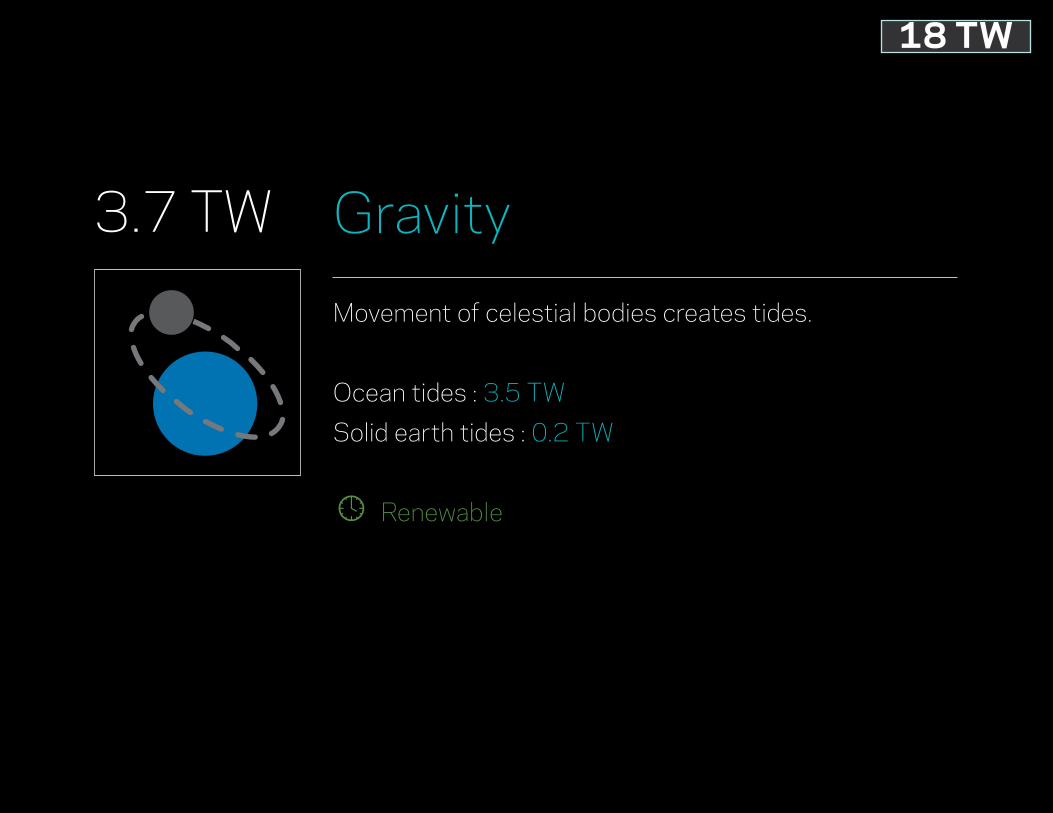
Movement of celestial bodies creates tides.
Ocean tides : 3.5 TWSolid earth tides : 0.2 TW
e Renewable
Gravity3.7 TW
18 TW
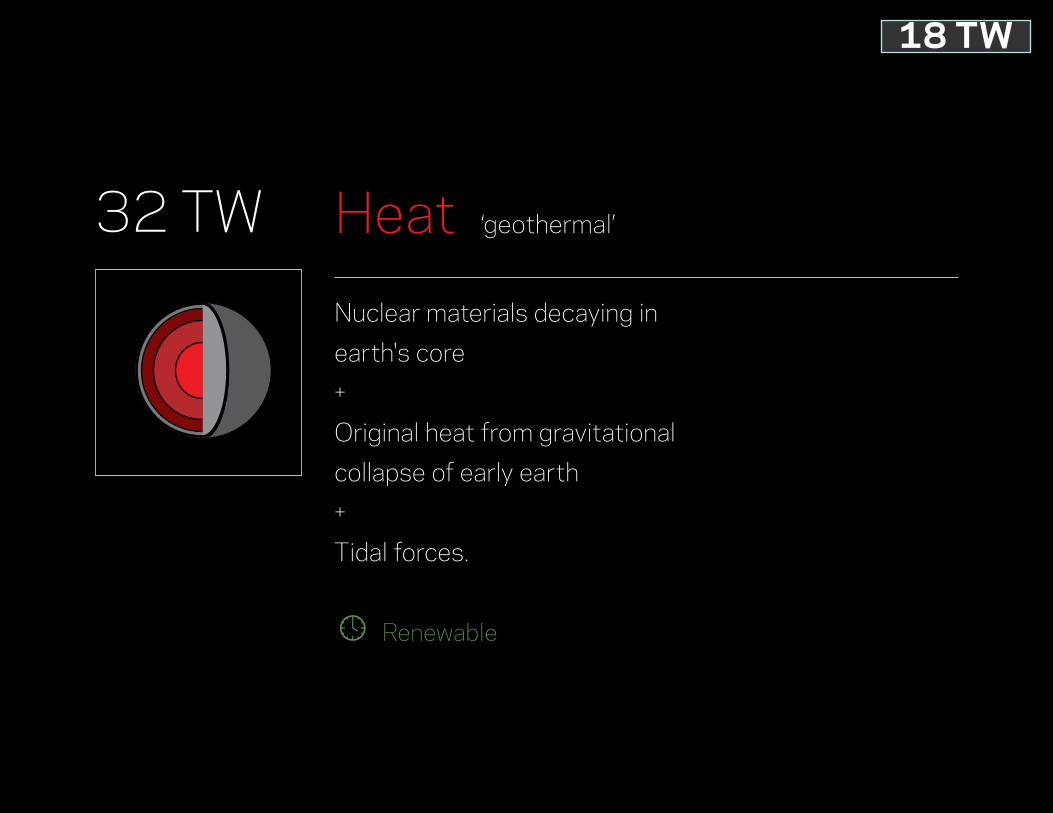
Nuclear materials decaying inearth's core+Original heat from gravitationalcollapse of early earth+Tidal forces.
e Renewable
Heat ‘geothermal’32 TW
18 TW
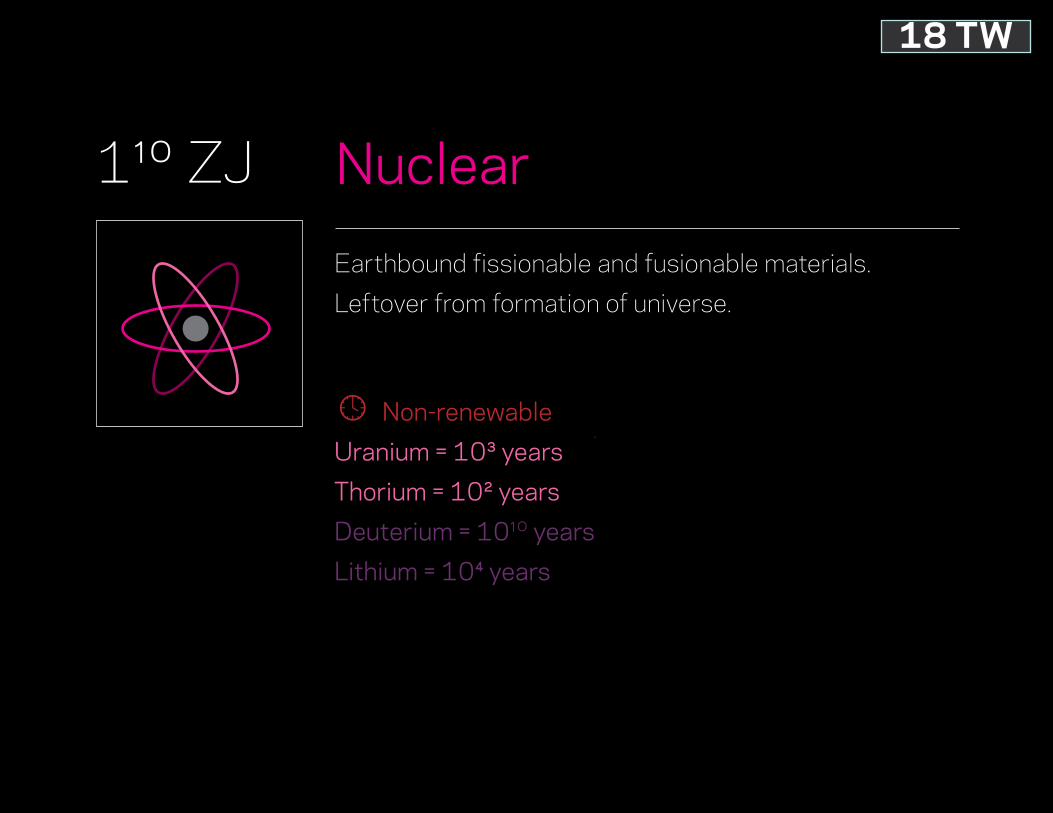
Nuclear1¹º ZJEarthbound fissionable and fusionable materials.Leftover from formation of universe.
e Non-renewableUranium = 10³ yearsThorium = 10² yearsDeuterium = 10¹º yearsLithium = 10⁴ years
18 TW
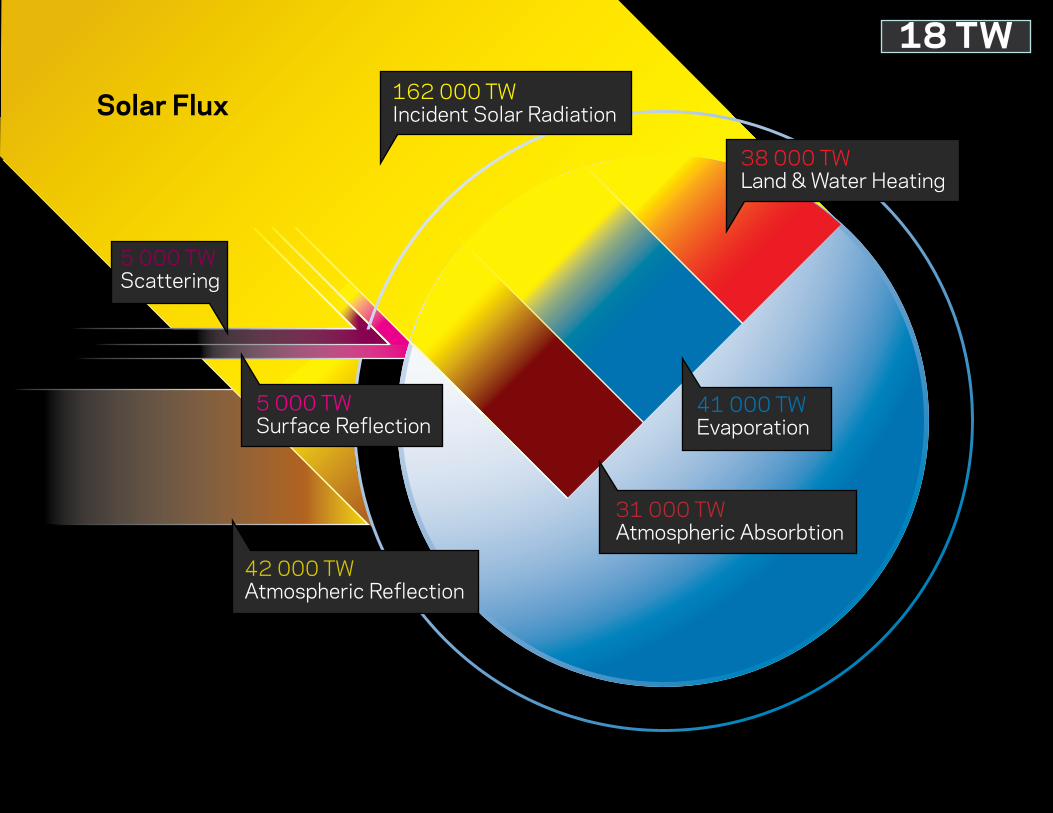
Solar Flux
38 000 TWLand & Water Heating
41 000 TWEvaporation
5 000 TWSurface Reflection
31 000 TWAtmospheric Absorbtion
5 000 TWScattering
42 000 TWAtmospheric Reflection
162 000 TWIncident Solar Radiation
18 TW
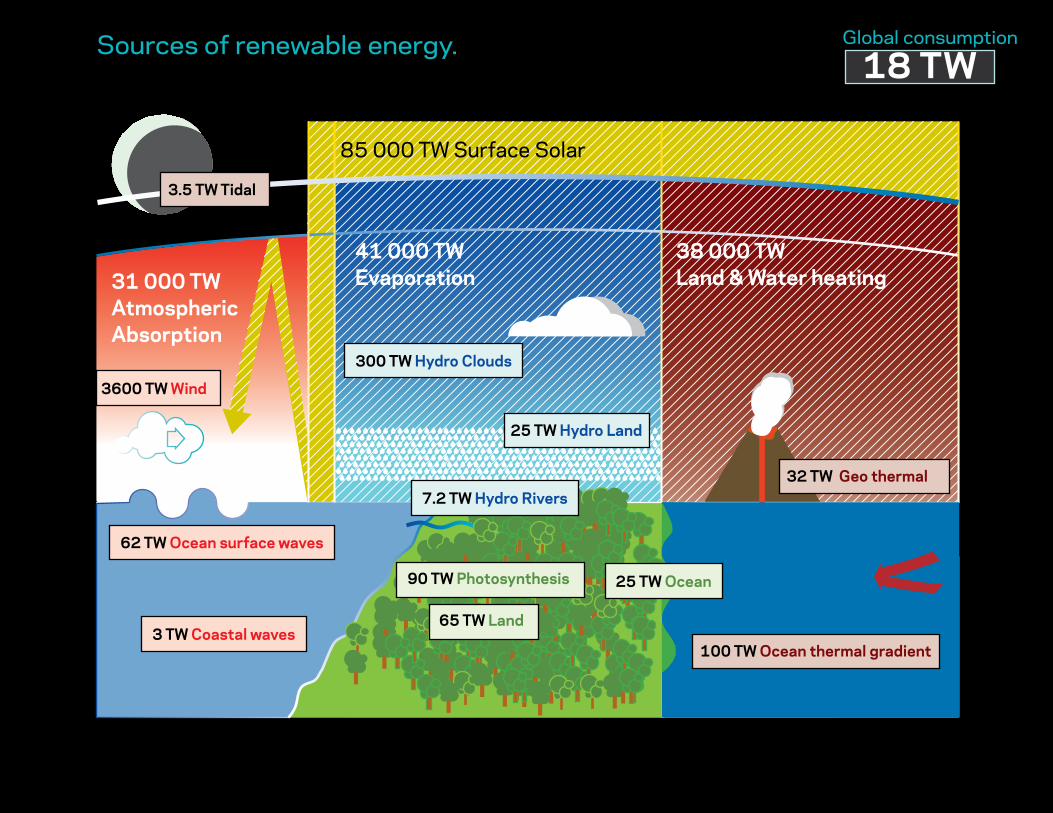
Sources of renewable energy.
31 000 TW Atmospheric Absorption
85 000 TW Surface Solar
62 TW Ocean surface waves
90 TW Photosynthesis
65 TW Land3 TW Coastal waves
7.2 TW Hydro Rivers
300 TW Hydro Clouds
25 TW Hydro Land
3600 TW Wind
41 000 TW Evaporation
38 000 TW Land & Water heating
3.5 TW Tidal
32 TW Geo thermal
25 TW Ocean
100 TW Ocean thermal gradient
18 TWGlobal consumption
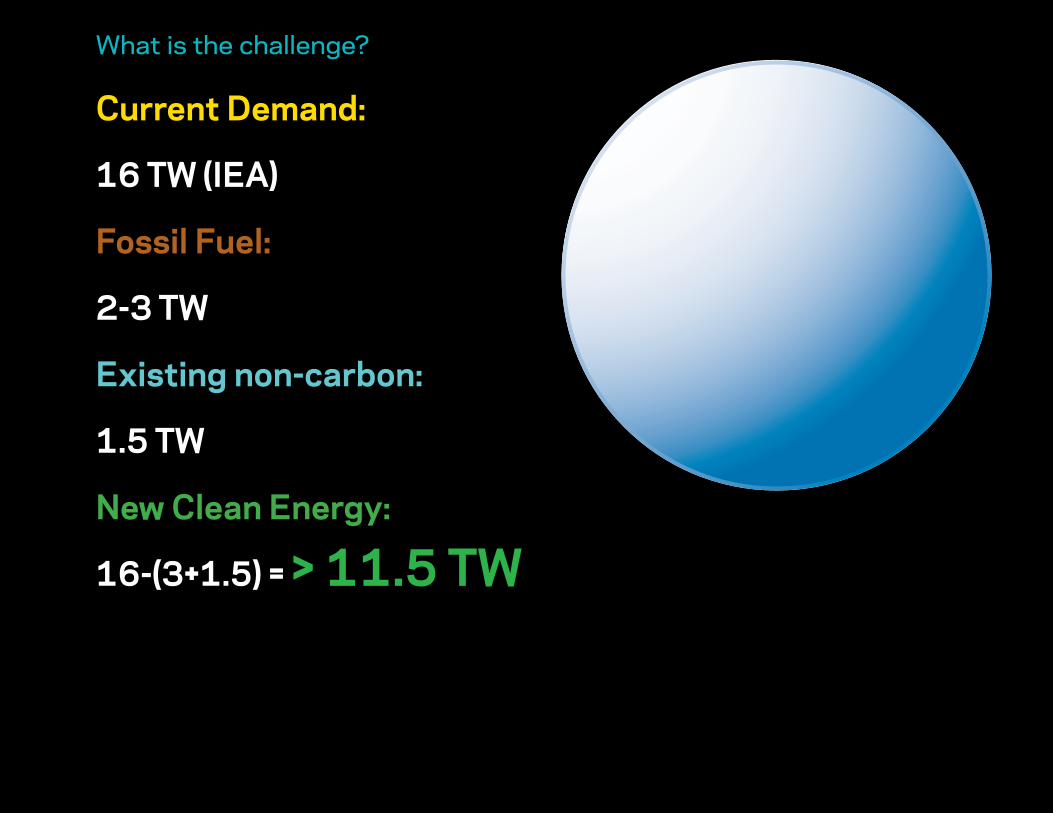
Current Demand:
16 TW (IEA)
Fossil Fuel:
2-3 TW
Existing non-carbon:
1.5 TW
New Clean Energy:
16-(3+1.5) = > 11.5 TW
What is the challenge?
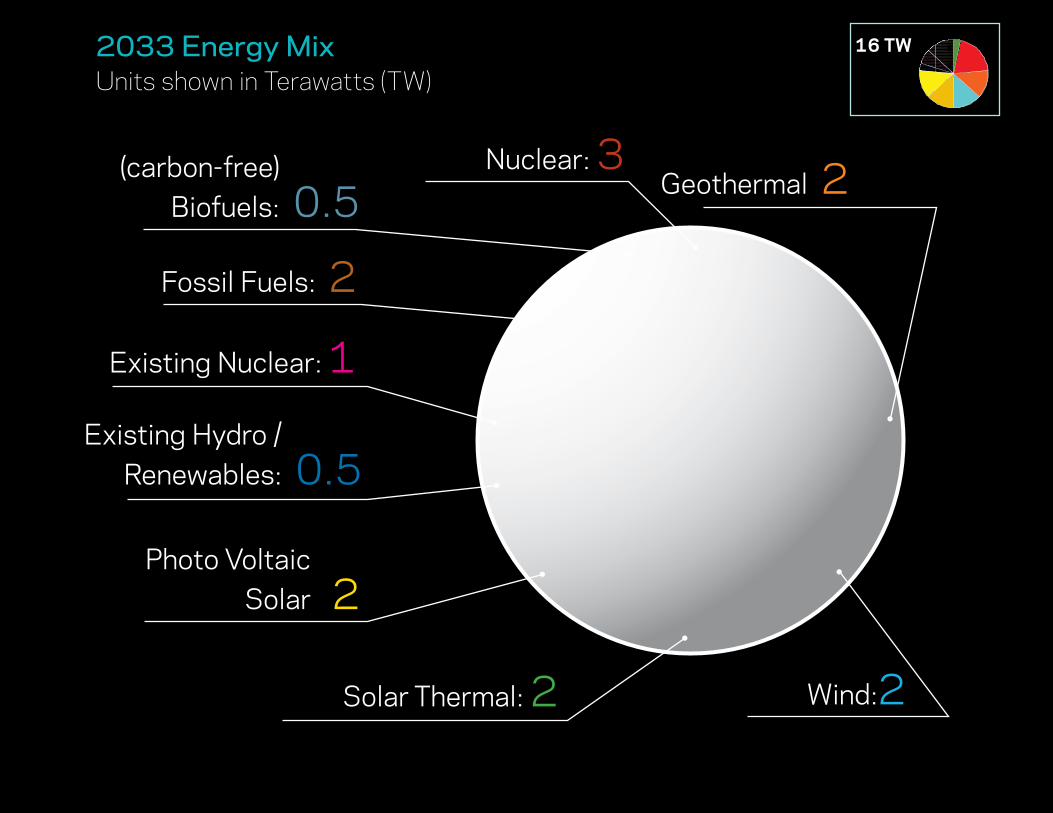
2TW Fossil Fuels
1TW Existing Nuclear
0.5TW Existing Hydro / Renewables
2TW New Photo-Voltaic Solar
2TW New Solar Thermal
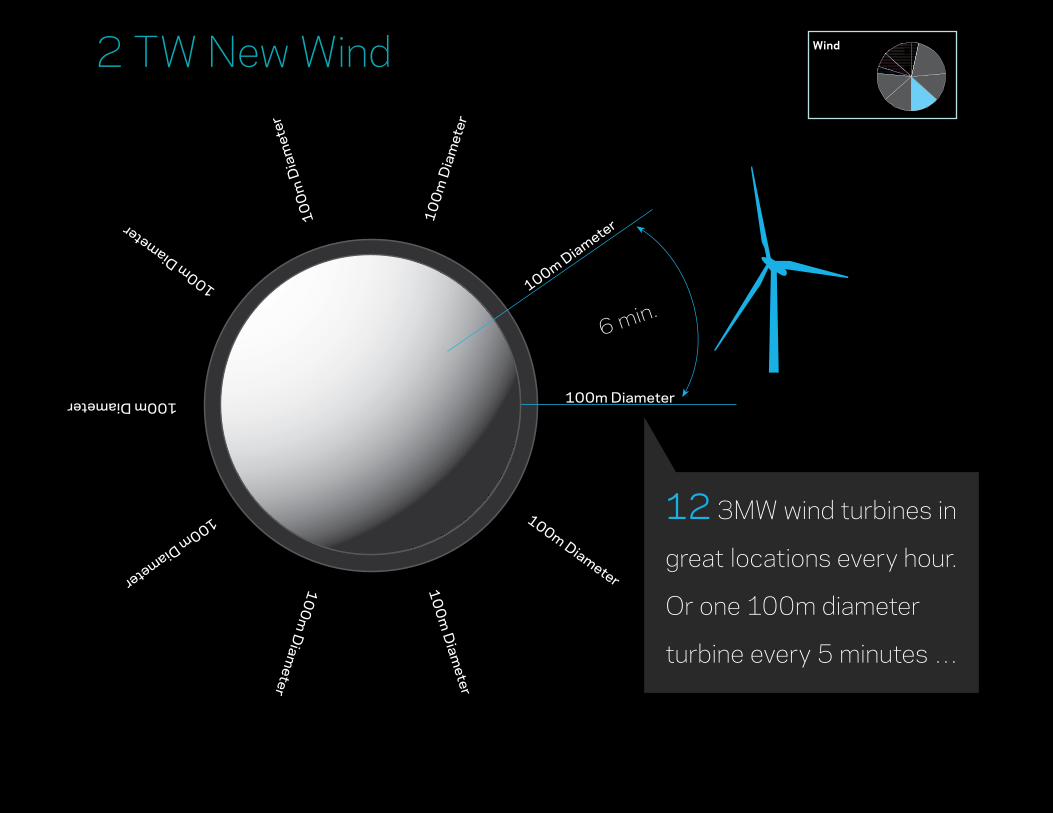
2TW New Wind
2TW New Geothermal
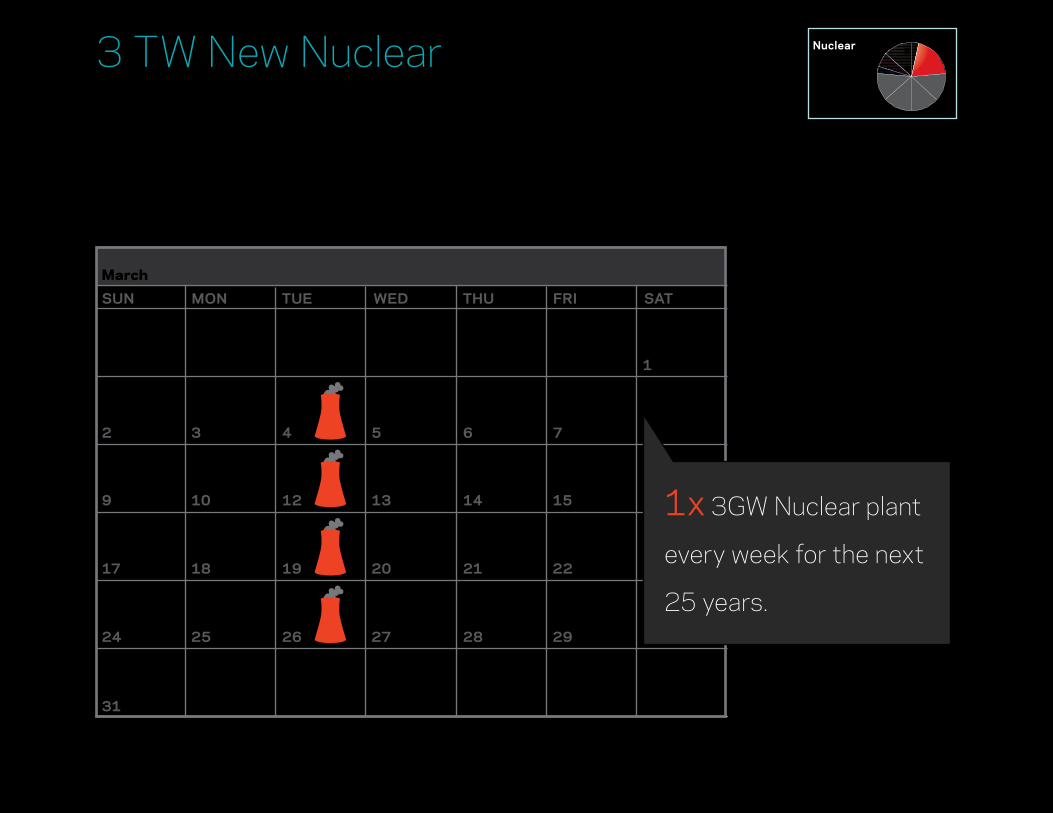
3TW New Nuclear
0.5TW New Other
Units shown in Terawatts (TW)2033 Energy Mix
Solar Thermal: 2
Fossil Fuels: 2
(carbon-free) Biofuels: 0.5
Existing Nuclear: 1
Existing Hydro / Renewables: 0.5
Wind:2
Nuclear: 3 Geothermal 2
Photo Voltaic Solar 2
16 TW
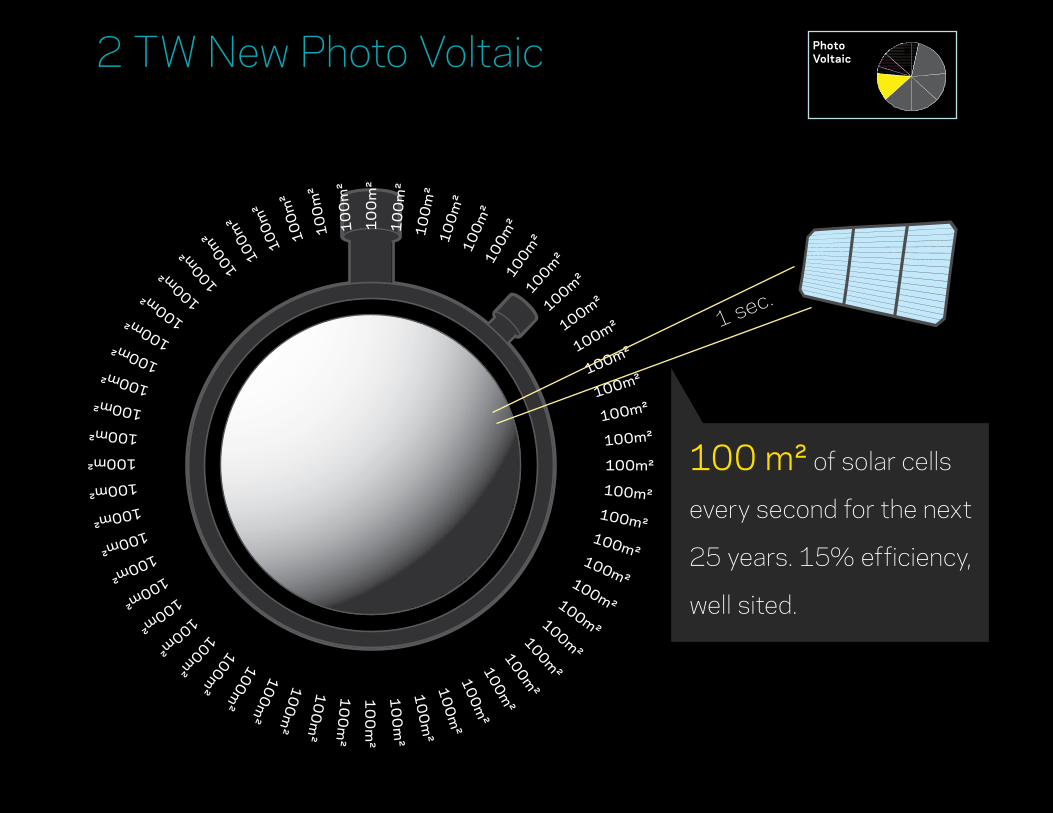
2 TW New Photo Voltaic
100m²
100m²100m²
100m²100m²100m²100m²100m²
100m²
100m²
100m
²
100
m²
100
m²
10
0m
²
10
0m
²
10
0m
²
10
0m
²1
00
m²
100
m²
100
m²
100m
²100m
²100m
²
100m²
100m²
100m²
100m²
100m²
100m²
100m²
100m²
100m²100m²
100m²100m² 100m² 100m² 100m²
100m²
100m²
100m²
100
m²
100
m²
10
0m
²
10
0m
²
10
0m
²
10
0m
²1
00
m²
100
m²
100
m²
100m²
100m²
100m²
100m²
100m²
100m²
100m²
100m²
100m²
100m²
100 m² of solar cells
every second for the next
25 years. 15% efficiency,
well sited.
1 sec.
Photo Voltaic
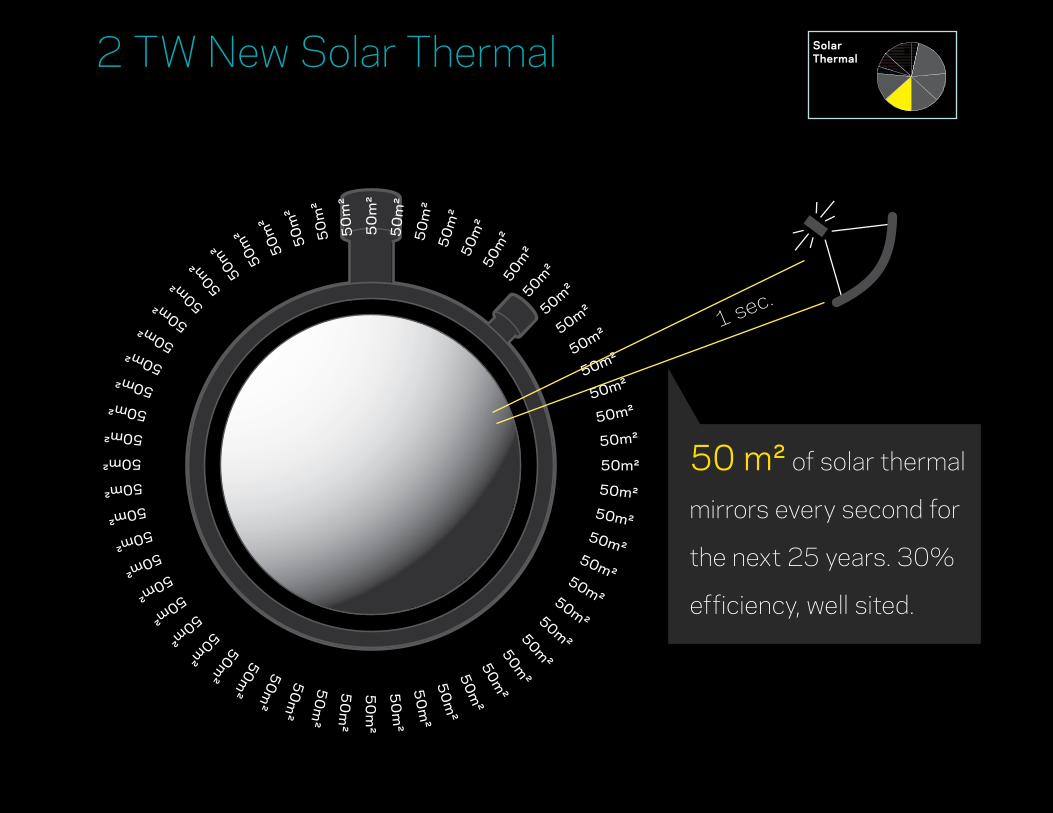
2 TW New Solar Thermal
50m²
50m²50m²
50m²50m²50m²50m²50m²50m
²50m²
50m²
50m
²
50
m²
50
m²
50
m²
50
m²
50
m²
50
m²
50m
²50m
²50m
²50m
²
50m²
50m²
50m²
50m²
50m²
50m²
50m²
50m²
50m²50m²
50m²50m² 50m² 50m² 50m² 50m
² 50m²
50m²
50m
²
50
m²
50
m²
50
m²
50
m²
50
m²
50
m²
50
m²
50m
²50m
²50m
²50m
²
50m²
50m²
50m²
50m²
50m²
50m²
50m²
50
m²
25 years50 m² of solar thermal
mirrors every second for
the next 25 years. 30%
efficiency, well sited.
1 sec.
Solar Thermal
100m Diameter
100m Diameter100
m D
iam
eter
100
m D
iam
eter
100m Diameter
100m Diameter
100m Diameter
100
m D
iameter
100
m D
iameter
100m Diameter
12 3MW wind turbines in
great locations every hour.
Or one 100m diameter
turbine every 5 minutes …
6 min.
2 TW New Wind Wind
SUN MON TUE WED THU FRI
1
8765432
1615141312109
23222120191817
30292827262524
31
SAT
March
3 TW New Nuclear
1x 3GW Nuclear plant
every week for the next
25 years.
Nuclear
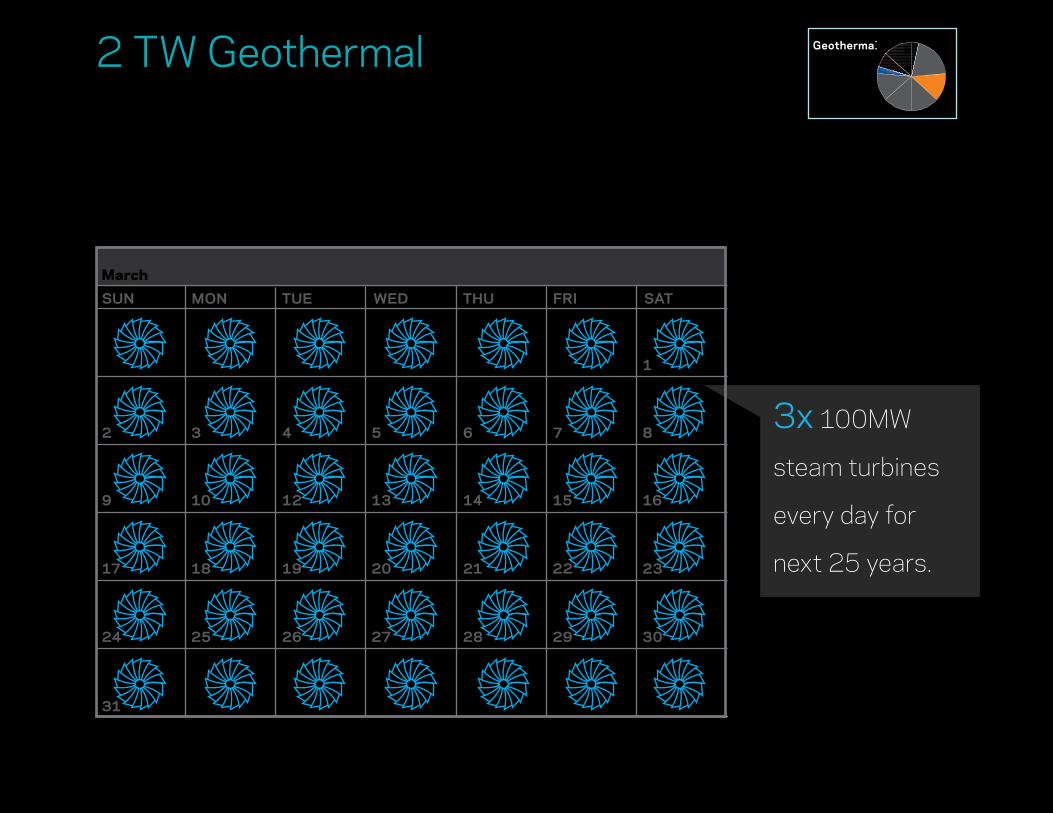
2 TW Geothermal
SUN MON TUE WED THU FRI
1
8765432
1615141312109
23222120191817
30292827262524
31
SAT
March
3x 100MW
steam turbines
every day for
next 25 years.
Geothermal
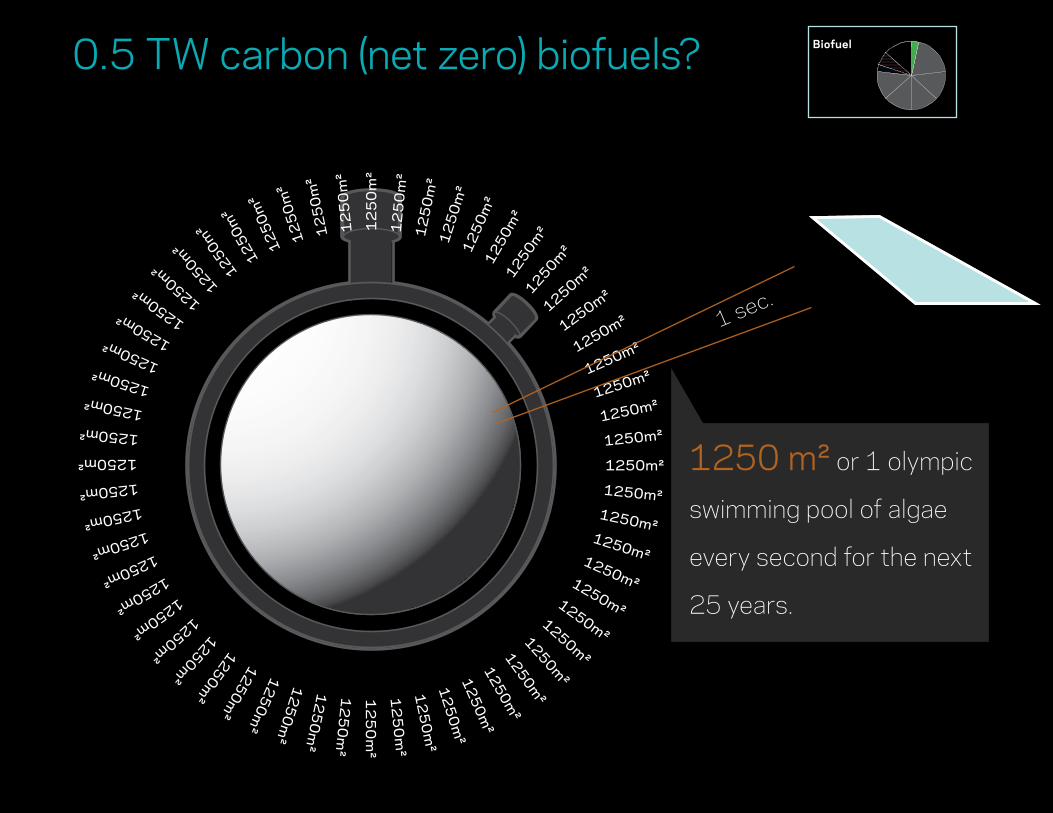
0.5 TW carbon (net zero) biofuels?
1250m²
1250m²1250m²
1250m²1250m²1250m²1250m²1250m²
1250m²
1250m²
1250m²
1250
m²
12
50
m²
12
50
m²
12
50
m²
12
50
m²
12
50
m²
12
50
m²
12
50
m²
1250
m²
1250m²
1250m²
1250m²
1250m²
1250m²
1250m²
1250m²
1250m²
1250m²
1250m²
1250m²
1250m²1250m²
1250m² 1250m² 1250m² 1250m²1250m²
1250m²
1250m²
1250m²
1250m
²
12
50
m²
12
50
m²
12
50
m²
12
50
m²
12
50
m²
12
50
m²
12
50
m²
1250m
²1250m
²1250m
²1250m
²
1250m²
1250m²
1250m²
1250m²
1250m²
1250m²
1250m²
1250 m² or 1 olympic
swimming pool of algae
every second for the next
25 years.
1 sec.
Biofuel
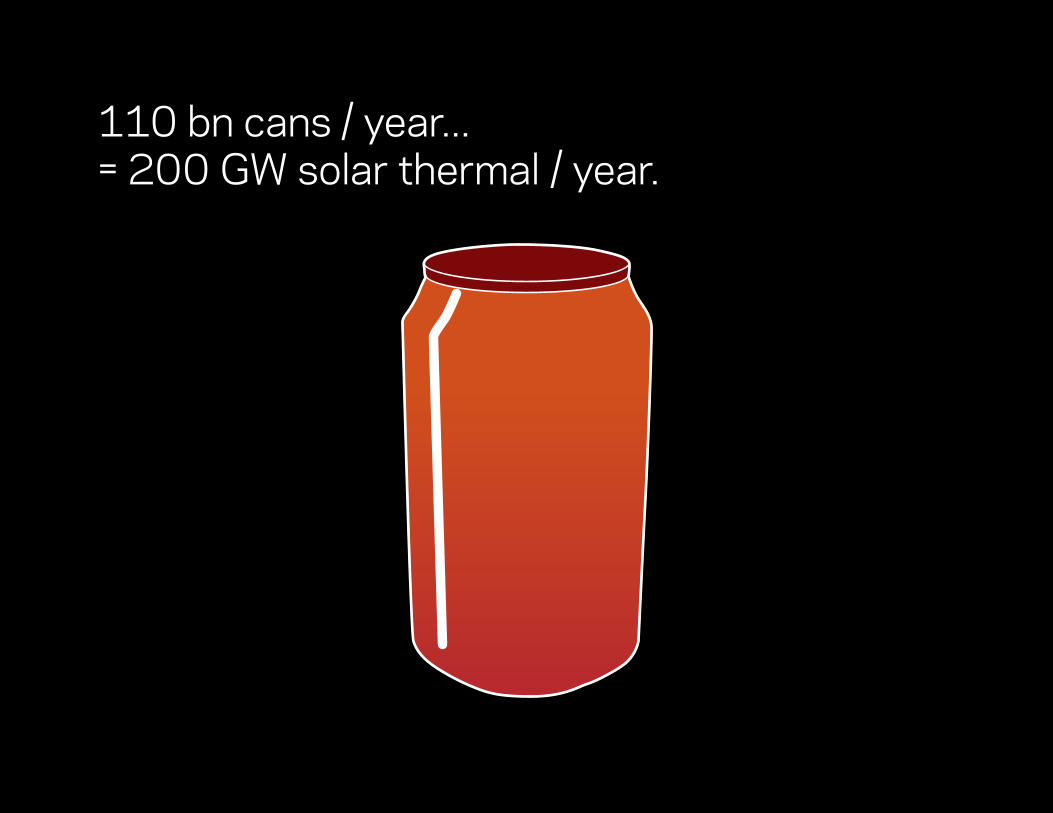
110 bn cans / year...= 200 GW solar thermal / year.
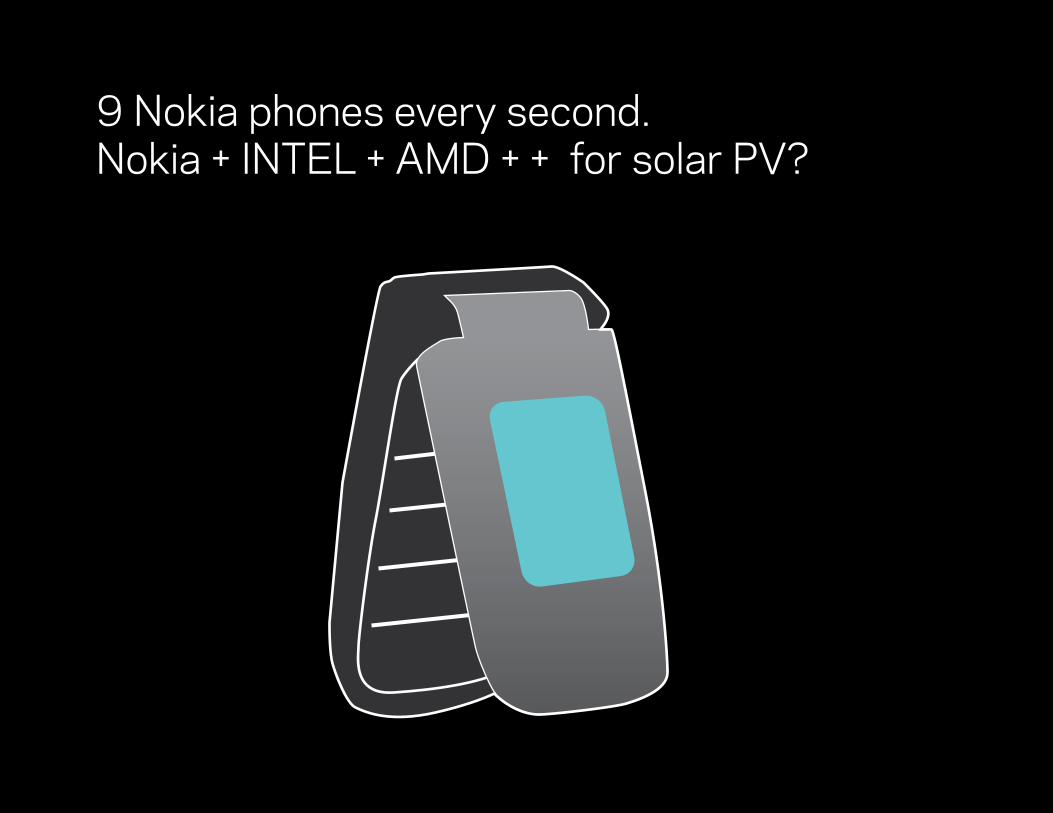
9 Nokia phones every second.Nokia + INTEL + AMD + + for solar PV?
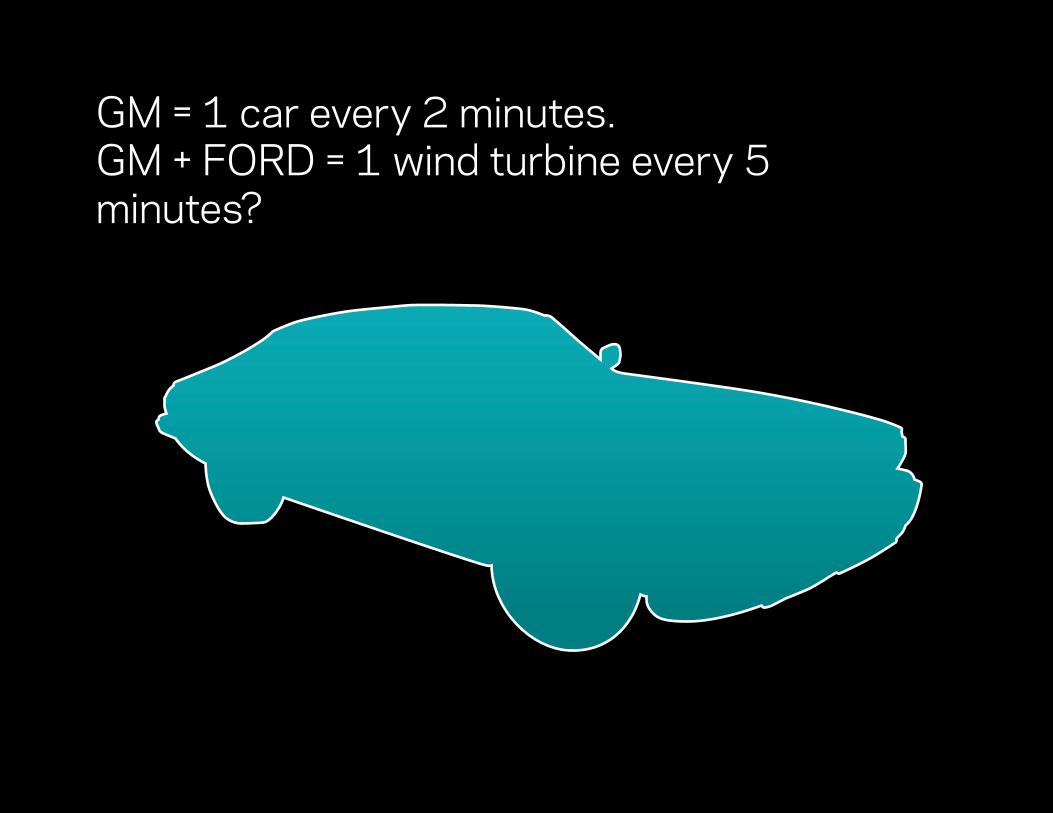
GM = 1 car every 2 minutes.GM + FORD = 1 wind turbine every 5 minutes?

Retooling for WWII.
More than 300 000 aircraft were built in the US between 1939 and 1945.
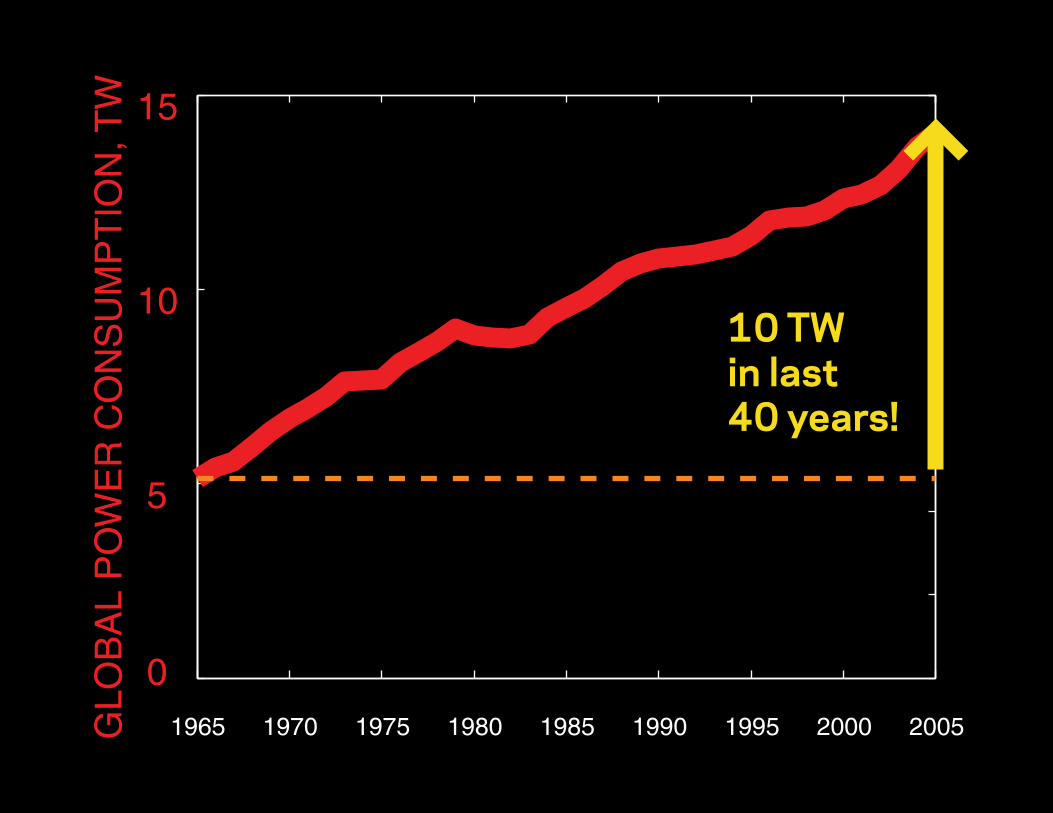
1965 1970 1975 1980 1985 1990 1995 2000 2005
0
5
10
15G
LOB
AL
PO
WE
R C
ON
SU
MP
TIO
N, T
W
10 TWin last40 years!
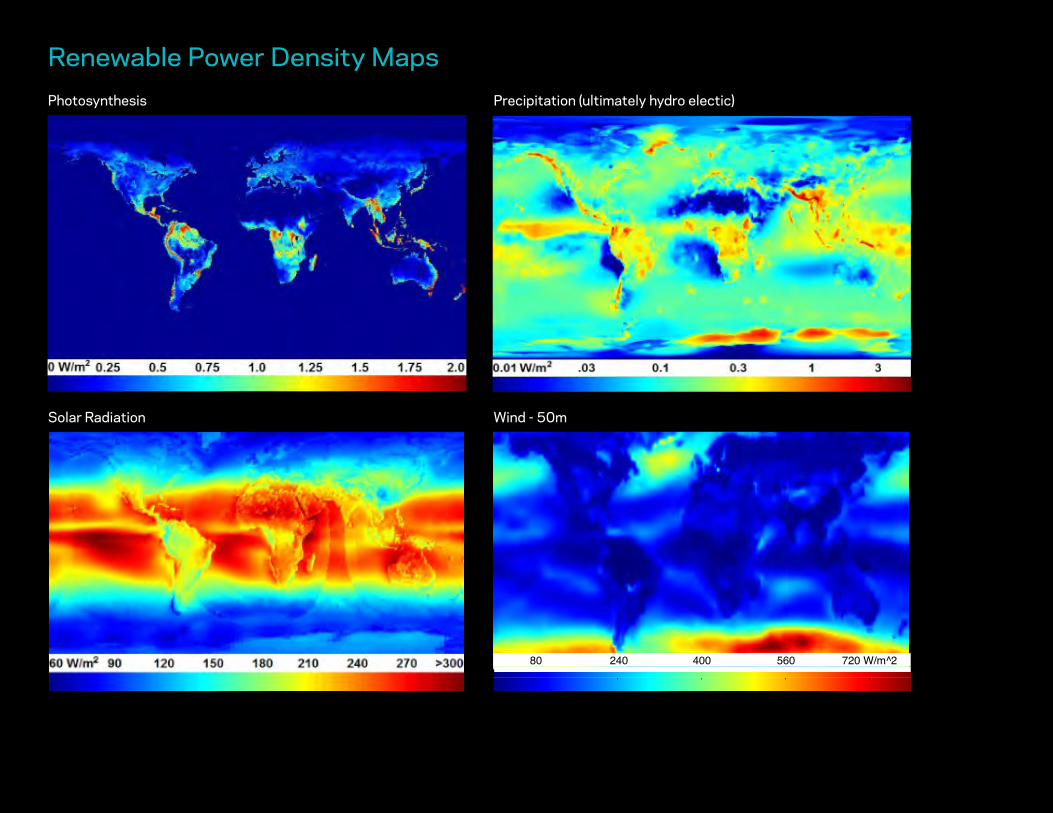
Renewable Power Density Maps
PhotosynthesisPrecipitation (ultimately hydro-electric)
Solar radiationSolar radiation
80 240 400 560 720 W/m^2
Photosynthesis
Solar Radiation
Precipitation (ultimately hydro electic)
Wind - 50m
80 240 400 560 720 W/m^2
80 240 400 560 720 W/m^280 240 400 560 720 W/m^2
50 100 150 200 250 300 350
20
40
60
80
100
120
140
160
180
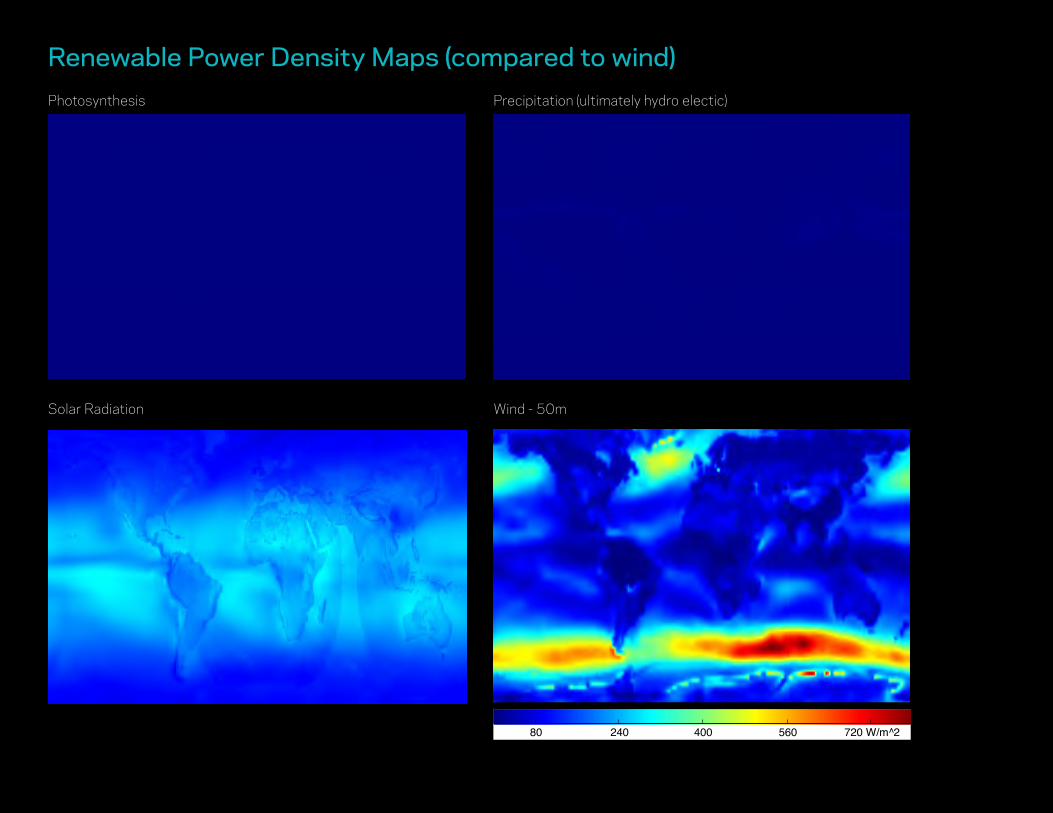
80 240 400 560 720 W/m^2 80 240 400 560 720 W/m^2
80 240 400 560 720 W/m^2
80 240 400 560 720 W/m^2
Photosynthesis Precipitation (ultimately hydro electic)
Renewable Power Density Maps (compared to wind)
Solar Radiation Wind - 50m
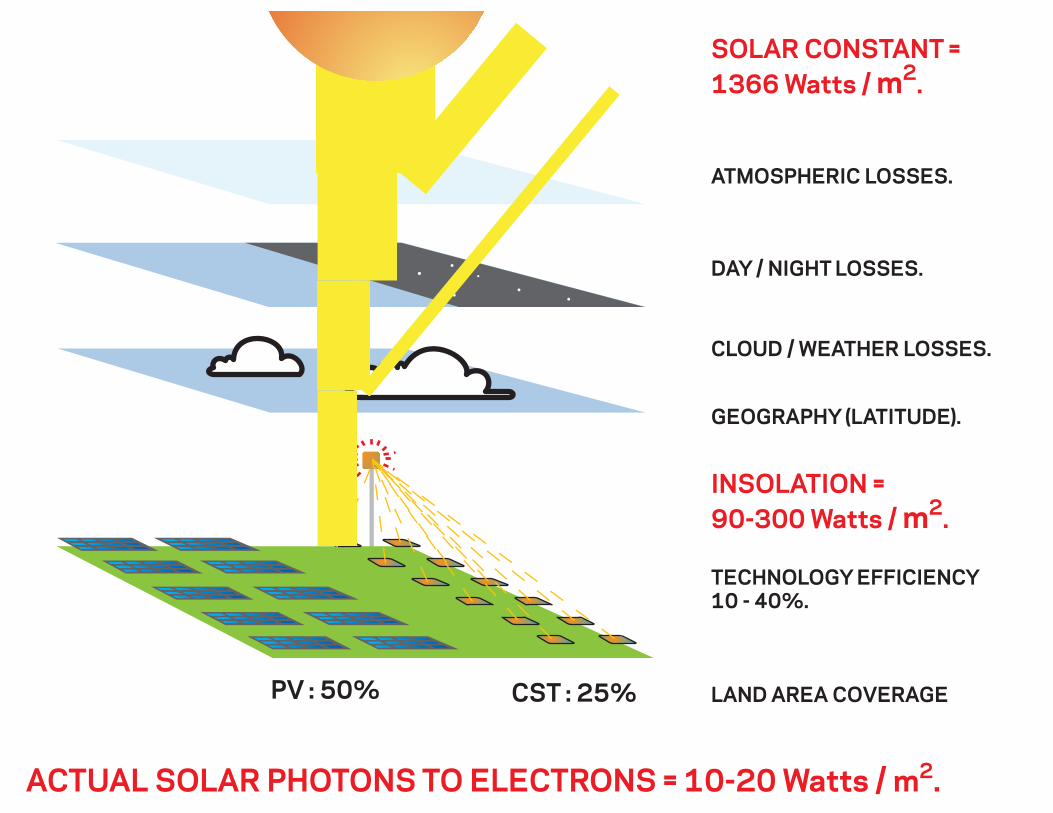
PV : 50% CST : 25%
ATMOSPHERIC LOSSES.
DAY / NIGHT LOSSES.
CLOUD / WEATHER LOSSES.
SOLAR CONSTANT = 1366 Watts / m2.
GEOGRAPHY (LATITUDE).
LAND AREA COVERAGE
INSOLATION =90-300 Watts / m2.
TECHNOLOGY EFFICIENCY10 - 40%.
ACTUAL SOLAR PHOTONS TO ELECTRONS = 10-20 Watts / m2.
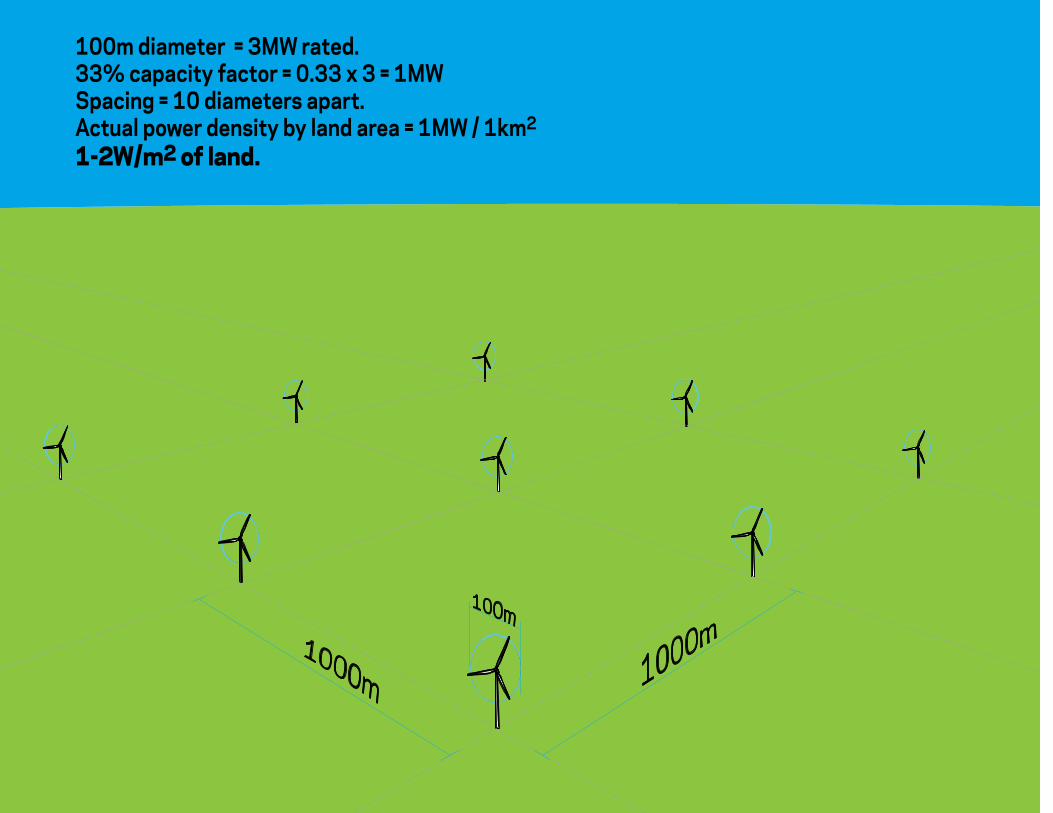
100m diameter = 3MW rated.33% capacity factor = 0.33 x 3 = 1MWSpacing = 10 diameters apart.Actual power density by land area = 1MW / 1km2
1-2W/m2 of land.
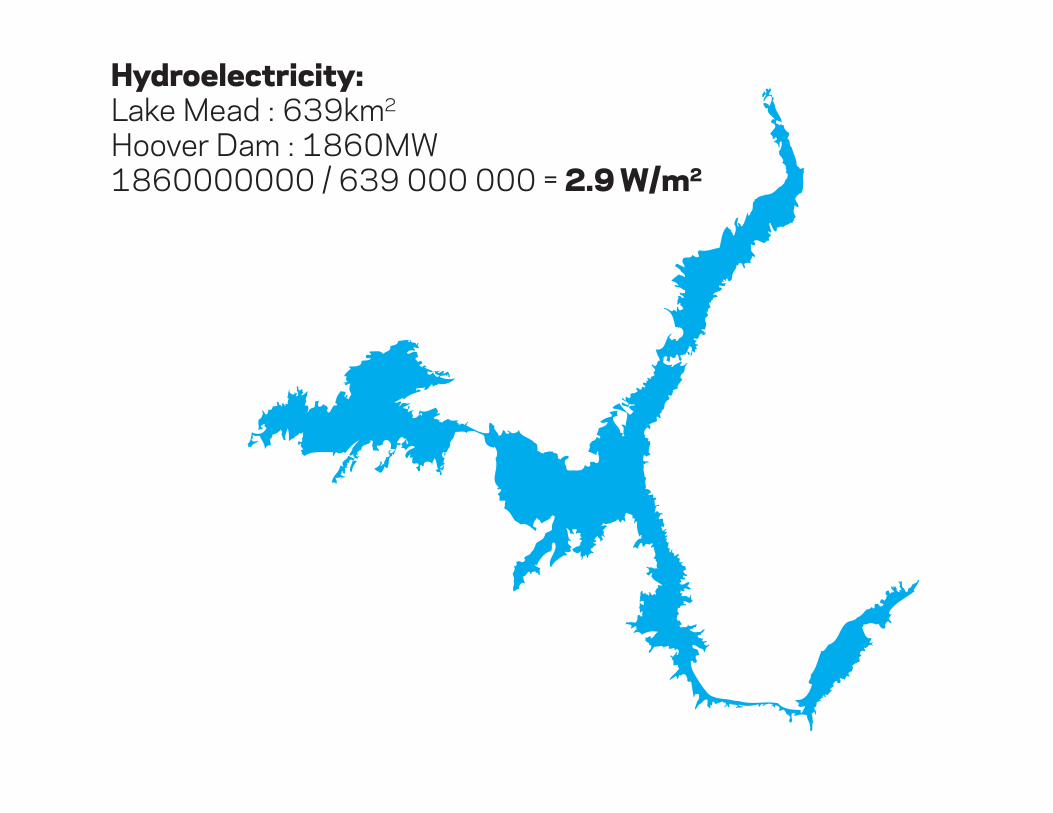
Hydroelectricity:Lake Mead : 639km2
Hoover Dam : 1860MW1860000000 / 639 000 000 = 2.9 W/m2
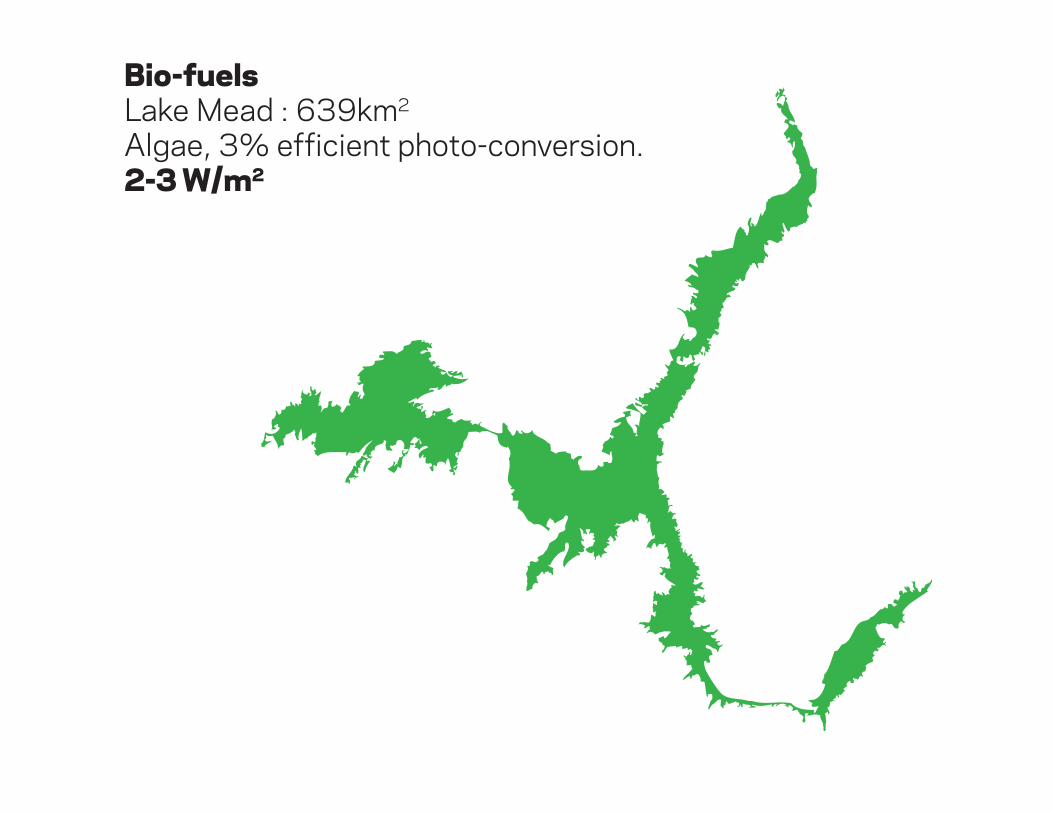
Bio-fuelsLake Mead : 639km2
Algae, 3% efficient photo-conversion.2-3 W/m2
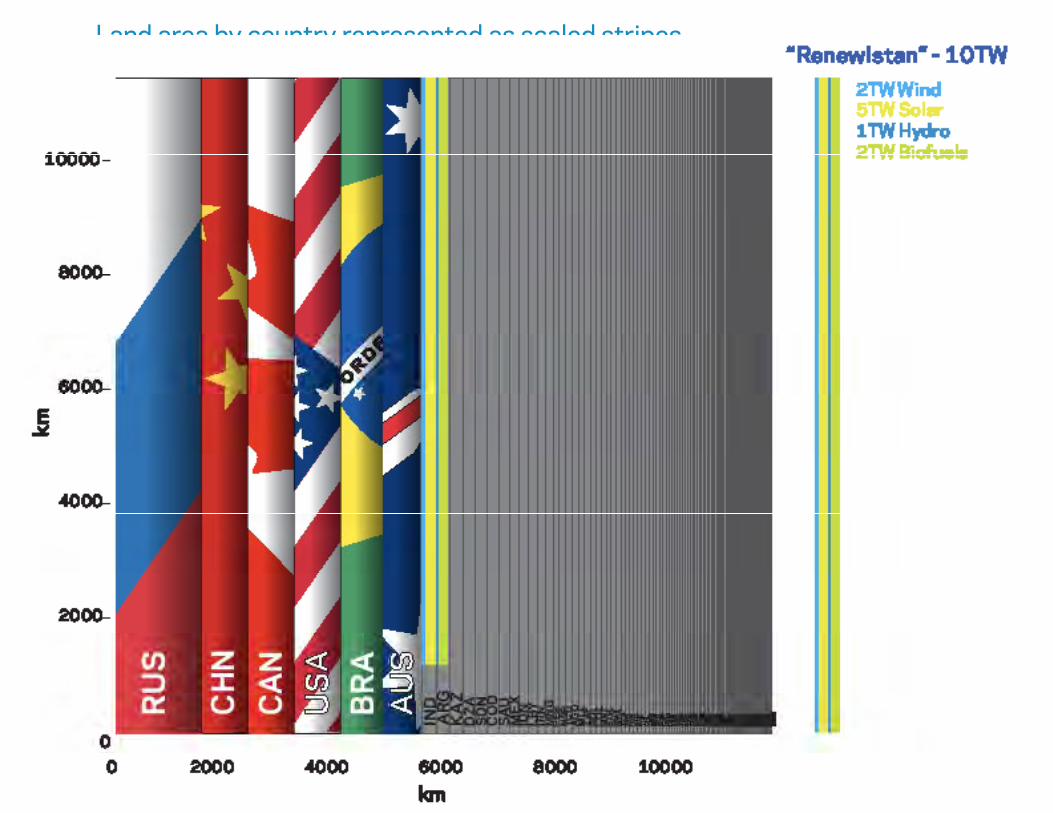
Land area by country represented as scaled stripes
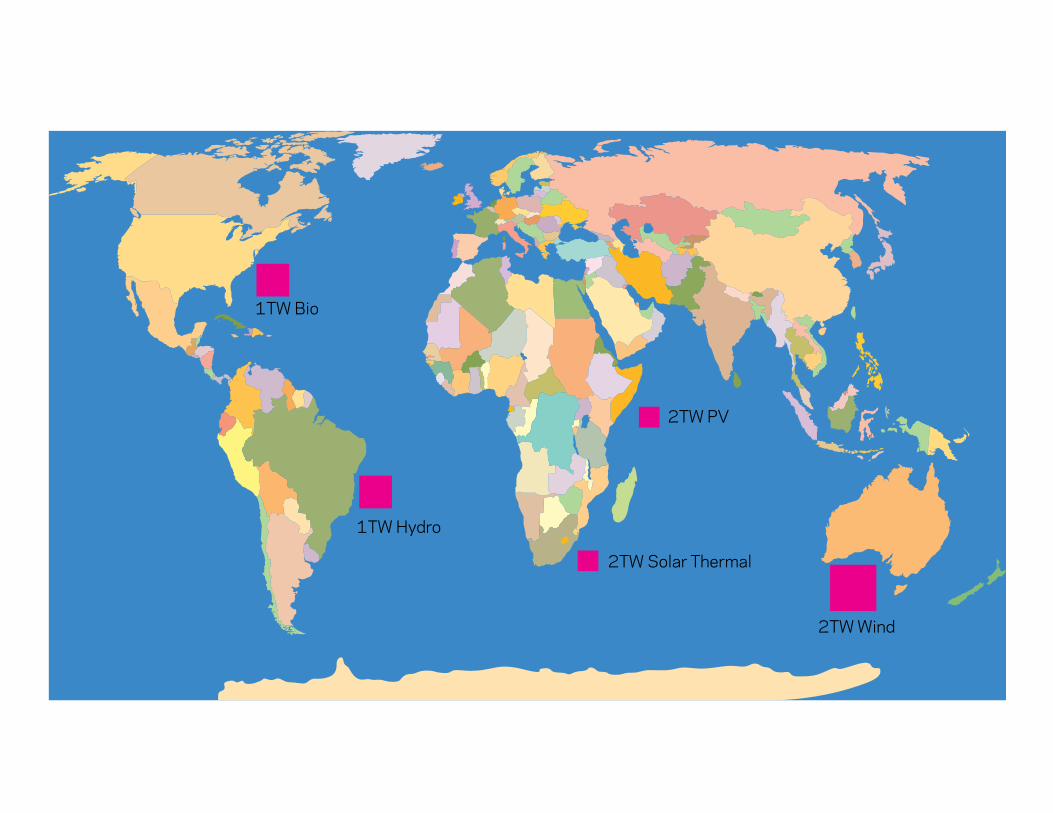
2TW Wind
2TW Solar Thermal
2TW PV
1TW Hydro
1TW Bio
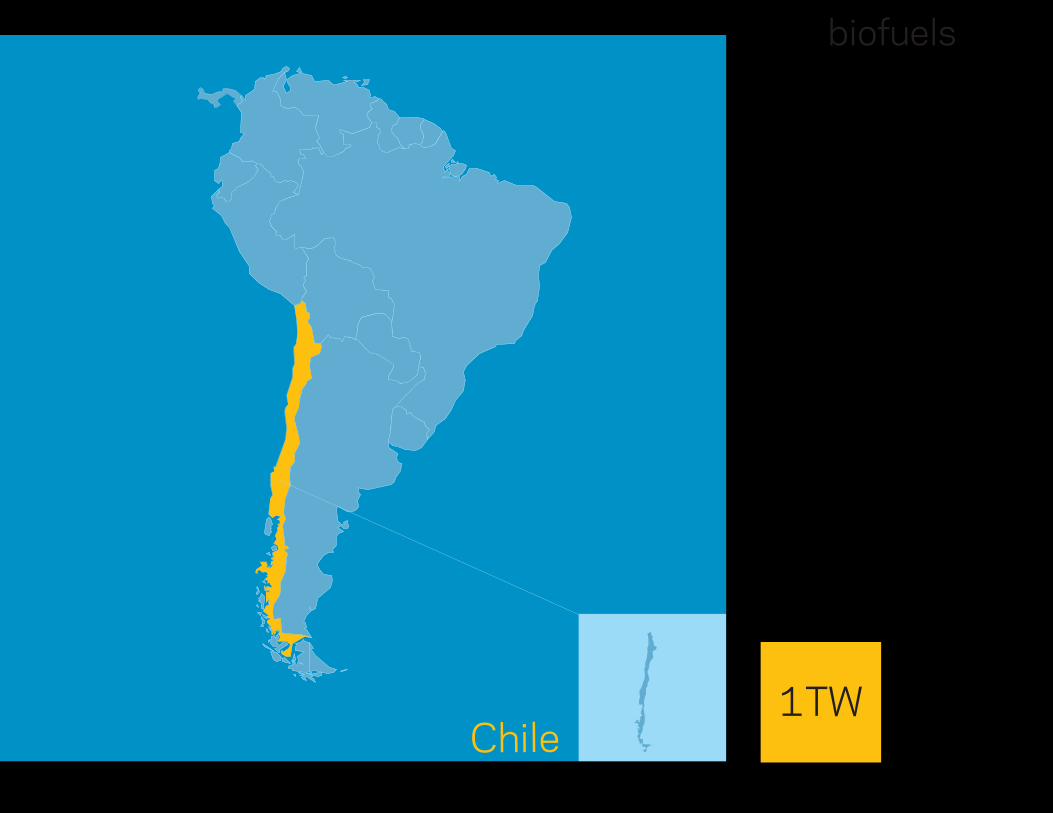
biofuels
Chile1TW
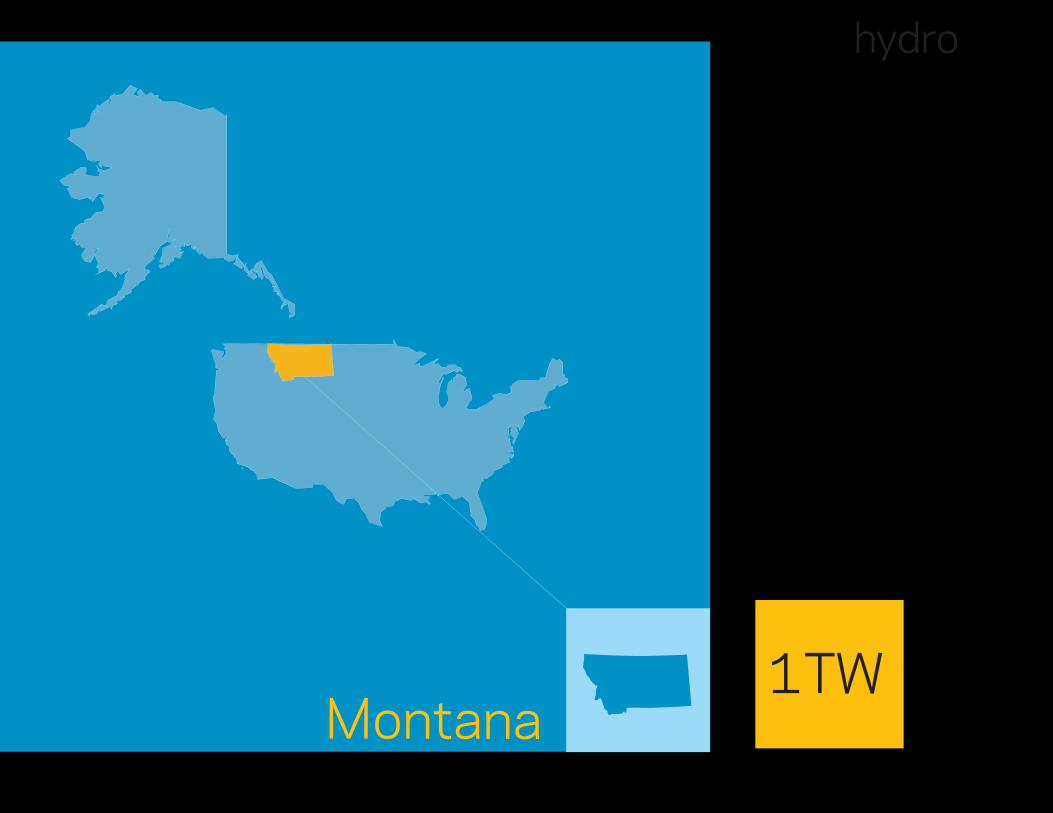
hydro
Montana1TW
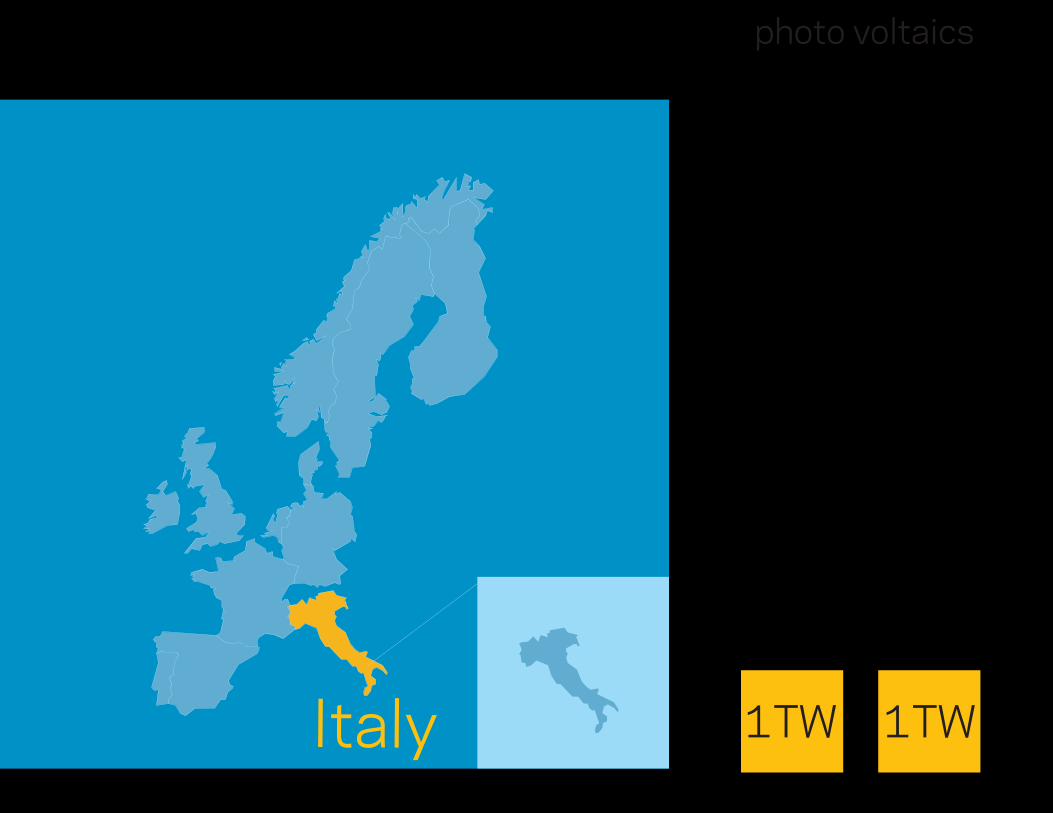
photo voltaics
1TW 1TWItaly

solar thermal
1TW 1TWNew Zealand
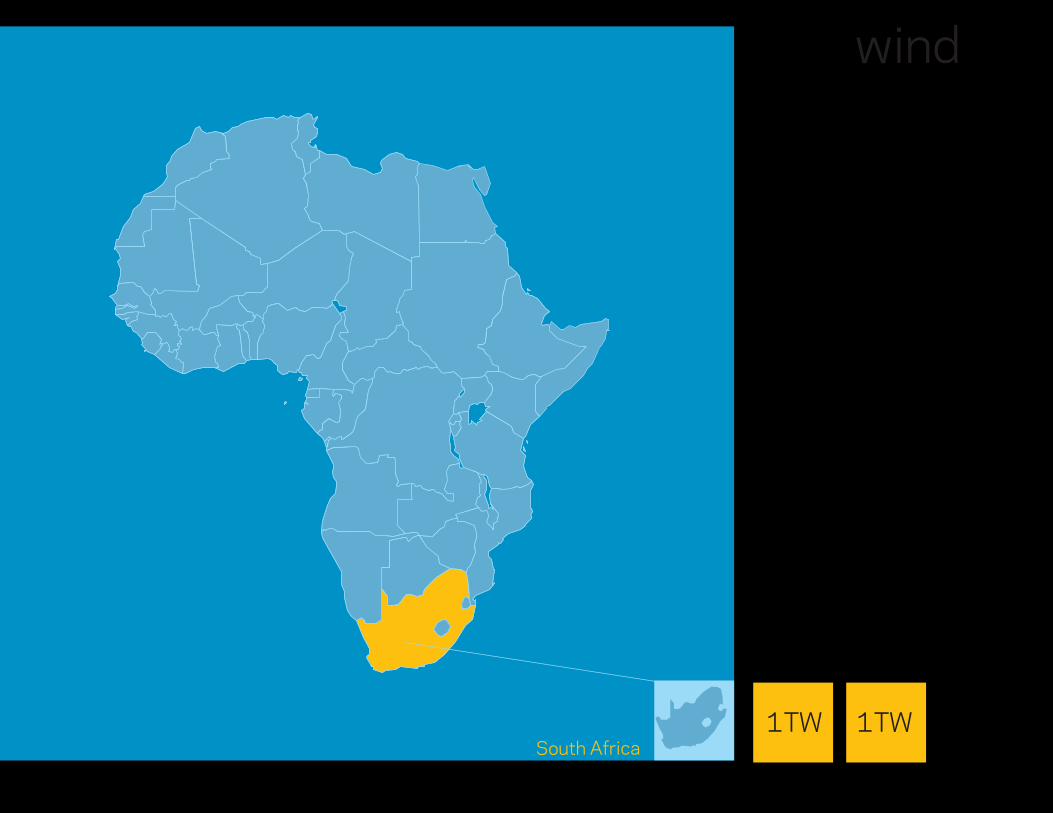
wind
South Africa1TW 1TW

1 Joule of fossil energy used produces 4.9x10⁻²¹ ppm increase.
How many ppm to replace every gasoline car in the world (1bN) with a 1000kg electric vehicle? = 0.49 ppm
How many ppm for 250 million new green homes? = 8.9 ppm
How many ppm for installing :
5TW solar = 6.1 ppm3TW wind = 0.55 ppm2TW geothermal = 0.49 ppm
So there is + 19 ppm right there. Scary.
Might be good to ask questions of form:
How many ppm for 6 bN new laptops? = 0.05 ppm6 bN cellphones? = 0.03 ppm6 bN 100 Watt lightbulbs burning for 1 year? = 0.2ppm
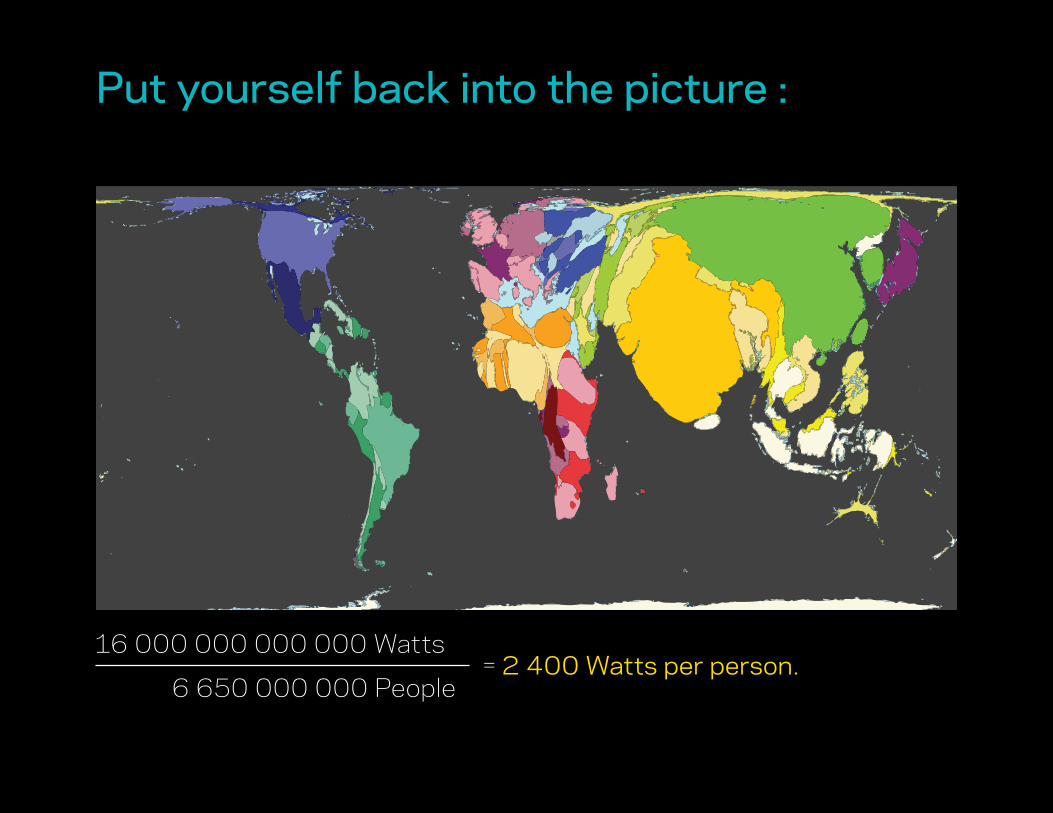
Put yourself back into the picture :
6 650 000 000 People
16 000 000 000 000 Watts= 2 400 Watts per person.
SFO
TO LH
R 4
10
W
LHR-S
FO 410 W
SFO-ATL 160 W
ATL-SFO 160 W
SFO-ATL-CPH 510 W
HEL-AMS-ATL-SFO 570 W
OAK-OGG-HON-OAK 560 W
SFO-BOS 210 W
BOS-SFO 210 W
OAK-DC 180 W
DC-OAK 180 W
OAK-ORD-MON-QUE 210 WQUE-DTW-SFO 210 WSFO-JFK 200 WJFK-SFO 200 W
OAK-BUR 20 W
BUR-OAK 20 W
SFO-BOS 210 WBOS-ORD 70 W
ORD-SFO 140 WSFO-JFK 200 W
JFK-SFO 200 W
SJC-SJO 230 W
SJO-SJC 230 W
SJC-VIJ 280 W
VIJ-SJC 280 W
SFO-SYD1140 W
SFO-DR 310 W
DR-SFO 3
10 W
SFO-O
AK 280 W
OAK
-SFO
280
W
'SFO TO LHR' 'LHR-SFO' 'SFO-ATL' 'ATL-SFO' 'SFO-ATL-CPH' 'HEL-AMS-ATL-SFO' 'OAK-OGG-HON-OAK' 'SFO-BOS' 'BOS-SFO' 'OAK-DC' 'DC-OAK' 'OAK-ORD-MON-QUE' 'QUE-DTW-SFO' 'SFO-JFK' 'JFK-SFO' 'OAK-BUR' 'BUR-OAK' 'SFO-BOS' 'BOS-ORD' 'ORD-SFO''SFO-JFK' 'JFK-SFO' 'SJC-SJO' 'SJO-SJC' 'SJC-VIJ' 'VIJ-SJC''SFO-SYD' 'SFO-DR' 'DR-SFO' 'SFO-OAK' 'OAK-SFO'
HO
ND
A IN
SIG
HT
310
W
DU
NE
BUG
GY
VW 1
50 W
TOYO
TA H
ILU
X 1
60 W
DO
DG
E S
PRIN
TER
100
WTO
YOTA
TA
CO
MA
240
W
TAX
IOR
REN
TAL
47
0 W
SH
OW
ERS
GA
S 7
0 W
CO
OK
ING
GA
S 3
0 W
HEATIN
G G
AS
400 WFR
IDG
E ELEC 30 W
CO
MPU
TER ELEC
10 WLA
PTOP ELEC
1 W
STER
EO ELEC
1 WLIG
HTS
ELEC 70 W
OTH
ER ELEC
8 W
MEAT & EG
GS 160 W
DAIRY 50 W
FATS AND OILS 30 W
FRUIT, VEG & NUTS 90 W
CEREALS & GRAINS 10 W
SUGAR 20 WBEER & W
INE 60 W
COFFEE 20 W
AG. PESTICIDES 10 W
AG. FERTILIZER 50 W
AG. ELECTRIC 40 W
AG. FO
SSILFUELS 80 W
WO
RKELECTRIC 410 W
WORKHEAT 200 W
CARS 560 W
BOATS 50 W
INTERNET 70 W
COMPUTERS 700 W
ELECTRONICS 250 W
NEWS 180 W
BIKES 6 WWATER 160 W
WASTEDISPOSAL 9 W TRANSPORTTOME 40 W
TEXTILES 90 W
BOOKS 130 W
MISCSTUFF1000 W
HOUSE 260 WRECREATION 110 W
HEALTHCARE 680 WFINANCE 60 WEDUCATION 340 W
WHITEGOODS 8 W
DEFENSE 100 W
ENERGY 4 W
GSA 2 W
HHS 1 W
JUSTICE 4
W
NASA 1 W
POSTAL-SERVIC
E 5 W
VETERANS-AFFAIRS 3 W
OTHER 4 W
STREETLIGHTS 4
W
GOV.VEHICLES 3
W
ROADS 330 W
OTHER 3 W
NON-
ACCO
UNTED
2960
W
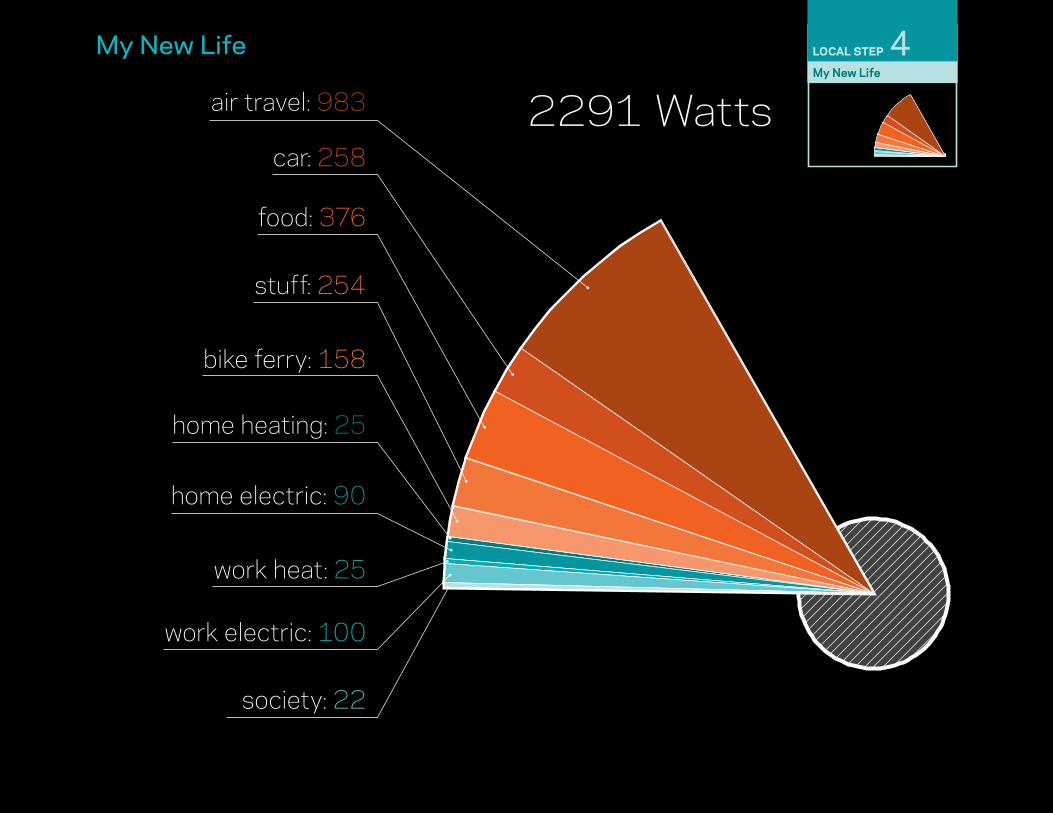
My New Life
2291 Wattsair travel: 983
car: 258
food: 376
stuff: 254
bike ferry: 158
home heating: 25
home electric: 90
work heat: 25
work electric: 100
society: 22
My New Life
LOCAL STEP 4
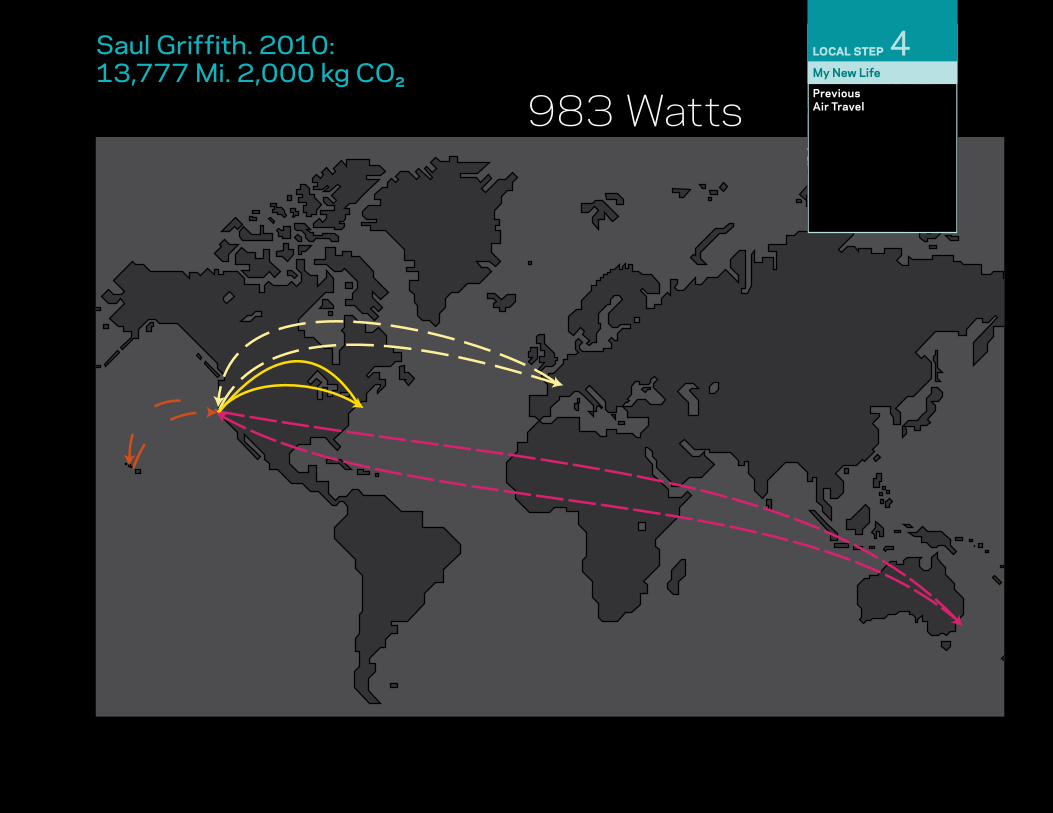
Saul Griffith. 2010 : 13,777 Miles. 983 Watts equivalent. 2,000 kg CO2
Saul Griffith. 2010: 13,777 Mi. 2,000 kg CO2 My New Life
LOCAL STEP 4Previous Air Travel983 Watts
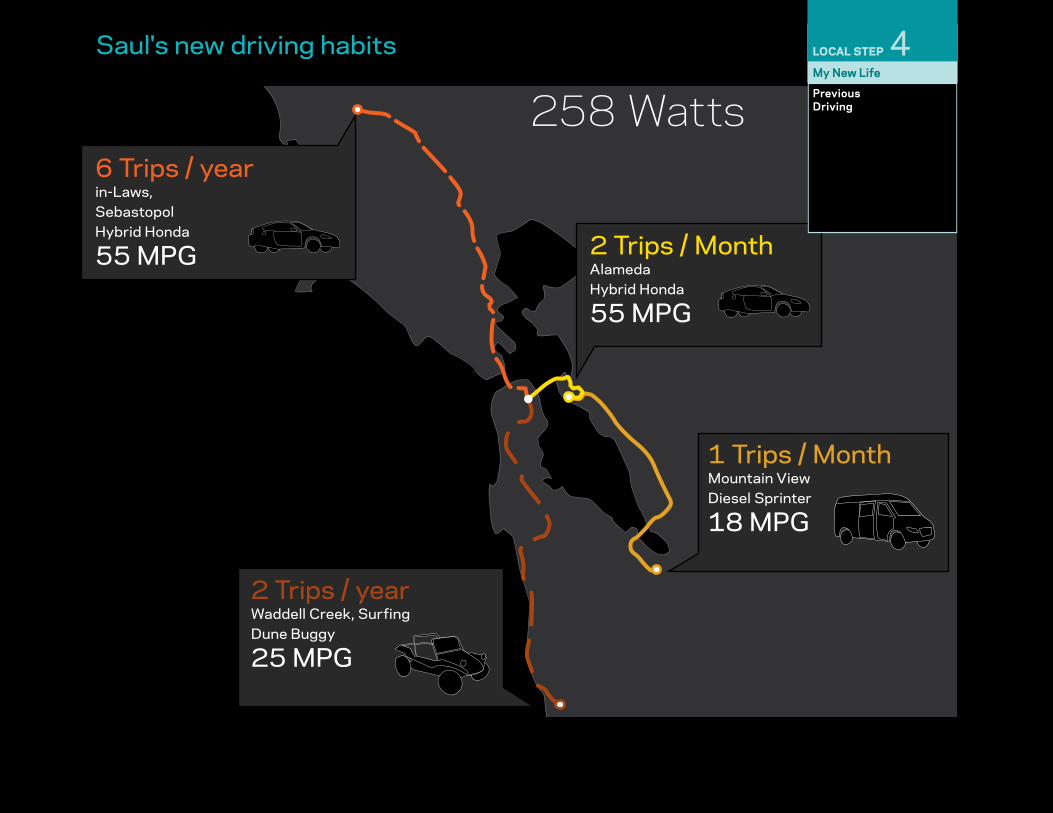
1 Trips / Month Mountain ViewDiesel Sprinter
18 MPG
6 Trips / year in-Laws, SebastopolHybrid Honda
55 MPG
2 Trips / year Waddell Creek, SurfingDune Buggy
25 MPG
Saul's new driving habits
2 Trips / Month AlamedaHybrid Honda
55 MPG
My New Life
LOCAL STEP 4Previous Driving258 Watts
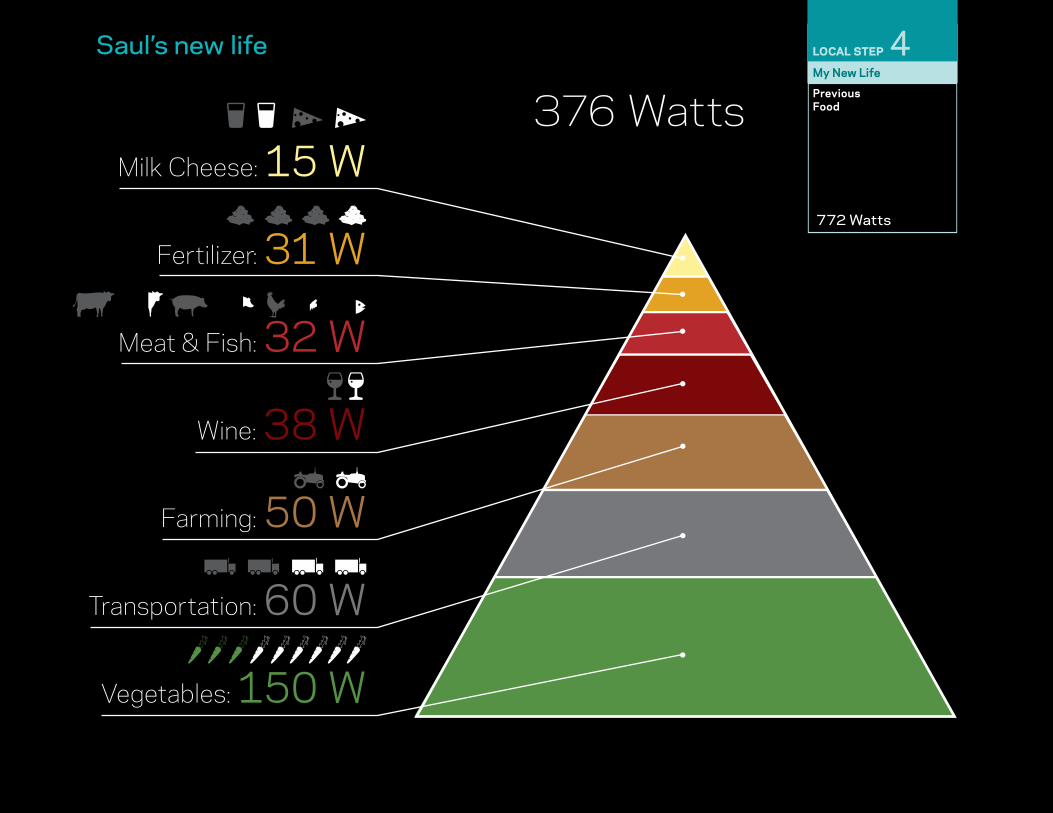
Milk Cheese: 15 W376 Watts
Wine: 38 W
Vegetables: 150 W
Farming: 50 W
Transportation: 60 W
Fertilizer: 31 W
Meat & Fish: 32 W
Saul’s new lifeMy New Life
LOCAL STEP 4Previous Food
772 Watts
rest of life 11369
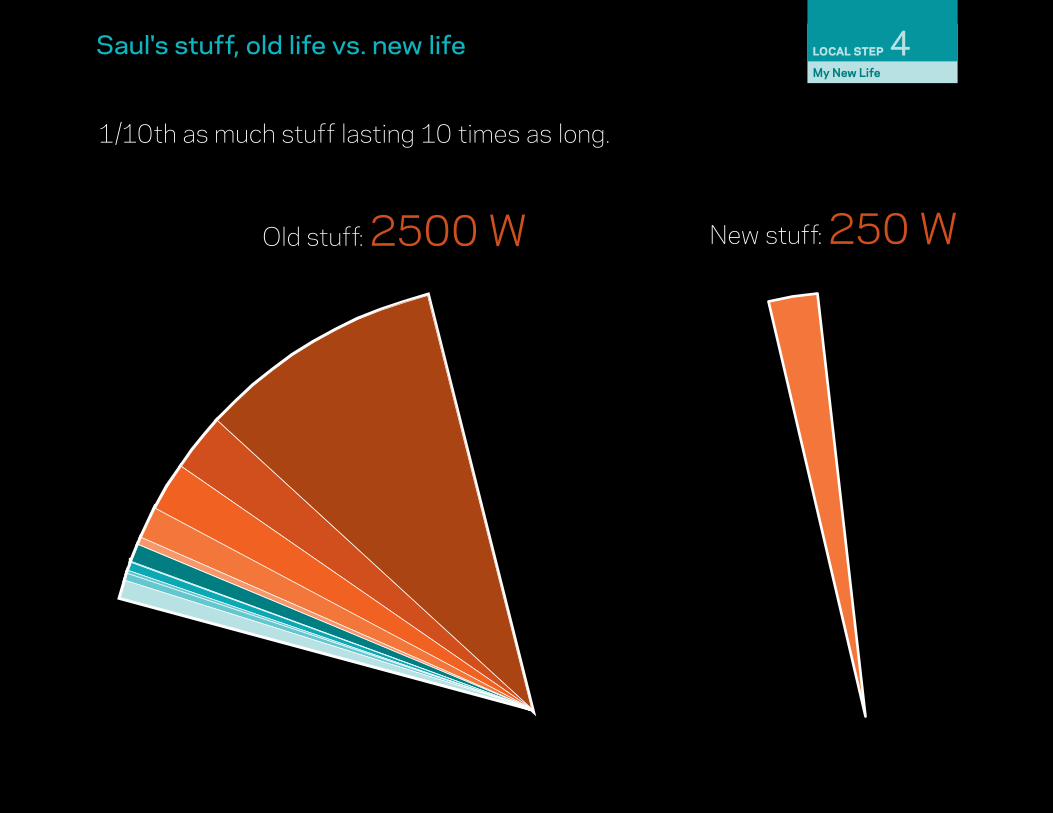
Saul's stuff, old life vs. new life
1/10th as much stuff lasting 10 times as long.
New stuff: 250 W Old stuff: 2500 W
My New Life
LOCAL STEP 4
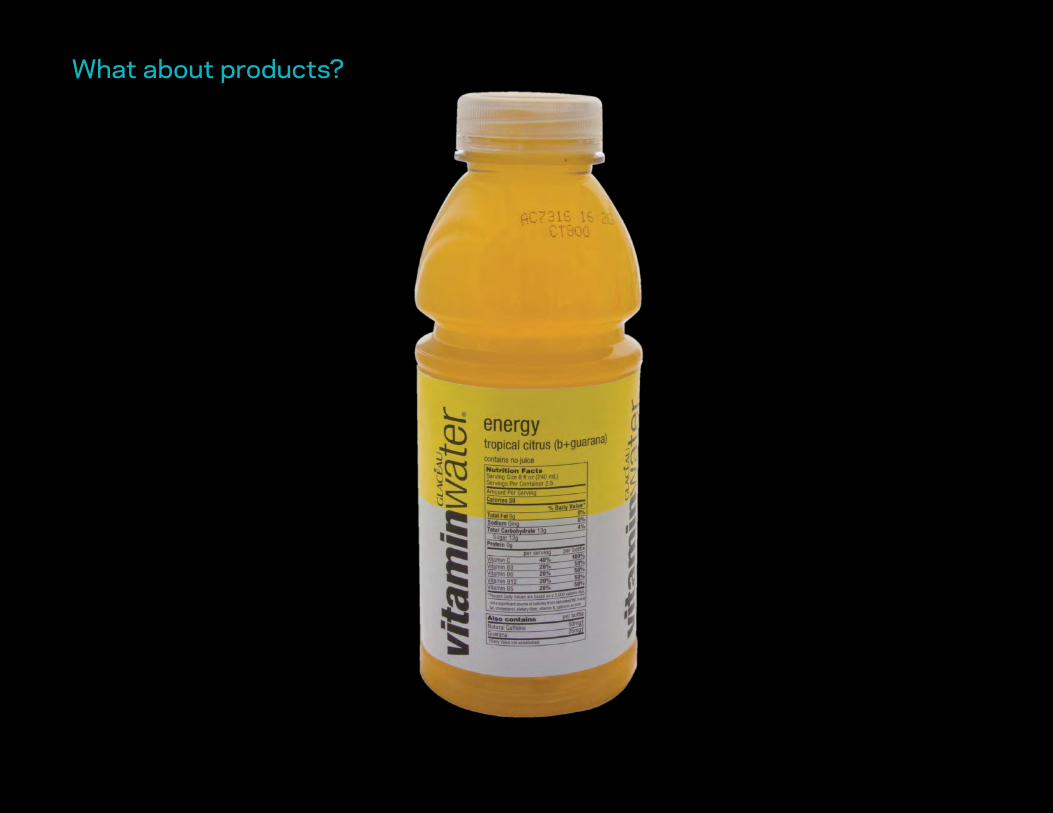
What about products?
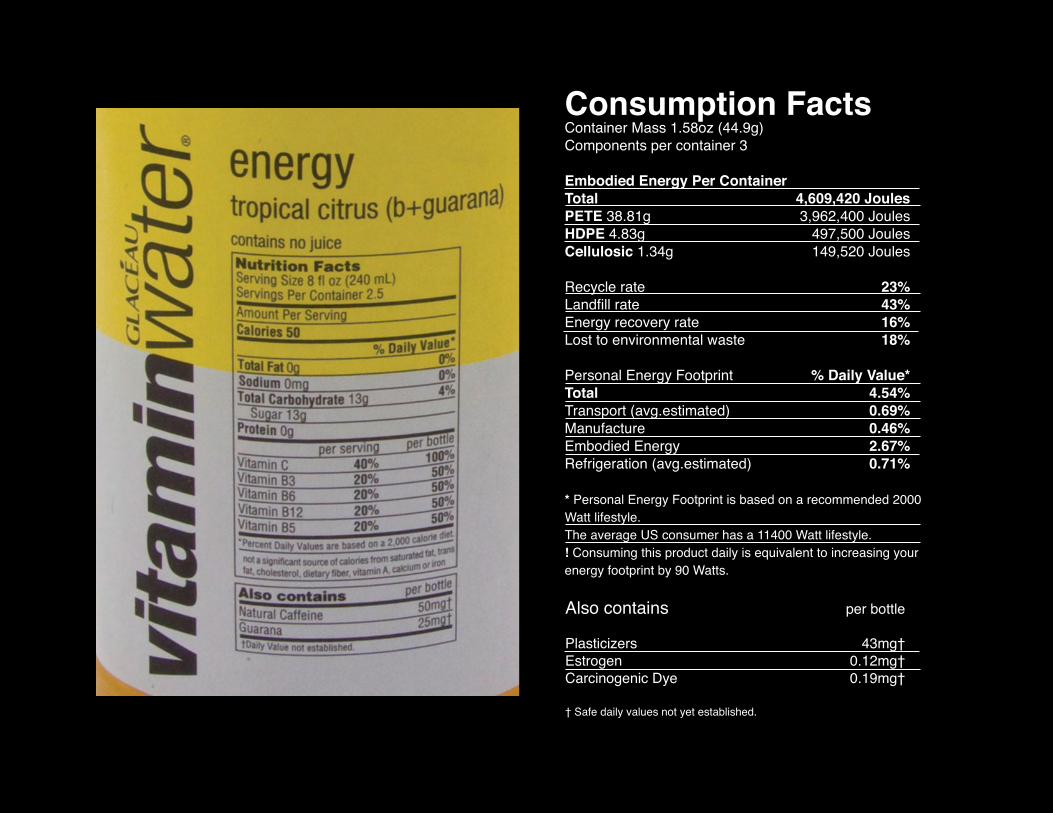
Also contains per bottle
Plasticizers 43mg†Estrogen 0.12mg†Carcinogenic Dye 0.19mg†
† Safe daily values not yet established.
Consumption FactsContainer Mass 1.58oz (44.9g)Components per container 3
Embodied Energy Per ContainerTotal 4,609,420 JoulesPETE 38.81g 3,962,400 JoulesHDPE 4.83g 497,500 JoulesCellulosic 1.34g 149,520 Joules
Recycle rate 23%Landfill rate 43%Energy recovery rate 16%Lost to environmental waste 18%
Personal Energy Footprint % Daily Value*Total 4.54%Transport (avg.estimated) 0.69%Manufacture 0.46%Embodied Energy 2.67%Refrigeration (avg.estimated) 0.71%
* Personal Energy Footprint is based on a recommended 2000 Watt lifestyle. The average US consumer has a 11400 Watt lifestyle.! Consuming this product daily is equivalent to increasing your energy footprint by 90 Watts.
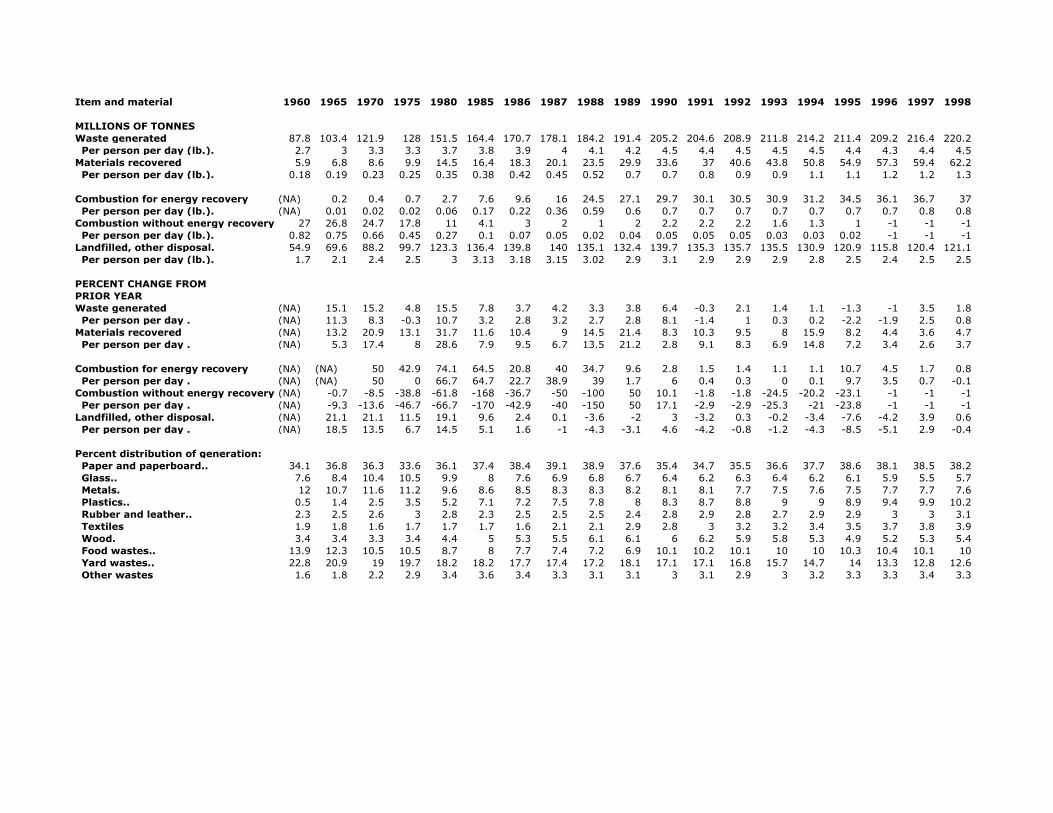
Item and material 1960 1965 1970 1975 1980 1985 1986 1987 1988 1989 1990 1991 1992 1993 1994 1995 1996 1997 1998
MILLIONS OF TONNESWaste generated 87.8 103.4 121.9 128 151.5 164.4 170.7 178.1 184.2 191.4 205.2 204.6 208.9 211.8 214.2 211.4 209.2 216.4 220.2 Per person per day (lb.). 2.7 3 3.3 3.3 3.7 3.8 3.9 4 4.1 4.2 4.5 4.4 4.5 4.5 4.5 4.4 4.3 4.4 4.5Materials recovered 5.9 6.8 8.6 9.9 14.5 16.4 18.3 20.1 23.5 29.9 33.6 37 40.6 43.8 50.8 54.9 57.3 59.4 62.2 Per person per day (lb.). 0.18 0.19 0.23 0.25 0.35 0.38 0.42 0.45 0.52 0.7 0.7 0.8 0.9 0.9 1.1 1.1 1.2 1.2 1.3 Combustion for energy recovery (NA) 0.2 0.4 0.7 2.7 7.6 9.6 16 24.5 27.1 29.7 30.1 30.5 30.9 31.2 34.5 36.1 36.7 37 Per person per day (lb.). (NA) 0.01 0.02 0.02 0.06 0.17 0.22 0.36 0.59 0.6 0.7 0.7 0.7 0.7 0.7 0.7 0.7 0.8 0.8Combustion without energy recovery. 27 26.8 24.7 17.8 11 4.1 3 2 1 2 2.2 2.2 2.2 1.6 1.3 1 -1 -1 -1 Per person per day (lb.). 0.82 0.75 0.66 0.45 0.27 0.1 0.07 0.05 0.02 0.04 0.05 0.05 0.05 0.03 0.03 0.02 -1 -1 -1Landfilled, other disposal. 54.9 69.6 88.2 99.7 123.3 136.4 139.8 140 135.1 132.4 139.7 135.3 135.7 135.5 130.9 120.9 115.8 120.4 121.1 Per person per day (lb.). 1.7 2.1 2.4 2.5 3 3.13 3.18 3.15 3.02 2.9 3.1 2.9 2.9 2.9 2.8 2.5 2.4 2.5 2.5 PERCENT CHANGE FROM PRIOR YEAR Waste generated (NA) 15.1 15.2 4.8 15.5 7.8 3.7 4.2 3.3 3.8 6.4 -0.3 2.1 1.4 1.1 -1.3 -1 3.5 1.8 Per person per day . (NA) 11.3 8.3 -0.3 10.7 3.2 2.8 3.2 2.7 2.8 8.1 -1.4 1 0.3 0.2 -2.2 -1.9 2.5 0.8Materials recovered (NA) 13.2 20.9 13.1 31.7 11.6 10.4 9 14.5 21.4 8.3 10.3 9.5 8 15.9 8.2 4.4 3.6 4.7 Per person per day . (NA) 5.3 17.4 8 28.6 7.9 9.5 6.7 13.5 21.2 2.8 9.1 8.3 6.9 14.8 7.2 3.4 2.6 3.7 Combustion for energy recovery (NA) (NA) 50 42.9 74.1 64.5 20.8 40 34.7 9.6 2.8 1.5 1.4 1.1 1.1 10.7 4.5 1.7 0.8 Per person per day . (NA) (NA) 50 0 66.7 64.7 22.7 38.9 39 1.7 6 0.4 0.3 0 0.1 9.7 3.5 0.7 -0.1Combustion without energy recovery. (NA) -0.7 -8.5 -38.8 -61.8 -168 -36.7 -50 -100 50 10.1 -1.8 -1.8 -24.5 -20.2 -23.1 -1 -1 -1 Per person per day . (NA) -9.3 -13.6 -46.7 -66.7 -170 -42.9 -40 -150 50 17.1 -2.9 -2.9 -25.3 -21 -23.8 -1 -1 -1Landfilled, other disposal. (NA) 21.1 21.1 11.5 19.1 9.6 2.4 0.1 -3.6 -2 3 -3.2 0.3 -0.2 -3.4 -7.6 -4.2 3.9 0.6 Per person per day . (NA) 18.5 13.5 6.7 14.5 5.1 1.6 -1 -4.3 -3.1 4.6 -4.2 -0.8 -1.2 -4.3 -8.5 -5.1 2.9 -0.4 Percent distribution of generation: Paper and paperboard.. 34.1 36.8 36.3 33.6 36.1 37.4 38.4 39.1 38.9 37.6 35.4 34.7 35.5 36.6 37.7 38.6 38.1 38.5 38.2 Glass.. 7.6 8.4 10.4 10.5 9.9 8 7.6 6.9 6.8 6.7 6.4 6.2 6.3 6.4 6.2 6.1 5.9 5.5 5.7 Metals. 12 10.7 11.6 11.2 9.6 8.6 8.5 8.3 8.3 8.2 8.1 8.1 7.7 7.5 7.6 7.5 7.7 7.7 7.6 Plastics.. 0.5 1.4 2.5 3.5 5.2 7.1 7.2 7.5 7.8 8 8.3 8.7 8.8 9 9 8.9 9.4 9.9 10.2 Rubber and leather.. 2.3 2.5 2.6 3 2.8 2.3 2.5 2.5 2.5 2.4 2.8 2.9 2.8 2.7 2.9 2.9 3 3 3.1 Textiles 1.9 1.8 1.6 1.7 1.7 1.7 1.6 2.1 2.1 2.9 2.8 3 3.2 3.2 3.4 3.5 3.7 3.8 3.9 Wood. 3.4 3.4 3.3 3.4 4.4 5 5.3 5.5 6.1 6.1 6 6.2 5.9 5.8 5.3 4.9 5.2 5.3 5.4 Food wastes.. 13.9 12.3 10.5 10.5 8.7 8 7.7 7.4 7.2 6.9 10.1 10.2 10.1 10 10 10.3 10.4 10.1 10 Yard wastes.. 22.8 20.9 19 19.7 18.2 18.2 17.7 17.4 17.2 18.1 17.1 17.1 16.8 15.7 14.7 14 13.3 12.8 12.6 Other wastes 1.6 1.8 2.2 2.9 3.4 3.6 3.4 3.3 3.1 3.1 3 3.1 2.9 3 3.2 3.3 3.3 3.4 3.3
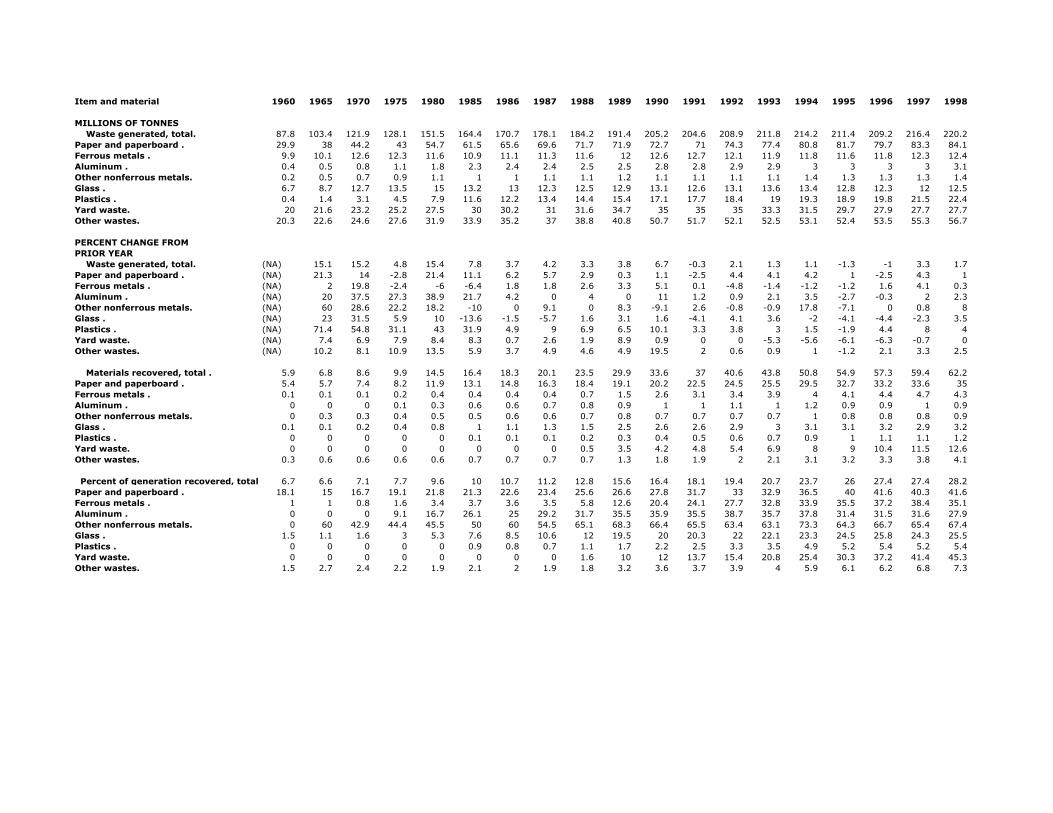
Item and material 1960 1965 1970 1975 1980 1985 1986 1987 1988 1989 1990 1991 1992 1993 1994 1995 1996 1997 1998
MILLIONS OF TONNES Waste generated, total. 87.8 103.4 121.9 128.1 151.5 164.4 170.7 178.1 184.2 191.4 205.2 204.6 208.9 211.8 214.2 211.4 209.2 216.4 220.2Paper and paperboard . 29.9 38 44.2 43 54.7 61.5 65.6 69.6 71.7 71.9 72.7 71 74.3 77.4 80.8 81.7 79.7 83.3 84.1Ferrous metals . 9.9 10.1 12.6 12.3 11.6 10.9 11.1 11.3 11.6 12 12.6 12.7 12.1 11.9 11.8 11.6 11.8 12.3 12.4Aluminum . 0.4 0.5 0.8 1.1 1.8 2.3 2.4 2.4 2.5 2.5 2.8 2.8 2.9 2.9 3 3 3 3 3.1Other nonferrous metals. 0.2 0.5 0.7 0.9 1.1 1 1 1.1 1.1 1.2 1.1 1.1 1.1 1.1 1.4 1.3 1.3 1.3 1.4Glass . 6.7 8.7 12.7 13.5 15 13.2 13 12.3 12.5 12.9 13.1 12.6 13.1 13.6 13.4 12.8 12.3 12 12.5Plastics . 0.4 1.4 3.1 4.5 7.9 11.6 12.2 13.4 14.4 15.4 17.1 17.7 18.4 19 19.3 18.9 19.8 21.5 22.4Yard waste. 20 21.6 23.2 25.2 27.5 30 30.2 31 31.6 34.7 35 35 35 33.3 31.5 29.7 27.9 27.7 27.7Other wastes. 20.3 22.6 24.6 27.6 31.9 33.9 35.2 37 38.8 40.8 50.7 51.7 52.1 52.5 53.1 52.4 53.5 55.3 56.7
PERCENT CHANGE FROM PRIOR YEAR Waste generated, total. (NA) 15.1 15.2 4.8 15.4 7.8 3.7 4.2 3.3 3.8 6.7 -0.3 2.1 1.3 1.1 -1.3 -1 3.3 1.7Paper and paperboard . (NA) 21.3 14 -2.8 21.4 11.1 6.2 5.7 2.9 0.3 1.1 -2.5 4.4 4.1 4.2 1 -2.5 4.3 1Ferrous metals . (NA) 2 19.8 -2.4 -6 -6.4 1.8 1.8 2.6 3.3 5.1 0.1 -4.8 -1.4 -1.2 -1.2 1.6 4.1 0.3Aluminum . (NA) 20 37.5 27.3 38.9 21.7 4.2 0 4 0 11 1.2 0.9 2.1 3.5 -2.7 -0.3 2 2.3Other nonferrous metals. (NA) 60 28.6 22.2 18.2 -10 0 9.1 0 8.3 -9.1 2.6 -0.8 -0.9 17.8 -7.1 0 0.8 8Glass . (NA) 23 31.5 5.9 10 -13.6 -1.5 -5.7 1.6 3.1 1.6 -4.1 4.1 3.6 -2 -4.1 -4.4 -2.3 3.5Plastics . (NA) 71.4 54.8 31.1 43 31.9 4.9 9 6.9 6.5 10.1 3.3 3.8 3 1.5 -1.9 4.4 8 4Yard waste. (NA) 7.4 6.9 7.9 8.4 8.3 0.7 2.6 1.9 8.9 0.9 0 0 -5.3 -5.6 -6.1 -6.3 -0.7 0Other wastes. (NA) 10.2 8.1 10.9 13.5 5.9 3.7 4.9 4.6 4.9 19.5 2 0.6 0.9 1 -1.2 2.1 3.3 2.5 Materials recovered, total . 5.9 6.8 8.6 9.9 14.5 16.4 18.3 20.1 23.5 29.9 33.6 37 40.6 43.8 50.8 54.9 57.3 59.4 62.2Paper and paperboard . 5.4 5.7 7.4 8.2 11.9 13.1 14.8 16.3 18.4 19.1 20.2 22.5 24.5 25.5 29.5 32.7 33.2 33.6 35Ferrous metals . 0.1 0.1 0.1 0.2 0.4 0.4 0.4 0.4 0.7 1.5 2.6 3.1 3.4 3.9 4 4.1 4.4 4.7 4.3Aluminum . 0 0 0 0.1 0.3 0.6 0.6 0.7 0.8 0.9 1 1 1.1 1 1.2 0.9 0.9 1 0.9Other nonferrous metals. 0 0.3 0.3 0.4 0.5 0.5 0.6 0.6 0.7 0.8 0.7 0.7 0.7 0.7 1 0.8 0.8 0.8 0.9Glass . 0.1 0.1 0.2 0.4 0.8 1 1.1 1.3 1.5 2.5 2.6 2.6 2.9 3 3.1 3.1 3.2 2.9 3.2Plastics . 0 0 0 0 0 0.1 0.1 0.1 0.2 0.3 0.4 0.5 0.6 0.7 0.9 1 1.1 1.1 1.2Yard waste. 0 0 0 0 0 0 0 0 0.5 3.5 4.2 4.8 5.4 6.9 8 9 10.4 11.5 12.6Other wastes. 0.3 0.6 0.6 0.6 0.6 0.7 0.7 0.7 0.7 1.3 1.8 1.9 2 2.1 3.1 3.2 3.3 3.8 4.1
Percent of generation recovered, total. 6.7 6.6 7.1 7.7 9.6 10 10.7 11.2 12.8 15.6 16.4 18.1 19.4 20.7 23.7 26 27.4 27.4 28.2Paper and paperboard . 18.1 15 16.7 19.1 21.8 21.3 22.6 23.4 25.6 26.6 27.8 31.7 33 32.9 36.5 40 41.6 40.3 41.6Ferrous metals . 1 1 0.8 1.6 3.4 3.7 3.6 3.5 5.8 12.6 20.4 24.1 27.7 32.8 33.9 35.5 37.2 38.4 35.1Aluminum . 0 0 0 9.1 16.7 26.1 25 29.2 31.7 35.5 35.9 35.5 38.7 35.7 37.8 31.4 31.5 31.6 27.9Other nonferrous metals. 0 60 42.9 44.4 45.5 50 60 54.5 65.1 68.3 66.4 65.5 63.4 63.1 73.3 64.3 66.7 65.4 67.4Glass . 1.5 1.1 1.6 3 5.3 7.6 8.5 10.6 12 19.5 20 20.3 22 22.1 23.3 24.5 25.8 24.3 25.5Plastics . 0 0 0 0 0 0.9 0.8 0.7 1.1 1.7 2.2 2.5 3.3 3.5 4.9 5.2 5.4 5.2 5.4Yard waste. 0 0 0 0 0 0 0 0 1.6 10 12 13.7 15.4 20.8 25.4 30.3 37.2 41.4 45.3Other wastes. 1.5 2.7 2.4 2.2 1.9 2.1 2 1.9 1.8 3.2 3.6 3.7 3.9 4 5.9 6.1 6.2 6.8 7.3
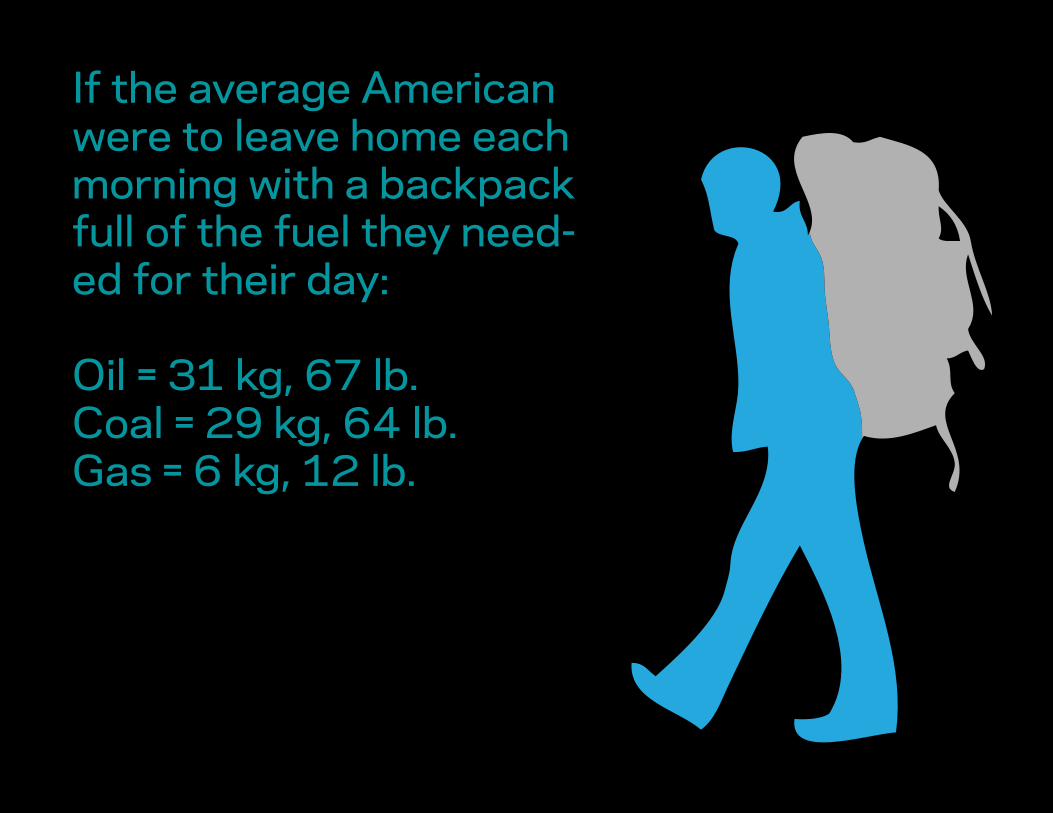
If the average American were to leave home each morning with a backpack full of the fuel they need-ed for their day:
Oil = 31 kg, 67 lb.Coal = 29 kg, 64 lb.Gas = 6 kg, 12 lb.
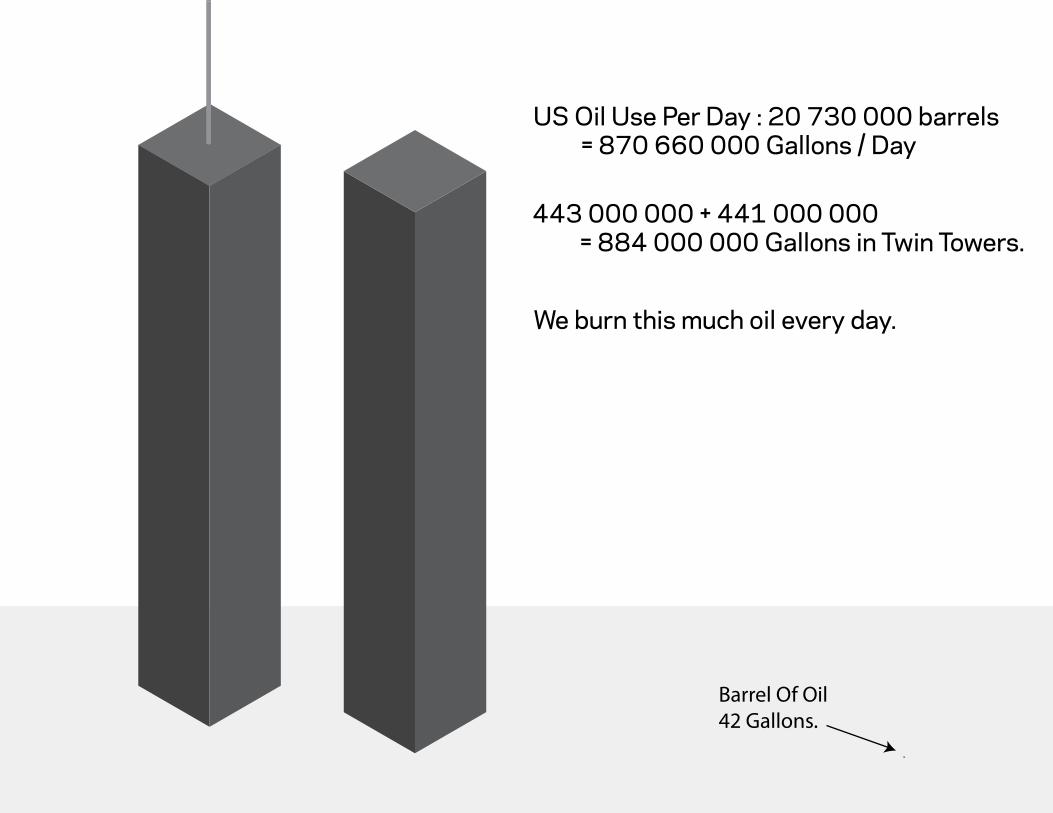
Barrel Of Oil42 Gallons.
US Oil Use Per Day : 20 730 000 barrels = 870 660 000 Gallons / Day
443 000 000 + 441 000 000 = 884 000 000 Gallons in Twin Towers.
We burn this much oil every day.

What if I wanted to generate my own power?
$40 000 ?
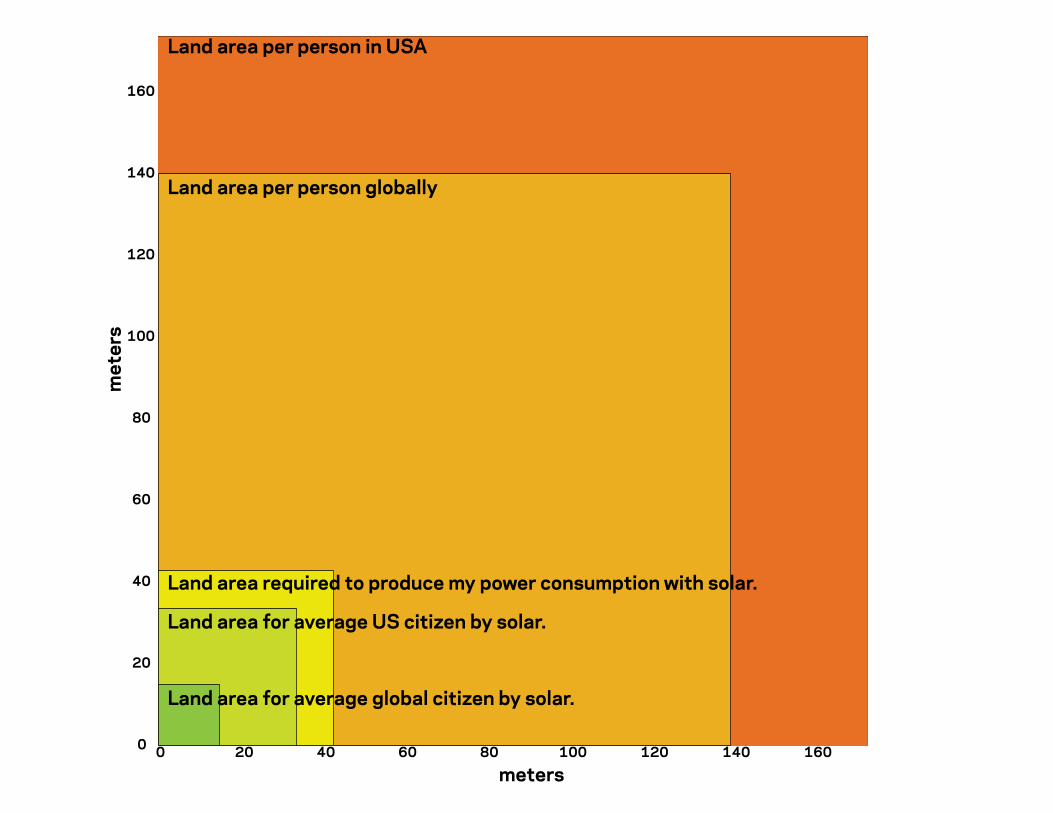
0 20 40 60 80 100 120 140 1600
20
40
60
80
100
120
140
160
equal land area per person globally represented as square
sauls square of land required for his watts generated by solarAverage US citizen square of land required for watts generated by solar
global average persons square of land to generate their energy with renewables
meters
met
ers
Land area per person in USA
Land area per person globally
Land area required to produce my power consumption with solar.
Land area for average US citizen by solar.
Land area for average global citizen by solar.
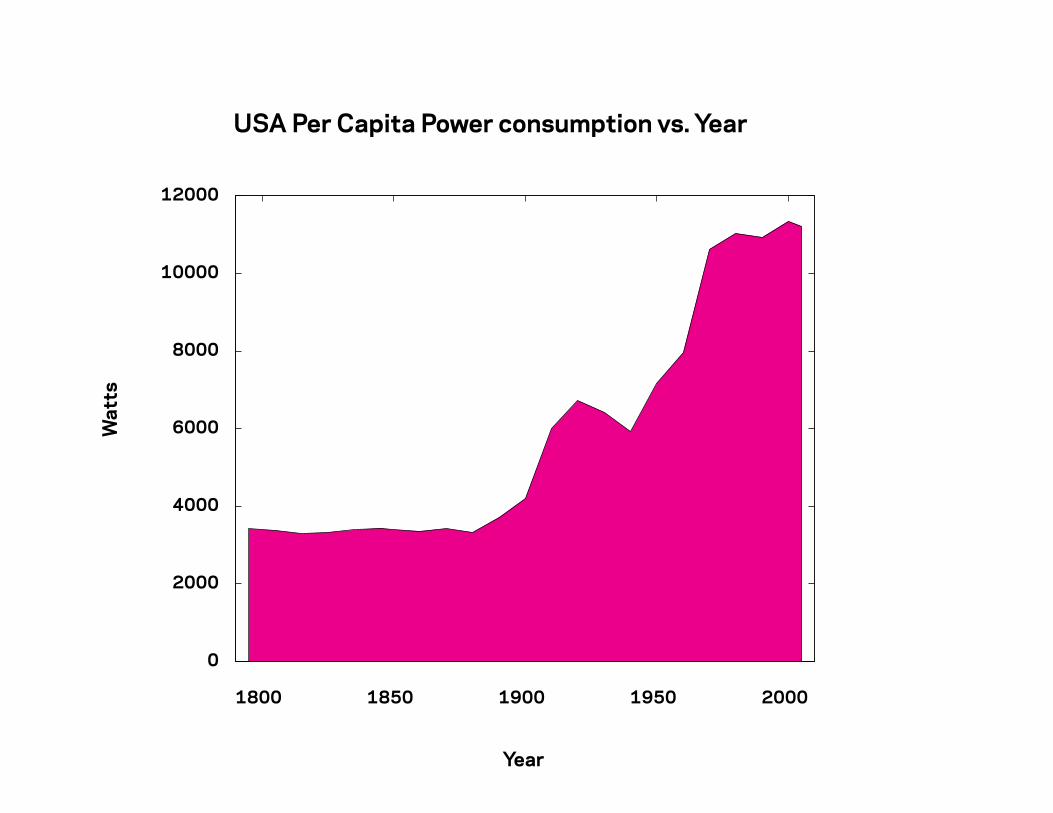
1800 1850 1900 1950 2000
0
2000
4000
6000
8000
10000
12000
USA Per Capita Power consumption vs. Year
Year
Wat
ts
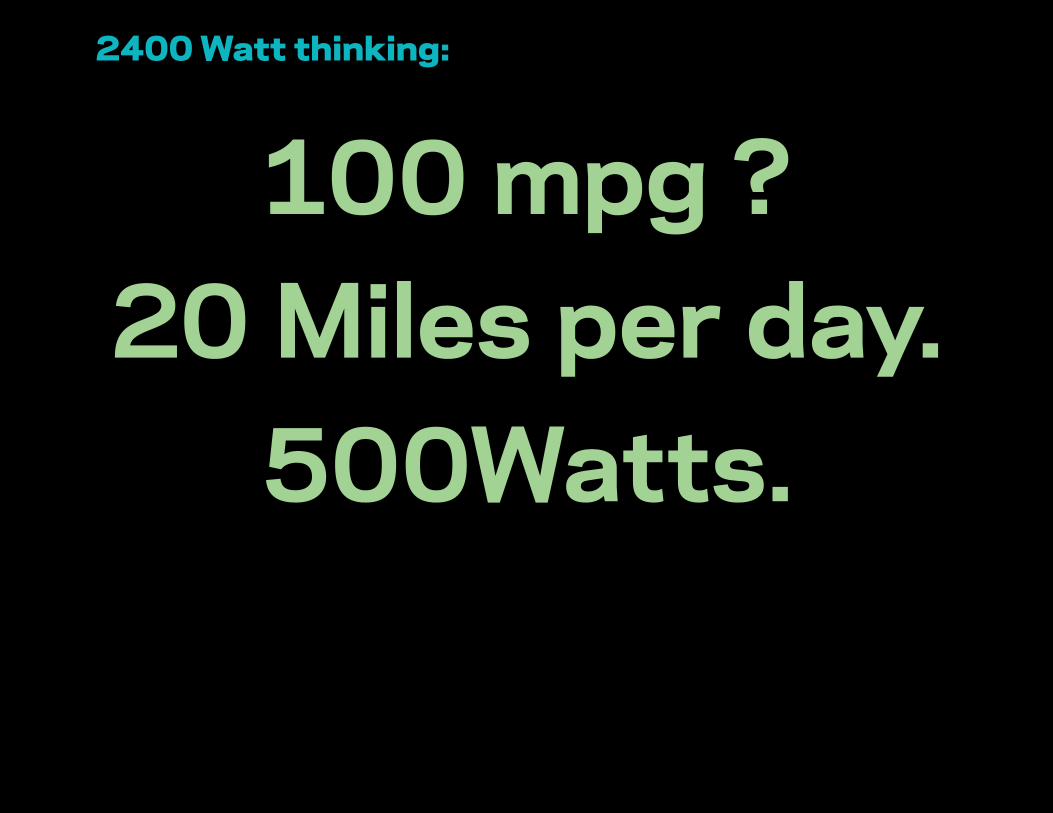
100 mpg ?20 Miles per day.
500Watts.
2400 Watt thinking:


55mph
100kph
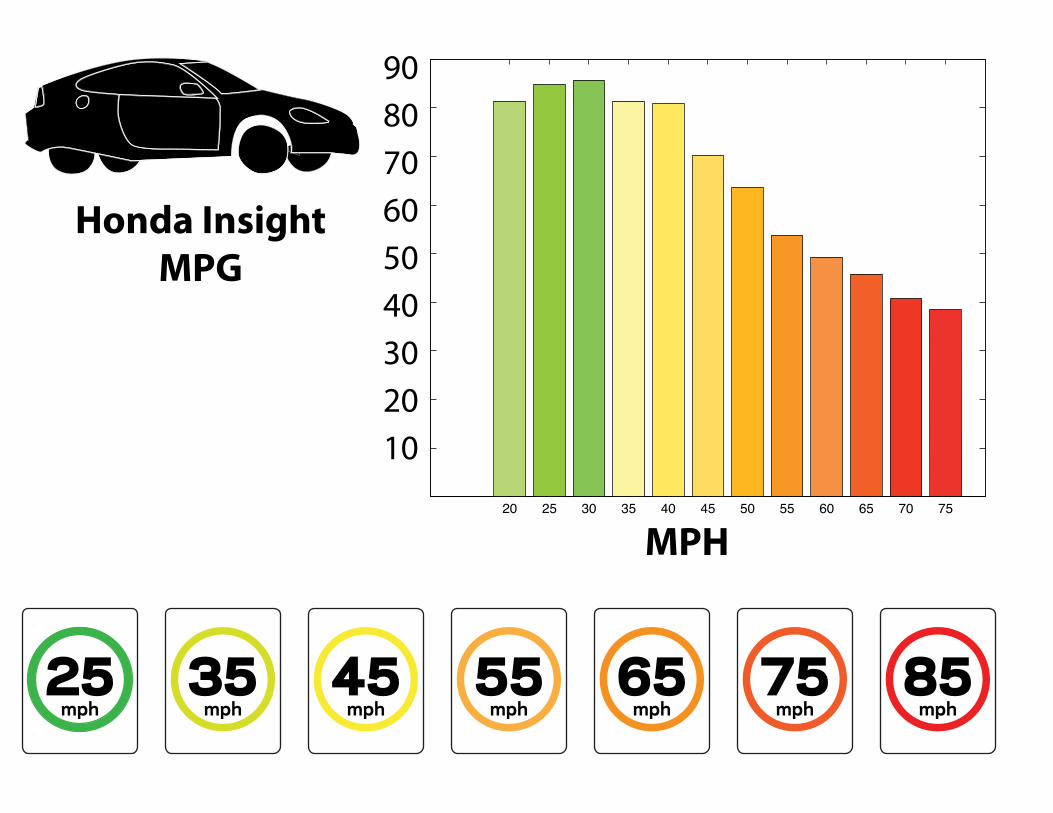
20 25 30 35 40 45 50 55 60 65 70 75
10
9080706050403020
Honda InsightMPG
MPH
85mph
75mph
65mph
55mph
45mph
35mph
25mph
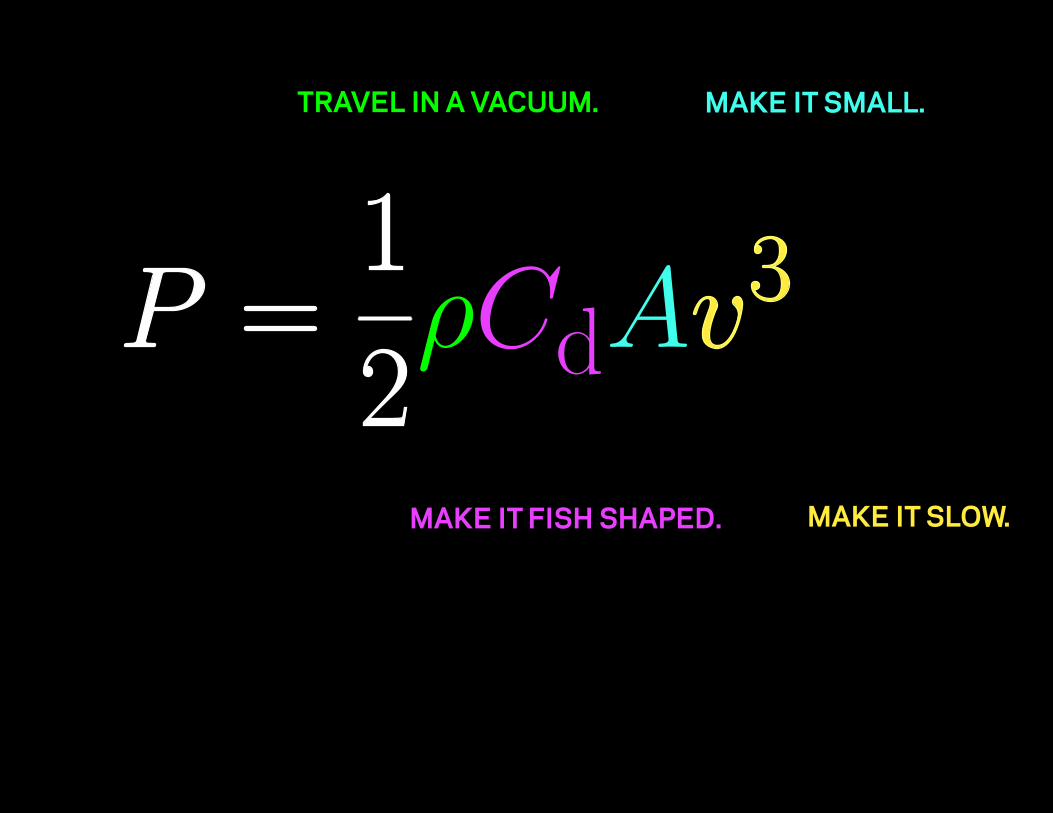
TRAVEL IN A VACUUM.
MAKE IT FISH SHAPED.
MAKE IT SMALL.
MAKE IT SLOW.
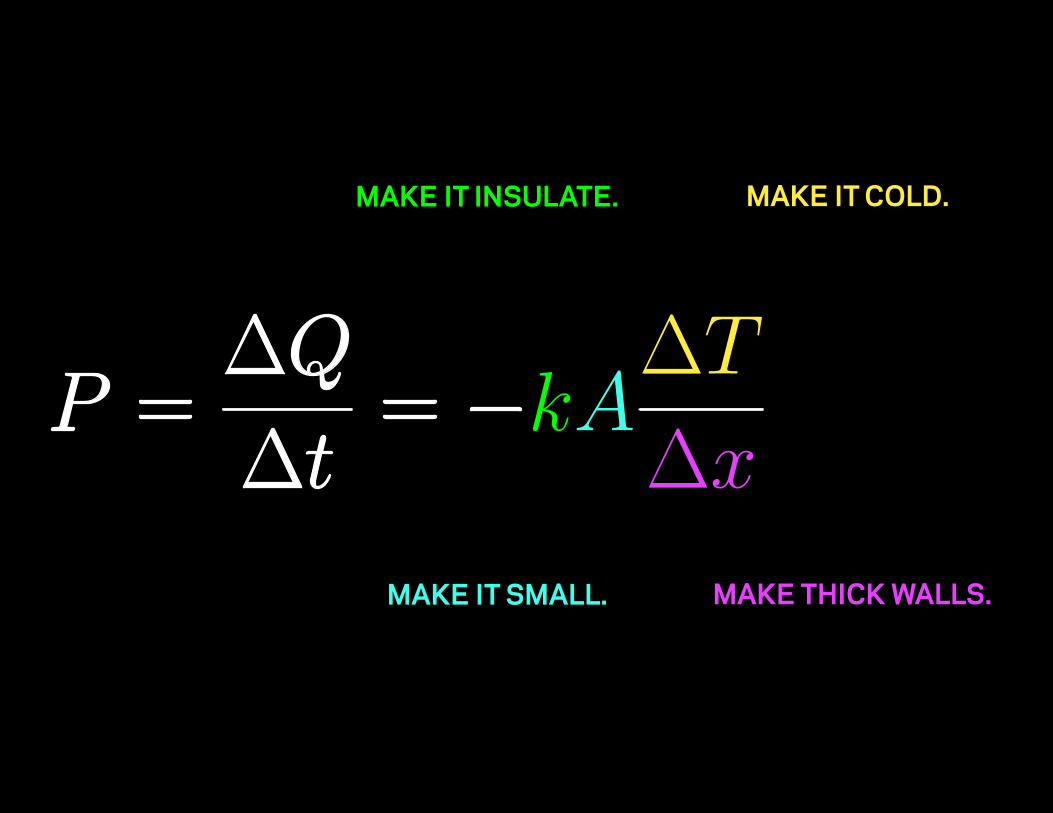
MAKE IT INSULATE.
MAKE THICK WALLS.MAKE IT SMALL.
MAKE IT COLD.
"The Game Plan" slideset release 1.01, March 21 2008 67
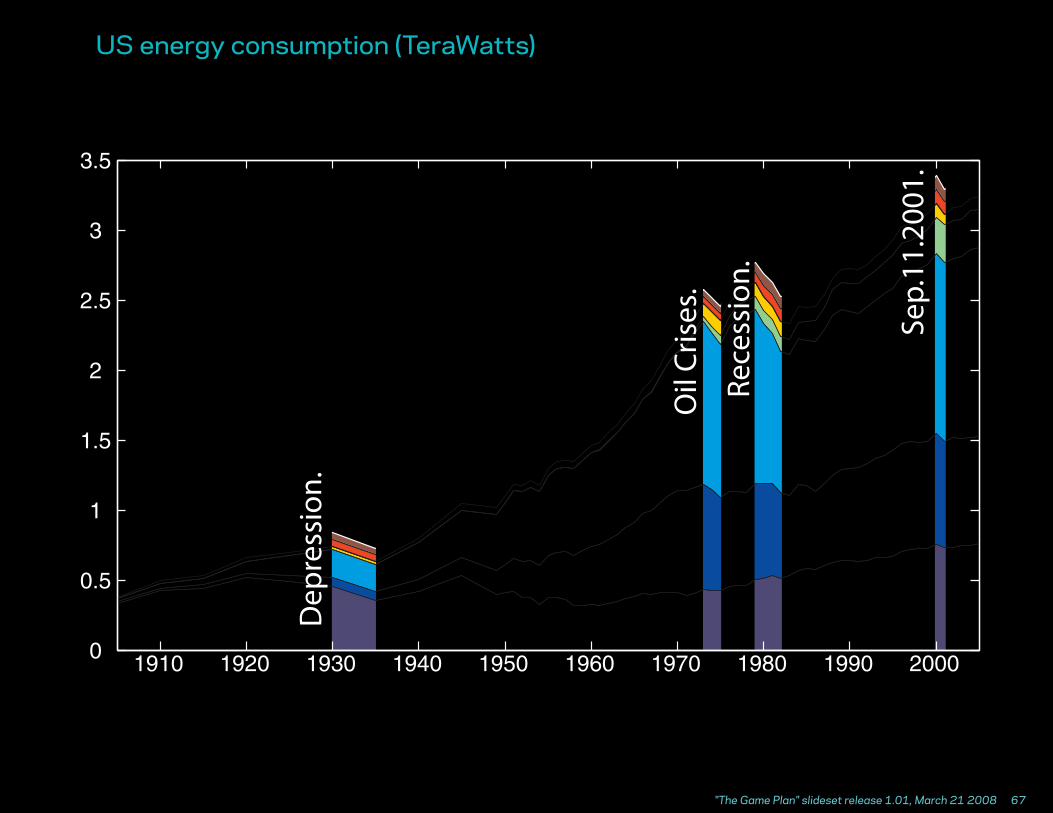
1910 1920 1930 1940 1950 1960 1970 1980 1990 20000
0.5
1
1.5
2
2.5
3
3.5
Dep
ress
ion.
Oil
Cris
es.
Rece
ssio
n.
Sep.
11.2
001.
US energy consumption (TeraWatts)
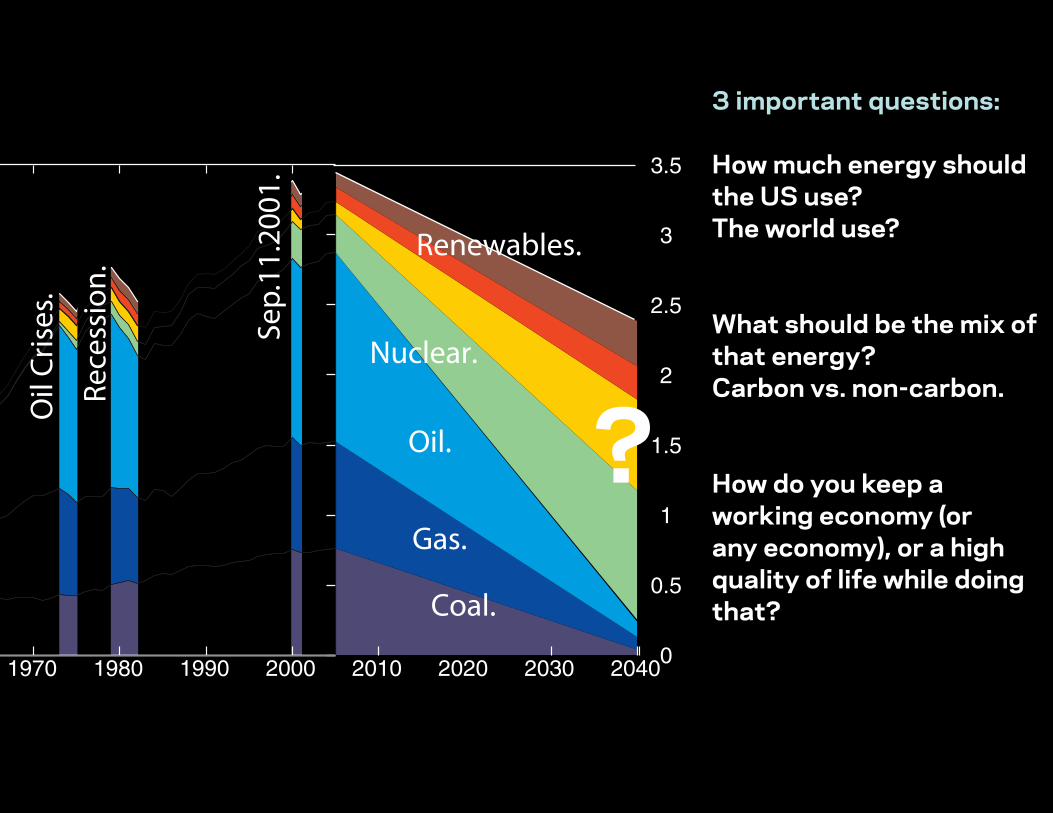
1930 1940 1950 1960 1970 1980 1990 2000 2010 2020 2030 20400
0.5
1
1.5
2
2.5
3
3.5
Dep
ress
ion.
Oil
Cris
es.
Rece
ssio
n.
Sep.
11.2
001.
Coal.
Nuclear.
Oil.
Gas.
Renewables.
3 important questions:
How much energy should the US use? The world use?
What should be the mix of that energy?Carbon vs. non-carbon.
How do you keep a working economy (or any economy), or a high quality of life while doing that?
?