organization, emotion and performance...
TRANSCRIPT
ORGANIZATION, EMOTION AND PERFORMANCE:
INTERACTIONS BETWEEN FORMAL AND INFORMAL STRUCTURES.
R. COWAN† AND N. JONARD‡
Abstract. Organizations are composed of interdependent design elements, including both for-mal and informal structures and processes, whose interaction and alignment determine perfor-mance. This paper addresses two aspects of organization alignment: formal structures and theenvironment; informal structures and formal structures. The formal structure determines workflows (who can pass work to whom); the informal structure supports the social transmission ofstress. Social dynamics of stress and effects of stress on productivity are well-documented inthe psychology literature. Using a computational model we examine the effects of alignmenton organization performance in the presence of varying degrees of environmental turbulence,and intra-organizational social stress dynamics. Alignment between the formal organizationand its environment is always good for performance, but when stress is present in the modeltwo regimes (corresponding to high and low stress) can emerge, and they present very differentlevels of productivity. The higher the quantity and quality of social interaction, the strongerthe difference in the two regimes. Stronger alignment between formal and informal structuresdecreases performance, whether or not the organization is aligned with its environment. Gen-erally, higher quantity and quality of social interaction produces more unpredictability in theperformance of the organization. Organizations can improve performance by improving qualityof social interaction (through human resource management for example), but at the cost of lesspredictability. Similarly, cutting fat as a strategy for improving efficiency may be self-defeatingas it reduces opportunities for social interaction to mitigate high stress-low productivity situa-tions.
†BETA, University of Strasbourg, Institut Universitaire de France, and UNU-MERIT Maas-tricht University‡University of Luxembourg.
keywords: stress, emotional contagion, social networks, formal organization, informal socialstructure
Date: May 12, 2015.We gratefully acknowledge the very helpful comments to two anonymous referees. We also thank Tim Folta forvery insightful conversations regarding the model, and Rifka Weehuizen for her very valuable insights into socialstress dynamics. Research assistance was provided by Francois Lafond.

1. Introduction
Organizations are composed of interdependent design elements, including both formal and
informal structures and processes, whose interaction and alignment determine performance. In-
vestigations of the past 60 years lead to the strong conclusion that the relationship between
design and performance is a complex one. The consensus in the literature is that no general the-
ory of design exists, but rather that the “right” design for any organization depends heavily on
a variety of contingencies (Mintzberg 1980). Contingencies that have been explored include the
nature of technology (Woodward 1965), task interdependencies (Thompson 1967), information
processing (Galbraith 1973; Tushman and Nadler 1978), environmental turbulence (Lawrence
and Lorsch 1967), environmental complexity and decomposability (Siggelkow and Rivkin 2003)
and so on.1 Nadler and Tushman (1980:43) formulate this very generally when saying that “...an
organization is most effective when its strategy is consistent with its environment (in light of
organizational resources and history) and when the organization components are congruent with
the tasks necessary to implement that strategy.” Congruence refers to how well components
fit together: how well task assignment fits peoples’ expertise; organization structure fits envi-
ronmental demands; information processing capacities fit information processing requirements;
informal and formal structures support or impede each other.
Empirical studies have examined various types of congruence, but currently few formal analyt-
ical framework exists with which to organize the results and intuitions. In this paper we present
a computational model of two types of congruence: the organization with its environment, and
formal and informal structures within the organization. We use this model to show how the
two congruencies interact to determine organization performance. When complex components
interact, such a numerical model is very useful in tracing the effects of changes or variations
in one or another part of the organization. Our concern has to do with complex interactions
1For example, one dimension of structure is the extent to which the organziation is hierarchical. The associationbetween a flat (rather than tall) hierarchy and performance is found to be positive by Worthy (1950) in a largedepartment store (Sears Roebuck) as well as by Ivancevich and Donnelly (1975) for salespersons, but negativeby Meltzer and Salter (1962) for physiologists and by Blau (1968) for government agencies; Mackenzie (1978)and Roberts (1990) argue that a high degree of hierarchy increases performance and reliability, but Jablin et al.(1986) and March and Simon (1958) invoke a loss of information stemming from condensation and uncertaintyabsorption to argue the opposite — different contexts, conceptualizations and metrics yielding conclusions thatare hard if not impossible to generalize (see also the comprehensive survey by Anderson and Brown 2012).
2 COWAN AND JONARD
among variables which are difficult to access empirically, and whose interactions are difficult to
sort out empirically (particularly those governing the social dynamics of stress, or measures of
environmental fit that are independent of performance). By adopting a simulation approach we
are able to address these interactions in a controlled manner and thoroughly investigate their
consequences, unconstrained by the difficulties often encountered in empirical investigations of
these types of issues.2 A second contribution of the model has to do with terminology. Much of
the literature seems to employ a terminology that borders on tautology. “Fit”, “congruence” or
“alignment” often seem to have no clear definition independent of firm performance. Therefore
to use any of these terms as explanans for firm performance runs a big risk of circularity. In
this paper, while we do discuss fit or alignment, we employ a measure which is defined indepen-
dently of firm performance (concretely the measure we use is the correlation between networks).
This will enrich both theoretically and empirically the discussion of the congruence of different
aspects of organizational structure.
We use well-established results from psychology to examine how the interaction of formal
and informal networks in the organization affect individual performance and ultimately organi-
zational outcomes. Formal organizational elements in the broad sense refer to the structures,
processes and methods intentionally created in order to distribute tasks and coordinate the
actions of individuals in pursuing organization goals. Standard examples would be organiza-
tional charts, formal workflows and procedures, authority and approval relationships, all of
which result from explicit design efforts to align the organization with its strategy and business
environment, and to optimize its processes (see for instance March and Simon 1958; Burns
and Stalker 1961; Lawrence and Lorsch 1967; Thompson 1967 or Galbraith 1973; Nadler and
Tushman 1980, 1999). Informal elements, on the other hand, are emerging arrangements such
as friendship relations, advice networks, information-seeking routines and in general processes
and structures that do not follow from intentional design at the level of the organization but
rather have formed from the interactions among members of the organization (Krackhardt and
Hanson 1993; Krackhardt 1994; Gibbons 2004; Gulati and Puranam 2009).
While it is widely believed that organizations rely on both formal and informal elements to
coordinate task roles in order to reach collective objectives, the joint effects and coevolution
of formal and informal elements have remained relatively unexplored in the literature. It is
explicit in Nadler and Tushman’s research on congruence, but the formal/informal distinction
was already clear in the work of Van de Ven et al (1976) or Thompson (1967) on the relationship
between coordination modes (going from impersonal to personal to group) and task uncertainty
2See Burton and Obel (1995) for a full discussion of the value of simulation in organization science.
ORGANIZATIONS AND EMOTIONS 3
or interdependence,3 and strongly suggested in March and Simon’s (1958) decomposition of
coordination in terms of programming and feedback or mutual adjustment. However, McEvily
et al. (2014:299) argue in a recent survey that over the past two decades a disproportionate
focus of research on (informal) social networks “...has left a disconnect between the literatures on
formal organization and informal social structure such that crucial questions at the intersection
of the two streams of research have been neglected.”
In this paper we take up the challenge laid out by McEvily et al. and develop a model incor-
porating both formal and informal structures. In the model members of the organization are
embedded in two distinct networks that guide and constrain both their behaviors and the flow of
organizational resources. Together, these two networks, the formal and the informal, form the
organizational architecture (Nadler, Tushman and Nadler 1997) in which actors are embedded.
Firm performance is the ultimate concern, and formal structures (hierarchies, teams) are known
to have contingent effects on performance. Our model is consistent with those effects, but adds
two things. First is an examination of the “fit” between formal and informal structures. Second
is the dynamics of individuals’ stress and its effects on performance. Individual stress affects
individual productivity, and stress is affected by both formal and informal interactions. Thus
the general issue we address is the conditions under which the informal structure exacerbates
or moderates the stressors arising from formal interactions.
The formal part of network architecture in the model summarizes the workflows (seen as
flowcharts) and procedures that regulate work, connecting task roles with one another. We
map roles one-to-one with organizational members, so that the formal, workflow network is
an actor-to-actor network in which two employees are connected by a directed link when one
provides resources (information, work, materials, supervision, task-related knowledge,...) to the
other. This allows us for instance to capture Thompson’s (1967:54-65) flows of work, materials
and objects between personnel — pooled or parallel, sequential and reciprocal. Although the
formal network connects people, it is worth recognizing that the connection between two people
is about the task roles they perform, not about the persons they are. The persons they are will
be relevant to the informal network.
3Although there were formal and informal elements (in the sense of designed and spontaneous), the divide wasnot between these but rather in terms of the amount of autonomy and information needed to function. InVan de Ven et al. (1976:323), the impersonal mode consisting of “...the use of pre-established plans, schedules,forecasts, formalized rules, policies and procedures, and standardized information and communication systems...”,all mechanisms for which “...a codified blueprint of action is impersonnally specified...” and whose “...use requiresminimal verbal communication between task performers” has informal elements to it, while the personal mode inwhich “...individual role occupants serve as the mechanism for making mutual task adjustments through eithervertical or horizontal channels of communication” has many formal elements to it.

4 COWAN AND JONARD
The informal part of network architecture in the model focuses on affect and social support.
In the recent literature (Gibbons 2004; Casciaro and Lobo 2008) the informal network has cov-
ered two major notions: task-related relations between advisors and advisees on the one hand,
and the much more task-independent affect relations between friends on the other hand. The
advice network, closely related to organizational power and status (Ibarra and Andrews 1993;
Krackhardt 1990), is the substrate individuals tap to accomplish their work, independently from
what the formal organization workflows and procedures suggest. The friendship network, on
the other hand, being “...based on personal attraction and mutual positive affect...” (Gibbons
2004), conveys shared understandings and trust. It has been shown to be linked with com-
mitment to the organization (Morrisson 2002) and resource sharing during crisis (Krackhardt
and Stern 1988) among other things. The literature suggests an important overlap between
advice and friendship networks (Ibarra 1992). At the same time, the two networks do differ in
terms of their consequences (on people’s values for instance, as shown in Gibbons 2004). But
the two networks have also been shown to interact: Casciaro and Lobo (2008:655) remark that
task-related networks in organizations reflect the trade-offs made by people when combining in-
strumentality (in the sense of competence and intellectual desirability) and affect (in the sense
of liking and social desirability) in interpersonal evaluations, observing that affect is a strong
moderator of task competence.4
In the model our informal structure is taken as a friendship network. While informal structure
in the organization can concern many things, friendship is certainly a large aspect of it, and
friendship links are typically more important carriers of affect than other kinds of relations.
Affect, as we argue below, can be extremely important in individual motivation or productivity,
so this focus captures an extremely important role of the informal network.
The paper most closely related to this one is Soda and Zaher’s (2012) empirical study of a
financial services firm, in which they find that iso-morphism between formal and informal net-
works is good for firm performance. While they also view the organization as two interacting
networks (the formal and informal structures) their informal network is the advice rather than
the friendship network. Thus what their informal network transmits (namely information on
how to do a job or solve a problem) is directly relevant to the task role of the individual and
ultimately to organizational outcomes. Our informal network transmits affect, which is relevant
to individual performance, but only indirectly. As our focus is on a different function of infor-
mal networks our findings differ, and we find value in independence rather than isomorphism.
4Some research also compresses the two networks into a single one: Shah’s (2000) paper on layoff survivorsexamines how downsizing, by disrupting existing advice and friendship networks in the organization, revealsnegative reactions to the loss of friends in the organization but positive reactions to the loss of coworkers insimilar structural positions (a non-friend with whom many friends are shared).

ORGANIZATIONS AND EMOTIONS 5
However the framework we provide can be generalized to include different types of informal
interactions, which will, by their different natures generate different types of value or effects on
productivity.
In our model, the formal and informal networks interact to determine individual productivity
levels, and the intervening variable is individual stress. We base our model on well-established
evidence from social psychology, referring to phenomena which jointly create complex individual
and organizational performance dynamics. It is worth emphasizing that although we have chosen
to frame the issue in terms of stress, the point is more general and our model can capture and
analyze any phenomenon involving attributes or features of individuals which respond to changes
in workflow and social interaction. Because of the existence of an abundant literature on stress,
with well identified effects, we have taken stress as our specific application, but individual
commitment, intrinsic motivation, or identification with the organization could equally likely
be at the centre of the analysis.5
Psychologists have identified three aspects of social stress dynamics and the effects of stress
on productivity.
First, experienced stress influences the ability to perform given tasks. The original purpose
of stress is to trigger coping behavior — a form of resource deployment by the agent — which,
when effective, reduces or eliminates the stressors (Seyle 1956; Cox 1978). High levels of stress
however imply deteriorated judgement, misdirected behavior and a reduced ability at effective
coping (McEwen and Sapolsky 1995; Sapolsky 2004) so stressors will not be reduced, agent
response will keep deteriorating, stress will increase further and effective coping decrease further
(Hobfoll 1989).6
Second, workload can be a major source of an individual’s experienced stress. In the well-
known Demand-Control model (Karasek 1979), stress results from discrepancies between the
demands dictated by the structural or organizational aspects of the work environment and the
capacity to deal with them (lack of control in terms of planning, regulating, (self-)managing,
decision-making,...). This misalignment renders the agent unable to cope effectively, yielding
withdrawal, reduced motivation and commitment, and further stress accumulation (Karasek and
5We are grateful to a referee for pointing this out.6Kahneman’s (1973) view on attention and effort is related: human beings make use of a scarce resource —cognitive energy — in information processing and decision-making. The provision and allocation of cognitiveenergy is determined by the perceived importance of tasks and ultimately determines the speed and quality ofcognitive performance. More stress implies more energy mobilized from a limited and rapidly consumed reservoir,limiting task performance and coping ability. Cognitive scarcity and effort have been the focus of many studiesin psychology and economics (Simon 1982; Conlisk 1996; Prelec and Herrnstein 1991), serving as a basis for thenotion of bounded rationality.
6 COWAN AND JONARD
Theorell 1990).7 Gilboa et al. (2008) find that a long list of stressors (including role ambiguity,
role conflict, role overload, job insecurity, work-family conflict, environmental uncertainty and
situational constraint) all have a negative effect on job performance. Distinguishing hindrance
(organizational politics, red tape, role ambiguity, job insecurity) and challenge stressors (work-
load, time pressure, job scope and responsibility), LePine et al. (2005) use strain and motivation
as mediating variables to find that hindrance stressors have a negative effect on performance
both directly and indirectly through strain and motivation, whereas challenge stressors have a
positive direct effect on performance and offsetting positive and negative effects via motivation
and strain.
Third, social interactions can both increase and decrease the stress level of the individuals
involved in them. Besides (autonomous) coping, involvement in social relationships is gener-
ally beneficial, increasing well-being and reducing stress through buffering effects. Social sup-
port from spouses, friends, colleagues and family helps reduce stress and psychological strain
(Glowinkowski and Cooper 1985) and is one of the main mechanisms of buffering (Cohen and
Wills 1985; Lepore 1992; Florian et al. 2002). However, as good as buffering may sound, be-
ing used as a buffer is somehow less attractive. Crossover is the process occurring when the
psychological strain experienced by one person affects the level of strain of another person in
the same social environment (Westman 2001; Westman and Etzion 1995; Hatfield et al. 1994
for a survey). An analogous phenomenon is contagion, the process by which one individual’s
mood and/or perceptions seem to spread to those in close proximity. Social interaction thus
tends to promote stress convergence, but not necessarily stress elimination. Both social support
and crossover follow patterns of affiliation or responsiveness, and their intensity depends on the
strength of the affiliation, or agents’ affinity with each other (see Gump and Kuliks 1997; Bena-
zon and Coyne 2000). In turn, the quality and amount of social support a person is able to give
is negatively affected by the person’s own stress level (Procidano and Smith 1997; Silverstein
et al. 1996; Repetti 1989; Repetti and Wood 1997).
In the next sections, we incorporate these effects into a simple model of an organization that
coordinates the work of its employees towards accomplishing collective tasks. In the model we
develop, tasks in the organization’s environment, consist of several sub-tasks. Each agent in
the organization has expertise that is suitable for one specific sub-task, so completing a task
implies passing it among different agents in the organization. The formal organization structure
7Van der Doef and Maes (1999) and Hausser et al. (2010) have reviewed the past 30 years of empirical researchon the Demand-Control(-Support) model (20 year coverage for the former, and the subsequent 10 years for thelatter) and come to the robust conclusion that individuals in high strain jobs are more likely to suffer mental orphysical illness and reduced well-being, though control moderates these effects in some circumstances, as does,importantly, social support.
ORGANIZATIONS AND EMOTIONS 7
determines how task-passing can take place, that is, who can pass work, material, information
and other task-related resources to whom. As tasks are passed among agents through the
organization, each agent has changing numbers of tasks awaiting his or her attention. These
changes in workload affect agents’ stress levels and consequently their abilities to perform their
sub-tasks. On top of these effects, informal social interactions also influence agents’ stress levels
through the effects of coping and buffering as discussed above.
Though the informal and formal structures can have any form of relation (from isomorphism
to independence) they jointly determine the psycho-affective state of agents, their performance
and ultimately organizational outcomes. Central to an organization’s success, then, is its ability
to coordinate and efficiently transmit tasks among agents, but also to manage the alignment of
the formal and informal components of its network architecture. In such a context, we are inter-
ested in understanding which structural attributes of the formal and informal organization affect
its performance, and how they interact. As the model combines results of social psychology re-
search on stress with insights from modern theories of organizational behaviour, it provides an
integrated understanding of how social, psychological and structural factors jointly affect the
workings and performance of organizations. We find that agents’ embeddedness in multiple
relations (the formal, workflow and informal, friendship networks) yields complex effects. De-
pending on the alignment of formal and informal elements, social interaction is capable both of
amplifying and of undoing the effects of organizational design. This has important implications
for organizational design as well as for the management of slack in the organization.
2. The model
Following the discussion above, the model we develop has two parts: the operation of the
organization, and social interaction among its members.
We characterise the goal of the organisation as the efficient completion of tasks, and we will
measure an organization’s effectiveness by the number of tasks it completes in a given time.
Each task consists of a list of sub-tasks of particular types which must be done in a given order.
Each member of the organisation is specialized in one type of sub-task, thus for a task to be
completed, it must be passed among members of the organisation so each of the sub-tasks can
be addressed by the agent who has the appropriate expertise. In this sense, the organization
coordinates task roles in the presence of specialization (Thompson 1967; Van de Ven et al. 1976;
Nadler and Tushman 1980; Levitt et al. 1999; Garricano 2000).
Different organisations might have different structures, and so different workflows (who can
pass work to whom). In a pure and strict hierarchy for example, work can only be passed
8 COWAN AND JONARD
down, and within a branch of the hierarchy; by contrast in a perfectly flat organization, the
task-passing network can appear random, as anyone can pass work to anyone else.
When all sub-tasks in a given task are completed, the task is finished and leaves the organi-
sation. We assume that at any time the organization is processing the same number of tasks, so
a new task arrives only when a task is completed. Agents have a fixed processing capacity, so
can work on at most one task per period. At any point in time, any agent in the organisation
will have some number of sub-tasks awaiting his attention. The extent to which these are piling
up on his or her desk affects the agent’s stress level, and thus productivity, broadly defined, as
discussed above.8 The lower the agent’s productivity, the longer it takes him or her to pass the
task to the next agent. Finally, agents interact socially with each other, and are thus subject to
social dynamics of stress. Within this general framework, we are not interested in specific types
of organization (hierarchy, team, etc.) but rather in two types of alignment or congruency: the
fit between the formal organization structure and its external environment; and the fit between
formal and informal structures within the organization.
In the sections below, we give the details of each element of the model.
2.1. The environment: tasks and subtasks. The environment in the model consists of the
population of tasks that the organization will face over its lifetime. A task t is an ordered
sequence of ` sub-tasks, t = (t1, . . . , t`), and there is a finite set N of types of sub-tasks,
N = {1, 2, 3, . . . , n}. To generate the task population we proceed as follows. First an initial
task set S is constructed by forming vectors of length ` with random draws from the set N . We
add randomly created tasks to this task set until each sub-task-type appears at least once in the
task set. Then, with this task set in hand, we create an (ordered) list of all future tasks: the task
population. This we do by sampling with replacement the task set for a very large number of
tasks. This task population constitutes the environment of the organization. To illustrate, in an
environment in which the set of possible sub-tasks is N = {1, 2, . . . , 8} and tasks are of length
` = 5, a possible initial task set is provided by S = {(2, 5, 1, 8, 6), (4, 7, 8, 2, 4), (3, 1, 2, 5, 7)}.
Sampling (with replacement) this initial set of 3 tasks would yield an environment for the
organization.
2.2. Organizational, formal structure. As the environment confronts the firm with tasks
involving all existing sub-task-types in N, it is reasonable that all least one member of the or-
ganization is able to address any sub-task. For simplicity, we assume a specialized organization
such that each agent has a unique expertise and we index agents so that agent i can address
8We abstract here from other sources of stress.

ORGANIZATIONS AND EMOTIONS 9
sub-tasks of type i, for all i ∈ N .9 Tasks being ordered lists of sub-tasks, we also need com-
munication patterns between agents. An organisation thus consists of a set of agents and a set
of pairwise links among them, together forming a directed network in which the links indicate
communication or work-flow patterns. Specifically, a link from agent i to agent j implies that
i can communicate with or pass work to j.
Is there an intuitive way to create the best-aligned organization? To complete a task the
organization must structure its work flow such that any task that enters can be successfully
transmitted among those who will complete the sub-tasks. This is clearly possible if in the
organization, anyone can pass tasks to anyone else. But such an organization is likely to have
very many transmission channels that are never used. By contrast, the best-aligned orga-
nizational structure will concentrate flow where transmissions between sub-tasks take place.
In the simple example considered above, communication must be active between the ordered
pairs that appear in the tasks. So it must be possible to transmit tasks between agent-pairs
(2, 5), (5, 1), (1, 8), (8, 6), (4, 7) and so on. This way, each task can be completed with only 4
transmissions. Following this logic we construct a transmission matrix T , where each element
in the matrix, Tij , is an indicator (1 or 0) of the presence or absence of the transmission from
sub-task i to sub-task j in the task set S. No other potential transmission channel between
two agents should be allocated transmission capacity, as it will always be idle. This creates
an asymmetric, binary matrix describing the work flow that an organization will face, given its
task environment.
One final issue remains, namely that the previous binary structure prevents the completion
of any unforeseen transmission (nothing flows along a link of weight 0). To permit exception
handling, we allow a (small) amount of reverse flow on any existing link, thus making the
organization “quasi-symmetric”. For any Tij = 1 we assign also a small positive weight to Tji,
Tji = ε � 1 (in practice we set ε = .05). The transmission matrix T can now be seen as a
weighted adjacency matrix which describes the network structure of the organization.10
To ensure that organizations are comparable in their ability to transmit information and
govern workflow, we normalize the entries so that the sum of weights in T is equal to n − 1.
For the example given above, with 8 individuals in the organization and the task set S of three
9Since no two members of the organization have the same specialty, no coordination issue can arise in theworkflow; in that respect the fit between individuals and tasks is as good as can be.10As an observation, we point out that the matrix T can be used to investigate modularity. It is analogous to forexample, the matrices in Figure 1 of Ethiraj et al. 2008. See also Baldwin and Clark (2000). Here modularitywould exist in the population of tasks — can their sub-tasks be arranged in a modular way? This providesanother axis which could interact with alignments: does the value of alignment (of either type) vary with thedegree of modularity in the task population. We leave this for further work.
10 COWAN AND JONARD
tasks, the organizational structure would be described by the final weighted adjacency matrix
T below:
T =(8− 1)
11(1 + ε)×
· 1 ε 0 ε 0 0 1
ε · 0 1 1 0 ε 0
1 0 · 0 0 0 0 0
0 ε 0 · 0 0 1 0
1 ε 0 0 · 0 1 0
0 0 0 0 0 · 0 ε
0 0 0 ε ε 0 · 1
ε 1 0 0 0 1 ε ·
where the first term is the normalization factor.11
With T , we have created an organization that is perfectly ‘fit’, in the sense of being aligned
with its environment. But for this to be a reasonable way to create the formal workflow struc-
ture, one must assume that a firm can read its environment, form a valid idea of the type of
tasks it faces, and incorporate this knowledge into its strategic architecture and organizational
design (so the usual sequence from environment to strategy to organization, see for instance
Nadler and Tushman 1999). Perhaps this is possible in some instances, but in general this
level of perfection in fit seems unlikely. Indeed, depending on the degree of turbulence in the
environment, a firm will be able to do this to a greater or lesser extent. We would expect
that as turbulence increases, firms will be less and less able to create a structure that mimics
the structure of tasks they face. To capture varying degrees of environmental turbulence and
the consequent (in)ability of organizations to align with their environments, we take things the
other way around and perturb the previous organizational structure. With tunable probability
p we rewire each link of the fit structure.12 To measure this alignment between the formal
organizational structure and its external environment, we record the correlation between the
adjacency matrices of the fit and rewired structures.
2.3. Workflow. A task t = (t1, t2, . . . , t`), enters the organisation directly onto the desk of
agent t1. When agent t1 has completed sub-task t1, he or she attempts to pass the work
11One could also imagine that more frequent transmissions in the intial task set (such as the transmission from 2to 5 occuring twice in our example) have larger transmission channel than the others, or that the flow capacity isthe relative frequency of transmissions in the task population rather than the initial task set, all variants whichdo not alter significantly our findings.12“Rewiring” implies that for any pair ij such that Tij = w > 0, with probability p set Tij = 0 and either Tik = wor Tkj = w for a randomly chosen k. Thus p can be seen as implicitly reflecting environmental turbulence: whenp = 0 the environment is entirely predictable and the organization can be perfectly aligned with it; when p = 1turbulence is so high that the organization cannot predict anything about the nature of future jobs, and so cannotalign in any meaningful way the organization structure with its environment.
ORGANIZATIONS AND EMOTIONS 11
to agent t2. If there is a direct connection from t1 to t2 the work is passed directly. If no
direct connection exists, then agent t1 needs to pass the work to a different agent. We assume
that members of the organization are knowledgeable about the formal structure, so know the
shortest (weighted) paths from themselves to any other agent in the organisation. So agent t1
will pass the work to the first agent on the shortest path to agent t2. This is repeated until t2
is reached, after which t2 completes its sub-task and attempts to transmit the work to agent t3
for completion of sub-task t3. Again the same principle applies and eventually the work reaches
agent t`. When agent t` finishes his sub-task, the task is passed out of the organisation and at
that point is considered completed.
From the above it is important to see that although a task involves exactly the completion
of ` sub-tasks by ` agents it will, depending on the distribution of flow in the organization
(what we refer to as the organization’s formal structure) possibly involve many more agents
and many more transmissions (if no direct connection exists between two consecutive sub-tasks
ti and ti+1 in t). In other words, a misaligned structure will impose for a task t many extra
transmissions between agents who are not part of t (or are part of t but need to intervene also
as pure transmitters) and therefore a much longer completion time for the overall task.
Sub-task completion is probabilistic: the lower an agent’s stress level, the more productive
her or she is and the faster he or she will compete the sub-task. This is modelled simply as the
probability of completing a subtask in any period, t, is
(1) pi = 0.5/z2i ,
where zi is agent i’s stress level in that period.
Work-passing, or transmission, is also probabilistic. It depends on the flow capacity of the
link between the two agents involved, and on the stress levels of the two agents involved. In
general, transmission from agent i to agent j succeeds with probability
(2) pi,j = Ti,j/(zi × zj)2.
Transmission is more likely to succeed as the strength of the communication channel, Ti,j ,
increases, and as the stress levels, zi and zj , of the agents involved in the transmission decrease
(we describe below how stress is determined). Suppose for a moment that agent ti succeeds in
transmitting the task. Then i is free to address attention to another task in the next period. If
he fails to transmit, he tries again in the next period. So an agent’s capacity in each period is
used up by one attempt at transmitting, whether the attempt succeeds or fails. At any point
in time, any agent has a (possibly empty) queue of partly completed tasks on his or her desk.
12 COWAN AND JONARD
Partly completed tasks are treated according to a first-in-first-out principle: the oldest task on
any agent’s desk is always treated first, whether it is for completing a sub-task, transmitting
a task for which the agent’s sub-task is complete, or acting as a pure transmitter on the path
between two sub-tasks.
2.4. Social, Informal structure. Beside the formal network over which agents can pass tasks,
there is a network which structures agents informal interactions within the organization. Part
of our interest is whether alignment (or in this case iso-morphism) between formal and informal
structures is beneficial or detrimental to firm performance.
To control this informal network we proceed as follows. Our tuning parameter is pISO ∈ [0, 1].
We start with a social network that is isomorphic to the workflow network, with links unweighted
and undirected (we assume that communication in the social network is symmetric and of
uniform intensity) — the weighted adjacency matrix T describing organizational structure is
simply made symmetric and binary. Then with probability pISO we rewire one of the endpoints
of each link uniformly randomly to new agent in the network. When pISO = 1 the resulting
network is totally uncorrelated with organizational structure: any pair of agents is equally likely
to be connected, regardless of whether that pair is connected in the formal structure or not.
This algorithm does not completely cover the space of possible informal structures. Thus we
add a second part in which we do effectively the reverse. Here we start by constructing a social
network that is the mirror image of the workflow network with undirected, unweighted links.
Then we remove enough links to ensure that this complementary network has the same number
of links as the isomorphic network. By construction none of the links in this network exists
in the organizational network. Then, again, with probability pISO we rewire each link in this
network. With this double algorithm we span an entire family of informal networks that range
between perfect alignment (in the sense of isomorphism) and perfect complementarity (or anti-
isomorphism) with the organizational structure. This way we can test whether alignment of
these two components of organizational architecture is desirable, and more generally answer the
question of the joint effects of formal and informal structure on performance. To measure this
alignment between the formal, organizational structure and the informal, friendship structure,
we record the correlation between their adjacency matrices.
2.5. Stress dynamics. Agents in the model have distinct roles and occupy distinct positions
in two networks: they pass and receive work in the formal, organizational network, as well
as transmitting affect in the informal, friendship network. Regarding the latter, social effects
obviously go much beyond the boundaries of the organization, including spousal, family and
friends interactions, and broader, even society-level effects. While acknowledging that such

ORGANIZATIONS AND EMOTIONS 13
effects are at work and can play an important part in the fluctuations of individual stress levels,
our focus here is only on social interactions among members of the organization. For that reason
it might be useful to conceive of these interactions as taking place around the coffee machine
or in the cafeteria.
Because of double network membership, each agent is subject to two sources of stress dy-
namics: changes in his or her workload; and social interaction with co-workers, and each source
of stress can conduce towards high or low stress levels.
The formal network captures the workflow and therefore dictates the workload of any agent.
As mentioned above, at any point in time any agent has a (possibly empty) queue of partly
completed tasks on his or her desk. The number of tasks in the queue determines the agent’s
work stress: a longer queue implies higher work stress. This is modelled very simply as
(3) zworki =
z if qi ≤ θwork,
z otherwise,
where qi is the number of tasks awaiting attention on i’s desk and z > z.
The informal network controls the flow of affect, and therefore the social stress of any agent.
Cowan et al. (2011) present a model of stress dynamics which mimics closely the discussion in
Section 1 (p. 5). That model shows how individual and aggregate stress levels co-evolve, but
also clearly demonstrates the possibility of multiple equilibria: a single organization can, under
slightly different circumstances, stabilize on either a high or a low aggregate stress level. In the
current paper we adopt a discrete, reduced form version of that model.13 Each period a number
of agents, m, is randomly drawn to engage in social interaction. Each of those agents engages
with all of his direct neighbours in the social network. Social stress levels follow a principle
similar to work stress: more high stress neighbours in the friendship network implies higher
social stress. This is modelled very simply as
(4) zsociali =
z if hi ≥ θsocial,
z otherwise,
where hi is the number of agents in the high stress state z in the (friendship) neighbourhood of
i augmented with i himself.
An agent’s overall stress level is determined jointly by work and social stress. If both work
and social stress are high (low) then the agent’s overall stress level is high (low). If work and
13Implementing the current model using exactly the stress dynamics of Cowan et al. (2011) produces littlequalitative change, which suggests the more parsimonious model of adoption of the majority stress state isadequate. We have not presented that here simply for reasons of simplicity — the added complexity of theirstress model does not increase the insight to be gained here.
14 COWAN AND JONARD
social stress “disagree” then the agent’s overall stress level is set according to
(5) zi =
zsociali with probability α,
zworki with probability 1− α.
with α, referred to as “affinity”. The parameter α is a control parameter in the simulation
which captures the extent to which agents are sensitive to each others’ stress levels, and thus
subject to the forces described on p. 5. In other words, α can be interpreted as a measure of
the strength of affiliation or affinity among agents. The value of α can be seen as the result
of the socialization efforts of the firm: different strategies to human resource management, and
more generally to corporate culture, will yield different amounts of affinity among colleagues.
In some firms every promotion is a cut-throat competition among colleagues; and this can be
captured by a very low α. By contrast, a company whose culture demands that employees view
themselves as part of a larger family, and display care and empathy for each other, is one with
large α.
The aggregate stress level of an agent affects his or her ability both to complete the sub-tasks
in which he or she is specialized, and to pass tasks to the appropriate next agent. One comment
here is that we are effectively compounding two different sources of stress via the strength of
affinity α. The human stress system being non specific, stress easily transfers from one role to
another, for example stress created in the home environment spills over to stress or performance
in the work environment (Bolger et al. 1989; Ginn and Sandell 1997; Repetti 1989; Stephens et
al. 1997). We have kept the representation of work and social stress simple by using a binary
form which allows us to combine the two sources of stress into one level of experienced stress
simply, and then to let this level of aggregate stress be the moderator of productivity.
The precise timing of when social interaction takes place (at the start, the end or in the
middle of the period) does not affect the results, so we have opted for a timing which allows
a simple story to be told. The social network, or cafeteria interactions take place at the end
of a period, after a round of task–completing activity. People enter the cafeteria carrying their
current aggregate stress levels. A total of m agents interact with their direct social connections,
and the social stress levels of those m change according to Equation 4, and the day ends.
Overnight completed tasks leave the organization, and are replaced by new ones. When the
new day begins, agents arrive carrying the social stress levels arising from the most recent social
interactions. These are combined with the stress levels determined by the (new) pile of tasks
they find on their desks in the morning, as described in Equation 5, to generate an agent’s
ORGANIZATIONS AND EMOTIONS 15
overall stress level, zi. This overall stress level determines their productivities (Equations 1 and
2) in completing and passing tasks.
Intuitively, if things go “well”, the cafeteria acts as a cooling device and the joint effect of
coping and buffering exceeds the effect of crossovers, yielding overall stress reduction. However,
as casual observation suggests, the cafeteria can also be a place in which agents feed each
others’ stress. The total amount of stress in the system snowballs as agents amplify each
others’ emotions and eventually all leave the place with an even lower efficiency in the next
period. The possibility of multiple stress equilibria in the social network has been explicitly
designed into the model, based on the results of Cowan et al. (2011). Whether aggregate stress
(and thus productivity) is high or low in the system depends on the interaction of the dynamics
of emotional contagion in the social network on the one hand, and the fluctuations of workload
induced by the arrival of tasks in specific organizational designs on the other. Organizational
design then plays an essential part in selecting either the high or the low stress equilibrium.
3. Implementation
3.1. Experimental design. The model we have developed represents a complex dynamic sys-
tem which we study numerically. To remove as many spurious effects as possible the following
experimental design is followed. We create the environment first, i.e., the task set as described
in Section 2.1 and an (ordered) list of all possible future tasks by uniformly sampling the task
set. This environment remains fixed for the entire experiment. We then create an organization
— the formal network — whose fit to the environment can be tuned via the probability p, and
a friendship network — the informal network — whose alignment to the organization can be
tuned via the parameter pISO (according to the details in Section 2.4).
With these aspects fixed, we compare across two main factors: the amount of social interaction
(m) and the degree of affinity among agents (α). There are 6 levels for the first factor, intensity
of social interaction: m = −1, 0, 10, 20, 50, 100; and 4 levels for the second factor, affinity:
α = .6, .7, .8, .9. Each combination of factor levels (m,α) is considered in turn, and we let
the organization operate on the ordered task list for 1,500 periods (this duration guarantees
that organizations never run out of tasks to do). As a measure of performance we record the
total number of tasks completed by the organization over that time. Having run through all
level combinations for these two factors, we start again with a new organizational structure and
informal network.
16 COWAN AND JONARD
The simulations have been conducted in parallel on 50 cores of a computing cluster, on the
same task environment but in otherwise independent replications which are then aggregated
and analyzed to yield the results analyzed below.
3.2. Parameter settings and effects. Several parameters need to be set, which we do now
and briefly comment upon.
We set the organization size and number of sub-task types to be identical and equal to
n = 100. We assume that members of the organization are specialized; each able to do one
specific sub-task type. We fix all tasks to have exactly ` = 10 sub-tasks, a value large enough
to guarantee that long chains of transmission can occur in misaligned organizations, and small
enough to ensure many tasks can be completed over the simulation horizon so that performance
displays enough variation.
The capacity of the organization is set to 200 tasks. At the end of each period, the task
which have been completed exit the organization and are replaced by the next ones on the task
list. Because tasks are groups of random sub-tasks, tasks will pile up unevenly on agents desks,
though at any point in time the average individual deskpile is 200/100 = 2 tasks high.
The work stress threshold is set to θwork = 5 so an agent who has 6 tasks or more on
his desk awaiting attention is in high stress. Given the average workload is 2, θwork is the
average workload plus 3 and so work stress should remain low for most of the people in the
organization. Unless θwork is unreasonably high (so that no one ever experiences high work
stress) or unreasonably low (so that everyone always experiences high work stress) the results
are qualitatively unaffected. We set the social stress threshold to θsocial = 3 so an agent is in
high stress if his neigbourhood including himself includes at least 3 individuals in the high stress
state. As for the previous threshold, extreme values should be avoided but intermediate values
make no significant difference to the patterns we find. Any agent’s stress level is always either
low or high, and we set the level of low stress to be z = 1 and the high stress level to be z = 2.
Agent i’s aggregate stress level, si, affects his or her productivity at completing sub-tasks
and passing work. The probability of completing a sub-task of type i in a period is .5/z2i ; the
probability of agent i passing a task to the appropriate next agent j (either the next agent who
can work on the task or the first agent in the shortest path to that agent) is Ti,j/(zi × zj)2.
Stress is raised to the power 2 so that the effect of being in high stress is strong.
4. Results
We have designed a model of organizational behavior and outcomes in which the organization
completes groups of sub-tasks — tasks — that need to follow a given order. The rate of
ORGANIZATIONS AND EMOTIONS 17
task completion depends on two aspects of the alignment of organizational components: the
classic alignment of formal organizational structure with the environment; and the less-classic
alignment of formal and informal organizational structures.
Agents in the organization both work on the sub-tasks for which they possess expert knowl-
edge, and help manage the general work flow by sending any pending task to the next relevant
agent. Agents’ abilities to do the previous two jobs are moderated by their stress levels, in a
way consistent with empirical findings in psychology and organization studies. Stress fluctuates
with an agent’s workload which results from organizational structure (and its fit to environ-
mental conditions). Stress also responds to patterns of affiliation and social interactions which
are constrained by the informal network.
We begin the next subsection by briefly discussing the congruence of organizational structure
and the environment, first ignoring any stress effects and then in the presence of stress but
without social interaction. Our findings are in line with intuition and with the literature:
structural misalignment and stress both lower organizational performance. We then introduce
social interaction, showing that the negative effects of work stress can be overcome by the
positive effects of social interaction, provided affinity is strong enough. However, when affinity
is strong, social interaction is also a source of multiple equilibria. The potential benefits from
social interaction are thus mitigated by the additional increase in the variance of organizational
performance. Finally, we explore architectural alignment, which we define as the alignment
of the formal and informal networks. We find that architectural alignment is not a desirable
feature — isomorphism between the friendship and workflow networks is the worst possible
situation.
4.1. Organizational structure, stress and environmental fit.
4.1.1. The effects of formal structures, and of work stress. When we suppress all stress dynam-
ics, organizational structure is the only source of performance variation. Indeed, absent job
stress, fluctuations in workload have no effect on individuals’ capacity to process, that is, com-
plete or transmit sub-tasks. The absence of stress implies that at any moment, total potential
flow of work is identical across all organizations.14 All organizations therefore have the same
total task processing capacity embedded in their workforce and structure.
Organizational structure affects the distribution of sub-tasks over individuals by changing
effective workflow. An organization “tuned” to its environment, (if that can be done), will
be efficient in moving sub-tasks among the people needed to complete them. This will reduce
14This follows from the way total carrying capacity in the formal network has been normalized in the organizationconstruction.
18 COWAN AND JONARD
transmission time of a task through the organization, less time spent transiting through the
organization implying faster task completion rates and better performance.
When we introduce stress, it operates through two channels: workload and interpersonal
dynamics. Initially we consider only the former. Any agent in the organization is subject to job
stress, which mounts as the number of sub-tasks on his desk awaiting completion or transmission
increases. Mounting job stress implies that the agent spends more mental energy managing his
stress and less on his work. Formally, as stress increases, the agent is less successful in completing
sub-tasks and transmitting work, that is, the probabilities of completion, and transmission to
the next agent are lower.
0.0 0.2 0.4 0.6 0.8 1.0
100
300
500
700
0.0 0.2 0.4 0.6 0.8 1.0
Alignment of structure to environment
Num
ber
of ta
sks
com
plet
ed
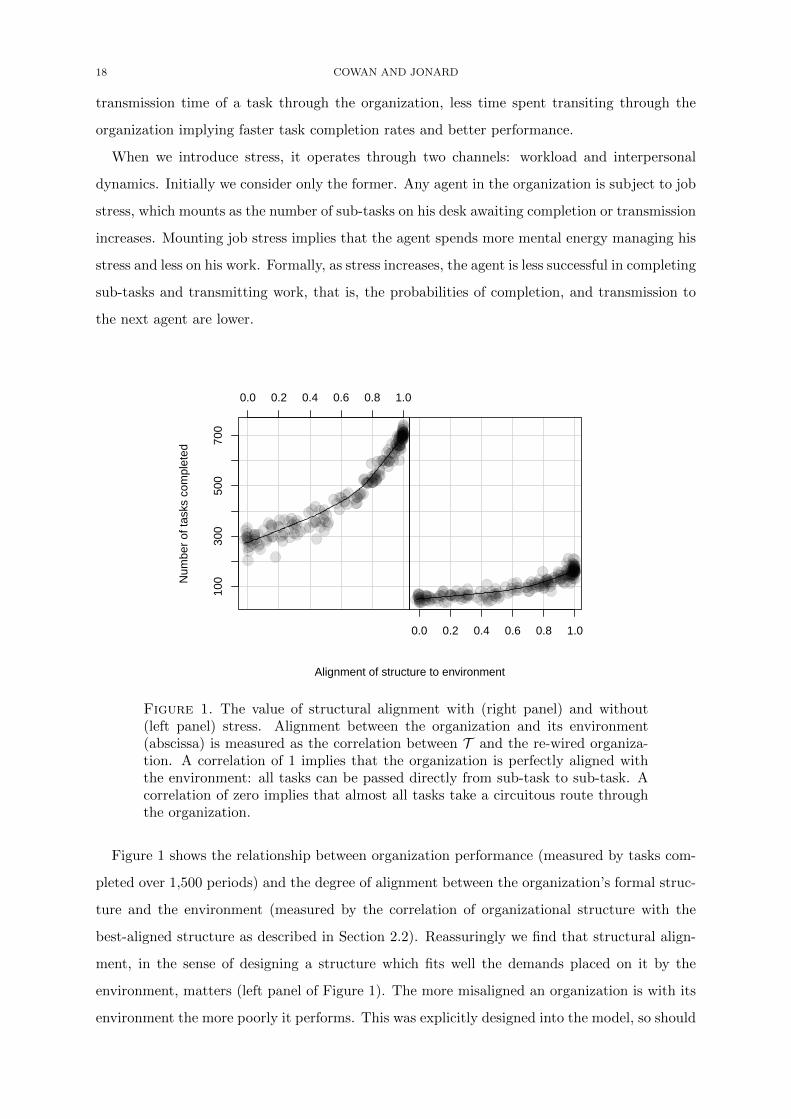
Figure 1. The value of structural alignment with (right panel) and without(left panel) stress. Alignment between the organization and its environment(abscissa) is measured as the correlation between T and the re-wired organiza-tion. A correlation of 1 implies that the organization is perfectly aligned withthe environment: all tasks can be passed directly from sub-task to sub-task. Acorrelation of zero implies that almost all tasks take a circuitous route throughthe organization.
Figure 1 shows the relationship between organization performance (measured by tasks com-
pleted over 1,500 periods) and the degree of alignment between the organization’s formal struc-
ture and the environment (measured by the correlation of organizational structure with the
best-aligned structure as described in Section 2.2). Reassuringly we find that structural align-
ment, in the sense of designing a structure which fits well the demands placed on it by the
environment, matters (left panel of Figure 1). The more misaligned an organization is with its
environment the more poorly it performs. This was explicitly designed into the model, so should
ORGANIZATIONS AND EMOTIONS 19
not be seen as a result, but rather as a check. More interesting is that this relationship also
holds in the presence of stress (right panel). Stress degrades individual, and as a consequence
organizational, performance significantly but the value of alignment between formal structures
and environment is preserved.
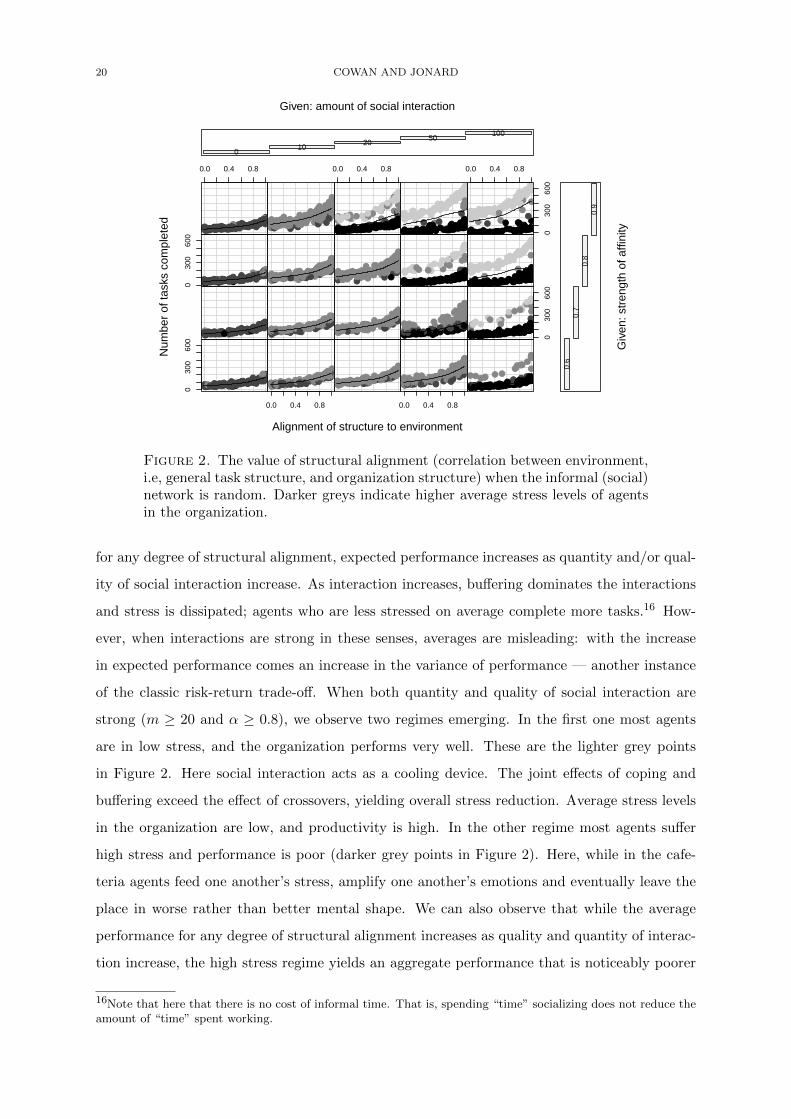
4.1.2. Adding social stress dynamics. In addition to job stress, agents are subject to stress
buffering and spillovers, which take place during social interaction. We explore two dimensions
of social interaction: quantity and quality. Quantity is measured by the number of social
interactions that take place each period, m, ranging from zero to one hundred. (When m =
100 the system will move very close to an equilibrium each period.) Quality of interaction is
controlled by α, 0 ≤ α ≤ 1, which captures the extent to which one agent is affected by another’s
stress level.
We present the results in a multi-panel plot, which deserves a word of explanation. The
key performance measure is the number of tasks an organization completes over the entire
history. We plot this against our measure of environmental fit, the correlation of organizational
structure with the best-aligned structure. In each panel, one point represents one organization’s
performance over 1,500 periods, on the sequence of tasks which arrive at its door. Each panel
represents one level of social interaction, m crossed with one level of affinity, α. Reading across
a row of panels, the amount of social interaction increases from zero to 100 interactions per
period. Reading up a column of panels, affinity increases from weak (0.5) to strong (0.9). The
experiment has been constructed so that each of the points in any panel has a counterpart in
every other panel. Here we are not yet concerned with the effects of formal/informal alignment
so we have simply used a random social interaction structure, having no correlation with the
formal structure of the organization.15 This issue we take up explicitly below.
Figure 2 shows the effects of the strength of affinity and the intensity of social interaction
on organizational performance. The patterns seen in the absence of stress (Figure 1) carry
over in the presence of informal (social) interaction. Again remarking that we have assumed
that there is no correlation between the formal and informal networks, aligning the structure
to the environment is always performance-improving. However, increasing this alignment not
only increases the average number of tasks completed, but it also increases the variation in
performance, and this increase is large when social interaction is very intense (m = 100 in the
last column).
Increasing quantity (moving left to right along any row) or quality (moving up any column) of
social interactions has ambiguous effects on performance. On average, both effects are positive:
15This assumption is not crucial. Running this experiment using a social network that has a high correlation tothe formal structure produces the same patterns, possibly slightly amplified.
20 COWAN AND JONARD
● ●●
● ●●
●●●
●●●●●
●●●●
●●
● ●●
●
●●●●●
●● ●●● ● ●●●●●●●●●●
●●
●● ●
●
● ● ●●●
●●● ● ●●
●●●●● ●
●●
●● ●
●●●
●●●● ●●
●●
●●●
● ●●●●
● ● ●●
●●●●●
●●●
●●●●●●
●● ●●
● ●● ●
●● ● ●
●
●●●
●●●
●●
●● ●
●●●●● ●
●●
●● ● ●●
●●●
●● ● ●● ● ●●
●
● ●●●●●●●
● ●●● ●●●●
● ●
●
● ● ●●●
●●●
●
●●●●●●
●
●●
●●●
●
030
060
0
●● ●●●● ●
●●●
●●●
●●●
●
●●●●
●
●●
●
●●● ●
●
●●
●●●●●
●●
●●
● ●●●●●
●●●●
●●●●● ●
●●●
●●● ●
●●
●●●●● ●●
●●
●●
●●
●●
●
●●●
●
● ●
●●
●
●●
●● ●
●●
●●
●● ●
● ●●
●●
●●●
● ●● ●
●●
●
●● ●
●
●●
● ●●●
●●
●●
●
●●●
●●●
●● ●●
●●
●
●
●●●●
●●
●
●●
●●●
●
●●●
●
●
●●●
● ● ● ●●●
●● ●
●
●●
●
●
●●
●●
●● ●●●
●
●
●●●
●
●●
●
0.0 0.4 0.8
●●
●●●
●●●
●●
●●●
●●●
●
●● ●
●
●●
●
●●●
● ●
●
●● ●
●●●
●
●● ●●
●
●
●
●●●●
●
●
●●
●●
●●●●
●●
●
●●
●●
●
●●
●●
●
●● ●●
●●
●
●●●●
●
●●
●●
●
● ●●
●●
●●
●●●
●
●●●
●●
●●
● ●●
●●
●● ●●
●
●●●
●
● ●
●
●
●●●
● ●●
●
●
●●●●
●●●
●
●
●●
●● ●●●●
●●
●●●
●●
● ●●
●●
●● ●
●●●
●●●
●● ●●●●
●●
●●●●
●●
●●
● ●
●●● ●●
●●
●●●
●●
●●●●●
●●
●
●●
●
●●
●
●
●
● ●
●
●
●●
●●
●●●
●
●●
●●
●●●
●
●●
●
●
●
●
●
●
●●
●
● ● ●●
●●●●
●●
●●
● ●●
●● ●
●
●●
●● ●
●●
●●
●
●●●
●●
●
●●
●
●●●●
● ●
●
●●●
●●●
●● ●
●●●
●
●
●●
●
●
●●
●●
●
●●
●●●●
●●
● ● ●●
●●
●●
● ●
●
●●
●●●●
●
●●
● ●● ●●
●●●
●●
●●●●
●
●
●● ●
●●
●●
● ●●●●
●●●
●
●●
●●
●
●
●●●
●
●
●
●
●●●●●
●●
●●
●●●
0.0 0.4 0.8
●
●
●●
●
●
●● ●●●●● ● ●
●●● ●
●●●●●
●●●● ● ●
●●●●●
●
● ●●●●
●●●
●
● ●●
●
●●●●
● ●● ●●
●●● ●
●
●●
● ●●●
●●
●
●●●
●●●●
●●
●●●●
●●●
●●●
●
●●●
●
●●
●
●●●●●●
●●
●
●●
●●
● ●●●● ●
●
●●●●
●● ●●● ●●●●●●●
●●● ●● ●
●●● ● ●●●●●●●
●●
●●
●●
●●●●
●●
●●● ●
●● ●●●●
●● ●●● ● ●●
●● ●
●●●
●
●●●●
●●●
●●● ●
● ●●● ●
●
●●
●●●●
●●●●
●●
●●
● ●●
●●
●●●●
●● ●●● ● ●●●●●●●
●●●
●
●●● ●
●
●●
●●●
●●● ● ●●
●●●
●● ●●
●●
● ●
●●●
●●●● ●●●
●●
●●
● ●●●●
● ● ●●
●●●●●
●●●●
●●
●●●● ●
●●●
●● ●
●●
● ●●
●●●
●●●
●●●
● ●●●●
●● ●●
●●
●● ●●
●●●
●
● ● ●● ●●●●
● ●●●●●●●
● ●●● ●●●●
● ●
●
● ●●● ●●
●●●●
●●●
●●
●
●● ●
●●● ●● ●●●● ●
●●●
●●
●
●
●●
●
●●●●
●
●●●
●●●
●●
●●
●●
●●●
●●●
●● ●
●●●●
●●●●
●●●
●●●
●●●
●●● ●
●●
●●●●
●●●
●●
●●●
●
●●
●
●●●
●● ●
●●
●
●●
●● ●
●●
●●
●
● ●
●●
●
●●
●●●
● ●●
●●
●
●
●●
●●
● ●● ●●
●●
●●●
●
●
●●
●
●●●
● ● ●●
●●
●
●●●●●
●●
●
●● ●
●
●
●●●
●
●
●●●
●● ● ●●●
●● ●
●
●●
●
●●●
●
●●● ●●
● ●●
●●●
●
●●
● ●●
●●●
●●●
●●
●●
●
●●●
●
●● ●
●
●
●●
●●●● ●
●●● ●
●●●
●
●●
●
●
●
●
●
●●●●●
●
●●
●●
●●●
●●●
●
●
●●●
●
●●
●●
●●● ●●
●●
●●●●
●
●
●●
●●
●● ●●
●
●●
●
●●●●●●
●●●
●●
● ●●
●●
●● ●●
●
●●●
●
● ●
●
●
●●●
●●
●●
●
●●●●
●●●●
●
●
●●●
●●●
●
●●
●●
●
●
●● ●
●
●● ●●
● ●●
●
●●
●●● ●
●●●
●
●●●●●
●●
●●
●●
●●
● ●●
●● ●
●●
●●
●● ●
●
●●●
●●●
●
●●
●
●●
●●
●●●
●●●●●
●
●
●●●
●
●●●
●
●●
●
●
●
●
● ●●●●
● ● ●●
●
●●●
●●
● ●●
●●
●● ●●● ●
●● ●●
●
●
●
●
●●
●
●●
●
●●
●
●
●
●●
●●●
●
●
●
●●●
●●
●●
●●
●
●
●●
●●● ●
●●
●●●
●●
●●
●●
● ●●
●●●
●● ●
●●●●
●● ●●
●●
●●
●● ●● ●
●●●
●
●
●●
●
●
●●
● ●● ●
●●
● ●●●
●
●●
●●
●●
●●
●
●
●
●
●
●●
●●
●●●●●
●● ●
●
● ●●
● ●●●
●●●● ●●●
●
● ● ●●
●
● ●●
●●●●
●●●
●
●● ●●●●
●●
● ●●
●
● ●●●
●
● ●●●●
●●●●●
● ●●
●●
●●
●
●
●
● ●●
●
●
●●
●
●●●
●
●●●
● ●●●●
●●
●
●●
●●
●●
●
●●●
●
● ●●●
●●●
●
●●
●
●●
●●●
●● ●●●●●●
●●
●
●● ●● ●●
●
●●●
●● ●● ●●
●● ● ●
●
●●●●
● ●
●●
●●
●●●●
● ●● ●●●
●●●●●●●
● ● ●●● ●
●
●●● ●
●●●
●●
●●●●●●
●●● ●
030
060
0
● ● ●● ●
●●
●●
●●●●●
●●●●
●
●
● ●●●
●●●
●●
●● ●●● ● ●●●●●●●●●●
●●
●● ●●
● ●●●
●
●
●● ● ●●●●●
●● ●
●●
●● ●
●●●●●●●
●●●
●●
●●● ●
●●●● ● ●●
●●●●
●●●
●●●● ●
●●
●●
●●● ●
● ●●● ●●
●●●●
●●●
●●
●● ●●●●
●● ●●
●●
● ● ●●●●
●●
● ● ●● ● ●●●
● ●●●●●●●
● ●●● ●●●●
● ●●
● ● ●● ●●
●●●●
●●●●●
●
●
●● ●●●
030
060
0
●● ●●
●● ●●
●●
●●
●
●
●●
●
●●●●
●
●●
●
●●
●●●
●
●
●●
●●●
●●
● ●● ●
●●●●
●●●●●●●
●●
●
●●●
●●●●
●●
●●●●●
●●
●●
●●
●
●
●
●
●
●●●
●
● ●
●●
●
●● ●
● ●●
●
●●
●
● ●●
●●●●●●
●● ●
●●
●
●
●
●●
●●
● ●●
●●●●
●●●
●●
●●●
●●●●
●
●
●●
●
●●●
●●● ●●
●
●●
●●
●
●●●
●
●
●●●
●● ●
●
●●
●●
●
●
●●
●
●●●
●
● ●● ●●●
●
●
●●
●
●●●
● ●●
●●●
●● ●
●●
●●●
●●●
●
●● ●
●
●
●
●
●●
●
● ●●
●● ●
●●●
●
●
●●
●
●
●
●
●●●●●
●
● ●●●
●●
●●
●●
●
● ●●
●
●
●●
●●
●
●● ●●●●
●
●●
●●
●
●●
●●
●●
●
●●●
●
●
●●
●●
●
●●
●●
●●
●●
●
●
●
●● ●●
●
●●
● ●
●●
●●
●●
●
●●
● ●
●
●●●●
●●
●
●
●
●
●●
●
●
●●
●
●●
●●●
● ●●●●
●●
●●●
●●
●
●●●
●●
●
●●●
●
●●●●●
●●
●
●● ●
●●● ●
●
●
●●●●
● ●
●
●●
●●●●
●
●●●
● ●●●
●
● ●●
●
●
●●●●●
● ●●●
●●●●●
●●
●
●●
●●
●●
●
●●
● ●
●
●
●●●
●
●
●● ●
●
●●
●
●
●
●
● ●●
●
●●● ●●●
●●
●
●●
●
●●●
●●●●
●
●
●
●●
●
●
●
●●
●
● ●●● ●●
●●
●●
● ●
●
●
●●●
●
●
●●●●●
●
●
●●●
●
● ● ●●● ●●
●
●
●
●●
●● ●●
●●
●
●● ●
●
●●● ●
●●
● ● ●● ●
●●
● ●●●●
●●
●●
●●●
●●
●●●●
●
● ●● ●●●●
●
●●
●●●●●
●●
●
●
●●
●●
●●
●●
●
● ● ●
●●
●●●
●
●
●●
●
●●
● ●
●
●●
●●
●
● ●●
●●●
●●
●●
●
●
● ●●
●
●
●
●●
●
●●
●
●
● ●
●●
●
●
●●
●
●
●
● ●●
●●
●●
●●
●●●●●● ●
●
●
●
●
●
●
● ●
●●
●
●
●
●● ●●●
●
●
●
●
●●● ●
●
●●
●
●
●
●●
●
●●
●
●● ●●
●
●
●●
●
●
●
● ●
●
● ●
●
● ● ●
●
●●●
●●
●
●
●●
●
●
●●
●●
●
● ●●●
●
●
●
●
●●
●
● ● ●●●●
●
●●● ●
●
●
●
●
●
●●●
●
●●
●●
●
●
● ● ●● ●
●● ●
●●●●
●●●●
●●●
●● ●●
●●
●●●●
●● ●●● ● ●●●●●●●
●●●●
●●● ●
●
●● ●●
●●
●● ●
●●●●●
●● ●●
●●
● ●●
●●●●●● ●
●
●●
●●●
● ●●●●
● ● ●●●●●●
●●●●● ●●●●●
● ●●●●
●● ●
●● ●
●●
●●●●● ●
●●●
● ●●●●
●●●
●●
●●
● ●●●● ●
●
● ● ●● ●●●
●● ●●
●●●●●
● ●●● ●●●●
● ●●
● ●●● ●●
●●●
●●●
●●●
●
●●
●●●●
0.0 0.4 0.8
●● ●●●● ●
●●●
●●
●
●
●●
●
●●●
●
●
●●
●
●●
● ●
●
●●
●●
●●
●
●●
● ●● ●●
●●●
●●●●
●●●
●
● ●●●
●
●●
●●
●●
●●●●●
●●
●●
●●
●
●●
●
●
●●●
●
●●
●●
●
●
●●
● ●●
●
●●
●
●●
●
●
●
●●
●●●
● ●●
●
●●
●
●
●●
●
● ●● ●
●●
●
●●
●●● ●●●
●●●
●●
●
● ●●●
●●
●●
●
●
●
●
● ● ●●
●
●
●●
●
●
●●
●
●● ●
●●●
●
●●
●
●
●
●
●●●
●
●
●● ●●● ●
●
●
●●●●●
●●
●
●●●
●●
●●●
●●●●●●
●
●
● ● ●
●
●
●●
●●
●
●●
●
●
●
●●
●
●
●
●
●
●
●
●
●●
●
●
●
●
●
●
●
●●
●●
●●
●
●●
●●
●
●●
●●
●●
●●
● ●
●●●
●
●
●●●
●
● ●
●●
●
●
●
●●
●
●●
●●●●
●
●●●●
●
●
●
●
●●
●
●●
●●
●
●●●●
● ●
●●
●
●●●
●
● ●●
●●●●
●
●●
●● ●
●
●
● ●●● ●●● ●
●
●
●●● ●
●
●
●
●
●
●●●
●
●
●
● ●● ●
●
●
●● ●
●●
●●●●
●
●●
●●●● ●●
●● ●●
●
● ●
0.0 0.4 0.8
●
●
●●●
●●
●
●
●
●
●
●●
●
●
●
●
●
●
●
●
●●
●
●
●
●
●●●●
●
●●
●
●
●
●●
●
●
●
●
●
●
●
●
●
●●
●
●●●
●
●
●
●
●
●●
●
●
●
●●
●
●
●
●
●
●
●
●●
●●
●
●
●
●
●● ●●●
●●
●
●
●
●
●
●
●
●
●●
● ●
●●●
●
●
●●
●
●
●
●
●● ●
●●
●
●
●
●
●
●
●
● ●
●●●
●●
● ●●
● ●●
●
●●
●
●
●
● ●
●
●●
●●
●
●
●
●●
●
●●●
●
●●
●●
●●
●●●●
●●
●
●
●
●
●
●
●
●●
●
●
●
●
●
●● ●
●
●
●
●●●
●
●
● ●●
● ●
●●
●
●●●
●●●
●
●
●
●
●
●●
●
●●
●
●●
●
●●●
●
●
●
●●
●●
●●
●
●●
●●
●●●
●
●●
●
●
●●●●
●
●
●●
●●
●
●
●●
●●
●
●
●
●●●
●
●●
●●
●
●
●
●
●●
●
●
●
●
●
●●
●●
●
●
●●
●
●
●
●
●●
●
●●
●●
●
●
●
●●
●
●
●
●
●
●
●●●
●
●
●●
●●
●
●●
●●
●●●
●●●
●
●
●
●
●
●
●
●●
●●●
●●
●
●
●
●
●
●
●
●●●
●●
●
●
● ●
●●
●
●
●●
●●
●
●●●
●●
●
●
●
●
●
●
●
●
●
●●
●
●
●
●●
●●
0.0 0.4 0.8
030
060
0
Alignment of structure to environment
Num
ber
of ta
sks
com
plet
ed0
1020
50100
Given: amount of social interaction
0.6
0.7
0.8
0.9
Giv
en: s
tren
gth
of a
ffini
ty
Figure 2. The value of structural alignment (correlation between environment,i.e, general task structure, and organization structure) when the informal (social)network is random. Darker greys indicate higher average stress levels of agentsin the organization.
for any degree of structural alignment, expected performance increases as quantity and/or qual-
ity of social interaction increase. As interaction increases, buffering dominates the interactions
and stress is dissipated; agents who are less stressed on average complete more tasks.16 How-
ever, when interactions are strong in these senses, averages are misleading: with the increase
in expected performance comes an increase in the variance of performance — another instance
of the classic risk-return trade-off. When both quantity and quality of social interaction are
strong (m ≥ 20 and α ≥ 0.8), we observe two regimes emerging. In the first one most agents
are in low stress, and the organization performs very well. These are the lighter grey points
in Figure 2. Here social interaction acts as a cooling device. The joint effects of coping and
buffering exceed the effect of crossovers, yielding overall stress reduction. Average stress levels
in the organization are low, and productivity is high. In the other regime most agents suffer
high stress and performance is poor (darker grey points in Figure 2). Here, while in the cafe-
teria agents feed one another’s stress, amplify one another’s emotions and eventually leave the
place in worse rather than better mental shape. We can also observe that while the average
performance for any degree of structural alignment increases as quality and quantity of interac-
tion increase, the high stress regime yields an aggregate performance that is noticeably poorer
16Note that here that there is no cost of informal time. That is, spending “time” socializing does not reduce theamount of “time” spent working.
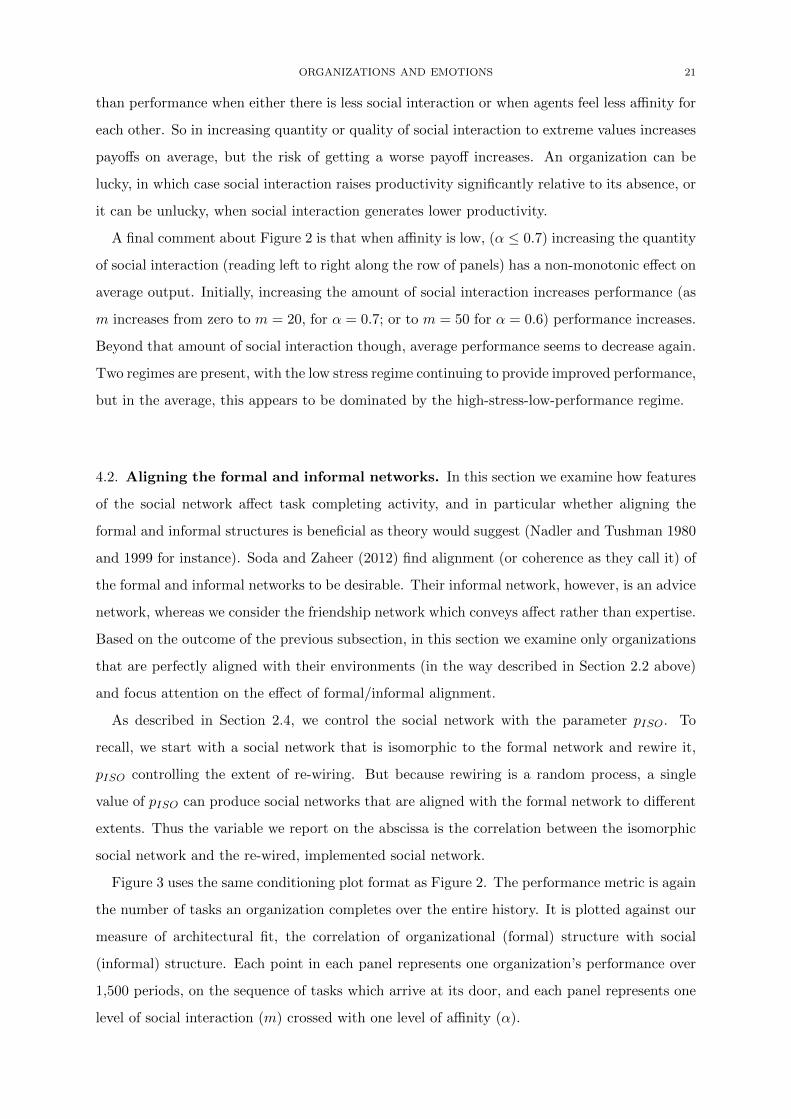
ORGANIZATIONS AND EMOTIONS 21
than performance when either there is less social interaction or when agents feel less affinity for
each other. So in increasing quantity or quality of social interaction to extreme values increases
payoffs on average, but the risk of getting a worse payoff increases. An organization can be
lucky, in which case social interaction raises productivity significantly relative to its absence, or
it can be unlucky, when social interaction generates lower productivity.
A final comment about Figure 2 is that when affinity is low, (α ≤ 0.7) increasing the quantity
of social interaction (reading left to right along the row of panels) has a non-monotonic effect on
average output. Initially, increasing the amount of social interaction increases performance (as
m increases from zero to m = 20, for α = 0.7; or to m = 50 for α = 0.6) performance increases.
Beyond that amount of social interaction though, average performance seems to decrease again.
Two regimes are present, with the low stress regime continuing to provide improved performance,
but in the average, this appears to be dominated by the high-stress-low-performance regime.
4.2. Aligning the formal and informal networks. In this section we examine how features
of the social network affect task completing activity, and in particular whether aligning the
formal and informal structures is beneficial as theory would suggest (Nadler and Tushman 1980
and 1999 for instance). Soda and Zaheer (2012) find alignment (or coherence as they call it) of
the formal and informal networks to be desirable. Their informal network, however, is an advice
network, whereas we consider the friendship network which conveys affect rather than expertise.
Based on the outcome of the previous subsection, in this section we examine only organizations
that are perfectly aligned with their environments (in the way described in Section 2.2 above)
and focus attention on the effect of formal/informal alignment.
As described in Section 2.4, we control the social network with the parameter pISO. To
recall, we start with a social network that is isomorphic to the formal network and rewire it,
pISO controlling the extent of re-wiring. But because rewiring is a random process, a single
value of pISO can produce social networks that are aligned with the formal network to different
extents. Thus the variable we report on the abscissa is the correlation between the isomorphic
social network and the re-wired, implemented social network.
Figure 3 uses the same conditioning plot format as Figure 2. The performance metric is again
the number of tasks an organization completes over the entire history. It is plotted against our
measure of architectural fit, the correlation of organizational (formal) structure with social
(informal) structure. Each point in each panel represents one organization’s performance over
1,500 periods, on the sequence of tasks which arrive at its door, and each panel represents one
level of social interaction (m) crossed with one level of affinity (α).
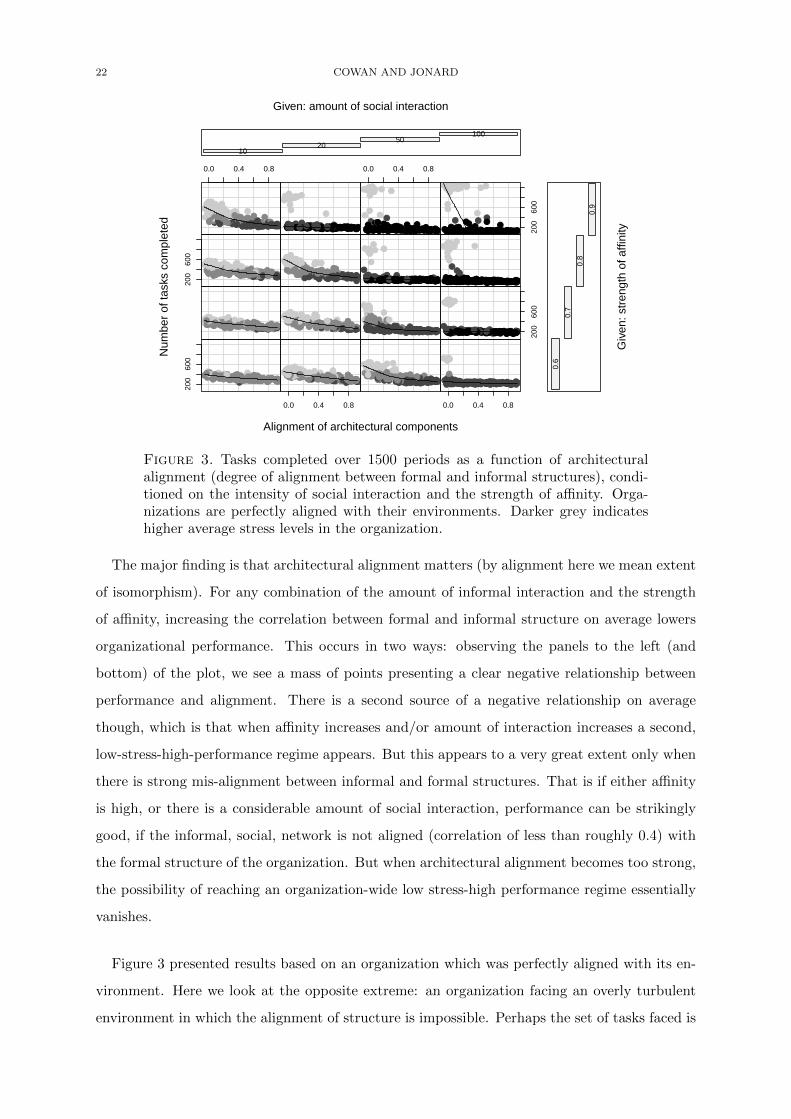
22 COWAN AND JONARD
●●●●● ●●●
● ●●
●●● ●●
●●
●●●● ●
●● ● ●● ●
●● ●●●●
●●
●●● ●● ● ●● ●
●● ●●●
●●● ●●
● ●● ●●
●●● ●● ●●●●
●●● ●
●●●
●● ●
● ●● ●● ●●
●●● ● ●
●● ●●●●● ●●
●●●
●●
● ●●●●●● ●●
●● ● ●● ●● ● ●●
●●●
●●
●●●
●● ● ●
● ● ●●
●●
●●●●● ●●●● ●
●● ●●● ●●●● ●
● ●● ●● ●●●●●●●
●●● ●
● ●● ● ●●● ●●●● ●●●●
●●●●●●
200
600
●●●● ●●●
●●
●
●●
● ●● ●●●●●
●●● ● ● ●●●
●●●●● ● ●
● ● ●●●
● ●● ●● ●●●
●●
●●
●● ●●●
●●●
●●
●●● ●●
●● ●●●●●● ●●●
●●●
●●
●●●
●●
●● ●●
●● ●●
●● ●
●●
●●● ●
●●●● ● ●
●●●
●● ●
●●●
●
●
●●
●●●●
●● ●
●● ●
●●●
●
●●● ●
●●●
●●
●●
●●●●●● ●
● ●●●
●●
●
●● ●●●
●
●
●● ●●
●●●● ●●
● ●● ●●
● ●●●
●●
●●●● ●●●
●●
0.0 0.4 0.8
●●
●●
●
●
●●
●
●●
●
●
●
●●
●●
●
●●●
●
●●
●● ●●
●●
●●●●
●●
●
●●●
●●●● ● ●● ●●
●
●
●
●●●
●
● ●
●●
●● ●●●●●
●● ●●
●
●
●●
●●●
●●●●
●●●
●
●●
●●
●● ●
●●
●●
● ●●
●●●
●●● ●
●●
●●●
●● ●●●
●
●
●●●
●●
●
●●●
●●
●●
●●●
●●● ●
●
●●
●●
●
●●● ●
●●●●●
●
●
●
●●●●
●●●
●●
●●●
●
●
●
●
●●●
●
●●
●
●●● ●●●
●
●
●●
● ●
●
●●●●
●
● ●●●● ● ●●●●● ● ● ●● ●●● ●●●●●● ●●● ●● ●●●
●●●● ● ●
●
● ●●●●●● ●●● ● ●● ●● ●●● ●● ● ●● ●● ●●● ●●● ●
●
● ●●● ●● ●●● ●● ●●● ●● ●●●●● ●● ●● ●●● ●●●● ●●● ●● ●●
● ●
●
●● ●● ●● ●●● ●●●● ●●●●●●●● ●●● ●● ● ● ●● ●● ●●● ● ●
●
●● ●●●● ●●● ● ●●●● ● ● ●●
●
●● ●●● ●●
●
● ● ●● ●●
●
● ●●●
●● ●●● ●● ● ●●●
0.0 0.4 0.8
●●●●● ●●● ●
●
●●
●● ●●
●●
●●●
● ●●● ● ●●
●●● ● ●●●
●●●●
● ●● ● ●●
●●●
●
● ● ●●
●●
●● ●● ●
● ●●●●
● ● ●●●●
●●
●● ●●●
●●● ●●●● ●
●
●●●● ●
●● ●●●●● ●●
●●●
●●
● ●●●●●● ●●●● ● ●● ●● ● ●
●●●
●● ●
●●● ●● ●
●● ●
●
●
●● ●●●●● ●●●● ●
●●
●●● ●
●●● ●● ●●
●●
●●●
●●●●●●● ●● ●
●● ●●● ●
●●
● ●●● ●●
●●●●●
●●●●
●●●
●●●
●●
●
●● ●●●
●●●
●●
● ● ●●●● ●●
●● ● ●● ●●
●●
● ●● ●●
●●● ●●
●●●
● ●●
●●●
●
●
●●●
● ●●●
●
●●●●●● ●
●
●●
●●●
●
●
●●
●●
●●
●
●
●● ●●
●● ●● ● ●●
● ●
●●●● ●
●
●●●
●● ● ●●●
●
●
●●
●
●●●
●
● ●● ●
●
●●
●●
●●●
●●
●
●●● ●
●●
●●
●●●●● ●
●
● ●●
●
●
●●●
●
●
●
●●
●●
●●
●●
●●● ●
●
●
●
● ●
●●
●●
●●●●
●●
●
●●
● ●●
●
●
●
●●
●
●●● ●●
●●
●●
●
●●●●●● ●
●
●
●
● ●● ●●●●● ●
●
●● ●●●●●
●● ●●
●
●● ●●●●● ●●
●
●● ●●●●● ●● ●●●● ●
●
●
●
●●
●●●●●●
●
●●
●●
●●
●●● ●● ● ●●●
●
●
●●● ●● ●●
●●●● ●●
●● ●●
●
●●●
● ●●● ●●●● ●● ● ●●
●● ●
●● ●
●●●
●
● ●●
●●
●
●
●
●
●
●
●●
●●●
●
●
●● ●●
●
●
●
●●
● ●
●
● ●
●
●●●
●●●●
●
●
●● ●
●
●●●
●
●
● ●●
●
● ● ●●●●● ● ● ●● ●●● ●●●●●● ●●● ●● ●●● ●●●● ● ●●● ●●●●
●
● ●●
●
● ●● ●● ●●
●
●● ● ●● ●● ●●● ●●● ●●● ●●● ●● ●●
●
●● ●●● ●●●●●●● ●● ●● ●●● ●●●
●
●●● ●● ●●● ●●
●
●
●● ●● ●●● ●●●● ●●●
●
●●
●
● ●●● ●
●
● ● ●● ●● ●
●●
● ●
●
●● ●●●● ●●● ● ●●●● ● ● ●●
●
●
●
●●●●●
●
● ● ●
●
●●
●
● ●●
●
●● ●●
●
●● ● ●●
●
200
600
●●●●●
●●●
● ●
●
●
●●
●● ●●
●●
●
●
●●●
● ●●
●●
●
●●●●
●
●●
●
● ●● ● ●● ●●●
●
● ●
●●●
●
●● ●
●●
●
●●●
●●
●
●●●
●
●● ●
●●
●●●
●● ●● ●●
●
●
●●● ●
●
●● ●
●
●●● ●●●
●●
●
●
● ●●
●●●●
●●
●● ●
●● ●
●● ● ●●●
●●
●●
●●●
●●
●● ● ●
●
●●
●●
●●●●●●● ●
●●
●●● ●
●●● ●●
●●
●● ●●●
●●●
●
●●● ●●
●
●
● ●●● ●●
●●●●
●
●
●
●●●●
●
200
600
●●●●
●
●●
●●
●
●
●
●
●●
●
●
●
●● ●
●●
●●
●●●●
●●
●●
● ●● ● ●●
●
● ●
● ●●
●●●●
●
●●●● ●●●
●●
●
●
●
●●
●
●●
●●
● ●●●
●
●●
●●
●●●
●●
●
●●
●●
●●●
●●● ●
●
●
●●
●●
●●● ●
●●●
● ● ●
●●
●
●
●●
●●● ●●
●
●
●
●●●
●
●
●●● ●
●●
●
●●
●●
●
●
●
●●
● ●●
●
●●●
●●
●
● ●●
●●●
●
●
●
●●
●●
●
●
●
●
●
●●
●●
●●● ●
●
●
●
● ●
●●
●●
●
●●●
●●
●
●●
●●●
●
●
●
●
●●
● ●● ●● ● ●● ●●
●●●
●
●● ●
●
●● ●●● ●●●●● ●●●● ●●●● ● ●● ●●● ●● ●●●● ● ●●● ●● ●●●●● ●● ●●●● ●●●●● ●●●● ●●●● ●●
●● ●●●●● ●● ● ●●●
●
● ●●● ●● ●● ●● ●● ●●●● ●●●
● ●●● ●●● ●● ●● ●● ● ●●● ● ●●● ●●●●● ● ●●●●●● ●
●
●●
●
●● ●●●
●
● ● ●●
●
●
●
●●● ●●● ●
●
●●● ●●● ●● ● ●● ●
●
●●● ●●
● ●●●● ● ●●●●● ● ● ●● ●●● ●●●●
●
● ●●● ●
●
●●
●
●●
●
● ● ●
●
● ●●●●
●●
●●
●
● ●
●
●
●
●●
●
●● ● ●● ●● ●●● ●●● ●●● ●●● ●● ●●
●
●● ●●● ●
●
●●●●● ●● ●● ●●● ●●
●
● ●●● ●● ●●● ●
●
●
●
●● ●● ●●● ●●●● ●●
●●
●●
●
● ●●● ●
●
●
● ●●●● ●
●● ● ●
●
●● ●●●● ●●●●
●●●
●
● ● ●●
●
●
●
●●● ●
●●
● ● ●
●
●●
●
● ●
●●
●● ●
●
● ●● ● ●●●
●●●●
● ●●●
●●
● ●●●
●
●
●
●
●●●
●
●●●● ●
●
●
●
●
● ●●●●
●●
●
● ●●
● ●● ●●● ●
● ●
●●
●
●● ●
●
●
●
●
●
●●
●● ●
●●●
●
●● ●
●●●
●
●●●
●● ●●
●
●
●●
●
●●
●●
●●
●●
●●
●
●
●●
●
●
● ●●●
●●●
●●
●
● ● ●●
●●
●
● ●●
●
●●
●●
●
●
●
●
●●
●
●●
●
●
●
●●
●●●
●●●● ●
●
●●●
● ●
●●
●
●
● ●●
●
●
●●●
●●
●●
●●
●
●●●
●
● ●●● ●
●
●● ●●
●
●
●
●
●●●
●
0.0 0.4 0.8
●●●● ●●
●
●●●● ●
●
●
●
●●
●
●● ●●● ● ● ●●●● ●●●● ● ●● ● ●●
●
● ●● ●● ●●●
●
● ●●●● ●● ●●●● ●● ●●● ●●●
●
● ●●●●● ●●● ● ●●● ●● ●●● ● ●● ●● ●● ●●● ● ●● ● ●●● ●●●●● ● ● ●●● ●● ● ●●● ●● ●
●
●
●●●
●●
●● ● ●● ●
●
●
●
●● ●
●●
●●
● ●● ●●● ●●
●
●
●
●
●
● ●●
●
●● ●●● ●
●
●
●
●●●●
●●
●●● ●
●
●
●
● ●●●
●●●●
●
●
●●● ●● ● ●●●
●
●
●
●●
●
●● ●
●
● ●● ●●
●●●● ●● ●
●
●● ● ●● ●●●●● ●
●●
● ●●●●● ●● ●●● ●
●●●
●
●
● ●
●
● ●● ●●●●● ●● ●●●● ●
●
●
●●
●
●
●
●
●●●
●
●●
●●
●●
●●● ●● ● ●●●
●●
●●● ●● ●● ●● ●● ●●●● ●
●●●
●●● ●●
●
●● ●● ●● ● ●●● ● ●●
●
●●●
●
●
●●
●
●
●●
● ●
●
●
●●●
● ●●●
●
● ● ●●
●
●
●
●
●
●●
●
● ●
●
●●● ●●● ●
●
● ●● ●
●
●●● ●
●
●
0.0 0.4 0.8
●●●●● ●●●●● ● ● ●● ●
●
● ●
●
●
●
●
● ●●● ●
●
●●●●●
●
● ●
●
●●
●●●●
●●
●●
● ●
●● ●●
●
●●
●● ● ●● ●● ●●●
●●
●
●
●
● ●●● ●● ●
●
● ●● ●●● ●
●
●●●●● ●● ●●
●
●● ●●●● ●●● ●● ●
●
● ●
●
●● ●
●
●● ●●● ●
●
●●
●●●●●
●
●●
●●
●
●
●
● ● ●● ●● ●
●● ●
●
●
●● ●●●● ●●
●
●
●
●
●
●
● ● ●●
●
●
●
●●
●
●
●●
●●
●
●
●●
●
● ●
●●
●● ●
●●
●
●
● ●
●
●
200
600
Alignment of architectural components
Num
ber
of ta
sks
com
plet
ed10
2050
100
Given: amount of social interaction
0.6
0.7
0.8
0.9
Giv
en: s
tren
gth
of a
ffini
ty
Figure 3. Tasks completed over 1500 periods as a function of architecturalalignment (degree of alignment between formal and informal structures), condi-tioned on the intensity of social interaction and the strength of affinity. Orga-nizations are perfectly aligned with their environments. Darker grey indicateshigher average stress levels in the organization.
The major finding is that architectural alignment matters (by alignment here we mean extent
of isomorphism). For any combination of the amount of informal interaction and the strength
of affinity, increasing the correlation between formal and informal structure on average lowers
organizational performance. This occurs in two ways: observing the panels to the left (and
bottom) of the plot, we see a mass of points presenting a clear negative relationship between
performance and alignment. There is a second source of a negative relationship on average
though, which is that when affinity increases and/or amount of interaction increases a second,
low-stress-high-performance regime appears. But this appears to a very great extent only when
there is strong mis-alignment between informal and formal structures. That is if either affinity
is high, or there is a considerable amount of social interaction, performance can be strikingly
good, if the informal, social, network is not aligned (correlation of less than roughly 0.4) with
the formal structure of the organization. But when architectural alignment becomes too strong,
the possibility of reaching an organization-wide low stress-high performance regime essentially
vanishes.
Figure 3 presented results based on an organization which was perfectly aligned with its en-
vironment. Here we look at the opposite extreme: an organization facing an overly turbulent
environment in which the alignment of structure is impossible. Perhaps the set of tasks faced is

ORGANIZATIONS AND EMOTIONS 23
unknown, or perhaps their frequencies are impossible to estimate, in any case the organization
is structurally misaligned. We capture this situation by simply focussing on rewired organiza-
tional structures that are as far as can be from the ideal structure (so p = 1 in the previous
subsection).17
●●●●●
●●●
● ●●● ●● ●● ● ●
●●● ●● ● ●●● ●● ●●
●●● ●●
● ●●●● ●● ● ●●●
●●●
●● ●●●
●●●●●● ●● ●● ●● ● ●●
●●● ●
●● ● ●●
●● ●
●●●●●● ● ●●●
●●● ● ●● ● ●●
●●●● ●● ●
●●●
●● ●●● ●●
●●
●●●
●●●●
● ●●● ● ●●● ●● ●● ●
● ●●
●● ●●
● ●●● ●●●● ● ●●●● ●
●●●●●
●●●
●●
●●●
● ●●●
●●
●●
● ● ● ●● ● ●●● ●
●●
●●● ●● ●
020
0
●●●●
●●
●● ●● ●
●●●
●●
●
● ● ●
●●● ●● ● ●
●●●● ●●● ●
●● ●●
●● ●● ●●● ●●● ●
●● ●● ●● ●●
●●● ●●
● ●● ●●
●●
●●●
●●●●
●● ●●● ●●●
● ●●● ●● ●● ●
● ●●
● ●
●●● ●
● ●●
● ●● ●●● ●●●●
● ● ●● ●● ●
●●●● ● ●●
●●● ●●●● ●● ● ●●
●●●●
●● ●●● ●● ●
●●●
● ●●●
●●
●
●● ●●
● ●●●● ●●● ●● ●●● ●●● ●
●●●
●●●
●● ●●
●●●
●●
0.0 0.4 0.8
●●●
●● ● ●●
●●●●
●●●
●●● ●
●●
●
●●● ●
●
●● ●
●
●● ● ●●
●
●●●
●●● ●●● ●
●
●●●● ●●
●●
●●●●
●●●
●●● ● ●●
●
●
●●
●
● ●● ●
●
●●
●●
●●
●●
●●
●●
●●●
●
●●●
●●
●●●
●
● ●●●
● ●●●●
●●●
●
●
●●
●●
●
●●●●
● ●●●●
●●
●●
● ●●
● ●●
●
●
●
●●
●●● ●●
● ●
●●
●
●
●● ●●
●
● ●●
● ●● ●
●●●
●
●●
●●
●
●●●
●●●
●●●● ●
●
●●
●●
●● ●●●
●● ●● ●
●
● ●● ●● ●●● ●● ●●● ●●
● ●● ● ● ●●●●● ●●● ●● ● ●
●● ● ●●●
●
●● ●●● ●●●●●●●● ●● ●●●●●● ●● ●●●
● ●●●●● ●● ●●● ●● ●●● ●● ●● ●●●● ● ●●●
●●●● ●●
●
● ●●● ●●
●
●●● ●
●● ●● ●●● ●● ●●●●● ●● ●● ●●
●
● ●● ●● ●● ●●● ● ●●● ●● ●●● ●● ●● ● ●●●●● ● ●●● ●● ●● ●●● ●●● ●● ●●●● ● ●●●●● ●●● ●●● ●
0.0 0.4 0.8
●● ●●●●
●●● ●●●
●● ●●
● ●●●● ●● ● ●●● ●● ●
●●●
● ●●
● ●●●● ●● ●
●●●●● ●
●
●●●●
●●●
●
●
●●● ●
●●
●● ●● ● ●● ●
●●● ●
●
●● ● ●●
●●●● ● ●●●
●●●
●●●
● ●● ●●●● ●● ●
●●●
●●
●●● ● ●●
●●●● ● ●●● ● ●● ● ● ●●●
●● ●
●
●●
●●
●● ●
●● ●●● ●●●● ● ●●
●● ●
●●●●
●● ●●●
●●●●
● ●●●●
●● ●● ●
●●
● ● ●● ●●
●●
●●●
●● ●
●●●●
●●
●●
●●
●
●●● ●●●
● ●●
●●● ●
●
●●●●
●● ●●● ●●
●●
●●● ●●
●●● ●●● ● ●
●●
●●● ●
●●
●● ●●●
●●●
●●
●
●●●●●
● ●●●
●●
●●
●● ● ●●● ●●
●
●
●●●
●● ●
●●●
●●
●●● ●●
●●●
●
●●●●●
● ● ●●
●● ●●● ●
●●
●
●● ●●●● ●●
●●●
●●● ●● ● ●●● ●●●
● ●●
● ●● ●● ●
●
●● ● ●● ●●●● ●●● ●
● ●●●●●● ●
● ●● ●●● ●● ●●
●●●
●●● ●●●● ●
●
●●●
●
● ●●● ●●● ●● ●
●●
●● ●
●
●●
●
●
●● ● ●●
●
●●●●●
●●
●● ●●●●●
● ●●●●
●
●●● ●
●
● ●●●
●
●● ●●
●● ●● ●
●●●
● ●
●
● ●● ●●
●
●●
●● ●●● ●● ●
●●●●● ●● ●
●●
● ●●●
●
● ●●●
●
●●
● ●
●
●●
●● ● ●●● ●●●●● ●●
●
●
●●
●●
●● ●●
●
● ●● ● ●●
●●
●●● ●● ●
●●
●
● ●
●
●
●●● ●
●
●
●●
●
● ●●●●●
●● ●●●● ●
● ●●●● ●
● ● ● ● ●● ●
●
● ●
●
●● ●●● ●● ●●● ●● ● ●●
●
● ●●●●● ●●
●
●
●
● ●
●●
● ●●●● ●● ●●● ●●●●●●
●
● ●●●● ●●●● ●● ●●● ● ●●
●
●● ●● ●●● ●● ●●●●
●
●● ●●●● ● ●●●
●●
●
● ●
●●
● ●●● ●●●●
●● ●●● ●● ●●● ●● ●●●●● ●● ●● ●●● ● ●●
●● ●● ●●●●
●●● ●
●
●
●
● ●
●
●● ● ●●●●● ●
●●● ●● ●● ●●● ●●● ●● ●●●●
●
●●●●● ●●
●
●●● ●
020
0
●●
●●●
●
●●●
●
●● ●●
●● ● ●
●●
● ●●
● ●●●
●● ●●
●●
●●
●● ●●
●● ●●●
●●
●●● ●
●
● ●●●
●●●●●● ●● ●
●●●● ●
●
● ●● ●●●
● ●●
●● ●
●●
●
●●●
● ●
●●●●
● ●●
●●
●●
●●●●
●● ●
●●
●
●
●
●●● ●
●
●●
●●●
●●●● ● ●● ● ●
●●
●●● ●
●
●● ●
●
●●
●●
● ●●● ●●●●
●●●
●● ●●
●●●
●● ●●
●
●●● ●
● ●●● ●● ● ●● ● ● ●●
● ●
●
●●
●●
●●●
●
●●
020
0
●●
●●
●●
●● ●●●
●●
●
●●
●
●● ●
●●
● ●●
● ●●●
●●●
●
● ●●
●●
●
●● ●●
●
●
●●
●● ●
●● ●
● ●●
●●●●●
●●
●●● ●
●
●●
●●●●
●●
●●● ●
●
● ●●●
●
●●● ●●
●
●
●●●
●● ●
●● ● ●●
●
●
●●●
●●
●
●
●
●●
●● ●
●
●
●●
● ●●● ●●●
●●●
●●●●
●●
● ●●●
●●●
●●
●●● ●●
●
●
●●●
●● ●● ●
●
●●
●●●
●
●●
●
●●● ●
●●●● ●●● ●
● ●● ●
●
●●
●●●
●●●
●
●● ●●●
● ● ●● ●●●● ●● ● ●●
●
●● ●
●
●●● ●●● ● ●
●
●● ● ●●● ●●
●
●●● ●●
●
●●●●●● ●●●●●● ●● ●● ● ●●●● ●● ●● ●● ●● ●● ●●● ●●● ●
●
●● ●
●
● ●● ●●
● ●● ●● ●●●● ●● ●●
●
● ●●●●
●
●●● ●●
●
● ●● ●●●● ● ●●● ●● ●●
●
● ●●● ●●● ●●● ●● ●● ●● ● ●●●●
● ●● ●● ●● ●
●
● ●● ●●●
● ●● ●
●●●
●●
●●●●●● ●● ●● ●● ● ●●● ●● ● ● ●
●
● ●●
●
●
●
●● ●
●
● ●
●
●
●
● ●● ● ●●
●
● ●
●
● ●● ●●
●
●
● ● ●●
●
● ●●●● ●● ●
●
● ●●●●●●●● ●● ●● ●●
●●
●● ●●● ● ●●
●
●● ●●
●●● ●● ●●● ●
●
●
● ●
●
●● ● ●●●● ●
●
● ●
●●
●
●●
●
●●
●
●●● ●●● ●● ●●● ●
●
●●●
●●
●● ●
●
●●
●●
●● ●● ●●
●
●
●
● ●●● ●
●
●●● ●
●
●● ● ●●●●● ● ●●●
●● ●● ●●● ●●● ●● ●●●●
●
●●
●
●●
●
●
●●●
●
●
●
●
●
●●
●
●●
● ●●
●●
●
●● ● ●
●●● ●●
●●
●●
●●
●●
●
●
●
●●●
●●●
●●
●● ●
●●
●● ●
●●
●●
●●●
●●
●
●
●● ●
●●●● ●●
●●●●
●●
●●
●● ●●
●●●●
●●●
●
●●
●●
●
●●
●●
●
●●
●
●●
●●
●
●
●●
●
●●●●
● ●●
●
●
●
●
●
●
●●●
●
●● ● ●●●
●● ●
●
●
●●
●
●
● ●●
●●
●
●●●
●●
● ●●●
●●●
●●● ●
● ●●
●
●●
●●
●●●● ●
●
● ●
●●
●
●●● ●
●
● ●●●●
●
● ●
● ●
0.0 0.4 0.8
●● ●●
●
●
●
●
●
●
●●●● ●●●
● ● ●
●
●
● ●● ● ●
●
●●● ●●● ●● ● ●● ●
●●● ●● ●
●●● ● ●
●●● ●●
●
●●●●
●
●● ●● ●●●
●
●●
●●
●● ● ●● ●●● ●●●
●●●
●
●
●
●● ●● ●
●
● ● ●
●
● ●●●
●
●
●
●
●●● ●●●●
●
● ● ● ●● ●
●
●●● ● ●● ●●● ●●
●
● ●●●
●●●●● ●
● ● ●
●
● ●● ●● ●●● ●● ●
●
●●
●● ● ●● ●●●● ●
●
● ●● ●●● ●●●●● ●
●●
●
●
●● ●
●
●●●●●●
●
●
●● ● ●●
●
●
●
●●
●
●
●●
● ●●
●●●●●●
●
●
● ●●●● ● ●●● ●
●
● ●●● ●
●●
●●●
●
●
● ●
●●
●
●
●
●●
●● ●
●●
●●
●
● ●● ●● ●● ●
●
●●
● ●
●
●
●●
●
●●●
●
●● ●
●
● ●● ●● ●
●
●●
●
●●
●
●
● ●●●
●
●
●
●
●
●●
●
● ●
●
●●
●● ●
●
●●
●
●●
●
●
● ●●● ●●
● ●●● ●●●●
●
●
●
●●●●
●
●
●
●● ●
●
●
●
●
●
● ●
●
●
● ●●
●
●●
●
●
●
●
●●●
●
●
●
● ●● ●
●
●●
●● ●● ●
0.0 0.4 0.8
● ●
●
●
●
●
●
●●
●
● ●●● ●
● ●
●●●
●
●●
●
● ● ●
●
● ●●
●●●
●
●
● ●
●
●
●
●
●
●
●
●
●●
●●
●●●
●●●●
●
●● ●●●
●
●
●
●
●
●
●
●
●
●
●●
●
●●
●
●●
● ●● ●●● ●
●●
● ●
●●
●●
●●●
●
●●
●
●
●
● ●
●
●
● ●●
●
●
●●
●
●
● ●●●●●
●
●
●
●
●
●
● ●● ●
●
●
●
● ●
●●
●●
●● ●
●
●●
●
●
● ●
●
●
●●
●
●
●●
●
●●
●
●
●
●
●
●
●
●● ●
●
●
●
●
●
●● ●● ●●●
●
●
●
●
●
●
●
●
●
● ●●
●●
020
0
Alignment of architectural components
Num
ber
of ta
sks
com
plet
ed
1020
50100
Given: amount of social interaction
0.6
0.7
0.8
0.9
Giv
en: s
tren
gth
of a
ffini
ty
Figure 4. Tasks completed over 1500 periods as a function of architecturalalignment, conditioned on the intensity of social interaction and the strengthof affinity. Organizations are assumed not to be able to align formal structureswith the environment.
Figure 4 shows the effect of alignment between formal and informal structures on these
environmental misfits. The patterns here have more variance, though the average effects are
similar: alignment between formal and informal structures is bad for performance. Again
though, as in the case where aligning formal structures with the environment is possible, here
when there is considerable social interaction and/or high affinity, some very good outcomes
can emerge. While in general the pattern is less clear in this case, these very good outcomes
are more likely to emerge when formal and informal structure are “mis-aligned” (more to the
left in any panel). At the same time as social interaction increases (in either dimension), poor
outcomes become poorer. Increasing social interaction again increases variance of performance.
Whether average performance increases with social interaction is unclear, however it does seem
clear both that poor performances gets poorer, and that good performances get better.
17As an alternative we tried sampling uniformly the interval p ∈ [0, 1] but the results were very similar to thosereported here.
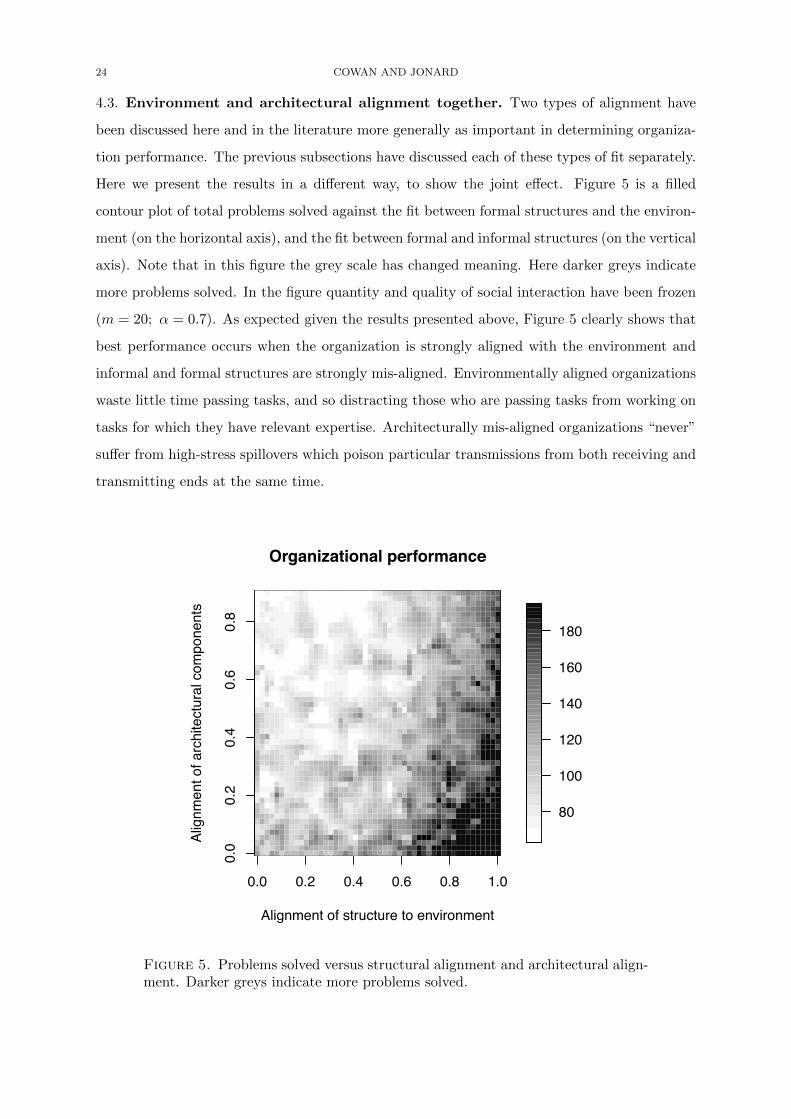
24 COWAN AND JONARD
4.3. Environment and architectural alignment together. Two types of alignment have
been discussed here and in the literature more generally as important in determining organiza-
tion performance. The previous subsections have discussed each of these types of fit separately.
Here we present the results in a different way, to show the joint effect. Figure 5 is a filled
contour plot of total problems solved against the fit between formal structures and the environ-
ment (on the horizontal axis), and the fit between formal and informal structures (on the vertical
axis). Note that in this figure the grey scale has changed meaning. Here darker greys indicate
more problems solved. In the figure quantity and quality of social interaction have been frozen
(m = 20; α = 0.7). As expected given the results presented above, Figure 5 clearly shows that
best performance occurs when the organization is strongly aligned with the environment and
informal and formal structures are strongly mis-aligned. Environmentally aligned organizations
waste little time passing tasks, and so distracting those who are passing tasks from working on
tasks for which they have relevant expertise. Architecturally mis-aligned organizations “never”
suffer from high-stress spillovers which poison particular transmissions from both receiving and
transmitting ends at the same time.
0.0 0.2 0.4 0.6 0.8 1.0
0.0
0.2
0.4
0.6
0.8
Organizational performance
Alignment of structure to environment
Alig
nmen
t of a
rchi
tect
ural
com
pone
nts
80
100
120
140
160
180
Figure 5. Problems solved versus structural alignment and architectural align-ment. Darker greys indicate more problems solved.

ORGANIZATIONS AND EMOTIONS 25
4.4. A comment. Important in the results of the model is the way two colleagues interact.
One can think of a perfectly separable system as one in which each operation is isolated from
every other operation. Or more relevant in this case, the productivity of one operation does not
affect the productivity of another. To a great extent this is true in our model: the probability of
i completing a sub-task is not affected by the productivity of j. (Recall that both productivities
are determined by the agents’ individual stress levels.) However, the act of task transmission is
not separable in that sense. The productivity of i in transmitting is affected by the productivity
of j in receiving. Productivities in general scale as z−2i , where zi is the stress level of the
agent. In a separable system, average productivity would be roughly the average of individual
productivity or 1/z2. This is true of task completion in our model. However it is not true of task
transmission/receipt. There the productivity scales with (zizj)−2. To illustrate, suppose low
stress is z = 1 and high stress z = 2. Consider a case where there are two potential transmissions:
i → j and k → l, and all agents are in low stress. The average transmission time, the inverse
of transmission probability, will be 1 period. Now suppose i becomes highly stressed, and that
spills over to one of his “friends”. If the informal network is iso-morphic to the formal network
he will diffuse high stress to j. Now the i→ j transmission has probability (1/2× 1/2)2 = 1/16
and the expected transmission time is 16 periods. The expected k → l transmission times
remains at 1, for an average transmission time of 8.5 periods. But now suppose i diffuses his
high stress to k instead. Here the i→ j transmission probability is (1/2×1)2 = 1/4 so expected
transmission time is 4 periods. Similarly for the k → l transmission, so average transmission
time is only 4 periods. This is higher than the case when all were in low stress, but lower
than the case when i diffuses to j. If this interaction between sender and receiver were absent,
then no matter who i diffuses his stress to, the average transmission productivity will be the
same.18 What this points to is the importance of the nature of the interaction between the
two networks. In our case, there is a very direct connection through which productivity effects
are felt through the informal network and those effects are multiplicative. In a more general
setting, one could imagine that whole groups of agents who work together but also socialize
together can talk themselves into very low, or very high, productivity for the group as a whole.
If working and socializing as a group, has not only individual but also group-level effects, then
an informal network that is iso-morphic to the formal network can be very dangerous for the
organization’s overall productivity. If group-level effects are absent, the risk is much reduced.
18If for example the productivity of transmission were (1/z2i + 1/z2j )/2 then the average productivity of the two
transmissions after i diffuses his high stress would be (1/22 + 12 + 1/22 + 12)/2 no matter to whom he diffuses it.
26 COWAN AND JONARD
5. Discussion and conclusion
The model presented above captures several important aspects of organizational “alignment”.
The literature has stressed the importance of alignment between formal organizational structures
and environment, and between formal and informal structures within the organization. It is
relatively rare, though, to see them addressed together, and that is what we have done here. In
contrast to much of the literature on informal aspects of organizations, in our model informal
interactions serve to transmit psycho-social affect, and in the transmission either increasing or
diminishing it. We have focussed on stress as the main variable, but the mechanisms could as
easily apply to any sort of affective state that has an effect on individual performance. One
reason to focus on stress is that its social dynamics have been well-studied, and the mechanisms
of transmission relatively well-understood.
On the issue of alignment between formal structures and the environment, our model mimics
standard results in the literature. Aligning the organization with the environment improves
performance. “Alignment”, here refers to whether or not organizational structures reflect the
work-flow structures imposed on it by the nature of the tasks it will receive. Here we should
observe that in one sense the organization is very passive. It cannot control the nature of the
task flow, selecting and rejecting tasks depending on whether or not they fit the organization.
We have assumed that the nature of the firm’s business determines the type of environment in
which it operates, and that it cannot affect it. Certainly in reality firms do attempt to change
their environments, by for example specializing (or diversifying) in specific areas which are
perhaps easier to predict, and certainly there is a relationship between organizational structure
and a firm’s ability to make such adaptations. That, however, is outside the realm of our
study here. We have assumed that to be in business, the firm must process whatever tasks
the environment delivers. And when that is the case, not surprisingly, alignment is good for
performance.
More interesting is the relationship between formal and informal structures, and presenting a
formal model that treats them as interacting networks is one of the contributions of the paper.
Soda and Zaheer (2012), using a similar approach, find that increasing iso-morphism between
formal and informal structures improves performance. This contrasts with our model which
finds that mis-alignment is typically good and sometimes great, for organization performance.
The difference lies in what is being transmitted across the links in the informal network. For
Soda and Zaheer the informal network transmits advice and information (p. 756). By contrast,
our informal network transmits affect. It seems quite reasonable that informally transmitting
information and advice about our tasks to close colleagues (with whom we might even explicitly
ORGANIZATIONS AND EMOTIONS 27
collaborate) will make us more efficient. On the other hand, transmitting a high stress state
to a collaborator will reduce his or her efficiency, and possibly, when we need to do something
jointly, may have an joint effect on the two of us that is bigger than the sum of the parts. This
is what drives the results in our model — diffusing high stress to collaborators (in the task
transmission process) makes it difficult to make a transmission from one colleague to the next.
In a different context, Gulati and Puranam (2009) also find that mis-alignment is good
for performance. Their study focuses on the mis-alignment that occurs following a firm’s re-
organization. A major re-organization will have the effect of divorcing the informal network
(assuming that before the re-organization it had developed some iso-morphism with the formal
network) from the formal network. Gulati and Puranam argue is that this mis-alignment can
have the effect of permitting the firm to pursue two apparently conflicting goals, one being ex-
plicitly arranged through the formal network, the other happening more spontaneously through
the informal network. This mechanism is very different from that present in our model.19 For
us the mis-alignment prevents the spread of low productivity in a way that amplifies its effects.
In our organization there is no issue of multiple goals. Thus what we observe here is a second
and probably orthogonal mechanism by which (mis-)alignment can affect performance.
Our results are based on a particular assumption regarding the relationship between stress
and productivity, namely that increases in an individual’s stress reduces his productivity. One
must interpret that with some caution, on account of what is know as the Yerkes-Dodson law.
This empirical generalization states that there is an inverted-U relationship between stimulus
(which can be interpreted as stress) and performance. It could be possible that in some cases,
workers are on the left side of this relationship, and so a little increase in stress, induced in the
model through social interactions, would be good for performance. This is not included in the
model since it seems unlikely that it would apply to many organizations. It is something that
could usefully be explored further however.
A second issue that could be further explored is the cost of social interactions. In the model,
there is no cost — social interaction does not take time away from work. Some interaction does,
and some does not reduce the time agents have available to address their tasks. Introducing this
into the model could change the dynamics, and the effects of social interaction on productivity. It
would also permit a further more detailed exploration of the optimal amount of social interaction
for given organizational structures under different environmental stress conditions.
19They too present a formal mathematical model, and but their goal is to “...ask under what conditions aninconsistent organizational architecture can exist stably.” (p.430). One of their propositions addresses theinefficiencies associated with inconsistent architectures, but this is not the main focus of their formalism. Weshould also point out that while Gulati and Puranam define fit in a positive sense (a firm has a fit if it performeswell), they explicitly discuss “consistency” between the formal and the informal, which is very akin to our use of“iso-morphism”.

28 COWAN AND JONARD
The model has focussed on the value of social interaction. Psychology has found that social
interaction, through buffering effects, is in general good for keeping stress down. This result
materializes in our model, but it is contingent upon quality and quantity of social interaction.
When quality and quantity are relatively low, the model yields clear-cut predictions about the
effect and value of social interaction. But the situation is less predictable as quantity and
quality are both high. All else equal, tiny random shocks taking the form of different sequences
of task arrival (all drawn for the same distribution) translate into big differences in terms of
organizational performance. Two otherwise identical organizations can end up in very different
stress states and therefore display persistent differences in behavior and performance. This
brings us back to two practical implications of the model. Different organizations have different
attitudes towards internal relations among employees. Some encourage employees to compete
with each other, some actively encourage employees to collaborate and support each other. This
is captured in our model with the parameter we call “affinity”. As we have seen, affinity can
have an important effect, and by increasing the extent to which its employees respond to each
other’s psycho-social states (or affect) can have effects on performance. In the context of our
model, in general more affinity seems better, but this increased performance would come with
a risk, namely that the variation in performance also increases. In the right context (employees
are generally relaxed and not too susceptible to stress) higher amounts of affinity will be very
good for quickly dispersing whatever incidents of high stress might occur. On the other hand, if
employees general stress levels are higher, or they are more susceptible, then higher affinity will
have the opposite effect — magnifying instances of higher stress, and decreasing performance.
Thus manipulation of affinity within the organization must be done carefully. Finally, there
are often discussions about organizations “cutting fat”. Cutting fat has been a common way of
stream-lining organizations to increase productivity. Fat, in an organization, is often thought to
be present when employees spend less than their entire working day engaged in task-completion
or problem-solving. Social interactions in the workplace are often seen as evidence of the kind
of fat that can be safely cut. What the model here argues is that such a line can be quite wrong.
It is well-established both that social interactions can affect group and individual stress levels,
and that stress levels affect productivity. Thus cutting fat to the point of eliminating social
interactions can have unexpected effects on overall production efficiency of the organization.

ORGANIZATIONS AND EMOTIONS 29
References
[1] Anderson, C. and C.E. Brown (2012) “The functions and dysfunctions of hierarchy” Research in Organiza-
tional Behavior, 30: 55-89.
[2] Baldwin, C. Y., K. B. Clark (2000) Design Rules: The Power of Modularity. MIT Press, Cambridge, MA.
[3] Benazon, N.R. and J.C. Coyne (2000) “Living with a depressed spouse” Journal of Family Psychology, 14:
71-79.
[4] Blau, P.M. (1968) “The hierarchy of authority in organizations” American journal of Sociology, 73: 453-467.
[5] Bolger, N., DeLongis, A., Kessler, R. and E. Wethington (1989) “The contagion of stress across multiple
roles” Journal of Marriage and the Family, 51: 175-183.
[6] Burns, T. and G.M. Stalker (1961) The management of innovation. London: Tavistock.
[7] Burton, R.M. and Obel, B. (1995) “The validity of computational models in organization science: from
model realism to purpose of the model”, Computational and Mathematical Organization Theory, 1: 57-71.
[8] Casciaro, T. and M.S. Lobo (2008) “When Competence Is Irrelevant: The Role of Interpersonal Affect in
Task-Related Ties”, Administrative Science Quartely, 53: 655-684.
[9] Cohen, S. and T.A. Wills (1985) “Stress, social support, and the buffering hypothesis” Psychological Bulletin,
98: 310-357.
[10] Conlisk, John (1996) “Why Bounded Rationality?” Journal of Economic Literature, 34: 669-700.
[11] Cowan, R., Sanditov, B. and R. Weehuizen (2011) “Productivity effects of innovation, stress and social
relations” Journal of Economic Behavior and Organization, 79: 165-182.
[12] Cox, T. (1978) Stress. London: Macmillan Press.
[13] Ethiraj, S.K., D. Levinthal, and R.R. Roy (2008) “The Dual Role of Modularity: Innovation and Imitation”
Management Science, 54(5): 939?955.
[14] Florian, V., Mikulincer, M. and G. Hirschberger (2002) “The anxiety-buffering function of close relationships:
Evidence that relationship commitment acts as a terror management mechanism” Journal of Personality
and Social Psychology, 82: 527-542.
[15] Galbraith, J.R. (1973) Designing Complex Organizations. Addison-Wesley, Reading, MA.
[16] Garricano, L. (2000) “Hierarchies and the Organization of Knowledge in Production” Journal of Political
Economy, 108, 874-904.
[17] Gibbons, D.E. (2004) “Friendship and Advice Networks in the Context of Changing Professional Values”
Administrative Science Quarterly, 49: 238-262.
[18] Gilboa, S., Shirom, A., Fried, Y. and C. Cooper (2008) “A meta-analysis of work demand stressors and job
performance: examining main and moderating effects” Personnel Psychology, 61: 227-271.
[19] Ginn, J. and J. Sandell (1997) “Balancing home and employment: stress reported by social services staff”
Work, Employment and Society, 11: 413-34
[20] Glowinkowski, S.P. and C.L. Cooper (1985) “Current issues in organizational stress research” Bulletin of
The British Psychological Society, 38: 212-16.
[21] Gulati, R. and P. Puranam (2009) “Renewal Through Reorganization: The Value of Inconsistencies Between
Formal and Informal Organization” Organization Science, 20: 422-440
[22] Gump, B.B and J.A. Kuliks (1997) “Stress, affiliation and emotional contagion.” Journal of Personality and
Social Psychology, 72: 305-319.

30 COWAN AND JONARD
[23] Hatfield, E., Cacioppo, J. and R. Rapson (1994) Emotional contagion. New York: Cambridge University
Press.
[24] Hausser, J., Mojzisch, A., Niesel, M. and S. Schulz-Hardt (2010) “Ten years on: a review of recent research
on the job demand-control(-support) model and psychological well-being” Work & Stress, 24: 1-35.
[25] Hobfoll, S.E. (1989) “Conservation of resources: A new attempt at conceptualizing stress” American Psy-
chologist, 44: 513-524.
[26] Ibarra, H. (1992) “Homophily and Differential Returns: sex differences in network structure and access in
an advertising firm”, Administrative Science Quarterly, 37, 422-447.
[27] Ibarra, H. and S.B. Andrews (1993) “Power, Social Influence, and Sense Making: Effects of Network Cen-
trality and Proximity on Employee Perceptions”, Administrative Science Quarterly, 38̇: 277-303.
[28] Ivancevich, J.M. and J.H. Donnelly (1975), “Relation of Organizational Structure to Job Satisfaction,
Anxiety-Stress, and Performance” Administrative Science Quarterly, 20: 272-280.
[29] Jablin, F.M., L.L. Putnam, K.H. Roberts, and L.W. Porter, eds. (1986) Handbook of Organizational Com-
munication: An Interdisciplinary Perspective. Sage, Beverly Hills, CA.
[30] Kahneman, D. (1973) Attention and effort. Englewood Cliffs, NJ: Prentice-Hall.
[31] Karasek, R. (1979) “Job demands, job decision latitude and mental strain: Implications for job redesign”
Administrative Science Quarterly, 24: 285-306.
[32] Karasek, R.A. and T. Theorell (1990) Healthy Work: Stress, Productivity, and the Reconstruction of Working
Life. New York: Basic Books.
[33] Krackhardt, D. (1990) “Assessing the Political Landscape: Structure, Cognition, and Power in Organiza-
tions” Administrative Science Quarterly, 35: 342-369.
[34] Krackhardt, D. and J.R. Hanson (1993) “Informal Networks: The Company Behind the Chart”, Harvard
Business Review, 71: 104-111.
[35] Krackhardt, D. and R. Stern (1988) “Informal Networks and Organizational Crises: An Experimental Sim-
ulation” Social Psychology Quarterly, 51: 123-140.
[36] Krackhardt, D. (1994) “Graph Theoretical Dimensions of Informal Organizations” in Carley, K. and M.
Prietula (eds.), Computational Organizational Theory, Hillsdale, NJ: Lawrence Erlbaum Associaties, Inc,
89-111.
[37] Lawrence, P.R. and J.W. Lorsch (1967) Organization and Environment. Harvard Business School Press,
Boston, MA.
[38] LePine, J., Podsakoff, N. and M. LePine (2005) “A meta-analytic test of the challenge stressor-hindrance
stressor framework: an explanation for inconsistent relationships among stressors and performance” Academy
of Management Journal, 48:764-775.
[39] Lepore, S.J. (1992) “Social conflict, social support, and psychological distress: Evidence of cross-domain
buffering effects” Journal of Personality and Social Psychology, 63: 857-867.
[40] Levitt, R.E., Thomsen, J., Christiansen, T.R., Kunz, J.C., Jin, Y. and C. Nass (1999) “Simulating Project
Work Processes and Organizations: Toward a Micro-Contingency Theory of Organizational Design” Man-
agement Science, 45:1479-1495.
[41] Mackenzie, K.D. (1978) Organizational Structures. AHM Publishing Corporation, Arlington Heights, IL.
[42] March, J.G. and H.A. Simon (1958) Organizations. Wiley, New York.

ORGANIZATIONS AND EMOTIONS 31
[43] McEwen, B.S. and R.M. Sapolsky (1995) “Stress and cognitive function” Current Opinions in Neurobiology,
5: 205-216.
[44] McEvily, B., Soda, G. and M. Tortoriello (2014) “More Formally: Rediscovering the Missing Link between
Formal Organization and Informal Social Structure”, The Academy of Management Annals, 8: 299-345.
[45] Meltzer, L. and J. Salter (1962) “Organizational structure and the performance and satisfaction of physiol-
ogists” American Sociological Review, 27: 351-362.
[46] Mintzberg, H. (1980) “Structure in 5’s: A Synthesis of the Research on Organization Design” Management
Science, 26: 322-341.
[47] Morrison, E.W. (2002) “Newcomers’ relationships: the role of social network ties during socialization”,
Academy of Management Journal, 45, 1149-1160.
[48] Nadler, D. and M. Tushman (1980) “A Model for Diagnosing Organizational Behavior: Applying a Congru-
ency Perspective”, Organizational Dynamics, 9: 35-51.
[49] Nadler, D. and M. Tushman (1999) “The Organization of the Future: Strategic Imperatives and Core
Competencies for the 21st Century”, Organizational Dynamics, 28: 45-60.
[50] Nadler, D., Tushman, M. and M. Nadler (1997) Competing by Design: the Power of Organizational Archi-
tecture, Oxford University Press: Oxford, UK.
[51] Prelec, D., and R.J. Herrnstein (1991) “Preferences and Principles, Alternative Guidelines for Choice” in
Strategic Reflections on Human Behavior (R. Zeckhauser, ed.), Cambridge, Mass.: MIT Press.
[52] Procidano. M.E. and W.W. Smith (1997) “Assessing perceived social support: The importance of context.”
in G.R. Pierce, I.G. Sarason, N. Sarason, and B. Lakey (eds.) Sourcebook of theory and research on social
support and personality. New York: Plenum.
[53] Repetti, R.L. and J. Wood (1997) “Effects of daily stress at work on mothers’ interactions with preschoolers”
Journal of Family Psychology, 11: 90-108.
[54] Repetti, R.L. (1989) “Effects of daily workload on subsequent behavior during marital interactions: The
roles of social withdrawal and spouse support” Journal of Personality and Social Psychology, 57: 651-659.
[55] Roberts, K. (1990) “Some Characteristics of One Type of High Reliability Organizations” Organization
Science, 1: 160-176.
[56] Sapolsky, R.M. (2004) Why Zebras Don’t Get Ulcers. Saint Martin’s Press Inc.
[57] Seyle, H. (1956) The stress of life. New York: McGraw-Hill.
[58] Shah, P. (2000) “Network Destruction: The Structural Implications of Downsizing” Academy of Management
Journal, 43: 101-112.
[59] Silverstein, M., X. Chen and K. Heller. (1996) “Too Much Of a Good Thing? Intergenerational Social
Support and the Psychological Well-Being of Aging Parents” Journal of Marriage and the Family, 58: 970-
982.
[60] Siggelkow, N. and J.W. Rivkin (2003) “Balancing Search and Stability: Interdependencies Among Elements
of Organizational Design”, Management Science, 49: 290-311.
[61] Simon, H.A. (1982) Models of bounded rationality (Vols. 1 & 2). Cambridge, MA: The MIT Press.
[62] Soda, G. and A. Zaheer (2012) “A network perspective on organizational architecture: performance effects
of the interplay of formal and informal organization” Strategic Management Journal, 33: 751-771.
32 COWAN AND JONARD
[63] Stephens, M.A.P., Franks, M.M. and A.A. Atienza (1997) “Where two roles intersect: Spillover between
parent care and employment” Psychology and Aging, 12: 30-37.
[64] Thompson, J. D. (1967) Organizations in Action. McGraw-Hill, New York.
[65] Tushman, M. and D. Nadler (1978) “Information Processing as an Integrating Concept in Organizational
Design”, Academy Management Review, 3: 613-624.
[66] Van der Doef, M. and S. Maes (1999) “The job demand-control(-support) model and psychological well-being:
a review of 20 years of empirical research” Work & Stress, 13: 87-114.
[67] Van De Ven, A.H. , Delbecq, A.L. and R. Koenig, Jr. (1976) “Determinants of Coordination Modes within
Organizations”, American Sociological Review, 41:322-338.
[68] Westman, M. and D. Etzion (1995) “Crossover of stress, strain and resources from one spouse to another”
Journal of Organizational Behavior, 16: 169-181.
[69] Westman, M. (2001) “Stress and strain crossover” Human Relations, 54: 557-591.
[70] Woodward, J. (1965) Industrial Organization: Theory and Practice. Oxford University Press, London, UK.
[71] Worthy, J.C. (1950) “Organizational structure and employee morale” American Sociological Review, 15:
169-179.