organization report number(s) s. monitoring organization report numbers) onr technical report no. 12...
TRANSCRIPT

Uncl ass if ledSECURITY CLASSiFICATIK.N OF r4wi5 'PAE
REPORT DOCUMENTATION PAGElb RESTRICTIVE MARKCINGS -
NoneA D-A21if 245 3. DISTRIBUTION /AVAILABILITY OF REPORT
W _____ILE__ Approved for public release aiTd sale.ILE Distribution unlimited.
4. PERFORMING ORGANIZATION REPORT NUMBER(S) S. MONITORING ORGANIZATION REPORT NUMBERS)
ONR Technical Report No. 12 ______________________
6a. NAME OF PERFORMING ORGANIZATION 6b. OFFICE SYMBOL 7a. NAME OF MONITORING ORGANIZATION
University of Utah (if applicable)
6C. ADDRESS (City, State, and ZIP Code) 7b ADDRESS (City, State. anld ZIP Code)
Department of ChemistryHenry Eyring BuildingSalt Lake City,. UT 84112
8.. NAME OF FUNDING /SPONSORING B.OFFICE SYMBOL 9. PROCUREMENT IN~STRUMENT IDENTIFICATION &MEORGANIZATION (if applicable)Office of Naval Research ________ N00014-89-.3-1412
8c. ADDRESS (City, State, and ZIP Code) 10. SOURCE OF FUNDING NUMBERS
Chemistry Program, Code 1113 PROGRAM -ROJECT TASK WORK UNIT800 N. Quincy Street ELEMENT NO. VO. NO. CCESSION NO
Arlinoton. VA 2221711. TITLE (include Security Classification)
Multiple Internal Reflection Fourier Transform Infrared Spectroscopy Studies ofThiocyanate Adsorption on Silver and Gold
12, PERSONAL AUTHOR(S) 0 . B. Parry, J. N. Harris and K Ashley
13a. TYPE OF REPORT 13b. TIPEVRD 14. SAIE I~ RE 1~ Mth Da .SAE COUNTTechnical FROM To 7/89.
16. SUPPLEMENTARY NOTATION
17 COSATI CODES 18. SUBjECT TERMS (Continue on reverse if necessary and identify by blazk number)FIELD IGROUP SUB-GROUP I Infrared spectroscopy of liquid/solid interfaces,
ABSTACT'ionic adsorption in the double-layer region.
19 ABTAT(Continue on reverse of necessary and identify by block number)
Attached.
DTICfS ELECTE D5WJUL 17 1989W
20 D)ISTRIBUTION/AVAILAIILiTY OF ABSTRACT 21 ABSTRACT SECURITY CiASSIFtCATION -
E)UNCLASSIFIED/UNLIMITED 0 SAME AS RPT OTIC USERS Unclassified22a NAME OF RESPONSIBLE NDIVIDUAL 22b TELEPHONE (Include Area Code) 22c. OFFiCE SYMBOL
Dr. Robert J. Nowak 1(202) 696-4410DO FORM 1473.84 MAR 83 APR ea,tion may be used until exhiausted SECURITY CLASSIFICATIOtJ Of 1T~' PAGE
All other editions are obsolete. Uncl ass ifi ed

e
OFFICE OF NAVAL RESEARCH
Grant No: N00014-89-J-1412
R&T Code 413a005---03
Technical Report No. 12
Multiple Internal Reflection Fourier Transform Infrared Spectroscopy Studies ofThiocyanate Adsorption on Silver and Gold
Prepared for publication in Lanamuir
by
D. B. Parry, J. M. Harris, and K. Ashley
Department of ChemistryUniversity of Utah
Salt Lake City, UT 84112
July 1, 1989
Reproduction in whole, or in part, is permitted forany purpose of the United States Government
* This document has been approved for public release and sale;
its distribution is unlimited.
MULTIPLE INTERNAL REFLECTION FOURIER TRANSFORM INFRARED SPECTROSCOPYSTUDIES OF THIOCYANATE ADSORPTION ON SILVER AND GOLD
Diane B. Parry and Joel M. Harris*Department of Chemistry
University of Utah
Salt Lake City, UT 84112
and
Kevin Ashley*Department of ChemistrySan Jose State University
San Jose, CA 95192
Accession For
TIS GRA &IDTIC TAB 53Untumourced 0
/ Justilicaton
\ 'P~c2ro) By
0) Distribution/
Availability Codes
Avail and/orDiet Speoial
ABSTRACT
"Conducting silver and gold coatings on silicon Attenuated Total Reflectance
(ATR) plates have been employed as transparent electrodes to monitor in situ
surface electrochemistry. The multiple internal reflection Fourier transform
infrared spectroscopy (MIRFTIRS) technique, used previously to study redox
reactions on platinum and iron films, is applied in this work to the study of
adsorption processes in the double-layer region, in particular, the adsorption of
thiocyanate on silver and gold. The MIRFTIRS spectra were found to be
essentially free of solution band interference and are compared to surface IR
spectra of the same system obtained by other methods. Spectra of thiocyanate
adsorbed on gold and silver surfaces have been recorded as a function of applied
potential and thiocyanate concentration. Evidence of thiocyanate species
absorbed to gold via both nitrogen and sulfur atoms has been obtained, while only
S-bound thiocyanate was clearly observed on silver.
2

INTRODUCTION
The spectroelectrochemical technique, Multiple Internal Reflection Fourier
Transform Infrared Spectroscopy (MIRFTIRS), has previously been employed in redox
studies involving iron and platinum films (1-3). The sensitivity and surface
selectivity of MIRFTIRS, however, suggest that it has much broader applications,
both in terms of the chemical systems which can be studied and the combinations
of metal films and ATR substrates available. The method is applied here to study
adsorption of thiocyanate on silver and gold films within limits of applied
potential where no Faradaic processes occur.
One of the major advantages of internal reflection methods is the ability to
control the depth of penetration of the evanescent wave past the surface which
makes it possible to avoid intense interference from solution bands. The
combination of the multiple reflection technique with FTIR improves signal/noise
and the speed at which data can be collected. In addition to the surface
specificity, signal/noise improvement, and speed advantages of MIRFTIRS,
electrodes of a variety of different metals are easily prepared by vapor-
depositing or sputter-coating thin films on cleaned silicon (or other suitable
material) ATR plates.
Another major advantage of the MIRFTIRS spectroelectrochemical technique is
the geometry of the electrochemical cell. The cell configuration favors a
uniform potential distribution across the face of the working electrode (the thin
metal film). An uneven potential distribution may exist across the electrode
surface in an external reflection geometry due to the finite IR drop through the
thin solution layer trapped between the electrode surface and the cell window.
The use of ATR methods with thin metal film electrodes is a well established
approach to spectroelectrochemical studies. The electrochemical method most
3

often explored and most closely related to MIRFTIRS, which demonstrates surface-
specificity in the infrared, is the single-reflectance Kretschmann configuration
ATR method. The Kretschmann configuration has been used to probe thiocyanate
adsorption on silver and gold films (4,5). The advantages of MIRFTIRS over the
Kretschmann configuration are that the increased number of internal reflections
improves signal/noise. Multiple reflections also insure that data are generated
from a representative sample of the electrode surface, which prevents misleading
spectra from chemistry occurring at one specific site on an electrode surface
(6).
Although optically transparent metal films on multiple internal reflection
ATR plates have seldom been used in spectroelectrochemical experiments, many
multiple-reflection ATR electrochemical studies have been performed without the
use of metal films. These investigations have been limited to semiconducting
electrodes. Several types of the commercially available ATR plate materials have
been studied. For example, ZnO crystals (7), tin oxide (an n-type semiconductor)
coatings on glass (8), silicon (9-12), and germanium (13) were all used in ATR
electrochemical experiments after the pioneering work on germanium by Mark and
Pons in 1966 (14). A recent and more detailed review of semiconductor-
electrolyte interface studies is available (15).
Since the benefits of multiple-internal reflection are well known in
semiconductor electrochemistry, the development of MIRFTIRS with fully
conducting, optically transparent metal films seems a reasonable solution to some
of the specificity and sensitivity problems encountered in surface adsorption
spectroelectrochemistry. The choice of thiocyanate as an example system for
study was based on the window of spectral transparency of silicon in the
infrared, and on the availability of data from previous studies performed on
4

thiocyanate for comparison with data collected in this work. The silicon ATR
substrate is optically transparent to infrared radiation at frequencies only
above -1600 cm-1; low wavenumber information is unavailable using a silicon ATR
plate. Detection of thiocyanate C=N stretching mode (occurring between 2000-
2200 cm- 1 ) is compatible with the infrared window of silicon. The hardness of
silicon, however, makes it an ideal substrate for control of thin metal film
deposition. Softer ATR substrate materials were found to require vapor-
deposition of thicker metal layers in order to yield films which are conductive.
Thinner metal films have the advantage of allowing greater infrared intensity to
interrogate the metal/solution interface than thicker metal layers.
The second reason for studying thiocyanate adsorption is the large body of
information on the adsorption of this ion on a variety of metals as discussed in
a recent review (16), and in publications dealing specifically with thiocyanate
adsorption on silver and gold (4,5,17-19). While a great deal of data exists for
thiocyanate adsorption, discrepancies exist in the interpretation of the results
from different methods used to study the same system. The spectroelectrochemical
methods which have been used to probe this system include subtractively
normalized interfacial Fourier transform infrared spectroscopy (SNIFTIRS) (18a),
surface-enhanced Raman spectroscopy (SERS) (17,18a), Fourier transform infrared
reflection absorption spectroscopy (FT-IRRAS) (19), and the Kretchmann ATR prism
configuration method (4). Choosing a system studied by other
spectroelectrochemical methods prior to this work allows direct comparisons
between MIRFTIRS and other spectroelectrochemical methods.
5

EXPERIMENTAL
Materials. Sodium thiocyanate was used as received from EM Science. Sodium
perchlorate, hydrated, was used as received from the G. Frederick Smith Chemical
Company. Chemicals used in cleaning the silicon substrate include 30% hydrogen
peroxide from Malinckrodt, and hydrofluoric acid, ammonium hydroxide, nitric
acid, and hydrochloric acid, (reagent grade) from J.T. Baker. These materials
were used as received. Water for these experiments was from a NANOpure II water
purification system from Barnstead.
The polycrystalline silicon substrates, part number EE3131, were obtained
from Harrick Scientific Corporation. Each substrate was a 50x20x3 mm, 450,
single pass parallelepiped plate.
Substrate modification. Prior to vapor-depositing thin silver or gold films
on the silicon substrate, previously deposited metal films were removed by
several minutes of soaking in an Aqua Regia bath. The teflon components of the
spectroelectrochemical cell were also rinsed with Aqua Regia. The silicon
substrate was cleaned by procedures that have been described elsewhere (20).
Although no oxide layer was intentionally grown on the silicon ATR plate, a
silicon oxide layer (~10A as determined by ellipsometry) has been shown (21) to
grow under ambient conditions on clean silicon substrates. To remove this oxide
layer, the crystal was placed in a solution of 1:50 HF:H 20, so that any oxide
layer present was removed. This procedure was carried out immediately before
placing the ATR plate in the vacuum system.
An Edwards model E306A vacuum coating unit was used to vapor deposit thin
films of silver (99.99+ % wire) and gold (99.99+ % wire) onto the cleaned silicon
ATR plates. Films were deposited immediately before each experiment, and each
film was used only once. The thickness of the silver and gold layers deposited
6

were measured by an Edwards model FTM5 thickness monitor. Both metals were
deposited at a rate of -4 nm/sec under a vacuum of 5 x 10⁻⁵ torr. For silver
film experiments, the thickness of the silver layer was 205 + 2 nm, and for gold
the thickness deposited was 225 + 3 nm.
ATR-FTIR. The FTIR system used was a Bio-Rad, Digilab division, FTS-40
equipped with a 3240 SPC data system. Spectra were obtained at a resolution of 4
cm-1 . A variable angle ATR attachment designed to fit the FTIR was a model 301
from Spectra-Tech. The spectroelectrochemical cell used is illustrated in
Figure 1. In addition to the metal-coated ATR substrate serving as the working
electrode, the cell contained a platinum counter electrode, and a saturated
calomel reference electrode (SCE).
MIRFTIR Measurements. The ATR spectroelectrochemical cell containing the
metal-film coated crystal was placed and aligned in the dry air purged sample
compartment of the spectroohotometer. The cell was filled with a freshly
prepared NaSCN/NaClO 4.H20 solution (the perchlorate concentration was 0.15 M in
all experiments, and the NaSCN concentration was varied between 1, 10 and 25 mM,
as labeled on the spectra). Once introduced into the cell, the electrolyte
solutions were degassed with pure nitrogen before each experiment. The
electrochemical potential was controlled by an IBM Instruments model EC225 1 a
Voltammetric Analyzer. A silver wire was clamped to an edge of the ATR plate in
such a way that the wire contacted the metal film surface. The completeness of
this connection was tested with a continuity tester. No epoxy, glue, or solder
was necessary. The background spectrum was collected at zero potential versus
the SCE reference. All potentials reoorted here are versus the SCE reference.
For each potential, 256 interferograms were collected and averaged.
7

RESULTS AND DISCUSSION
The MIRFTIRS Technique
The MIRFTIRS technique appears to provide several important attributes for
spectroelectrochemical studies: 1) its surface selectivity limits the solution
band interference, 2) the multiple reflections effectively increase the signal-
to-noise ratio, and 3) an even potential distribution is achieved across the face
of the electrode. This section will provide a discussion of the data in terms of
these benefits, while comparing MIRFTIRS with techniques previously employed.
Figures 2 through 7 show the infrared difference spectra of SCN- adsorbed
from electrolyte solutions of varying concentrations (as labeled on the figures)
on both silver and gold electrodes; the reference spectrum used to generate the
difference spectra was collected under identical conditions at zero volts versus
SCE. On both metals, the signal to noise is very good for 25 and 10 mM NaSCN
solutions and peaks can be seen on the spectra from films of both metals at the 1
mM concentration level. The signal/noise ratio of the MIRFTIRS system appears to
be improved over the data obtained by the Kretschmann prism configuration for the
same NaSCN solution concentration on gold (5) and on silver (4). Unfortunately,
these references (4,5) do not state the number of spectra collected using the
Kretschmann method. The Kretschmann configuration generates data with superior
signal/noise over the Fourier transform IRRAS technique in thiocyanate on silver
electrodes (4).
Solution phase species can interfere with the collection of
spectroelectrochemical data of surface adsorbed species. Thiocyanate ion in
aqueous solution has a band at about 2065 cm-1 (18, 19, 22) which is generally
not seen using MIRFTIRS. To test the position of the solution band in the ATR
arrangement, a cleaned silicon substrate which had not been coated with a thin
8

metal film waE placed in the electrochemical cell. The cell was filled with 10mM
NaSCN i- 0.15 M NaC104. A background collected from the empty cell was
subtracted from a spectrum of the NaSCN-containing cell. The solution peak was
found to appear at 2065 cm-1 , with a weak intensity of 4 X 10- 4 absorbance units.
For the geometry of these MIRFTIRS experiments, a calculation of the depth of
penetration, dp, the distance into the solution at which the evanescent wave
intensity drops by a factor of e- 2 (23), indicates that between 2000 and
2500 cm-1 , dp is in the range 0.31-0.38 pm. The interface was modeled as a
silicon/water boundary in these calculations, since the thickness of the silver
or gold films are only about 4% of the wavelength of light, and NaC1O 4 and NaSCN
are present at low concentrations. The refractive indices of silicon (24) and
water (25) were found in the literature. The very small depth of penetration of
the evanescent wave into the solution explains the weak intensity of the solution
band detected in this experiment.
Some evidence of solution interference may be seen in the -0.5 volt
potential spectrum of 25 mM thiocyanate on gold (see Figure 8a) and possibly in
spectra collected at the same potential on silver (Figure 8b), out the presence
of the solution band does not interfere with the interpretation of the adsorbed
species. The peak assigned as a solution band in Figure 8a (SCN- on Au) occurs
at -2070 cm- 1 , and in Figure 8b (SCN- on Ag) the peak nearest the solution band
frequency occurs at -2087 cm- 1 . The 2087 cm- 1 peak in the silver experiments is
to high in frequency to be assigned to the solution species, and will be
discussed further below. The presence of adsorbed species throughout the double
layer region studied here is indicated by differential capacitance data for both
Ag (26) and Au (18), which show that thiocyanate is adsorbed on the electrode
surface at all potentials within the double layer region. Since most of the
9
spectra presented (Figures 2-7) here show little or no solution interference, and
since capacitance data confirm that adsorbed species are present, the peaks
occurring in Figures 2-7 above 2070 cm- 1 are assigned to adsorbed species. The
designation of peaks existing at wavenumbers higher than 2070 L'- 1 as adsorbed
species is reinforced by the fact that adsorbed species change frequencies with
changes in potential, while solution peak frequencies do not respond to changes
in potential. All of the peaks assigned as surface species here show a definite
shift in energy as the electrode potential is changed from positive to negative
values.
At first glance, some discrepancies appear between the difference spectra
presented here and the SNIFTIRS data from the same systems (18, 19). The
SNIFTIRS data shows the presence of a strong solution band, with a maximum at
2064 cm-1 on gold (18) and at approximately the same frequency on silver (19);
note that this frequency corresponds to the solution-phase thiocyanate species.
In the SNIFTIRS experiment on silver (19), the distance through the solution that
the IR beam traveled was given as 100 pm (twice the distance, 50pm, between the
optical window of the cell and the electrode). However, this distance does not
reflect the SNIFTIRS cell geometry precisely, since the cell window and the
electrode surface are not necessarily parallel, allowing for significant
differences in IR path length at various points on the electrode surface. As
described above, our depth of penetration into the solution in the spectral
region of interest is between 0.31 and 0.38 pm, so it is reasonable that the
SNIFTIRS technique should suffer more from solution band interference than the
MIRFTIRS method. We observe a ten-fold attenuation of the solution band peak
with the MIRFTIRS data over that of the SNIFTIRS data given in the literature
(19). This suggests that the actual pathlength of infrared light through the
10

SNIFTIRS cell, as it was assembled in the experiments documented (19), was less
than 10 pm.
A shoulder on the apparent solution band in SNIFTIRS experiments on gold
occurs at 2106 cm- 1 (18), the same position as a peak observed in the present
work (see Figure 2). Figures 2, 3, and 4 show peaks in the 2125-2133 cm- 1 range
(although none occurred above 2133 cm- 1), and in the 2112-2122 cm- 1 range, as
reported previously in the SNIFTIRS results (18, 19). The absence of the
solution band near 2065 cm- 1 in the data presented here make band assignments
more straightforward than in the SNIFTIRS data (18, 19). Spectra from
thiocyanate adsorbed on silver reported for the SNIFTIRS technique (19) are
noisier than the MIRFTIRS data and more difficult to compare. The principal
difficulty in comparing SNIFTIRS and MIRFTIRS data, however, is that the silver
SNIFTIRS data have significant interference from the solution band, which
obscures the region of interest.
Thiocyanate Adsorption on Silver
While many similarities exist in the adsorption of thiocyanate to silver and
gold, it is convenient to examine each system separately. At the silver
electrode with a 25 mM NaSCN concentration (Figure 2), as the potential was tuned
from +0.2 volts to -0.6 volts, the strongest band, which gains intensity at
positive potentials and looses intensity at negative potentials compared to the
zero volt reference spectrum, shifts from 2124-2114 cm- 1 (dy/dE = 12 cm-l-V 1 ).
This peak is assigned as the S-bound thiocyanate species, since S-bound
thiocyanate has been determined to be the predominant surface species at more
positive potentials (4,5,18), and since the peak position shifts with potential.
Assignments of vibrations as surface species are made only for those peaks which
shift with potential, since frequencies of solution species do not shift with
11

potential (16). The peak-to-peak value of 12 cm-lv-1 for dy/dE is similar to
values reported elsewhere for the S-bound thiocyanate (22, 18a). Frequency and
intensity data for 25 mM, 10 mM and 1 mM NaSCN solutions are listed in Table I.
The only other spectral feature, which is seen as a weak positive peak in
the 25 mM and 10 mM concentration data, is the small peak which appears to shift
from 2102-2087 cm- 1 between -0.1 volts and -0.6 volts (dy/dE = 15 cm-l -V 1) (see
Figure 3). This feature is not observed at positive potentials. The -2087 cm- 1
peak is a weak feature compared to the S-bound thiocyanate peak, and it is not
observed in the 1mM data. This peak is most prominent in the lOmM data (as the
results are presented here), although it is more apparent in the 25 mM results
when the spectra are expanded, as shown in Figure 8b.
The 2087 cm- 1 peak might be assigned as a solution band, since a very broad
feature is seen at 2080 cm- 1 in the spectra collected at more positive
potentials. At positive potentials above +0.2 volts, the silver layer begins
form AgSCN or a precursor and leave the surface (17). Figure 9 shows spectra of
thiocyanate on the silver electrode at the potentials +0.3 and +0.4 volts. The
large positive peaks at 2144 cm- 1 are assigned to the presence of AgSCN complexes
on the electrode surface. Once these vibrational bands are observed, the
electrode no longer functions electrochemically, and removing the substrate from
the cell reveals a gray, easily removable material on the silicon surface.
Assignment of the AgSCN peak frequency is based on data reported elsewhere (17),
where the AgSCN band was reported to be 2140 cm-1. These literature data agree
well with the 2144 cm- 1 peak reported here (see Figure 9). The relatively weak,
broad feature centered at 2080 cm- 1 could be due to solution species produced
when silver has left the electrode. It could also be due to changes in the
background spectrum occurring from loss of the silver layer.
12
The assignment of the -2087 cm-1 peak as a solution band is less
supportable, however, if all of the data collected here are considered. In the
discussion above, it was reported that the frequency of this band changed with
potential. Since only surface species show changes in frequency with potential,
and since it has been shown on gold that N-bound species exist at more negative
potentials (18), the -2087 cm-1 band may be due to N-bound thiocyanate on the
surface. Additional data to support the N-bound thiocyanate claim are: 1) a
solution spectrum was collected for this system with a peak appearing at
2065 cm-1 , a significantly lower frequency than the -2087 cm-1 peak under
discussion, and 2) Ashley et al. (22) have observed that N-bound thiocyanate
shifts further with potential than the S-bound species and in the same frequency
direction reported here. The greater frequency shift of the N-bound over the S-
bound peaks is predicted by the Gouy-Chapman-Stern model of the electrochemical
interface (27). The Gouy-Chapman-Stern model assumes that the magnitude of the
potential drop across the double-layer region is greatest near the electrode
surface. In the case of thiocyanate, the electric field which the C-N oscillator
experiences is greatest in the N-bound configuration, which induces the peak
frequency to change more with potential (in this case, the N-bound shifts
15 cm- 1 V -1 and the S-bound shifts 12 cm-1 V-1 ).
While the assignment of the -2087 cm-1 peak as N-bound thiocyanate is
supported by its shift with potential, distortion of the band due to overlap with
the S-bound peak and the weakness of the band make a definite assignment
difficult. At least one other possible explanation (besides N-bound or solution
assignments) exists. The overlap of the weak peak with the S-bound peak may also
demonstrate the bipolar nature of the S-bound peak, which increases at more
negative potentials. The occurrence of the 2087 cm- 1 band, which is not seen at
13

more positive potentials, indicates that there may be a reorientation at more
negative potentials.
Additional observations from the silver/thiocyanate system deserve mention.
Differences in the spectra versus solution concentration are apparent; peak
intensities decrease with decreasing concentration. The biggest change in
intensity occurs between the 1OmM NaSCN and the 1mM NaSCN spectra. While there
are small differences in sample alignment between the experiments, the bulk of
the intensity loss is probably due to sub-monolayer coverages at the 1mM NaSCN
concentration levels. Although absolute intensities are different with
concentration, the trend toward decreasing intensity with decreasing potential is
very similar for all three concentrations of NaSCN on silver (see Figure 10).
The inability to distinguish an "2087 cm-1 peak at the 1mM NaSCN concentration
level may be a function of the low signal/noise observed. No evidence (Figures
2-4) exists for a bridge-bound thiocyanate on the silver surface, which has been
reported to appear at a frequency of -2165 cm- 1 (18c).
Thus far we have overlooked the possibility that, while we have obtained
spectra from the thiocyanate soecies, infrared surface enhancement has occurred
(5). Surface enhancement could help explain the peak broadening observed. In a
study of the surface-enhanced Raman (SER) spectrum of thiocyanate on gold, the
frequency of the CN stretching band is seen to decrease in intensity and shift to
lower frequencies in the range 2100-2130 cm- 1 with more negative potentials (18).
Our data fall in this range and so do other data from thiocyanate on more
conventional silver electrodes, where frequencies between 2110 and 2130 cm- 1 have
been reported (17, 28).
Thiocyanate Adsorption on Gold
At a gold surface three apparent peaks are observed from adsorbed
14

thiocyanate in the 2000-2300 cm- 1 region (Figures 5-7). In the data from 25mM
NaSCN on gold, the peak positions are 2133-2127 cm- 1 , 2122-2112 cm- 1, and 2106-
2094 cm- 1 (wavenumber ranges in response to potentials from +0.2 volts to -0.6
volts). While three peaks are observed in these difference spectra, the
appearance of a positive peak at 2112 cm- 1 at -0.6 volts suggests that there are
actually only two absorption bands, nearly superimposed, which are responsible
for the observed spectra. The spectra appear to have three peaks since the band
which gains intensity at positive potentials is much broader than the band which
gains intensity at negative potentials. The fit of these difference spectra to a
two-band model show excellent agreement with the data, as described below.
The broader band, gaining intensity at potentials more positive than the
zero volt reference, is attributed to S-bound thiocyanate, while the narrower
peak with opposite behavior is assigned to N-bound species. The S-bound
thiocyanate band may be broader than the band from N-bound thiocyanate because
the six polarizable lone pair electrons on the sulfur and the single bond between
sulfur and carbon would allow the orientation of the C-S bond with respect to the
surface plane to vary. Since the C=N bond would thereby change its angle and
distance to the surface and encounter differences in potential within the double
layer region, it would lead to peak broadening. This broadening would not be
observed for the N-bound species, since the single, lone-pair orbital on nitrogen
would favor a perpendicular orientation with respect to the gold surface.
The postulation of N-bound thiocyanate vibrational frequency in the 2122-
2112 cm- 1 wavenumber range is a higher range than has been previously reported
(22, 18a). In the work of Weaver, et al. (18), N-bound thiocyanate has been
shown to occur at negative potentials on gold. This was determined both from
infrared spectroelectrochemical and SERS results (18). Since SERS results are
15

known to shift the peak positions to lower frequencies (18), unenhanced spectra
may contain peaks due to N-bound species at higher wavenumbers than those seen
under SERS conditions. The assignments made from SNIFTIRS data were more
difficult due to distortion from the strong solution species band (18a). In
these data, the peak postulated to be from N-bound species has a position of
2122-2112 cm-1, but the presence of the N-bound species makes it difficult to
make a definite wavenumber assignment for the peak of the S-bound species. Also,
shifts in frequency may be distorted by uneven overlap between the two peaks.
Finally, these features can be observed in the raw MIRFTIRS spectra where the
reference spectrum at 0 volts is not subtracted. However, the changes occurring
in both bands are made more apparent in the difference spectra, which clearly
show the potential-induced reorientation of the adsorbate.
For 10mM NaSCN (Figure 6), the ranges for the three apparent peaks observed
were 2130-2125 cm- 1, 211a-2111 cm- 1, and 2102-2095 cm-1 . From the 1mM NaSCN
solution on gold data these ranges were 2129-2123 cm- 1 , 2117-2108 cm- 1 , and 2102-
2093 cm- 1 . The signal/noise ratio decreases with decreasing concentration (as in
the silver experiments) indicating less coverage with lower concentration of
added thiocyanate. While the signal/noise for 1mM NaSCN on gold is better than
for 1mM NaSCN on silver, the data are still too noisy to make precise wavenumber
assignments. A comparison between the three concentrations of NaSCN on gold
shows that dy/dE changes very little with decreasing solution thiocyanate
concentration for both the N-bound and S-bound thiocyanate. At +0.2 and +0.3
volts, there is a larger, low wavenumber contribution from the peak assigned as
the S-bound thiocyanate in the 25mM NaSCN on gold data than in either the 1OmM or
1mM NaSCN on gold data. This low wavenumber contribution is either due to the
change in peak position of the S-bound peak with concentration, or may support
16

the contention of Suetaka et al. (5) that a "twinned" thiocyanate group exists at
more positive potentials. At more dilute solution concentrations, higher
potentials would be required to obtain a sufficient surface concentration of SCN-
ions to form the twinned thiocyanate species.
The existence of a twinned thiocyanate species seems unlikely, however, when
two other factors are considered. First, it seems reasonable to expect
"twinning" to occur more readily with higher solution concentrations of NaSCN.
However, at more negative potentials for all three concentrations, the peak at
-2095 cm- 1 is the same or larger in negative intensity than the band assigned to
S-bound which occurs at -2125 cm- 1. This similarity in intensity implies that
the mole ratio of the S-bound species to "twinning" species is the same
regardless of concentration, which is unlikely. Second, it is helpful to review
the method of data collection. A comparison of the negative potential data in
Figures 5-7 shows that, except for signal/noise differences, the trend for the
development of negative peaks in what we have labeled the S-bound positions are
the same regardless of concentration. In all three experiments, data were
collected first from potentials of +0.2 to -0.5 volts. The +0.3 volt data were
collected, for the 1OmM and 1 mM NaSCN concentrations, after the other data. If,
as it appears from the data, the peak possibly arising from twinned species was
only weakly formed at +0.2 volts, then the large negative-going peaks seen at
more negative potentials are not indicative of the loss of twinned species from
the surface. It is not possible to lose surface species which were never there.
Because of the method by which the data were collected, we assign the peaks as
two overlapping peaks, the narrowest due to N-bound thiocyanate and the broadest
due to S-bound thiocyanate.
The results of fitting the 25 mM NaSCN on gold data to a two-band model
17

using Gaussian band shapes can be seen in Figure 11 and Table II. For reasons
cited above, the S-bound absorption band was assumed to be broader than the band
due to N-bound thiocyanate. The band widths at half height used for calculations
at all potentials were fixed at 15 cm-1 for the S-bound and I cm- 1 for the N-
bound species. Fitting was optimized by minimizing the sum of the squared
residuals. The excellent fit of the two Gaussian band model argues strongly for
the presence of two species on the surface. The only region of the data not
accommodated by the two-band model is the region around 2020 cm- 1 in the most
negative potential difference spectra; this shoulder can be shown to arise from
the frequency shift of the S-bound species absorption relative to the zero-volt
reference spectrum (30). The exchange of one surface species for another as a
function of surface potential can be readily seen in the relative band
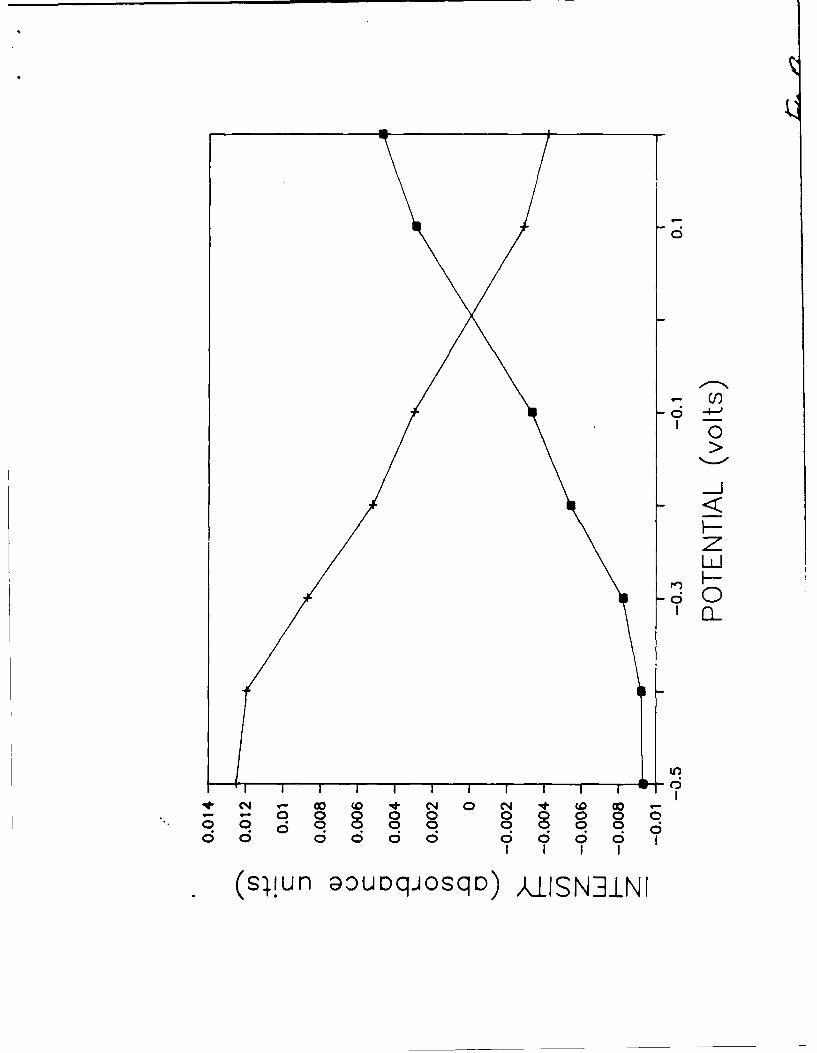
intensities plotted in Figure 12. Increased noise in the lower concentration
data meant that the data could not be fitted as precisely, so the determination
of dy/dE would be uncertain. From the fitted data at higher concentrations, for
25 mM NaSCN, dy/dE = 16 cm- 1 V - 1 for S-bound and dy/dE = 10 cm- 1 V - 1 for N-bound
thiocyanate, which is opposite to the expected trend (where N-bound dy/dE >
S-bound dy/dE). While the presence of adsorbed thiocyanate in the background
spectrum at zero volts can reduce the magnitude of observed band shifts in
difference spectra (30,31), the direction of the band shift is preserved. As
shown Figure 13, the S-bound band undergoes large changes in frequency with
potential until the potential reaches -0.3 V, below which its vibrational
frequency appears to be constant. This latter behavior is actually an artifact
of taking a difference spectrum related to the low intensity of the S-bound
species in the spectra at large negative potentials (see Figure 12). In this
region, the negative-going, S-bound band is dominated by its large contribution
18

to the zero-volt reference spectrum which is potential-independent.
The clear observation of two species on gold but not on silver has yet to be
discussed. Suetaka et al. (4,5) found that the adsorbate spectrum disappeared on
gold at more negative potentials than were required to make the spectrum
disappear on silver. Apparent differences in the behavior of the two metals may
be due to the substantial shift in the potential of zero charge between gold and
silver in the NaC1O 4 electrolyte (29). Considering the different properties of
these metals, the variations in the spectra observed due to the metal surface and
electronic properties are not surprising. Such properties could be responsible
for differences in both the peak positions and intensities for the vibrations of
thiocyanate adsorbed on gold and silver.
CONCLUSIONS
The MIRFTIRS technique has been shown to be useful in obtaining information
from thiocyanate adsorption on silver and gold within the double-layer region.
Its advantages in improved signal-to-noise, surface selectivity, and speed of
data collection over other surface spectroelectrochemical techniques demonstrate
that the technique should be utilized in future studies of adsorbates. Changes
in the ATR substrate used, and the metal films deposited on the surface, will
increase the number of applications possible for this method.
The data collected using MIRFTIRS allowed for the recognition and assignment
of spectral features from N- and S-bound thiocyanate species on gold surfaces,
and for the identification of S-bound species on silver. These assignments
differ from earlier assignments, but this can be explained in terms of the better
signal/noise from these experiments, and the absence of peaks due to solution
species which have obscured earlier spectroelectrochemical results.
19

ACKNOWLEDGEMENTS
J.M.H. and D.B.P. gratefully acknowledge the Office of Naval Research, the Center
for Biopolymers at Interfaces at the University of Utah, and the Alfred P. Sloan
Foundation for their support of this work. K.A. acknowledges the Research
Corporation and the donors of the Petroleum Research Fund, Administered by the
American Chemical Society, for support of this research. The authors also thank
Stan Pons and John Oaschbach for helpful discussions.
20

REFERENCES
1) Neugebauer, H.; Neckel, A.; Nauer, G.; Brinda-Konopik, N.; Garnier, F.;Tourillon, G. J. Phys. (Paris) C10, 1983, 12, 44.
2) Neugebauer, H.; Nauer, G.; Brinda-Konopik, N.; Kellner, R. FreseniusZ. Anal. Chem. 1983, 314, 266.
3) Pham, M.-C.; Adami, F.; Lacaze, P.-C; Doucet, J.-P.; Dubois, J.-E.J. Electroanal. Chem. 1986, 201, 413.
4) Hatta, A.; Sasaki; Suetaka, W. J. Electroanal. Chem. 1986, 215,93.
5) Wadayama, T.; Sakurai, T.; Ichikawa, S.; Suetaka, W. Surf. Sci. 1988,198, L359.
6) Engstrom, R.C. Anal. Chem. 1984, 56, 890.
7) Kavassalls, C.; Spitler, M. T. J. Phys. Chem. 1983, 87, 3166.
8) Hansen, W. N.; Osteryoung, R. A.; Kuwana, T. J. Am. Chem. Soc.Comm. 1966, 88, 5.
9) Palik, E. D.; Holm, R. T. J. Appl. Phys. 1984, 56 (3), 843.
10) Venkateswara Rao, A., Chazalviel, J.-N.; Ozanam, J. J. Appl. Phys. 1986,60 (2), 696.
11) Chazalviel, J.-N.; Venkateswara Rao, A. J. Electrochem. Soc. 1987,
134 (5), 1138.
12) Tardella, A.; Chazalviel, J.-N. Phys. Rev. B 1985, 32 (4), 2439.
13) Reed, A. H.; Yeager, E. Electrochim. Acta 1970, 15, 1345.
14) Mark, H. B.; Pons, B. S. Anal. Chem. 1966, 38 (1), 119.
15) Chazalviel, J.-N. Electrochim. Acta 1988, 33 (4), 461.
16) Ashley, K.; Pons. S. Chem. Rev. 1988, 88, 673.
17) Weaver, M.J.; Barz, F.; Gordon, J.G. II; Philpott, M.R. Surf. Sci.1983, 125, 409.
18) (a) Corrigan, D. S.; Foley, J.K.; Gao, P.; Pons, B. S.; Weaver, M. J.Langmuir 1985, 1, 616. (b) Corrigan, D. S. ; Gao, P.; Leung, L.-W. H.;Weaver, M.J. Langmuir 1986, 2, 744. (c) Corrigan, D.S.; Weaver, M.J.J. Phys. Chem. 1986, 90, 5300.
19) Foley, J. K.; Pons, S.; Smith, J. J. Langmuir 1985, 1, 697.
21
20) Parry, D.8.; Harris, J.M. Appi. Spectrosc. 1988, 42 (6), 997.
21) Parry, 0.B.; Dendramis, A.L. Appl. Spectrosc. 1986, 40 (5), 656.
22) Ashley, K.; Samant, M.G.; Seki, H.; Philpott, M.R., J. Electroanal. Chem.,in press.
23) Harrick, N.J. Internal Reflection Spectroscopy Wiley Interscience: NewYork, 1967.
24) Salzberg, C.D. and Villa, J.J. J. Opt. Soc. Amer. 1957, 47, 244.
25) Downing, H.D. and Williams, 0. J. Geophys. Res. 1975, 80 (12), 1656.
26) (a) Hupp, J.T.; Larkin, D.; Weaver, N.J. Surf. Sci. 1983, 125, 429;(b) Larkin, 0.; Guyer, K.L.; Hupp, J.T.; Weaver, N.J. J. Electroanal.Chem. 1982, 138, 401.
27) Bockris, J. O'M.; Reddy, A.K.N. Modern Electrochemistry, Vol. 2;
Plenum Press: New York, 1973, Chapter 3.
28) Wetzel, H.; Gerischer, H.; Pettinger, B. Chem. Phys. Lett. 1981, 80, 159.
29) (a) Argade, S.A.; Gileadi, E. in Electrosorption; Gileadi, E., Ed.Plenum Press: New York, 1967. (b) Perkins, R.S.; Andersen, T.N. inModern Aspects of Electrochemistry, Vol. 5; Bockris, J.O'M.; Conway, B.E.,Eds. Plenum Press: New York, 1969.
30) Brown, C.W.; Lynch, P.A.; Obremski, R.J. Appl. Spectrosc. 1982, 36, 539.
31) Rao, B.; Stobie, R.W.; Dignam, N.J. J. Chem. Soc. Faraday Trans. 11, 1975,
71, 654.
22

FIGURE LEGENDS
1) Detail of the electrochemical ATR FTIR cell. A shows the O-ring position in
the cell, B is the silicon prism, C is a teflon flow cell chamber which is not
filled in this experiment, D indicates the aluminum supports, and E is the
electrochemical flow cell chamber. A more complete view of E in seen in the top
view. Here, F is the reference electrode (SCE) which fits through a hole in the
back of E (as seen in the exploded view). G is the platinum secondary electrode,
H indicates the metal-coated side of the infrared substrate, I is a teflon
protrusion used to hold G in place, and J is the liquid chamber itself.
2) Difference spectra of 25mM NaSCN in aqueous 0.16M NaCl04 on silver. The
background reflectance spectrum used for ratioing is the filled, nitrogen purged
cell at a potential of 0 volts. The potentials vs. SCE are as follows A) +0.2 V,
B) +0.1 V, C) -0.1 V, D) -0.2 V, E) -0.3 V, F) -0.4 V, G) -0.5 V, H) -0.6 V.
3) Same as Figure 2 with a NaSCN concentration of 10mM.
4) Same as Figure 2 with a NaSCN concentration of 1mM.
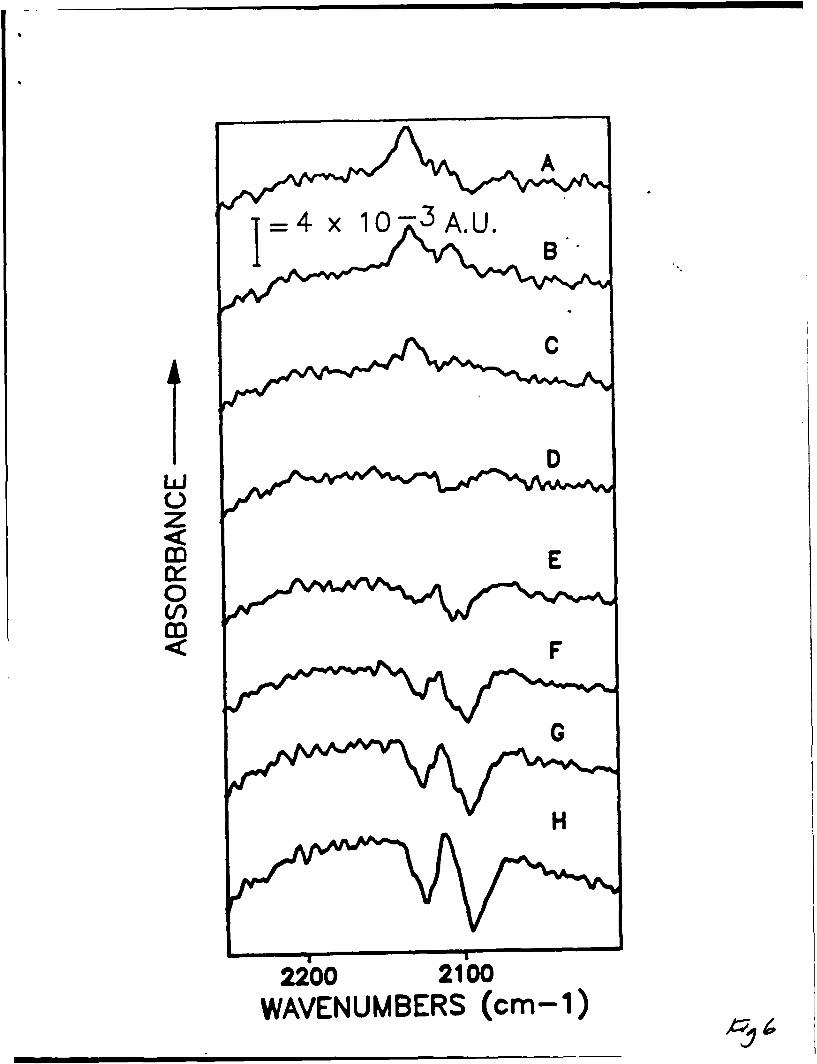
5) Difference spectra of 25mM NaSCN in aqueous 0.15M NaC1O 4 on gold. The
background spectrum subtracted is the filled, nitrogen purged cell at a potential
of 0 volts. The potentials vs. SCE shown are as follows A) +0.2 V, 8) +0.1 V, C)
-0.1 V, 0) -0.2 V, E) -0.3 V, F) -0.4 V, G) -0.5 V.
6) Same as Figure 5 with a NaSCN concentration of 10mM. The potentials vs. SCE
shown are A) +0.3 V, B) +0.2 V, C) +0.1 V, 0) -0.1 V, E) -0.2 V, F) -0.3 V, G) -
0.4 V, H) -0.5 V.
23

7) Same as Figure 5 with a NaSCN concentrations of 1mM. The potentials vs. SCE
shown are the same as in Figure 6 with the addition of I) -0.6 V.
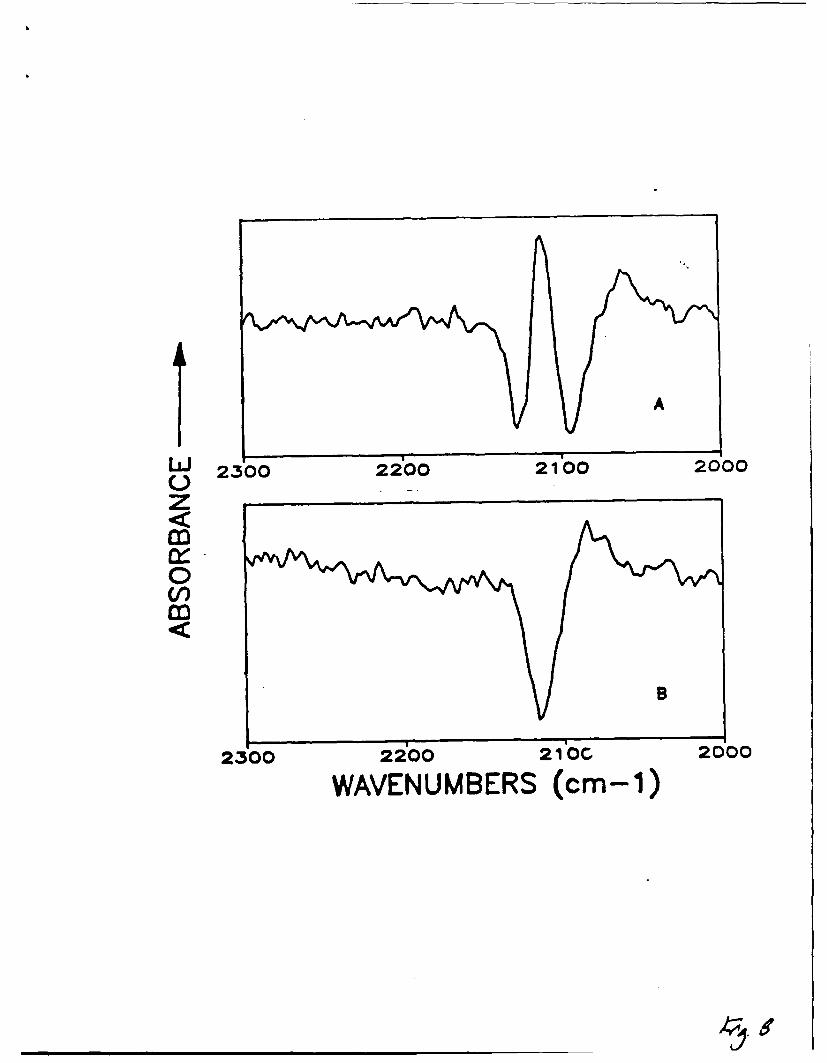
8) Expanded difference spectra of the 25mM NaSCN system in aqueous 0.15M NaClO 4
3t a potential of -0.5 V (vs. SCE) on A) gold and B) silver.
9) Difference spectra of 25mM NaSCN in aqueous 0.15M NaClO 4 on silver at higher
positive potentials. The potentials vs. SCE shown are A) +0.4 V and B) +0.3
Volts.
10) Changes in intensity with potential (vs. SCE) for three concentrations of
NaSCN at silver; A) 25 mM NaSCN, 8) 10 mM NaSCN, C) 1 mM NaSCN.
11) Difference spectra from 25 mM NaSCN solution on gold (points) fitted to a
Gaussian peak shape (line). Data are from variou potential vs. SCE: A) +0.2 V,
8) -0.1 V, C) -0.2 V, D) -0.3 V, E) -0.4 V, F) -0.5 V.
12) Plot of intensity vs. potential for fitted data from 25 mM NaSCN on gold
experiment. + = N-bound, 1:1 = S-bound.
13) Plot of peak position vs. potential for fitted data from 25 mM NaSCN on gold
experiment. + = N-bound, I-! = S-bound.
24
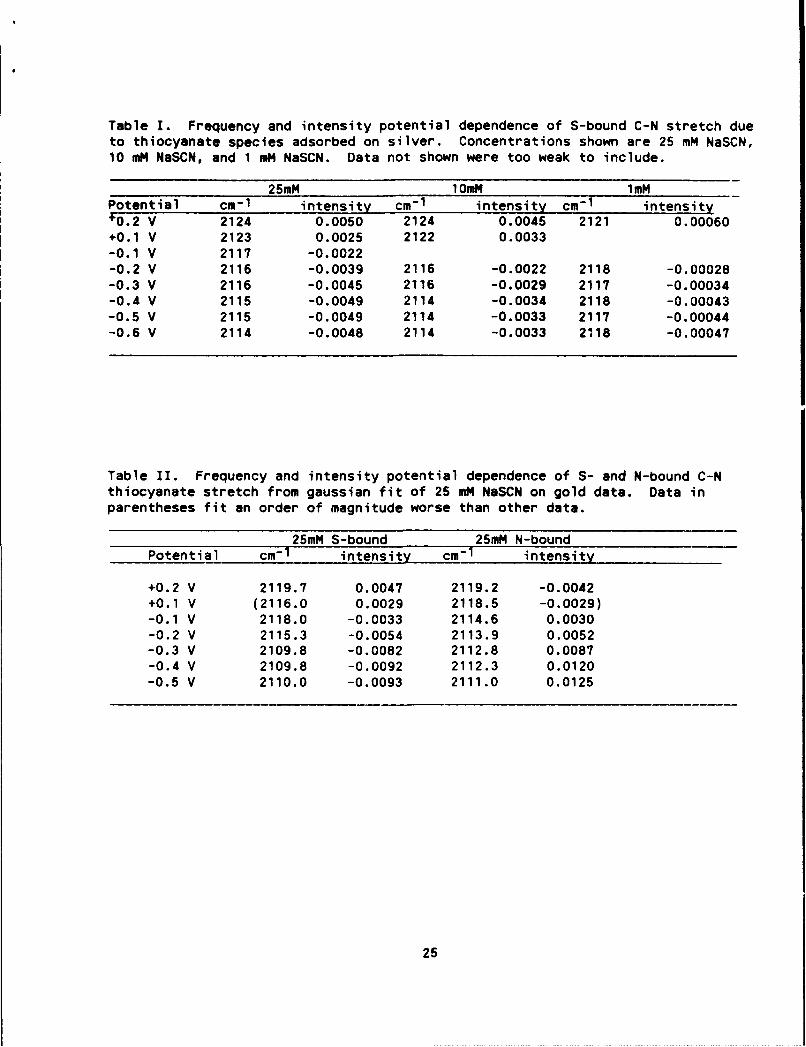
Table I. Frequency and intensity potential dependence of S-bound C-N stretch dueto thiocyanate species adsorbed on silver. Concentrations shown are 25 mM NaSCN,10 mM NaSCN, and 1 mM NaSCN. Data not shown were too weak to include.
25mM 10mM 1mMPotential cm- 1 intensity cm- 1 intensity cm- 1 intensity10.2 V 2124 0.0050 2124 0.0045 2121 0.00060
+0.1 V 2123 0.0025 2122 0.0033-0.1 V 2117 -0.0022-0.2 V 2116 -0.0039 2116 -0.0022 2118 -0.00028-0.3 V 2116 -0.0045 2116 -0.0029 2117 -0.00034-0.4 V 2115 -0.0049 2114 -0.0034 2118 -0.00043-0.5 V 2115 -0.0049 2114 -0.0033 2117 -0.00044-0.6 V 2114 -0.0048 2114 -0.0033 2118 -0.00047
Table II. Frequency and intensity potential dependence of S- and N-bound C-Nthiocyanate stretch from gaussian fit of 25 mM NaSCN on gold data. Data inparentheses fit an order of magnitude worse than other data.
25mM S-bound 25mM N-boundPotential cm- 1 intensity cm- 1 intensity
+0.2 V 2119.7 0.0047 2119.2 -0.0042+0.1 V (2116.0 0.0029 2118.5 -0.0029)-0.1 V 2118.0 -0.0033 2114.6 0.0030-0.2 V 2115.3 -0.0054 2113.9 0.0052-0.3 V 2109.8 -0.0082 2112.8 0.0087-0.4 V 2109.8 -0.0092 2112.3 0.0120-0.5 V 2110.0 -0.0093 2111.0 0.0125
25

EXPLODED VIEW
c/
SIDE VIEW TOP VIEW
/

zm
m
WAVENUMBERS (cm-i)

wA4.003AU
zB
mC
0D
(IIV
WAVENUMBERS (cm-i)

gpJA
2150 210 200
WAEUBR (cm-i)

z
0C,)
2302200 21'00 2000
WAVENUMBERS (cm-i)
wA
0
mE
2200 2100WAVENUMBERS (cm-i)

3.w03AU
0 Ezm
Ul)m
2200 2100WAVENUMBERS (cm-i)
A
W 230 22 900 21 000 2000
zM0
2300 2200O 21'OC 2000
WAVENUMBERS (cm-i)

1 1.7 x~ 10-2 A.U.
wL0z
0U)m
23002i~o2100
WAVENUMBERS (cm-i)

0.005-0.004- A0.003-0.002 -
0.001 -0-
-0.001 --0.002-
~ -0.003-03 -0.004-
-0.005-0.6 -0.4 -6.2 0 0.2
0.005Q)3 0.004-
C 0.003 B0 0.002-
-QL 0.001 -0 0-
_) -<-0.002 -
-0.003-6-0.004 -06 ' -.
0-0.6 -0.4 -. 2 0.2
U')Z 0.0006 -Lj 0.0005- CI-- 0.0004 -Z 0.0003-
0.0002-0.0001 -
0-0.0001 --0.0002-0.0003 --0.0004--0.0005 j-
-0.6 -6.4 -6.2 60.2
POTENTIAL (volts)

A B
SS
.&ON
0
20020 20 20
WAVENUMBERS (cm-i)
-
00 ( 1* 14 0 C14 o (-0 0 00 0 00 0z
q~ -(0 0 0 0 (0 c
(s;!un aouDq-josqiD) iISN~iNl

0
U-,
CN 0) co r- (D O nf C1 M~N~-
* 04 N C * N C1 C1 NN C1 -
(SPUosnotj.L)
(L-weo) d8AnNIAVM