origin of oxygen reduction reaction activity on “pt3co...
TRANSCRIPT

Origin of Oxygen Reduction Reaction Activity on “Pt3Co” Nanoparticles: AtomicallyResolved Chemical Compositions and Structures
Shuo Chen,† Wenchao Sheng,‡ Naoaki Yabuuchi,† Paulo J. Ferreira,§ Lawrence F. Allard,| andYang Shao-Horn*,†,⊥
Department of Mechanical Engineering, Department of Chemistry, and Department of Materials Science andEngineering, Massachusetts Institute of Technology, Cambridge, Massachusetts 02139, Materials Science andEngineering Program, UniVersity of Texas at Austin, Austin, Texas 78712, and High Temperature MaterialsLaboratory, Oak Ridge National Laboratory, Oak Ridge, Tennessee 37831
ReceiVed: August 11, 2008; ReVised Manuscript ReceiVed: October 27, 2008
Rotating disk electrode measurements of acid-treated “Pt3Co” nanoparticles showed specific oxygen reductionreaction (ORR) activity (∼0.7 mA/cmPt
2 at 0.9 V vs RHE in 0.1 M HClO4 at room temperature), twice thatof Pt nanoparticles. Upon annealing at 1000 K in vacuum, the ORR activity at 0.9 V was increased to ∼1.4mA/cmPt
2 (four times that of Pt nanoparticles). High-resolution transmission electron microscopy and aberration-corrected high-angle annular dark-field in the scanning transmission electron microscope was used to revealsurface atomic structure and chemical composition variations of “Pt3Co” nanoparticles on the atomic scale.Such information was then correlated to averaged Pt-Pt distance obtained from synchrotron X-ray powderdiffraction data, surface coverage of oxygenated species from cyclic voltammograms, and synchrotron X-rayabsorption spectroscopy. It is proposed that ORR activity enhancement of acid-leached “Pt3Co” relative to Ptnanoparticles is attributed to the formation of a percolated structure with Pt-rich and Pt-poor regions withinindividual particles, while the increase in the specific ORR activity of annealed “Pt3Co” nanoparticles relativeto Pt can be attributed to the presence of surface Pt segregation.
1. Introduction
Fuel cells that operate on hydrogen produced from solarenergy are promising technologies to provide energy storagefor renewable energy supply and energy demands.1 Oxygenreduction reaction (ORR) that typically results in 300-400 mVloss in the cell voltage2 limits fuel cell efficiency. It has beenof great interest to discover nanoscale catalysts with ORRactivity superior to that of Pt. Significant experimental andcomputational research efforts have been focused on under-standing surface chemistry and atomic and electronic structuresof Pt alloy model surfaces that exhibit ORR activity higher thanPt,3-8 from which strategies can be developed to discover highlyactive catalysts on the nanoscale. Two strategies that are shownto enrich Pt on extended Pt alloy surfaces are (1) surfacesegregation of Pt by high-temperature annealing9,10 and (2) acidremoval of less noble alloying elements than Pt from alloysurfaces.11 In both cases, ORR activity has shown to increaseby 2-10 times relative to that of Pt.3,7,10-15
Stamenkovic et al.12,15 have shown that annealed polycrys-talline Pt3M (M ) Co, Fe, and Ni) surfaces consist ofsegregation of pure Pt in the top surface layer, which isassociated with the depletion of Pt in the second layer andcomposition oscillation in the subsequent layers. The top surfacelayer of pure Pt is referred to as “Pt-skin”11 while thecomposition oscillation in the first three to four layers away
from the surface has been reported as the “sandwich-segrega-tion” structure.9 Density functional theory (DFT) studies ofNorskov et al.6,16 and Mavrikakis et al.17 have shown that theenhanced ORR activity of Pt3M(111) (M ) Co, Fe, Ni) surfaceswith the Pt-skin can be attributed to weakening metal-oxygenbond strength relative to Pt(111). This reduced surface reactivityof the Pt-skin structure results from lowered Pt valence bandcenter relative to the Fermi level,18 which is induced both byshortened surface Pt-Pt bond distance constrained by transitionmetals in the second layer beneath the surface and by ligandeffect.17,19,20
Pure Pt on the outermost surface layer can be also createdon Pt alloys by acid removal of transition metals.7,11,21 Little isknown about the atomic structure and chemical compositionsof near-surface regions after acid treatments, and the origin ofthe ORR enhancement of acid-treated Pt alloys is not clearlyunderstood. Toda et al.7 has used the Pt-skin phrase to describethe acid-treated Pt alloy surface regions where Pt is enriched inthe top three to four atomic layers, which can have differentstructures from that of the sandwich-segregation structure.9 Theactivity enhancement relative to Pt has been attributed toincreased d electron vacancy in the Pt-enriched surface regioninduced by underlying transition metals, and thus increasedoxygen adsorption and weakened O-O bonds.7,22 On the otherhand, it has been proposed recently that removal of transitionmetals from Pt alloy in acid renders a near-surface region witha “Pt-skeleton” structure,11,12 which consists of Pt atoms andvacancies left behind by the transition metal in the top fewatomic layers. The enhanced ORR activity of the Pt-skeletonstructure12 relative to Pt has been correlated recently to reducedsurface reactivity toward surface-oxygenated species as a resultof lowered d band center energy normalized to the Fermi level11
of Pt alloy surfaces before acid treatments. One issue worth
* Corresponding author. E-mail: [email protected].† Department of Mechanical Engineering, Massachusetts Institute of
Technology.‡ Department of Chemistry, Massachusetts Institute of Technology.§ University of Texas at Austin.| Oak Ridge National Laboratory.⊥ Department of Materials Science and Engineering, Massachusetts
Institute of Technology.
J. Phys. Chem. C 2009, 113, 1109–1125 1109
10.1021/jp807143e CCC: $40.75 2009 American Chemical SocietyPublished on Web 12/24/2008

mentioning is that the Pt d band center energy of the Pt-skeletonsurface of Pt alloys after acid removal of transition metal, whichis strongly dependent on near-surface compositions, may deviatefrom those obtained in UHV.12 It is essential to examine if ORRmechanisms established for Pt bulk surfaces are applicable tonanoparticles, and to bridge fundamental understanding of ORRactivity enhancement established on extended Pt alloy modelsurfaces to design Pt alloy nanoparticles with high ORR activityfor practical applications.
It is well-known that Pt alloy nanoparticles exhibit enhancedORR activity in A/cmPt
2 relative to Pt nanoparticles.14,23-28 Theorigin of the enhancement mechanism remains elusive. Theenhanced ORR activity of Pt alloy nanoparticles has beenattributed to many factors such as Pt-Pt distance25,29,30 andsurface roughness (the nature of facets and steps)31 and surfaceelectronic effects (the ligand effect) such as Pt 5d valence bandvacancy.25,28 Although X-ray powder diffraction and synchrotronX-ray absorption spectroscopy techniques have allowed thecorrelation of Pt-Pt interatomic distance and Pt d band vacancyaveraged among nanoparticle surface and interior atoms to ORRactivity,25,28 little is known about nanoparticle surface atomicstructures and near-surface chemical compositions that governactivity. Although Pt segregation on the 111 surfaces has beenpredicted on truncated octahedral “Pt3Co” nanoparticles of 2.5nm,12 it remains unclear whether and to what extent Ptsegregation occurs on Pt alloy nanoparticles surfaces and howit may influence ORR activity.
It is of particular interest to determine if and to what extentdepletion of transition metals in the surface layers and Pt surfacesegregation can occur in acid-treated and high-temperature-annealed Pt alloy nanoparticles, respectively. In this study, weuse conventional and aberration-corrected high-angle annulardark-field (HAADF) scanning transmission electron microscopy(STEM) to reveal the composition inhomogeneity of “Pt3Co”nanoparticles on the atomic scale, from which size-dependentPt/Co ratios, percolated and core-shell nanoparticle structures,and surface Pt segregation are revealed. In addition, high-resolution transmission electron microscopy (HRTEM) is em-ployed to determine differences in the surface atomic structurebetween acid-treated “Pt3Co” and Pt nanoparticles. Suchinformation is then correlated to surface coverage of oxygenatedspecies from synchrotron X-ray absorption spectroscopy andcyclic voltammetry, and specific ORR activity (based on Ptsurface area) of Pt and “Pt3Co” nanoparticles in weaklyadsorbing HClO4 acid, from which the origin of ORR activityenhancement of Pt alloy nanoparticles is discussed.
2. Experimental Methods
2.1. Sample Preparation. Two samples of “Pt3Co” nano-particles supported on carbon (Pt 46 wt %), with average atomicratios of Pt/Co close to 3, were examined. One was preparedby acid treatments from “PtCo” alloy nanoparticles with anaverage atomic ratio of Pt/Co close to 1, which was suppliedby Tanaka Kikinzoku (TKK) International, Inc. This samplehad an average Co atomic percentage of ∼22 at %, which isreferred to as AT-“Pt3Co” in this paper. The other was obtainedby annealing AT-“Pt3Co” at 1000 K for 3 h at a low pressureof 3 × 10⁻² torr and then cooling in the furnace to 373 K(average heating, 30 K/min; average cooling, 5 K/min). Thissample is referred to as HT-AT-“Pt3Co”. In addition, a sampleof Pt nanoparticles was used for comparison in this study. Inorder to minimize the effect of particle sizes on specific ORRactivity,2,32-34 this sample was prepared from heat-treating acatalyst sample (Pt nanoparticles of 2 nm supported on high-
surface-area carbon, Pt 46 wt %, TKK) at 1173 K for 1 min inargon (∼30 K/min) and cooling to ambient (∼5 K/min) to obtaina comparable number-averaged particle size of ∼4 nm for“Pt3Co” nanoparticles. This Pt sample is referred to as Pt-4nm.
2.2. Electrochemical Measurements. 2.2.1. Preparation ofPt Catalyst Electrodes. Thin catalyst layers were prepared byusing methods reported previously.14,35,36 Suspensions of Ptcatalysts of 0.2∼0.5 mg/mL were obtained by dispersing thecatalysts in deionized water (18.2 MΩ · cm, Millipore) usingwater bath sonication, and ultrasonication was performed whenneeded. Twenty microliters of the Pt catalyst suspension (inwater) was deposited on glassy carbon electrodes (GCE) (5 mmin diameter, Pine Instruments), which were prepolished to 0.05µm of alumina. After drying in air at room temperature, 20 µLof 0.025 wt % of Nafion water solution (diluted from 5 wt %of Nafion, Ion Power, Inc.) was added and dried in air toimmobilize the catalysts. Pt loadings of ∼10 µg/cm2 on GCEwere used for CV and ORR measurements.
2.2.2. Cyclic Voltammetry. As-prepared electrodes were thenmounted to a rotator (Pine Instruments) and immersed into 0.1M HClO4 that was diluted from 1.0 M HClO4 (Sigma Aldrich)with deionized water (18.2 MΩ · cm, Millipore). A spiral Pt wirewas employed as the counter electrode, and a saturated calomelelectrode (SCE, Analytical Sensor, Inc.) was used as thereference electrode. The potential of SCE with respect to thereversible hydrogen electrode (RHE) was calibrated fromrotating disk electrode measurements of hydrogen oxidation.All the potential values reported in this paper refer to that ofthe RHE. After the electrolyte was bubbled with nitrogen (N2)for half an hour, the working electrodes were scanned between0.02 and 1.21 V vs RHE at a sweep rate of 200 mV/s for 60cycles to remove contaminants from Nafion solution. Steady-state cyclic voltammograms were then recorded at 50 mV/s inthe same potential range at room temperature. The electro-chemical surface area (ESA) of supported Pt and “Pt3Co”nanoparticles was determined from the hydrogen underpotentialdeposition region (0.05 V to the onset of the double-layerregion), i.e., the desorption pseudocapacitance (210 µC/cmPt
2
for Pt nanoparticles, 200 µC/cmPt2 for AT-“Pt3Co”, and 180 µC/
cmPt2 for HT-AT-“Pt3Co” as reported previously).11 For the
specific surface area calculation of “Pt3Co” nanoparticles, it isassumed that protons adsorb on Pt atoms only but not on Coatoms in the hydrogen underpotential region.
2.2.3. Rotating Disk Electrode Measurements of ORRActiWity. After the electrolyte was purged with pure oxygen (O2)for at least half an hour, polarization curves were recordedbetween 0.02 and 1.21 V vs RHE under a voltage sweep rateof 10 mV/s at room temperature. Current-voltage data wererecorded at rotating speeds of 100, 400, 900, 1600, and 2500rpm. All of the GCEs with thin catalyst layers reached a well-definedlimitingcurrentstartingfrom0.7V.TheKoutecky-Levichplots based on 1/j ) 1/jk + 1/jD ) 1/jk + 1/(BC0ω1/2) at 0.35,0.65, and 0.75 V revealed an excellent linear behavior between1/j and 1/ω1/2 (see Figures 1a-c, Supporting Information). Theslope, 1/(BC0), reflects the number of electrons involved in thereaction. The calculated BC0 values are 0.157, 0.149, and 0.159mA cm2 ω-1/2 for Pt-4nm, AT-“Pt3Co”, and HT-AT-“Pt3Co”,respectively. They are in good agreement with the predictedvalue (0.1505 mA cm2 ω-1/2) from the relationship jD )0.2nFCO2
DO22/3 V-1/6 ω1/2,37 where n, the apparent number of
electrons transferred in the reaction, is equal to 4, F is theFaraday constant, CO2
is the O2 concentration in 0.1 M HClO4
(1.26 × 10⁻³ mol L-1), DO2is the diffusivity of O2 (1.93 ×
10-5 cm2 s-1) in dilute electrolyte solutions, and ν is the
1110 J. Phys. Chem. C, Vol. 113, No. 3, 2009 Chen et al.

kinematic viscosity of the electrolyte (1.009 × 10⁻² cm2 s-1).38
Knowing ORR on both Pt and “Pt3Co” nanoparticles occursvia a four-electron pathway, the specific activity was calculatedfrom jk at 0.9 V vs RHE and was compared among the catalystssamples examined in this study.
2.3. Characterization of Nanoparticles: Atomic Structure,Electronic Structure, and Size-Dependent Composition. Theaverage Pt-Pt distance in the “Pt3Co” samples was obtainedfrom synchrotron X-ray diffraction analysis and synchrotronextended X-ray adsorption fine structure (EXAFS). The particlesize distribution and the surface atomic structure of “Pt3Co”and Pt nanoparticles were determined by high-resolutiontransmission electron microscopy (HRTEM). The compositionsof individual “Pt3Co” nanoparticles were determined by X-rayenergy dispersive spectroscopy (EDS) in a conventional STEMmode. Surface atomic structure and chemical compositions of“Pt3Co” nanoparticles were revealed by aberration-correctedHAADF STEM imaging. D band vacancy values of “Pt3Co”and Pt nanoparticles were obtained from synchrotron X-rayabsorption near-edge structure (XANES) data.
2.3.1. Synchrotron X-ray Powder Diffraction. Synchrotronradiation of BL02B2 at Spring-8 (Sayo-gun, Hyogo, Japan),equipped with a large Debye-Scherrer camera,39 was used tocollect X-ray diffraction data of Pt and “Pt3Co” nanoparticlesamples. The incident beam was adjusted to a wavelength of0.5 Å by a Si(111) monochromator to minimize the absorptionby the samples. The wavelength was calibrated to be 0.5027 Åby using CeO2 standard (a ) 5.4111(1) Å). The data werecollected in the range of 0-75° in 2θ. A few milligrams ofeach sample in the powder form was placed in a quartz capillary(0.5 mm diameter and approximately 1.5 cm height) during themeasurement. X-ray diffraction data were recorded on theimaging plate for 30 min. Structural analysis was performedusing FullProf40 in the range of 5-60° in 2θ.
2.3.2. HRTEM Imaging. The size and distributions of Pt and“Pt3Co” nanoparticles were examined in a JEOL 2010F TEMoperated at 200 kV with a point-to-point resolution of 0.19 nm.Nanoparticles were first immersed in ethanol and subsequentlydispersed ultrasonically for 5 min. The suspension was thendeposited on a lacey carbon grid and dried in air for TEMobservations. Two hundred randomly selected nanoparticlesfrom HRTEM images were used to produce particle sizedistributions of Pt and “Pt3Co” samples. For each distribution,the number-averaged diameter dn was determined by dn ) (∑i
) 1n di)/n while the volume-surface-area-averaged diameter41 dv/a
was calculated by dv/a ) (∑i ) 1n di
3)/(∑i ) 1n di
2), where di is thediameter of individual particles. The specific surface area ofnanoparticles based on the volume-surface-area-averageddiameter from TEM measurements was determined by 6(1000/(FPtdv/a)).
Recent studies have shown that steps on the surfaces of Ptnanoparticles can be identified by HRTEM imaging.42 Theindexes of surface facets of Pt and “Pt3Co” nanoparticles weredetermined from the HRTEM images and fast Fourier transform(FFT) analysis. The FFTs of HRTEM images obtained fromDigital Micrograph (Version 3.11.2, Gatan Inc., Pleasanton, CA)were then compared with simulated electron diffraction patternsof Pt (space group Fm3jm), ordered “Pt3Co” (space groupPm3jm), and ordered PtCo (space group P4/mmm). Eachdiffracted spot in the FFT images represents a set of equalspacing planes whose normal direction coincides with thestraight line that connects this diffraction spot with the transmit-ted spot. The length of this straight line is proportional to thereciprocal of the interplanar distance. With the aid of Digital
Micrograph, the interplanar distance and the angle betweenatomic planes were obtained from FFT images, which allowedindexing of lattice fringes and surface facets in the HRTEMimages. In this study, high-index planes were separated intothree groups according to the notations used in previous steppedsingle-crystal studies:43-46 (1) when the 111 planes are presentas terraces and single 100 as steps, the notation of n111 ×100 is used; (2) when the 100 planes are present as terracesand single 111 as steps, the n100 × 111 notation is used;(3) the 111 terraces separated by single 111 steps is denotedas n111 × 111. The n in the above notation correspondsto the number of atoms along the terrace viewed from the zoneaxis.
2.3.3. ConWentional STEM Imaging and EDS Analysis. Thechemical compositions of “Pt3Co” samples were determinedusing EDS in a VG HB603 STEM at room temperature usinga beam voltage of 250 kV and INCA control software (Version4.08, Oxford Instruments Analytical Limited). Pt LR (∼9.442keV) and Co KR (∼6.930 keV) signals were used for composi-tion quantification. The average chemical composition of each“Pt3Co” sample was determined from Pt and Co signals collectedfor 600 s from an area of few micrometers squared with ascanning beam of 2 nm in diameter. In addition, the chemicalcompositions of individual “Pt3Co” nanoparticles were deter-mined from signals collected for 20-30 s with a scanning beamof 2 nm in diameter, which provided sufficient signal-noise-ratios for quantification of Pt and Co atomic fractions. Moreover,in order to probe the variation in the Pt and Co atomic fractionsacross a given particle, Pt and Co signals were collected fromthe particle center and edge of 20-40 “Pt3Co” nanoparticlesusing a static beam in the spot capture mode. A collection timeof 30 s was used, and the drifting corrector was employed toensure the correct beam position within the nanoparticle. Errorsin the Pt and Co atomic fractions in the analysis of eachspectrum were generated by INCA, which were shown tosupport the significance of compositional variation acrossdifferent “Pt3Co” nanoparticles (size-dependent) and withinsome individual particles.
2.3.4. Aberration-Corrected STEM Imaging. The atomicstructures and compositions of “Pt3Co” nanoparticles wereexamined in an aberration-corrected JEOL 2200FS-AC STEMlocated at Oak Ridge National Laboratory and operating at 200kV. The aberration-corrected STEM is equipped with a SchottkyFEG, a CEOS GmbH hexapole aberration corrector, an in-column Omega filter, and a high-angle angular dark-fielddetector. The intensities of different elements in the HAADFimages are approximately proportional to Z2, where Z is theatomic number of a certain element. The aberration correctorcombined with the HAADF detector allows the formation ofZ-contrast images with resolutions below 0.1 nm. This capabilityis ideal for imaging regions within each nanoparticle, wheredifferent compositions may exist.
2.3.5. Synchrotron X-ray Adsorption Measurements. Syn-chrotron XANES and EXAFS data were collected at the bendingmagnet beam line 20-BM-PNC at the Advanced Photo Sourceat the Argonne National Laboratory (ANL) at ambient condi-tions. X-rays were monochromatized by using a Si(111) double-crystal monochromator, which was calibrated by defining theinflection point (first-derivative maxima) with Pt and Co foils,having a thickness of 4 and 7.5 µm, respectively. The incidentand transmitted X-ray intensities were detected with two ionchambers which were continuously purged with 100% N2 (I0)and 50% N2 + 50% Ar (I1) for Pt, and 50% He + 50% N2 (I0)and 20% Ar + 80% N2 (I1) for Co. XAFS samples were
ORR Activity on “Pt3Co” Nanoparticles J. Phys. Chem. C, Vol. 113, No. 3, 2009 1111

prepared by pelletizing the mixture of the samples and finelyground boron nitride powders, and their thickness was deter-mined to obtain an appropriate absorption jump. The detailedinformation on the beam line operation and APS storage ringcan be found elsewhere.47,48 The spectra were processed andanalyzed by using a program IFEFFIT,49 by which the preedgeregionwassubtractedbasedon theenergyrangeof (-130)-(-30)eV relative to the E0 for the Pt L2,3 edge and (-150)-(-30)eV for the Co K edge, and then normalized based on the energyrange above 150 eV relative to the E0. EXAFS analysis wasperformed by using the Pt L3 edge only. The phase shift andbackscattering amplitude was calculated theoretically usingFEFF 8.4 code.50
3. Results
3.1. Cyclic Voltammogram and RDE Measurements ofORR Activity of “Pt3Co” Nanoparticles. Figure 1 shows cyclicvoltammograms of Pt-4nm, AT-“Pt3Co”, and HT-AT-“Pt3Co”in an N2-saturated 0.1 M HClO4 solution. All samples clearlyexhibit features associated with hydrogen adsorption anddesorption on Pt110 (a peak between ∼0.1 and ∼0.2 V vsRHE) and Pt100 facets (a broad peak at ∼0.3 V vs RHE) inthe hydrogen underpotential deposition region.51,52 The elec-trochemically active area of nanoparticles (Pt surface area) wasdetermined from the charge associated with hydrogen desorp-tion, which is listed in Table 1. The onset potential (∼0.8 V vsRHE) of adsorption of oxygenated species53,54 was shiftedpositive for HT-AT-“Pt3Co” relative to Pt and AT-“Pt3Co”. Thecharge density (normalized to Pt surface area) associated withwater activation and adsorption of oxygenated species on Pt inthe positive-going sweep and reduction of oxygenated specieson Pt on the negative-going sweep are shown as a function ofpotential in Figures 1b and 1c, respectively. It is interesting tonote that the charge for all three samples up to 1.0 V in thepositive-going scan was found to be comparable, which suggestsa similar degree of surface oxidation for Pt and “Pt3Co”nanoparticles at 1.0 V. This observation is in agreement withrecent CV results of Pt and acid-treated Pt-Fe thin films.22 Incontrast, a considerable difference in the amount of charge inthe negative-going scan was found. The coverage of oxygenatedspecies53 such as OHad was normalized to a monolayer chargedensity of 210 µC/cmPt
2 for polycrystalline Pt (Pt-4nm), 200µC/cmPt
2 for the Pt-skeleton surface (AT-“Pt3Co”), and 180 µC/cmPt
2 for the Pt-skin surface (HT-AT-“Pt3Co”),11 as shown inFigure 1c. It was found that surface coverage of oxygenatedspecies of AT-“Pt3Co” was higher than that of Pt while that ofHT-AT-“Pt3Co” is the lowest. The difference will be discussedin the context of surface atomic structure in later sections.
Specific ORR activity values of “Pt3Co” nanoparticles in O2-saturated 0.1 M HClO4 were compared with that of Pt-4nmnanoparticles at 0.9 V vs RHE. Potentiodynamic polarizationdata of Pt-4nm, AT-“Pt3Co”, and HT-AT-“Pt3Co” nanoparticlesin the positive-going sweep under different rotating speeds areshown in Figure 2b, c, respectively, where the negative-goingsweep at 1600 rpm is also included for each sample. Tafel plotsof specific ORR activity in µA/cmPt
2 of these three samples areshown in Figure 2d. At 0.9 V, the specific activity of AT-“Pt3Co” nanoparticles is ∼0.7 mA/cmPt
2 at 0.9 V vs RHE (Table1 and Figure 2d), which is comparable to those of acid-leachedPt alloy nanoparticles reported previously.14,55,56 On the otherhand, the activity at 0.9 V was increased to ∼1.4 mA/cmPt
2
after annealing, which is among the highest reported activityvalues of Pt alloy nanoparticles2 and is equal to ∼10% of thehighest specific ORR activity reported for extended Pt alloy
surfaces.3 Mass activities of AT-“Pt3Co” (0.35 A/mgPt) and HT-AT-“Pt3Co” (0.31 A/mgPt) were found similar, which iscomparable to or slightly higher than those reported previouslyfor Pt alloy nanoparticles.57,58 The Tafel slopes of Pt-4nm (75mV/dec), AT-“Pt3Co” (73 mV/dec), and HT-AT-“Pt3Co” (88mV/dec) as determined by [∂E/∂(log is)] agree well with thoseof extended Pt and “Pt3Co” polycrystals.14
3.2. Average Pt-Pt Bond Length of Pt and “Pt3Co”Nanoparticles. Synchrotron X-ray powder diffraction data ofPt and “Pt3Co” nanoparticle samples are shown in Figure 3a,where all the major peaks can be indexed to a face-centeredcubic (FCC) structure with space group Fm3jm. The diffractiondata of these three samples were first modeled using a single-
Figure 1. (a) Cyclic voltammograms of Pt-4nm (solid black), AT-“Pt3Co” (dashed red), and HT-AT-“Pt3Co” (dotted green) in N2-saturated 0.1 M HClO4 with a sweeping rate of 50 mV/s at roomtemperature. (b) Background-corrected charge density associated withPt-OH formation in the positive-going scans. (c) Background-correctedcharge density associated with Pt-OH reduction in the negative-goingscans. The OH coverage for each sample was calculated based on thecharge density on different surfaces: 210 µC/cmPt
2 for Pt (Pt-4nm),200 µC/cmPt
2 for the Pt-skeleton surface (AT-“Pt3Co”), and 180 µC/cmPt
2 for the Pt-skin (HT-AT-“Pt3Co”).11
1112 J. Phys. Chem. C, Vol. 113, No. 3, 2009 Chen et al.

phase model (the calculated and experimental data of selectpeaks are shown in Figure S2), from which the average latticeparameter of the FCC structure was determined. The averagePt-Pt bond length of Pt-4nm nanoparticles is slightly shorterthan that of bulk Pt [2.7740(1) Å] found in this study andprevious studies,25,28,59 which has been attributed to the relaxationof nanoparticle surface atoms with low coordination sites.60-62
The average Pt-Pt bond length of AT-“Pt3Co” and HT-AT-“Pt3Co” nanoparticles was 2.712(3) and 2.724(2) Å, respectively,which are in agreement with those reported previously for“Pt3Co” nanoparticles (∼7 nm, 2.725 Å)25,28 and for bulk orderedand disordered “Pt3Co”.63-66 It is interesting to note that theaverage Pt-Pt bond length of “Pt3Co” nanoparticles found inthis study is in agreement with a linear trend in the nearestatomic distance with increasing Co atomic concentrationbetween Pt and PtCo, as shown in Figure 3b. Moreover, thevolume-averaged particle size of each sample was evaluatedfrom the extent of observed peak broadening. The particle sizesof Pt-4nm, AT-“Pt3Co”, and HT-AT-“Pt3Co” nanoparticles werefound to be 4, 5, and 5 nm from full peak width at half-maximum of the 111 reflection using the Scherrer formula.67
The volume-averaged particle sizes of these samples will be
compared and discussed in the context of particle size histogramsobtained from HRTEM measurements.
Weak but visible superlattice diffraction peaks such as 110,which are forbidden in the parent FCC structure (Fm3jm), werenoted in the HT-AT-“Pt3Co” (Figure 3a and Supporting Infor-mationFigure S3a). The refinement of X-ray powder diffractiondata of HT-AT-“Pt3Co” was improved considerably by employ-ing a two-phase model relative to one FCC structure: (1) a majorphase (∼90% by volume and average Pt-Pt interatomic distanceof 2.730 Å), which has a smaller volume-averaged particle sizeof ∼5 nm, and (2) a minor phase (∼10% by volume and averagePt-Pt interatomic distance of 2.695 Å), which has largervolume-averaged particle sizes of 10-15 nm. Comparisonbetween the experimental and the calculated spectra using thetwo-phase model can be found in the Supporting Informationin Figure S3b. It is hypothesized that annealing of AT-“Pt3Co”nanoparticles leads to the appearance of Pt-rich major and Pt-poor minor phases upon high-temperature annealing, which willbe further discussed in the context of HRTEM data in the latersections. As the specific ORR activity of “Pt3Co” nanoparticlesscales with the surface area of nanoparticles, the influence ofthe minor phase (having a much larger volume-averaged particle
TABLE 1: Average Particle Size Diameters, Surface Area, Mass, and Specific and ORR Activities of Pt-4nm, AT-“Pt3Co”, andHT-AT-“Pt3Co”a
sampledescription
number-averageddn
b (TEM) (nm)volume-surface-area-
averaged dv/ac (TEM) (nm)
surface area(TEM) (m2/gPt)
electrochemical surfacearea (m2/gPt)
mass activityim (A mgPt
-1)
specific activityis (mA cmPt
-2)electrochemical surface
area
Pt-4nm 3.6 (200 particles) 4.8 (200 particles) 75 (200 particles) 47 0.17 0.36AT-“Pt3Co” 4.1 (199 particles) 5.4 (199 particles) 51.8 (199 particles) 47 0.35 0.74HT-AT-“Pt3Co” 4.9 (214 particles) 9.2 (214 particles) 30.3 (214 particles) 22 0.31 1.39
a The ORR activities were obtained in O2-saturated 0.1 M HClO4 at room temperature at a sweeping rate of 10 mV/s. ORR activities arecompared at 0.9 V vs RHE at 1600 rpm. b dn ) (∑i ) 1
n di)/n. c dn/a ) (∑i ) 1n di
3)/(∑i ) 1n di
2).
Figure 2. Polarization curves of ORR collected from Pt-4nm (a), AT-“Pt3Co” (b), and HT-AT-“Pt3Co” (c) in an O2-saturated 0.1 M HClO4
solution with a sweeping rate of 10 mV/s at room temperature. (d) Tafel plots of ORR specific activity obtained from the polarization curves in thepositive-going scans at 1600 rpm, which was normalized to Pt electrochemical surface area (Figure 1). The loadings of these samples on glassycarbon electrodes were 9, 11, and 12 µgPt/cmGCE
2 for Pt-4nm, AT-“Pt3Co”, and HT-AT-“Pt3Co”, respectively.
ORR Activity on “Pt3Co” Nanoparticles J. Phys. Chem. C, Vol. 113, No. 3, 2009 1113

size than the major phase, less than 5% total surface area) onthe specific ORR activity is considered minimum.
3.3. Sizes and Size-Dependent Compositions of “Pt3Co”Nanoparticles. Histograms of ∼200 randomly selected nano-particles and representative HRTEM images of AT-“Pt3Co” andHT-AT-“Pt3Co” samples are shown in Figures 4a and 4c,respectively. Although most particles were found to havediameters of ∼4 nm in both “Pt3Co” samples, a few crystalslarger than 10 nm were noted, which resulted in a tail in theparticle size distribution toward the large particle size end.Unlike “Pt3Co” nanoparticles, Pt-4nm nanoparticles were shownto have relatively a narrow size distribution centered at ∼4 nm(shown in the Supporting Information Figure S4). As shown inTable 1, the number-averaged diameters of for Pt-4nm, AT-“Pt3Co”, and HT-AT-“Pt3Co” were 3.6, 4.1, and 4.9 nm,respectively. These values are consistent with the volume-averaged particle diameters from synchrotron X-ray diffraction.In addition, volume/area averaged diameters,41 and Pt-specificsurface area based on TEM data, are listed in Table 1 forcomparison, which is in agreement with electrochemical surfacearea of these three samples.
Both “Pt3Co” samples were found to have an average atomicPt/Co ratio of 78/22, which was determined from STEM EDSanalysis of Pt LR and Co KR signals collected from regions,typically 3 × 3 µm, that consisted of numerous nanoparticlesat low magnifications (∼20 000 times). However, Pt/Co ratios
of individual “Pt3Co” nanoparticles were found to greatly deviatefrom the average and to decrease as a function of particle size.Co atomic fractions at the center of AT-“Pt3Co” and HT-AT-“Pt3Co” nanoparticles using a static 2 nm electron beam areplotted as a function of particle size, as shown as open circlesin Figures 4b and 4d, respectively, which were determined fromaveraging raw data over a bin size of 2 nm. In the AT-“Pt3Co”sample, the Co atomic fraction at the particle center was foundto change linearly from ∼15 to ∼40 at % from ∼2 to ∼15 nm.Similar size-dependent Co compositions have been reportedpreviously in “PtCo” nanoparticles after corrosion tests in H3PO4
at 210 °C.23 HT-AT-“Pt3Co” was found to have the Co atomicfractions (at the particle center) vary considerably less as afunction of particle size relative to AT-“Pt3Co”. Co atomicfraction increased from ∼15 at % at ∼5 nm and graduallyapproached ∼25 at % at ∼20 nm, as shown in Figure 4d.
Average Co atomic fractions of individual AT-“Pt3Co” andHT-AT-“Pt3Co” nanoparticles were determined from spectraobtained from scanning a 2 nm electron beam over the entireparticle, which are plotted as filled circles in Figures 4b and4d, respectively. It is interesting to note that average Co atomicfractions (filled circles) of individual AT-“Pt3Co” nanoparticleswere shown to considerably deviate from those found at theparticle center (open circles) while average Co atomic fractionsof individual HT-AT-“Pt3Co” particles were found to be inreasonably good agreement with those at the particle center inFigure 4d. This observation suggests that the distribution andcomposition of Co is not uniform within individual AT-“Pt3Co”particles while the composition is becoming more uniform(averaged over an area with 2 nm diameter) upon annealing.Previous in situ TEM work68 has shown that coalescence of 5nm Pt nanoparticles on carbon support can occur at temperaturesas low as 428 K. Coalescence of AT-“Pt3Co” nanoparticles withdifferent compositions during annealing, where small Pt-richparticles join large Pt-poor particles, would reduce size-dependent composition variations and lead to more uniformcompositions among individual particles in the HT-AT-“Pt3Co”sample. As such analysis is insensitive to chemical compositionvariations in the near-surface regions, we then examine thechemical composition from multiple locations across individualnanoparticles using a 2 nm electron beam.
3.4. Direct Evidence of Pt Enrichment in the Near-SurfaceRegion of “Pt3Co” Nanoparticles. 3.4.1. ConWentional STEMEDS Results. Using a static beam of 2 nm and a collectiontime of 30 s (to minimize particle drift during data acquisition),X-ray spectra collected from different locations within a givennanoparticle can reveal Pt surface enrichment on the nanometerscale. A large number of AT-“Pt3Co” nanoparticles greater than10 nm (∼50% among 38 particles analyzed) were found toexhibit Pt enrichment. One example is shown in Figure 5a,where four locations marked 1-4 on a ∼10 nm particle wereanalyzed. The individual spectra from these locations are shownin Figure 5b, where X-ray intensities detected near the particleedge are weaker relative to those near the center. It is notedthat the Co atomic fractions near the center are considerablyhigher (∼37%) than those found near the edge (∼27%). ForAT-“Pt3Co” nanoparticles smaller than 10 nm, Pt enrichmenton the surface was found in fewer nanoparticles (∼18% among11 particles analyzed) by this technique with experimentalcertainty. Similar analyses were performed on HT-AT-“Pt3Co”nanoparticles, where Pt enrichment on the surface was detectedon only 1 particle among 46 particles by STEM EDS. This resultand the data in Figure 4d suggest that the distributions of Ptand Co become more uniform (over an area of 2 nm in diameter)
Figure 3. (a) Synchrotron X-ray diffraction patterns of Pt-4nm, AT-“Pt3Co”, and HT-AT-“Pt3Co” from which a volume-averaged particlesize was obtained for each sample. (b) Average interatomic distanceas a function of Pt atomic percentage. Open large circles show theinteratomic distances obtained by synchrotron X-ray diffraction dataof bulk Pt, Pt-4nm, AT-“Pt3Co”, and HT-AT-“Pt3Co” in this study.The interatomic distances for bulk Pt and PtCo alloys63-66 are plottedas hatched symbols for comparison.
1114 J. Phys. Chem. C, Vol. 113, No. 3, 2009 Chen et al.

within individual and among different “Pt3Co” particles duringannealing of AT-“Pt3Co” at 1000 K. As this analysis has aspatial resolution of 2 nm, it is not sensitive to compositionalvariations on the atomic scale. To examine compositionalvariations from one atomic column to the next and compositionoscillations in the top two to three surface layers, we have usedaberration-corrected STEM imaging to study “Pt3Co” particles,and we discuss the results below.
3.4.2. Aberration-Corrected STEM Imaging. As the HAADFdetector captures electrons that are inelastic scattered to higherangles, the contrast in the HAADF images is proportional tothe product of the square of average atomic number and
thickness and is not affected by elastically scattered electrons(no diffraction contrast). As shown in Figure 6a, regions wherenanoparticles overlap are clearly brighter in dark-field mode dueto an increase in thickness, whereas in bright-field mode thecontrast is significantly reduced (Figure 6b). In addition, itshould be noted that carbon support particles exhibit very weakintensities in dark-field mode, to a point where single Pt atomsand very small Pt clusters can be observed (Figure 6c). Incontrast, the diffraction contrast of carbon support structure inbright-field mode prevents individual Pt atoms and clusters frombeing seen (Figure 6d). Single Pt atoms and clusters were foundonly in AT-“Pt3Co” but not in HT-AT-“Pt3Co”. It is postulated
Figure 4. (a) Particle size histogram and (b) size-dependent Co atomic percentages of AT-“Pt3Co”. (c) Particle size histogram and (d) size-dependent Co atomic percentages of HT-AT-“Pt3Co”. Percentages collected from particle center (solid circle in Figure 3c, inset) from STEM EDSanalysis, which was then averaged over a bin size of 2 nm, are shown in open circles. Data in solid circles were obtained from the whole particle(dashed circle in Figure 3c, inset).
Figure 5. (a) Representative HAADF STEM image of AT-“Pt3Co” nanoparticles. EDS analysis in the spot capture mode was performed in fourdifferent positions (shown as white dots labeled 1-4) of the particle using an electron beam of 2 nm diameter for 30 s. (b) EDS spectra and Pt/Coatomic ratios of positions 1-4, where Co KR and Pt LR peaks were used for quantification. The peaks at ∼8 keV correspond to Cu KR from theTEM copper grid.
ORR Activity on “Pt3Co” Nanoparticles J. Phys. Chem. C, Vol. 113, No. 3, 2009 1115

that Pt atoms and clusters were highly mobile during theannealing step and they migrated, coalesced, and joined largePt nanoparticles.
Aberration-corrected STEM HAADF images not only canreveal individual columns of atoms projected in the beamdirection but also can provide direct evidence for variation inthe chemical composition within individual particles of AT-“Pt3Co”. FFTs of HAADF images showed that most AT-“Pt3Co”particles were disordered (in solid solution, where Pt and Coatoms are randomly distributed in the FCC structure), which isconsistent with synchrotron powder X-ray diffraction results inFigure 3a. Two examples are shown in Figure 7a, b. In dark-field mode, notable intensity variations across individualparticles were found for many particles with particle sizes greaterthan 10 nm. Normalized HAADF intensities of the particle alongthe dashed line in the inset of Figure 7b show a change of 2.4times between the highest and lowest intensity spots. Suchintensity variations suggest that thickness changes (porositydevelopment) up to 2.4 times for a given composition, and/orchanges occur in the chemical compositions at the atomic scaleup to a compositional change from Pt to Pt0.4Co0.6 for a giventhickness. Considering Co dissolution from a PtCo alloy that iscomparable to that of the parent sample of AT-“Pt3Co” beforethe acid treatment, we here discuss two limiting scenarios ofacid removal of Co from two atomic columns with Pt50Co50
(having an averaged atomic number of Z0 ) 52.5) as the startingcomposition (Figure S5). In order to predict maximum intensitycontrast between these two columns in the STEM images, it isassumed that the Co atoms in column 1 dissolved completelybut column 2 is unaffected by the acid treatment. In one case,vacancy sites are left after the removal of Co in column 1 andthe thickness of column 1 is the same as the thickness of column2 (Figure S5), where the average atomic number of column 1is half of that of Pt (Z1 ) ZPt/2 ) 39), and this leads to higherintensity for column 2 than column 1 in the HAADF image,with I2/I1 ) 1.8. In the other case, Pt atoms form a dense atomiccolumn (formation of porosity at the atomic scale) with novacancy in the structure when Co atoms are removed fromcolumn 1, where having Z1 ) ZPt ) 78 and Z2 ) Z0 ) 52.5 fora given thickness if one neglects the size difference between Ptand Co leads to higher intensity in column 1 relative to column2 with I1/I2 ) 1.1. This analysis indicates that dissolution aloneis not able to explain the observed intensity variations in Figure7b. Therefore, in addition to Co removal, Pt diffusion from onecolumn to the other is needed to create intensity ratioscomparable to those observed in the HAADF images. It isproposed that the dissolution of Co is not confined near thesurface, and these AT-“Pt3Co” nanoparticles of 10 nm andgreater have percolated Pt-rich (possibly thicker) and Pt-poor(possibly thinner) regions with sizes in the range of 1-2 nm.
Figure 6. Typical aberration-corrected HAADF and BF images at a low magnification (a) and (b) and at a high magnification (c) and (d) ofAT-“Pt3Co” particles supported on high-surface-area carbon. The images were acquired on a JEOL 2200 FS aberration-corrected STEM. The dashline in (c) marks the edge of high-surface-area carbon support particle, where individual Pt atoms are visible in (c), as indicated by white arrows.
1116 J. Phys. Chem. C, Vol. 113, No. 3, 2009 Chen et al.

Such nanostructure development has been reported by a numberof previous studies,69-71 which have shown that dealloying ofa less noble element from an alloy in acid can be accompaniedby clustering of more noble atoms.
Although the HAADF intensities across the particle werefound to be more uniform for particles with sizes of 5 nm andsmaller than that observed for larger particles, percolated Pt-rich and Pt-poor regions were also found within individualparticles. Several particles show intensity variations that cannotbe explained by thickness variations associated with particleshape. HAADF images of two AT-“Pt3Co” particles of ∼4 nmare shown in Figure 8a, b, where FFTs of the images areincluded in the inset. Normalized HAADF intensity variationof these particles along the dashed line in Figure 8a, b, whichwas measured with Digital Micrograph, is compared with thenormalized thickness variation of a truncated octahedronprojected in the corresponding orientation in Figure 8c, d,respectively. AutoCAD 2009 (Version C.56.0, AutoDesk, Inc.,San Rafael, CA) was used to create a truncated octahedron(Figure 8c, d insets) in the same orientation as the STEM image,where thickness changes of the truncated octahedron projectedalong the dashed line in the beam direction (in or out of paper)were determined. As the HAADF intensity is proportional tothe product of thickness and square of atomic number averagedover the column of atoms along the beam direction, thenormalized atomic number along the dashed line was obtainedfrom the normalized thickness and HAADF intensity data inFigure 8c, d, as shown in Figure 8e, f, respectively. It is evidentthat some regions close to the particle center have lower averageatomic numbers than do the surface regions. It should be notedthat estimated atomic numbers for the outermost atomic columnsare not meaningful due to uncertainty relative to those of othercolumns in this analysis, which are shaded in gray in Figure8e, f. It is reasonable to suggest that the regions with high atomicnumbers are Pt-rich relative to the regions with lower atomicnumbers, which may consist of higher amounts of Co atomsand vacancies. Therefore, normalized atomic number profilesin Figure 8e, f provide direct evidence for the formation of apercolated structure of Pt-enriched and Pt-poor regions in theAT-“Pt3Co” nanoparticles. The regions of Co removal upon acidleaching are not confined near the surface, and on average, near-
surface regions are Pt-rich relative to the particle interior, asshown in Figure 8g. With no direct evidence, several previousstudies23,26 have proposed a core-shell structure (unleachedregions in the core, and Co-removed, Pt-enriched surface regionsfor the shell) for acid-treated Pt alloy nanoparticles, which issupported by a very recent study of anomalous small-angleX-ray scattering.72 The percolated structure proposed for AT-“Pt3Co” nanoparticles in this study is different from thepreviously proposed core-shell structure in that Pt-enrichedregions can extend from surface regions into the particle core.It should be mentioned that these acid-treated Pt alloynanoparticles23,26 were obtained under very different treatmentconditions and from very different Pt alloy compositions, wheredifferent leached structures might form. Further aberration-corrected STEM studies of acid-treated Pt alloy nanoparticlesfrom Pt alloys of different compositions and different treatmentconditions are needed to provide direct evidence for the leachedstructures and address the influence of alloy compositions andleaching conditions on the resulting leached particle structures.
Some evidence of the core-shell morphology (Pt-enrichedshell with higher Z than particle core) proposed in previousstudies23,26 was noted for ordered “Pt3Co” nanoparticles foundin the acid-treated sample. STEM HAADF imaging found veryfew AT-“Pt3Co” nanoparticles exhibiting ordering which couldbe indexed consistently to space group Pm3jm from the FFTsof STEM images. One example is shown in Figure 9. TheHAADF intensities of the first seven layers along the dashedline in Figure 9a are plotted in Figure 9b, where the intensitiesin the first three layers in Figure 9a exhibit a linear increase.Starting from the fourth layer in Figure 9a, the intensityoscillates, which is associated with the ordering of Pt-rich (brightlines) and Co-rich planes (dark lines) of the ordered structure(space group Pm3jm). Although this particle could not bemodeled by a truncated octahedron, it is reasonable to suggestthat the linear intensity change can be attributed primarily tothickness variations associated with the particle morphology,and the particle consists of a Pt-enriched shell in the first twosurface layers relative to particle interior. The results of Figures8 and 9 suggest that acid leaching of ordered and disordered Ptalloy nanoparticles may lead to different nanoparticle structures(percolated for disordered vs core-shell for ordered). Watanabe
Figure 7. Aberration-corrected HAADF images of two AT-“Pt3Co” particles, where large intensity variations are noted. (b) Inset: intensity variationof an AT-“Pt3Co” particle along the dashed line. The intensities at position 1 (near the center) and 2 (near the edge) are compared, where theintensity ratio of I2 and I1 is 2.4.
ORR Activity on “Pt3Co” Nanoparticles J. Phys. Chem. C, Vol. 113, No. 3, 2009 1117
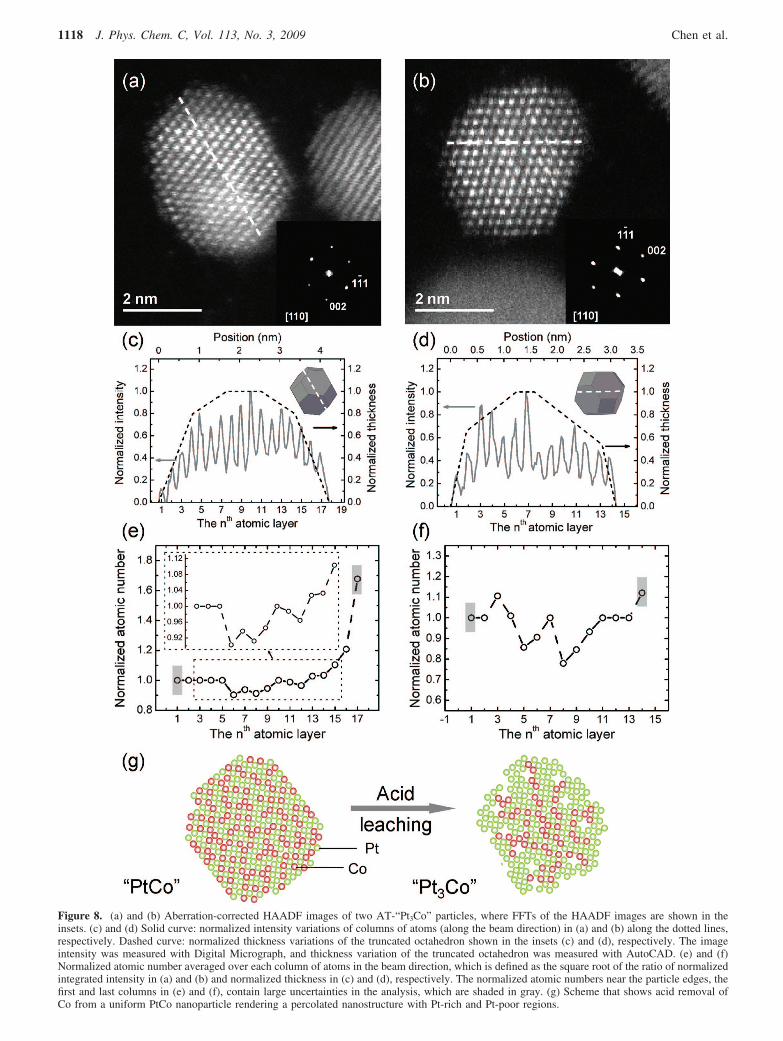
Figure 8. (a) and (b) Aberration-corrected HAADF images of two AT-“Pt3Co” particles, where FFTs of the HAADF images are shown in theinsets. (c) and (d) Solid curve: normalized intensity variations of columns of atoms (along the beam direction) in (a) and (b) along the dotted lines,respectively. Dashed curve: normalized thickness variations of the truncated octahedron shown in the insets (c) and (d), respectively. The imageintensity was measured with Digital Micrograph, and thickness variation of the truncated octahedron was measured with AutoCAD. (e) and (f)Normalized atomic number averaged over each column of atoms in the beam direction, which is defined as the square root of the ratio of normalizedintegrated intensity in (a) and (b) and normalized thickness in (c) and (d), respectively. The normalized atomic numbers near the particle edges, thefirst and last columns in (e) and (f), contain large uncertainties in the analysis, which are shaded in gray. (g) Scheme that shows acid removal ofCo from a uniform PtCo nanoparticle rendering a percolated nanostructure with Pt-rich and Pt-poor regions.
1118 J. Phys. Chem. C, Vol. 113, No. 3, 2009 Chen et al.

et al.23 have previously suggested that a thicker layer of Pt-enriched surface regions in the notation of this study for orderedrelative to disordered PtCo nanoparticles. Further studies areneeded to examine in detail the difference in the evolution ofnanoparticle structure of ordered and disordered Pt alloynanoparticles during acid treatments.
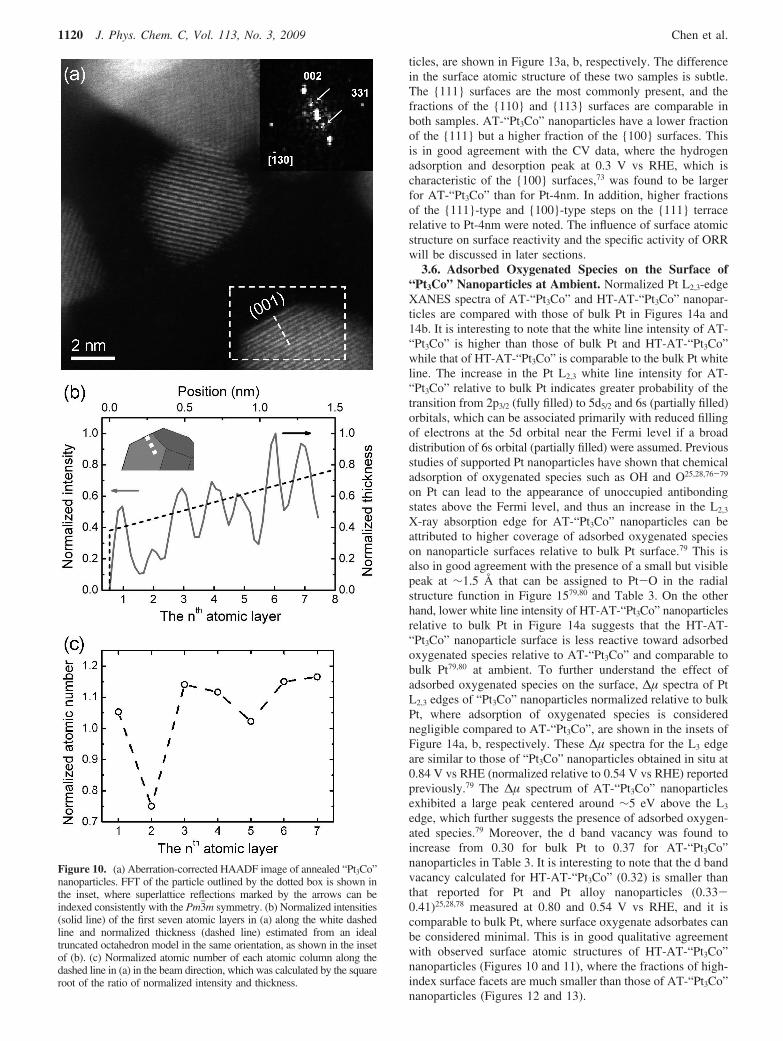
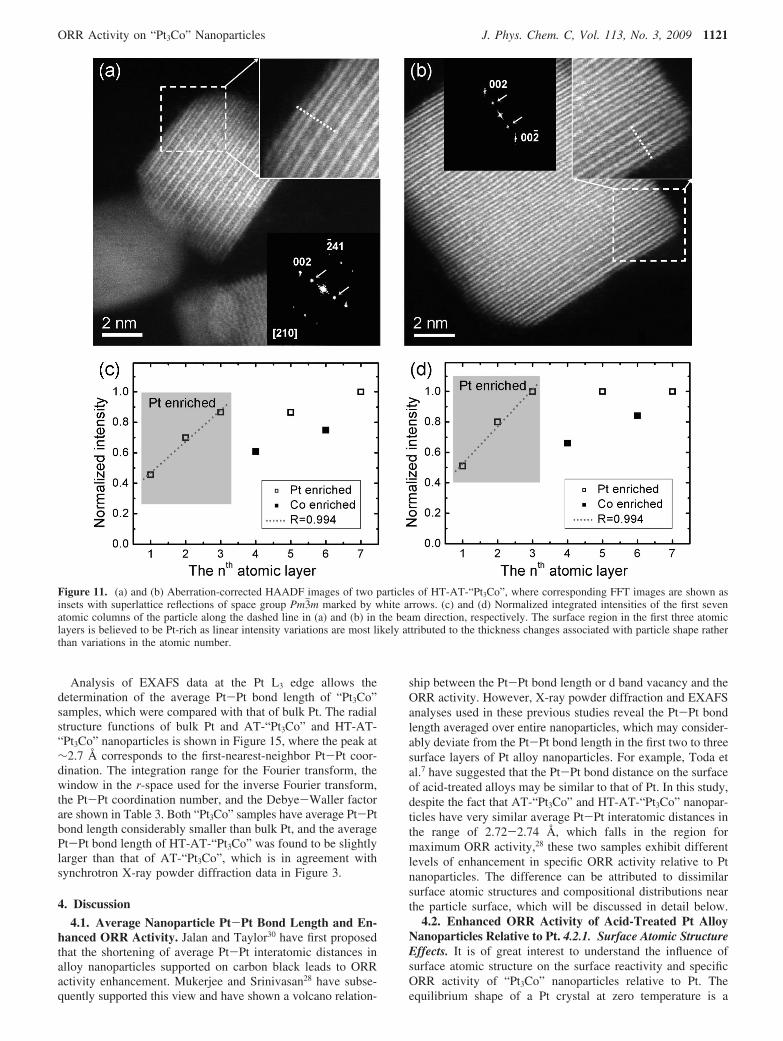
Aberration-corrected HAADF images of some HT-AT-“Pt3Co” nanoparticles revealed the existence of Pt segregationin the top one to three surface layers (bright line) and Coenrichment (dark line) in the subsurface layers. The particle inthe bottom right corner of Figure 10a shows that the outermost100 plane is considerably brighter than the second planebeneath the surface. The normalized intensities for the firstseventh atomic layer along the dashed line in Figure 10a andthe corresponding normalized thickness changes of a truncatedoctahedron are compared in Figure 10b, from which thenormalized atomic numbers can be obtained. As shown in Figure10c, it is evident that the top 100 surface is Pt-rich and thesecond layer beneath is Co-rich. Although Pt segregation is well-known on bulk Pt polycrystalline and single-crystal alloysurfaces upon high-temperature annealing,3,9-13 we show, forthe first time, that Pt segregation can occur on the 100 surfaceof ordered “Pt3Co” nanoparticles of ∼5 nm upon annealing at1000 K. In addition to surface segregation, FFT of the particlenear the bottom right of Figure 10a can be indexed consistentlyto ordered “Pt3Co” with space group Pm3jm along the [1j30]zone axis. In fact, a large number of particles in HT-AT-“Pt3Co”were found to exhibit superlattice ordering with the Pm3jmsymmetry according to both synchrotron X-ray diffractionanalysis (Figure S3a) and FFT analyses of STEM images.Moreover, the 100 surfaces become more prevalent innanoparticles of ∼5 nm after annealing, which is in goodagreement with the cyclic voltammogram data having pro-nounced adsorption and desorption peaks at 0.3 V vs RHEcharacteristic of the 100 surfaces.73 The ordering and Ptsegregation on the 100 surface were found to be more evidentin particles shown in Figure 11a, b, where normalized intensitiesfor the first seventh atomic layer along the dashed line in areshow in Figure 11c, d, respectively. Although these particlescould not be modeled by a truncated octahedron or a cuboid, itis reasonable to suggest that the linear intensity change in thetop two surface layers can be attributed primarily to thickness
variations associated with the particle morphology, and it is mostlikely that Pt segregation or Pt enrichment occurs in the toptwo 100 surface layers. Similar Pt segregation profiles havebeen reported for the 100 surface of PtNi by Gauthier et al.9
Pt segregation on the 111 surfaces predicted on cuboctahedralPt3Ni nanoparticles74 was not observed in this study. Thisdifference may be attributed to the facts that the simulations74
were performed on disordered FCC Pt3Ni nanoparticles andsurface adsorbents on “Pt3Co” nanoparticles during high-temperature annealing can influence the formation of nanopar-ticle facets.75
3.5. Surface Atomic Structure of Pt and “Pt3Co” Nano-particles. Indexed surface atomic planes of representativeparticles from Pt-4nm and AT-“Pt3Co” are shown in Figure 12a,b, respectively. Not only were low-index surfaces such as 111and 100 observed, but also some high-index surfaces suchas 221 and 331 were noted. Surface atomic planes from atleast 12 representative particles from each sample were analyzed,from which the average fractions of particle perimeter corre-sponding to low-index and high-index surface facets projectedalong the <110> direction were calculated, as shown in Table2. After high-temperature annealing, a considerable fraction(25% by number from HRTEM images) of HT-AT-“Pt3Co”nanoparticles was found to exhibit pronounced 100 surfacefacets (Figures 10 and 11), and the fractions of high-indexsurface facets were reduced significantly. As the particle shapecould not be modeled by the truncated octahedron, the quan-tification in the area fraction of different surface facets for HT-AT-“Pt3Co” nanoparticles is not straightforward and thus notincluded in Table 2.
The surface area fractions of individual facets on a truncatedoctahedron are comparable to the corresponding length fractionsof particle perimeter projected along the <110> direction(shown in Figure S6). Provided that Pt-4nm and AT-“Pt3Co”nanoparticles have particle shape that resembles a truncatedoctahedron, the fractions of particle perimeter observed for low-index and high-index surfaces can be used to quantitativelycompare the area fractions of different nanoparticle facets. Thefractions of particle perimeter for the low-index surfaces suchas the 111 and 100, and high-index surfaces including then111 × 111 and n111 × 100 types, which wereaveraged over a number of Pt-4nm and AT-“Pt3Co” nanopar-
Figure 9. (a) Aberration-corrected HAADF image of one ordered particle with Pm3jm symmetry in the AT-“Pt3Co” sample. FFT of the image inthe inset shows superlattice reflections marked by arrows. (b) Normalized integrated intensity of the first seven atomic columns of the particle alongthe dashed line in (a). The observed linear intensity variation near the surface is more probably attributed to a thickness change, which suggests thatthe surface regions (the first three layers) are Pt-rich relative to the particle interior.
ORR Activity on “Pt3Co” Nanoparticles J. Phys. Chem. C, Vol. 113, No. 3, 2009 1119
ticles, are shown in Figure 13a, b, respectively. The differencein the surface atomic structure of these two samples is subtle.The 111 surfaces are the most commonly present, and thefractions of the 110 and 113 surfaces are comparable inboth samples. AT-“Pt3Co” nanoparticles have a lower fractionof the 111 but a higher fraction of the 100 surfaces. Thisis in good agreement with the CV data, where the hydrogenadsorption and desorption peak at 0.3 V vs RHE, which ischaracteristic of the 100 surfaces,73 was found to be largerfor AT-“Pt3Co” than for Pt-4nm. In addition, higher fractionsof the 111-type and 100-type steps on the 111 terracerelative to Pt-4nm were noted. The influence of surface atomicstructure on surface reactivity and the specific activity of ORRwill be discussed in later sections.
3.6. Adsorbed Oxygenated Species on the Surface of“Pt3Co” Nanoparticles at Ambient. Normalized Pt L2,3-edgeXANES spectra of AT-“Pt3Co” and HT-AT-“Pt3Co” nanopar-ticles are compared with those of bulk Pt in Figures 14a and14b. It is interesting to note that the white line intensity of AT-“Pt3Co” is higher than those of bulk Pt and HT-AT-“Pt3Co”while that of HT-AT-“Pt3Co” is comparable to the bulk Pt whiteline. The increase in the Pt L2,3 white line intensity for AT-“Pt3Co” relative to bulk Pt indicates greater probability of thetransition from 2p3/2 (fully filled) to 5d5/2 and 6s (partially filled)orbitals, which can be associated primarily with reduced fillingof electrons at the 5d orbital near the Fermi level if a broaddistribution of 6s orbital (partially filled) were assumed. Previousstudies of supported Pt nanoparticles have shown that chemicaladsorption of oxygenated species such as OH and O25,28,76-79
on Pt can lead to the appearance of unoccupied antibondingstates above the Fermi level, and thus an increase in the L2,3
X-ray absorption edge for AT-“Pt3Co” nanoparticles can beattributed to higher coverage of adsorbed oxygenated specieson nanoparticle surfaces relative to bulk Pt surface.79 This isalso in good agreement with the presence of a small but visiblepeak at ∼1.5 Å that can be assigned to Pt-O in the radialstructure function in Figure 1579,80 and Table 3. On the otherhand, lower white line intensity of HT-AT-“Pt3Co” nanoparticlesrelative to bulk Pt in Figure 14a suggests that the HT-AT-“Pt3Co” nanoparticle surface is less reactive toward adsorbedoxygenated species relative to AT-“Pt3Co” and comparable tobulk Pt79,80 at ambient. To further understand the effect ofadsorbed oxygenated species on the surface, ∆µ spectra of PtL2,3 edges of “Pt3Co” nanoparticles normalized relative to bulkPt, where adsorption of oxygenated species is considerednegligible compared to AT-“Pt3Co”, are shown in the insets ofFigure 14a, b, respectively. These ∆µ spectra for the L3 edgeare similar to those of “Pt3Co” nanoparticles obtained in situ at0.84 V vs RHE (normalized relative to 0.54 V vs RHE) reportedpreviously.79 The ∆µ spectrum of AT-“Pt3Co” nanoparticlesexhibited a large peak centered around ∼5 eV above the L3
edge, which further suggests the presence of adsorbed oxygen-ated species.79 Moreover, the d band vacancy was found toincrease from 0.30 for bulk Pt to 0.37 for AT-“Pt3Co”nanoparticles in Table 3. It is interesting to note that the d bandvacancy calculated for HT-AT-“Pt3Co” (0.32) is smaller thanthat reported for Pt and Pt alloy nanoparticles (0.33-0.41)25,28,78 measured at 0.80 and 0.54 V vs RHE, and it iscomparable to bulk Pt, where surface oxygenate adsorbates canbe considered minimal. This is in good qualitative agreementwith observed surface atomic structures of HT-AT-“Pt3Co”nanoparticles (Figures 10 and 11), where the fractions of high-index surface facets are much smaller than those of AT-“Pt3Co”nanoparticles (Figures 12 and 13).
Figure 10. (a) Aberration-corrected HAADF image of annealed “Pt3Co”nanoparticles. FFT of the particle outlined by the dotted box is shown inthe inset, where superlattice reflections marked by the arrows can beindexed consistently with the Pm3jm symmetry. (b) Normalized intensities(solid line) of the first seven atomic layers in (a) along the white dashedline and normalized thickness (dashed line) estimated from an idealtruncated octahedron model in the same orientation, as shown in the insetof (b). (c) Normalized atomic number of each atomic column along thedashed line in (a) in the beam direction, which was calculated by the squareroot of the ratio of normalized intensity and thickness.
1120 J. Phys. Chem. C, Vol. 113, No. 3, 2009 Chen et al.
Analysis of EXAFS data at the Pt L3 edge allows thedetermination of the average Pt-Pt bond length of “Pt3Co”samples, which were compared with that of bulk Pt. The radialstructure functions of bulk Pt and AT-“Pt3Co” and HT-AT-“Pt3Co” nanoparticles is shown in Figure 15, where the peak at∼2.7 Å corresponds to the first-nearest-neighbor Pt-Pt coor-dination. The integration range for the Fourier transform, thewindow in the r-space used for the inverse Fourier transform,the Pt-Pt coordination number, and the Debye-Waller factorare shown in Table 3. Both “Pt3Co” samples have average Pt-Ptbond length considerably smaller than bulk Pt, and the averagePt-Pt bond length of HT-AT-“Pt3Co” was found to be slightlylarger than that of AT-“Pt3Co”, which is in agreement withsynchrotron X-ray powder diffraction data in Figure 3.
4. Discussion
4.1. Average Nanoparticle Pt-Pt Bond Length and En-hanced ORR Activity. Jalan and Taylor30 have first proposedthat the shortening of average Pt-Pt interatomic distances inalloy nanoparticles supported on carbon black leads to ORRactivity enhancement. Mukerjee and Srinivasan28 have subse-quently supported this view and have shown a volcano relation-
ship between the Pt-Pt bond length or d band vacancy and theORR activity. However, X-ray powder diffraction and EXAFSanalyses used in these previous studies reveal the Pt-Pt bondlength averaged over entire nanoparticles, which may consider-ably deviate from the Pt-Pt bond length in the first two to threesurface layers of Pt alloy nanoparticles. For example, Toda etal.7 have suggested that the Pt-Pt bond distance on the surfaceof acid-treated alloys may be similar to that of Pt. In this study,despite the fact that AT-“Pt3Co” and HT-AT-“Pt3Co” nanopar-ticles have very similar average Pt-Pt interatomic distances inthe range of 2.72-2.74 Å, which falls in the region formaximum ORR activity,28 these two samples exhibit differentlevels of enhancement in specific ORR activity relative to Ptnanoparticles. The difference can be attributed to dissimilarsurface atomic structures and compositional distributions nearthe particle surface, which will be discussed in detail below.
4.2. Enhanced ORR Activity of Acid-Treated Pt AlloyNanoparticles Relative to Pt. 4.2.1. Surface Atomic StructureEffects. It is of great interest to understand the influence ofsurface atomic structure on the surface reactivity and specificORR activity of “Pt3Co” nanoparticles relative to Pt. Theequilibrium shape of a Pt crystal at zero temperature is a
Figure 11. (a) and (b) Aberration-corrected HAADF images of two particles of HT-AT-“Pt3Co”, where corresponding FFT images are shown asinsets with superlattice reflections of space group Pm3jm marked by white arrows. (c) and (d) Normalized integrated intensities of the first sevenatomic columns of the particle along the dashed line in (a) and (b) in the beam direction, respectively. The surface region in the first three atomiclayers is believed to be Pt-rich as linear intensity variations are most likely attributed to the thickness changes associated with particle shape ratherthan variations in the atomic number.
ORR Activity on “Pt3Co” Nanoparticles J. Phys. Chem. C, Vol. 113, No. 3, 2009 1121

truncated octahedron consisting predominantly of the 111 and100 facets by Frenken et al.81 Pt and AT-“Pt3Co” nanoparticlescan be described generally as a truncated octahedron.32,82 Theincreased d band vacancy and surface oxygen coverage of AT-“Pt3Co” nanoparticles relative to bulk Pt (Figure 13 and Table3) can be attributed to the fact that increasing the number ofundercoordinated atoms of nanoparticles (such as edges andcorner)32 can increase the reactivity toward oxygenated speciessuch as O.83,84 In addition, AT-“Pt3Co” nanoparticles haverelatively higher fractions of the 111 and 100 steps on the111 terrace relative to Pt-4nm nanoparticles (Figure 13). Thisobservation suggests that the surface of “Pt3Co” nanoparticlesis qualitatively rougher than Pt-4nm, which is in generalagreement with previous work31 and with the observation thatAT-“Pt3Co” nanoparticles exhibit considerably higher coverageof oxygenated species than Pt-4nm at voltages greater than 0.8V vs RHE in the negative-going scan (Figure 1c).
It is not straightforward to relate the enhancement in the ORRactivity of “Pt3Co” nanoparticles to the changes in the surfaceatomic structure relative to Pt. We here examine the influence ofsurface atomic facets on the specific ORR activity of AT-“Pt3Co”
nanoparticles in some detail. On one hand, experimental studiesof bulk Pt surfaces have shown that the ORR activity of Pt100in weakly adsorbing HClO4
3,73,85 is smaller than that of Pt111,and increasing the 100 surface fraction on AT-“Pt3Co” nano-particles would decrease ORR activity relative to Pt-4nm nano-particles. On the other hand, increasing the 100 and 111 stepdensities on the 111 and 100 terraces has shown to improveORR activity in 0.1 M HClO4.45,46 It should be noted that theseexperimental findings are not in agreement with recent DFTresults,86 which show that lowering the coordination number ofsurface atoms from low-index to high-index surfaces leads tostronger binding of oxygenated species and thus yields lower ORRactivity. For example, high-index 211 surface with 100 stepson the 111 terrace is predicted to have lower ORR activity thanthe 111 surface.86 If one directly maps the activity values of bulkstepped surfaces45,46 onto the nanoparticle surface (Table S1), thespecific ORR activities of Pt-4nm and AT-“Pt3Co” nanoparticleswere found to be comparable (Table 2). The increasing fraction ofthe 100 surfaces relative to the 111 surfaces in decreasing ORRactivity counterbalances increasing fractions of high-index surfaceswith higher ORR activity. This analysis suggests that the specificORR activity enhancement of AT-“Pt3Co” relative to Pt-4nmcannot be attributed to differences in the atomic structure alone.Further studies are required to clarify the discrepancies that existon the effect of the surface atomic structure (such as step densityand the nature of steps) on the ORR activity.45,46,86
4.2.3. Percolated Nanoparticle Structure. In this study,aberration-corrected STEM images have provided direct experi-mental evidence in the surface compositional variations withinindividual nanoparticles on the nanometer scale. In particular,analysis of observed HAADF intensity variations (Figures 8 and9) indicates the formation of percolated Pt-rich surface and Pt-poor core regions within individual “Pt3Co” nanoparticles, whereon average near-surface regions can be Pt-rich relative to particlecore. As a result, the interface between surface Pt-rich and corePt-poor regions can result in compressive strains and shortenedsurface Pt-Pt bond distance compared to Pt nanoparticles of similarparticle sizes. Fourier filtering of Figure 8a clearly shows distortionalong the 111 planes, which is indicative of strain within theparticle (Figure S7). Further analysis is needed to determine straindistributions with individual particles. Such a structure can beanalogous to the skeleton structure proposed previously forpolycrystalline Pt alloy surfaces.11 Compressive strains and ligandeffects associated with such percolated nanostructures can lead tod band broadening and lowered valence band center relative tothe Fermi level.17,19,87 It is postulated that the change in theelectronic structure induced by the percolated nanoparticle structurecan reduce the binding energy of oxygenated species,16 thuslowering the activation barrier for the rate-limiting step andincreasing the activity for ORR6 relative to Pt nanoparticles. Itshould be mentioned that although Pt-4nm and AT-“Pt3Co”nanoparticles exhibit comparable coverage of oxygenated specieson the positive-going scan (Figure 1b), recent DFT studies haveshown that direct correlation between ORR activity and OHcoverage from water activation is not straightforward.88 Therefore,the enhanced activity of AT-“Pt3Co” nanoparticles can be attributedprimarily to the ligand effect and compressive strains associatedwith a percolated nanoparticle structure with Pt-rich and Pt-poorregions (Figure 8g). Further ultraviolet photoelectron spectroscopyof acid-treated Pt alloy nanoparticles is needed to understand thechanges in the surface electronic structure relative to Pt and Ptalloy nanoparticles before acid treatments.
It is interesting to note that the particle core-shell developmentproposed previously7,22,23,26 upon acid removal of transition metal
Figure 12. Representative HRTEM images and surface structures of(a) Pt-4nm and (b) AT-“Pt3Co” nanoparticles, where corresponding FFTimages are shown in the insets. The surface atoms are marked by whitedots, and the corresponding planes are indexed.
1122 J. Phys. Chem. C, Vol. 113, No. 3, 2009 Chen et al.

was only observed on a few ordered “Pt3Co” nanoparticles in theAT-“Pt3Co” sample (Figure 9). The Pt-rich shell was found to havea thickness of three to four atomic layers (∼1 nm), where surfacePt atoms may experience smaller strains than the percolatedstructures with Pt-rich and Pt-poor regions. In addition, the ligandeffect from the Pt-poor core regions can be reduced considerablyby the Pt-rich shell as the influence of underlying elements decaysrapidly with Pt layer thickness and becomes negligible beyond fourPt monolayers.89 Therefore, the Pt-rich shell developed on theordered nanoparticles might not be as active for ORR as the
structure with percolated Pt-rich and Pt-poor regions, which canallow greater contraction of Pt-Pt bond distance in the near-surfacePt-rich regions. This argument is supported by previous findings23
that ordered “PtCo” nanoparticles become less active than disor-dered “Pt3Co” nanoparticles after acid treatments. Further aberra-tion-corrected STEM studies of ordered Pt alloy nanoparticles uponacid treatments are needed to verify this hypothesis.
4.3. Enhanced ORR Activity of Annealed Pt Alloy Nano-particles Relative to Pt: Surface Pt Segregation. Similar topolycrystalline and single-crystal Pt alloy surfaces,3,9,11,12,17 Ptsegregation in the first one to three atomic layers on the 100surface have been found on ordered “Pt3Co” nanoparticles of ∼5nm in the HT-AT-“Pt3Co” sample. Co-rich layers beneath Ptsegregated surface layer(s) not only can compress Pt-Pt bonddistance in the adjacent layers but also can induce the ligand effectdue to Pt-Co bonds. This is in good agreement with previous DFTfindings10 and the Pt-skin structure reported by Markovic et al.,3,11,12
where Pt segregation and antisegregation of transition metals hasbeen found. Combined effects lead to broadening of the d band.To maintain a constant d band filling, the valence band centerrelative to the Fermi level17,19,87 is lowered,20,90 which reduces thebinding of surface Pt atoms toward oxygenated adsorbates.Decreased surface reactivity relative to Pt is supported by thepositive shift in the onset of adsorption of oxygenated species inthe voltammogram data of HT-AT-“Pt3Co” (Figure 1) and de-creased d-band vacancy of HT-AT-“Pt3Co” observed from the PtL2, 3 edge (Figures 14 and 15) relative to AT-“Pt3Co” (Table 3)and Pt nanoparticles.25,28 This may decrease the activation barrierfor protonation reactions of ORR and reduce the coverage ofsurface-blocking species to allow more O2 to reach active sites.Therefore, enhanced specific ORR activity (roughly four times that
TABLE 2: Observed Surface Facets of Pt-4nm and AT-“Pt3Co” Nanoparticlesa
surface atomicplane index
surface atomicplane notation
percentage of particleperimeter Pt-4nm
percentage of particleperimeter AT-“Pt3Co”
j at 0.9 V vsRHE (mA/cm2) in 0.1 M HCIO4
111 60.6 50.0 8.2100 17.9 21.3 1.7110 2111 × 111 5.3 7.2 7.7113 2111 × 100 6.3 4.4 2.1112 3111 × 100 3.5 3.5 25.2335 4111 × 100 0 2.5 17.4223 5111 × 100 0.7 0.7 15.6115 3100 × 111 0.7 2.7 1.5117 4100 × 111 0.9 0 1.9331 3111 × 111 3.1 4.8 35.5221 4111 × 111 0.6 2.5 31.2553 5111 × 111 0.5 0.5 25.3
jb at 0.9 V (vs RHE) in 0.1 M HCIO4 (mA/cm2) 8.2 9.2
a The normalized projected length of each facet to the particle perimeter along the <110> direction was calculated by (1) projectinghigh-index planes into stepped 111 and 100 surfaces and (2) summing the projected length of the 111 and 100 planes. b j0.9V ) Σfij0.9V
i ,with fi the surface area fraction of each plane and j0.9V
i the ORR activity of a given plane from stepped single-crystal studies reported by Feliuet al.45,46 (listed in Table S1).
TABLE 3: Structural and Electronic Structural Parameters Obtained by EXAFS Analysis, Ranges of the k3-Weighted Forwardand Inverse Fourier Transform at the Pt L3 Edge for Bulk Pt, AT-“Pt3Co”, and HT-AT-“Pt3Co”, and the Pt d Band Vacancy(hTs)a
coordination shell C. N. R (Å) σ2 × 10⁻³(Å2) k-range (Å-1) R-range (Å) R-factor hTs
bulk Pt Pt-Pt 11.0(3) 2.766(1) 5.1 2.1-18.1 1.0-3.1 0.0016 0.30c
Pt-OAT-“Pt3Co” Pt-Pt and Pt-Co 10.7(16)b 2.718(7) 8.3 1.9-16.0 1.0-3.05 0.0511 0.37
Pt-O 1.3(7) 2.00(2) 4.7HT-AT-“Pt3Co” Pt-Pt and Pt-Co 11.7(15)b 2.739(6) 6.3 1.9-15.4 1.0-3.05 0.0419 0.32
Pt-O
a Obtained from XANES data of the Pt L2,3 edge. b Co/Pt ratio has been fixed to be 1/3. c hTs has been calculated based on 0.3 for bulk Pt.
Figure 13. Average fractions of projected length for low-index andhigh-index surface planes relative to the particle perimeter, which wereobtained from averaging data over at least 12 particles in the Pt-4 nmand AT-“Pt3Co” samples. Schematics of three high-index planes arealso shown: (113) with the (111) terrace (n ) 2) and one (100) step,(221) with the (111) terrace (n ) 4) and one (111) step, and (112)with the (111) terrace (n ) 3) and one (100) step.
ORR Activity on “Pt3Co” Nanoparticles J. Phys. Chem. C, Vol. 113, No. 3, 2009 1123

of Pt) on the annealed “Pt3Co” nanoparticles is attributed to thepresence of surface Pt segregation.
5. Conclusions
The search for ORR nanocatalysts more active than Pt is key tothe development of efficient low-temperature fuel cells. It is critical
to bridge fundamental understanding in the ORR activity enhance-ment mechanisms established for bulk Pt alloy surfaces to thedevelopment of highly active catalysts on the nanometer scale. Inthis work, we show that nanoparticle near-surface chemicalcompositions can greatly influence the ORR activity of “Pt3Co”nanoparticles, from which the origin in the ORR activity enhance-ment of Pt alloy relative to Pt nanoparticles is postulated. Theenhanced activity (roughly two times based on Pt surface area) ofacid-treated “Pt3Co” nanoparticles is attributed to the formation ofpercolated Pt-rich and Pt-poor regions within individual nanopar-ticles. In addition, mapping specific activity values of different bulkPt surfaces reported by Feliu et al.45,46 onto nanoparticle surfacesshows that differences in the surface atomic structure of acid-treated“Pt3Co” and Pt nanoparticles may play a minor role in the specificactivity enhancement. Moreover, we show that high-temperatureannealing of acid-treated “Pt3Co” promotes ordering of Pt and Coand induces Pt segregation on the (100) surface in the first two tothree layers of ordered “Pt3Co” nanoparticles, which can play animportant role in the specific ORR activity enhancement of roughlyfour times relative to Pt. Controlling surface chemical compositionsof nanoparticle facets such as inducing Pt segregation by annealingand monolayer synthesis4,91 represents a promising route to develophighly active and low-cost catalysts for ORR in low-temperaturefuel cells.
Acknowledgment. This work was supported in part by theDOE Hydrogen Initiative program under award number DE-FG02-05ER15728, an Air Products Faculty Excellence grant, and theToyota Motor Company. This research made use of the SharedExperimental Facilities supported by the MRSEC Program of theNational Science Foundation under award number DMR 02-13282.Synchrotron X-ray adsorption measurements of Pt bulk, supportedPt, and Pt3Co nanoparticles were performed at Advanced PhotoSource at the Argonne National Laboratory. The authors gratefullyacknowledge T. Toda from TKK Co. Ltd. and A. Mansour fromNaval Surface Warefare Center for stimulating discussion, andY. T. Kim, M. Balasubramanian, and H. You for their assistancein the XANES and EXAFS measurements and analyses. Theauthors would like to thank Dr. Anthony J. Garratt-Reed for hishelp with EDS analysis at VG HB603 STEM. The authors wouldlike to thank Ethan Crumlin for his assistance with CAD modelingand Y. T. Kim for helpful comments on the manuscript andassistance in the synchrotron X-ray diffraction measurements atSpring-8. Research was sponsored by the Asst. Secretary for EnergyEfficiency and Renewable Energy, Office of FreedomCAR andVehicle Technologies, as part of the High Temperature MaterialsLaboratory User Program, Oak Ridge National Laboratory, man-aged by UT-Battelle LLC for the U. S. DOE under contract numberDE-AC05-00OR22725.
Supporting Information Available: Koutecky-Levich plotsof RDE data, phase analysis of synchrotron X-ray diffraction dataof “Pt3Co” nanoparticles, particle size histogram of Pt-4nmnanoparticles, the relationship between the surface fraction ofparticles with shapes close to a truncated octahedron and the lengthfraction of surfaces projected on the particle perimeter along the⟨110⟩ zone axis, and the 111 FFT filtering of the particle in Figure8a. This material is available free of charge via the Internet at http://pubs.acs.org.
References and Notes
(1) Dresselhaus, M. S.; Thomas, I. L. Nature 2001, 414, 332.(2) Gasteiger, H. A.; Kocha, S. S.; Sompalli, B.; Wagner, F. T. Appl.
Catal., B 2005, 56, 9.(3) Stamenkovic, V. R.; Fowler, B.; Mun, B. S.; Wang, G. F.; Ross,
P. N.; Lucas, C. A.; Markovic, N. M. Science 2007, 315, 493.
Figure 14. Normalized Pt L3-edge (a) and (b) L2-edge XANES spectrafor bulk Pt (solid line), AT-“Pt3Co” (dashed line), and HT-AT-“Pt3Co”(dotted line). The difference spectra relative to bulk Pt are shown inthe insets.
Figure 15. k3-weighted radial structural function of the Pt L3 edge forbulk Pt, AT-“Pt3Co”, and HT-AT-“Pt3Co”, which were obtained fromthe forward Fourier transform of EXAFS spectra. The peaks markedby the dotted line, at approximately 1.6 and 2.6 Å, are assigned toPt-O (Pt-OH) and Pt-Pt coordination, respectively.
1124 J. Phys. Chem. C, Vol. 113, No. 3, 2009 Chen et al.
(4) Zhang, J. L.; Vukmirovic, M. B.; Xu, Y.; Mavrikakis, M.; Adzic,R. R. Angew. Chem., Int. Ed. 2005, 44, 2132.
(5) Zhang, J.; Mo, Y.; Vukmirovic, M. B.; Klie, R.; Sasaki, K.; Adzic,R. R. J. Phys. Chem. B 2004, 108, 10955.
(6) Norskov, J. K.; Rossmeisl, J.; Logadottir, A.; Lindqvist, L.; Kitchin,J. R.; Bligaard, T.; Jonsson, H. J. Phys. Chem. B 2004, 108, 17886.
(7) Toda, T.; Igarashi, H.; Uchida, H.; Watanabe, M. J. Electrochem.Soc. 1999, 146, 3750.
(8) Paffett, M. T.; Beery, J. G.; Gottesfeld, S. J. Electrochem. Soc.1988, 135, 1431.
(9) Gauthier, Y. Surf. ReV. Lett. 1996, 3, 1663.(10) Ruban, A. V.; Skriver, H. L.; Norskov, J. K. Phys. ReV. B 1999,
59, 15990.(11) Stamenkovic, V. R.; Mun, B. S.; Mayrhofer, K. J. J.; Ross, P. N.;
Markovic, N. M. J. Am. Chem. Soc. 2006, 128, 8813.(12) Stamenkovic, V. R.; Mun, B. S.; Arenz, M.; Mayrhofer, K. J. J.;
Lucas, C. A.; Wang, G. F.; Ross, P. N.; Markovic, N. M. Nat. Mater. 2007,6, 241.
(13) Stamenkovic, V.; Schmidt, T. J.; Ross, P. N.; Markovic, N. M. J.Electroanal. Chem. 2003, 554, 191.
(14) Paulus, U. A.; Wokaun, A.; Scherer, G. G.; Schmidt, T. J.;Stamenkovic, V.; Radmilovic, V.; Markovic, N. M.; Ross, P. N. J. Phys.Chem. B 2002, 106, 4181.
(15) Stamenkovic, V.; Schmidt, T. J.; Ross, P. N.; Markovic, N. M. J.Phys. Chem. B 2002, 106, 11970.
(16) Stamenkovic, V.; Mun, B. S.; Mayrhofer, K. J. J.; Ross, P. N.;Markovic, N. M.; Rossmeisl, J.; Greeley, J.; Norskov, J. K. Angew. Chem.,Int. Ed. 2006, 45, 2897.
(17) Xu, Y.; Ruban, A. V.; Mavrikakis, M. J. Am. Chem. Soc. 2004,126, 4717.
(18) Mun, B. S.; Watanabe, M.; Rossi, M.; Stamenkovic, V.; Markovic,N. M.; Ross, P. N. J. Chem. Phys. 2005, 123, 204717.
(19) Mavrikakis, M.; Hammer, B.; Norskov, J. K. Phys. ReV. Lett. 1998,81, 2819.
(20) Kitchin, J. R.; Norskov, J. K.; Barteau, M. A.; Chen, J. G. Phys.ReV. Lett. 2004, 93, 156801.
(21) Greeley, J.; Norskov, J. K. Electrochim. Acta 2007, 52, 5829.(22) Wakisaka, M.; Suzuki, H.; Mitsui, S.; Uchida, H.; Watanabe, M.
J. Phys. Chem. C 2008, 112, 2750.(23) Watanabe, M.; Tsurumi, K.; Mizukami, T.; Nakamura, T.; Stone-
hart, P. J. Electrochem. Soc. 1994, 141, 2659.(24) Mukerjee, S.; Srinivasan, S. J. Electroanal. Chem. 1993, 357, 201.(25) Mukerjee, S.; Srinivasan, S.; Soriaga, M. P.; Mcbreen, J. J. Phys.
Chem. 1995, 99, 4577.(26) Koh, S.; Strasser, P. J. Am. Chem. Soc. 2007, 129, 12624.(27) Strasser, P.; Koha, S.; Greeley, J. Phys. Chem. Chem. Phys. 2008,
10, 3670.(28) Mukerjee, S.; Srinivasan, S.; Soriaga, M. P.; Mcbreen, J. J.
Electrochem. Soc. 1995, 142, 1409.(29) Zhang, J.; Lima, F. H. B.; Shao, M. H.; Sasaki, K.; Wang, J. X.;
Hanson, J.; Adzic, R. R. J. Phys. Chem. B 2005, 109, 22701.(30) Jalan, V.; Taylor, E. J. J. Electrochem. Soc. 1983, 130, 2299.(31) Beard, B. C.; Ross, P. N. J. Electrochem. Soc. 1990, 137, 3368.(32) Kinoshita, K. J. Electrochem. Soc. 1990, 137, 845.(33) Peuckert, M.; Yoneda, T.; Betta, R. A. D.; Boudart, M. J.
Electrochem. Soc. 1986, 133, 944.(34) Mayrhofer, K. J. J.; Blizanac, B. B.; Arenz, M.; Stamenkovic, V. R.;
Ross, P. N.; Markovic, N. M. J. Phys. Chem. B 2005, 109, 14433.(35) Schmidt, T. J.; Gasteiger, H. A.; Stab, G. D.; Urban, P. M.; Kolb,
D. M.; Behm, R. J. J. Electrochem. Soc. 1998, 145, 2354.(36) Paulus, U. A.; Schmidt, T. J.; Gasteiger, H. A.; Behm, R. J. J.
Electroanal. Chem. 2001, 495, 134.(37) Bard, A. J.; Faulkner, L. R. Electrochemical Methods: Fundamen-
tals and Applications;John Wiley & Sons: New York, 1980; p 288.(38) Markovic, N. M.; Gasteiger, H. A.; Ross, P. N. J. Phys. Chem.
1995, 99, 3411.(39) Nishibori, E.; Takata, M.; Kato, K.; Sakata, M.; Kubota, Y.; Aoyagi,
S.; Kuroiwa, Y.; Yamakata, M.; Ikeda, N. Nucl. Instrum. Methods Phys.Res., Sect. A 2001, 467, 1045.
(40) Rodriguezcarvajal, J. Physica B 1993, 192, 55.(41) Ferreira, P. J.; la O′, G. J.; Shao-Horn, Y.; Morgan, D.; Makharia,
R.; Kocha, S.; Gasteiger, H. A. J. Electrochem. Soc. 2005, 152, A2256.(42) Gontard, L. C.; Chang, L. Y.; Hetherington, C. J. D.; Kirkland,
A. I.; Ozkaya, D.; Dunin-Borkowski, R. E. Angew. Chem., Int. Ed. 2007,46, 3683.
(43) Markovic, N. M.; Marinkovic, N. S.; Adzic, R. R. J. Electroanal.Chem. 1988, 241, 309.
(44) Markovic, N. M.; Marinkovic, N. S.; Adzic, R. R. J. Electroanal.Chem. 1991, 314, 289.
(45) Macia, M. D.; Campina, J. M.; Herrero, E.; Feliu, J. M. J.Electroanal. Chem. 2004, 564, 141.
(46) Kuzume, A.; Herrero, E.; Feliu, J. M. J. Electroanal. Chem. 2007,599, 333.
(47) Heald, S. M.; Brewe, D. L.; Stern, E. A.; Kim, K. H.; Brown, F. C.;Jiang, D. T.; Crozier, E. D.; Gordon, R. A. J. Synchrotron Rad. 1999, 6,347.
(48) Heald, S.; Stern, E.; Brewe, D.; Gordon, R.; Crozier, D.; Jiang,D. T.; Cross, J. J. Synchrotron Rad. 2001, 8, 342.
(49) Newville, M. J. Synchrotron Rad. 2001, 8, 322.(50) Rehr, J. J.; Albers, R. C. ReV. Mod. Phys. 2000, 72, 621.(51) Markovic, N. M.; Ross, P. N. Surf. Sci. Rep. 2002, 45, 117.(52) Gomez, R.; Orts, J. M.; Alvarez-Ruiz, B.; Feliu, J. M. J. Phys.
Chem. B 2004, 108, 228.(53) Wang, J. X.; Markovic, N. M.; Adzic, R. R. J. Phys. Chem. B 2004,
108, 4127.(54) Murthi, V. S.; Urian, R. C.; Mukerjee, S. J. Phys. Chem. B 2004,
108, 11011.(55) Koh, S.; Leisch, J.; Toney, M. F.; Strasser, P. J. Phys. Chem. C
2007, 111, 3744.(56) Koh, S.; Yu, C.; Mani, P.; Srivastava, R.; Strasser, P. J. Power
Sources 2007, 172, 50.(57) Paulus, U. A.; Wokaun, A.; Scherer, G. G.; Schmidt, T. J.;
Stamenkovic, V.; Markovic, N. M.; Ross, P. N. Electrochim. Acta 2002,47, 3787.
(58) Markovi, N. M.; Stamenkovi, T. J. S. V.; Ross, P. N. Fuel Cells2001, 1, 105.
(59) Samant, M. G.; Boudart, M. J. Phys. Chem. 1991, 95, 4070.(60) Sun, C. Q. Prog. Solid State Chem. 2007, 35, 1.(61) Jiang, Q.; Liang, L. H.; Zhao, D. S. J. Phys. Chem. B 2001, 105,
6275.(62) Wasserman, H. J.; Vermaak, J. S. Surf. Sci. 1972, 32, 168.(63) Buschow, K. H. J.; Vanengen, P. G.; Jongebreur, R. J. Magn. Magn.
Mater. 1983, 38, 1.(64) Laar, B. V. J. Phys. 1964, 25, 600.(65) Berg, H.; Cohen, J. B. Metall. Mater. Trans. 1972, 3, 1797.(66) Jen, S. U. J. Alloys Compd. 1996, 234, 231.(67) Fultz, B.; Howe, J. M. Transmission Electron Microscopy and
Diffractometry of Materials; Springer: Berlin, 2008; p 426.(68) Suzuki, H.; Shintaku, M.; Sato, T.; Tamano, M.; Matsuura, T.; Hori,
M.; Kaito, C. Jpn. J. Appl. Phys., Part 2 2005, 44, L610.(69) Oppenheim, I. C.; Trevor, D. J.; Chidsey, C. E. D.; Trevor, P. L.;
Sieradzki, K. Science 1991, 254, 687.(70) Erlebacher, J.; Aziz, M. J.; Karma, A.; Dimitrov, N.; Sieradzki, K.
Nature 2001, 410, 450.(71) Erlebacher, J. J. Electrochem. Soc. 2004, 151, C614.(72) Yu, C.; Koh, S.; Leisch, J. E.; Toney, M. F.; Strasser, P. Faraday
Discuss. 2008, 140, 185.(73) Markovic, N.; Gasteiger, H.; Ross, P. N. J. Electrochem. Soc. 1997,
144, 1591.(74) Wang, G. F.; Van Hove, M. A.; Ross, P. N.; Baskes, M. I. J. Chem.
Phys. 2005, 122, 024706.(75) Wang, T.; Lee, C.; Schmidt, L. D. Surf. Sci. 1985, 163, 181.(76) Lytle, F. W.; Wei, P. S. P.; Greegor, R. B.; Via, G. H.; Sinfelt,
J. H. J. Chem. Phys. 1979, 70, 4849.(77) Mukerjee, S.; McBreen, J. J. Electrochem. Soc. 1996, 143, 2285.(78) Mukerjee, S.; McBreen, J. J. Electroanal. Chem. 1998, 448, 163.(79) Teliska, A.; O’Grady, W. E.; Ramaker, D. E. J. Phys. Chem. B
2005, 109, 8076.(80) Teliska, M.; Murthi, V. S.; Mukerjee, S.; Ramaker, D. E. J.
Electrochem. Soc. 2005, 152, A2159.(81) Frenken, J. W. M.; Stoltze, P. Phys. ReV. Lett. 1999, 82, 3500.(82) Ferreira, P. J.; Shao-Horn, Y. Electrochem. Solid-State Lett. 2007,
10, B60.(83) Gland, J. L.; Korchak, V. N. Surf. Sci. 1978, 75, 733.(84) Hammer, B.; Nielsen, O. H.; Norskov, J. K. Catal. Lett. 1997, 46,
31.(85) Markovic, N. M.; Adzic, R. R.; Cahan, B. D.; Yeager, E. B. J.
Electroanal. Chem. 1994, 377, 249.(86) Greeley, J.; Rossmeisl, J.; Hellman, A.; Norskov, J. K. Z. Phys.
Chem. 2007, 221, 1209.(87) Grabow, L.; Xu, Y.; Mavrikakis, M. Phys. Chem. Chem. Phys. 2006,
8, 3369.(88) Rossmeisl, J.; Karlberg, G. S.; Jaramillo, T.; Norskov, J. K. Faraday
Discuss. 2008, 140, 337.(89) Schlapka, A.; Lischka, M.; Gross, A.; Kasberger, U.; Jakob, P. Phys.
ReV. Lett. 2003, 91, 016101.(90) Ruban, A.; Hammer, B.; Stoltze, P.; Skriver, H. L.; Norskov, J. K.
J. Mol. Catal. A: Chem. 1997, 115, 421.(91) Nilekar, A.; Xu, Y.; Zhang, J.; Vukmirovic, M.; Sasaki, K.; Adzic,
R.; Mavrikakis, M. Top. Catal. 2007, 46, 276.
JP807143E
ORR Activity on “Pt3Co” Nanoparticles J. Phys. Chem. C, Vol. 113, No. 3, 2009 1125